1. Introduction
Seismic risk assessment of large building stocks is a critical challenge for earthquake-prone regions. The need to retrofit and strengthen existing structures requires a systematic approach to prioritise interventions efficiently. Given the vast number of buildings to be assessed, it is essential to adopt rapid, cost-effective evaluation methods that enable rational intervention planning. Developing prioritisation lists of vulnerable buildings enables stakeholders—including property owners, companies, and public administrations—to allocate resources effectively, thereby optimising seismic risk mitigation investments.
However, prioritisation is not only essential for retrofitting interventions but also for planning structural investigations required by various regulations. These investigations can be expensive and invasive, often involving destructive testing that may disrupt or slow down production in industrial facilities. Thus, property owners need a structured methodology that allows them to efficiently organise such activities while minimising economic and operational disruptions. These assessment methodologies should be robust and, where applicable, aligned with relevant regulations. Also, the evaluation procedures should be transparent, scalable and harmonised across various building types.
Studies on prioritisation approaches and territorial vulnerability assessment have attempted to deal with this necessity by tailoring approaches based on the scale of analysis.
Mass appraisal methods aim at the assessment at a very large scale of distributed built heritage [
1,
2] or numerous point-like assets [
3]. These methods are generally based on scarce census data which allow investigated structures to be associated with a macro-class. Seismic vulnerability, often expressed through fragility curves [
4,
5,
6], is then assumed homogeneous within each macro-class.
Conversely, the prioritisation of building stocks requires methods capable of capturing the distinctive features of each building, accounting for them in the outcome priority list.
The use of rapid visual screening (RVS) methodology allows preliminary evaluations of built assets with limited costs and time consumption. Several RVS forms are provided by national institutions in seismic-prone countries [
7,
8,
9]. Among these, the (second level) GNDT form, issued in Italy, represented a seminal example of an index-based survey form, developed for both masonry and R.C. buildings [
10,
11,
12].
Further advances in these tools have been presented in the literature, mostly for r.c. buildings. Perrone et al. (2015) [
13] proposed an index-based RVS for r.c. hospitals which accounts for vulnerabilities of structural and non-structural elements, as well as with organisation features which impact the emergency response. This proposal was then broadened to R.C. schools [
14]. In a follow-up study [
15], Sangiorgio et al. (2020) exploited multi-criteria analysis to enhance the calculation of a robust risk index. Other works mainly focused on the structural response of R.C. buildings, validating screening results through refined modelling [
16,
17].
One of the potential strengths of RVS is the exploitation of fuzzy theory on simple linguistic judgments to yield a risk score [
18]. In addition, RVS forms are adaptive tools capable of adjusting for holistic evaluations. This can be useful for assessing cultural heritage considering the artistic value [
19]. Further developments of rapid visual approaches have included the use of machine learning techniques [
20], as well as adaptations aimed at prioritising religious or heritage structures in specific seismic contexts [
21,
22].
Further tools for expeditious assessments at a territorial scale are simplified mechanical models, which provide a quantification of seismic vulnerability.
Among the others, the simplified approach Vulnus enables rapid evaluations of unreinforced masonry buildings. It has been widely used for the seismic assessment of historical centres, allowing its validation through observed seismic damage [
23,
24,
25]. Another relevant simplified method is DBV-masonry, which relies on displacement-based assessment criteria [
26,
27]. Results from Vulnus and DBV-masonry were compared for a restricted set of prototype buildings, showing a promising level of agreement [
28].
Various simplified methods are available in the literature for R.C. buildings, most based on non-linear analyses [
29] and displacement-based assessment [
30,
31,
32]. The main limitations of these methods are their assumption of 2D resisting systems or their restriction to R.C. frames (excluding wall and dual systems), with some methods exhibiting both constraints. On the other hand, simplified models that employ more complex 3D representations generally rely on the assumption of faster linear static analyses. Approaches like FIRSTEP-RC [
33] thus tend to be conservative, yet they are capable of accounting for each building peculiarity, being thereby well-suited for stock assessment.
Due to the inherent limitations of simplified methods, some studies explored the opportunity to combine multiple assessment levels to enhance the reliability of the final prioritisation. In 2007, Grant et al. [
34] introduced a pioneering framework for multi-level risk assessment of stocks, in particular of school buildings. The multi-level procedure includes the following phases: (
i) the computation of discrepancy between the expected seismic action and the code-based seismic load at the time of construction; (
ii) the application of an RVS screening [
10,
11,
12]; and (
iii) the application of mechanics-based models [
30,
35].
More recently, Karatzetzou et al. (2023) [
36] revisited the concept of a desk-based priority index relying solely on the demand and design seismic action. The second assessment level, on the other hand, was computed using fragility curves for macro-classes on a broad exposure model [
37]. This approach thereby included a wide typology of buildings, including precast and steel structures, which were often disregarded before. A further development of this proposal [
38] then replaced the desk-based priority index with a scoring obtained through rapid visual screening. These recent works dealt with heterogeneous built assets. However, the second order of assessment does not allow for a differentiated quantification of vulnerability among buildings within the same macro-class, unlike the aforementioned mechanical methods.
The prioritisation of seismic retrofit interventions for heterogeneous building stocks remains insufficiently defined and is still a subject of ongoing debate. Moreover, the operational constraints inherent in existing methodologies have yet to be effectively addressed.
This paper attempts to face these challenges by developing a prioritisation methodology that is suitable for a comprehensive building taxonomy while also tailored for a stock-level assessment, i.e., based on a building-by-building evaluation.
The proposed methodology stems from the experience gained by Saler et al. (2023) [
39] on the prioritisation of a urban stock of R.C. schools, by expanding its applicability to larger scales (i.e., within the area of heterogeneous hazard), and to a wide list of construction technologies (i.e., masonry, R.C., precast R.C., and steel buildings) and building types (both ordinary and industrial). It builds upon existing, validated tools, integrating them where possible and developing new assessment tools where necessary to ensure consistency across structural types.
As a first-level assessment, a qualitative approach is carried out based on RVS forms according to Saler et al. (2023, 2025) [
39,
40]. This framework originally included forms for masonry and reinforced concrete structures. To expand its applicability, we developed additional forms for precast concrete and steel structures, ensuring a uniform evaluation process across many building types. Then, the second-level–quantitative–assessment relies on simplified mechanics-based approaches from the literature for r.c. and masonry structures. Since established methodologies were lacking for precast concrete and steel structures, equivalent static analyses based on Single Degree of Freedom (SDOF) modelling are implemented. Additionally, for precast r.c. structures, an activation index is introduced to assess the loss-of-support mechanism, pivotal for this building type. The proposed methodology was then applied to an industrial-oriented building stock comprising 79 structural units located in Italy.
This research enhances previous prioritisation methodologies by introducing some novelties: (i) new tools were developed for both the first- and second-level assessments of industrial buildings; (ii) the first-level RVS method was extended to incorporate seismic hazard, suiting the methodology for territorial scale assessment with non-uniform hazard; (iii) in the second-level assessment, the outcomes of adopted mechanical methods were standardised in terms of safety indices; and (iv) a combined classification was introduced to consolidate the results of both assessment levels into a final categorisation.
The proposed methodology will support stakeholders and property owners in the seismic risk management of built stock, by enabling an efficient planning of mitigation strategies.
2. Methodology for Rapid Seismic Prioritisation of Heterogeneous Building Stocks
The procedure proposed in this study for the rapid seismic vulnerability assessment of heterogeneous building stocks, aimed at prioritising detailed analyses and seismic retrofitting interventions, consists of two progressively refined levels.
The first level, referred to as qualitative assessment, involves identifying the main seismic deficiencies, allowing the assignment of a vulnerability level to the building. By integrating this information with seismic hazard data, a first-level priority class can also be defined.
The second level, referred to as quantitative assessment, requires a seismic analysis, albeit based on simplified structural models and verifications specific to the building type. This level calculates an overall safety index of the building, providing a quantitative measure of its seismic vulnerability. Based on this safety index, and similarly to the first-level assessment, it is then possible to define a second-level priority class. The latter is essential for defining an integrated prioritisation procedure that considers the outputs of both assessment levels, and thus the knowledge encompassed by each.
For each building, the assessment involves to retrieval of all available original design documentation and on-site surveys. These surveys may include rapid, non-invasive testing, to gather information on the structural system and construction details. Additionally, random checks can be performed to verify the consistency between the original projects and the as-built configuration, without resorting to destructive investigations.
Details on the two assessment levels and their combined use for risk prioritisation purposes in heterogeneous building stocks are provided in the following subsections.
2.1. First-Level (or Qualitative) Assessment
The first-level analysis is conducted using checklist-based RVS tools to rapidly identify seismic deficiencies. The deficiency forms used in this study for masonry (M) and reinforced concrete (RC) ordinary buildings are derived and adapted from those issued by the Emilia-Romagna Region following the 2012 earthquake [
41], as referenced in Saler et al. (2023) [
39]. These forms were originally designed to determine eligibility for financial aid for the repair, restoration with seismic improvement, or demolition and reconstruction of residential buildings and housing units made unusable by the earthquake. For mixed masonry-concrete (M-RC) ordinary buildings, the deficiency form specifically developed by Saler in her doctoral project was adopted [
39,
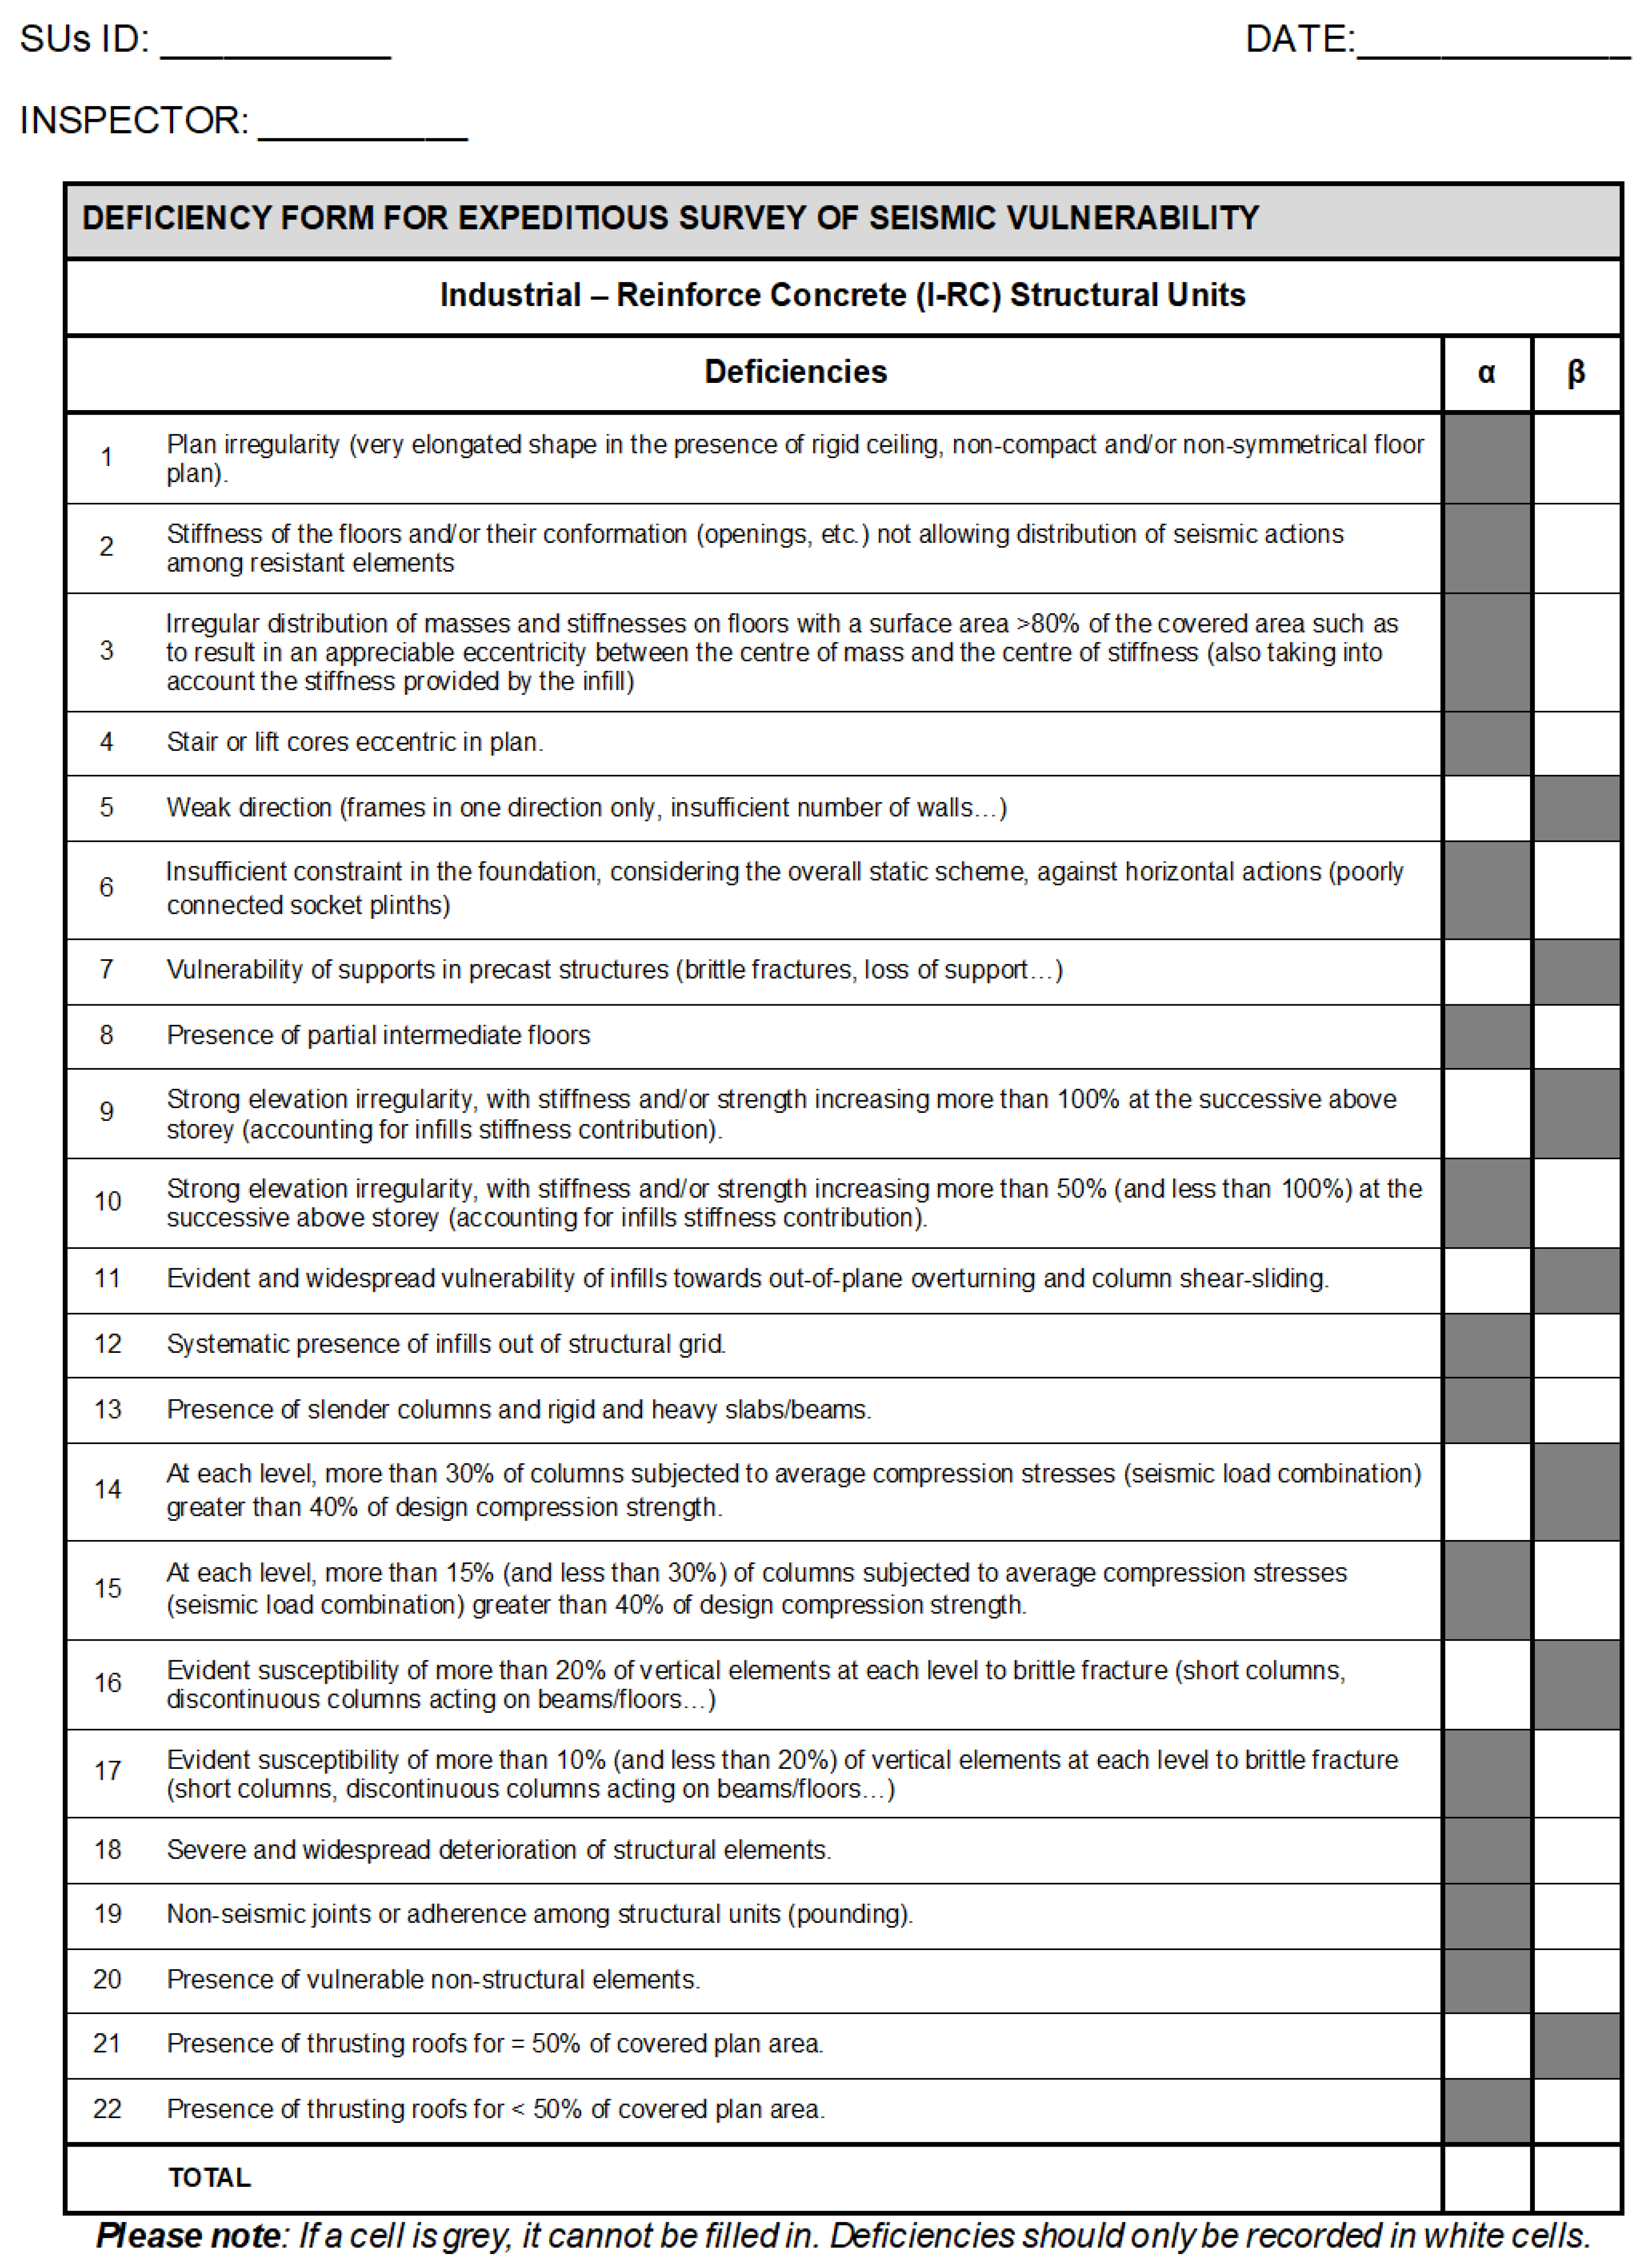
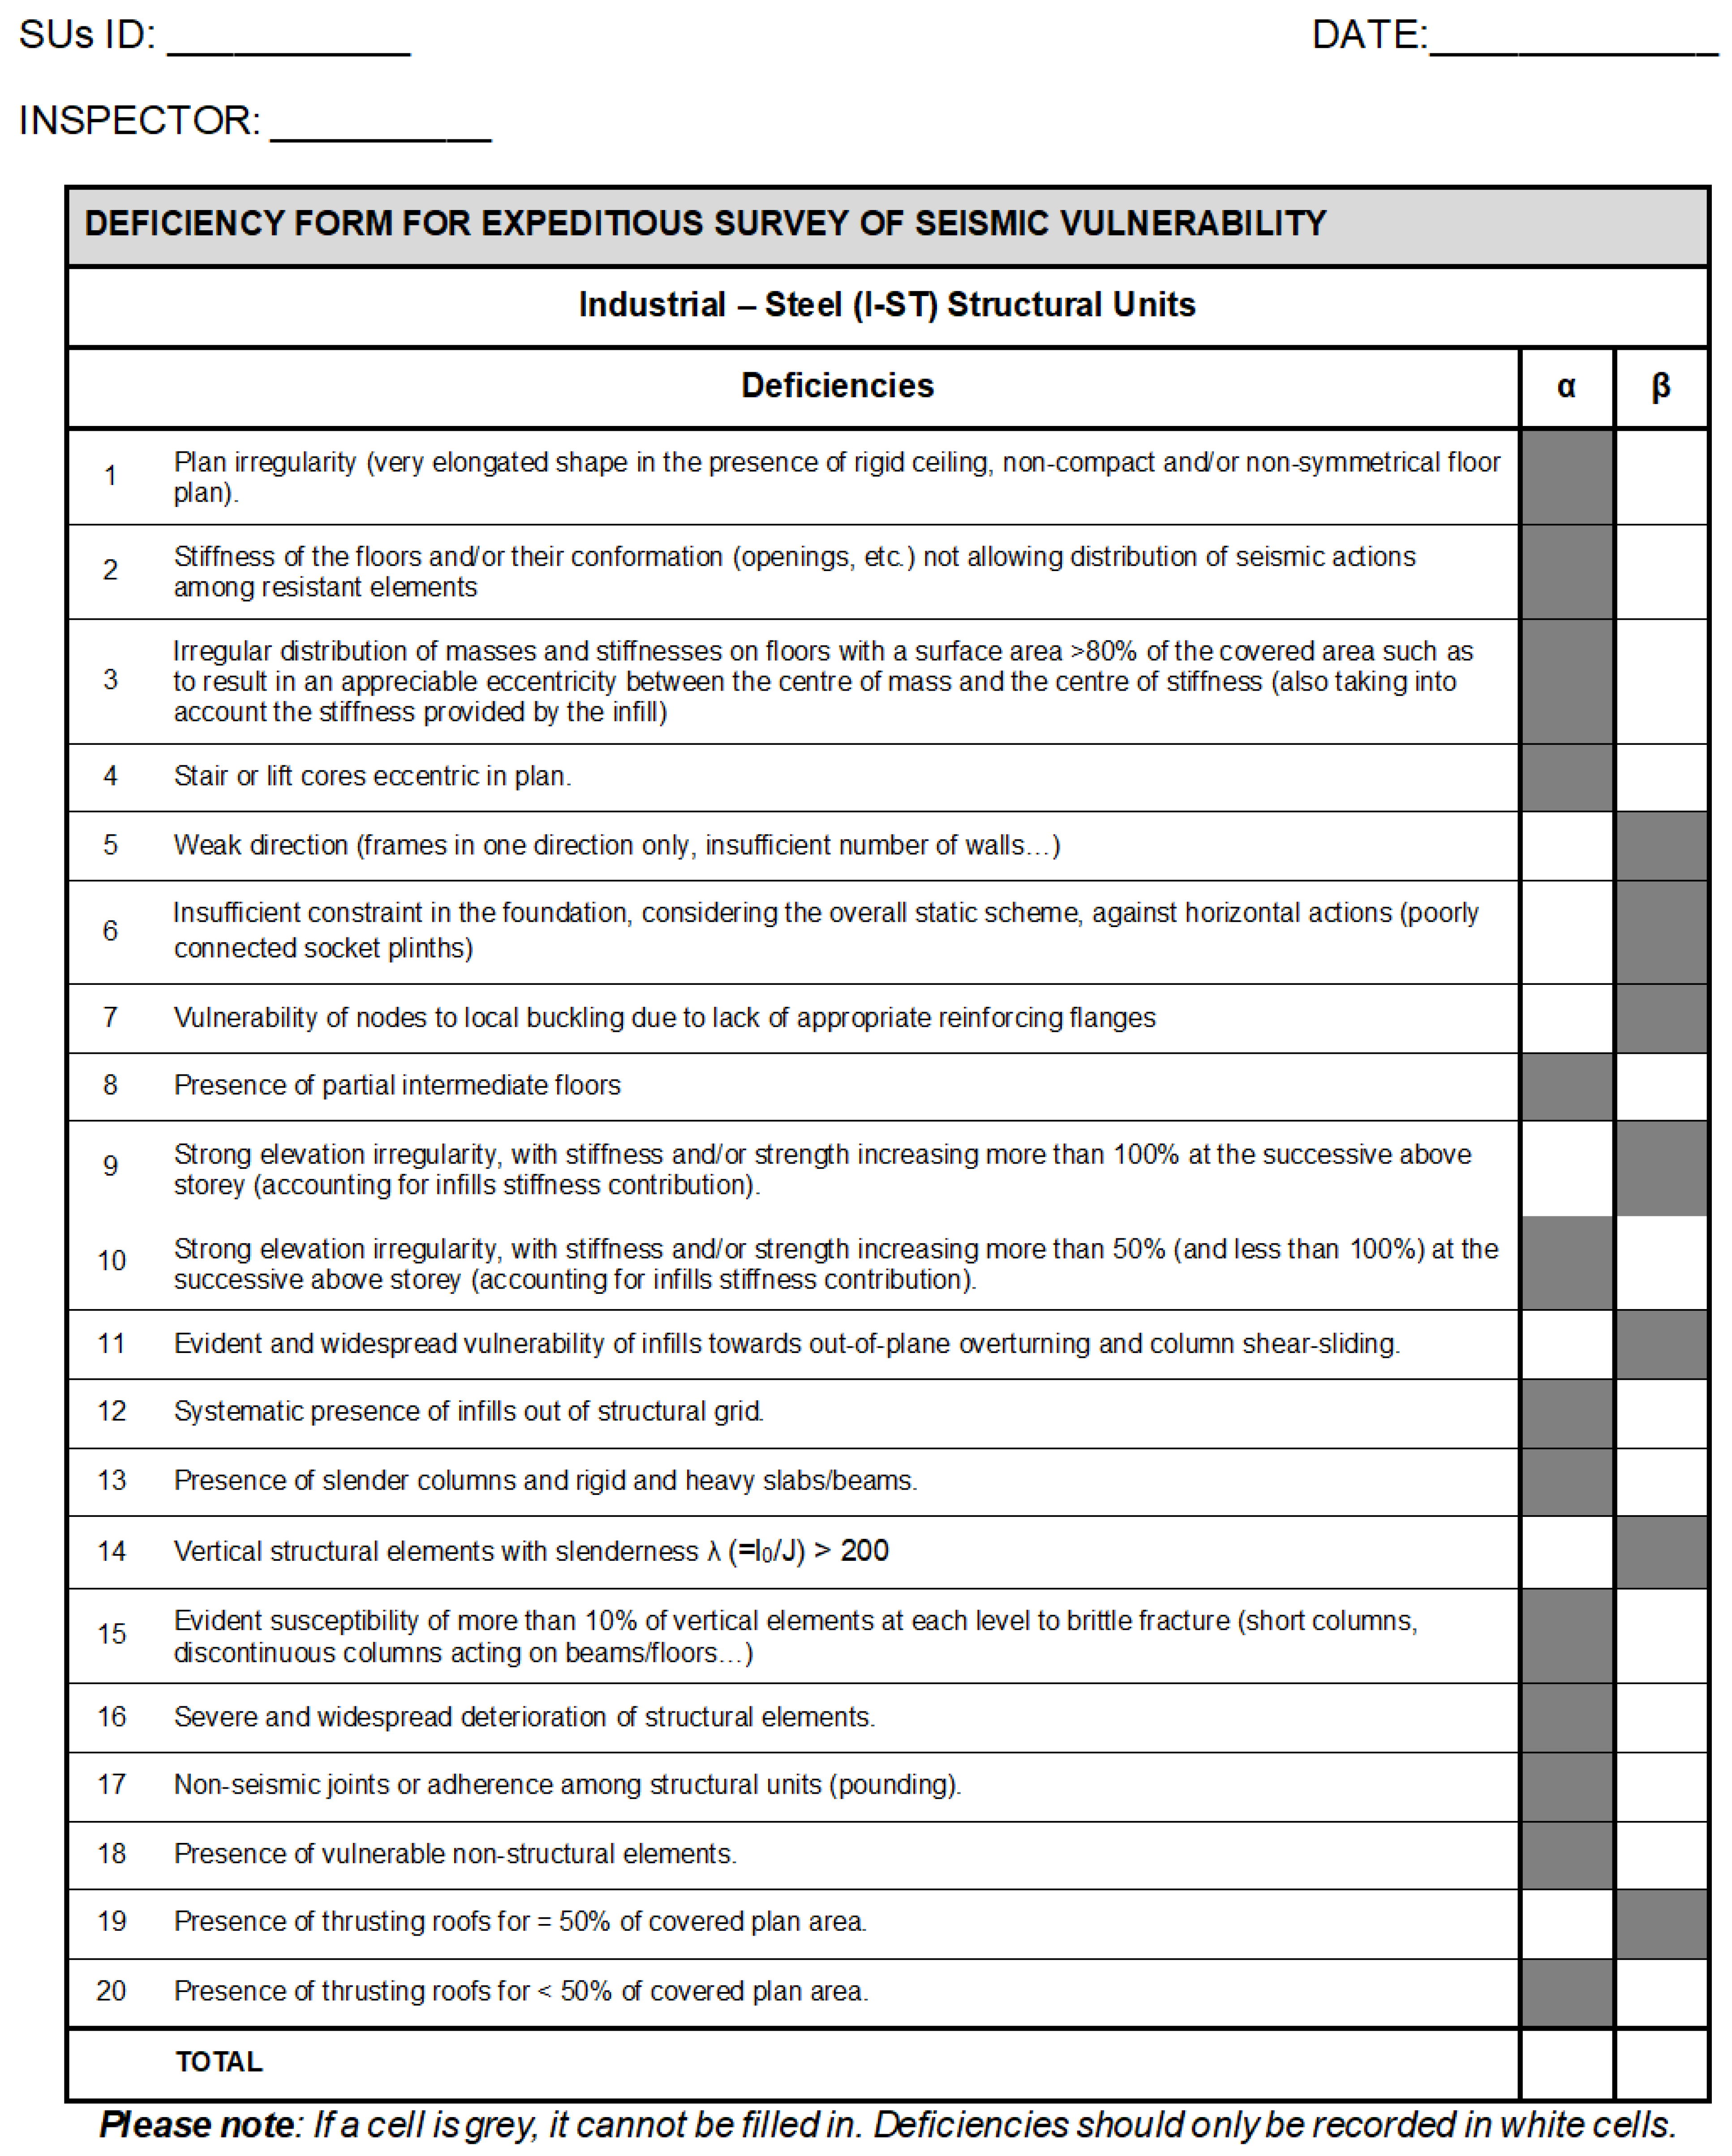
42]. Lastly, since no specific deficiency forms were available for industrial buildings—both in reinforced concrete (I-RC) and steel (I-ST)—these forms were developed in this study and will be presented in the following subsection.
In general, these forms consist of a list of deficiencies or vulnerability factors, which are specific to different structural types. Each deficiency has a pre-assigned severity level: severe (α) or moderate (β). Its significance is therefore established a priori and does not rely on the inspector’s judgment. Moreover, the same vulnerability factor may appear twice within the form, classified as either an α or β deficiency depending on the extent of its occurrence.
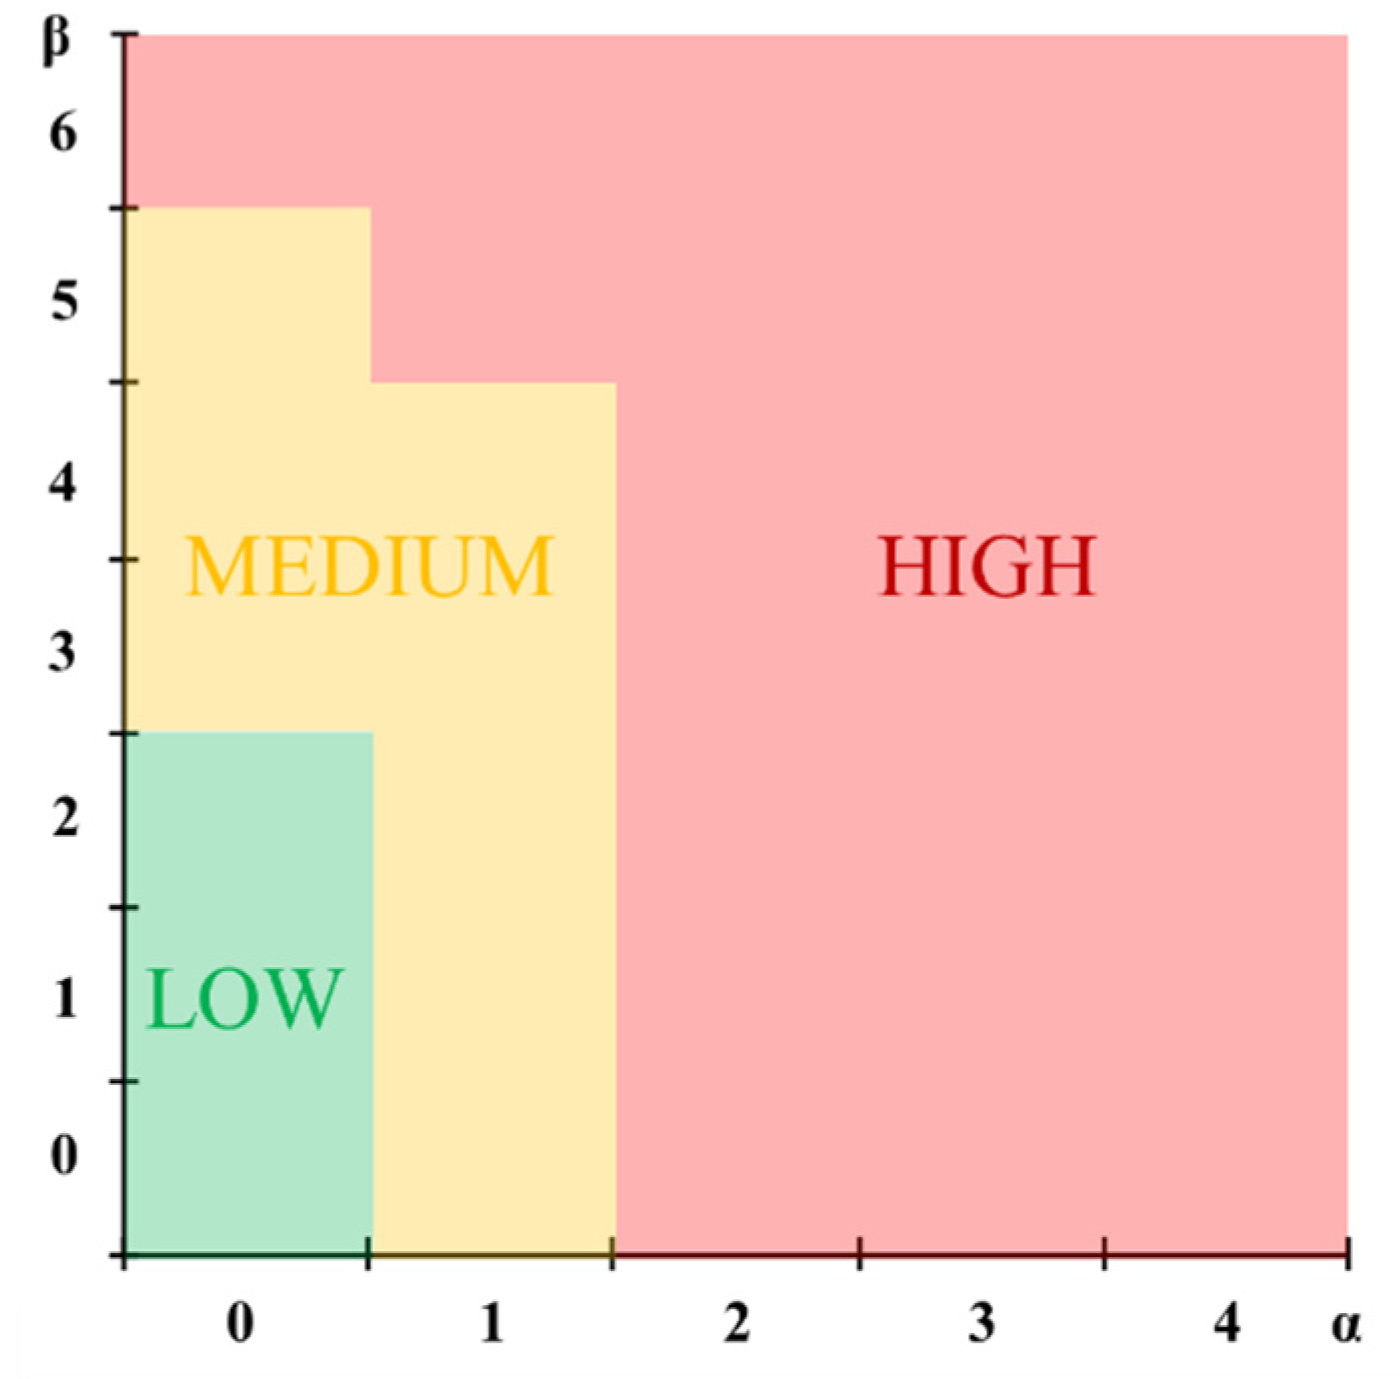
Based on the number of severe (α) and moderate (β) deficiencies, an overall deficiency grade for the building can be defined, representing its qualitative vulnerability level. The metric used follows the definition by Saler et al. (2023) [
39] and is illustrated in
Figure 1. It classifies buildings into three overall deficiency/vulnerability levels:
Low (L): with no α-deficiencies and less than 3 β-deficiencies;
Medium (M): intermediate cases;
High (H): with almost 2 α-deficiencies or almost 6 β-deficiencies (or equivalent combinations).
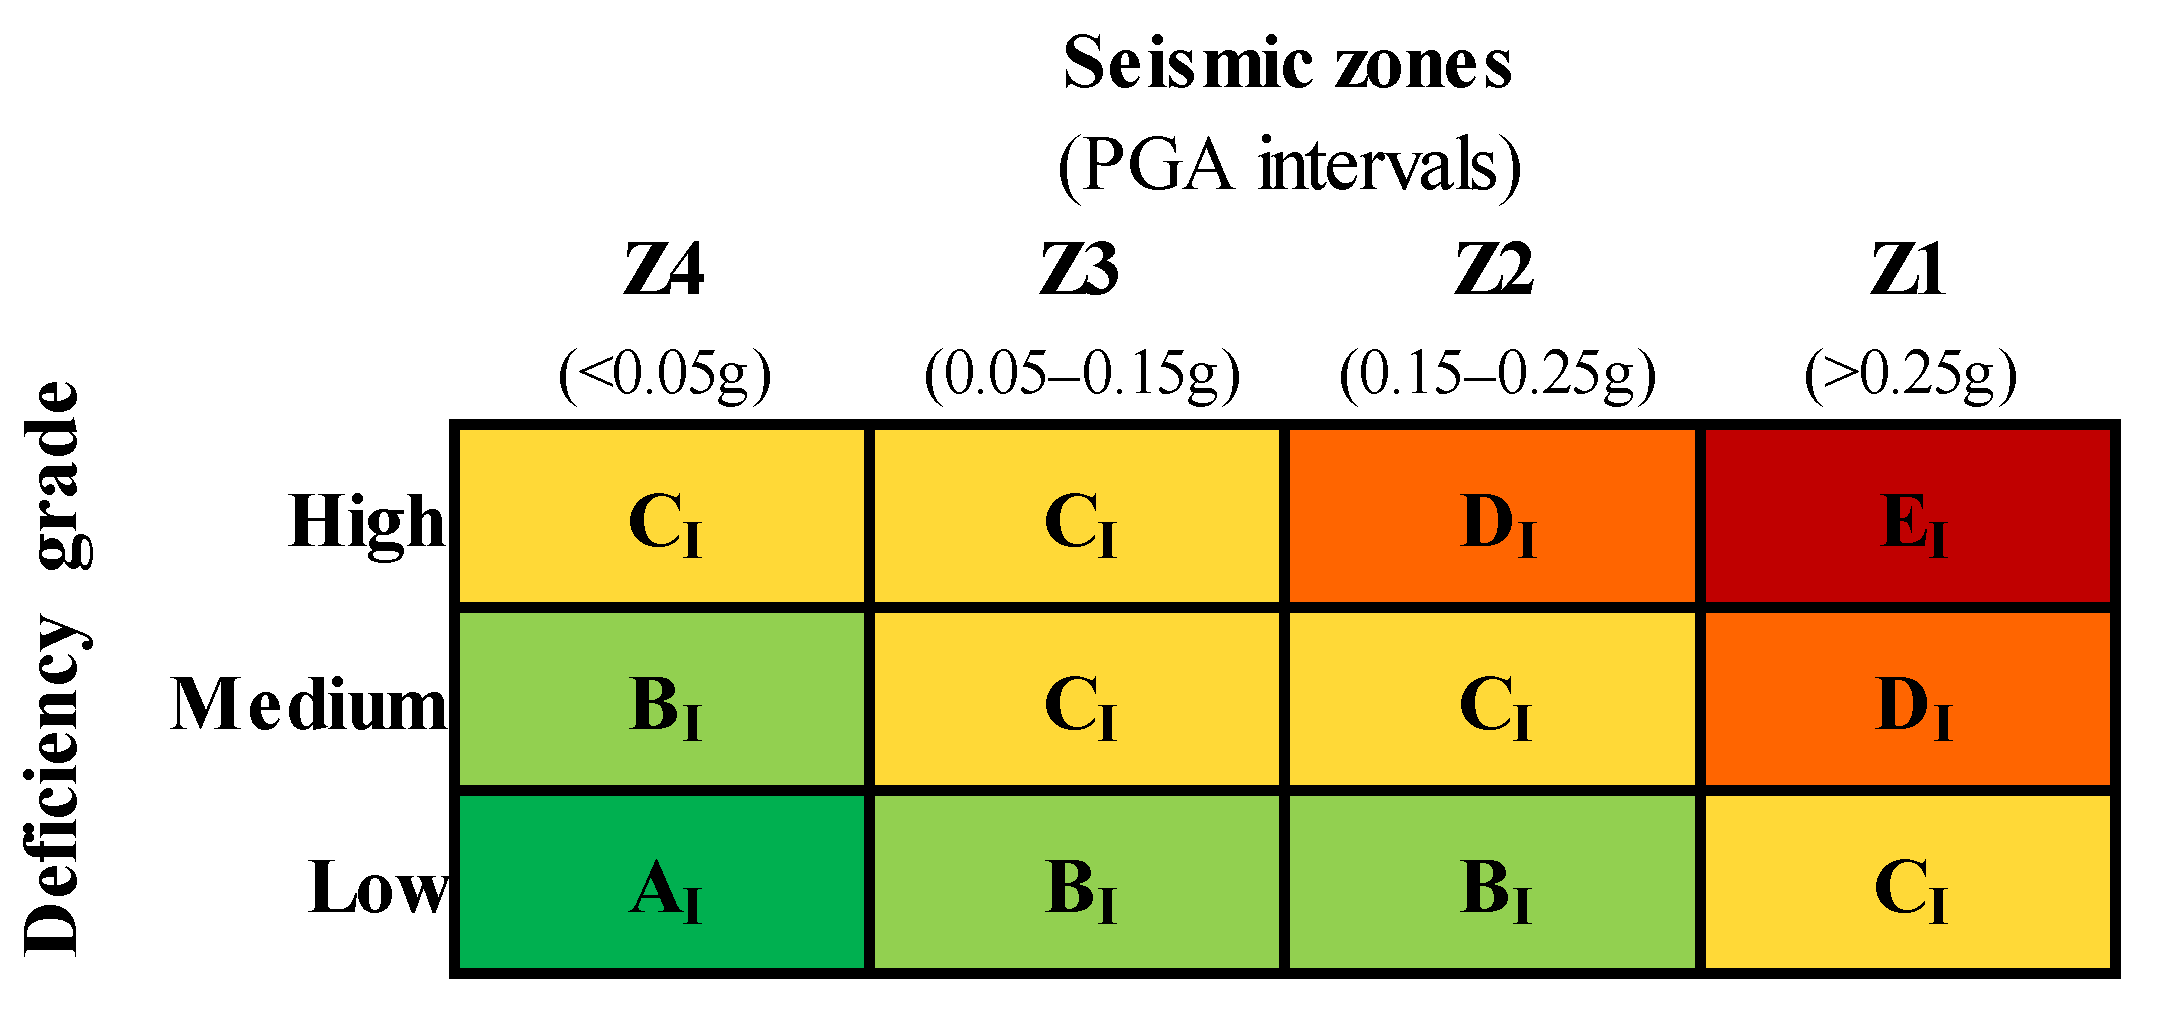
The deficiency grade alone may have limited usefulness if it is not correlated with the specific seismic hazard of the construction site. To address this, a risk metric was defined using a decision tree approach (
Figure 2), incorporating both the deficiency grade and the seismic hazard level. The latter is classified into four seismic zones (Z1, Z2, Z3, Z4) based on peak ground acceleration (PGA) values for a 475-year return period event, as defined by the Ordinance of the Presidency of the Council of Ministers No. 3274 [
43]. The risk metric resulting from this combination provides the first-level priority, which comprises five classes, ranging from A
I (lowest risk) to E
I (highest risk).
2.2. Second-Level (or Quantitative) Assessment
The second-level seismic assessment is based on simplified structural analysis methods and models specific to various building types. These methods enable the estimation of the seismic capacity of buildings based solely on expeditious information collected during the documentary investigation and rapid on-site survey. Hence, more detailed data, such as that obtained through specialised experimental investigations, are not strictly requested.
For M and RC ordinary buildings, simplified assessment methods validated in previous research studies are readily available and were adopted in this work. Specifically, M buildings were assessed through the VULNUS method, developed at the University of Padova [
23,
50,
51], and extensively used for estimating the seismic fragility of these buildings (e.g., [
39,
52]). RC buildings were assessed using the FIRSTEP-RC method, developed at the Universities of Trieste and Udine [
33,
53], and successfully implemented within the ASSESS project to evaluate school buildings in the Friuli-Venezia Giulia region (Italy) [
54,
55].
As for mixed M-RC buildings, they often feature a predominant lateral resisting system, either load-bearing masonry or reinforced concrete, which allows for simplified analysis as either M or RC buildings, respectively. If this assumption cannot be justified due to the presence of different lateral resisting systems within the building—comparable in terms of stiffness and capacity—specific considerations regarding the structural analysis method become necessary. However, there is a paucity of studies addressing the expeditious seismic assessment of these complex structures, and this goes beyond the scope of the present paper and represents an interesting potential future development.
On the other hand, for industrial buildings made of reinforced concrete (I-RC) or steel (I-ST), no similar methods for rapid seismic assessment could be identified. Therefore, a specific assessment method based on the equivalent single degree of freedom (ESDOF) approach was proposed.
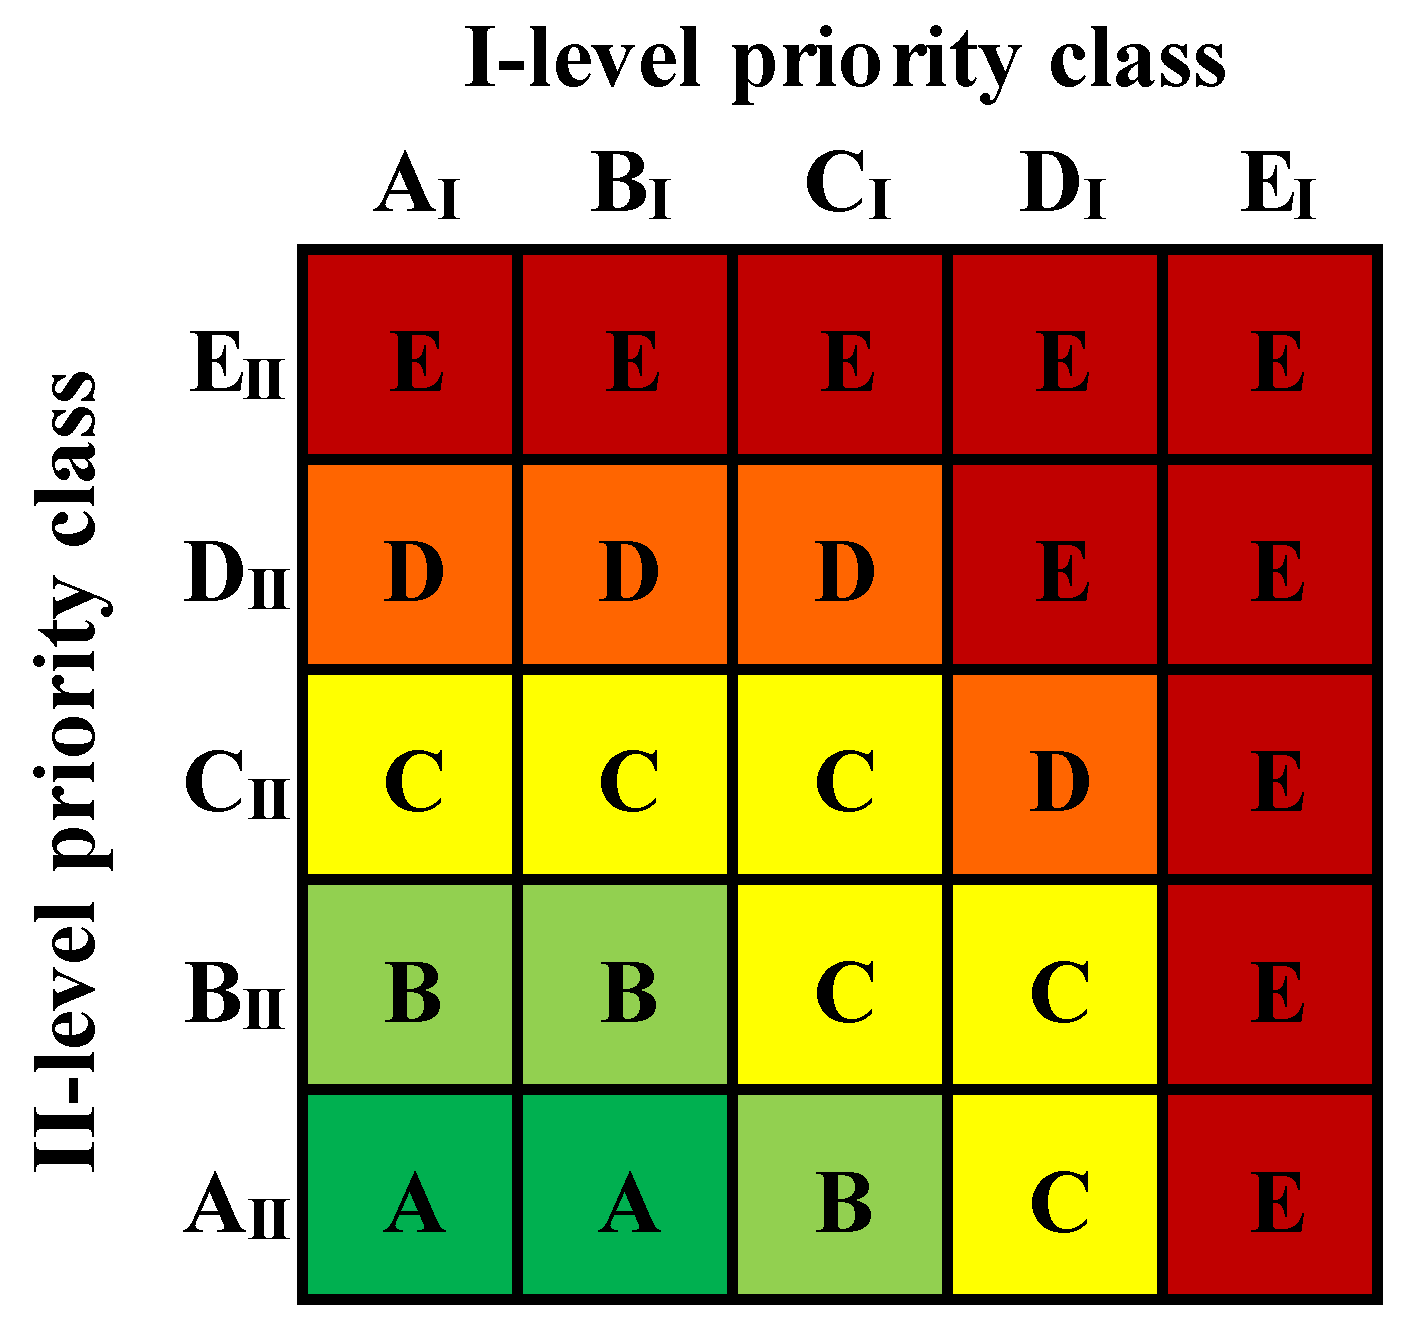
The final output of the second-level assessment is an overall safety index for the building, defined as the minimum seismic capacity-to-demand ratio, calculated for each structural type as explained below. Based on this index and consistently with the qualitative method, five second-level priority classes were defined (
Table 2), ranging from A
II (lowest risk) to E
II (highest risk).
The numerical thresholds for these classes were established in accordance with the Italian “Guidelines for the Seismic Risk Classification of Constructions” [
56].
2.2.1. VULNUS Method for Load-Bearing Masonry (M) Buildings
VULNUS processes key information on building geometry (plan and elevation), material properties, types of resistant system, floors and roofs (e.g., lightweight or heavy decks), and the presence or absence of wall-to-wall connections (and their effectiveness). It then returns two main resistance indexes (or triggering accelerations), VIP,index and VOP,index, associated with the global in-plane (IP) and the primary local out-of-plane (OOP) mechanisms, respectively.
In particular,
VIP,index is obtained from an IP shear resistance linear analysis of the building in the two main analysis directions, based on the POR method [
57]. The following assumptions are made: a uniform distribution of mass along the building height; a uniform distribution of load-bearing walls in-plane; a height-wise distribution of seismic forces proportional to height and weight; and shear resistance provided solely by parallel wall systems, considered rigidly coupled by the deck, and calculated using the formula proposed by Turnšek and Čačovič (1971) [
58].
On the other hand, VOOP,index is obtained from the assessment, through linear kinematic analysis, of the main OOP mechanisms associated with the vertical and horizontal masonry portions of each wall (taken one meter wide). For vertical strips, the possible mechanisms are the global overturning of walls and overturning and flexural collapse of the walls at the top storey. For horizontal strips, these mechanisms include bending and arching failure at the top storey, overturning and flexural failure of lateral walls (i.e., constraining the arch mechanism) at the top storey, and detachment of the transverse walls, also at the top storey.
To ensure result consistency across the various assessment methods, the resistance indices were normalised to the seismic demand, yielding the corresponding safety indices (
αM,IP and
αM,OP). The seismic demand was derived from the site-specific design spectrum for a 475-year return period. For the OOP analysis, the Peak Ground Acceleration (PGA) is consistently compared with the computed resistance, while the maximum spectral acceleration (PGA scaled by the amplification factor
F0) is defined for the IP analysis. This approach conservatively accounts for the effect of the main structural period and potential resonance when the structure exhibits a global response. In addition, both the IP and OOP demands were scaled by the behaviour factor
q, assumed to be 2 in accordance with DM 2018 for masonry [
59]. The overall safety index of the building is then taken as the lower of
αM,IP and
αM,OP (see Equation (1)).
Among the main limitations of the VULNUS method is its inability to model and analyse significant plan irregularities, as only minor ones can be addressed through corrective coefficients. It also cannot account for elevation irregularities resulting from variations in the stiffness of the lateral resisting system along the building height or staggered floor levels. Additionally, it does not consider deformable decks, nor does it account for masonry disintegration due to poor material quality.
2.2.2. FIRSTEP-RC Method for Reinforced Concrete (RC) Buildings
FIRSTEP-RC requires key information on building geometry (plan and elevation), material properties, types of RC frames (construction age, uni- or bi-directional frame, and structural element dimensions), floors and roof (e.g., lightweight or heavy decks). Rebar details of vertical elements (RC walls and columns) can be directly set when available; otherwise, a simulated design procedure is performed in accordance with the Italian Code RD 2229/1939 [
60].
It then calculates the building’s capacity acceleration through an equivalent linear analysis in both directions, assuming that global capacity is reached when the first vertical element attains its Life-Safety Limit State (LSLS). The assessed ultimate conditions (and corresponding capacity accelerations) include: the combined compression-biaxial bending behaviour of RC walls and columns (aTresP); the shear/sliding mechanism in RC walls and columns (aTresS); and the potential local failure of the beam-column joints (aTresL).
Each vertical element is analysed independently according to its static scheme; the latter depends on the element type (column or wall), boundary conditions at the base and top (influenced by beam type), and the number of storeys. The analysis approach (i.e., linear static) complies with the ASCE 41 Tier 1 assessment [
61]. Although simplified, this method accounts for the actual floor plan configuration of buildings, taking into account the eccentricity between the centres of mass and stiffness, and therefore the actual distribution of seismic forces. This aspect is particularly important for buildings with significant plan irregularities.
As done previously, to ensure consistency across the various methods, the capacity accelerations obtained from FIRSTEP-RC were normalized to the maximum site-specific seismic demand for a 475-year return period event, yielding the corresponding safety indices (
αRC,b,
αRC,s,
αRC,j). A behaviour factor
q, differentiated for fragile and ductile mechanisms according to DM 2018 [
59], was also taken into account (for more details see [
33]). The overall safety index of the building is therefore taken as the lower of these indices (see Equation (2)).
Among the main limitations of the FIRSTEP-RC model, we identify the following: it is based on two representative floors, making it unable to analyse structural irregularities in elevation; it assumes only rigid horizontal diaphragms, preventing the assessment of conditions such as perforated or flexible slabs; furthermore, it does not account for the out-of-plane failure of infill walls.
2.2.3. ESDOF Method for Reinforced Concrete (I-RC) or Steel (I-ST) Industrial Buildings
The industrial buildings considered here—in reinforced concrete (I-RC), including PRC and LRC structures, and in steel (I-ST)—are mostly single-story structures, with roofs and floors lacking in-plane stiffness or any measures for diaphragm behaviour, which is necessary to uniformly distribute seismic forces among the vertical elements. Secondary beams are generally simply supported on the main beams, with connections of varying efficiency, while the main beams are connected to the tops of the columns through hinge constraints. This configuration follows an isostatic scheme, preventing stress redistribution within structural elements once their resistance is exceeded, ultimately leading to sudden collapse. As a result, the overall structural behaviour can be reduced to a series of simple “inverted pendulum” systems, where individual columns respond independently without significant interaction with the rest of the structure. In this context, the assessment method proposed for these buildings is based on modelling columns using their equivalent single-degree-of-freedom (ESDOF) representation, from which the method takes its name. A linear static analysis is then implemented to evaluate the ultimate (code-compliant) strength of the columns.
Specifically, the ESDOF method requires the key characteristics of vertical structural elements, including the main material properties, geometric dimensions and rebar details. Such information is gathered from available documentation and rapid on-site surveys, including the use of a rebar detector. When the collected data is not sufficient for a complete definition of the analysis input, simulated design, in accordance with the regulations in force at the time of construction, comes into play, and its output (particularly reinforcement details) is taken as a reference.
For both types of industrial buildings analysed here (I-RC and I-ST), the ESDOF method evaluates two column-failure mechanisms, i.e., the combined compression-biaxial bending failure and the shear failure, providing the corresponding safety indices (α,b and α,s, respectively). These indices are calculated as the ratio of resisting moment (MRd) to seismic design moment (MEd) and resisting shear (VRd) to seismic design shear (VEd), respectively. The seismic demand forces (MEd, VEd) are derived from the site-specific spectral acceleration (Sd), associated with the fundamental vibration period of the column, assuming an event with a return period of 475 years and a behaviour factor q of 1.5. Such a q value is appropriately conservative, considering the low or null degree of redundancy of this type of building.
For I-RC buildings only, the local failure mechanism due to support loss was also analysed. A simplified approach was adopted, defining a support loss activation coefficient (
αPRC,μ) as the ratio of frictional resistance (
Ffric) to the horizontal seismic force (
Fh), as shown in Equation (3):
where
m is the seismic mass of the column,
g is the gravitational constant, and
μ is the friction coefficient between concrete and neoprene (a material commonly used for supports in prefabricated structures), with the latter defined as in Magliulo et al. (2011) [
62].
Therefore, the building’s overall safety index is determined as the smallest of the relevant safety indices, as shown in Equations (4) and (5) for I-RC and I-ST buildings, respectively.
Lastly, the ESDOF method considers short-column effects but does not account for other vertical irregularities, such as offset floors. Furthermore, it does not assess the out-of-plane failure of infill walls and assumes a perfectly fixed support condition at the column base.
2.3. Proposal of a Combined Seismic Priority Class
The second-level (quantitative) assessment method clearly yields more precise and detailed results than the first-level (qualitative) method. However, the structural analysis procedures in the quantitative approach rely on simplified modelling techniques and assumptions, which introduce the limitations discussed in the previous subsections.
While the qualitative method provides less detailed results—relying on quick visual inspections to identify primary vulnerability factors—it can help mitigate the shortcomings of the quantitative approach by accounting for aspects the latter tends to overlook. These include plan and elevation irregularities (see
Table 1) and other structural deficiencies specific to different building types, such as potential masonry disintegration in M buildings or insufficient foundation restraints in industrial structures.
Further examples include vulnerabilities related to infill walls and other non-structural elements (e.g., chimneys and overhanging components), as well as pounding effects due to the absence of seismic joints between adjacent buildings.
Therefore, combining the results from both levels of seismic assessment enhances the reliability of the proposed prioritisation approach. In practice, this combination was implemented at the priority class level using the decision-tree approach shown in
Figure 3. Slightly greater importance is assigned to second-level classes, as they stem from more detailed assessments.
Ultimately, the proposed methodology for the rapid seismic prioritisation of a heterogeneous building portfolio introduces some notable innovations. Initially, new first- and second-level assessment tools were defined for industrial buildings made of reinforced concrete (I-RC) and steel (I-ST), with the most significant addition being the newly developed deficiency forms for these building types. Furthermore, in the second-level assessment, results from different structural analysis procedures were standardised using homogeneous safety indices (α), ensuring direct comparability. Additionally, a unified metric was established for both assessment levels to determine priority classes. To this end, the deficiency-based method was extended to incorporate seismic hazard information, yielding priority classes consistent with the quantitative approach.
Lastly, while first- and second-level rankings can also be used independently to generate separate prioritisation lists, their combined use ensures a more robust and reliable classification, particularly when assessing heterogeneous building stocks.
3. Presentation of the Heterogeneous Case Study Building Stock
The real building portfolio analysed in this study comprises 60 diverse buildings, totalling 79 distinct structural units (SUs), all managed by a single operator. These are distributed across 31 industrial complexes, located in regionwide area. Their exact locations and the managing company’s name are intentionally withheld for privacy reasons. While this section provides an overview of the examined building stock, the next section presents the main findings from the on-site survey of deficiencies and the first- and second-level vulnerability assessments of the individual structural units.
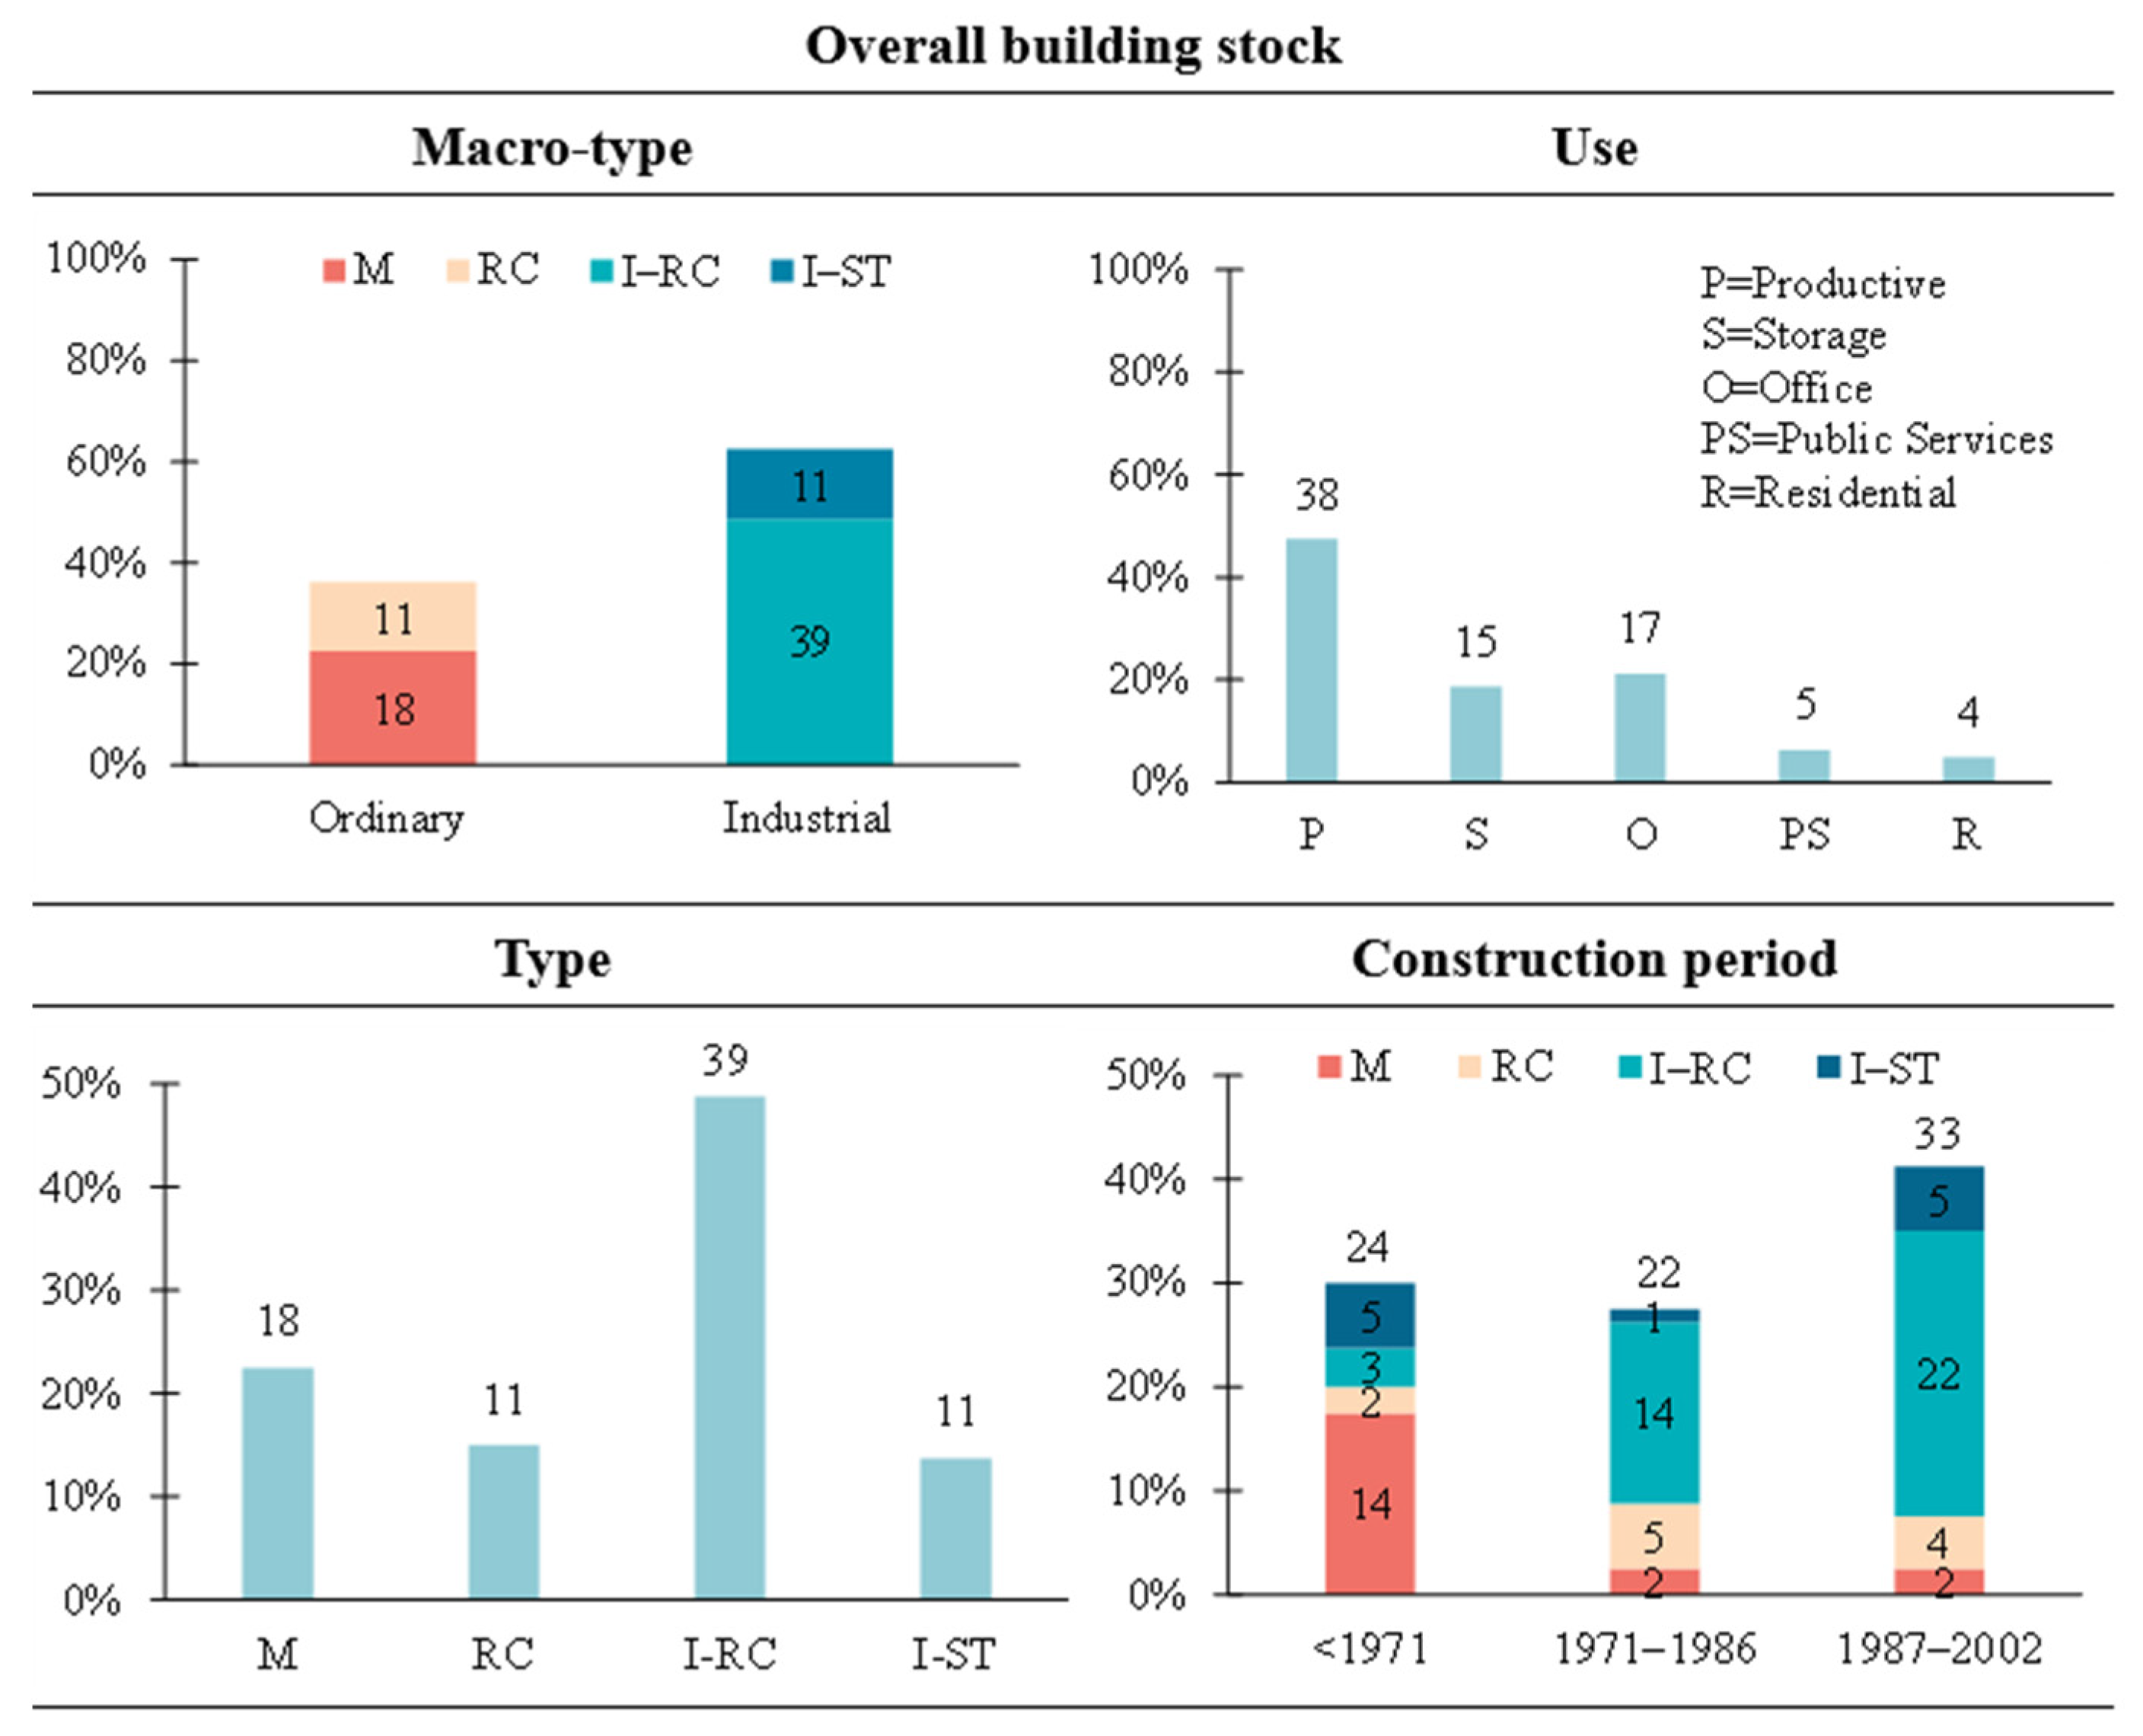
Figure 4 provides statistics on the key typological characteristics of the structural units involved. As observed, most structural units (50) belong to industrial facilities, while the remaining 29 are units in ordinary buildings. The most common use is for production purposes (e.g., mechanical workshops, service garage, etc.), accounting for nearly 50%, followed by office and storage spaces (around 20% each), and finally, units used for public services (e.g., canteens, ticket offices, etc.) and residential purposes (approximately 6% each).
Among the units in ordinary buildings, masonry (M) units prevail over reinforced concrete (RC) units, with a ratio of 18 to 11. On the other hand, in industrial buildings, reinforced concrete units (I-RC, including PRC or LRC structures) are significantly more common than steel units (I-ST), with a ratio of 39 to 11. Four ordinary buildings in the stock feature mixed M-RC structures, but with a clear predominance of the masonry load-bearing system as the lateral resisting system. Therefore, in the second-level assessment, these buildings were appropriately analysed using VULNUS and, for the sake of clarity, they were included in the M building category.
Additionally, it is noticeable that the majority of M structural units were constructed before 1971, while the other structural units are mainly from the subsequent construction periods, i.e., 1972–1986, and particularly 1987–2002. This clearly reflects the historical evolution of construction practices in Italy: prior to 1971, masonry construction was predominant, while from the 1970s onward, reinforced concrete structures—especially precast solutions—became increasingly widespread. These period ranges were defined to align with the main building survey tools currently available in Italy (e.g., Aedes [
63], Cartis [
64]) and correspond to significant advancements in construction standards (e.g., [
52,
65]) and technologies.
Figure 5,
Figure 6,
Figure 7 and
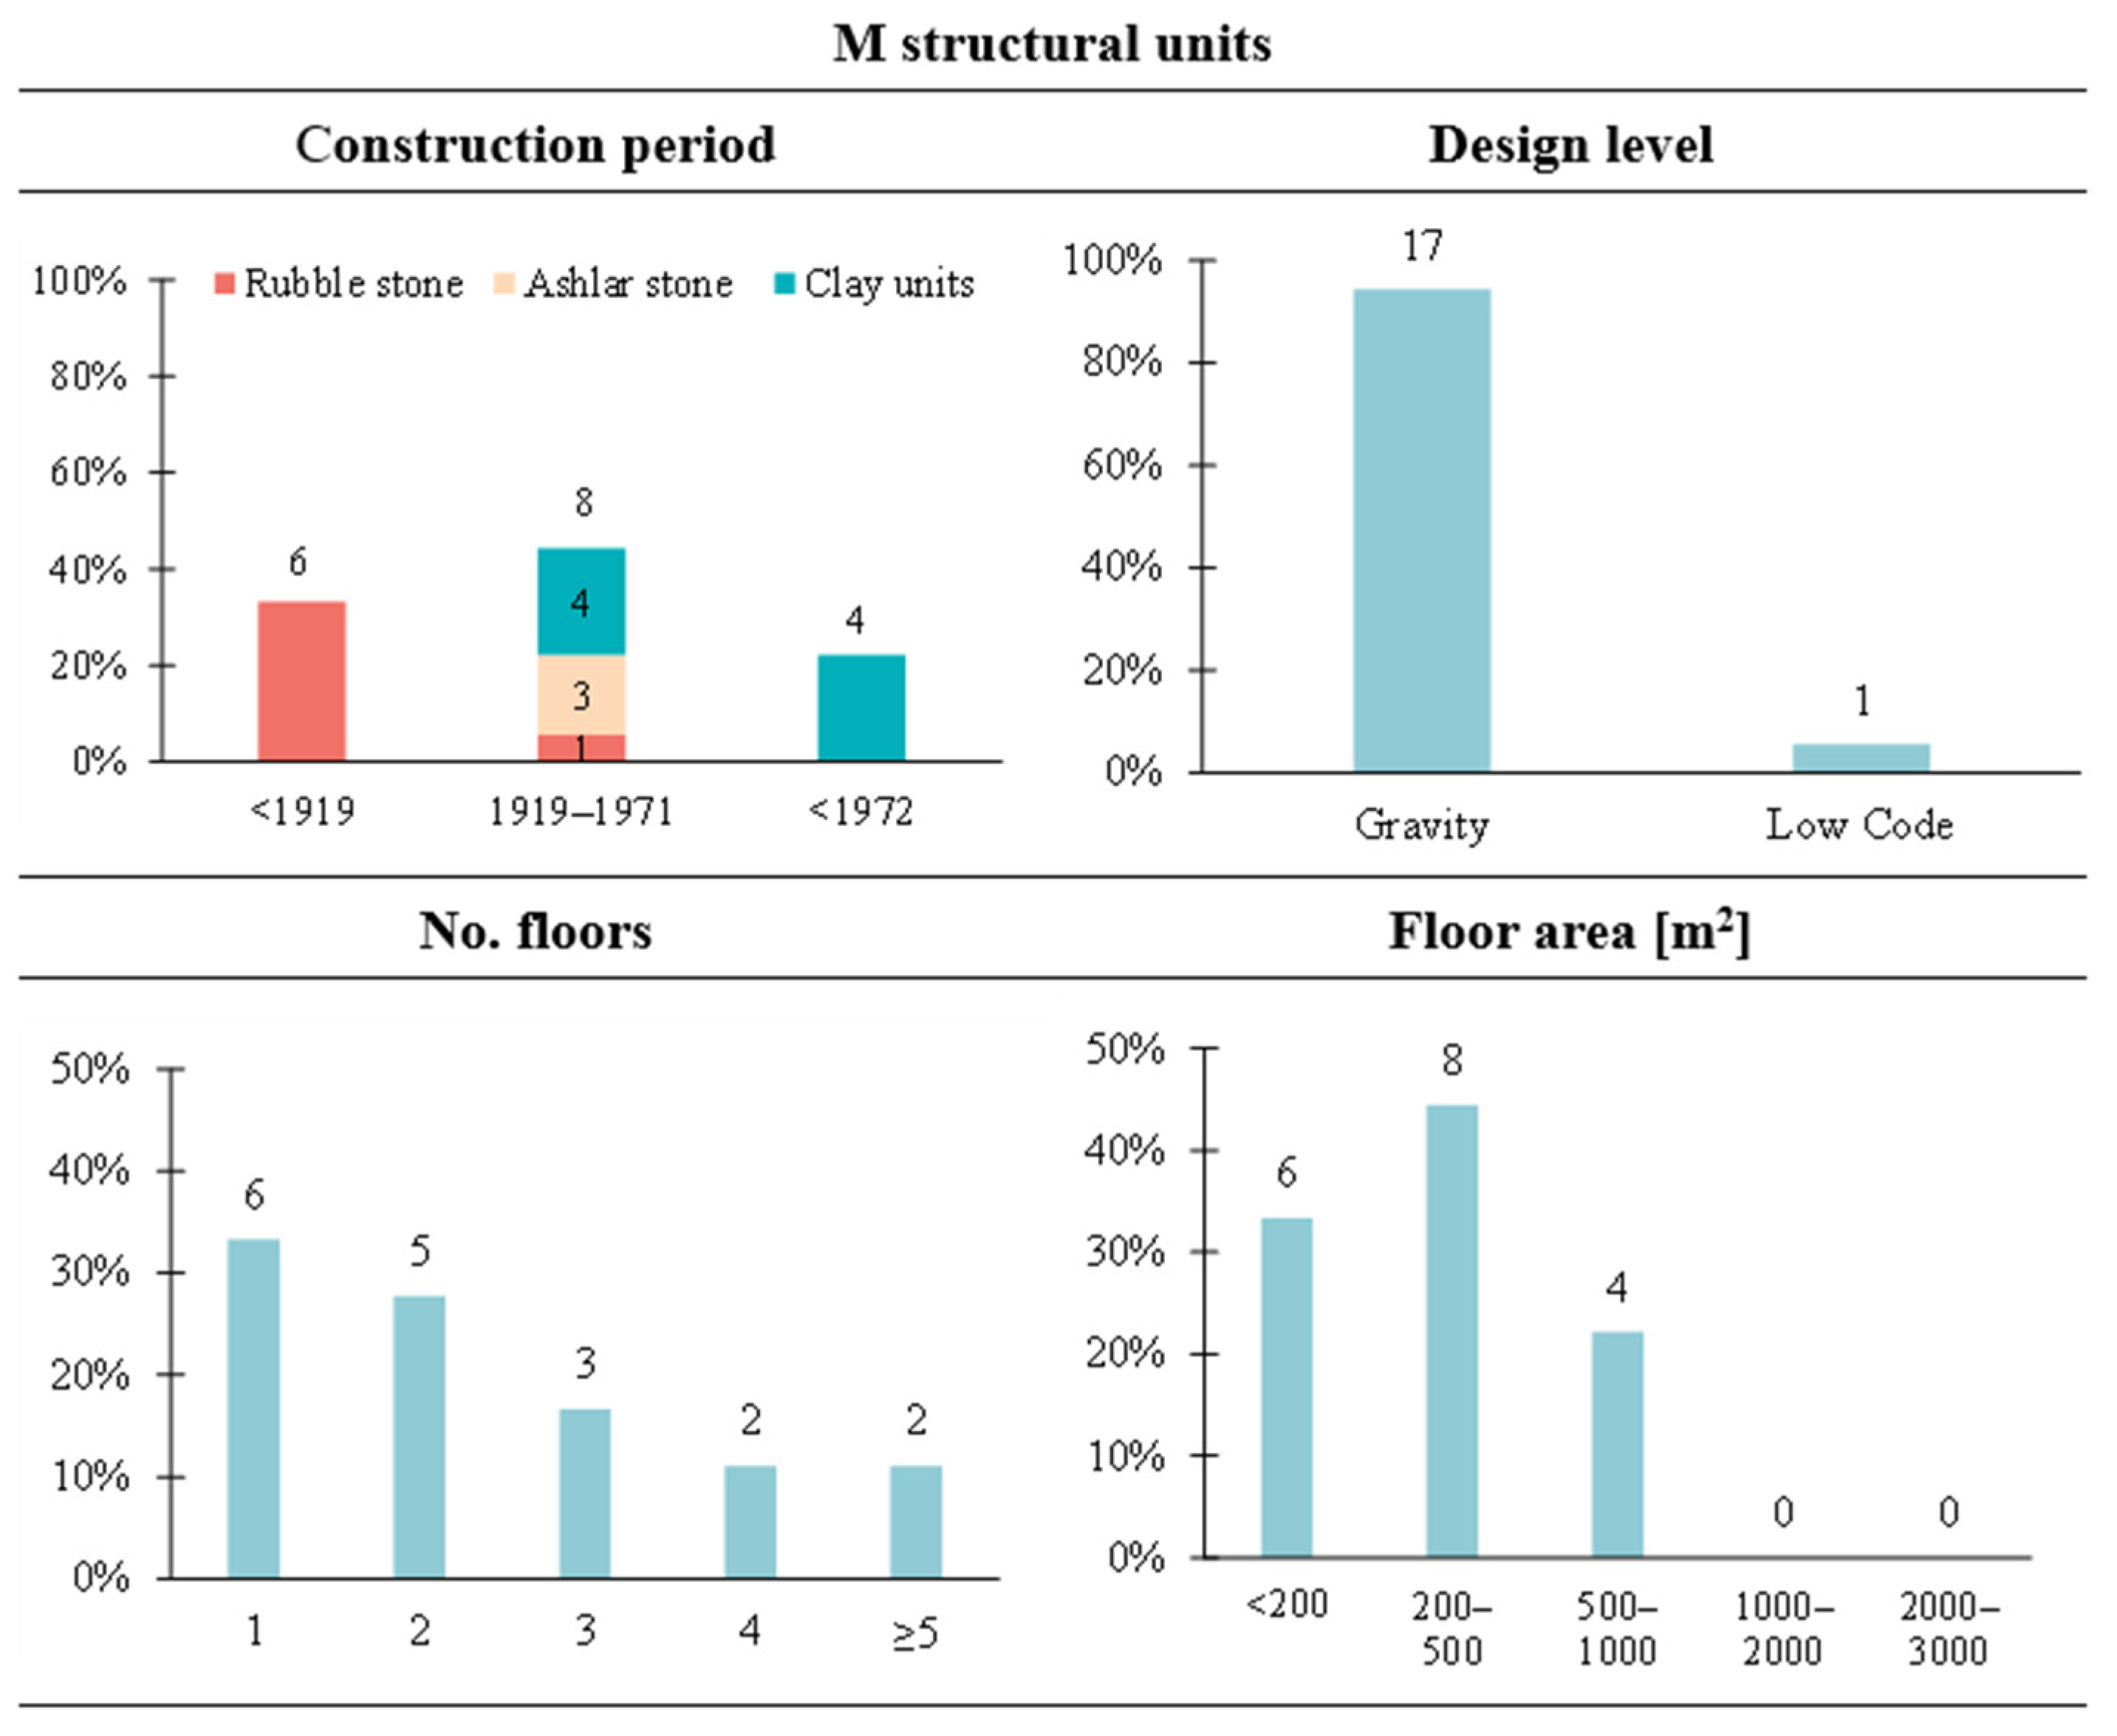
Figure 8 provide key statistics for the M, RC, I-RC, and I-ST structural units, respectively. As shown in
Figure 5, three main masonry types were identified in the M units, with varying prevalence across different construction periods: rubble stone, ashlar stone, and clay unit masonry. All these units, except for one, can be assigned a ‘Gravity’ design level, as no seismic considerations were included in their design. In general, the design level of a building depends on its construction period and the seismic classification of its municipality at the time of construction, which evolved significantly between 1971 and 2002, until the introduction of OPCM 2003 [
43]. Although the examined M units cover the full range of height classes typical for this building type, they are predominantly low-rise buildings (≤2 storeys). Moreover, the majority of these units have a footprint of less than 200 m
2 (33%) or between 200 and 500 m
2 (44%).
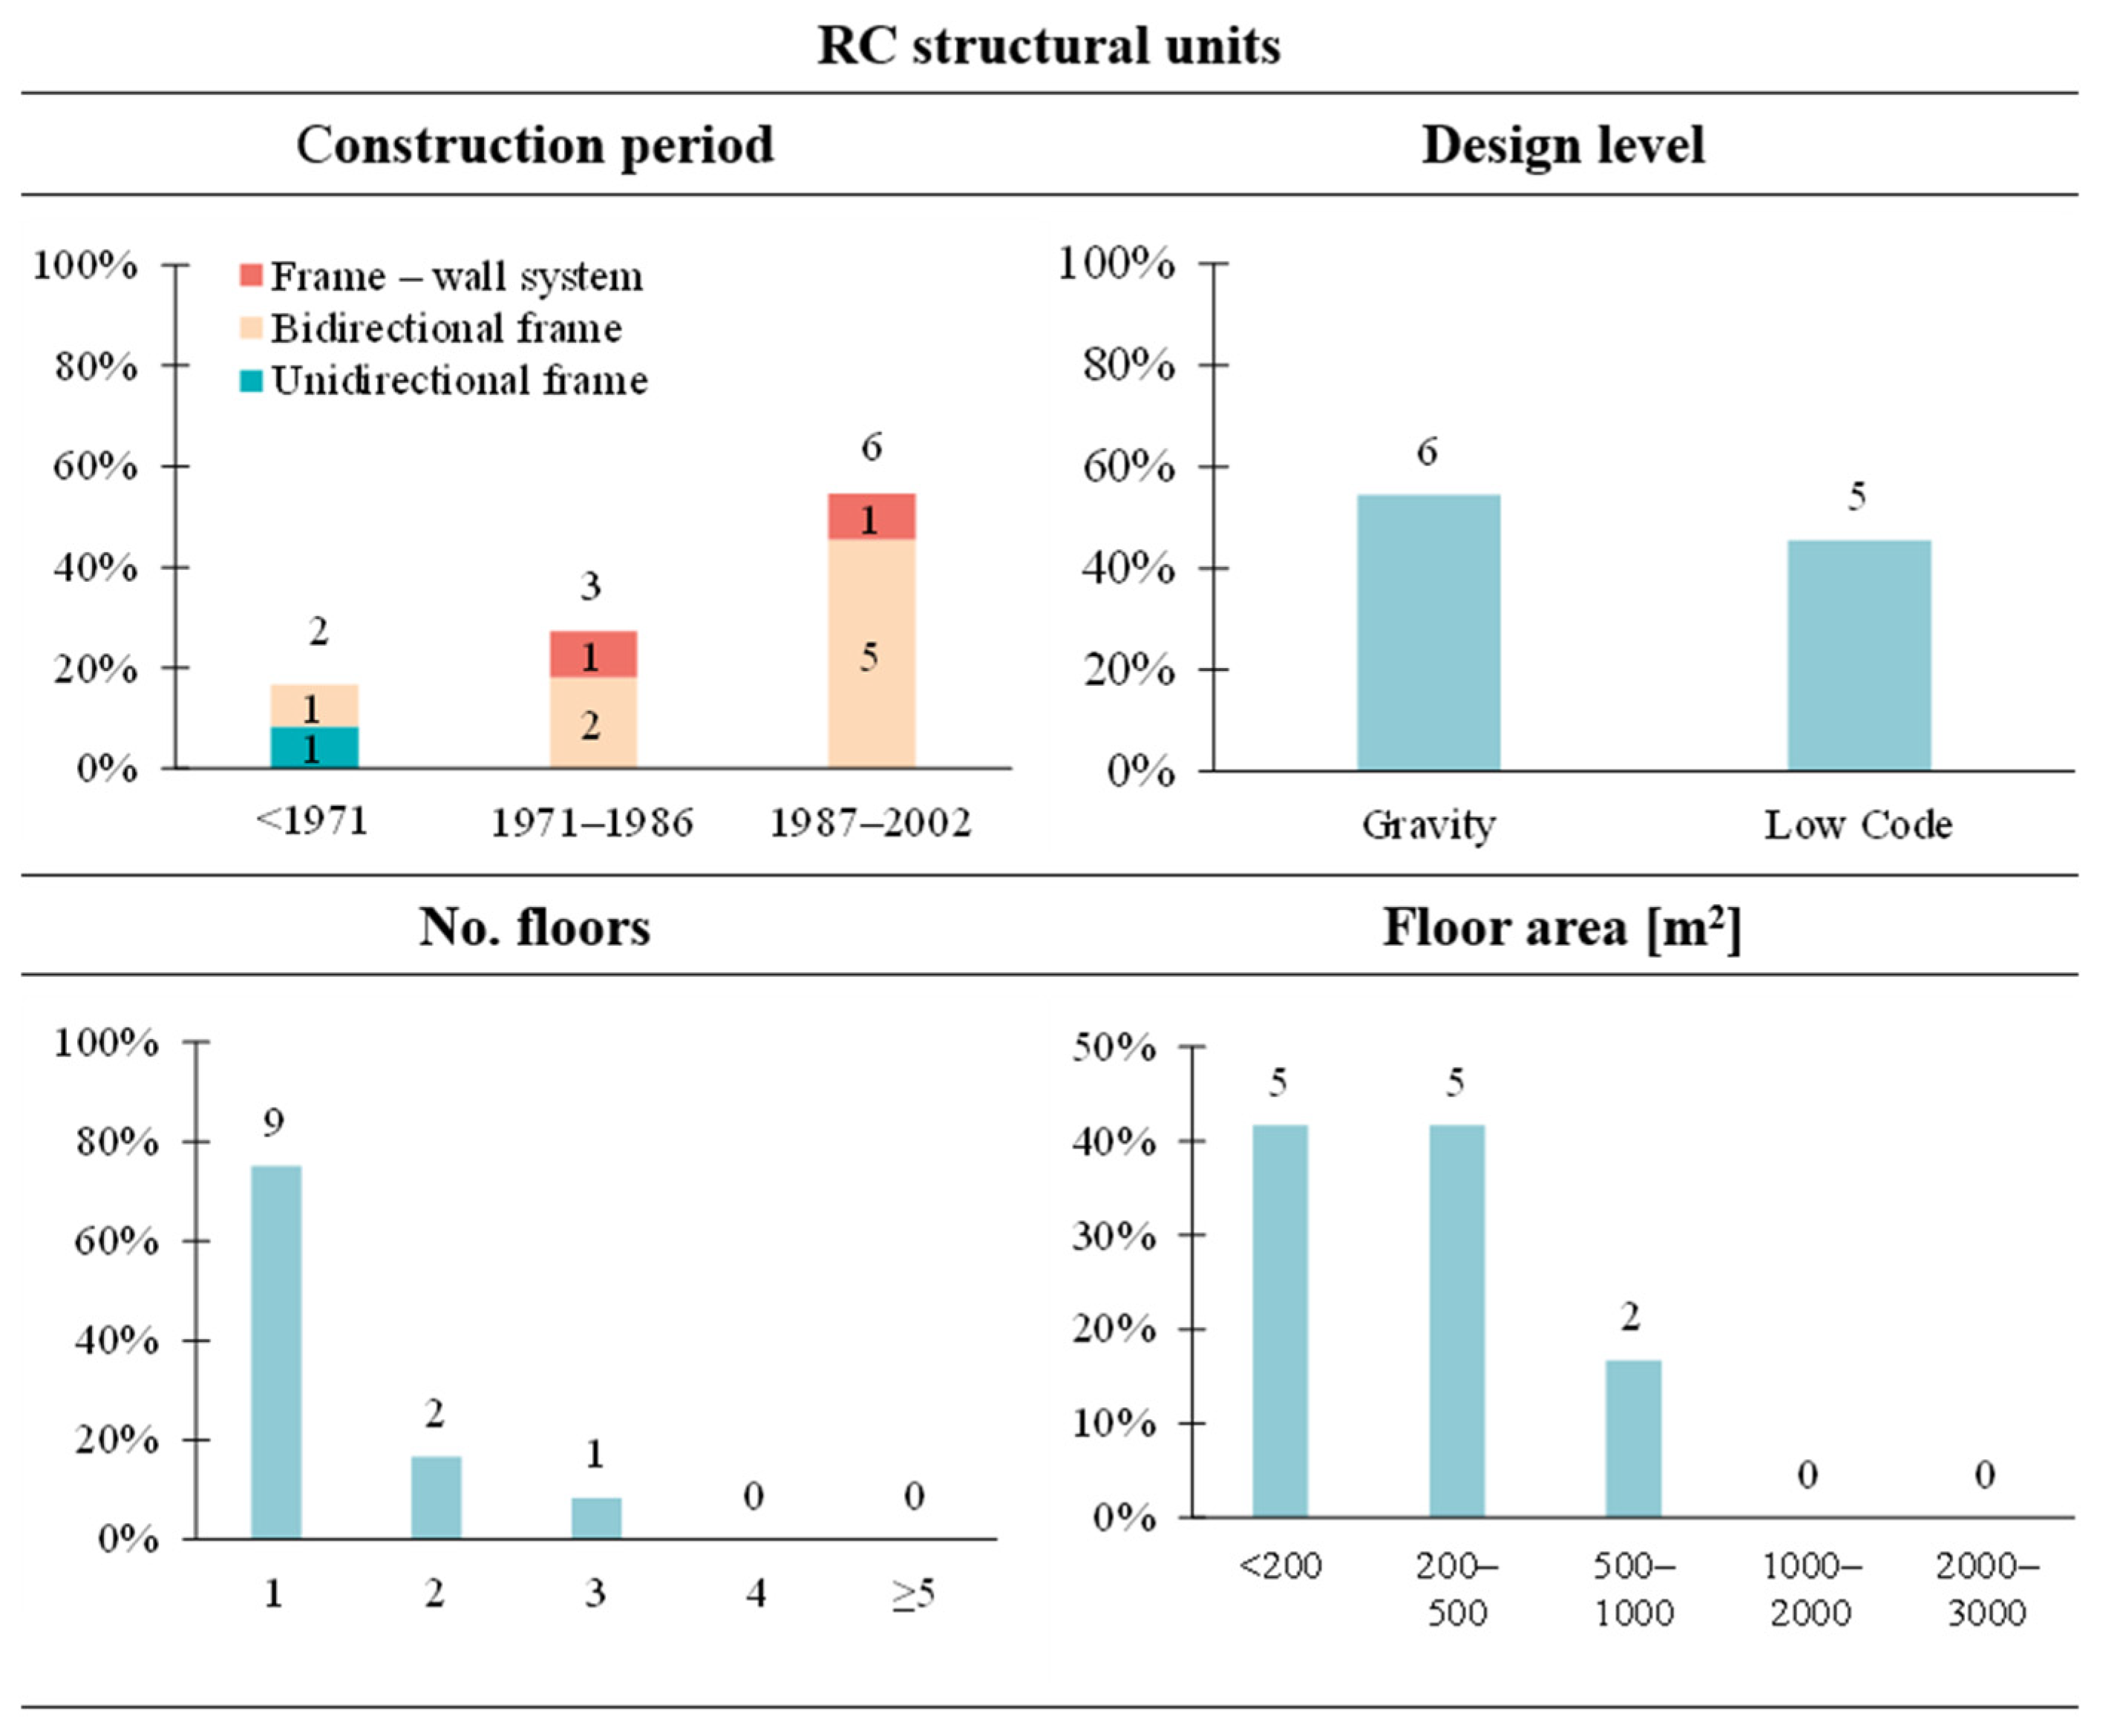
Figure 6 presents statistics on RC units. Three main structural systems were identified: unidirectional frames, bidirectional frames, and frame-wall systems. More than 50% of these units were built after 1987. Furthermore, 6 out of 11 units (45%) can be classified as ‘Low Code’, as they meet minimum seismic design requirements (albeit according to early seismic design standards), while the remaining units can be assigned a ‘Gravity’ design level. In terms of geometric characteristics, the surveyed RC units are mostly single-storey buildings, with a floor area not exceeding 500 m
2 in 83% of cases.
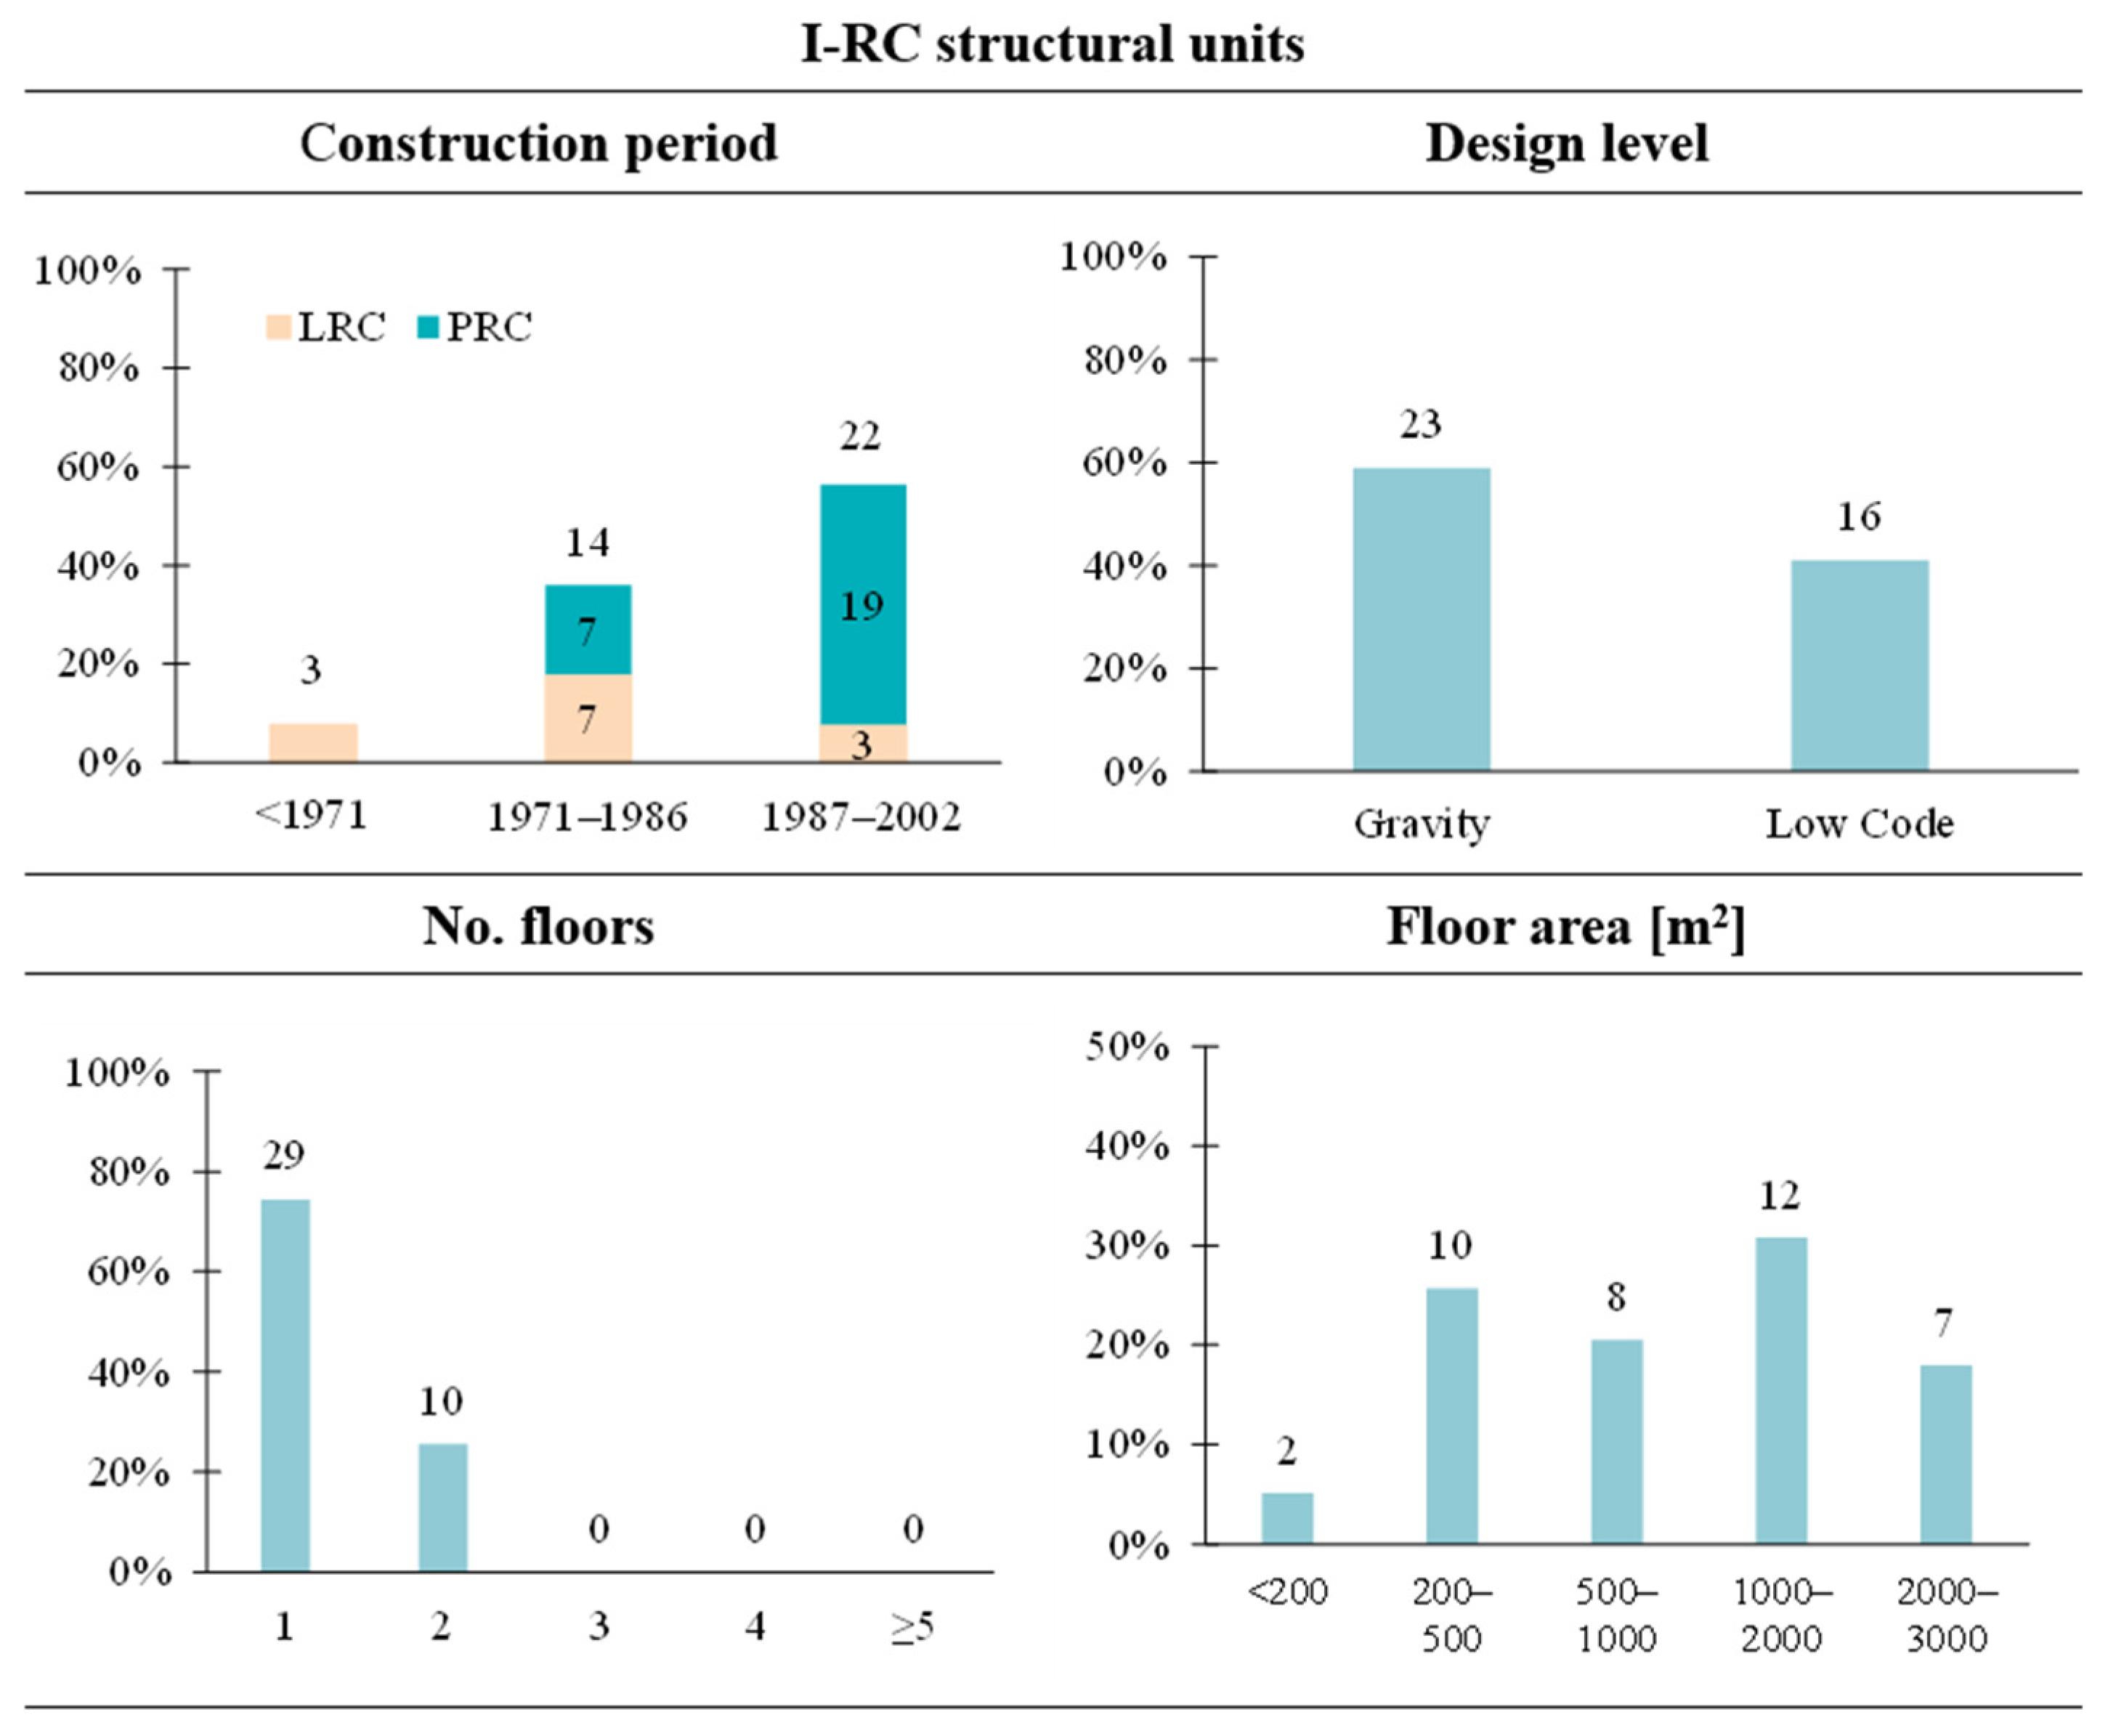
Figure 7 shows similar statistics for I-RC units. These units were primarily constructed starting from the 1970s, and over 50% were built between 1987 and 2002, similar to the RC units. This building type includes both prefabricated reinforced concrete (PRC) structures and large-span reinforced concrete (LRC) structures, with PRC structures predominating, as PRC is the leading technology in industrial construction.
Overall, 60% of I-RC units can be assigned a ‘Gravity’ design level, while the remaining units can be classified as ‘Low Code’. Moreover, these units are mainly single-storey or, at most, two-storey buildings, with floor areas almost evenly distributed within the range of 200–3000 m2.
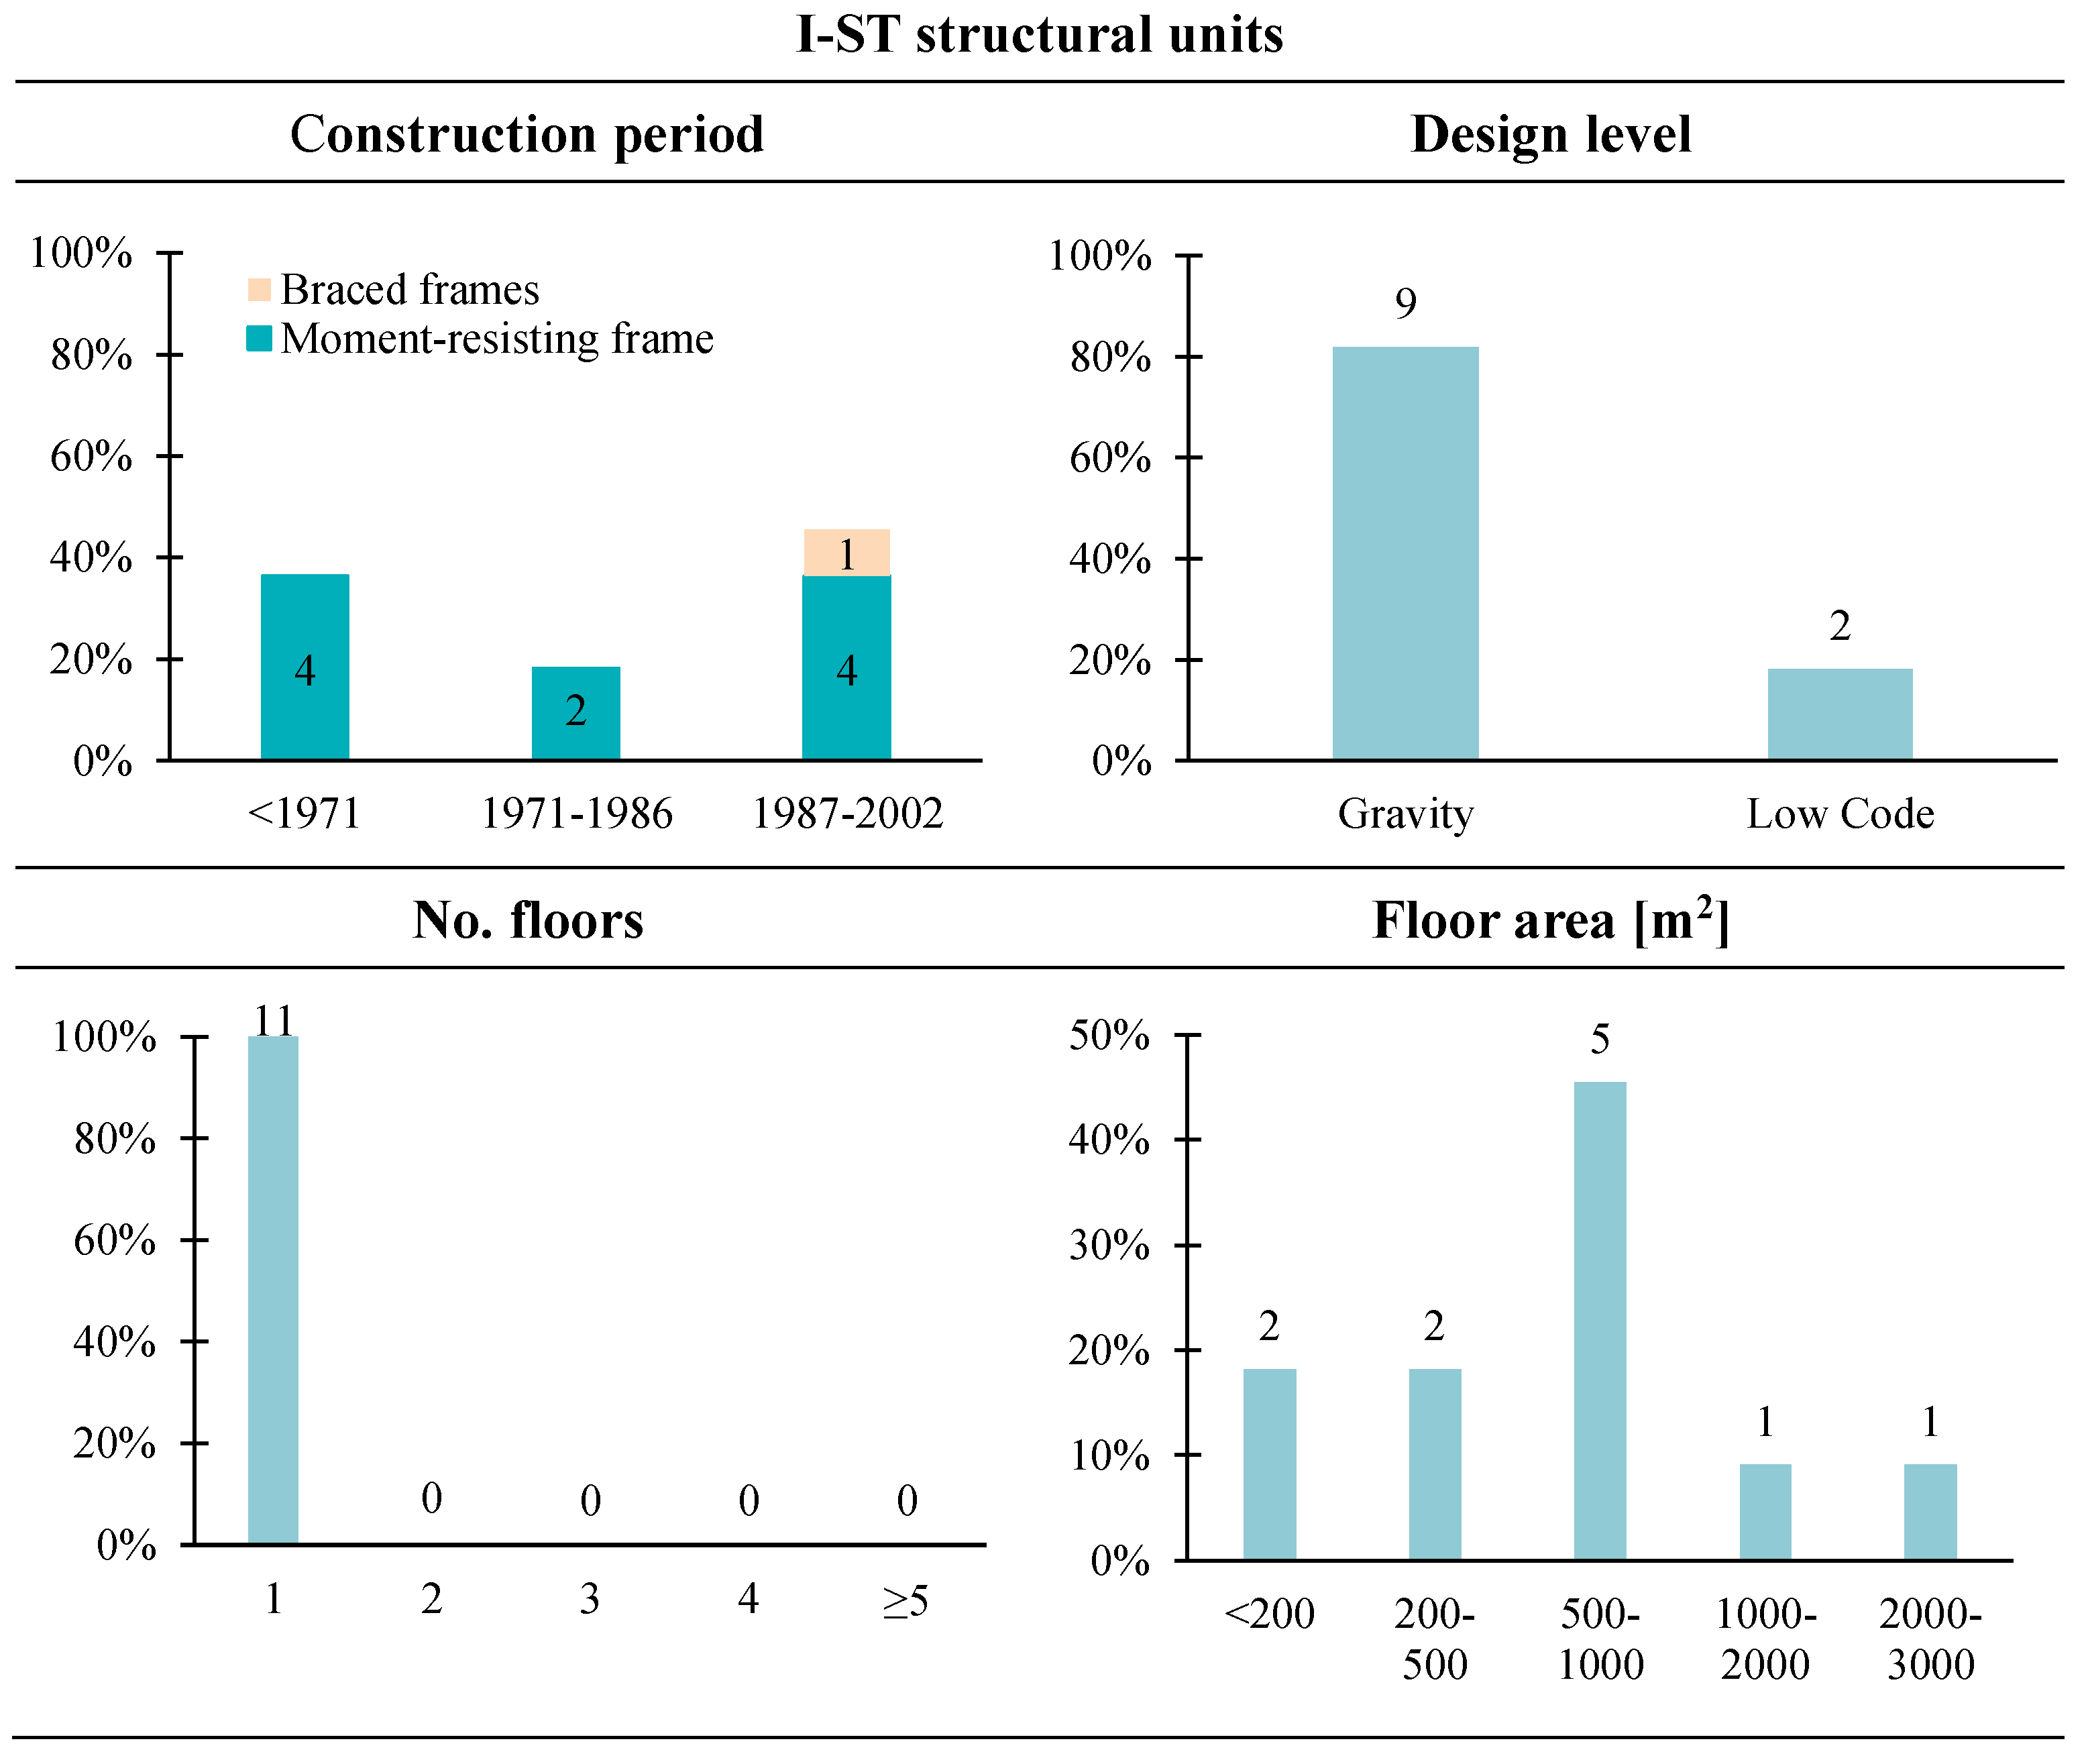
Lastly, statistics for I-ST units are presented in
Figure 8. Two types of structural systems were identified: braced frames (the majority) and moment-resisting frames (only one case). 9 out of 11 units (82%) fall under the ‘Gravity’ design level, while the remaining two were classified as ‘Low Code’. Furthermore, all these structures are single-storey buildings with highly variable floor areas, although the most common range is between 500 and 1000 m
2.
4. Application of the Seismic Prioritisation Methodology to the Case Study Building Stock
4.1. I-Level Seismic Assessment Results
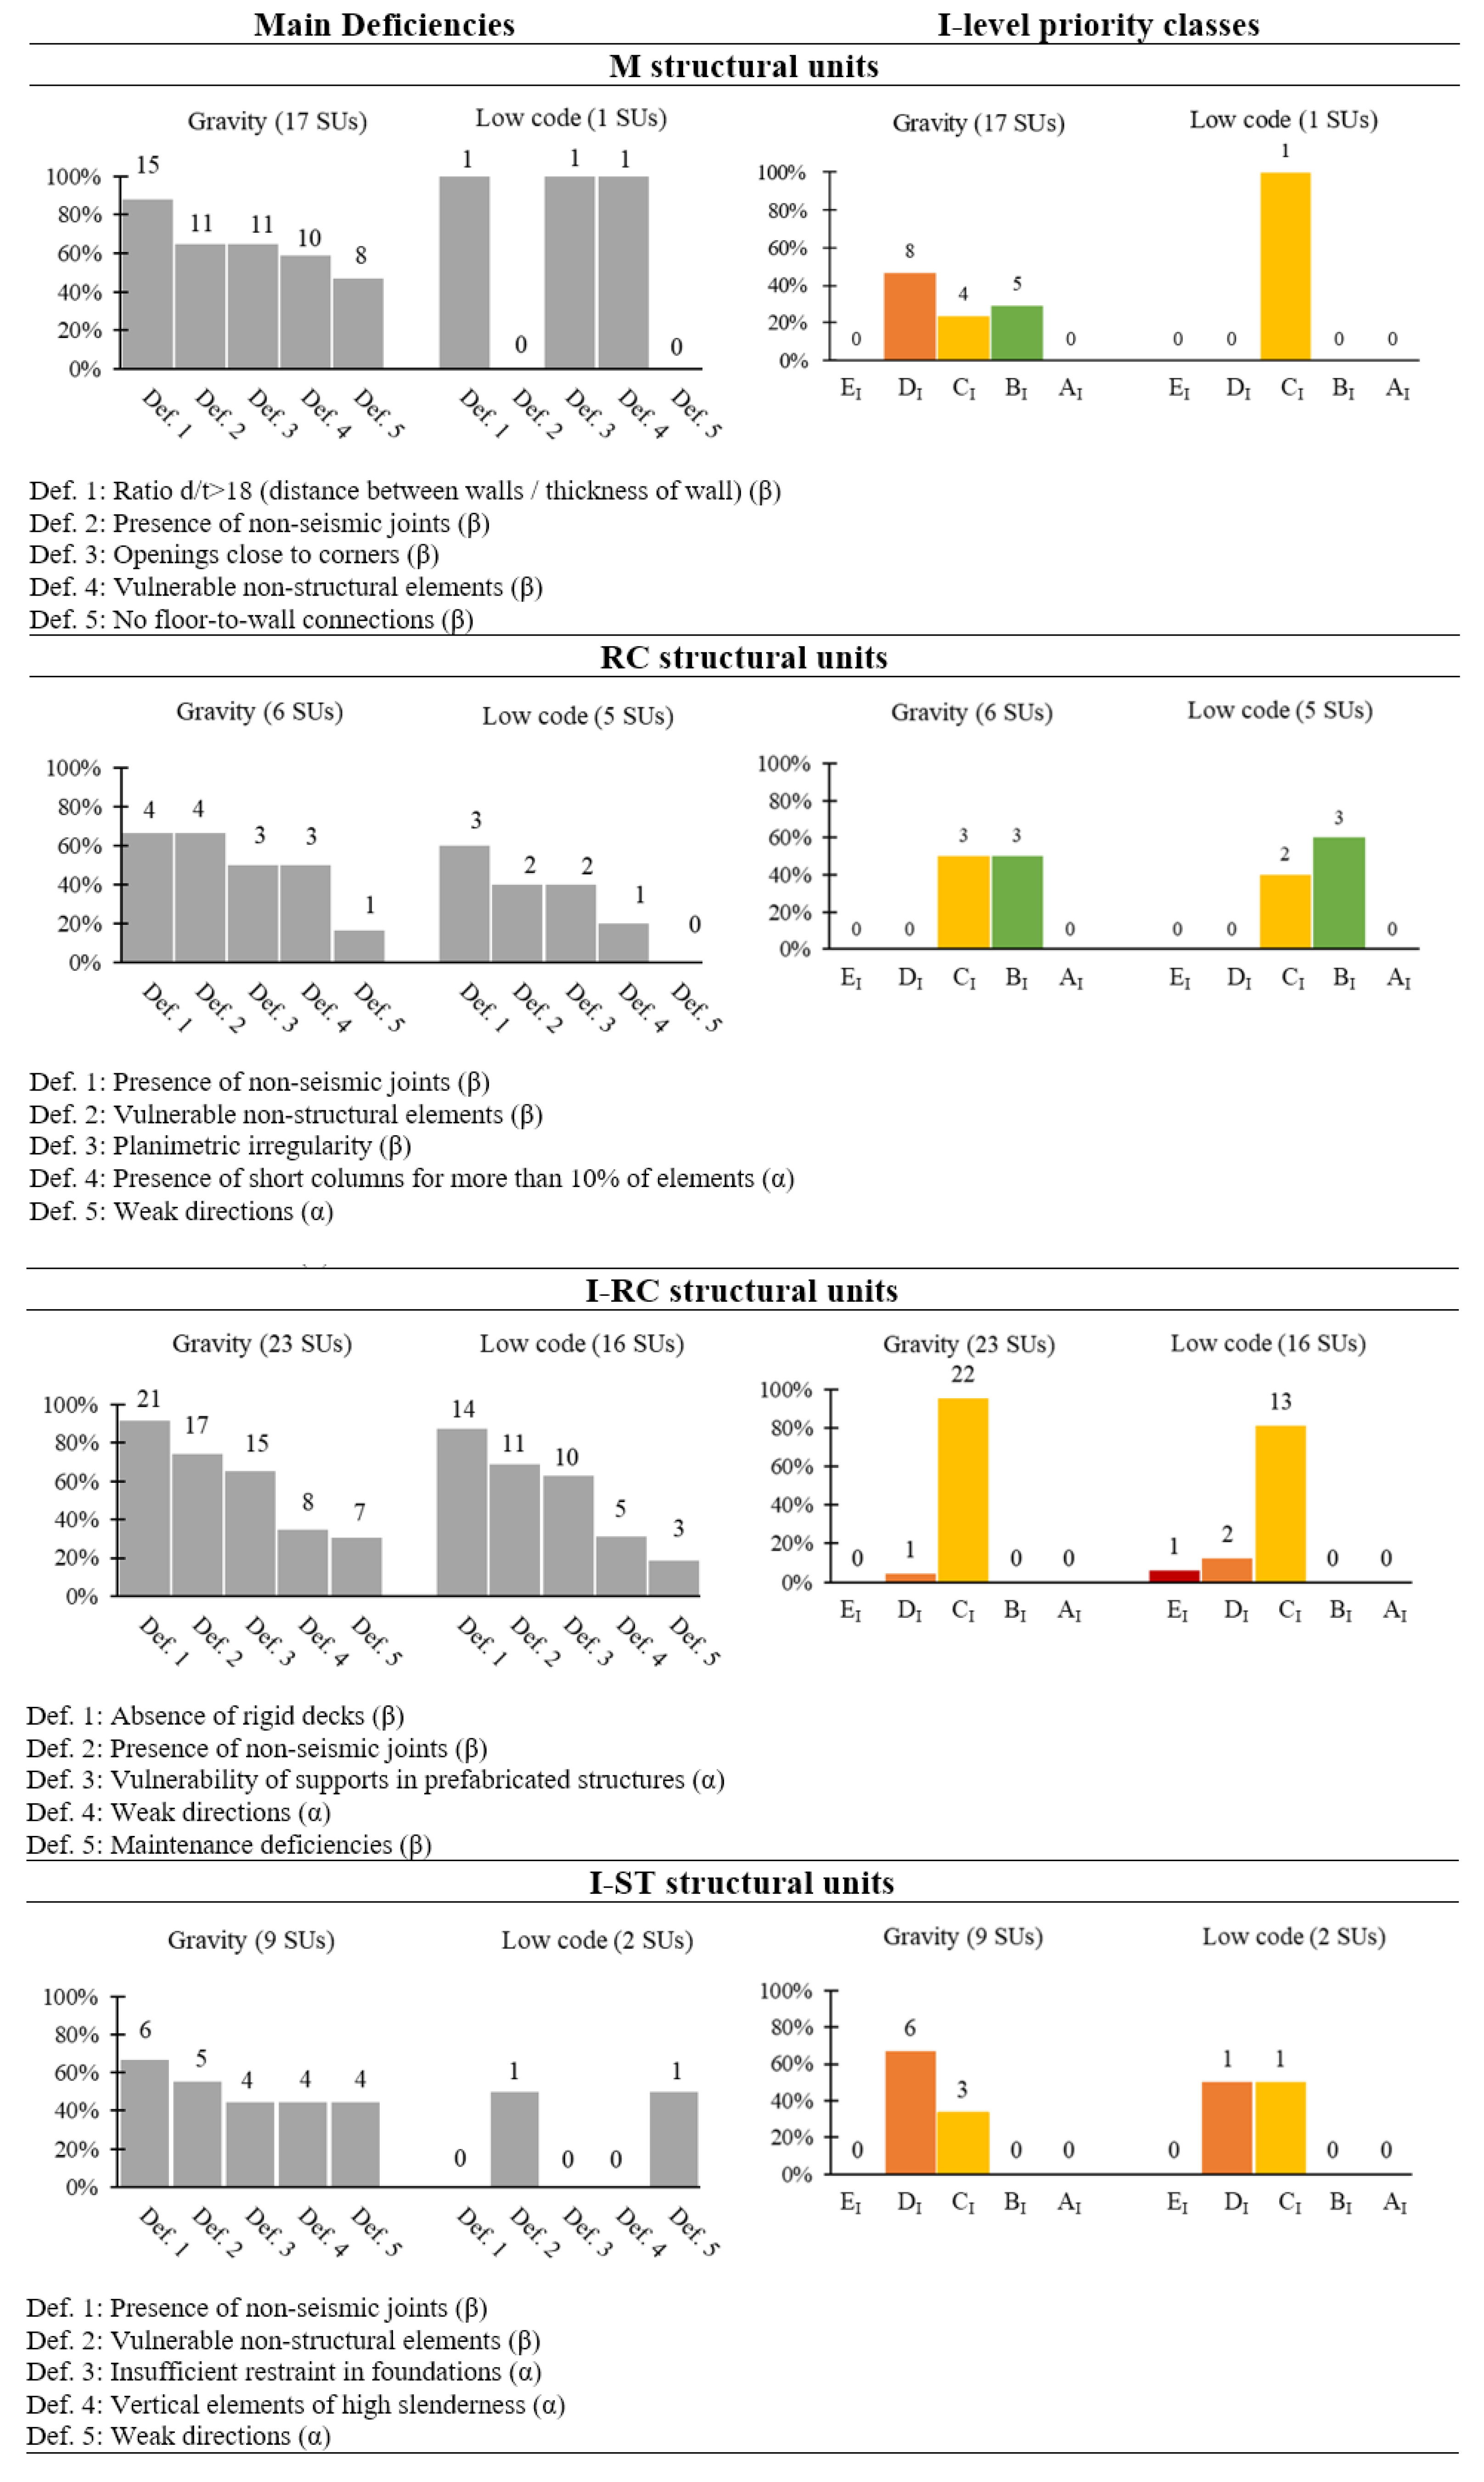
Figure 9 provides an overview of the main results obtained from the application of the first-level seismic assessment to the analysed building stock. For each building type (M, RC, I-RC, I-ST), and by grouping the structural units (SUs) based on their design level (‘Gravity’ and ‘Low Code’), this figure presents: on the left, the main deficiencies identified during the on-site survey using the specific deficiency forms; on the right, the classification of SUs into first-level priority classes, as determined by the procedure described in
Section 2.1.
The number of identified deficiencies generally exceeds the number of SUs, as multiple deficiencies can be recorded for each SU. Additionally, deficiencies are ordered by frequency of occurrence within the analysed building subset, facilitating the identification of the most recurrent weaknesses.
Regarding M structural units, only the ‘Gravity’ sample is sufficiently representative. Within this subset, the main identified deficiencies are all β-type, both structural (e.g., high wall spacing-to-thickness ratio, presence of non-seismic joints, openings near corners) and non-structural (e.g., presence of vulnerable non-structural elements, such as shelving, partitions, false ceilings, installations, overhangs, etc.).
For RC structural units, the sample shows limited statistical significance in both the ‘Gravity’ and ‘Low Code’ categories. However, both subsets share the four most common deficiencies with similar occurrence frequencies. Three of these are β-type (presence of non-seismic joints, vulnerable non-structural elements, and irregular floor plan), while one is α-type (presence of short columns). Additionally, a building in the ‘Gravity’ subset, constructed before 1971, exhibits the ‘weak direction’ deficiency, which is absent in the ‘Low Code’ category.
The I-RC unit sample is the most statistically significant among those analysed. The main deficiencies are still shared between the ‘Gravity’ and ‘Low Code’ subsets, with similar frequency trends, as observed for the RC sample. Notably, the ‘absence of rigid decks’ is prevalent across nearly all surveyed units, as expected for this construction type. ‘Non-seismic joints’ are also frequently observed, as well as ‘deficient structural supports’, a typical feature of this building type. It is also worth noting that α-type deficiencies, specifically ‘deficient supports’ and ‘weak direction’ (ranked third and fourth), are present in both the ‘Gravity’ and ‘Low Code’ subsets. This is consistent with the fact that significant improvements in the structural design of these buildings only took place after the 2012 Emilia Romagna earthquake [
45].
Lastly, the ‘Gravity’ subset of the I-ST sample—the only significant one—exhibits a high recurrence of certain α-type deficiencies typical of this construction type when not designed for seismic loads, specifically ‘insufficient restraint in foundations’ and ‘highly slender vertical elements’.
The first-level priority classes, shown in the right column of
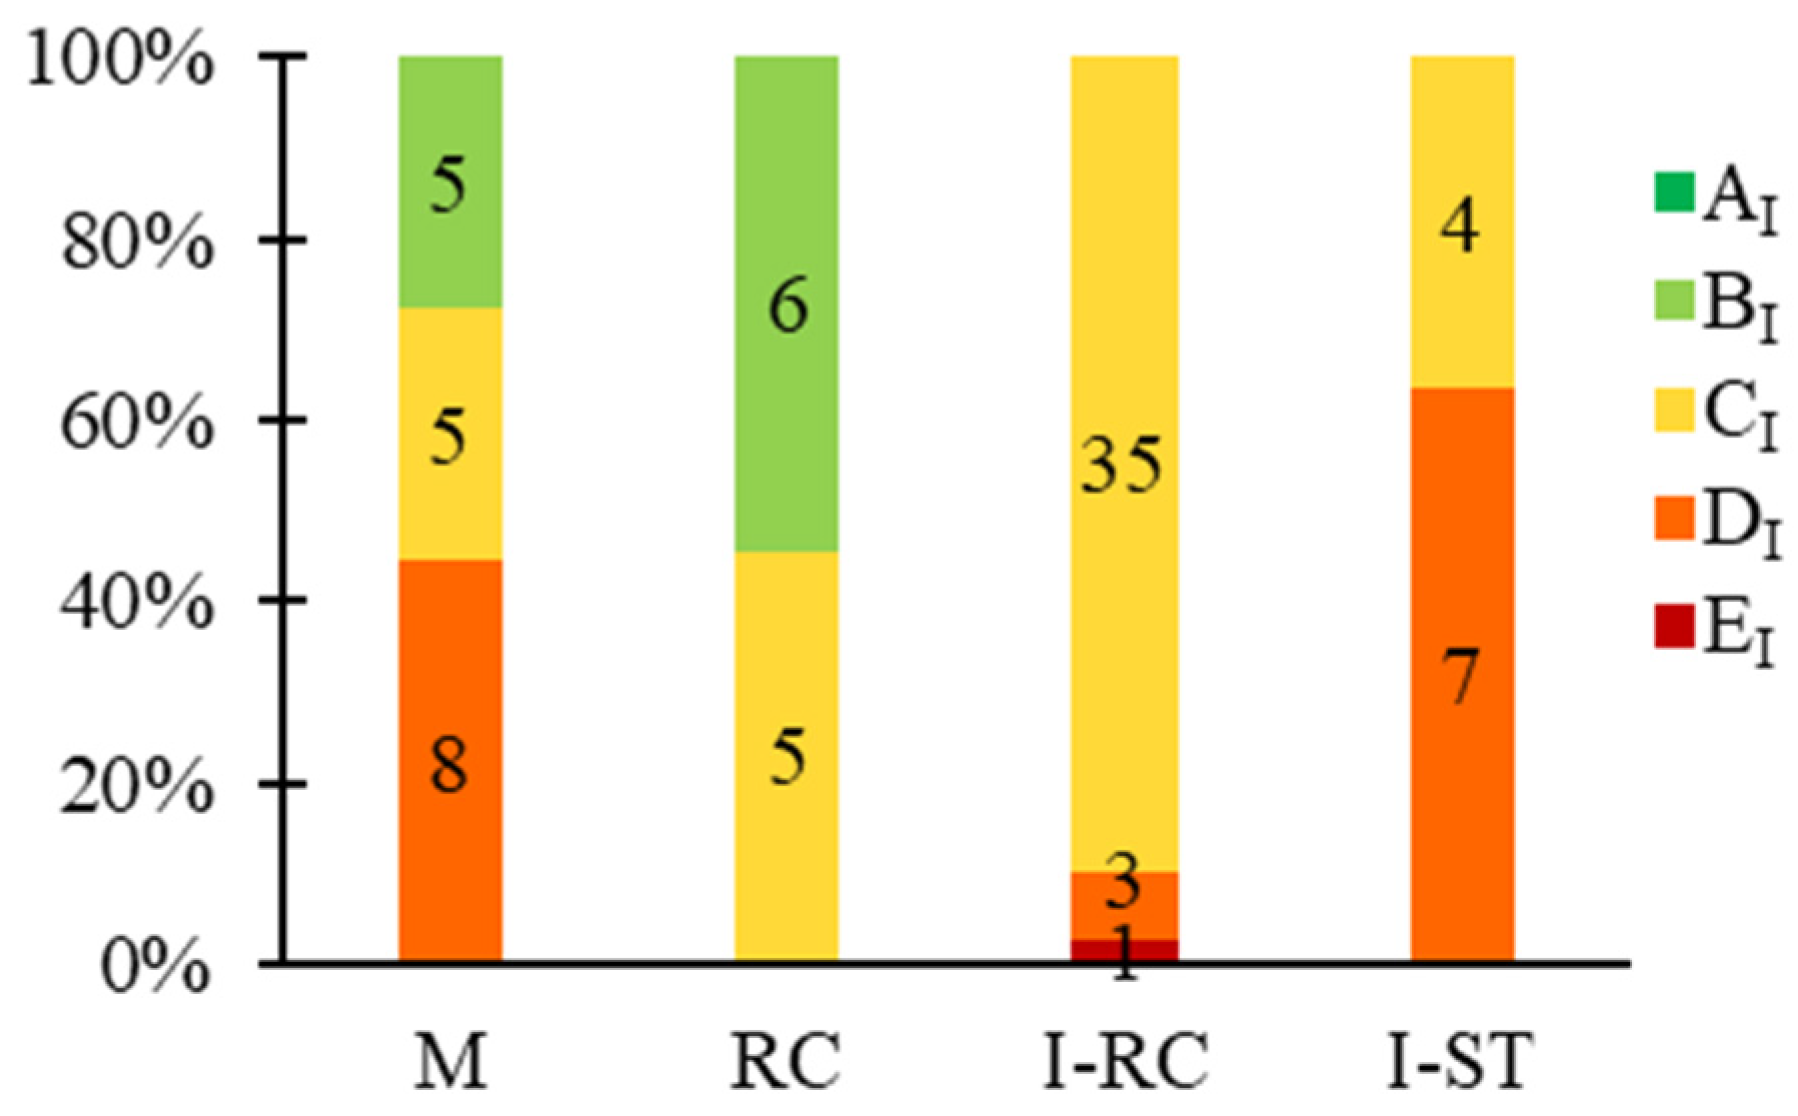
Figure 9, clearly depend on the deficiency grade and seismic zone of each structural unit. Overall, the results indicate that RC units are the least vulnerable in the stock, while I-ST units are the most vulnerable—except for one I-RC unit, which falls into the highest priority class (EI), mainly due to the high PGA value at its site. These results are summarised in
Figure 10, which provides a clearer visual representation of the distribution of first-level priority classes across various building types.
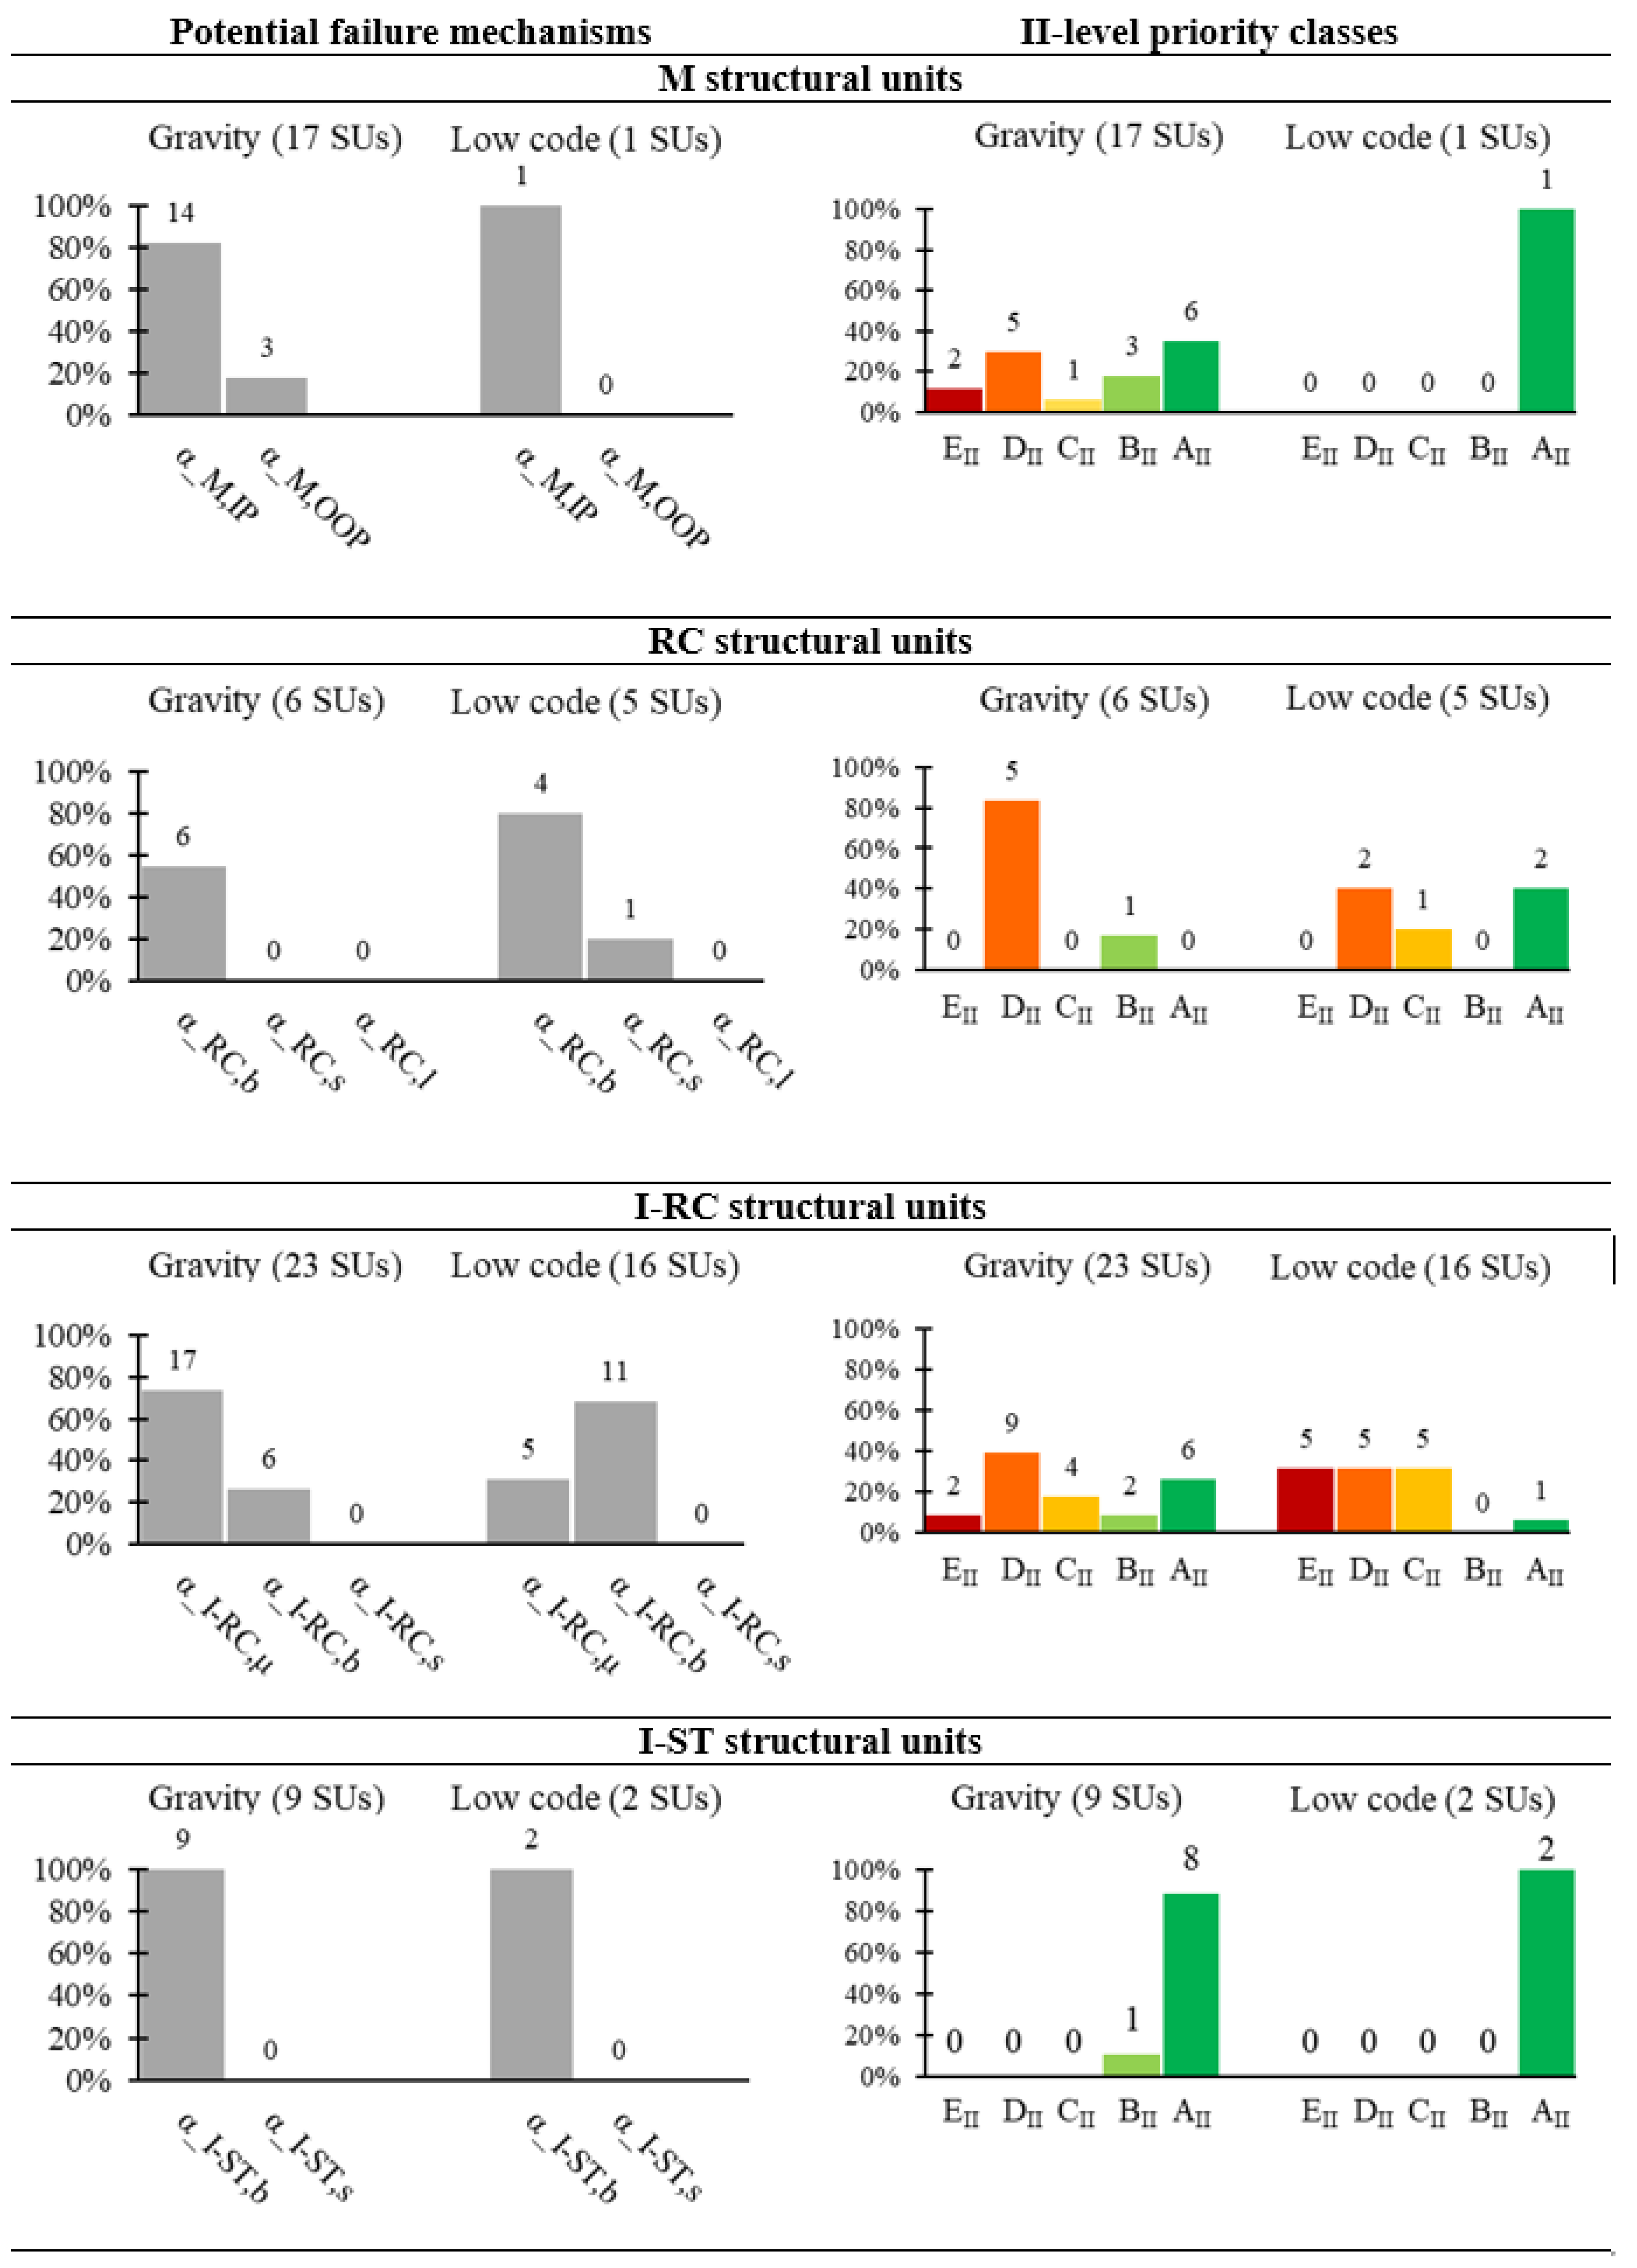
4.2. II-Level Seismic Assessment Results
Figure 11 provides an overview of the main results obtained from the application of the second-level seismic assessment to the analysed building stock. For each building type (M, RC, I-RC, I-ST), and by grouping the structural units (SUs) based on their design level (‘Gravity’ and ‘Low Code’), this figure presents: on the left, the potential failure mechanisms that would be triggered first in the analysed buildings (one per SU), identified by the corresponding safety indices (α
i); on the right, the classification of SUs into second-level priority classes, as determined by the procedure described in
Section 2.2.
Note that the mechanism identified for each SU may not be triggered by the design earthquake (i.e., an event with a 475-year return period), i.e., as the corresponding α value may exceed 1. Thus, the information on the most vulnerable collapse modes simply provides a general understanding of the seismic response of various building types, aiding in their seismic risk management.
Regarding the M structural units, the primary identified failure mechanism is in-plane shear failure of the walls (αM,IP), which suggests appropriate masonry behaviour alongside a sufficient box-like response. However, the resulting priority classes reveal a heterogeneous safety level across the various M units, spanning the entire classification range. Although the site-specific PGA can play a significant role on its own in the priority classification, the oldest M units fall into the highest-priority classes (EII, DII), as expected.
For RC structural units in both the ‘Gravity’ and ‘Low Code’ categories, the main failure mechanism is associated with the combined compression-biaxial bending behaviour of columns or walls (αRC,b). The SUs in the ‘Gravity’ category prove to be more vulnerable, as expected, even considering the relatively limited variation in site-specific PGA for these units. As previously mentioned, the identified mechanisms represent only the potential failure modes. This applies to the unit in the ‘Low Code’ subset associated with shear failure (αRC,s), which is ultimately classified as AII, demonstrating a high safety level despite the critical nature of its failure mechanism.
In the ‘Gravity’ subset of I-RC units, the primary collapse mechanism is support loss (αI-RC,μ), as expected, since this is the main vulnerability of this construction type when not designed for standing seismic loads. When beam-to-column support is ensured, the potential mechanism shifts to combined compression-biaxial bending failure of the columns (αI-RC,b). In the ‘Low Code’ subset, both mechanisms are still present but, as expected, their relative importance is reversed. For these SUs as well, in both the ‘Gravity’ and ‘Low Code’ categories, the identified priority classes span the entire classification range, indicating a highly variable safety level. Notably, some SUs in the ‘Gravity’ subset fall into lower attention classes (AII, BII), benefiting from the low seismicity of their site.
The I-ST structural units primarily exhibit combined compression-biaxial bending failure of the columns (αI-RC,b). All these SUs, in both the ‘Gravity’ and ‘Low Code’ categories, show a very high safety level, with 10 out of 11 units falling into the lowest attention class (AII). This result contrasts with the first-level classification, where these units were assigned medium-to-high attention classes (CI-DI). The discrepancy arises from the simplifications in the first-level assessment, which fails to fully capture the actual seismic demand for this type of structure. Indeed, they are typically lightweight, with low structural masses, which results in relatively low seismic forces and, consequently, higher safety index values. This demonstrates the importance of appropriately combining the results of both assessment levels, as each compensates for the limitations of the other.
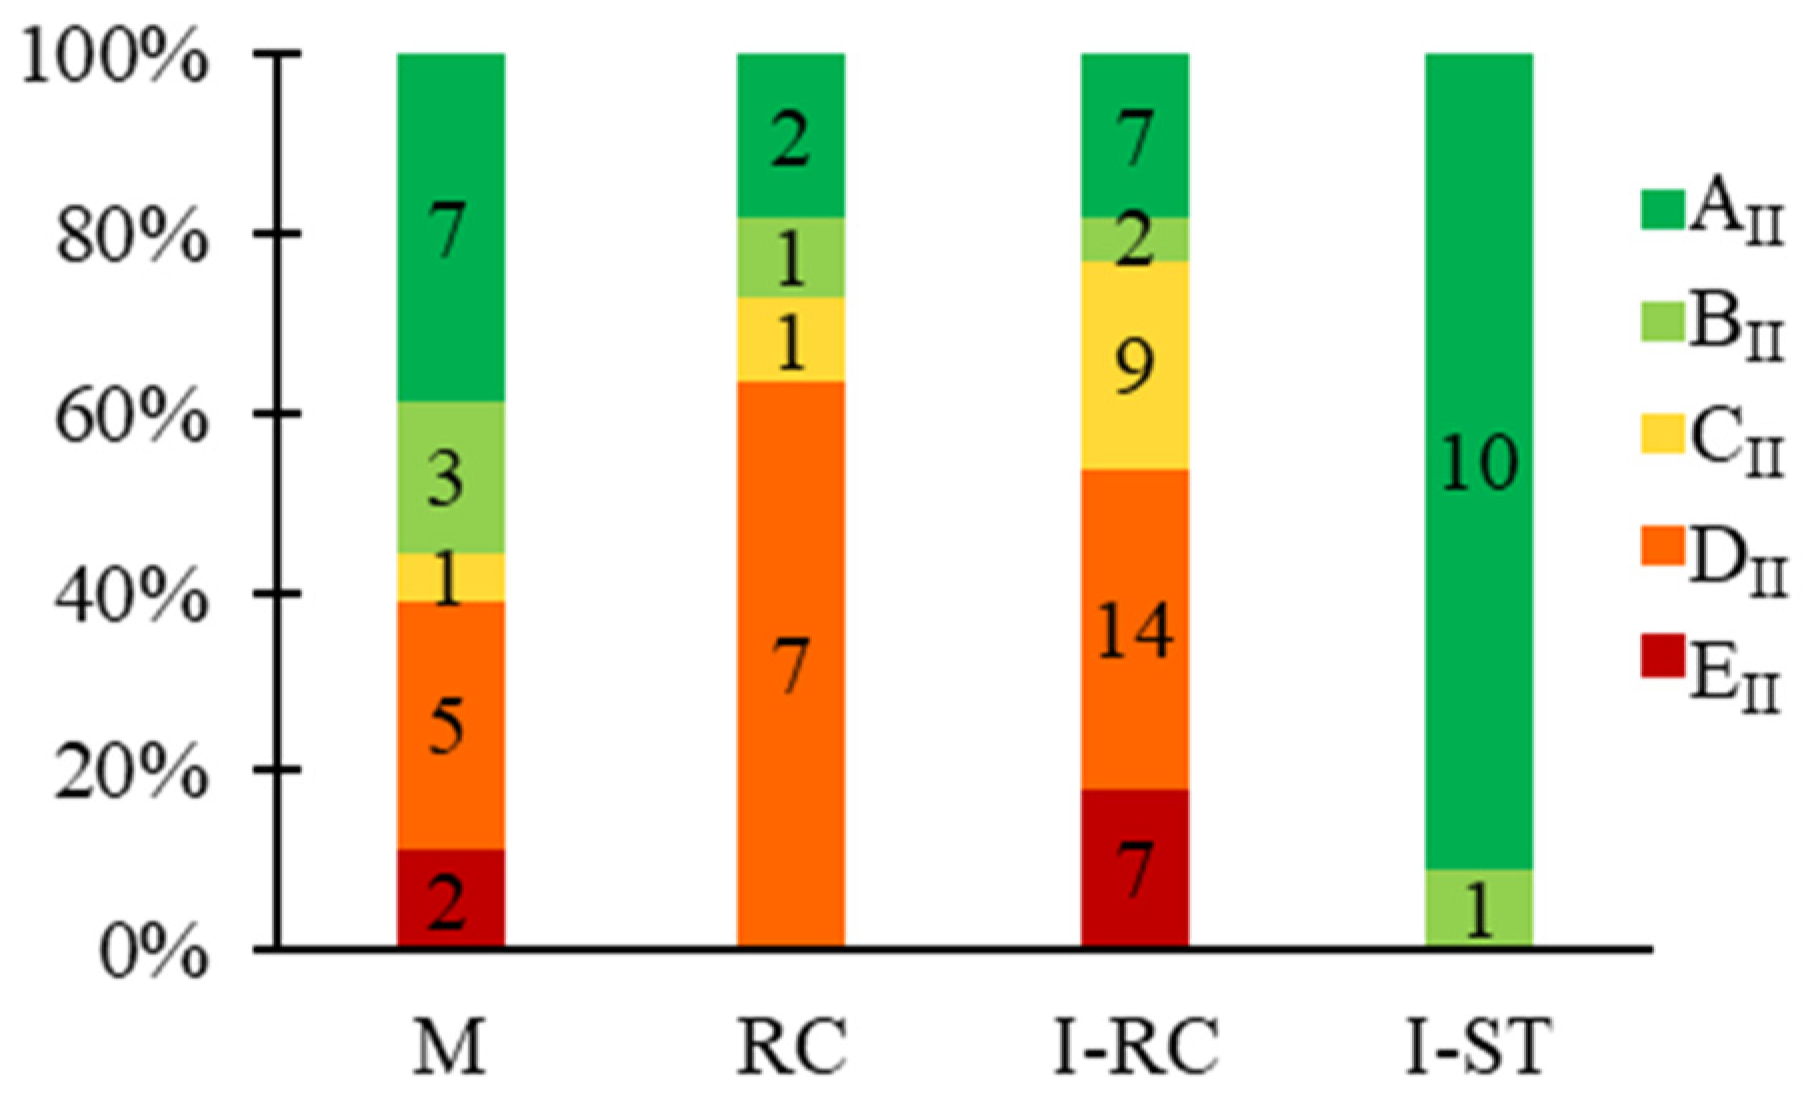
Lastly,
Figure 12 provides a clearer visual representation of the distribution of second-level priority classes across various building types.
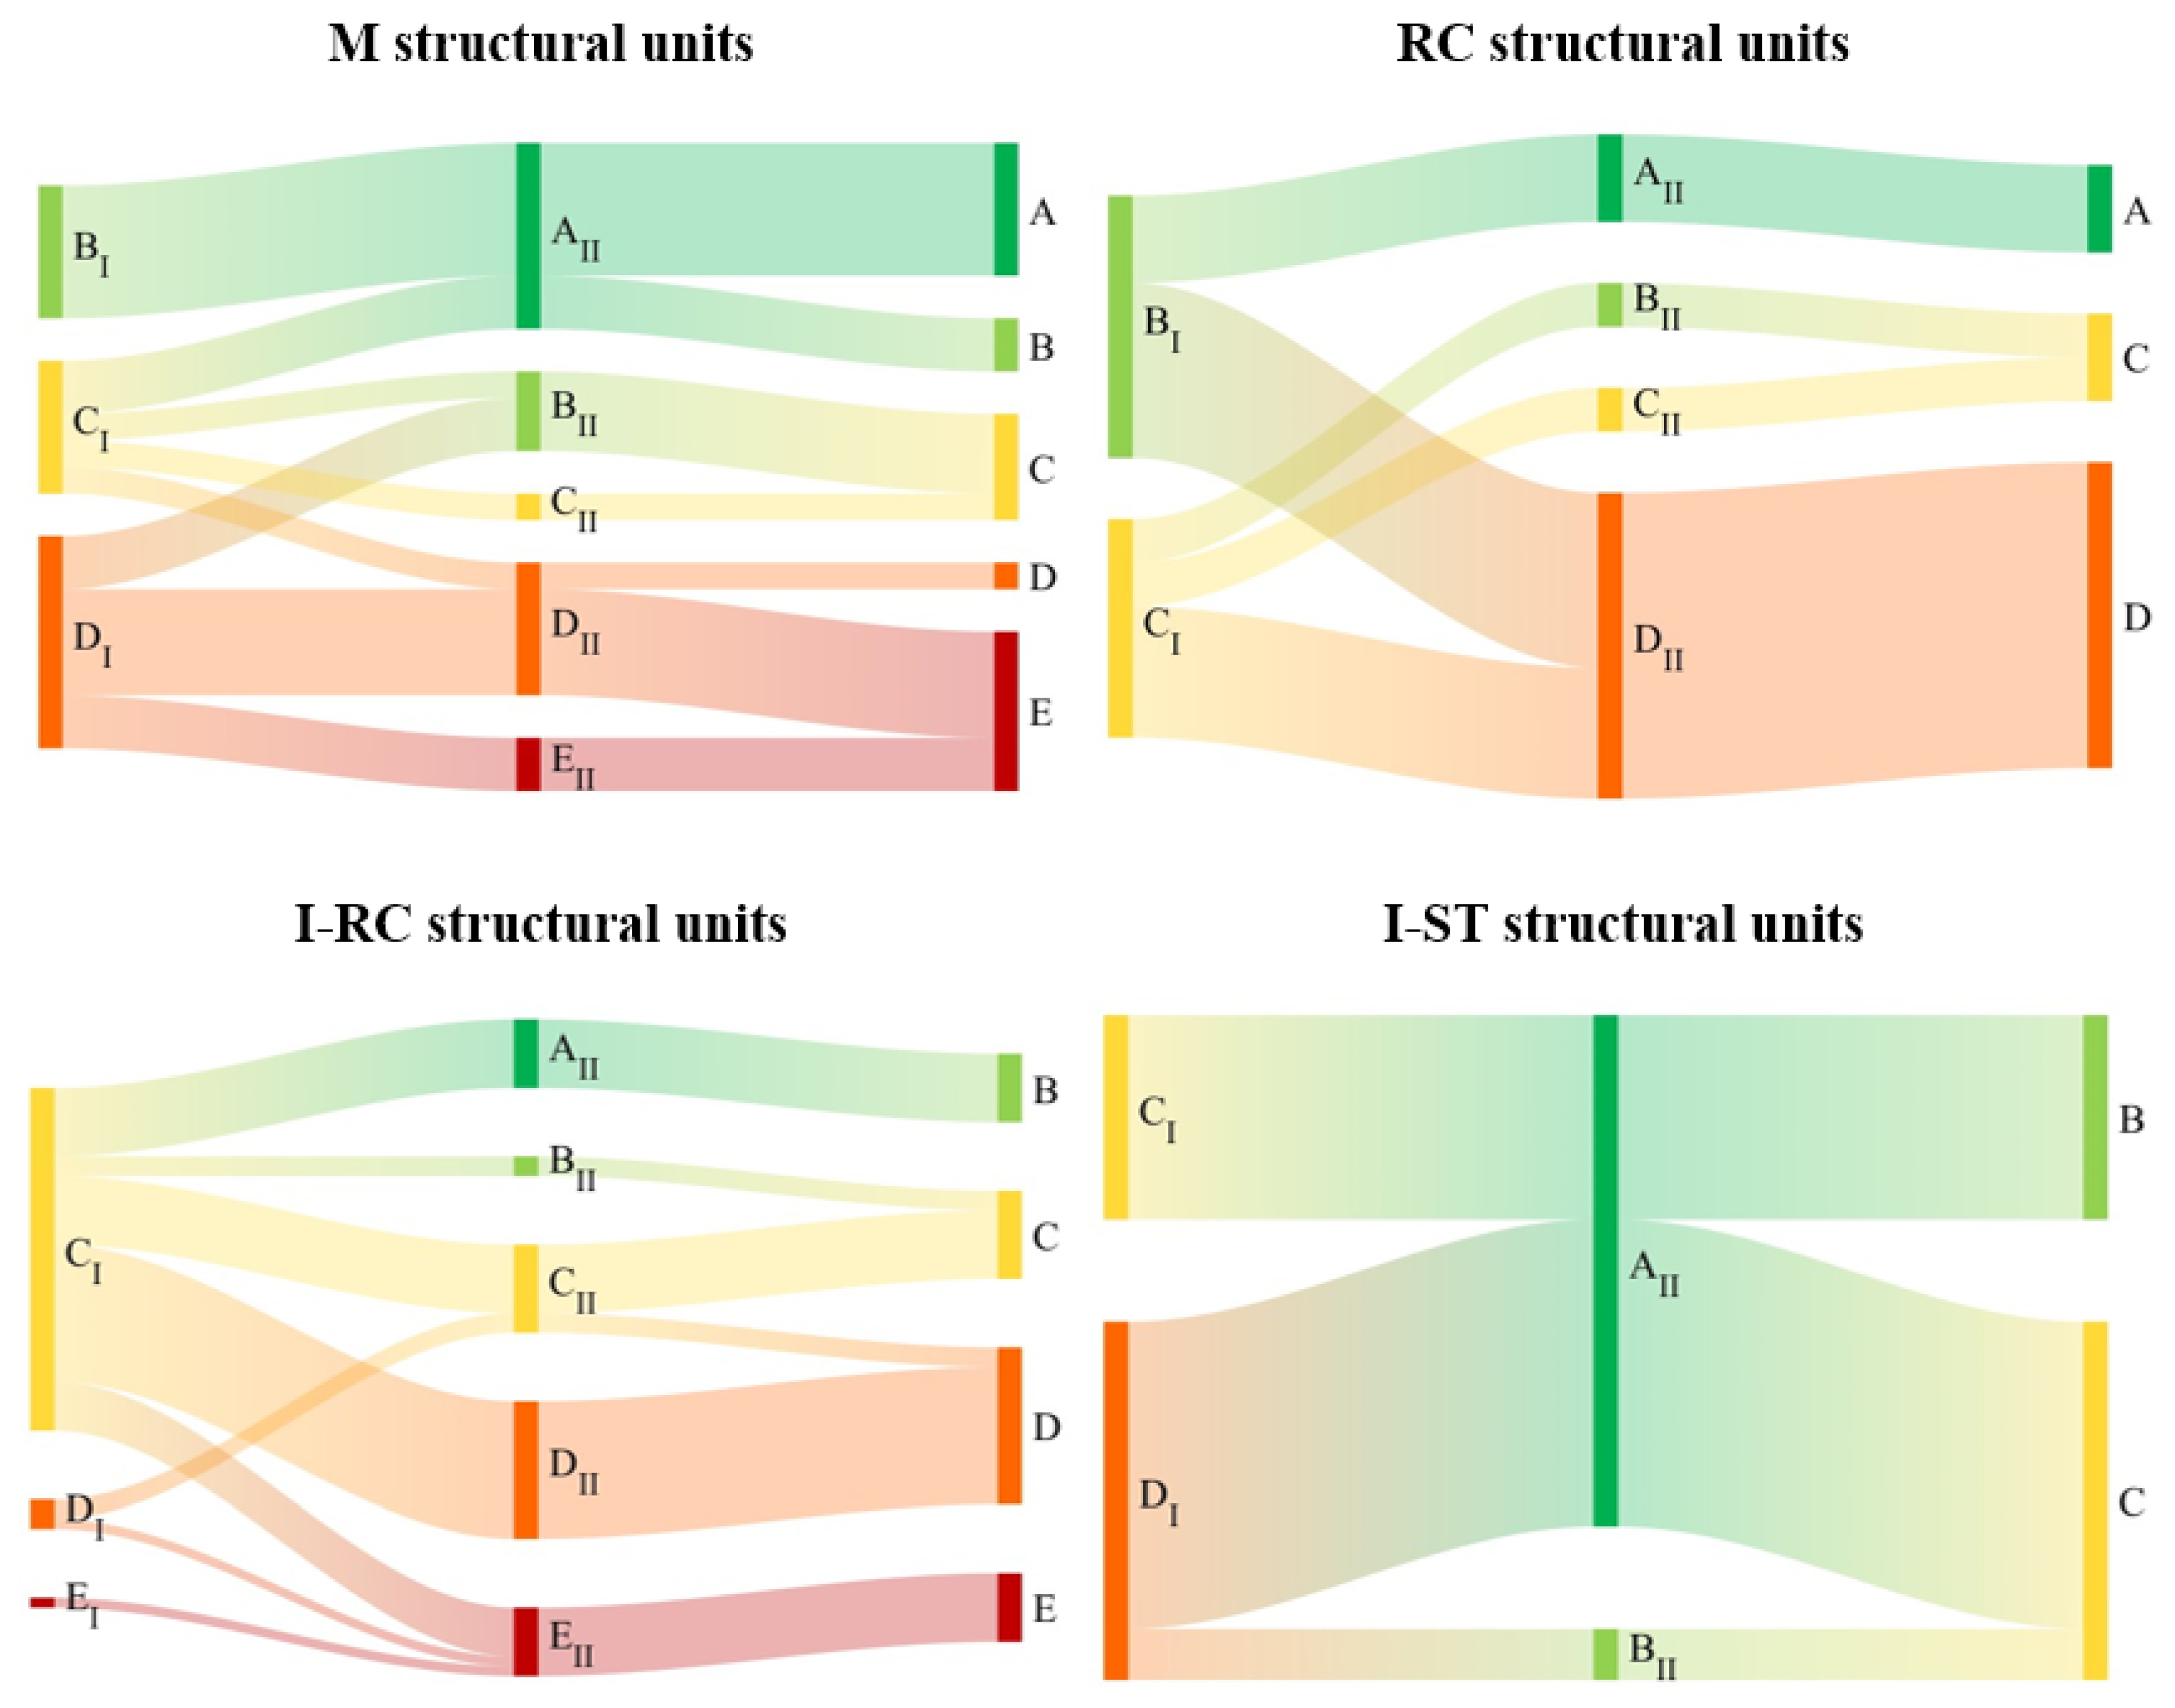
4.3. Combined Seismic Assessment Results
Figure 13 illustrates, using Sankey diagrams, the combination of first- and second-level priority classes for various building types, following the decision-tree approach shown in
Figure 3. While first-level classification groups SUs into two or three categories—mainly intermediate ones (from B
I to D
I)—the second-level classification distributes them across the entire range (from A
II to E
II). This reflects the greater accuracy of the quantitative safety assessment, which also enables a more distributed evaluation through the safety index (α), defined on a continuous scale from 0 to 1.
For the building types M, RC, and I-RC, the combined ranking appears to be quite similar to the second-level ranking, with at most a one-class downgrade due to the potentially worse assessment from the first-level analysis.
In contrast, for the I-ST building type, as previously mentioned, there is an opposite assessment between the first- and second-level methods. Although these buildings exhibit a high degree of deficiencies, they all have relatively high safety levels due to their lightweight nature. Also, as mentioned in
Section 2.2, the second-level assessment overlooks the presence of certain vulnerability factors specific to building technology, which could increase the seismic risk of the SUs. Therefore, the combined assessment approach proposed in this study proves essential for addressing the prioritisation needs of this building type (I-ST), and more generally for heterogeneous building stocks, as it ultimately allows for the comparison of different building types through a synthetic, coherent, and robust parameter, which is the combined priority class.
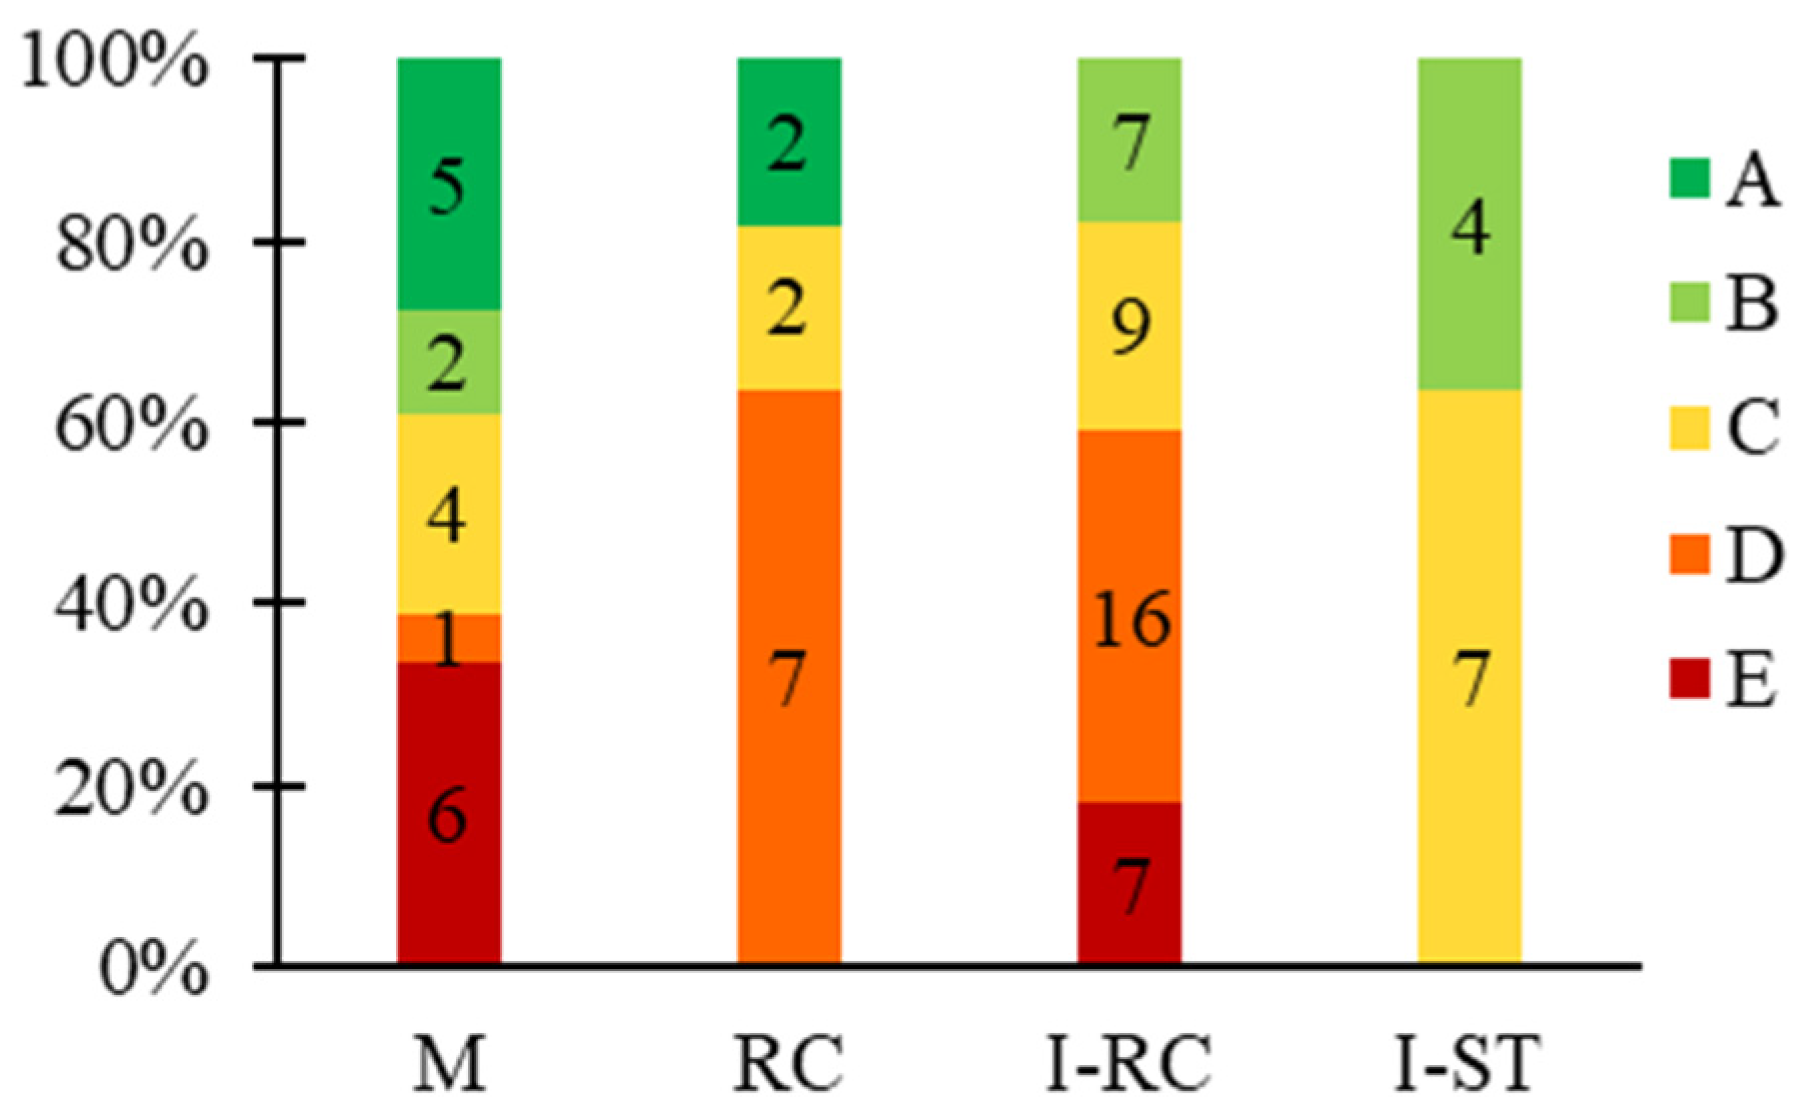
Figure 14 shows the final outcome of applying this prioritisation methodology to the case study building stock, with the distribution of combined priority classes across the identified building types. These results are specific to the analysed stock and cannot be used to draw general conclusions about the relative safety of different building types. However, it can be said that, within the case study stock, the M and I-RC subsets contain SUs associated with the highest priority class (E). For M units, this is mainly due to their significant age, and thus their inherent vulnerability from materials and construction techniques of the era. For I-RC units, the main reason is the inadequacy of the beam-column connections, frequently observed in this building type regardless of the design level (‘Gravity’ or ‘Low Code’), which could lead to a failure mechanism due to beam support loss. Additionally, for ‘Gravity’ units, inadequate design plays a significant role, resulting in a structural conception insufficient to withstand even moderate seismic actions. The latter reason also justifies the relatively high number of RC units in class D. In contrast, for the reasons already mentioned, the I-ST units generally require less attention, falling at most into class C.
Lastly, the outcome derived from this methodology serves as a valuable tool for managing entities or property owners of building stocks, guiding the selection of buildings for in-depth investigations and seismic analyses by professional engineers, while also enabling the prioritisation of seismic retrofit interventions across the stock. An example of the direct application of this tool to guide stock managers’ decisions is shown in
Figure 15. It demonstrates how the seismic assessment for I-RC units could be improved by addressing the inadequacy of beam-column connections (to prevent beam support loss) through cost-effective, non-invasive retrofit interventions, thereby justifying their widespread implementation.
5. Effectiveness of the Proposed Prioritisation Methodology
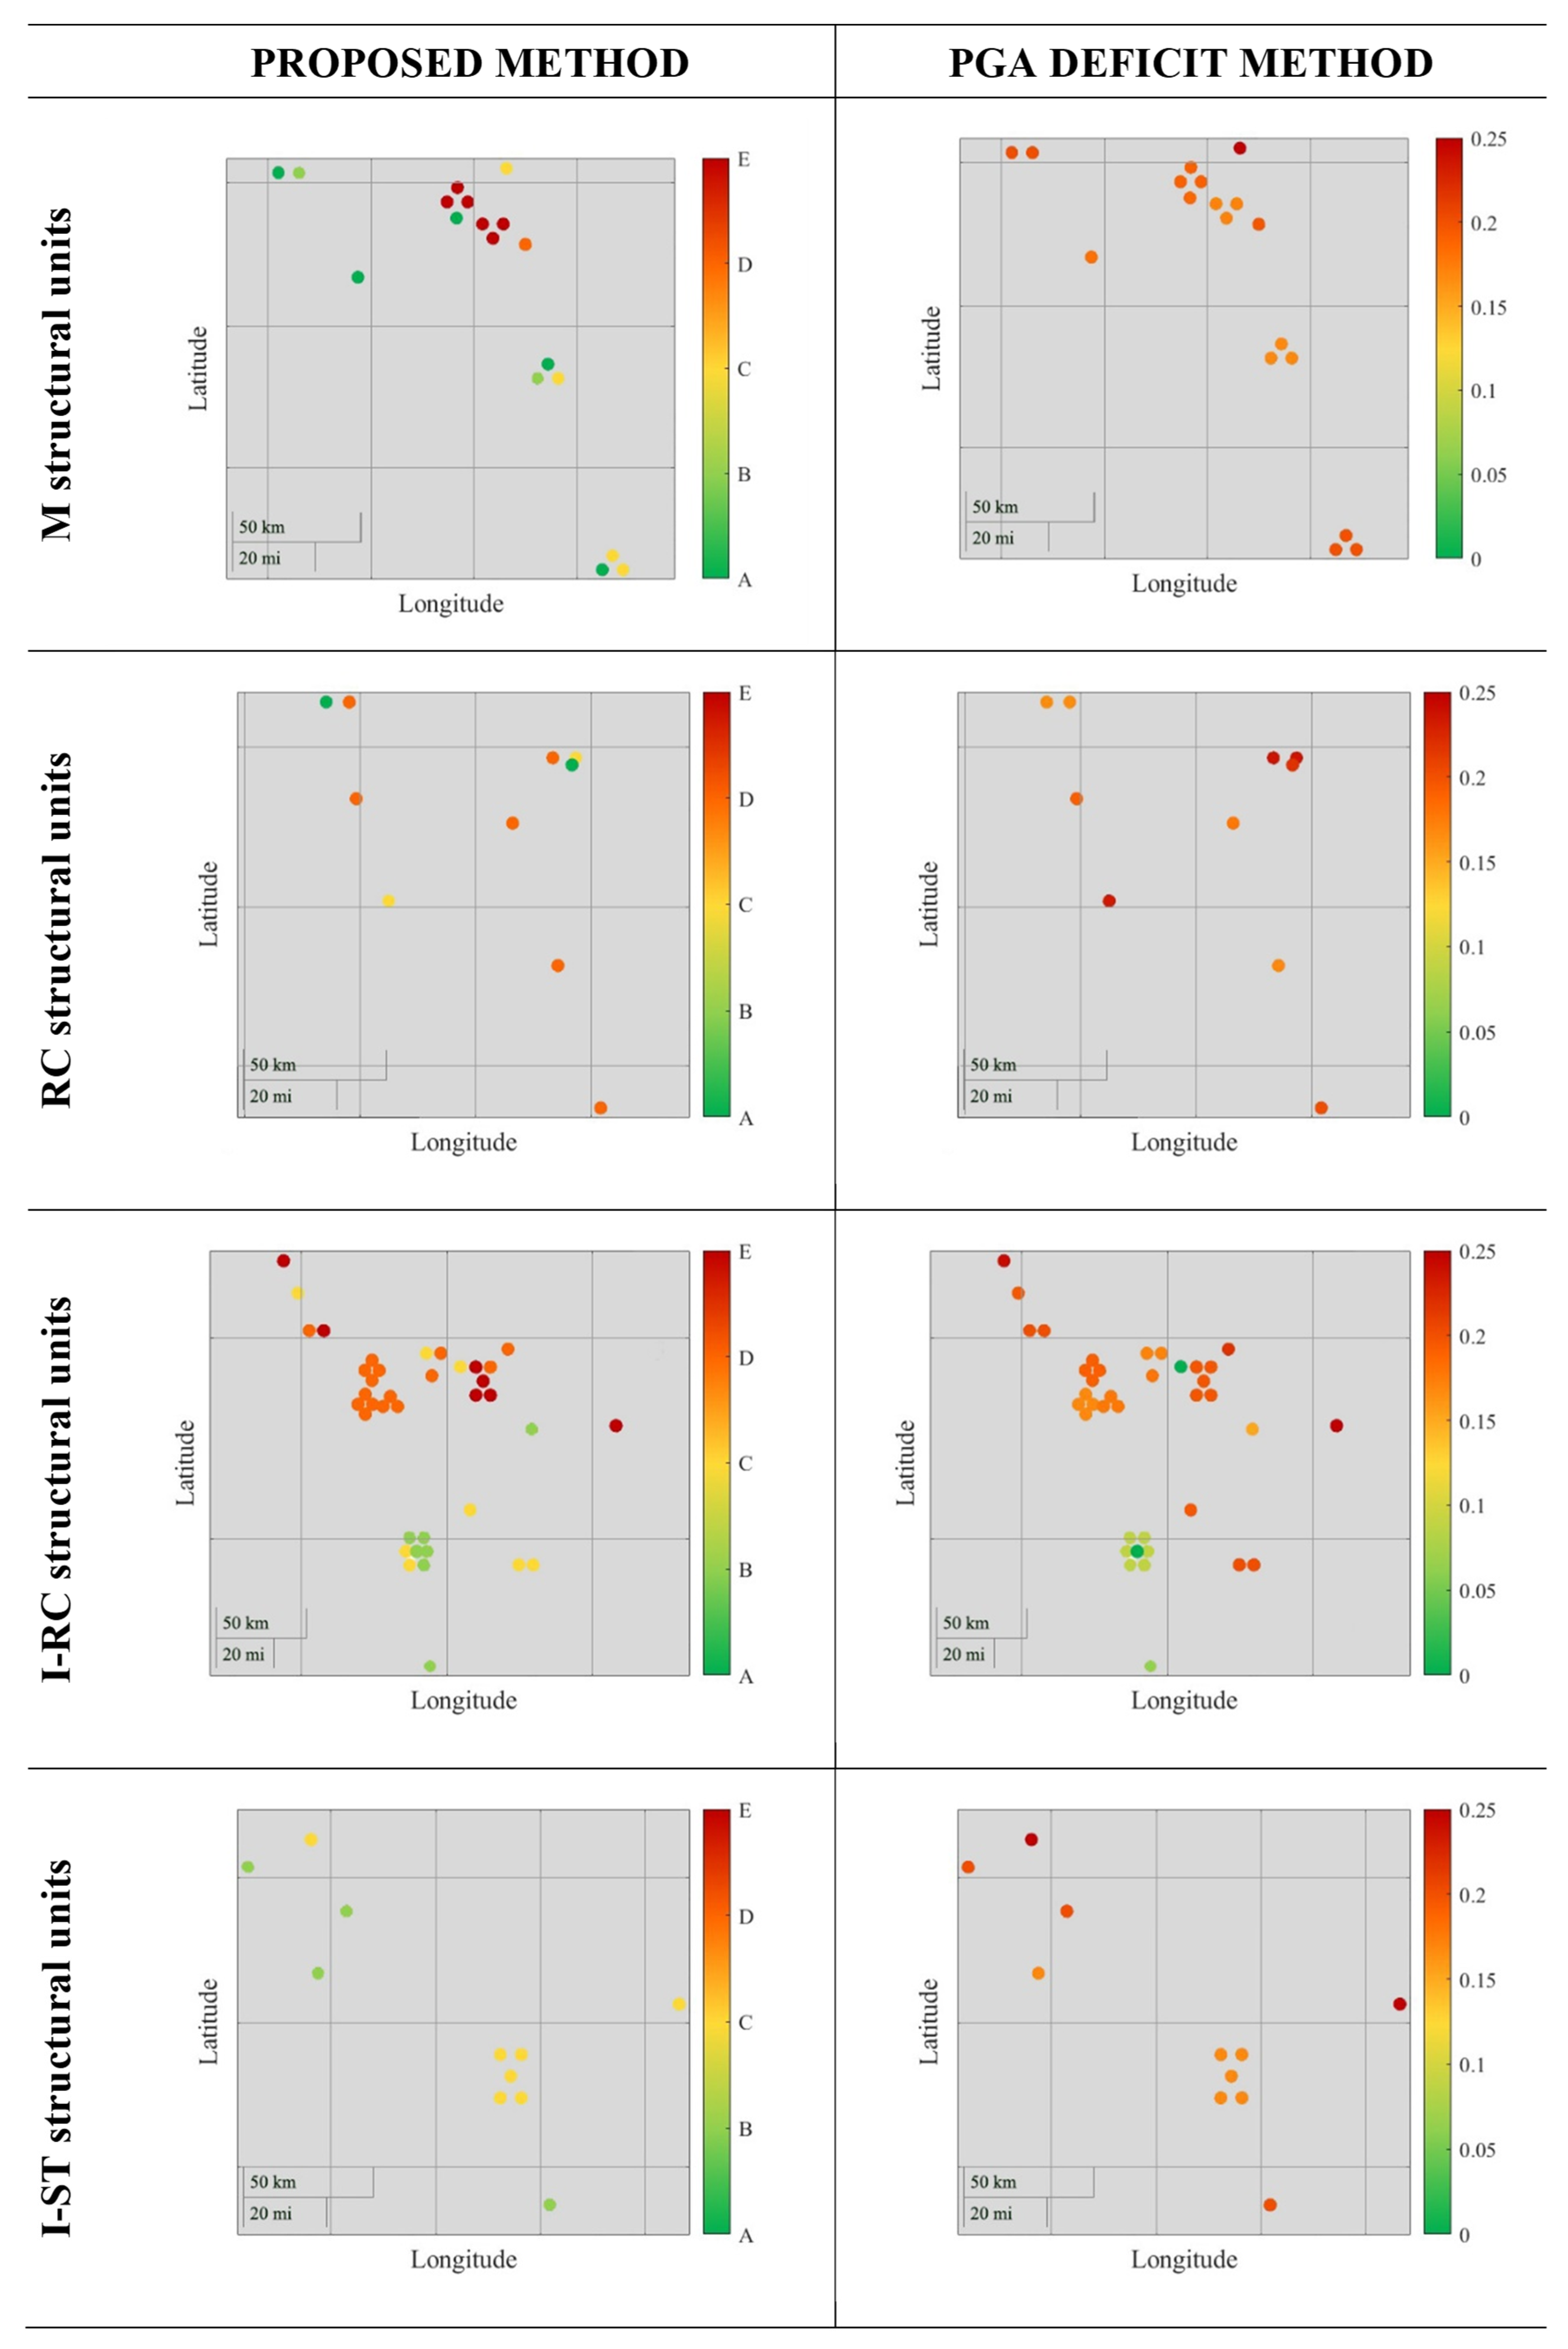
To assess the effectiveness of the proposed methodology,
Figure 16 compares the prioritisation results obtained in this study (on the left) with those derived from the application of the PGA deficit method to the same case study stock (on the right). The PGA deficit method, first proposed by Grant et al. (2007) [
34], assumes that the building’s seismic capacity is equal to the site-specific seismic demand prescribed by the regulations in force at the time of construction. The theoretical capacity deficit is then calculated (Equation (6)) as the difference between the aforementioned seismic demand and the site-specific seismic demand provided by the current seismic hazard model MPS04 [
66] and prescribed by DM 2018 [
59]. Based on this PGA deficit, a prioritisation ranking of the investigated buildings can then be defined.
Clearly, this method has the advantage of ease of use, as it does not require on-site building inspections or structural analyses, relying only on the minimal information of the year and site of construction. However, its results are less refined compared to those of the proposed methodology, and at times, also less reliable.
Since the results of both procedures are clearly influenced by the site of the structural units, they are represented using a georeferenced scatter plot on a territorial map. Specifically, each building is represented by a marker, the colour of which indicates the priority level, from A to E (in a discrete scale) for the proposed procedure, and from 0 to 0.25 g (in a continuous scale) for the comparison method. 0.25 g is the upper limit of the PGA deficit in this case study.
In general, the results of both procedures are comparable, especially in terms of prioritisation within specific subsets of building types. However, there are notable differences.
For the M, RC, and I-RC building types, the PGA deficit method yields less variation in results compared to the proposed methodology. By incorporating even a minimal level of structural knowledge, the latter enables a more refined seismic assessment of the investigated SUs, which can either elevate or downgrade their priority class relative to an assessment based solely on the knowledge of seismic demand.
Additionally, a clear difference emerges in the assessment of I-ST units, due to their lightweight nature, which results in lower inertial forces compared to other building types, given the same PGA. This aspect cannot be accounted for by the PGA deficit method, which therefore leads to much more conservative safety assessments.
Finally, although the PGA deficit method may be considered adequate or accepted for prioritisation studies of large, homogeneous building stocks, its limitations are too significant when assessing smaller and/or more heterogeneous stocks. In the latter case, the proposed methodology is undoubtedly a more suitable and reliable tool.
6. Conclusions
This study responds to the growing need for scalable and reliable tools to assess the seismic vulnerability of heterogeneous building stocks, particularly in contexts where detailed analyses for all structures are unfeasible due to limited time and resources. To this end, it presents a comprehensive methodology for the seismic assessment of heterogeneous building stocks, addressing a critical gap in existing evaluation frameworks. By integrating deficiency-based qualitative evaluations with simplified mechanical models, the proposed approach ensures a balanced and scalable assessment across various structural types, including masonry, R.C., precast R.C., and steel buildings.
The application of the methodology to an existing industrial-oriented building stock demonstrated its suitability for the assessment of heterogeneous stocks and allowed notable vulnerability factors in existing buildings to be identified. For instance, vulnerable non-structural elements and pounding susceptibility were observed across all the examined building types. Moreover, most I-RC buildings were at risk of loss of support, while ordinary R.C. structures mainly showed plan irregularity and captive columns. Contrary to expectations, the analysed stock did not show a significant reduction in the observed deficiencies when transitioning from purely gravity-based design to low-code seismic design. As a result, the design improvements in structural conceptualisation are not clearly evident, with deficiencies still widely observed in both gravity and low-code structures.
The combination of two assessment levels provides more robust priority estimates, as it allows for leveraging the advantages while mitigating the shortcomings inherent to both rapid assessment methods. For instance, the proposed first-level assessment, based on deficiency forms, accounts for vulnerability factors that influence seismic damage of buildings but are challenging to model, even in detailed numerical models compliant with regulatory standards (e.g., pounding effects, vulnerability of non-structural elements, masonry disaggregation, and insufficient connections in steel structures). Moreover, the combined assessment yields a sufficiently distributed classification of the stock within the prioritisation categories (A–E), thereby facilitating effective and feasible planning and budgeting of necessary interventions.
Once the implementation is complete, the handling of the outcome classification by the bodies in charge is facilitated by the dual level of assessment and by the methods adopted, which highlight vulnerability factors and collapse mechanisms specific to each building. Additionally, it allows rapid simulations of widespread interventions, which can guide the decision-making of stock managers.
As for all expeditious methodologies, the proposed approach is constrained by the limitations of simplified methods, which are also based on limited knowledge of the portfolio, typically excluding any destructive testing. Nonetheless, the multi-level methodology is precisely aimed at integrating qualitative and quantitative evaluations to overcome their intrinsic shortcomings. An additional limitation concerns the final priority rating which consists of a classification of buildings (from class A to E). While this enables harmonised decision-making across diverse building types, it prevents the generation of prioritisation lists based on a sorting ranking, as is possible when using the safety index α from the second-level analysis alone. This constraint is mitigated, however, by the improved accuracy and completeness of the combined assessment. Nonetheless, further investigations through refined numerical simulations could improve the calibration of the final priority list, especially for specific contexts with recurrent archetypes.
Lastly, the methodology assumes the availability of both original design documentation and in-situ survey data for each building under investigation. Although these surveys are rapid and non-invasive, their completeness may vary depending on the documentation quality and building accessibility, potentially affecting the consistency of the assessments within the portfolio.
Lastly, the application of the proposed methodology was compared to the first-level approach by Grant et al. (2007) [
34]. The comparison highlights the effect of refining the information compared to the purely desktop-based method. The latter, besides not accounting for the peculiarities of each stock building, is not adjustable to different construction technologies, which is essential for maintaining cross-type comparability of the results. The application performed showed that, within the proposed methodology, steel buildings are not critical due to their lightweight and consequent low seismic demand. However, they would be ranked higher solely based on PGA deficit, potentially outranking more vulnerable buildings (and thus being selected for the next assessment level).
Further work is required to explore the validity of the proposed method through a benchmark case study. This requires either the identification of heterogenous building stock hit by a seismic event (for empirical validation) or a large number of refined simulations through non-linear analyses (for numerical validation).
Ultimately, this study contributes to advancing seismic risk assessment methodologies by providing a practical and adaptable framework that equips policymakers with the tools needed to prioritize interventions, allocate resources effectively, and design resilience strategies tailored to diverse territorial contexts–paving the way for more informed and effective risk reduction efforts.


 ,
, 
