Article

The Validation and Discussion of a Comparative Method Based on Experiment to Determine the Effective Thickness of Composite Glass

1
State Key Laboratory for Green Building Materials, China Building Materials Academy, Beijing 100024, China
2
China Testing & Certification International Group Co., Ltd., Beijing 100024, China
*
Author to whom correspondence should be addressed.
Buildings 2025, 15(14), 2542; https://doi.org/10.3390/buildings15142542
Submission received: 12 June 2025 / Revised: 1 July 2025 / Accepted: 11 July 2025 / Published: 19 July 2025
(This article belongs to the Section Building Materials, and Repair & Renovation)

Abstract

This study introduces and validates a comparative experiment-based method for determining the effective thickness of composite glass, including polymeric laminated glass (with polyvinyl butyral (PVB) and SentryGlas® (SGP) interlayers) and vacuum glazing. This method employs comparative four-point bending tests, defining effective thickness by equating the bending stress of a composite specimen to that of a reference monolithic glass specimen under identical loading and boundary conditions. Specimens with varying configurations (glass thicknesses of 5 mm, 6 mm and 8 mm) were tested using non-destructive four-point bending tests under a multi-stage loading protocol (100 N–1000 N). Strain rosettes measured maximum strains at each loading stage to calculate bending stress. Analysis of the bending stress state revealed that vacuum glazing and SGP laminated glass exhibit superior load-bearing capacity compared to PVB laminated glass. The proposed method successfully determined the effective thickness for both laminated glass and vacuum glazing. Furthermore, results demonstrate that employing a 12 mm monolithic reference glass provides the highest accuracy for effective thickness determination. Theoretical bending stress calculations using the effective thickness derived from the 12 mm reference glass showed less than 10% deviation from experimental values. Conversely, compared to established standards and empirical formulas, the proposed method offers superior accuracy, particularly for vacuum glazing. Additionally, the mechanical properties of the viscoelastic interlayers (PVB and SGP) were investigated through static tensile tests and dynamic thermomechanical analysis (DMA). Distinct tensile behaviors and differing time-dependent shear transfer capacities between the two interlayer materials are found out. Key factors influencing the reliability of the method are also discussed and analyzed. This study provides a universally practical and applicable solution for accurate and effective thickness estimation in composite glass design.

1. Introduction

Laminated glass is manufactured in a sandwich structure to mitigate the risk of catastrophic failure. It is typically fabricated by bonding two or more glass plies with one or more polymeric interlayers. Several commercial polymeric interlayers are used for this purpose, including polyvinyl butyral (PVB), ethylene vinyl acetate (EVA) and SentryGlas® Plus Interlayer (SGP) [1,2]. Among these, PVB is the most prevalent material in laminated glass manufacturing. The properties of these polymeric interlayers exhibit substantial differences. Specifically, the stiffness of SGP could be approximately 100 times greater than PVB, and its strength could be roughly 5 times higher than that of PVB [3]. Regarding temperature resistance, the glass transition temperature Tg of SGP (~60 °C) is also much higher than that of PVB (~25 °C) [3]. As established by Norville [4], the mechanical response of laminated glass in bending varies between two boundary cases: (i) the monolithic limit, characterized by no relative slippage between glass plies; (ii) the layer limit, characterized by free slippage between glass plies. Furthermore, this mechanical response depends critically on the shear transfer capacity of the interlayer, which is influenced by multiple parameters, including interlayer thickness, load magnitude, load duration, temperature and adhesion properties. The effects of these dependencies have been investigated by numerous researchers, although modeling them is considerably complicated [5].
Conversely, vacuum glazing has been developed over decades for building applications, since first applied as a patent in 1913 [6]. The technology maintains a vacuum below 0.1 Pa between two contiguously sealed glass plies, eliminating the gaseous conduction and convection of gas to achieve superior thermal insulation [7]. To preserve vacuum integrity, a tight edge seal bonds the glass plies. The edge seal is normally made of glass. To prevent deformation of glass plies caused by pressure, a grid of small pillars is used to support in the interstitial space [8]. In practical applications, the vacuum glazing obtains comparable thermal properties, but reduced weight compared to conventional triple-glazing insulation glass constructions [9]. Regarding mechanical response, when external loads are applied, the loads can be transferred from one glass ply to another through the small pillars, maintaining consistent deformation across both plies. Consequently, the vacuum glazing can be frequently modeled as monolithic glass to simplify analytical procedures [10].
Currently, the “effective thickness” concept provides a simplified modeling approach for composite glass. The method is explained as, under identical boundary and load conditions, the maximum stress or maximum deflection of composite glass is equal to that of a monolithic glass with a certain thickness, and the nominal thickness of this monolithic glass is defined as the effective thickness of the composite glass [11]. For laminated glass, multiple formulations for determining effective thickness have been proposed by several studies and national standards. The original concept of this method for sandwich beams was developed by Wölfel, then subsequently adapted for laminated glass [2,12]. The Preliminary European Norm proposes a design approach to determine the effective thickness of laminated glass, based on considerations of polymeric interlayers, but this method could not be applicable to vacuum glazing [13]. The design of the effective thickness of vacuum glazing can be very different from that of laminated glass due to the structural distinctions. Some researchers believe that there is no theoretical formulation for vacuum glazing to determine the effective thickness; therefore, they suggest determining the effective thickness by an empirical formula through extensive experiments [10,14]. Consequently, no universally applicable method can currently be used for determining the effective thickness across all composite glass types, and there is no appropriate method to determine the effective thickness of vacuum glazing. It is necessary to develop a methodology applicable to diverse composite glass structures while ensuring precise, effective thickness determination.
This work presents a comparative experiments methodology for determining the effective thickness of composite glass. Especially, PVB laminated glass, SGP laminated glass and vacuum glazing are used as examples to validate the broad applicability of this method. Firstly, the effective thickness and stress state of these specimens are determined and analyzed. The reliability of this method is confirmed by comparing the experimental bending stress with the theoretical bending stress derived from the effective thickness. The tensile behavior and time-dependent properties of the viscoelastic interlayer are studied. The effects of the properties of the interlayer on the proposed method are also discussed. Eventually, some critical factors that affect the accuracy of this method are pointed out and discussed.

2. Methodology

2.1. Glass Materials

All glass specimens in this study used tempered glass. Two types of interlayers of laminated glass with glass thicknesses of 5 mm, 6 mm and 8 mm were prepared (1.52 mm PVB and SGP). Vacuum glazing specimens were prepared with glass thicknesses of 5 mm, 6 mm and 8 mm. For comparative testing, 2 types of reference monolithic glass with thicknesses of 8 mm and 12 mm were also prepared. All specimens were machined to 1100 mm × 360 mm nominal dimensions. Detailed structural configurations and thickness parameters are presented in Table 1.

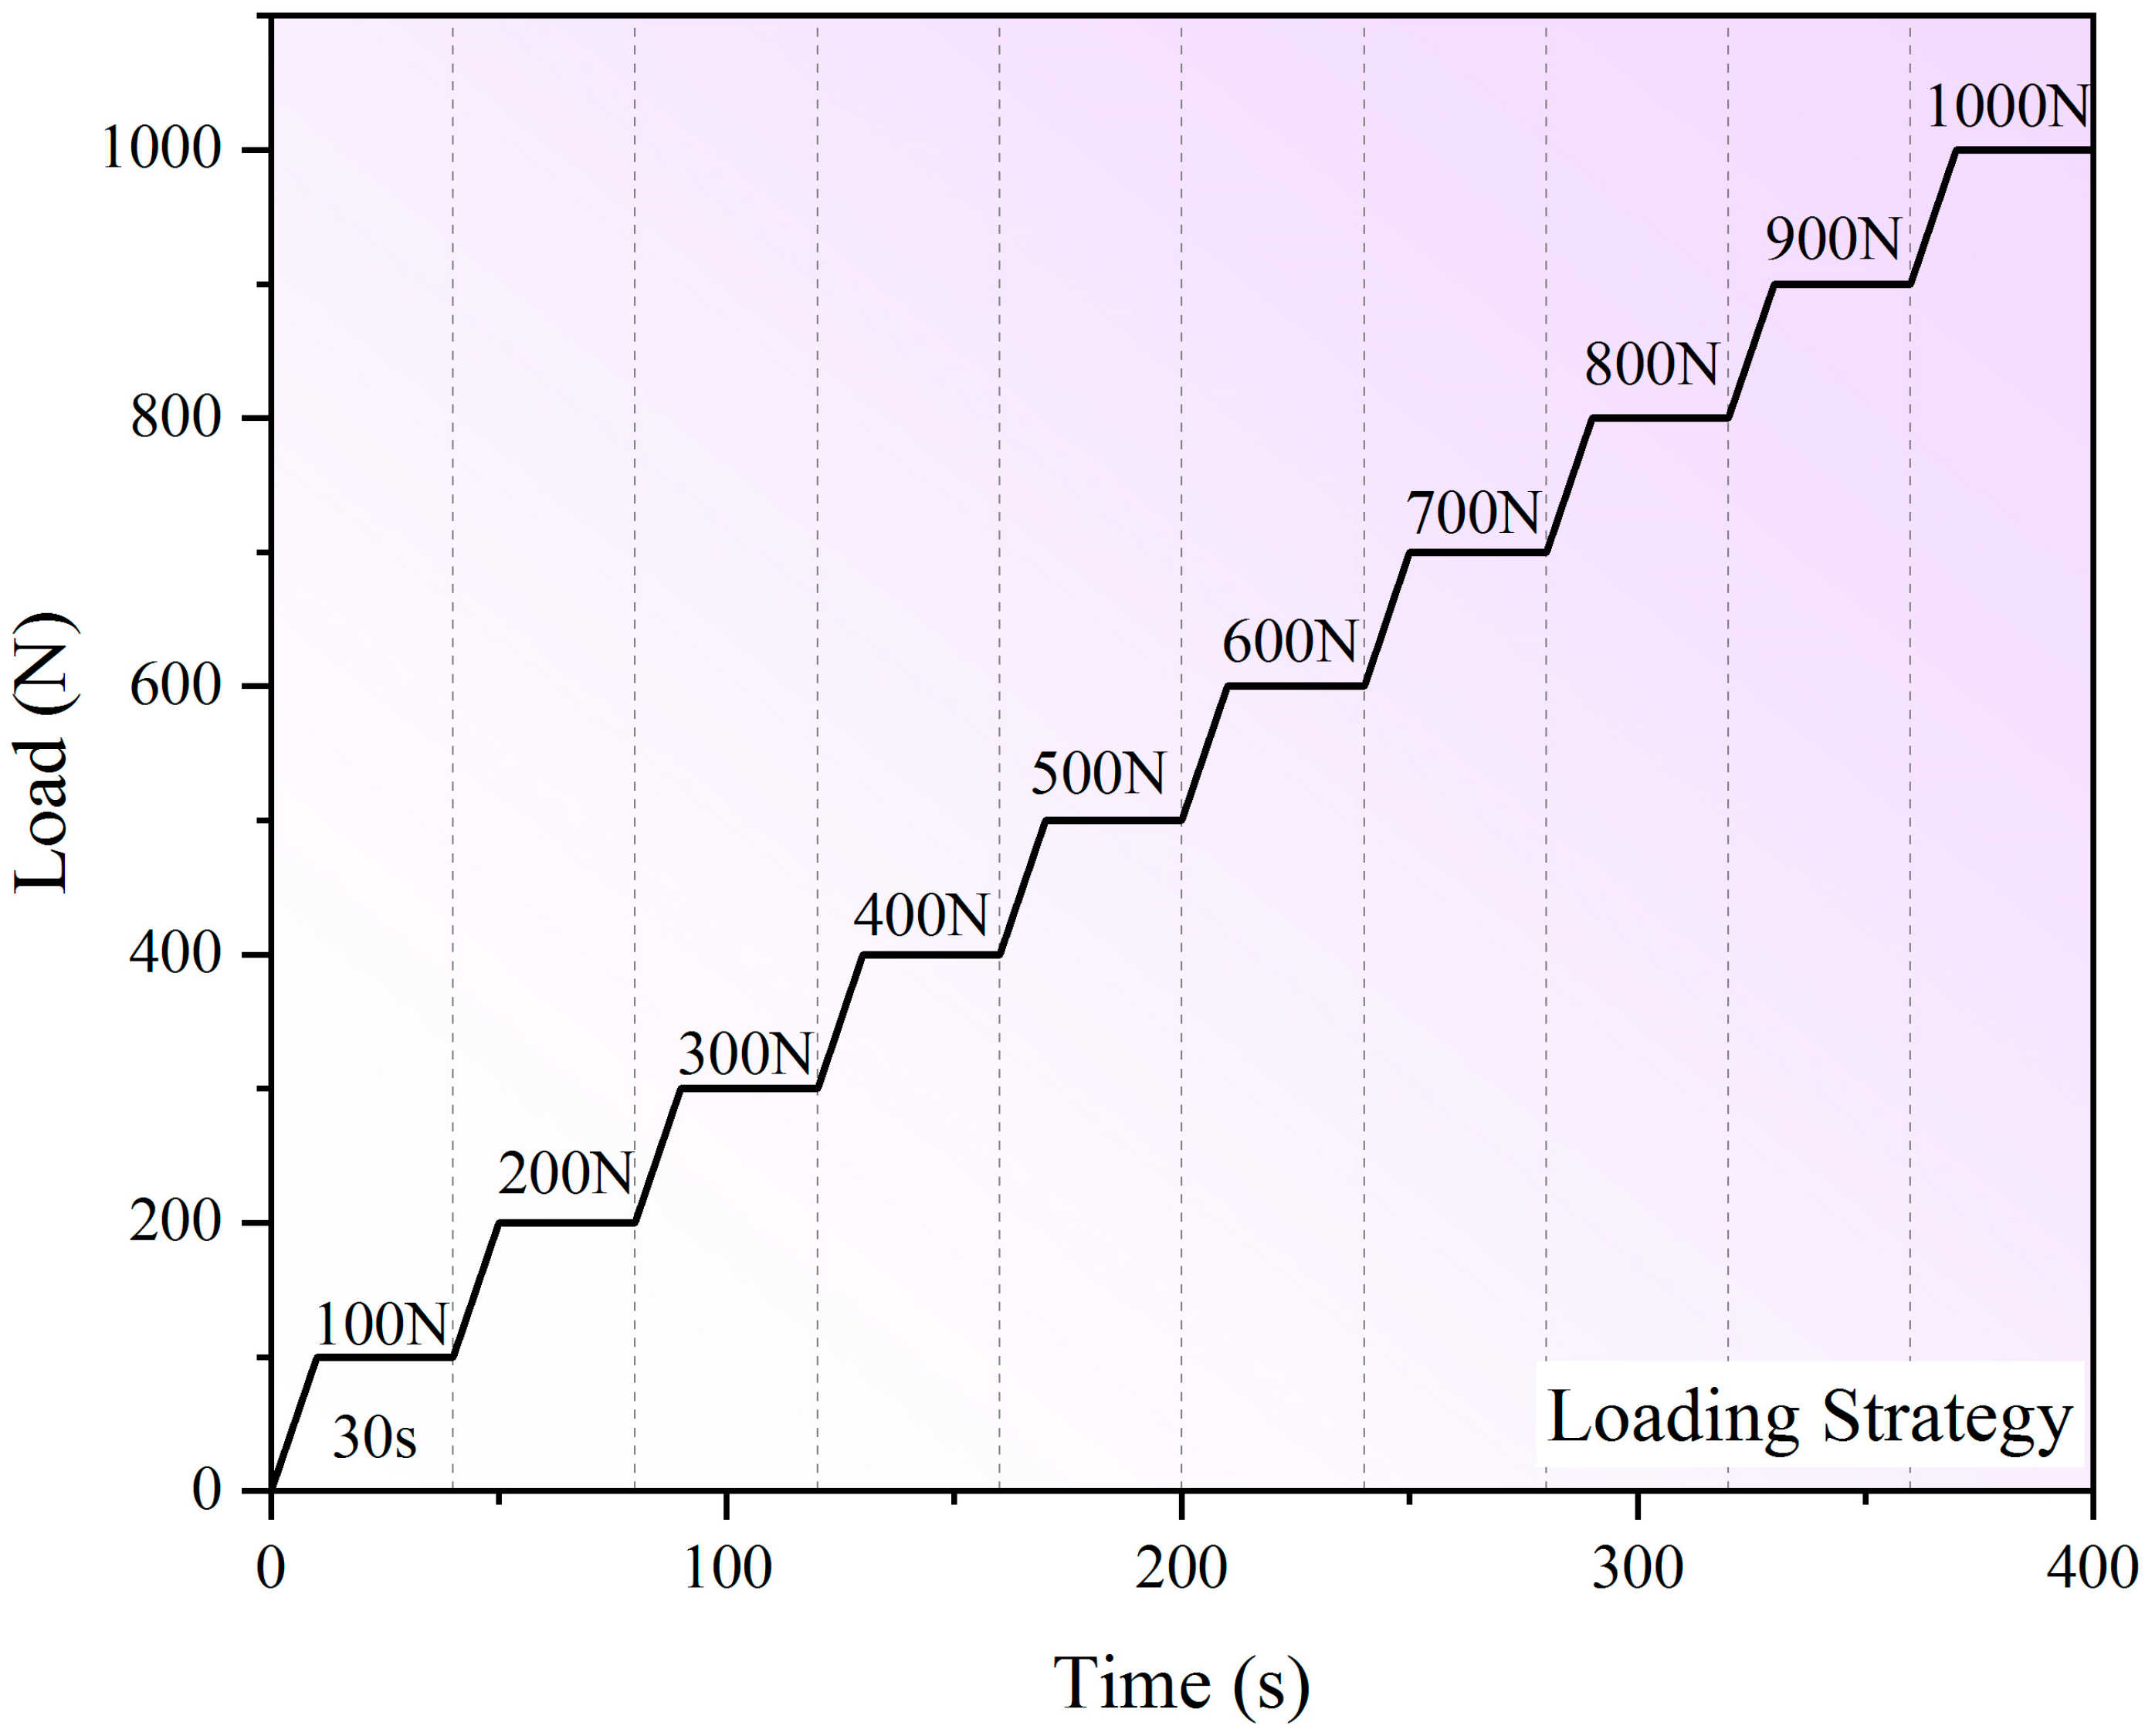
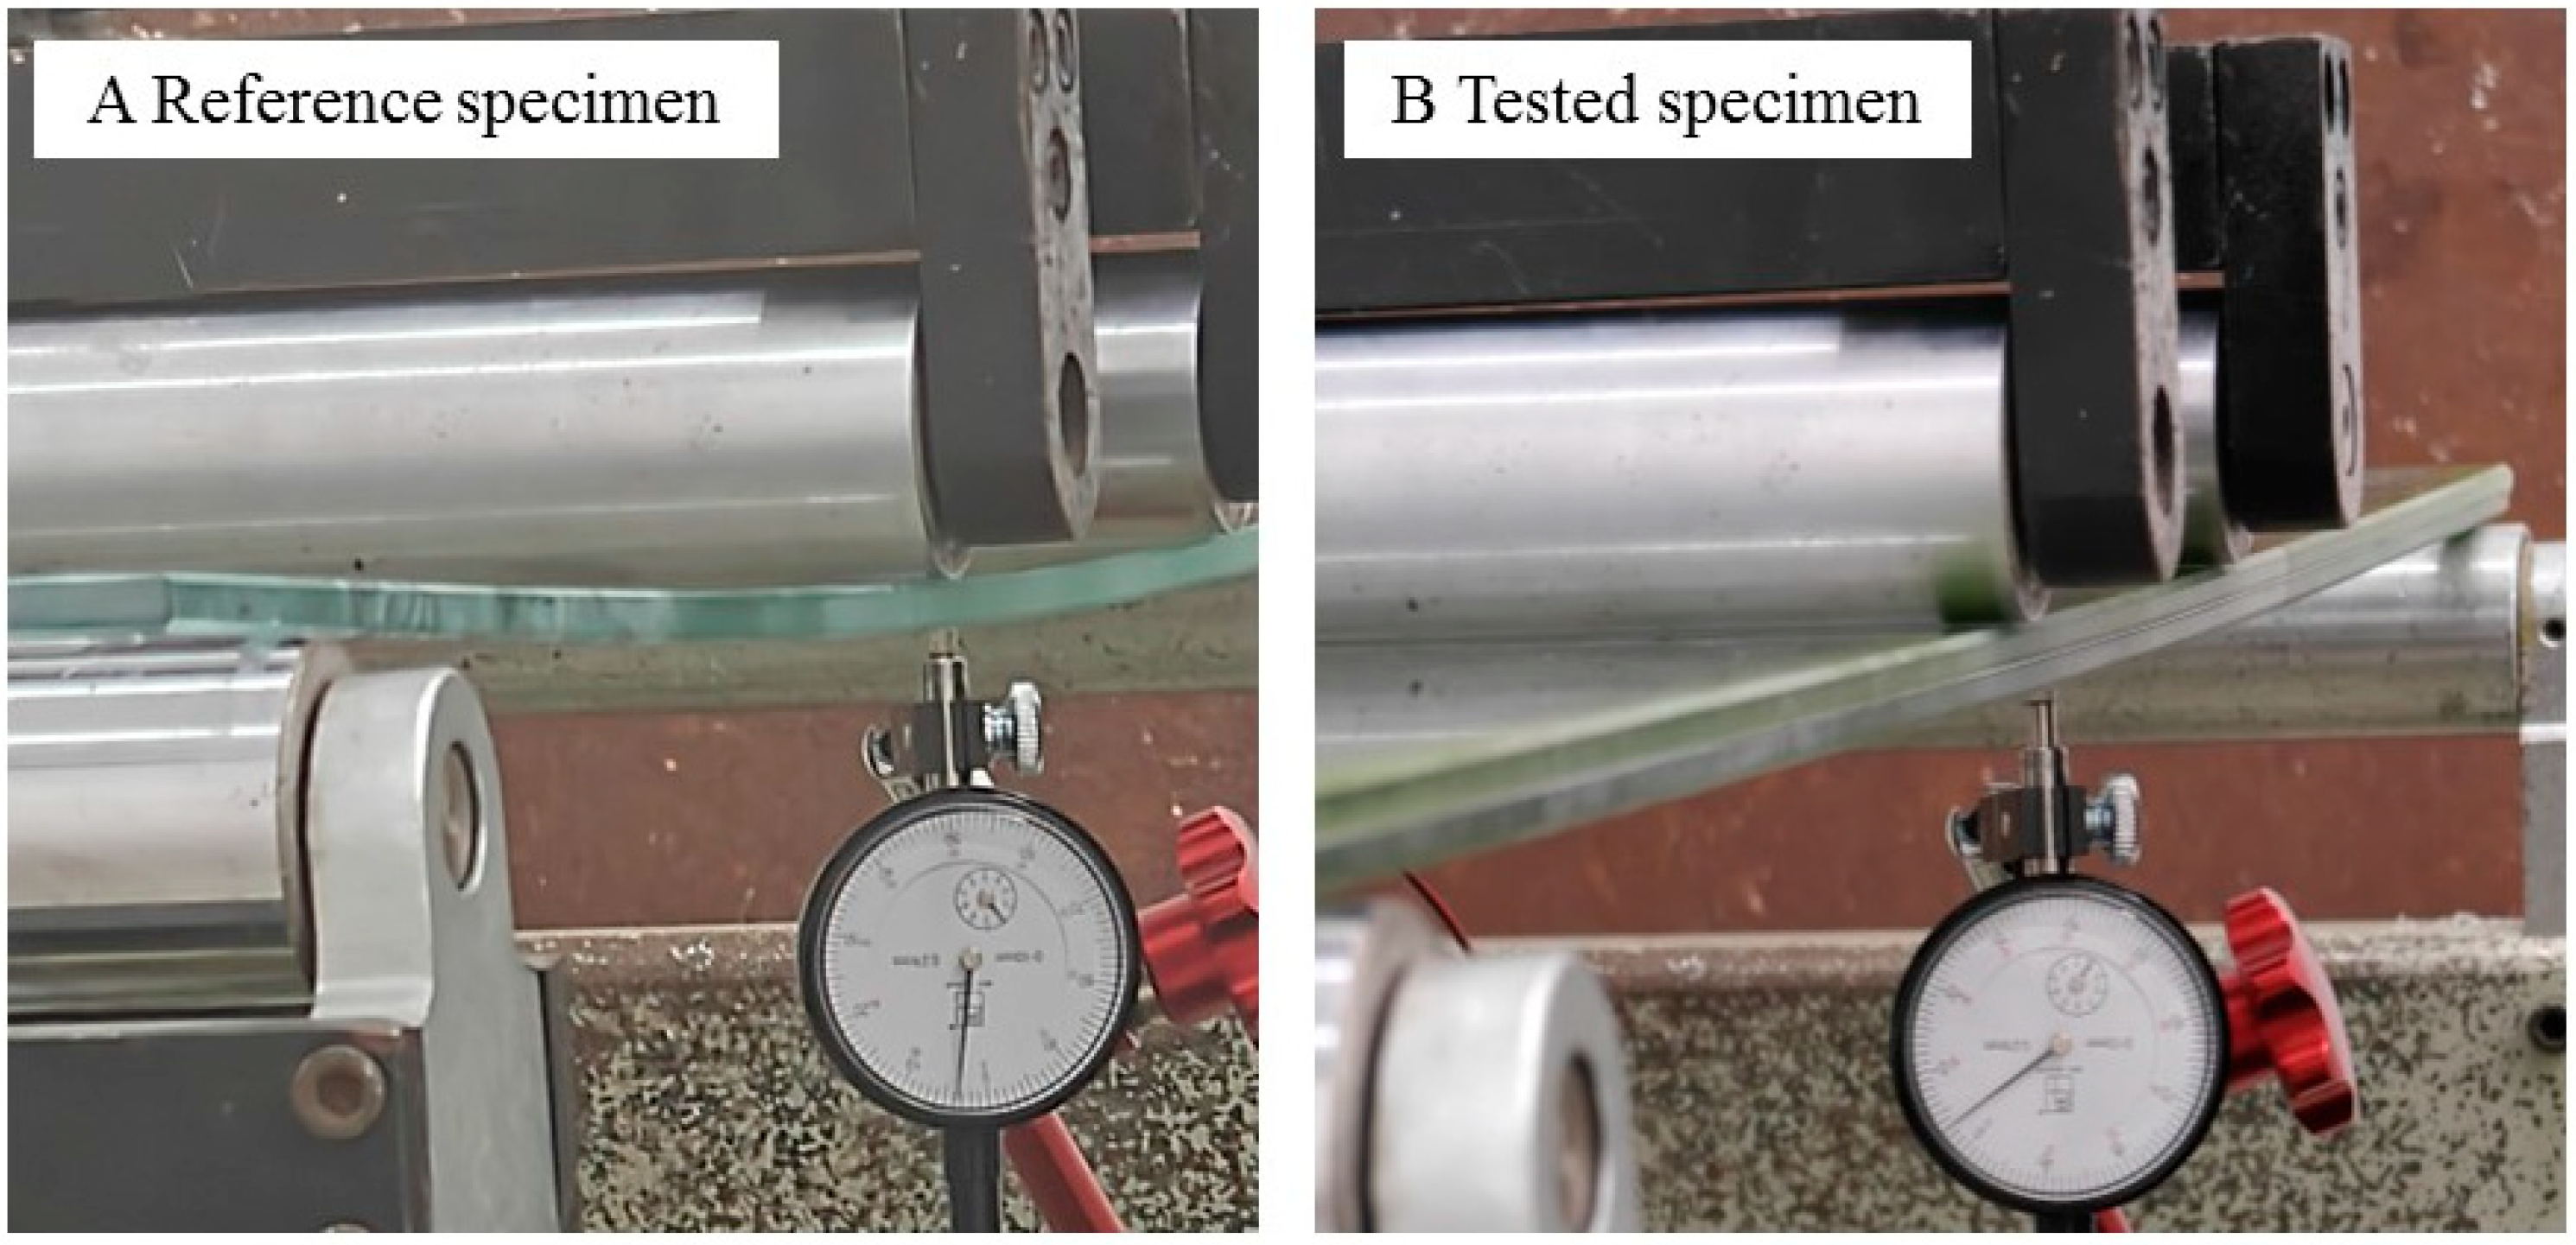
2.2. Four-Point Bending Test

The method for determining effective thickness was carried out by the four-point bending test. The four-point bending test was performed using a universal test machine (CMT-5204, SUST, China). The supporting and loading spans were set at 1000 mm and 200 mm, respectively. Specimens were loaded at a loading speed of 10 N/s. The four-point bending test was non-destructive, and the loading protocol terminated when reaching 1000 N maximum load (well below fracture thresholds). The loading protocol was carried out by multi-stage loading sequences. The loading sequence was from 100 N to 1000 N with incremental 100 N steps, and each loading step was maintained constant for 30 s. The loading protocol is shown in Figure 1. This loading strategy could ensure linear elastic response while easing viscoelastic effects, thereby enhancing measurement accuracy.

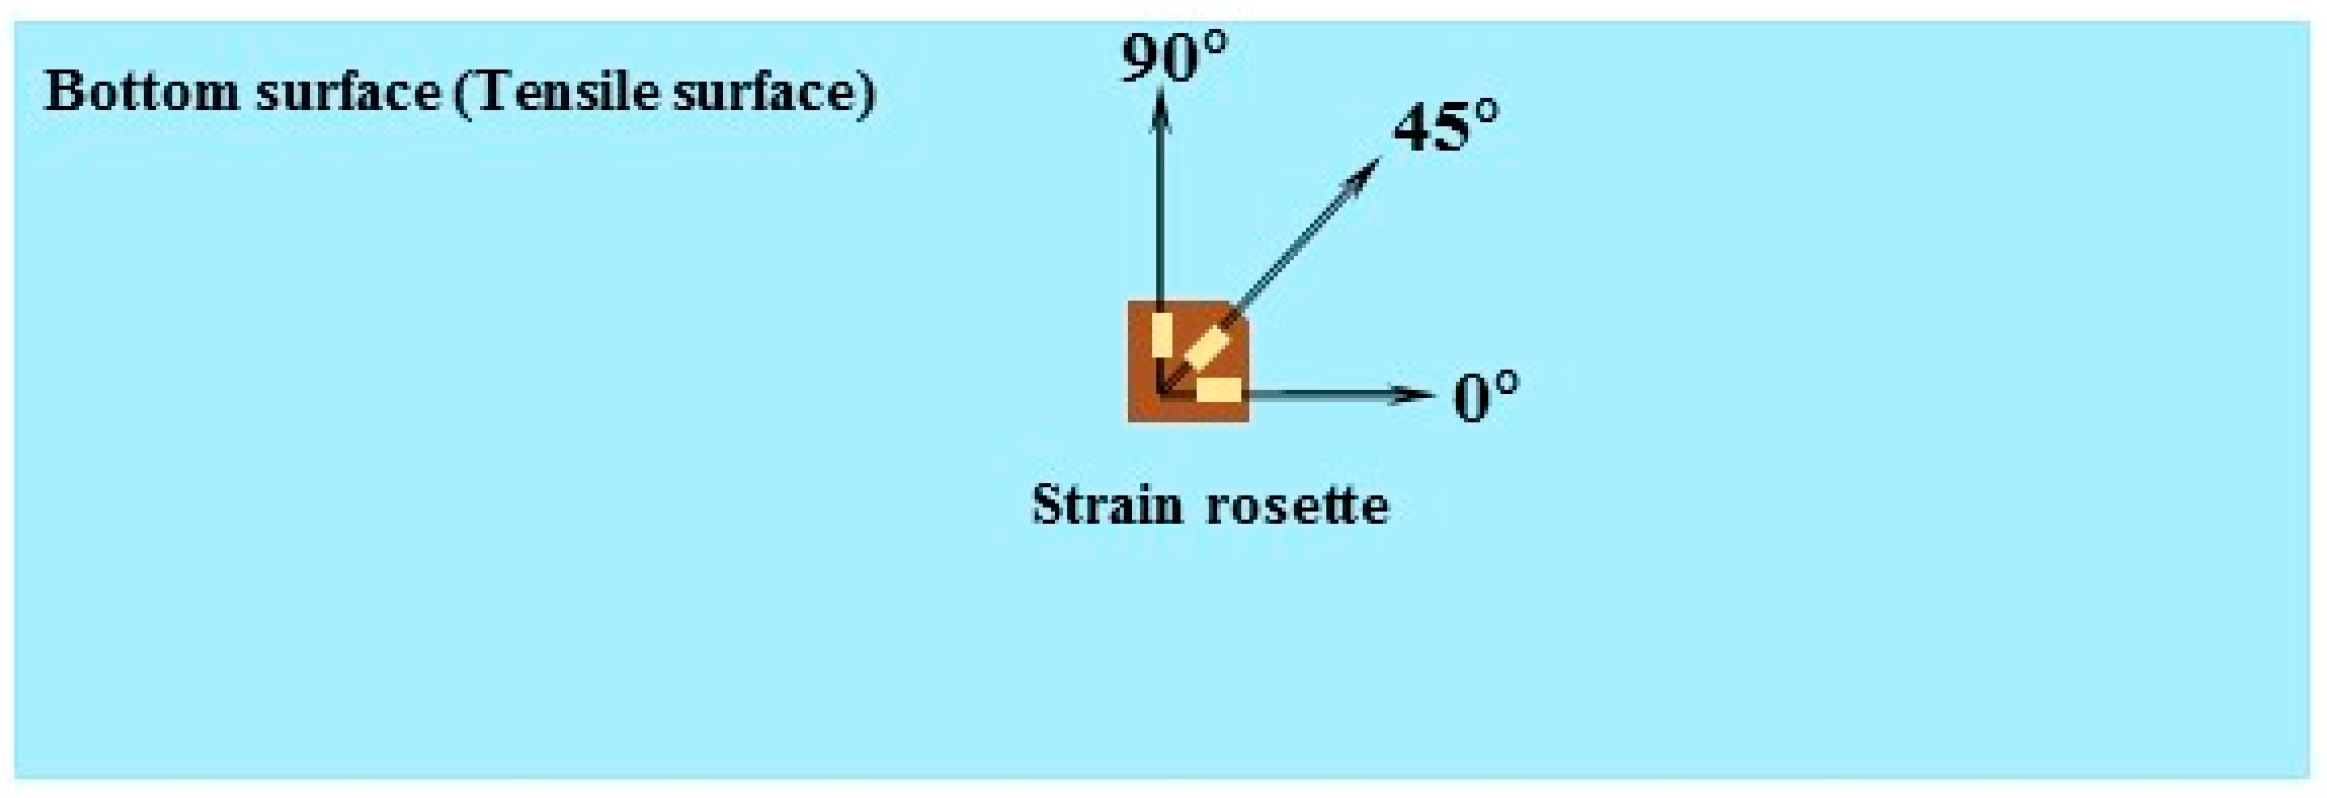
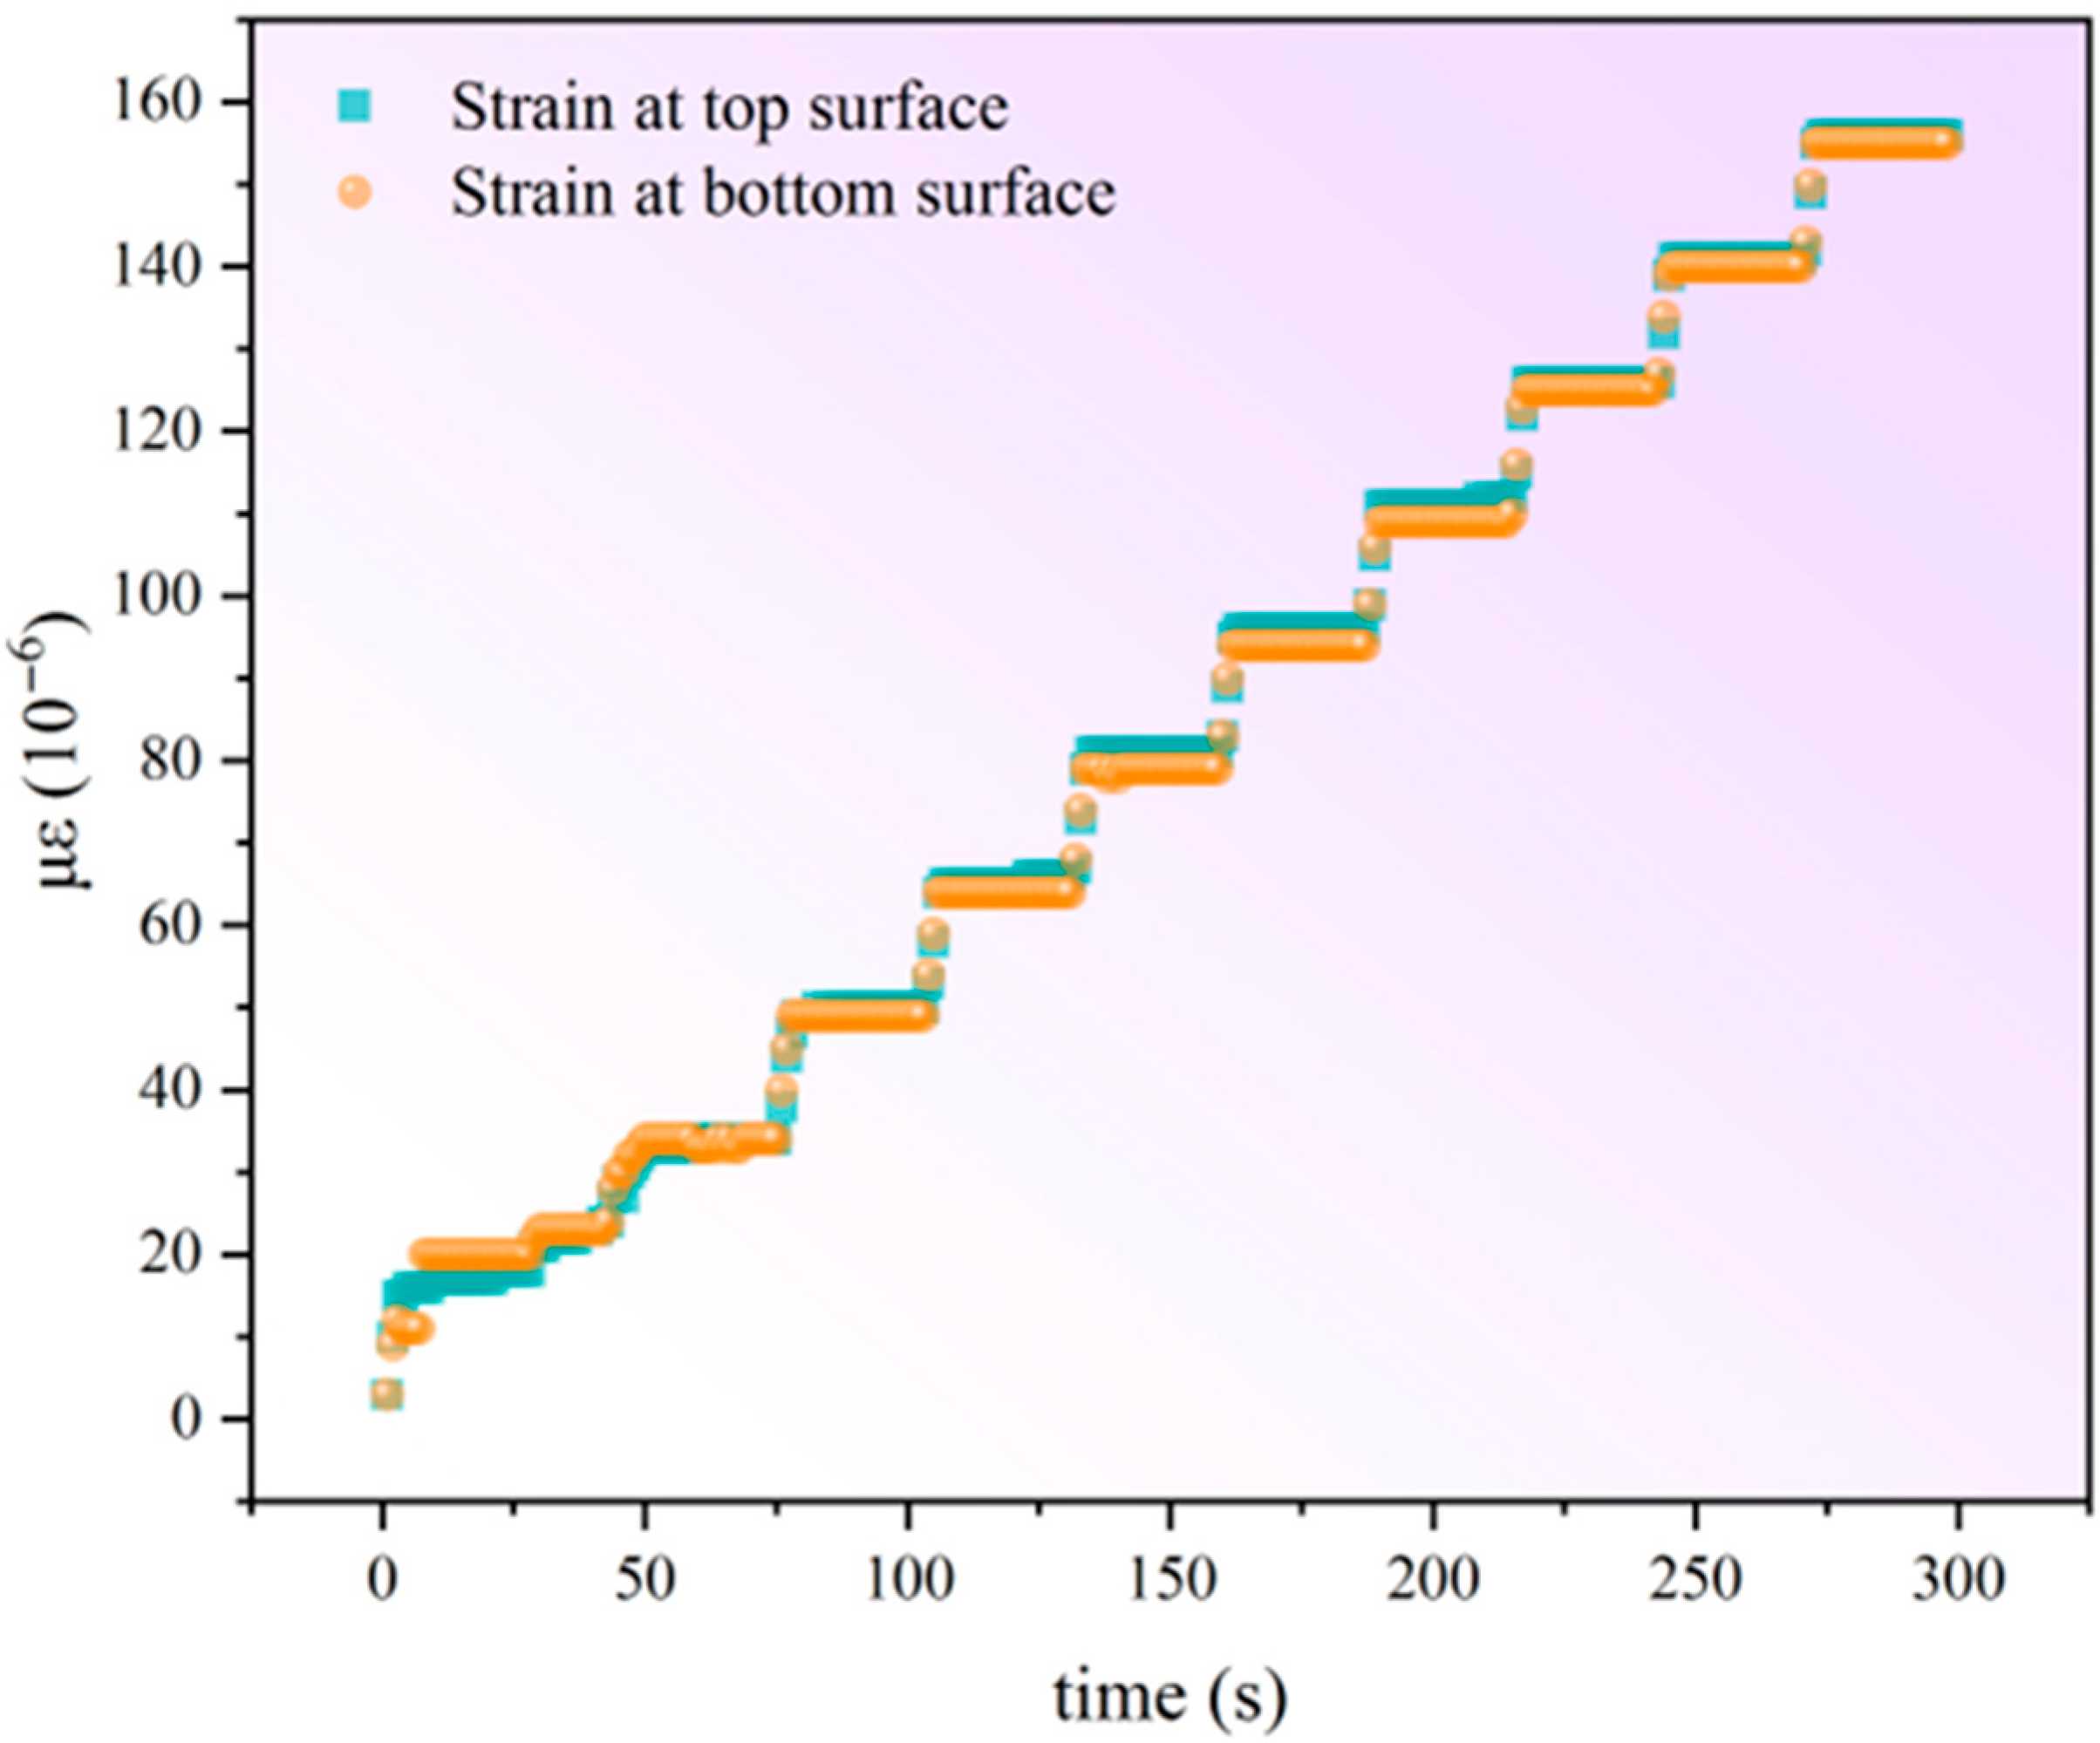
2.3. Strain Measurements

Strain rosettes with three measuring grids arranged at directions of 0°/45°/90° were used to collect the strain values at each loading step. The strain rosettes were installed at the bottom surface (tensile surface) of the bottom glass ply of the composite glass to capture the maximum bending strain. The schematic diagram of the stain rosettes installation is illustrated in Figure 2. A static strain acquisition system (JM3812, JingMing Technology, Guangzhou, China) was used to connect with strain rosettes, recording the measurements. To verify that the mechanical response is predominantly bending, a complementary strain gauge was also installed on the top surface (compressive surface) of the glass. The photo of the actual specimen installed with two strain gauges is shown in Figure 3. Strain symmetry was confirmed through equal-magnitude opposite-sign readings from opposing surfaces, shown in Figure 4, validating the bending response. Alternatively, if there is only one strain gauge, the specimens can be tested twice under identical conditions, swapping the upper and lower surfaces to collect the strain signals from both sides and comparing the values to ensure bending response.

2.4. The Method for Determining the Effective Thickness of Composite Glass

As established, there are various formula expressions for determining the effective thickness of composite glass, and their applicability to complex configurations of composite glass remains limited. To resolve these constraints, this study investigates a method based on a comparative experiment. Firstly, a reference monolithic glass with a certain thickness and a composite glass with the same length and width but different thickness were subjected to identical four-point bending conditions, maintaining identical support and loading spans, loading protocol and boundary constraints. Consequently, the bending stress of the monolithic and composite glass can be determined by the following equations:
σ 1 = K t 1 2
σ 2 = K t e q 2
where σ1 is the bending stress of monolithic glass. σ2 is the bending stress of the composite glass. t1 is the thickness of monolithic glass. teq is the effective thickness of the composite glass. K is a constant associated with dimensions (length and width), loading and support conditions. As the constant K remains identical for the monolithic glass and composite glass, Equations (1) and (2) can be rearranged, expressing the teq shown in Equation (4).
σ 1 σ 2 = K t 1 2 / K t e q 2
t e q = t 1 σ 1 σ 2
As the four-point bending was performed by a multi-loading step protocol, the bending stress in each loading step can be calculated by the strain values recorded from strain rosettes at the corresponding loading step. The equation for determining bending stress is shown in Equation (5) [15].
σ = E 2 · ε 0 ε 90 1 μ + 1 1 + μ · ( ε 0 ε 90 ) 2 + ( 2 ε 45 ε 0 ε 90 ) 2
where ε0 is the strain at 0°, ε45 is the strain at 45°. ε90 is the strain at 90°. E is the elastic modulus of glass (~72 GPa). μ is the Poisson’s ratio of glass (~0.24) [16]. Using the bending stress in each loading step plotted the diagram of stress against load. Within the linear elastic range, identical load magnitudes were matched between monolithic and composite specimens. Corresponding stress equivalence thus enabled the determination of the composite glass effective thickness. The close-up of the reference and tested specimens as prepared for the four-point bending test is shown in Figure 5. The documented photos of reference and tested specimens with obvious deflection are shown in Figure 6.

2.5. Mechanical Properties of Polymeric Interlayers

It is known that the load duration could strongly affect the mechanical properties of the polymeric interlayer, particularly shear modulus [17]. In this study, the loading protocol of the method for determining effective thickness requires holding the load at each step for 30 s. In order to investigate the effects of load holding time, the mechanical properties of SGP and PVB interlayer are studied.
The specimens were cut to a dumbbell shape with a gauge length of 20 mm; the close-up of specimens and the documented photo during the tensile test are shown in Figure 7. The tensile characterizations of SGP and PVB were carried out by a small load universal test machine (Model C45, MTS, USA). The tensile test was performed with a loading speed of 50 mm/min. Additionally, the evolution of shear modulus of PVB and SGP under prolonged loading was also investigated by time–temperature superposition principle (TTSP), and the experiment was carried out via Dynamic Thermomechanical Analyzer (DMA1, METTLER TOLEDO, Switzerland). Temperatures of 30 °C, 40 °C and 50 °C were selected as testing temperatures, and the range of isothermal frequency sweeps at each temperature was from 0.01 Hz to 100 Hz to establish the master curve.

3. Results

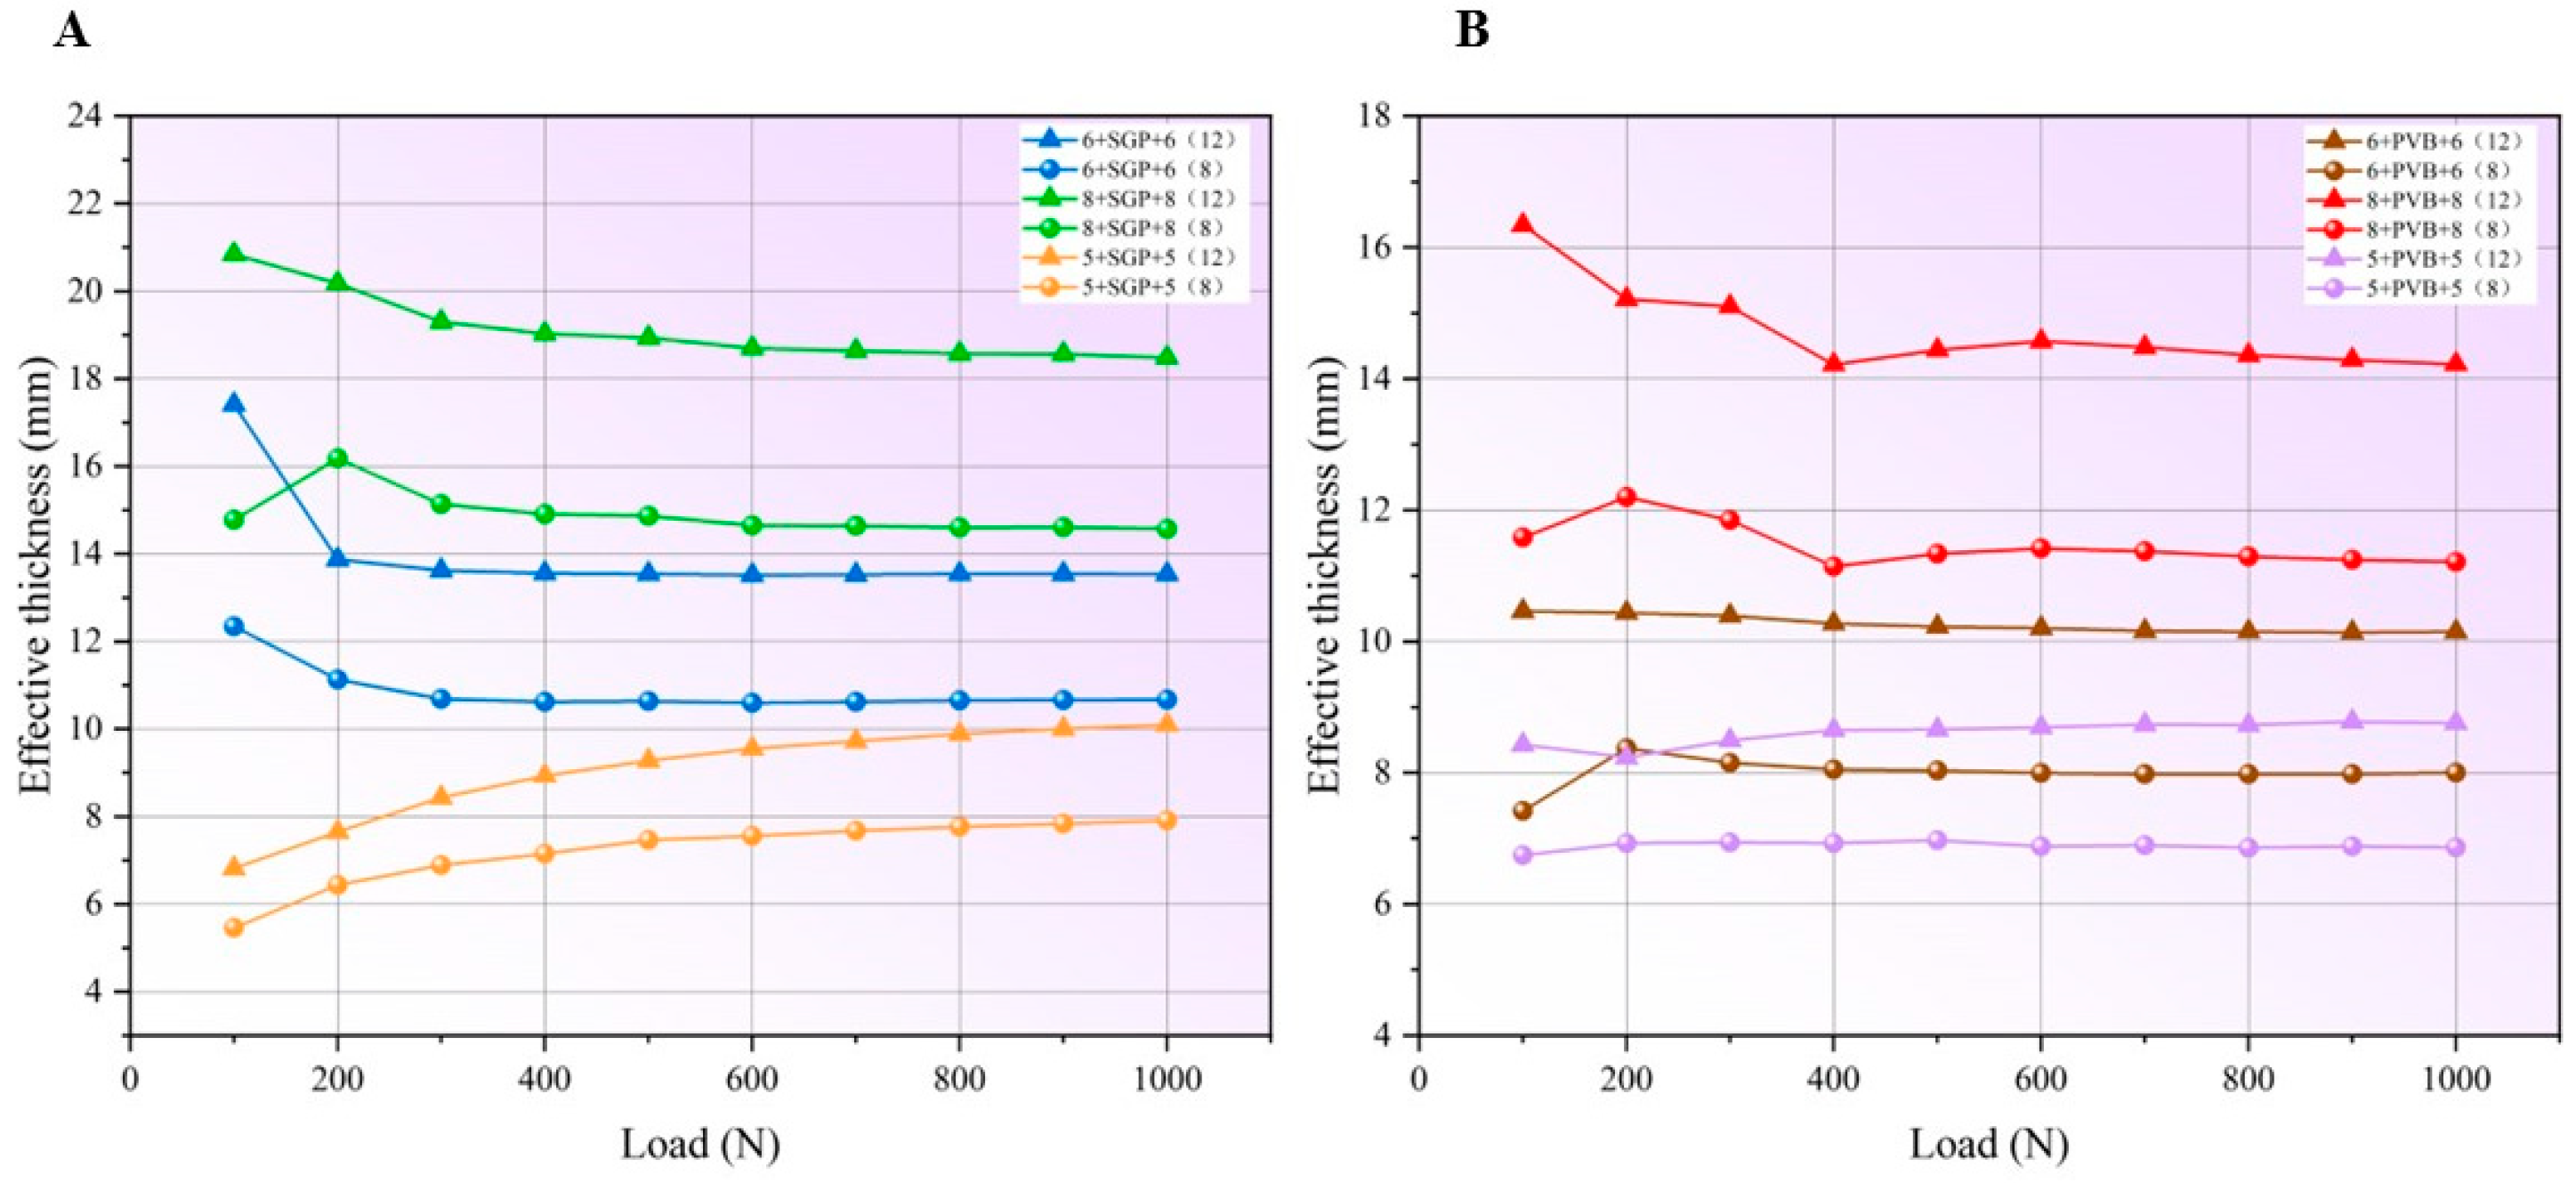
3.1. The Effective Thickness and Stress State of PVB and SGP Laminated Glass

The bending stress of laminated glass was determined from strain measurements, and correspondingly, the effective thickness was calculated. These results are presented in Figure 8 and Figure 9 and Table 2. As shown in Figure 8, bending stress decreases substantially with increasing glass thickness for both PVB and SGP laminated glass. Laminated glass with a glass thickness of 5 mm exhibited the highest bending stress. Specimens with 5 mm and 6 mm glass thickness demonstrated nearly double the bending stress of 8 mm ones. Furthermore, SGP laminated glass consistently showed significantly lower bending stress than PVB laminated glass under identical conditions.
The effective thickness of laminated glass using different reference glasses at each loading step is presented in Figure 9. When different thicknesses of reference glass were employed to determine the effective thickness of identical laminated glass specimens, significant deviations in results were observed. Furthermore, Figure 9 demonstrates that the effective thickness derived from data obtained during the initial loading process was considerably different from those calculated using data from the later loading.
The effective thickness of laminated glass using the proposed method above was systematically compared with results obtained from the Preliminary European Norm (prEN 16612). As a widely adopted standard for determining the effective thickness of laminated glass in building applications, the methodology’s validity has been extensively confirmed through multiple studies [18,19]. The effective thickness from prEN can be mathematically expressed through the following equations [13]:
h e , d f = 2 h 3 + 12 τ I s 3
I s = h ( h + h v ) 2 2
h s = h + h v
τ = 1 1 + 9.6 h v E I s G h s 2 b 2
h e q = h e , d f 3 h + 2 τ h s
where hv and h are the thicknesses of the glass and interlayer. he,df, Is and hs are the parameters related to the thickness of glass and interlayer. τ is the shear transfer coefficient of interlayer materials. G is the shear modulus of interlayer materials. The effective thickness determined by prEN is shown in Table 2.

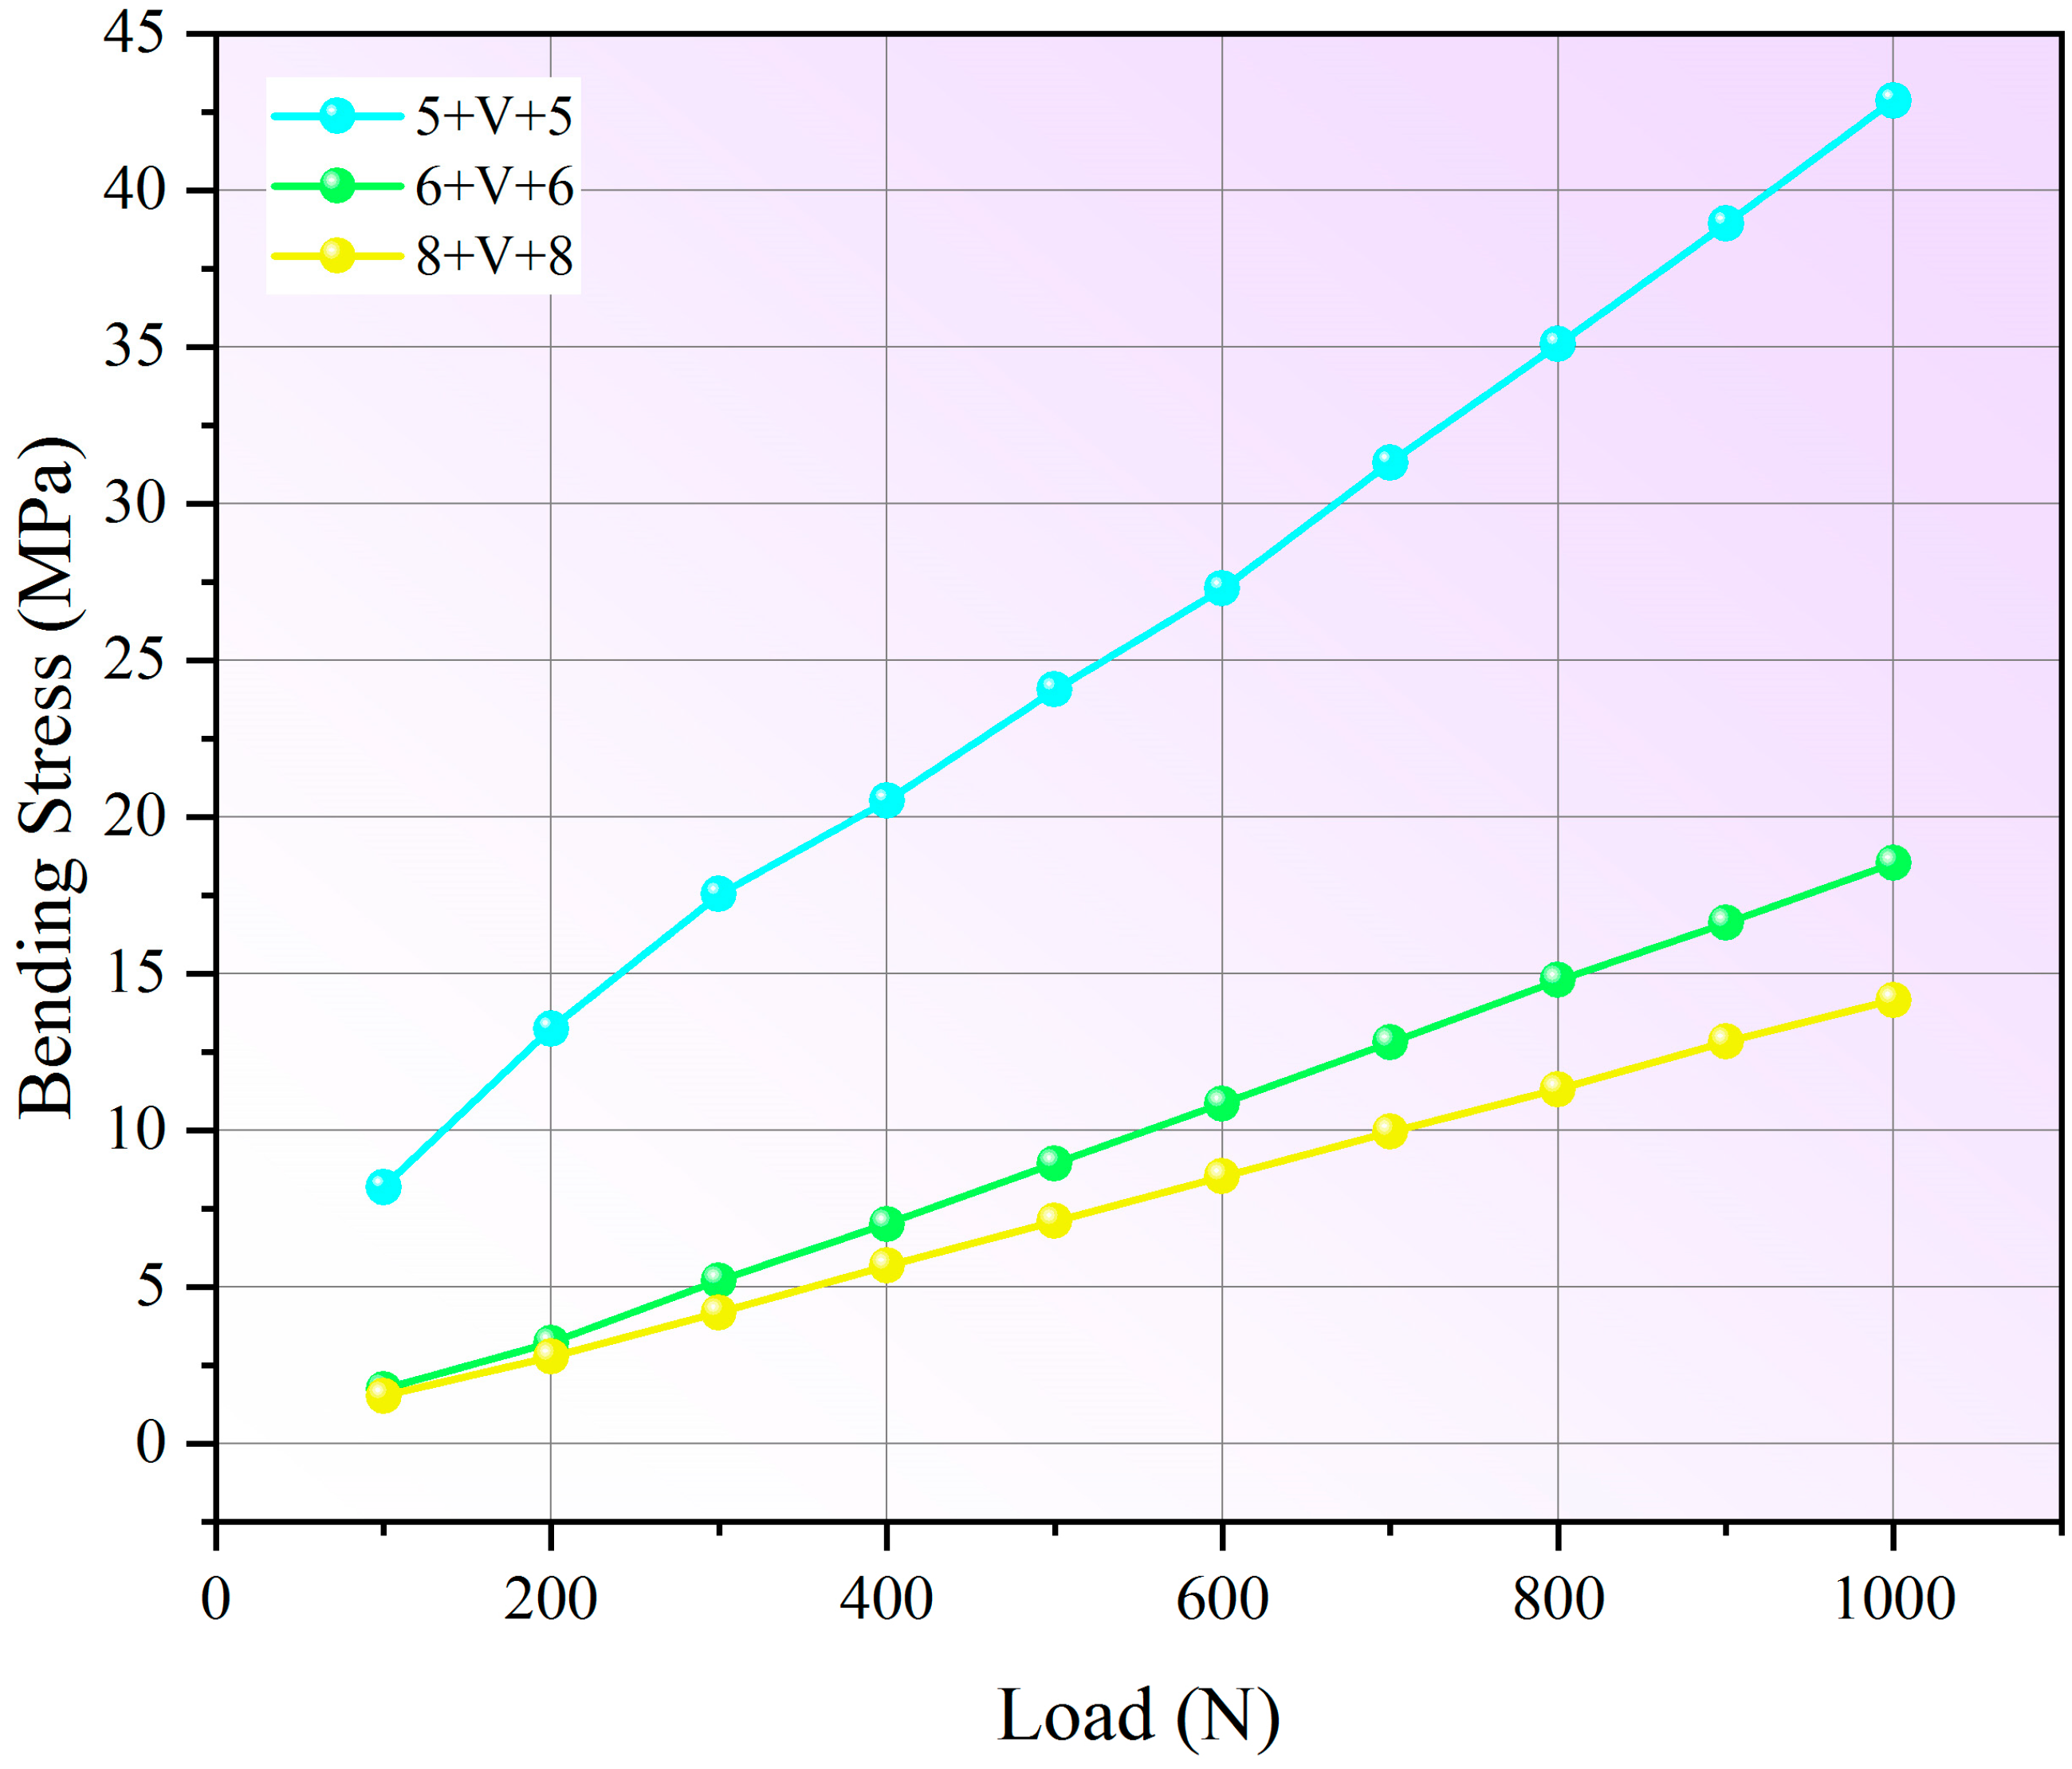
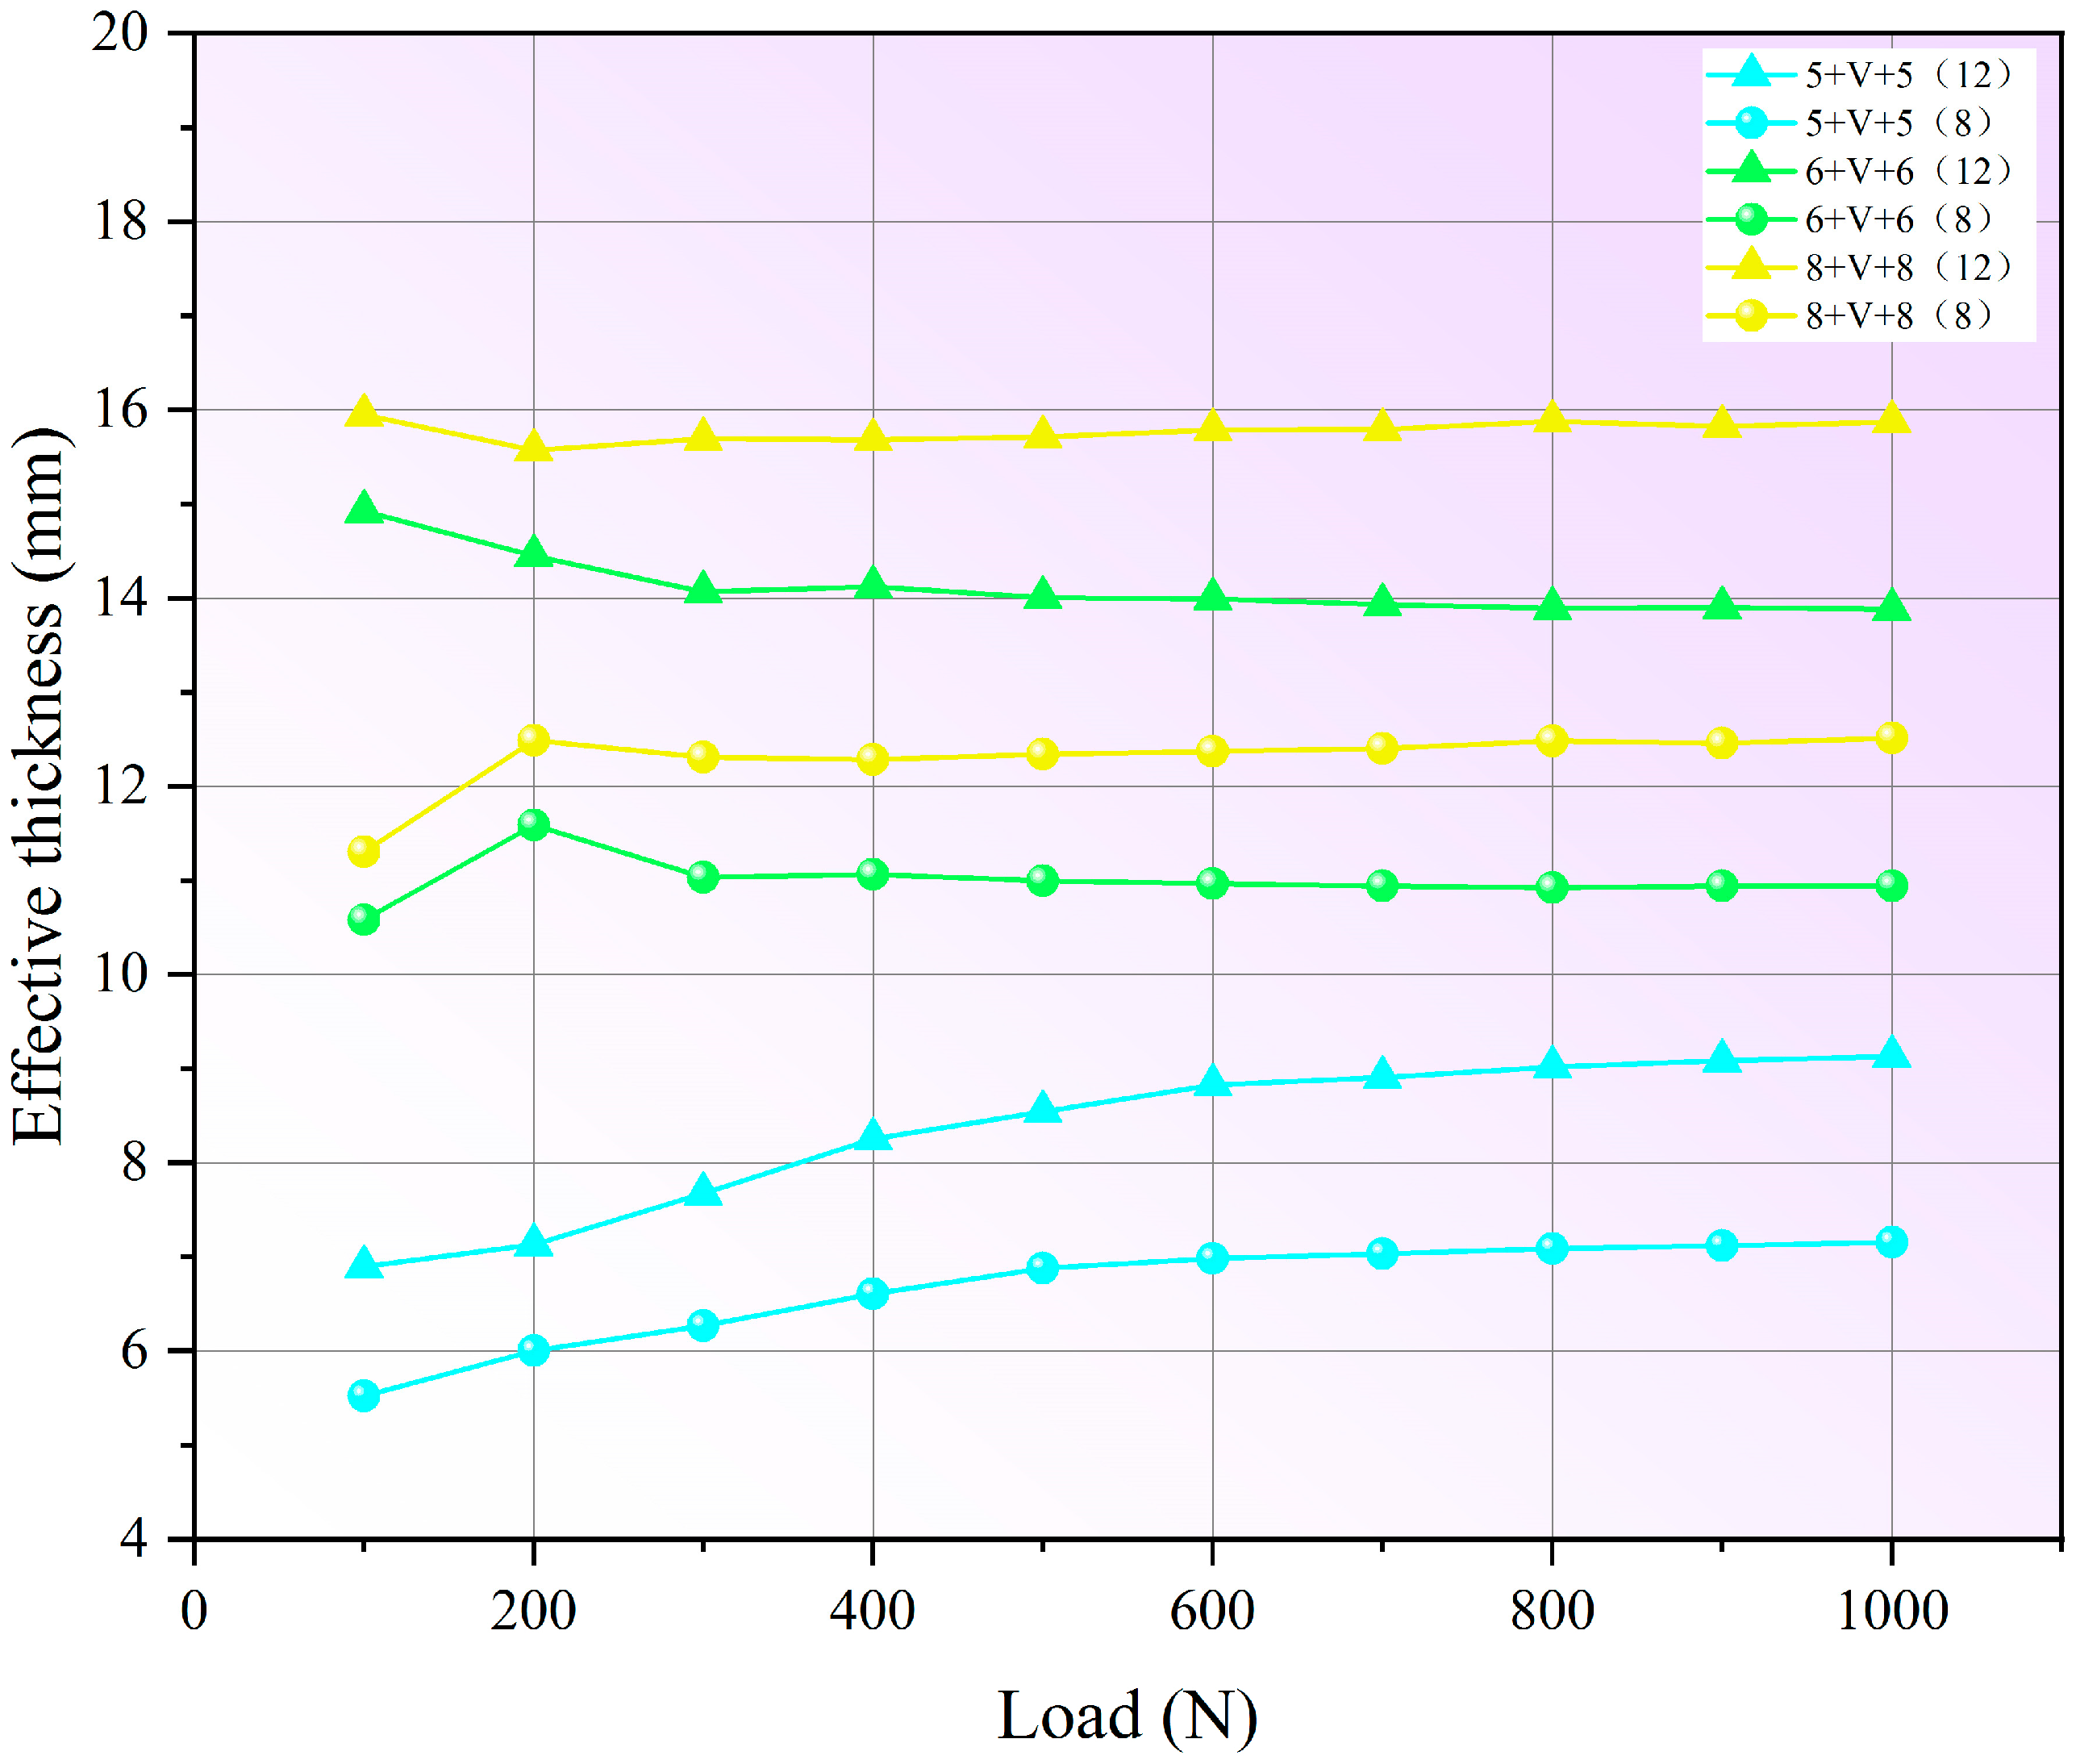
3.2. The Effective Thickness and Stress State of Vacuum Glazing

The bending stress at each loading step of vacuum glazing with different thicknesses of glass is demonstrated in Figure 10. As shown in Figure 10, vacuum glazing exhibited decreasing bending stress with increasing glass thickness, which showed a similar trend to PVB and SGP laminated glass. Notably, vacuum glazing demonstrated comparable bending stress to SGP laminated glass under identical loading conditions, while showing lower stress values than PVB laminated glass. The effective thickness of vacuum glazing determined using different reference glasses is shown in Figure 11, where the previously observed phenomenon is confirmed, that the effective thickness values derived from the initial loading stage display marked divergence.
Several researchers believe that there is no theoretical formula to determine the effective thickness of vacuum glazing due to the complex structure. Consequently, an empirical formula has been developed through a comprehensive experimental investigation, shown in Equation (11). The effective thickness of vacuum glazing determined by the empirical formula is shown in Table 3 [20].
h e q = μ ( h 1 + h 2 )
where heq is the effective thickness of vacuum glazing. h1 is the thickness of the top glass ply. h2 is the thickness of the bottom glass ply. μ is the coefficient of effective thickness, normally taken as 0.81.

3.3. Validation of Comparative Method for Determining the Effective Thickness of Composite Glass

As established in Equation (5), experimental bending stress can be determined from strain values measured at the maximum strain point of specimens. The theoretical bending stress of composite glass is calculated by substituting the nominal thickness with the experimentally determined effective thickness, as presented in Equation (12). This theoretical framework enables validation of the effective thickness determination method through direct comparison between experimental and calculated bending stresses at identical loading levels.
σ B = k [ F 3 ( L S L B ) 2 B h e q 2 + σ C ]
σ C = 3 ρ g L S 2 4 h e q
where σB is the four-point bending stress at each loading step. k is a dimensionless factor, normally taken as 1. LS is the length of the lower span. LB is the length of the upper span. B is the width of the specimen. heq is the effective thickness determined by the comparative method. σC is the stress generated by the weight of glass panes. ρ is the density of glass. g is the gravitational acceleration [21,22].
The comparative analysis of experimental versus calculated bending stress for all specimens is shown in Table 4. For all specimens, bending stresses calculated using effective thickness values derived from 12 mm reference glass showed the closest agreement with experimental results, with post-500 N deviations remaining around 10%. In contrast, calculations employing 8 mm reference glass produced significantly divergent results, exhibiting approximately 40% error when using data beyond 500 N. Table 4 further compares results obtained using established methods. The prEN-derived results for laminated glass showed acceptable results with approximate deviations of 25%. However, the empirical formula for vacuum glazing provided larger deviations (~35%) from experimental values, indicating limited accuracy.

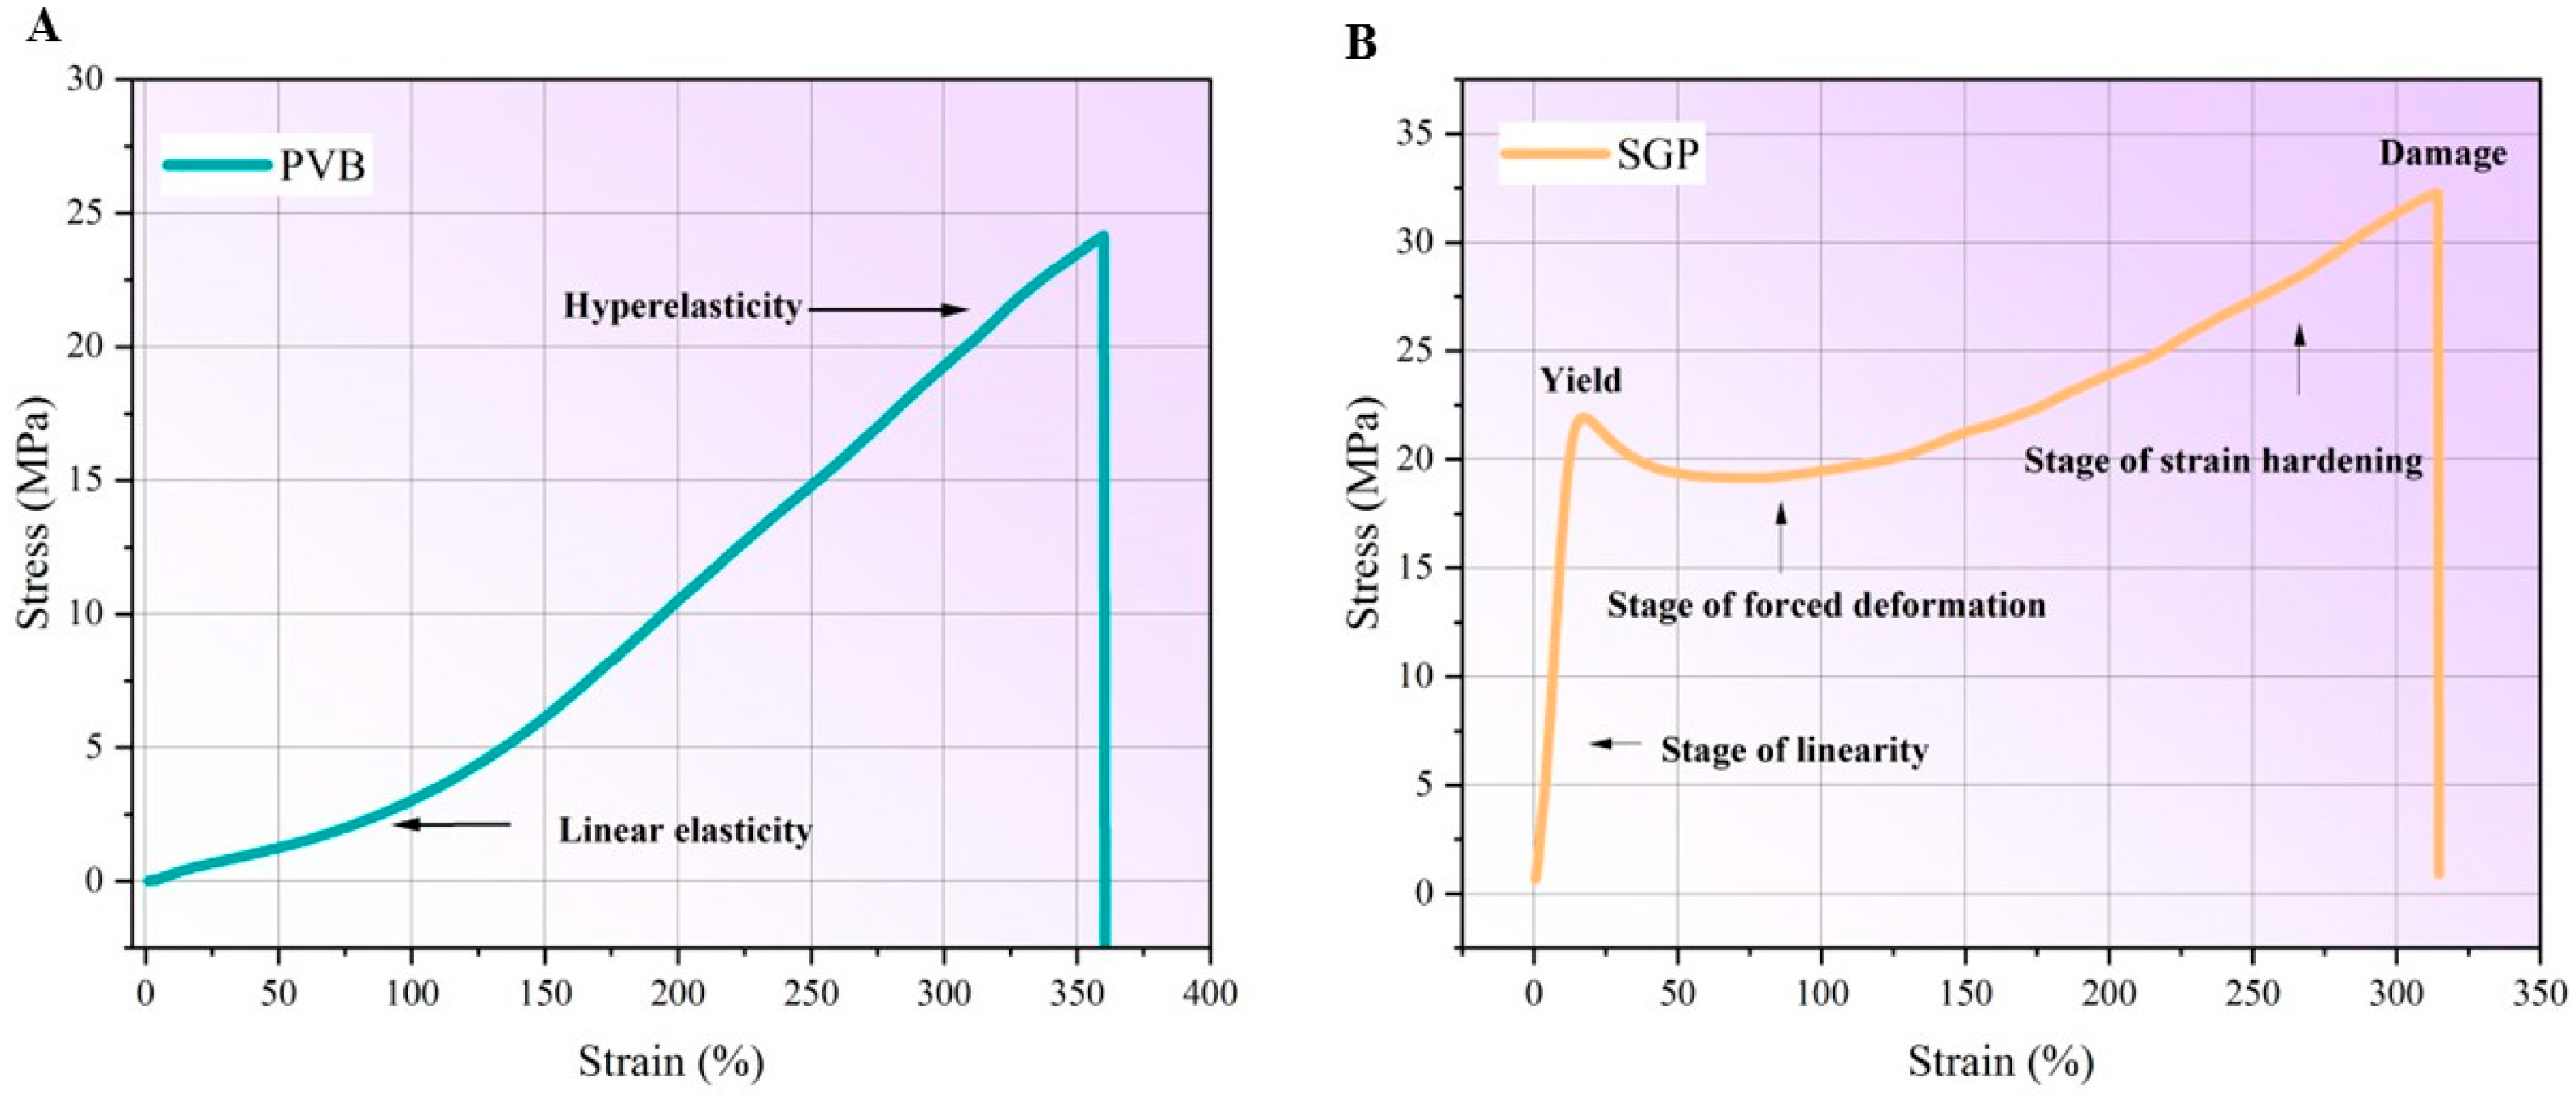
3.4. The Mechanical Properties of PVB and SGP

Static tensile tests were conducted on both PVB and SGP, with the resulting plot of stress against strain, shown in Figure 12. It can be noticed that the tensile strength of SGP was higher than that of PVB, and the degree of deformation of SGP was slightly lower than that of PVB. On the other hand, Figure 12 reveals fundamentally different tensile behavior between the two materials.
Frequency sweep tests were performed to analyze the time-dependent properties. The logarithm of shear modulus of PVB and SGP against the logarithm of time at different temperatures is shown in Figure 13A and Figure 14A, respectively. These curves can be superimposed using appropriate shift factors to establish a master curve. The derived master curve enables to extent of the time regime at a specific temperature [23]. Notably, the master curves of PVB and SGP are shown in Figure 13B and Figure 14B. There were significant differences in the trend of shear modulus evolution between PVB and SGP over the extended time scales.

4. Discussions

4.1. Polymeric Laminated Glass

As established in Section 3.1, the bending stress of polymeric laminated glass exhibits significant thickness dependence. Variations in the thickness of glass could directly affect flexural rigidity, subsequently modifying bending deformation behavior and resulting in distinct stress states. Furthermore, it is also found that SGP laminated glass demonstrates substantially lower bending stress than PVB one under identical loading conditions. The SGP obtains superior shear properties compared to PVB, so the relative sliding of SGP laminated glass is minimized, causing its mechanical response to approach the monolithic limit. When the thickness and loading condition remain identical for PVB and SGP laminated glass, the deflection of SGP laminated glass can be 1/4 of that of PVB laminated glass. These behaviors confirm that SGP laminated glass shows better load-bearing performance compared to PVB ones [24,25].
The selection of reference monolithic glass thickness (12 mm vs. 8 mm) significantly impacts effective thickness determination for both SGP and PVB laminated glass. Table 4 reveals that using a 12 mm reference glass provides optimal accuracy when calculating bending stress via effective thickness. The precision can be explained by several reasons. It is known that the thickness of 12 mm reference glass is relatively equal to the thickness of polymeric laminated glass used in this study, so the deformation characteristics of the reference and tested specimens can be matched up with each other, ensuring the assumption that “factor K is constant” (from Equations (1) and (2)) can be established, providing precise results. On the other hand, the thinner monolithic glass normally obtains reduced stiffness, promoting large deflection during the bending process. The large deflection may compromise the adhesion of the strain rosette installed on the tensile surface, leading to inaccurate strain measurements. Moreover, the stress against load curve of thin reference glass could demonstrate non-linear stress-load response, even fracture at the initial loading stage. The limited linear segment of the curve could make it difficult to select accurate results for calculation, resulting in errors. In addition, using the effective thickness from the prEN for calculation provides relatively acceptable results, but the accuracy of such a method is not as precise as the proposed method (using 12 mm reference glass). In practical design, the prEN can be used, but the applicability needs to be fully analyzed.

4.2. Polymertic Interlayers

PVB and SGP represent the two predominant interlayers in laminated glass manufacturing. Their distinct mechanical properties offer fundamentally different shear force transfer capability, directly influencing application suitability. Additionally, it is known that the polymeric interlayers exhibit significant sensitivity to loading duration, where even short-term loading could substantially alter the mechanical properties, particularly shear modulus. In this study, the 30 s load holding protocol at each loading step during the four-point bending test is provided, clarifying that the behaviors of PVB and SGP are essential for methodological accuracy.
As shown in Figure 12, it can be noticed that the tensile response of PVB and SGP is fundamentally different. PVB exhibits a rubbery state at room temperature, and the tensile stress–strain curve shows an exponential function profile. At room temperature, it demonstrates a non-linear viscoelastic behavior. The tensile process of PVB can be divided into two stages: 1. initial linear elastic stage; 2. hyperplastic (strain hardening) stage. Conversely, SGP displays a glassy state at room temperature, demonstrating an elastoplastic characteristic. The tensile behavior of SGP can be categorized into three stages: 1. elastic stage; 2. forced high-elastic deformation stage; 3. strain hardening stage [26]. Based on the distinct tensile behaviors of PVB and SGP, the mechanical response of laminated glass could be fundamentally different in force transfer mechanisms, failure modes and post-breakage performance. PVB interlayer allows the glass plies to slide slightly, absorbing the energy when under load. After the breakage, PVB could act like a flexible membrane, sagging but retaining the glass debris. PVB laminated glass is ideal for designing high-impact-resistance products but poor for the structural applications required for high stiffness. Differently, the ionic crosslinks in SGP could resist initial deformation (the steep elastic stage), bonding tightly to the glass. Even after glass breakage, the SGP interlayer can still be able to transmit relatively high loads to frames. Therefore, the SGP laminated glass is suitable for load-bearing applications [27]. The different mechanical response of PVB and SGP could also explain the reason SGP laminated glass obtains lower bending stress than PVB laminated glass under the same loading level, as shown in Figure 8.
By applying the TTSP, it can easily obtain the evolution of shear modulus of PVB and SGP under a constant load during a relatively long-term loading. From Figure 13 and Figure 14, the evolution of shear modulus of PVB and SGP shows a distinct difference. PVB undergoes a dramatic change in shear modulus over a short time. However, the shear modulus of SGP shows a minimal change over a relatively long time. These load-dependent properties could impact laminated glass. In terms of the creep resistance properties, the shear modulus of PVB dropping over time could lead to progressive loss of stiffness, resulting in an increase in long-term deflection, even glass plies debonding. However, the SGP-based laminated glass could obtain good creep resistance over a long time due to the minimal change in shear modulus over time. The viscoelastic behavior of PVB could make the laminated glass with evolving properties, which is unsuitable for long-term load-bearing applications but ideal for short-term impact safety. Reversely, the SGP provides stable properties over time, and due to this, it is preferred to use it in structural applications, such as bridges and floors.
Considering the 30 s holding time of the four-point bending test mentioned in the effective thickness method, there is a small change in the shear modulus of both interlayers during 30 s, as shown in Figure 13 and Figure 14. In order to induce stress redistribution and affect the accuracy of the method, a large amount of shear modulus decay is required to change the load-transfer conditions between glass plies. However, it is still necessary to carefully select the load holding time based on the time evolution characteristics of specific polymeric materials.

4.3. Vacuum Glazing

The bending stress of SGP laminated glass and vacuum glazing exhibits comparable results under identical conditions, but both are higher than that of PVB laminated glass. Under a four-point bending, the PVB laminated glass demonstrates the lowest load-bearing capacity compared to the others, while and SGP laminated glass and vacuum glazing show nearly equivalent performance. Although both types of glass utilize multiple glass plies, their load-transfer mechanisms and stress responses are fundamentally different. Polymeric laminated glass depends on shear transfer through the viscoelastic interlayer, resulting in bending stress and load-bearing capacity strongly sensitive to interlayer properties. For vacuum glazing, the two plies of glass are always in contact with the pillars at the middle due to huge atmospheric pressure; thereby, the external load can be directly transferred from the top ply to the bottom ply, maintaining co-deformation [14]. By previous experiments, the stress distribution of vacuum glazing under bending is quantified using the photoelastic scanning method [10]. It is found that the photoelastic stress spot nears the pillar remains identical from the pre-loaded stage to failure. These observations confirm that the two glass plies in vacuum glazing exhibit effectively co-deformation under external load. In terms of the bending behaviors, SGP laminated glass (great shear transfer capability) and vacuum glazing (co-deformation) behave more rigidly like monolithic glass, resulting in strong load-bearing capacity.
The effective thickness of vacuum glazing determined by the empirical formula seems to be acceptable in this study; however, using the data for bending stress calculation could still be inaccurate shown in Table 4. Due to the complex structure of vacuum glazing, some studies have concluded that there is no theoretical formula for determining the effective thickness. Same as the theory to design polymeric laminated glass, when two glass plies of vacuum glazing are completely unconstrained by each other, it is equivalent to two glass plies simply stacked together. The effective thickness for this condition can be calculated by Equation (14). When the two glass plies are firmly bonded as a monolithic glass, the effective thickness is the sum of the thickness of the two plies of glass, as shown in Equation (15).
h e q = h 1 3 + h 2 3 3
h e q = h 1 + h 2
where h1 is the thickness of the top glass ply. h2 is the thickness of the bottom glass ply. heq is the effective thickness.
These unique mechanical characteristics make the precise determination of the effective thickness of vacuum glazing particularly challenging. Currently, only the empirical formula presented in Equation (11) derived through extensive experimentation can provide a viable estimate of effective thickness [10,14]. However, the coefficient μ in the empirical formula is not constant; it varies with the dimensions of glass panes. Normally, considering the safety and convenience, the coefficient μ is typically taken as 0.81 for all calculations. When vacuum glazing has different dimensions, still using 0.81 for calculation could result in inaccurate outcomes, imposing notable limitations for practical design applications [20].
By using the proposed method, the effective thickness of vacuum glazing was successfully determined and validated. As with polymeric laminated glass, the effective thickness determined by using 12 mm reference glass shows the most accurate results compared to alternative methods, as shown in Table 4. For vacuum glazing, the materials, number of plies of glass, the configuration of grid and the length of pillars can be changed to adapt to the application, but the fundamental change is the stress. Therefore, measuring the change in stress can reflect the actual behavior of vacuum glazing under external loads, hence determining the effective thickness.

4.4. Discussion of Appropriate Use of the Proposed Method

The results of effective thickness determined at each loading step for all specimens are shown in Figure 9 and Figure 11. The effective thickness determined by the data from the initial stage of the loading process demonstrates a relatively large deviation. In addition, it can be seen from Table 4 that there are also significant differences in calculated and experimental bending stress during the initial loading stage compared to the later loading stage. This can be attributed to incomplete compaction of gaps between testing machine fixtures, leading to non-linear mechanical behavior during initial loading stages, as evident in the initial segments of Figure 8 and Figure 10. Therefore, in order to obtain reliable results, it is recommended to use effective thickness values obtained during the middle to late loading stage (500–1000 N), while it needs to be careful when using measurement values from the initial loading stage.
On the other hand, it is known that glass contains flaws and defects from manufacturing, wear and tear. The method proposed in this study could potentially consider the effect of the existed defects. The method addresses this concern through the following experimental and analytical approaches. Firstly, the bending stress derived in this method by experimentally measured strains (strain rosettes) rather than theoretical material properties. Since the strains are measured on the actual specimens with natural defects, the resulting bending stress can directly reflect the effects of these defects. This ensures that the calculated effective thickness potentially considers the defect-induced strength variations. Secondly, the objective of this method is to determine the effective thickness by comparing the bending stress of composite glass and monolithic reference glass under identical loads. This is a stress-based equivalence principle rather than a determination of absolute strength. As the defects could equally influence strain measurements in both reference and composite glass under identical loading conditions, the effects could probably be canceled out in the stress ratio. Finally, since the method is non-destructive, the specimen can be tested multiple times to average the stress values. The averaging values obtain statistically representative data that is associated with the defect-driven strength scatter.

5. Conclusions

This study introduces a comparative experiment-based method universally applicable for determining the effective thickness across diverse composite glass types. PVB and SGP laminated glass and vacuum glazing were tested as examples to carry out the results. Key conclusions can be summarized as follows:
  • The SGP laminated glass and vacuum glazing exhibit significantly lower bending stress compared to PVB laminated glass under identical loading levels, attributed to their enhanced stiffness. The SGP and vacuum glazing exhibit monolithic-like behavior, indicating superior load-bearing capacity.
  • The proposed method enables the precise determination of the effective thickness of PVB and SGP laminated glass and vacuum glazing. The results are compared with the results from the prEN and the empirical formula. The results from the proposed method demonstrate the superior accuracy.
  • Bending stress calculated using derived effective thickness shows a strong correlation with experimental measurements. It is also found that the selection of reference monolithic glass thickness can critically influence the accuracy of the proposed method. Using a 12 mm reference glass can obtain the optimal results. Experimenting using 12 mm reference glass can minimize the errors caused by large-deflection effects and inaccurate strain measurement.
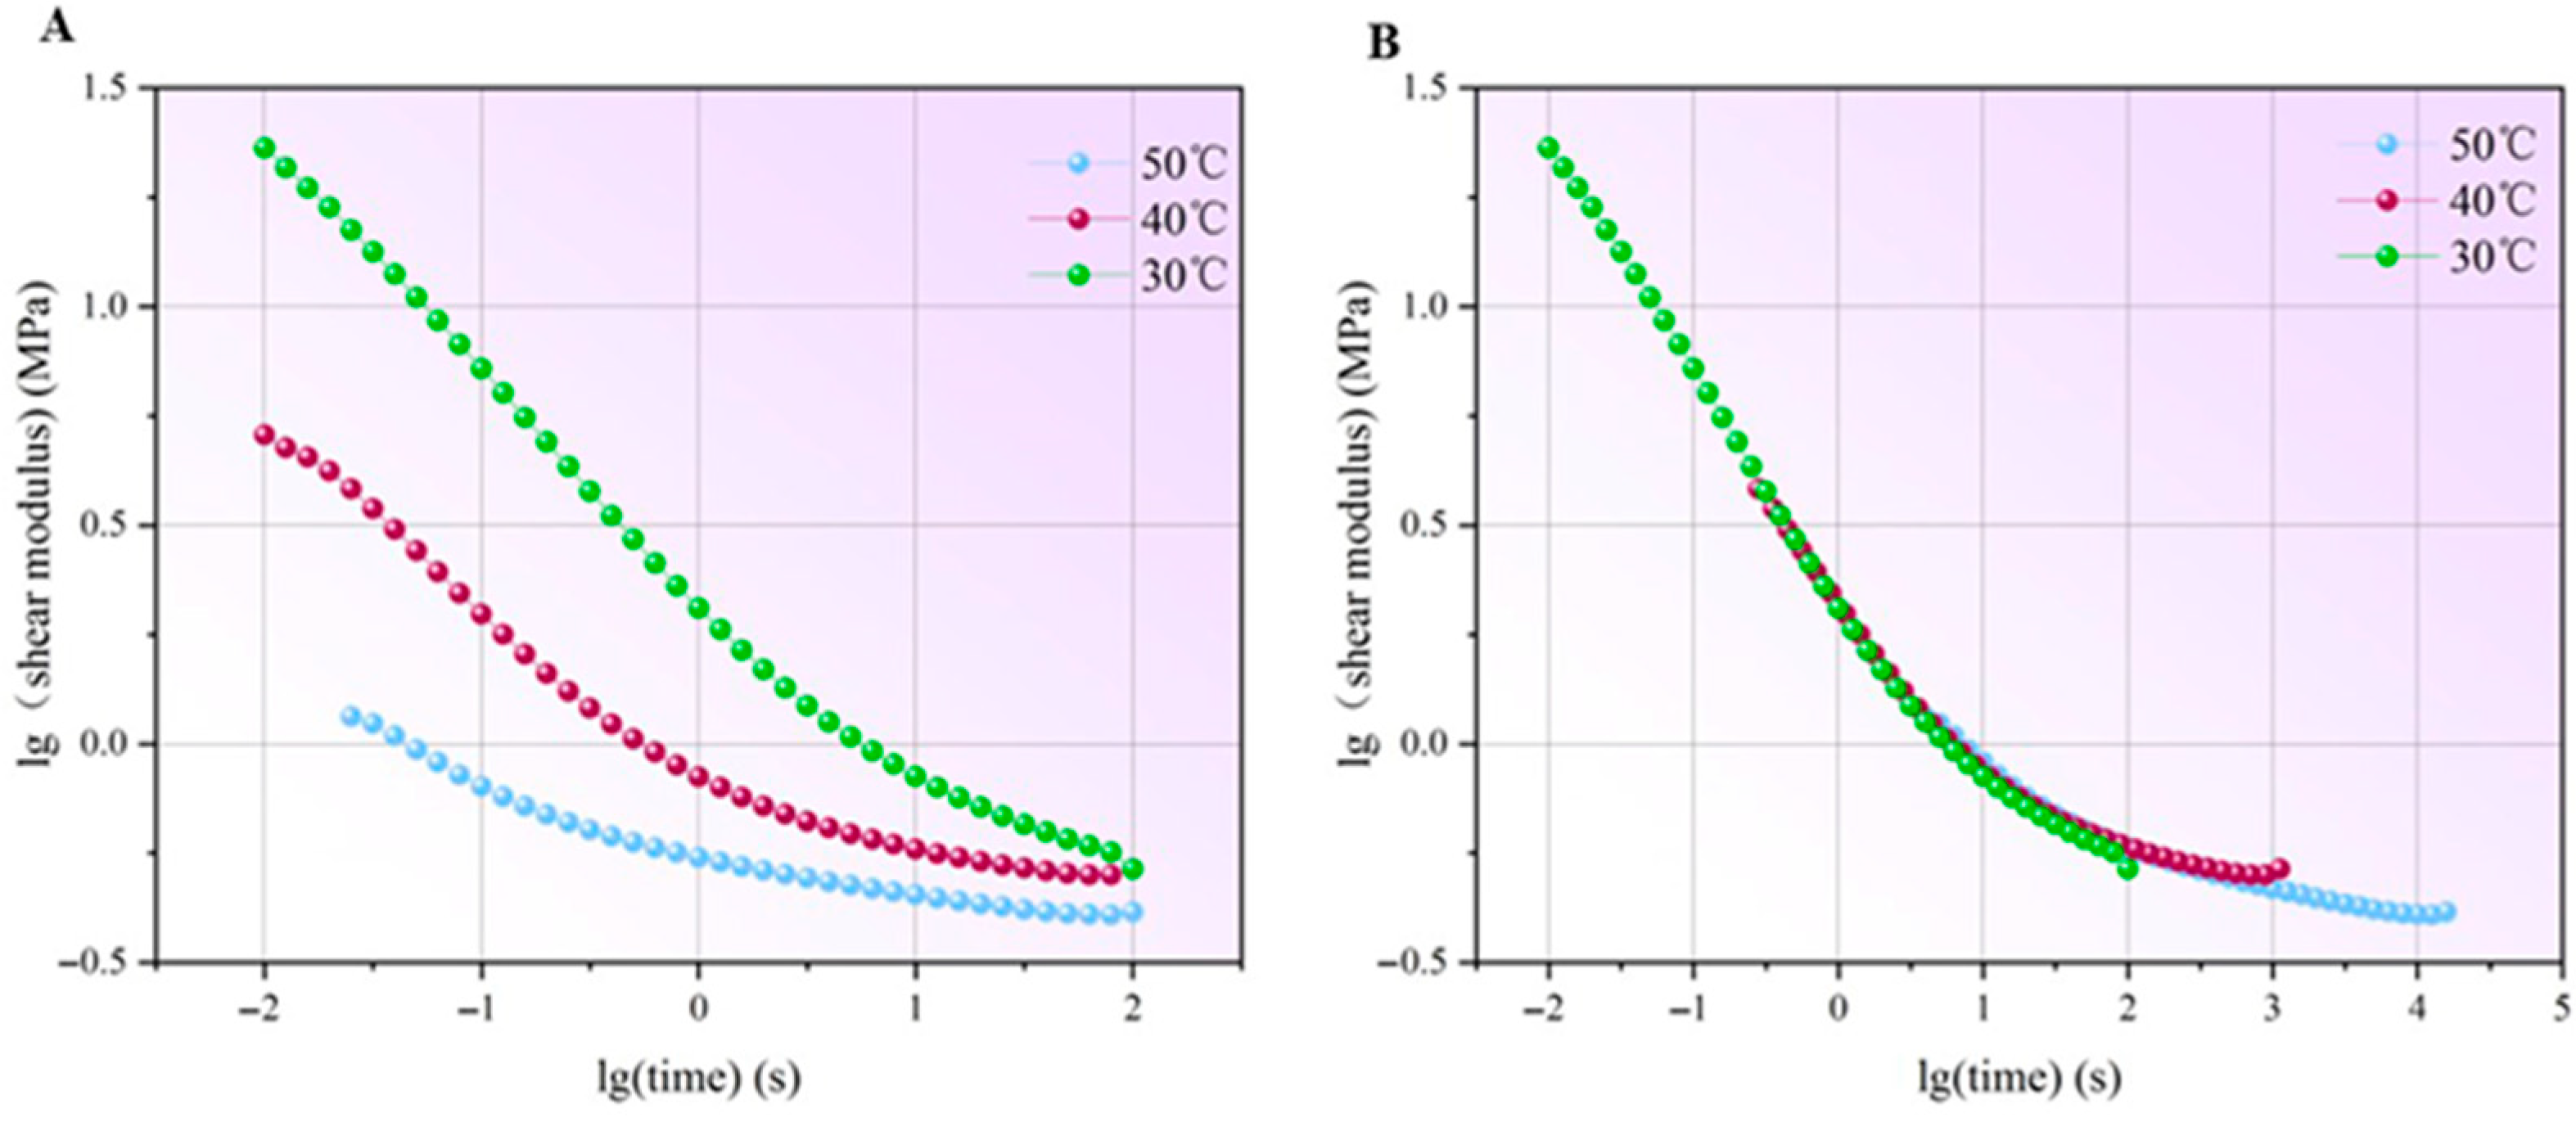
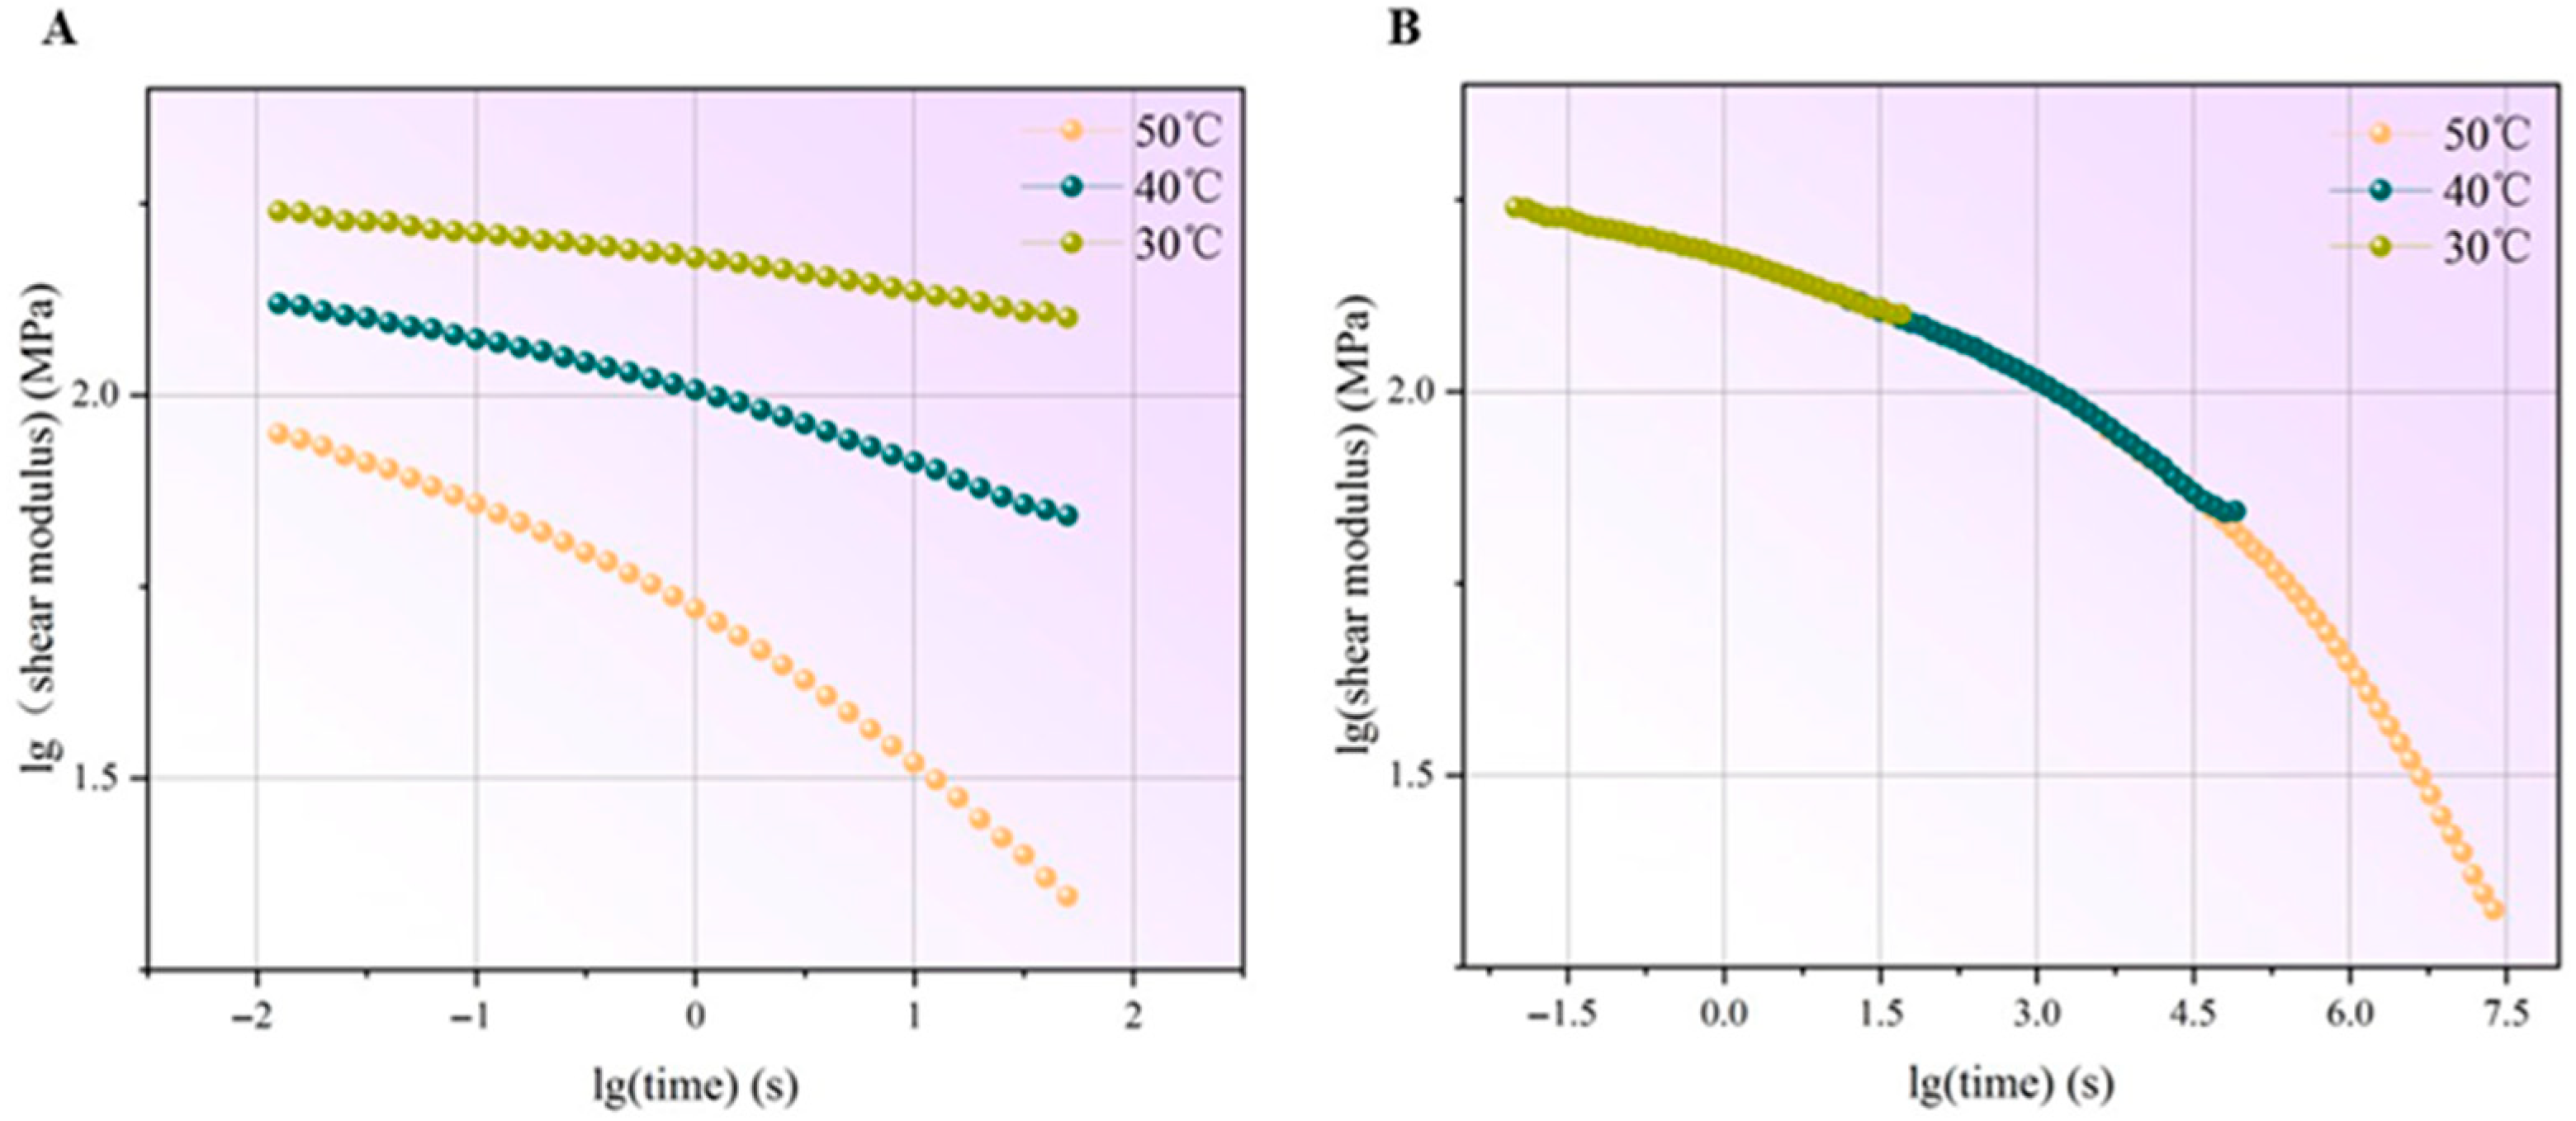
  • By static tensile test, the SGP interlayer provides higher tensile strength and lower tensile deformation compared to that of PVB. Substantially different tensile behavior of SGP and PVB is evident from their respective stress–strain profiles. Furthermore, the TTSP analysis reveals that the evolution of shear modulus of PVB and SGP over time shows a distinct difference. PVB undergoes a dramatic reduction in shear modulus over a short duration, whereas the shear modulus of SGP shows a minimal change over a relatively extended period. Additionally, it is also found that there is negligible shear modulus change of both interlayers during 30 s intervals, so the 30 s holding time in the proposed method could not be affected so much.
  • A guideline for providing accurate results by using the proposed method is established, which is to avoid using the early loading stage data due to the nonlinearity caused by the gaps between the fixtures. The optimal results can be obtained from the middle to later loading range (500 N–1000 N). The methodology also accounts for material defects through three mechanisms. This integrated approach ensures that derived effective thickness values reflect actual structural performance while accommodating inherent material variability.

Author Contributions

Writing—original draft, Methodology, Investigation, D.C.; Writing—review and editing, Supervision, Funding acquisition, Conceptualization, X.L.; Resources, Z.Y.; Investigation, J.H.; Software, M.X.; Project administration, D.W. All authors have read and agreed to the published version of the manuscript.

Funding

This work was funded by the National Key Research and Development Program (Grant No. 2023YFC3806205).

Data Availability Statement

Data are contained within the article.

Conflicts of Interest

Authors Dake Cao, Xiaogen Liu, Zhe Yang, Jiawei Huang, Ming Xu and Detian Wan were employed by the company China Testing & Certification International Group Co., Ltd. The authors declare that the research was conducted in the absence of any commercial or financial relationships that could be construed as a potential conflict of interest.

References

  1. Martín, M.; Centelles, X.; Solé, A.; Barreneche, C.; Fernández, A.I.; Cabeza, L.F. Polymeric interlayer materials for laminated glass: A review. Constr. Build. Mater 2020, 230, 116897. [Google Scholar] [CrossRef]
  2. Bennison, S.J.; Qin, M.H.; Davies, P.S. High-performance laminated glass for structurally efficient glazing. In Proceedings of the Innovative Light-Weight Structures and Sustainable Facades Conference, Hong Kong, China, 7 May 2008; pp. 1–12. Available online: https://www.researchgate.net/profile/Phillip-Davies/publication/237263030_High-performance_laminated_glass_for_structurally_efficient_glazing/links/5eb10af592851cb267741cf8/High-performance-laminated-glass-for-structurally-efficient-glazing.pdf (accessed on 10 July 2025).
  3. Galuppi, L.; Royer-Carfagni, G.F. Effective thickness of laminated glass beams: New expression via a variational approach. Eng. Struct. 2012, 38, 53–67. [Google Scholar] [CrossRef]
  4. Norville, H.S.; King, K.W.; Swofford, J.L. Behavior and strength of laminated glass. J. Eng. Mech. 1998, 124, 46–53. [Google Scholar] [CrossRef]
  5. Behr, R.A.; Minor, J.E.; Norville, H.S. Structural behavior of architectural laminated glass. J. Struct. Eng. 1993, 119, 202–222. [Google Scholar] [CrossRef]
  6. Simko, T.M.; Fischer-Cripps, A.C.; Collins, R.E. Temperature-induced stresses in vacuum glazing: Modelling and experimental validation. Sol. Energy 1998, 63, 1–21. [Google Scholar] [CrossRef]
  7. Collins, R.E.; Turner, G.M.; Fischer-Cripps, A.C.; Tang, J.Z.; Simko, T.M.; Dey, C.J.; Clugston, D.A.; Zhang, Q.C.; Garrison, J.D. Vacuum glazing—A new component for insulating windows. Build. Environ. 1995, 30, 459–492. [Google Scholar] [CrossRef]
  8. Pont, U.; Wölzl, M.; Schober, P.; Khosravi, S.N.; Schuss, M.; Mahdavi, A. Recent progress in the development of windows with vacuum glass. MATEC Web Conf. 2019, 282, 02020. [Google Scholar] [CrossRef]
  9. Ali, H.; Hayat, N.; Farukh, F.; Imran, S.; Kamran, M.S.; Ali, H.M. Key design features of multi-vacuum glazing for windows: A review. Therm. Sci. 2017, 21, 2673–2687. [Google Scholar] [CrossRef]
  10. Liu, X.G.; Bao, Y.W.; Wan, D.T.; Qiu, Y.; Wang, X.F.; Xu, H. Bearing behavior and strength design for building vacuum glazing. J. Cent. South Univ. 2011, 42, 349–355. [Google Scholar]
  11. Galuppi, L.; Royer-Carfagni, G. The effective thickness of laminated glass plates. J. Mech. Mater. Struct. 2012, 7, 375–400. [Google Scholar] [CrossRef]
  12. Bennison, S.J.; Stelzer, I. Structural Properties of Laminated Glass; Glass Performance Days: Tampere, Finland, 2009; pp. 12–15. [Google Scholar]
  13. prEN 16612; Glass in Buildings—Determination of the Load Resistance of Glass Panes by Calculation and Testing, European Standard. European Commission: Brussels, Belgium, 2013.
  14. Liu, X.G.; Qi, S.; Sun, Y.K. Stress Analysis and Strength Design of Vacuum Glazing. Bull. Chin. Ceram. Soc. 2022, 41, 1141–1147. [Google Scholar]
  15. Hoffmann, K. An introduction to stress analysis and transducer design using strain gauges. HBM Test Meas. 2012, 257. Available online: https://www.kk-group.ru/help/Strain_Gauge_Measurements_Book_2012_01.pdf (accessed on 10 July 2025).
  16. Rouxel, T. Elastic properties and short-to medium-range order in glasses. J. Am. Ceram. Soc. 2007, 90, 3019–3039. [Google Scholar] [CrossRef]
  17. Zhang, X.; Hao, H.; Shi, Y.; Cui, J. The mechanical properties of Polyvinyl Butyral (PVB) at high strain rates. Constr. Build. Mater. 2015, 93, 404–415. [Google Scholar] [CrossRef]
  18. Krasnopol’skii, B.I.; Chesnokov, A.G.; Chesnokov, S. A Numerical modeling and analysis of strength properties in glass. Glass Ceram. 2005, 62, 375–378. [Google Scholar] [CrossRef]
  19. Serafinavicius, T.; Kvedaras, A.K.; Sauciuvenas, G. Bending behavior of structural glass laminated with different interlayers. Mech. Compos. Mater. 2013, 49, 437–446. [Google Scholar] [CrossRef]
  20. Wang, S.; Wan, C.; Li, D.; Wang, J. Research on the Design Method of Equivalent Thickness of Architectural Vacuum Glass. Bull. Sci. Technol. 2025, 41, 56–63. [Google Scholar]
  21. Sable, L.; Kalnins, K. Evaluation of Glass in Design of Load Bearing Structures. In Proceedings of the 4th International Conference Civil Engineering`13 Proceedings Part I Structural Engineering, Jelgava, Latvia, 16–17 May 2013; pp. 46–52. [Google Scholar]
  22. Sable, L.; Japins, G.; Kalnins, K. Evaluation of Behaviours of Laminated Glass. IOP Conf. Ser. Mater. Sci. Eng. 2015, 96, 012077. [Google Scholar] [CrossRef]
  23. Naya, S.; Meneses, A.; Tarrío-Saavedra, J.; López-Beceiro, J.; Gracia-Fernández, C.; Artiaga, R. New method for estimating shift factors in time-temperature superposition models. J. Therm. Anal. Calorim. 2013, 113, 453–460. [Google Scholar] [CrossRef]
  24. Bennison, S.J.; Smith, C.A.; Duser, A.V.; Jagota, A. Structural performance of laminated glass made with a “stiff” interlayer. ASTM Int. Glass Build. 2002, 1434, 57–65. [Google Scholar]
  25. Wang, X.E.; Yang, J.; Liu, Q.; Zhao, C. Experimental investigations into SGP laminated glass under low velocity impact. Int. J. Impact Eng. 2018, 122, 91–108. [Google Scholar] [CrossRef]
  26. Xu, X. Research on Influence of Polymer Interlayer on Mechanical Characteristics and Fracture Mechanism of Laminated Glass; Tsinghua University: Beijing, China, 2017. [Google Scholar]
  27. Shao, X.; Chen, S. Review on studies on mechanical properties of SGP. Hans J. Civ. Eng. 2015, 4, 143–150. [Google Scholar] [CrossRef]
Figure 1. The loading protocol of the four-point bending test.
Buildings 15 02542 g001
Figure 2. Schematic diagram of strain rosette installation on the bottom surface of the bottom ply of the composite glass.
Buildings 15 02542 g002
Figure 3. The strain gauges installed on both sides of the specimen. (A) Top surface. (B) Bottom surface.
Buildings 15 02542 g003
Figure 4. The absolute values of strain signals of 0° measured at the top and bottom sides of the composite glass.
Buildings 15 02542 g004
Figure 5. The frame of the comparative method for determining effective thickness. (A) Reference monolithic glass. (B) Tested composite glass.
Buildings 15 02542 g005
Figure 6. The documented photos during the bending test. (A) Reference monolithic glass. (B) Tested composite glass.
Buildings 15 02542 g006
Figure 7. (A) The dumbbell-shaped PVB and SGP specimens. (B) The tensile loading process.
Buildings 15 02542 g007
Figure 8. The plot of bending stress against corresponding load for polymeric laminated glass.
Buildings 15 02542 g008
Figure 9. The effective thickness of polymeric laminated glass determined by the proposed method at each loading step. (A) SGP laminated glass. (B) PVB laminated glass.
Buildings 15 02542 g009
Figure 10. The plot of bending stress against the corresponding load for vacuum glazing.
Buildings 15 02542 g010
Figure 11. The effective thickness of vacuum glazing determined by the comparative method at each loading step.
Buildings 15 02542 g011
Figure 12. The plot of stress against strain of PVB and SGP under tensile loading. (A) The tensile response of PVB interlayer; (B) The tensile response of SGP interlayer.
Buildings 15 02542 g012
Figure 13. (A) The plot of the logarithm of shear modulus of PVB against the logarithm of time at each temperature. (B) The master curve after superposition.
Buildings 15 02542 g013
Figure 14. (A) The plot of the logarithm of shear modulus of SGP against the logarithm of time at each temperature. (B) The master curve after superposition.
Buildings 15 02542 g014
Table 1. Structure and thickness of specimens.
StructureThickness
(mm)
Glass + PVB interlayer + Glass5 + 1.52 + 5
6 + 1.52 + 6
8 + 1.52 + 8
Glass + SGP interlayer + Glass5 + 1.52 + 5
6 + 1.52 + 6
8 + 1.52 + 8
Glass + Vacuum + Glass5 + V + 5
6 + V + 6
8 + V + 8
Reference monolithic glass8
12
Table 2. The effective thickness of laminated glass determined by prEN 16612.
Effective thickness of 5 + PVB + 5(mm)9.99
Effective thickness of 6 + PVB + 611.8
Effective thickness of 8 + PVB + 814.8
Effective thickness of 5 + SGP + 513.2
Effective thickness of 6 + SGP + 615.7
Effective thickness of 8 + SGP + 820.5
Table 3. The effective thickness of vacuum glazing determined by the empirical formula.
Effective Thickness of 5 + V + 5Effective Thickness of
6 + V + 6
Effective Thickness of
8 + V + 8
(mm)
8.109.7213.0
Table 4. The comparative results of calculated and experimental bending stress of all specimens.
Corresponding LoadCalculated Bending Stress by the Method Using 12 mm Reference GlassCalculated Bending Stress by the Method Using 8 mm Reference GlassCalculated Bending Stress by the Results from prEN or Empirical FormulaExperimental Bending Stress
(N)(MPa)(MPa)(MPa)(MPa)
5 + PVB + 5
100045.673.535.246.6
90041.066.131.941.7
80037.159.428.637.5
70032.751.825.232.6
60028.645.021.928.1
50024.437.018.523.4
40019.930.515.218.7
30016.023.411.914.3
20012.116.58.529.94
1006.8810.05.215.49
6 + PVB + 6
100034.254.443.534.7
90031.049.439.431.3
80027.744.235.227.7
70024.438.931.124.1
60021.033.626.920.4
50017.728.122.816.8
40014.422.918.613.2
30011.017.314.59.6
2007.8811.710.36.18
1004.808.546.203.56
8 + PVB + 8
100017.828.225.717.7
90016.025.423.315.7
80014.222.520.813.8
70012.419.718.411.9
60010.717.016.010.0
5009.2714.613.68.43
4007.8912.411.26.91
3005.608.688.794.52
2004.095.996.382.91
1002.374.073.971.46
5 + SGP + 5
100034.555.620.535.0
90031.851.218.632.1
80029.246.616.729.2
70026.642.014.826.3
60023.937.512.923.3
50021.432.411.020.4
40018.828.79.0417.5
30016.223.77.1314.5
20013.818.95.2211.5
1009.8714.63.318.38
6 + SGP + 6
100019.631.014.719.5
90017.728.113.317.5
80015.925.212.015.6
70014.122.410.613.6
60012.319.69.2811.6
50010.416.57.939.57
4008.6113.66.587.61
3006.7410.55.235.56
2004.797.043.883.50
1002.153.682.521.28
8 + SGP + 8
100010.817.08.8310.5
9009.7015.38.039.32
8008.7213.87.248.28
7007.7012.16.457.15
6006.7010.65.666.08
5005.628.784.864.90
4004.657.234.073.86
3003.645.583.282.77
2002.553.682.481.65
1001.652.771.690.90
5 + V + 5
100042.067.753.142.9
90038.461.848.038.9
80034.855.742.935.1
70031.549.837.831.3
60027.843.732.827.3
50025.037.927.724.1
40021.833.322.620.5
30019.428.417.517.5
20015.721.612.413.3
1009.6814.37.358.19
6 + V + 6
100018.629.533.818.5
90016.926.830.616.6
80015.124.027.414.8
70013.321.224.212.8
60011.518.321.010.9
5009.8115.517.88.96
4007.9912.614.67.01
3006.369.8811.45.21
2004.466.558.213.22
1002.734.715.011.75
8 + V + 8
100014.422.819.414.2
90013.120.817.612.8
80011.718.615.811.3
70010.516.714.09.96
6009.1914.612.28.53
5007.9212.410.77.11
4006.5910.38.565.68
3005.238.096.764.19
2003.935.754.962.78
1002.464.233.151.53
Disclaimer/Publisher’s Note: The statements, opinions and data contained in all publications are solely those of the individual author(s) and contributor(s) and not of MDPI and/or the editor(s). MDPI and/or the editor(s) disclaim responsibility for any injury to people or property resulting from any ideas, methods, instructions or products referred to in the content.

