
Experimental Study on Mechanical Differences Between Prefabricated and Cast-In Situ Tunnel Linings Based on a Load-Structure Model

 ,
,
Abstract
1. Introduction
2. Load-Structure Indoor Experiment
2.1. Specimen Design
2.2. Material Parameters
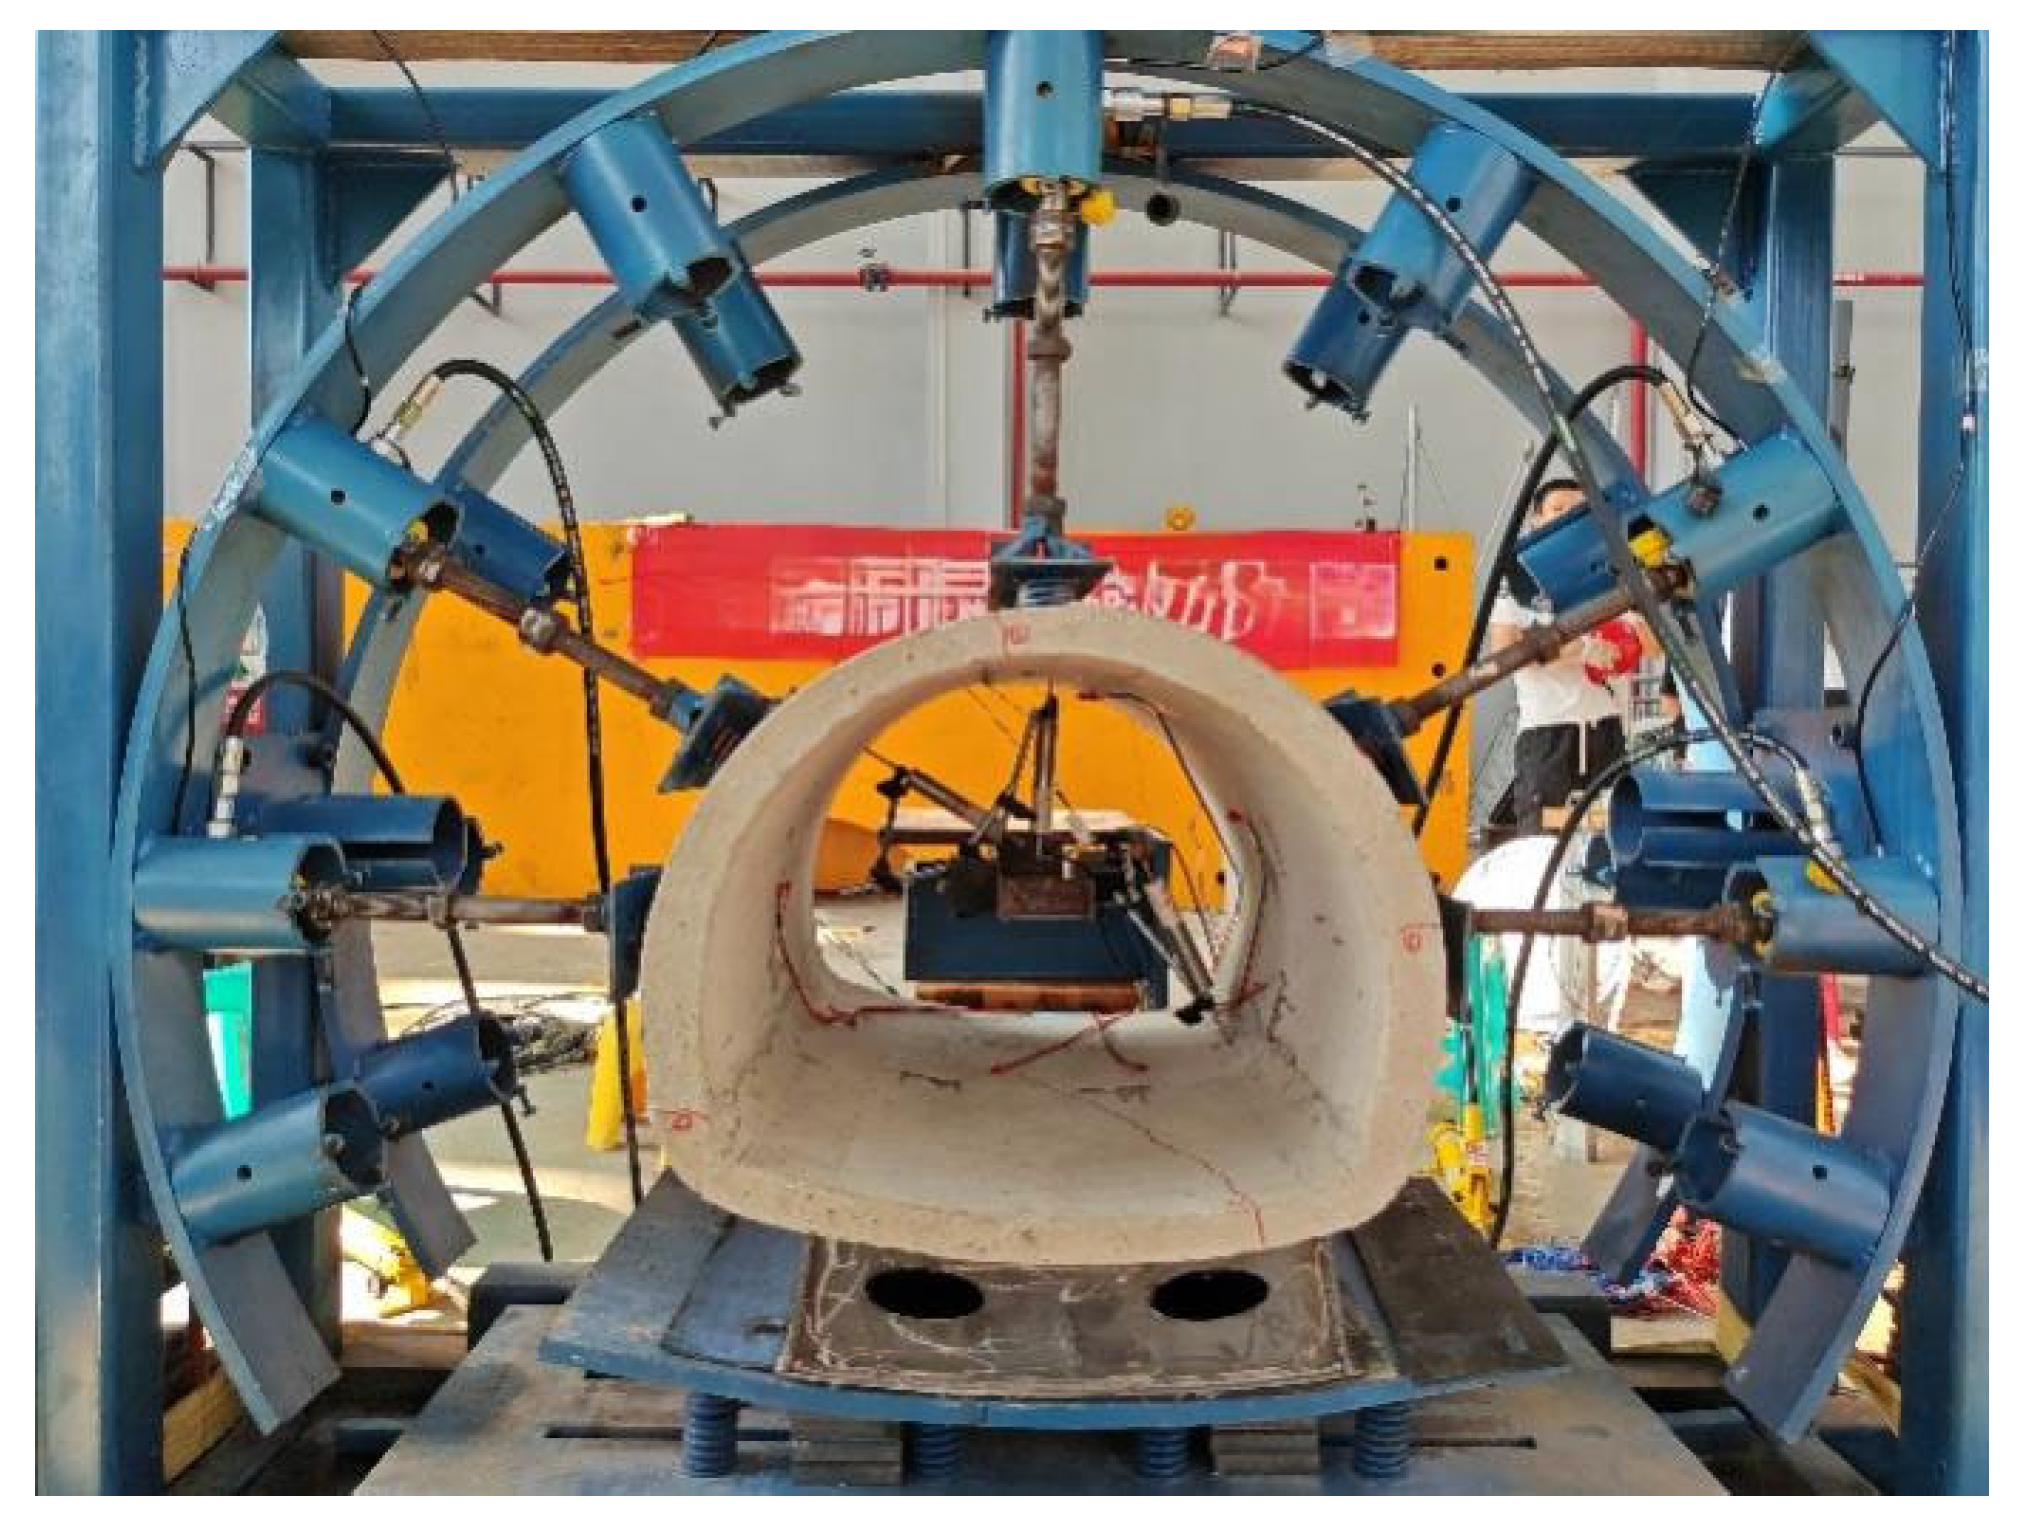
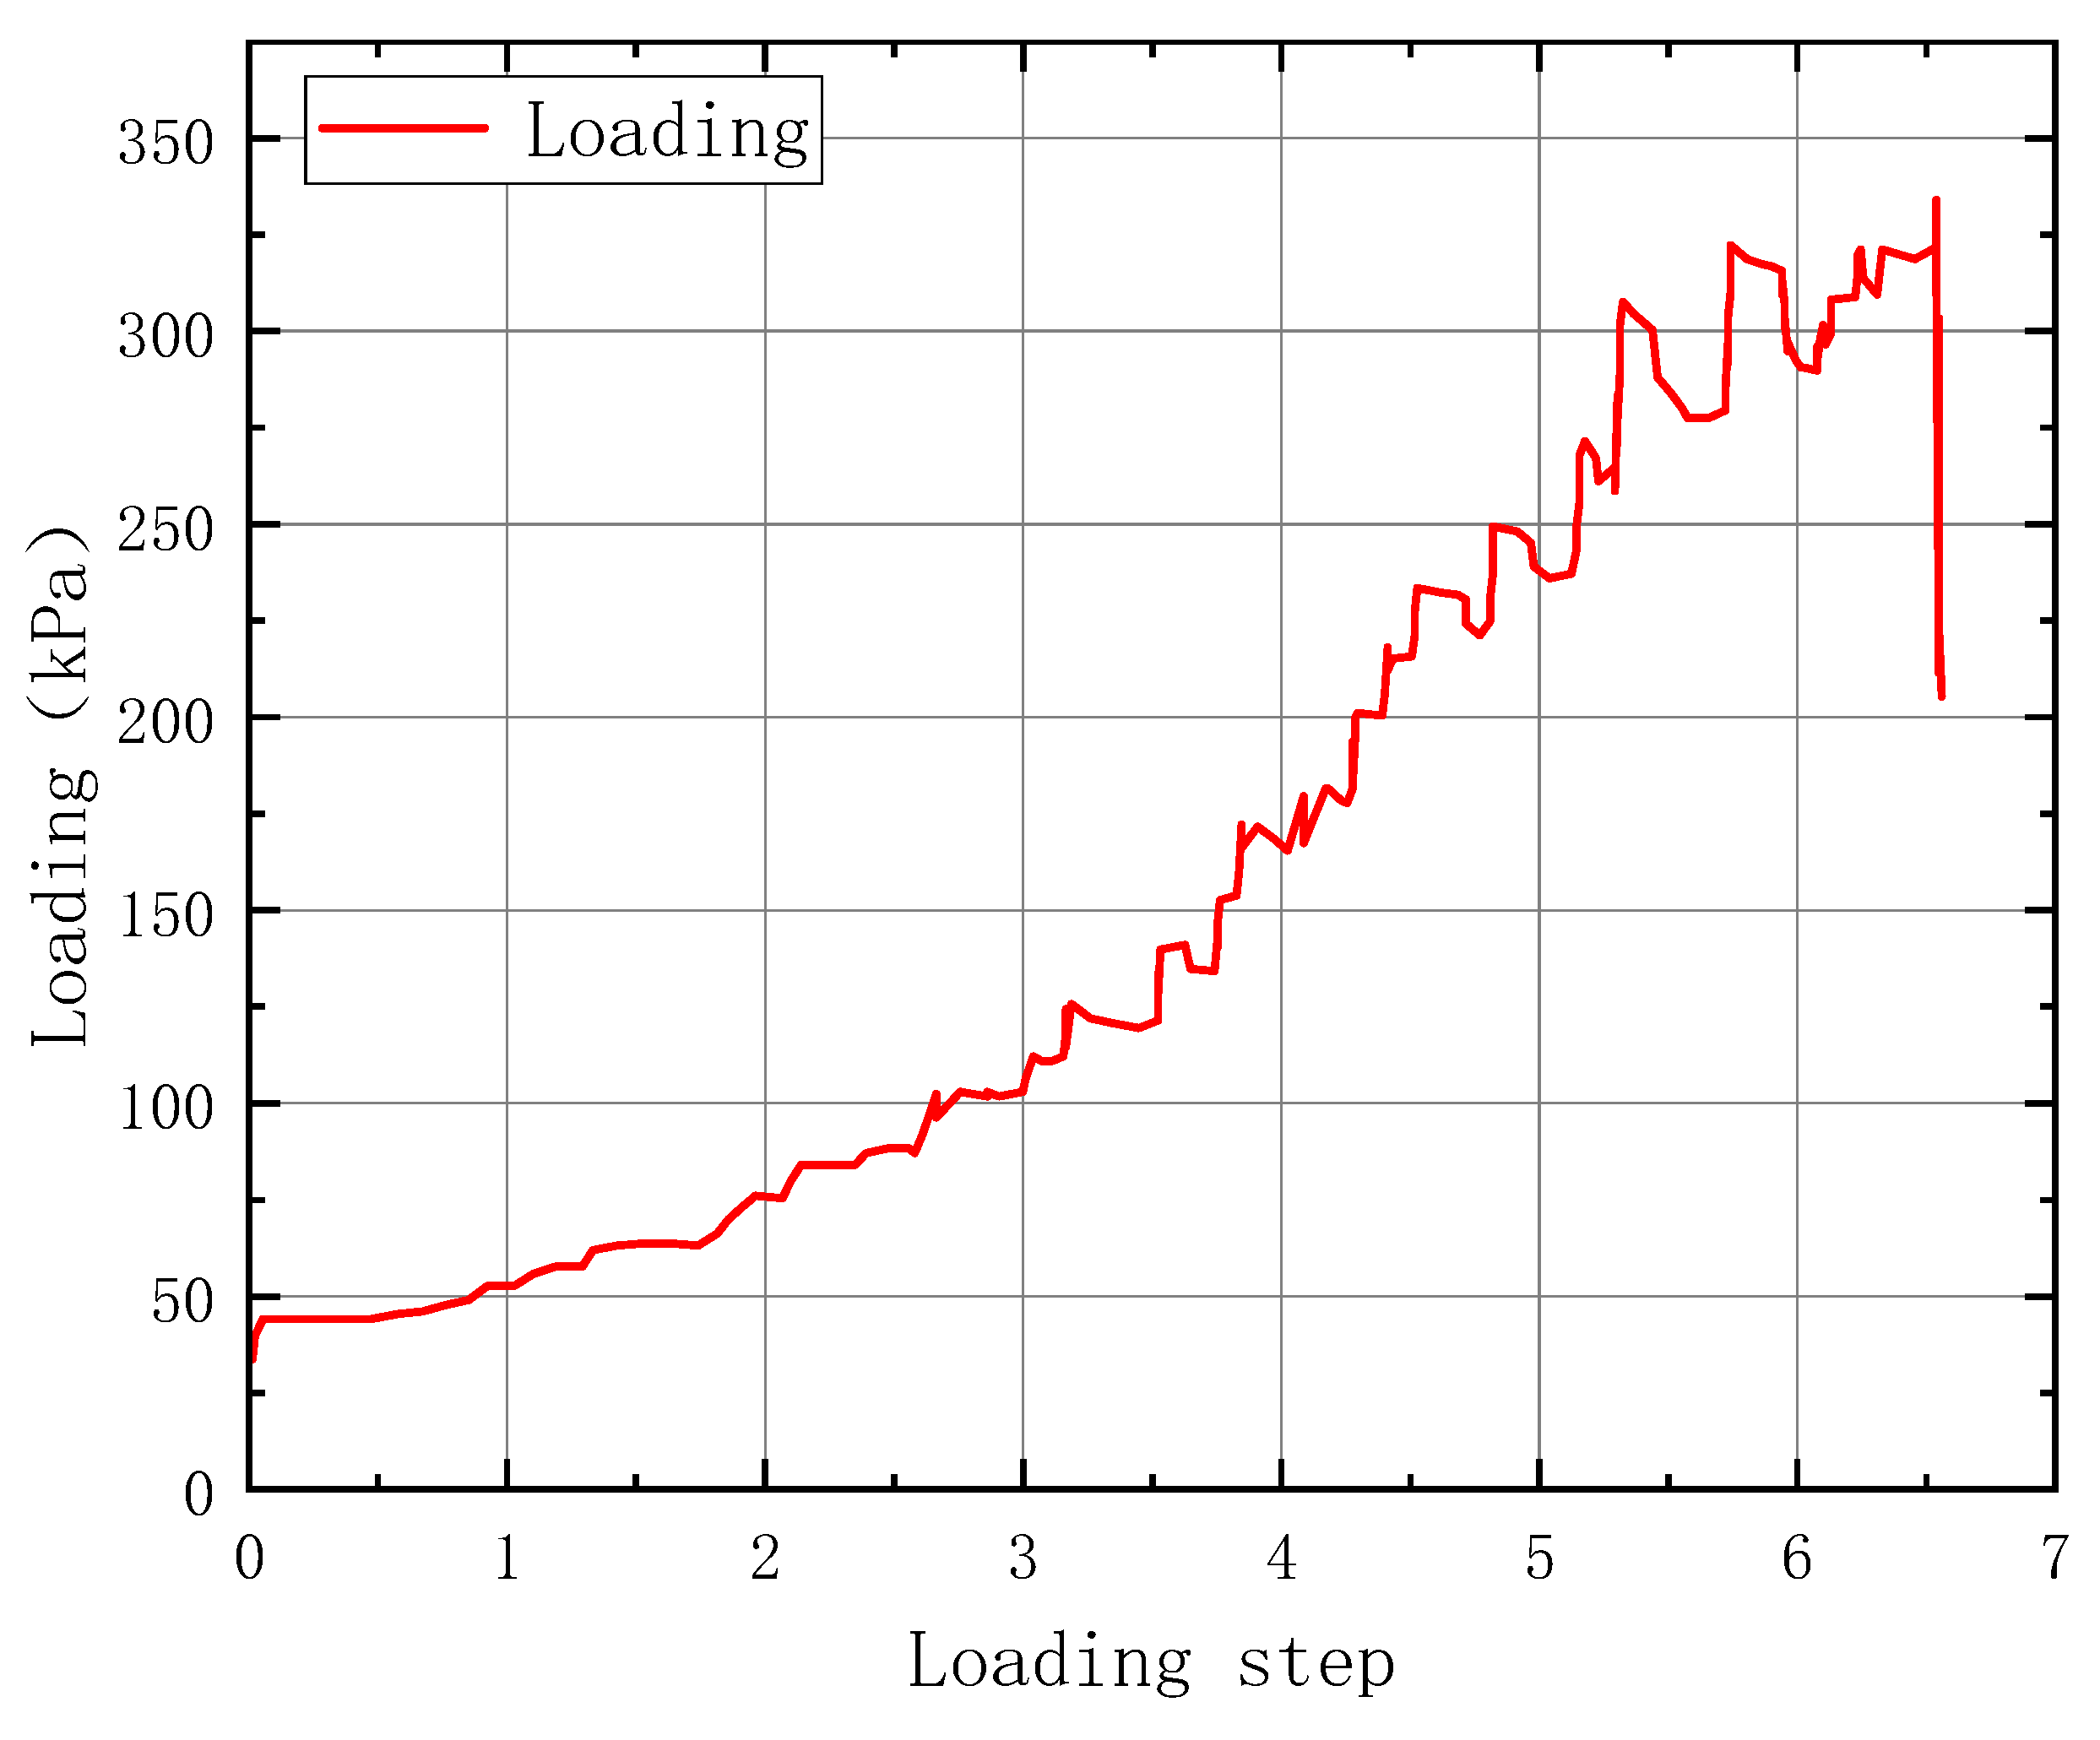
2.3. Loading System
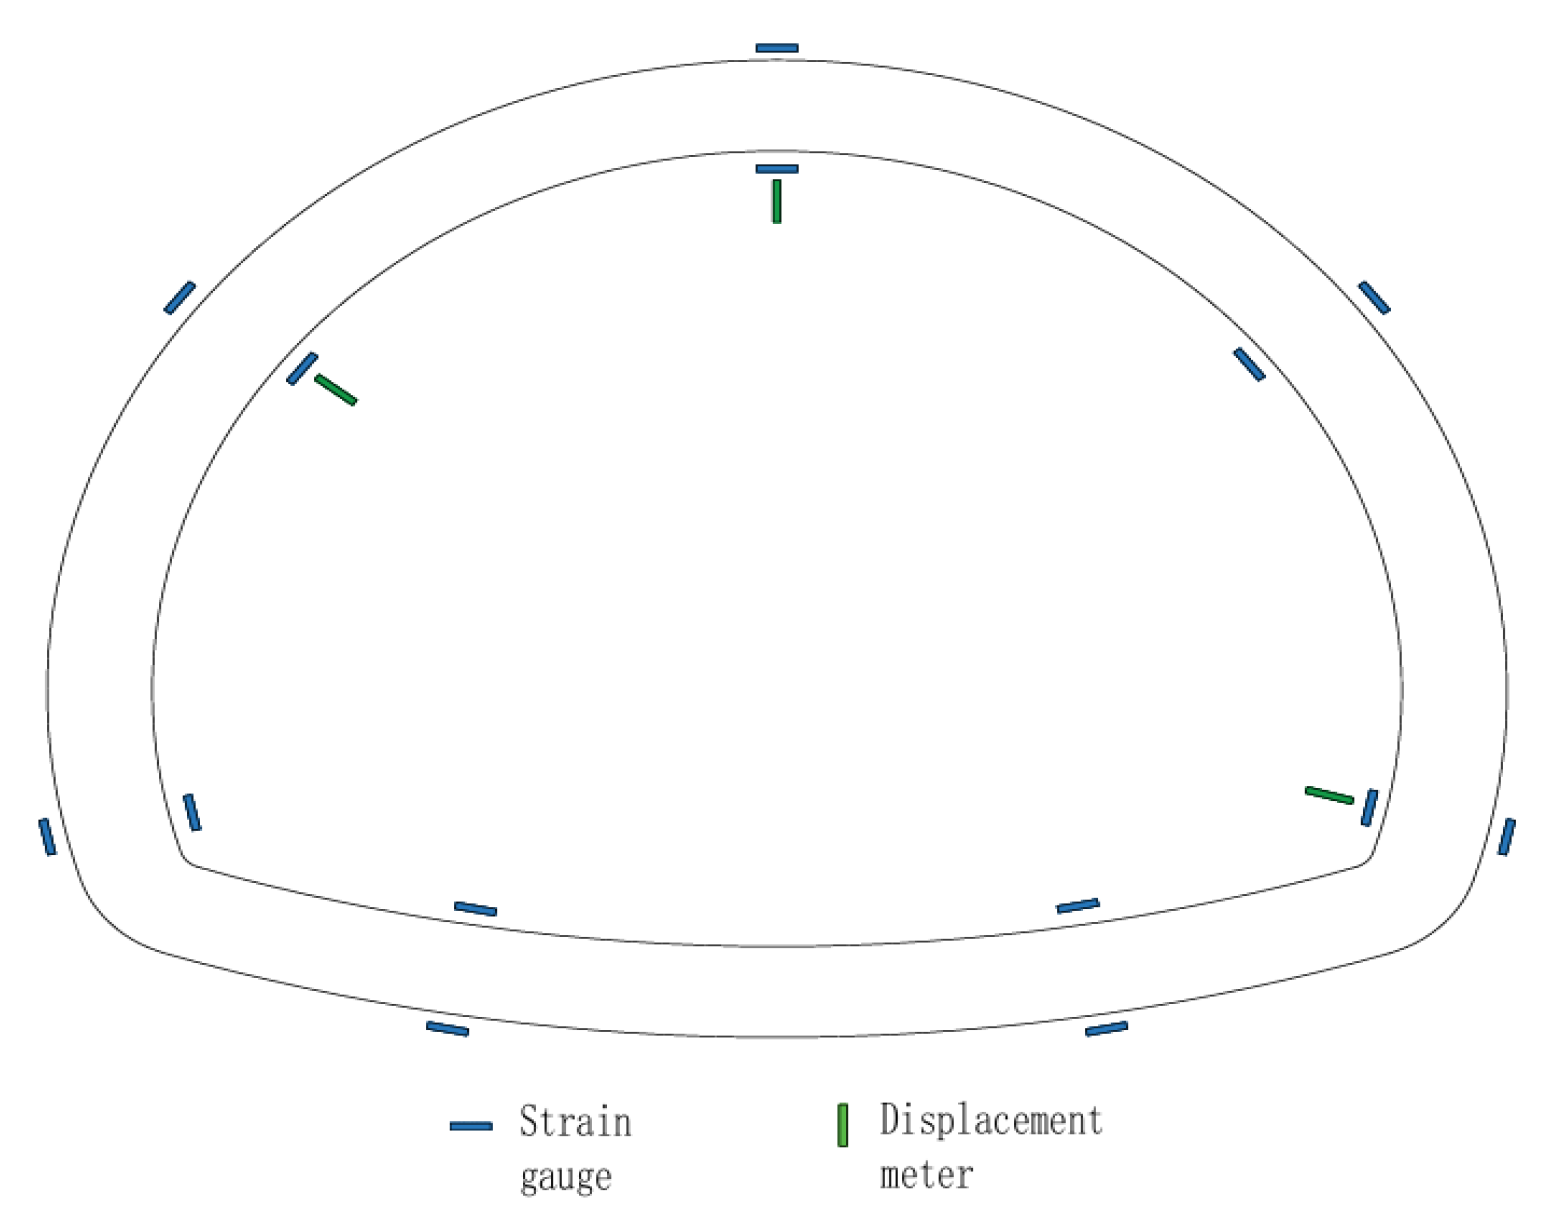
2.4. Monitoring System
3. Cast-In Situ Lining
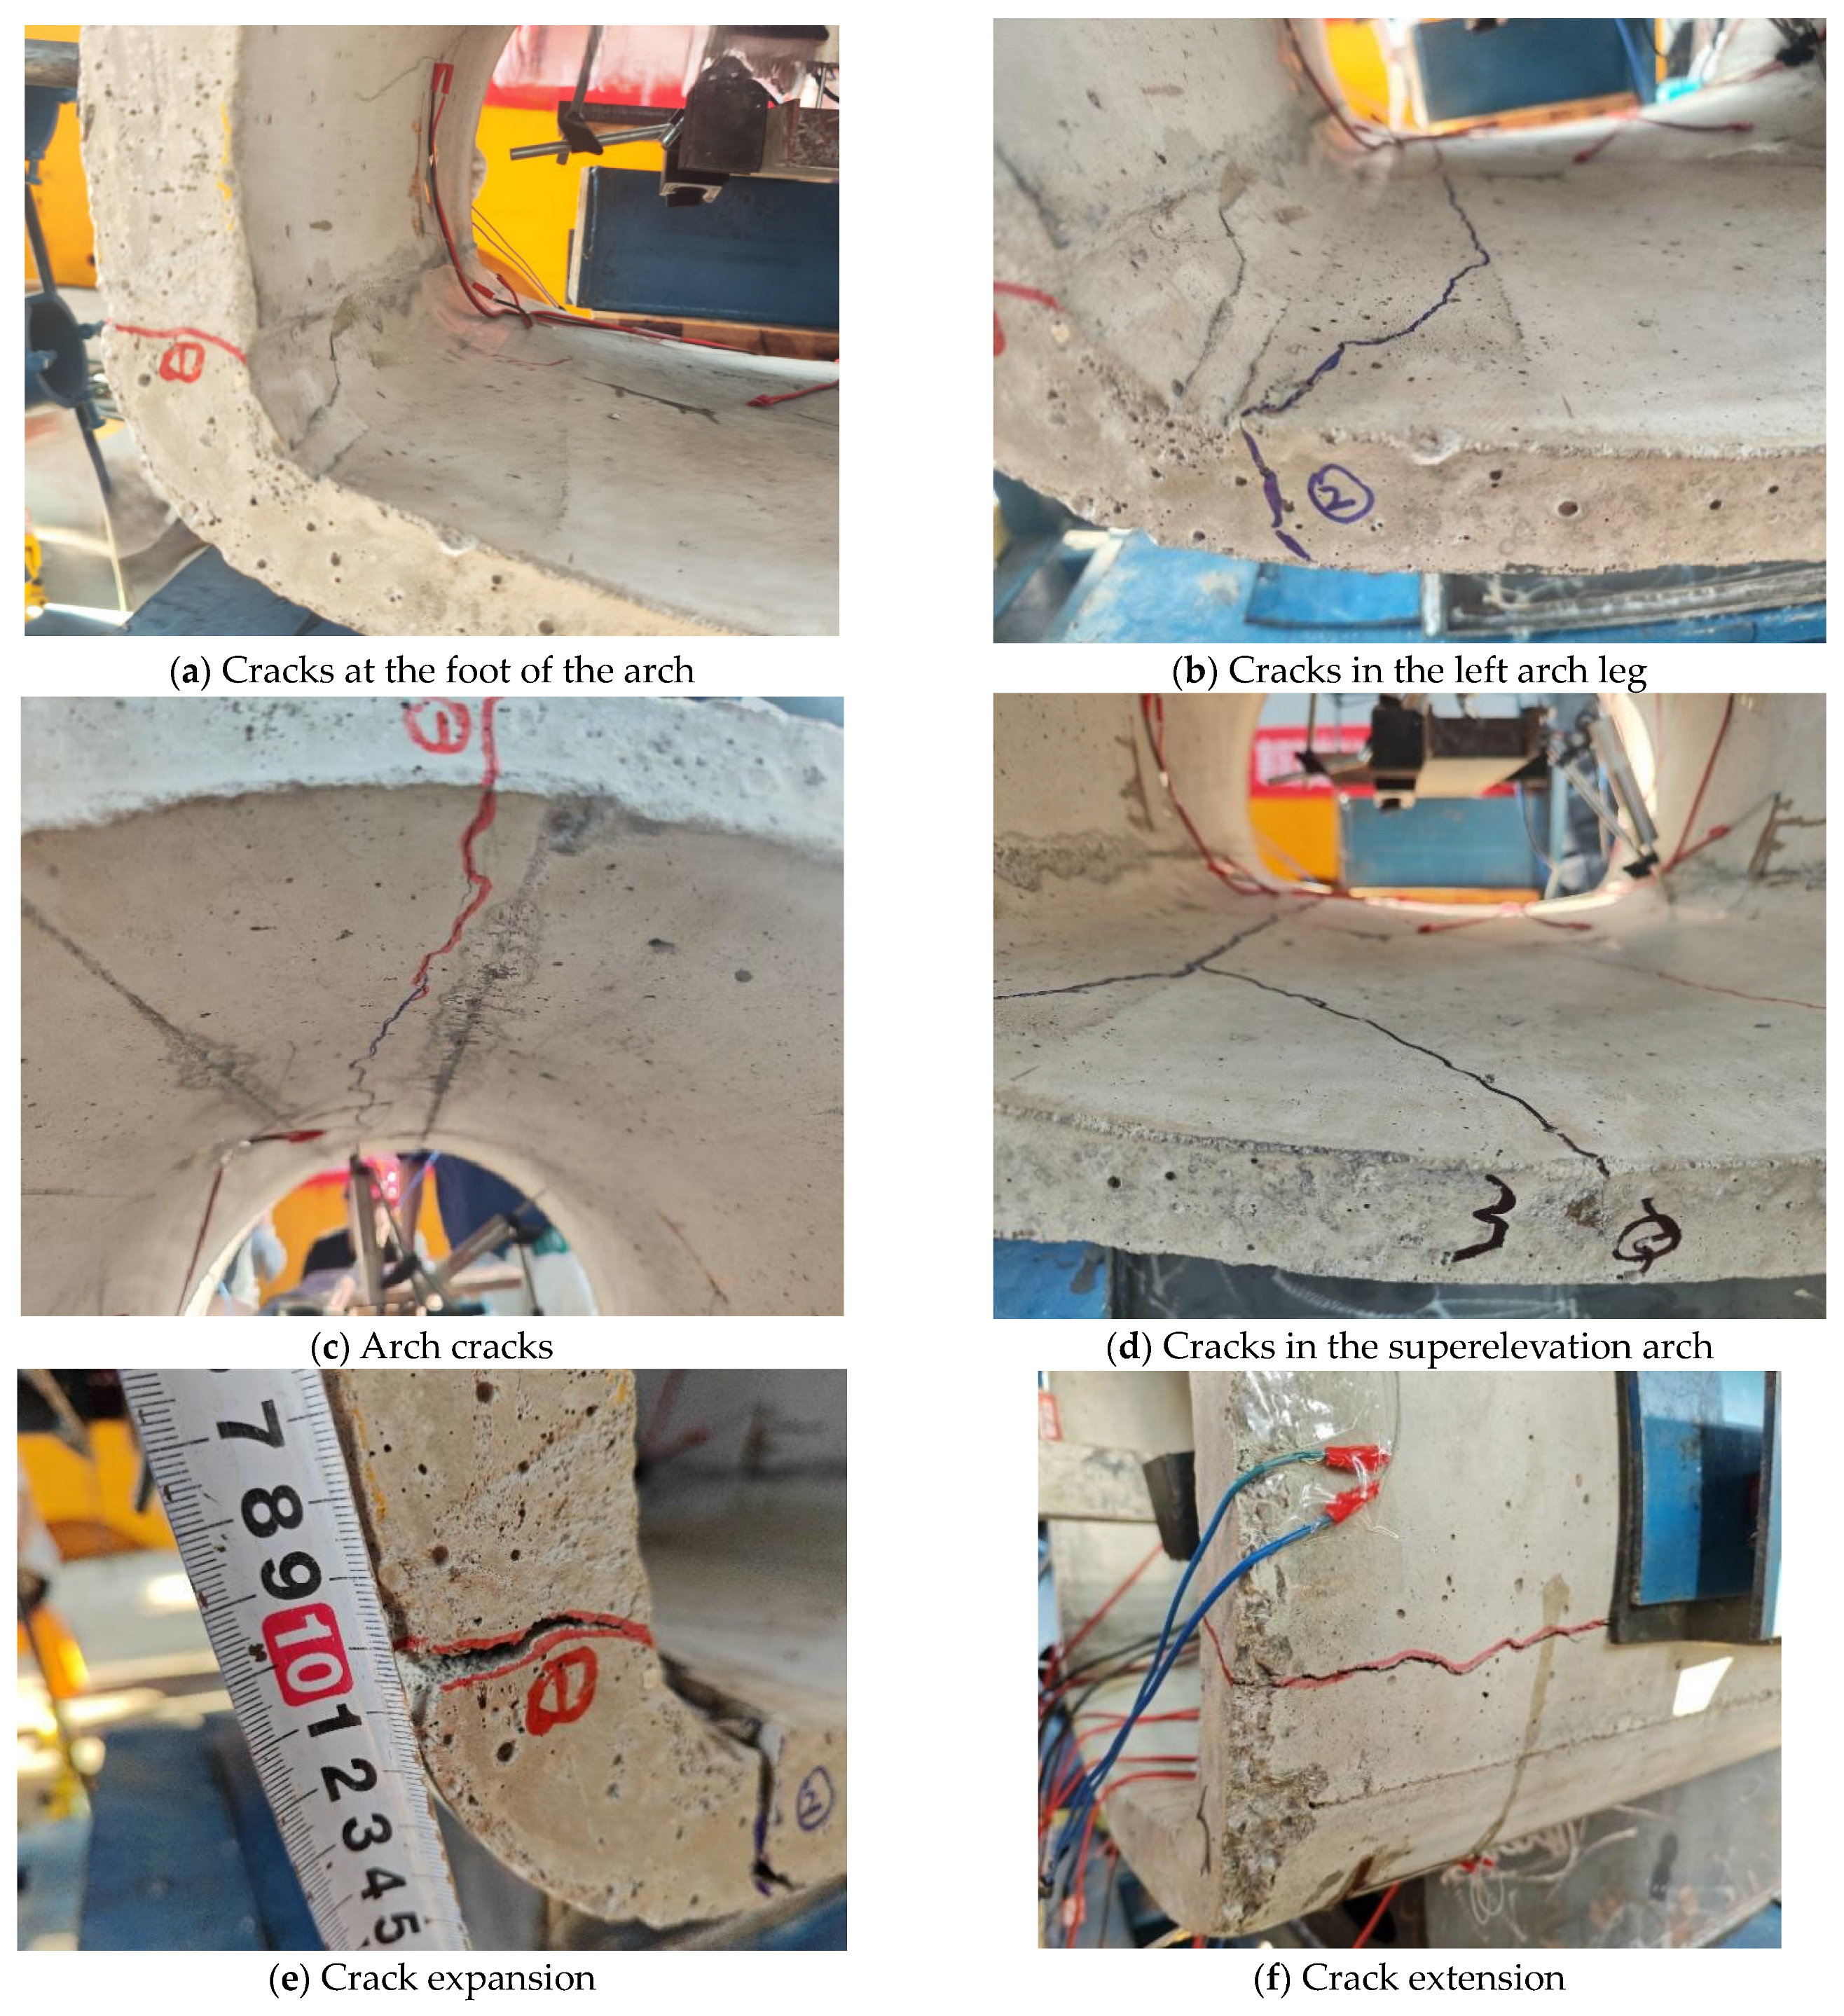
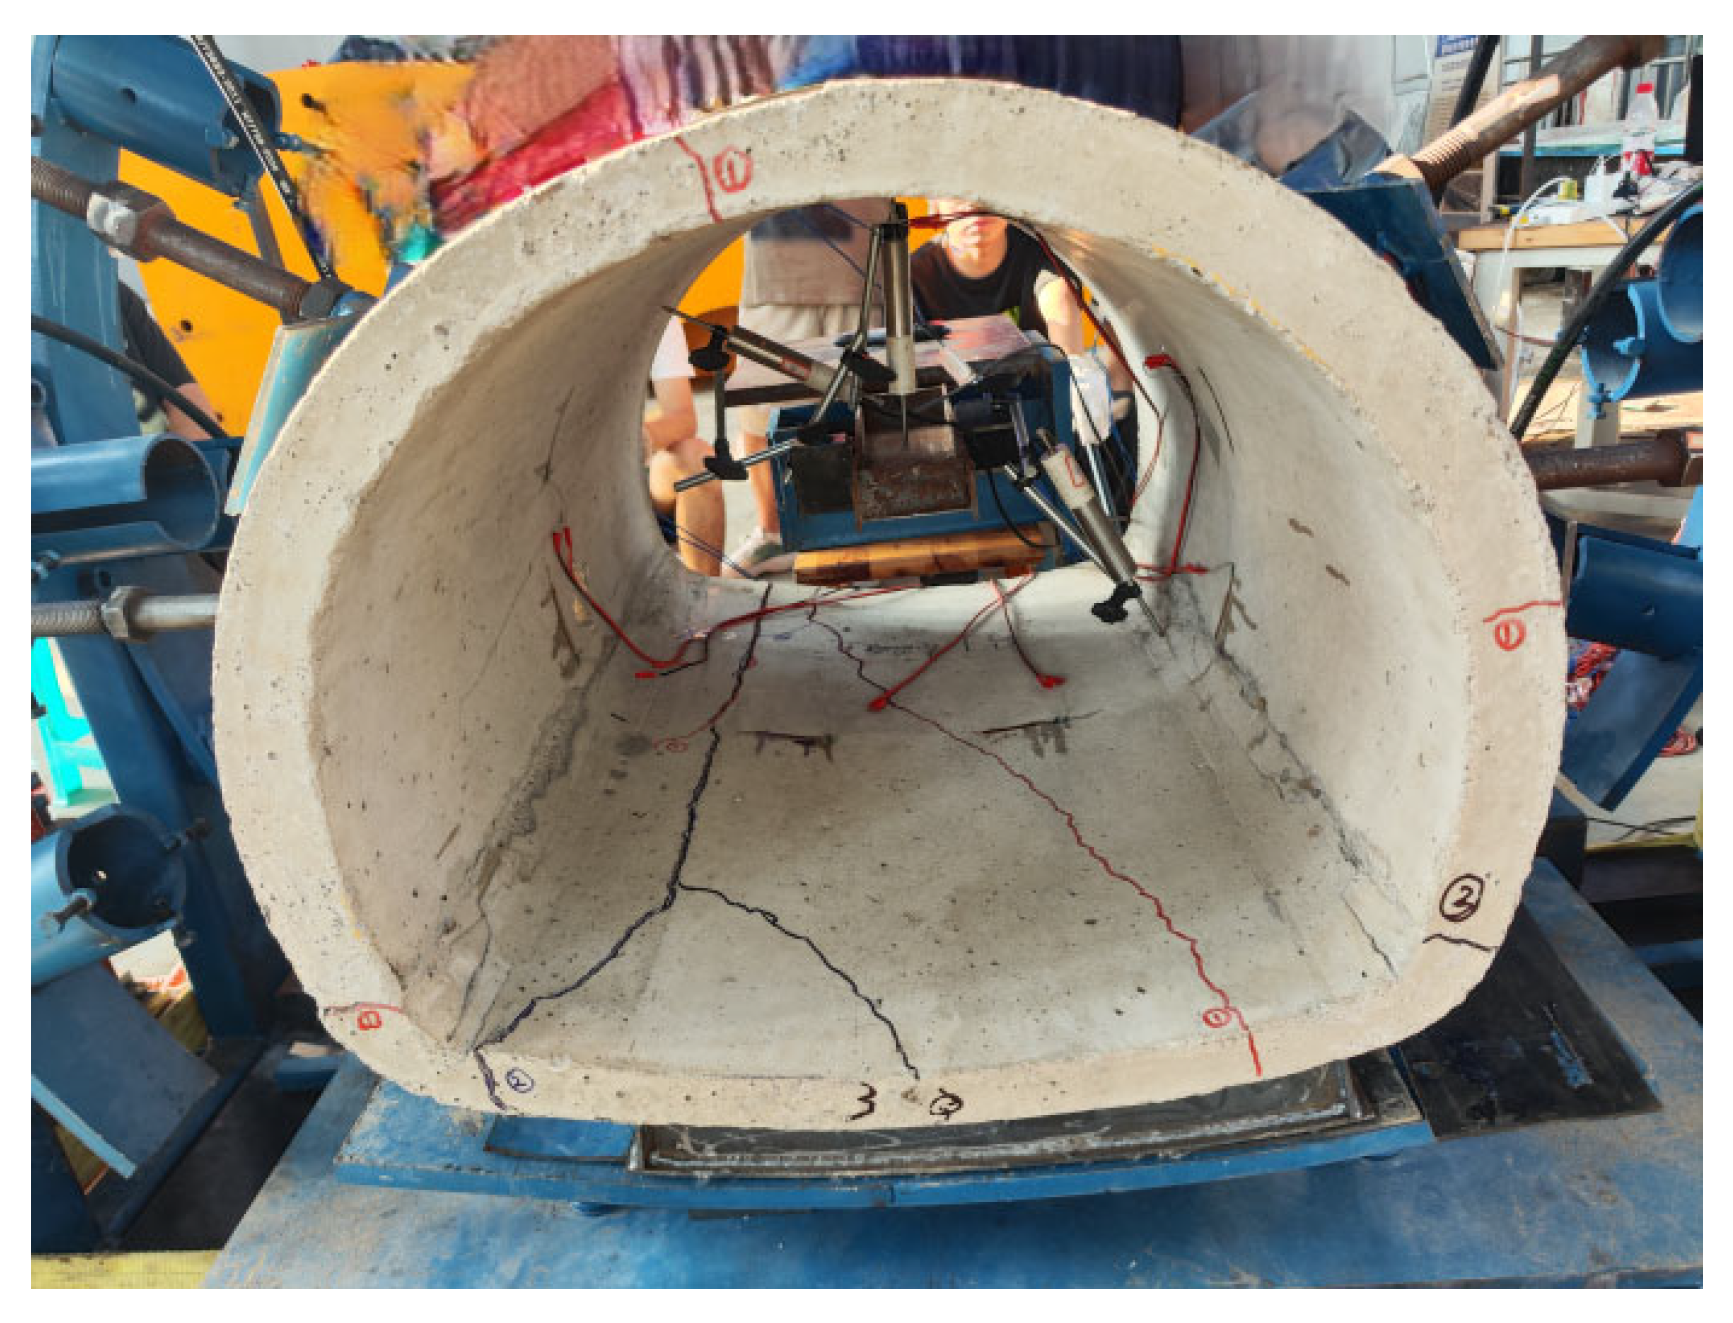
3.1. Structural Failure Process and Deformation
3.2. Analysis of Results
4. Three-Segment Prefabricated Lining
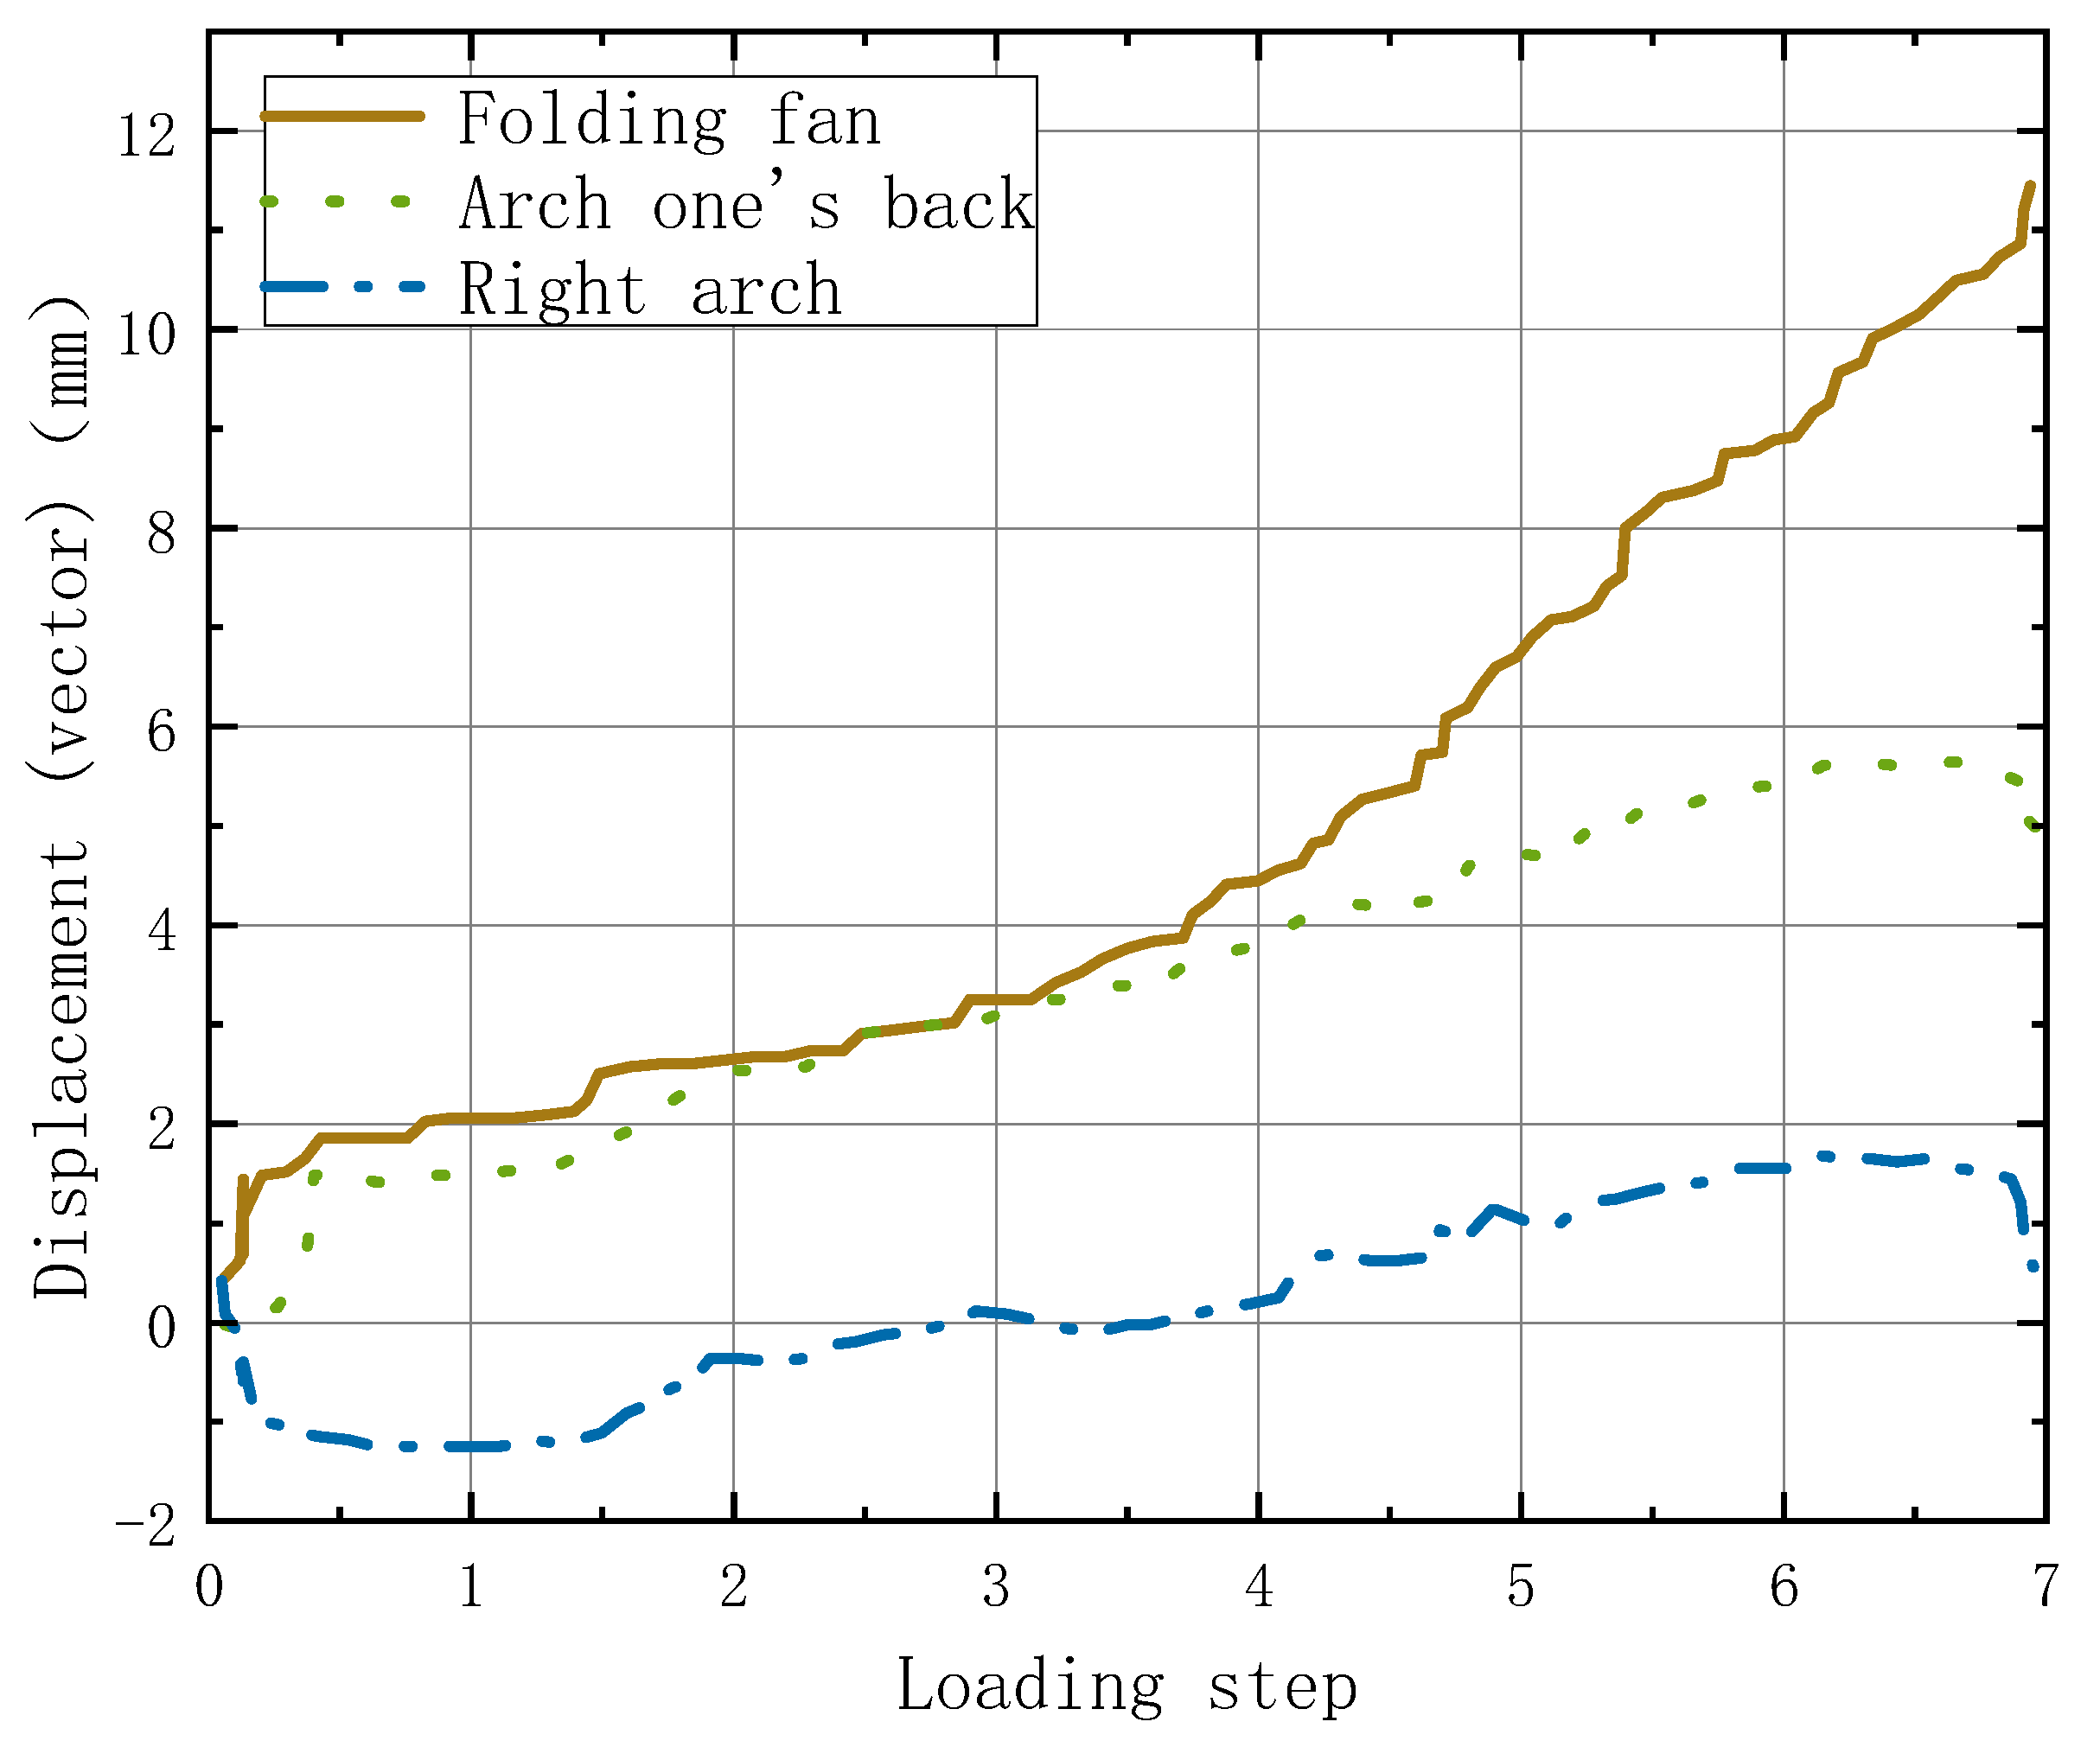
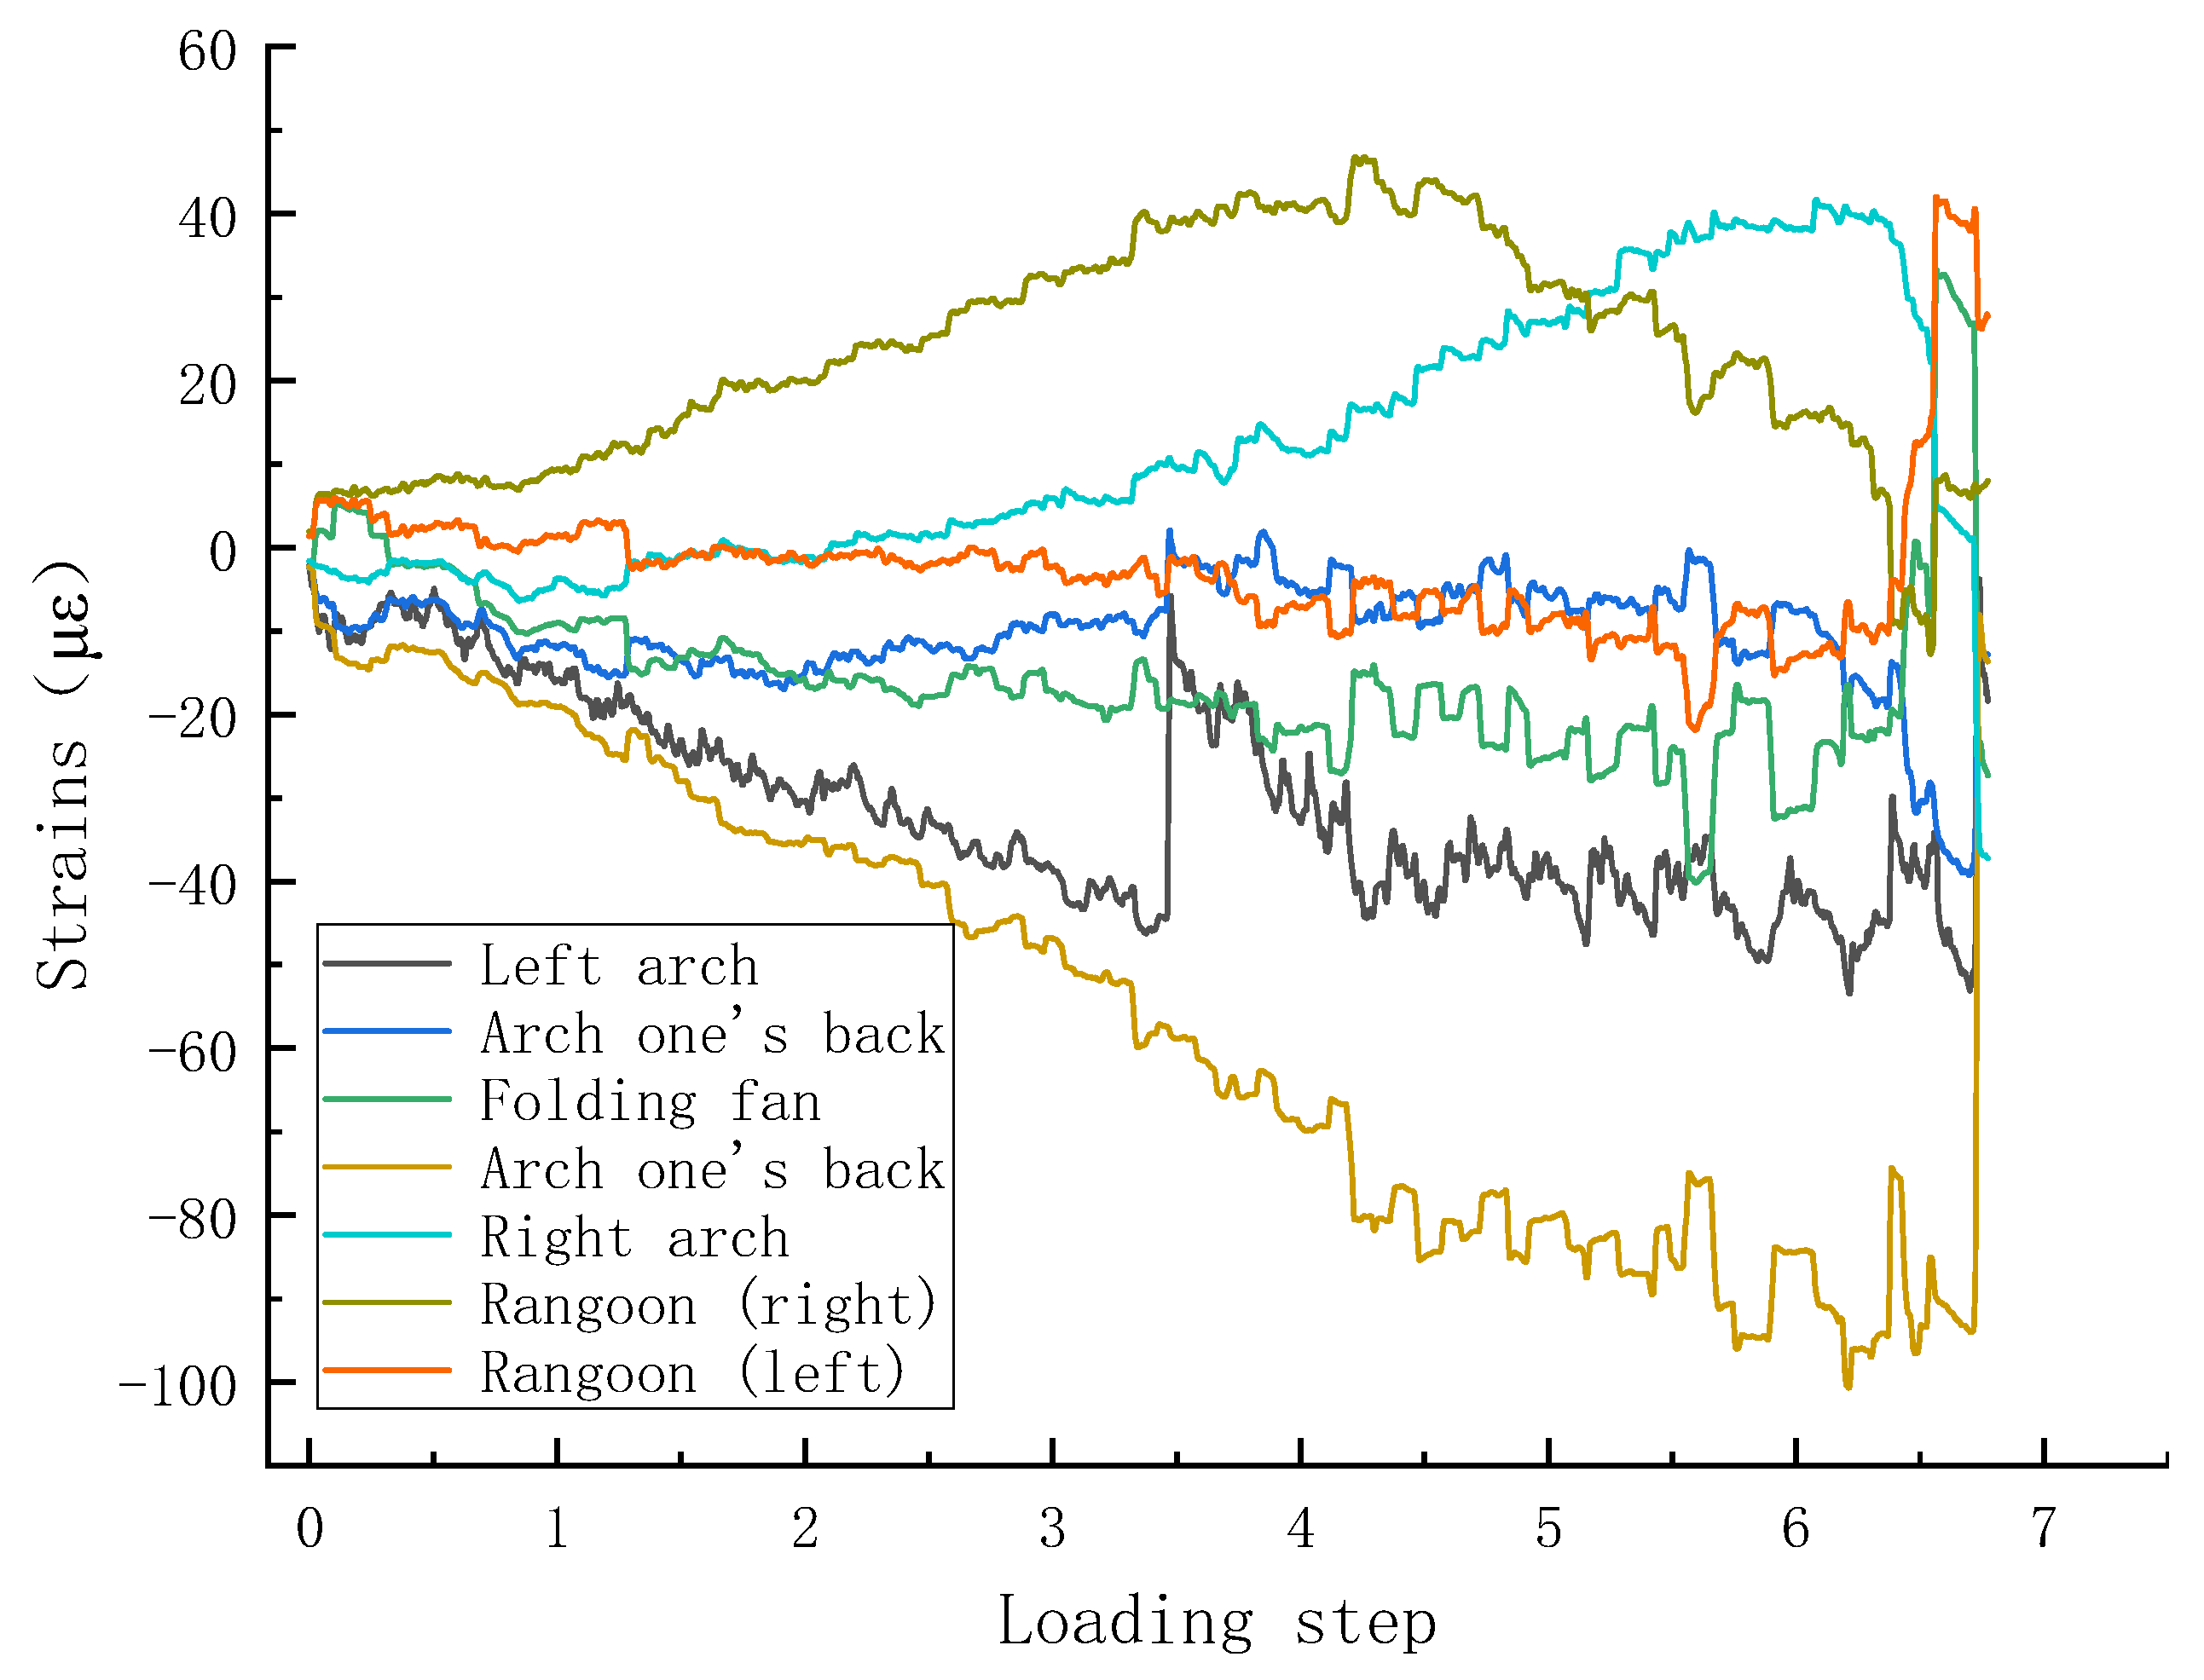
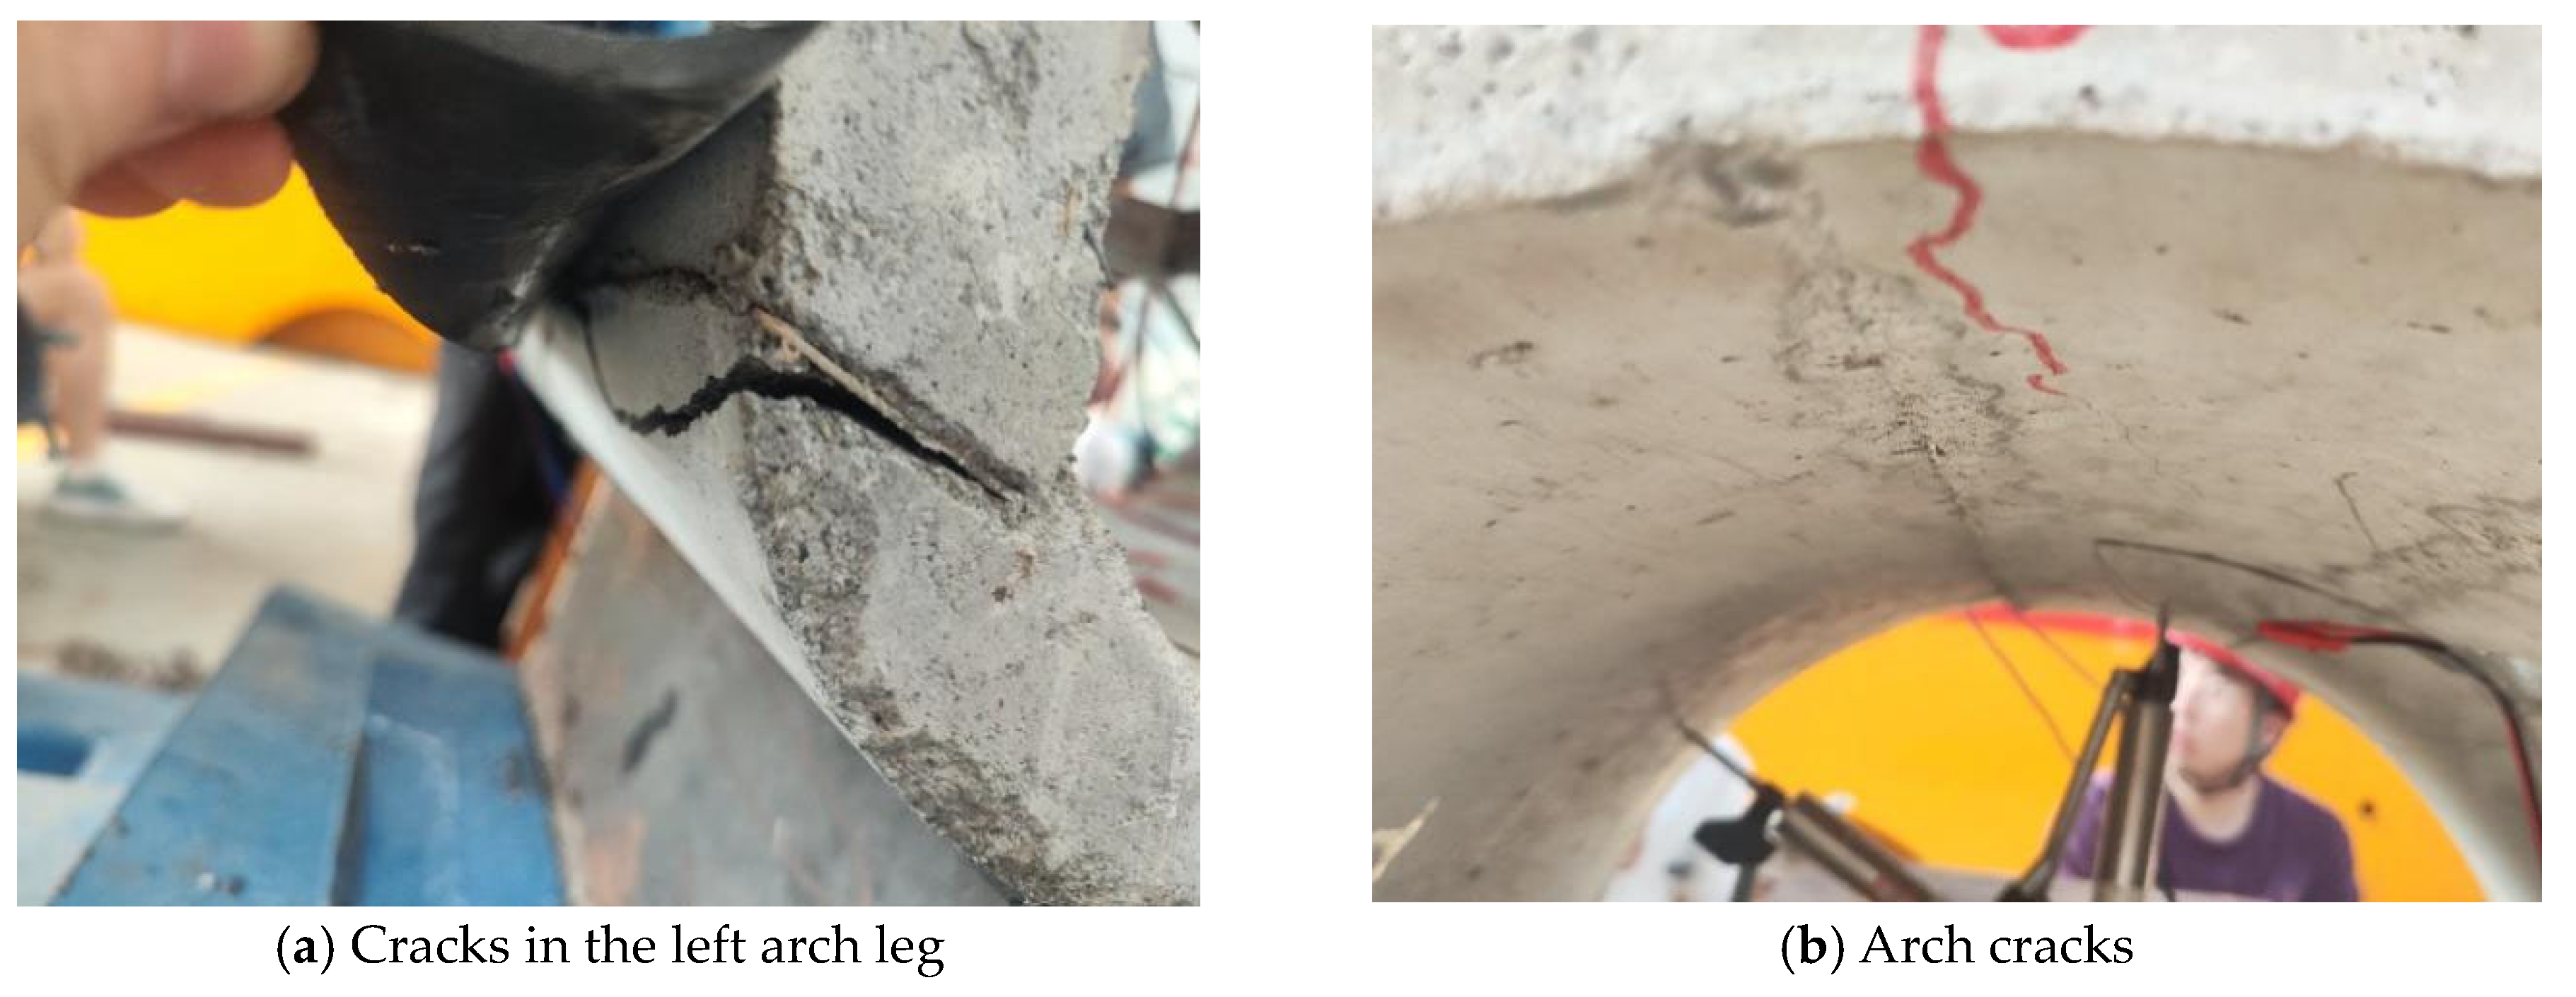
4.1. Structural Failure Process and Deformation
4.2. Analysis of Results
5. Load-Structure Model Finite Element Simulation
5.1. Model Parameters
5.2. Comparative Analysis
5.3. Safety Factor Analysis
6. Conclusions
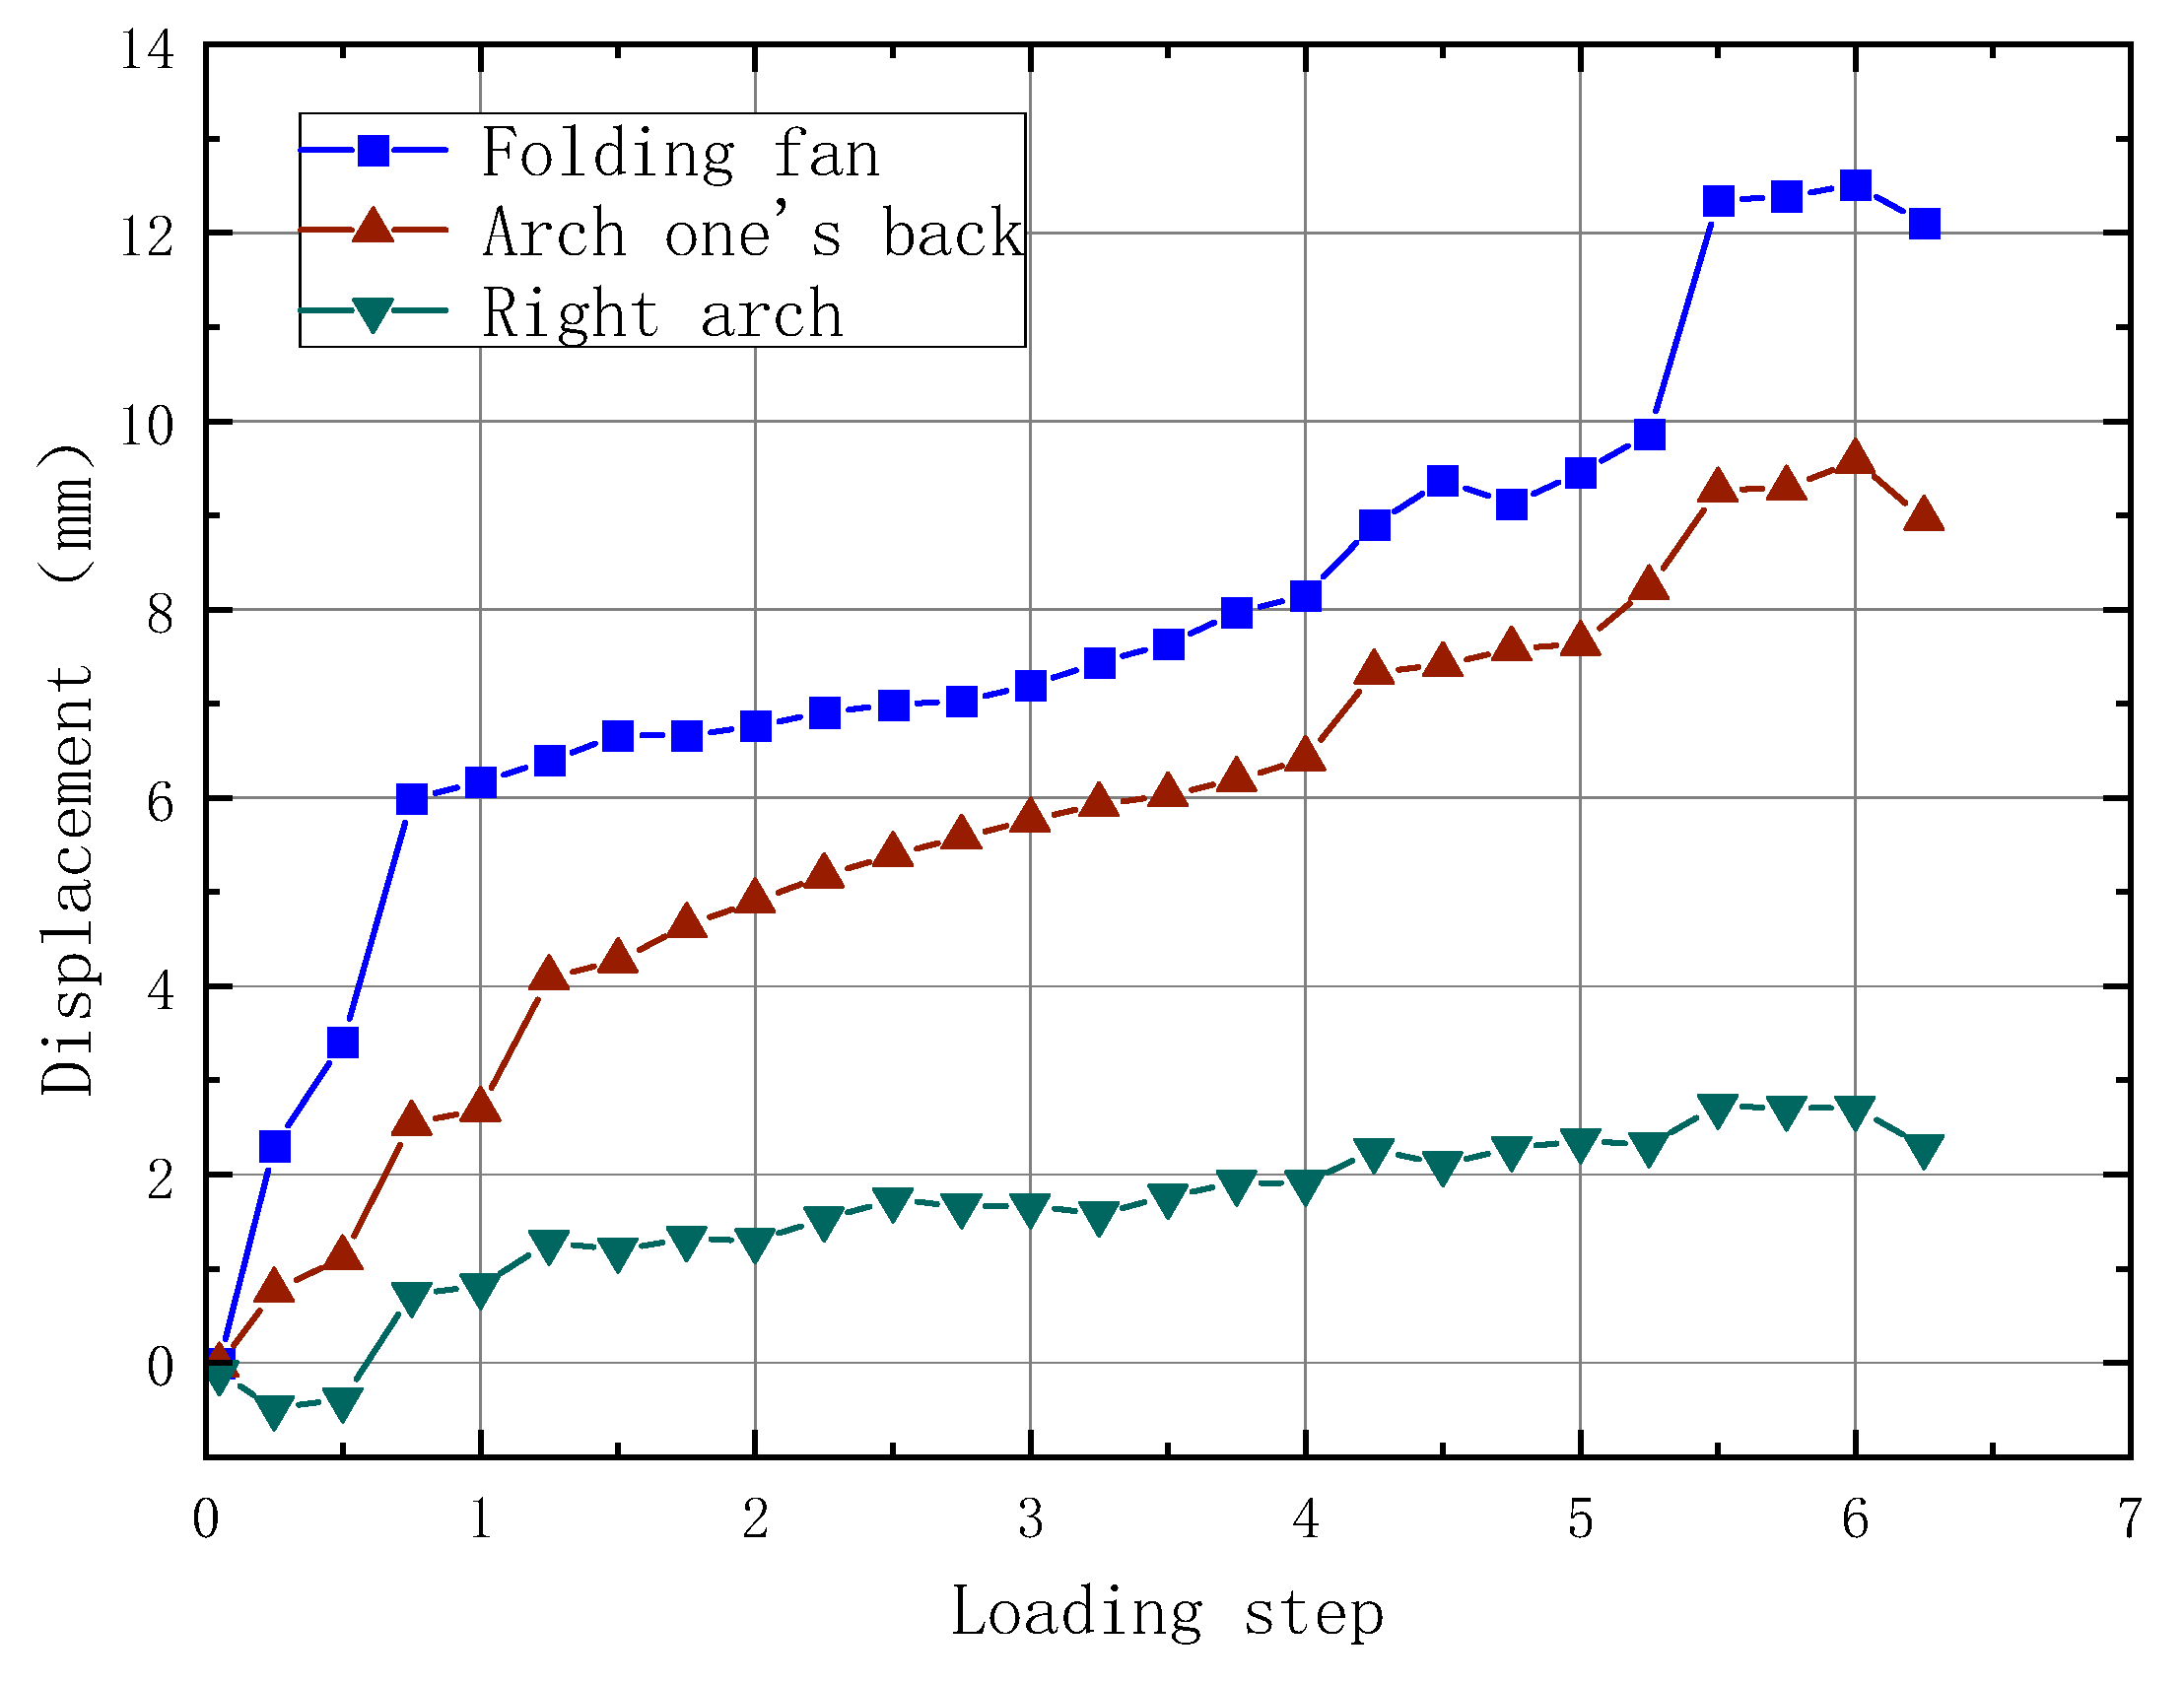
- Tests showed that the ultimate bearing capacity of the assembled lining (288 kPa) was 15.3 per cent lower than that of the cast-in-place lining (340 kPa), and that crack initiation and expansion were concentrated earlier in the joint area. The damage of the fully cast lining showed an overall tilt trend, while the assembled structure was damaged asymmetrically due to the lack of joint stiffness, with a maximum crack width of 12.7 mm and a significant increase in displacement.
- Numerical simulation results show that the joint stiffness has a significant role in regulating the mechanical properties of the block lining. When the joint stiffness is reduced from 50 MN-m/rad to 30 MN-m/rad, the structural bending moment is reduced by 37.7%, and the increase in transverse displacement is controlled within 6.38 mm, which indicates that the moderate reduction of the stiffness can improve the distribution of the internal force, but it is necessary to balance the demand for displacement control.
- In order to improve the stability of the assembled lining, it is recommended to apply preload to the joints during construction to eliminate the initial gap, and at the same time optimise the stiffness of the joints to the range of 20–30 MN-m/rad, so that the bending moment and displacement characteristics are close to those of the fully cast lining. In addition, it is necessary to strengthen the local reinforcement of the joints between the vault and the foot of the arch to inhibit crack expansion.
- The synergistic effect of surrounding rock and lining is not considered in this study, and the structural response under actual working conditions can be further analysed by a stratigraphic–structural model. At the same time, the influence of the material detail difference on the damage evolution in the scaled-down test needs to be verified by the prototype test. In the follow-up, further in-depth studies can be carried out on parameters such as fatigue damage and the durability of the lining.
Author Contributions
Funding
Data Availability Statement
Conflicts of Interest
References
- He, Q.; Chen, Z.; Yang, Y.; Qi, R.; Liu, S. Research on the application of new type assembled lining in railway tunnel constructed by mining method. Tunn. Constr. 2022, 42, 1491–1498. [Google Scholar]
- Pantelides, C.P.; Burkhart, B.A.; Reaveley, L.D.; Platt, D. Short-Span and Full-Scale Experime nts of a Prefabricated Composite Floor-Building System. J. Perform. Constr. Facil. 2016, 30, 04015018. [Google Scholar] [CrossRef]
- Tvede-Jensen, B.; Faurschou, M.; Kasper, T. A modelling approach for joint rotations of segmental concrete tunnel linings. Tunn. Undergr. Space Technol. 2017, 67, 61–67. [Google Scholar] [CrossRef]
- Wang, Y.; Zhang, Q. Construction technology of assembled lining structure of highway tunnel by drill and blast method. China Constr. 2021, 7, 122–123. [Google Scholar]
- Cha, H.; Tong, L.; Liu, S.; Zhan, F.; Li, H. Field experimental study on bearing performance of prefabricated assembled corrugated steel comprehensive pipe corridor. J. Southeast Univ. 2021, 51, 426–434. [Google Scholar]
- Xu, H.; Li, P.; Tan, Z. Study on load sharing ratio of assembled lining in road tunnel. Sci. Technol. Innov. 2022, 29, 128–131. [Google Scholar]
- Cui, T.; Zhang, J.; Liu, Y.; Guo, J. Study on the performance of assembled lining joints in urban railway cut-and-cover tunnels. Railw. Constr. 2019, 59, 76–78. [Google Scholar]
- Conforti, A.; Trabucchi, I.; Tiberti, G.; Plizzari, G.A.; Caratelli, A.; Meda, A. Precasttunnel segments for metro tunnel lining: A hybrid reinforcement solution using macro-synthetic fibers. Eng. Struct. 2019, 199, 109628. [Google Scholar] [CrossRef]
- Vivek, A.; Mamta, L. Singla prefabricated dowel(s) with fiberreinforced resin composite. Aust. Endod. J. 2017, 43, 23–28. [Google Scholar]
- Abbas, S.; Soliman, A.M.; Nehdi, M. Experimental studyon settlement and punching behavior of full-scale RC and $FRC precast tunnel liningsegments. Eng. Struct. 2014, 72, 1–10. [Google Scholar] [CrossRef]
- Yang, X.-R. Theory and Practice of Prefabricated Assembly Structure for Open Excavation Metro Station. Master’s Thesis, Beijing Jiaotong University, Beijing, China, 2020. [Google Scholar]
- Yang, X.-R.; Huang, M.-Q.; Lin, F. Research on the experimental scheme of grouted tongue-and-groove joints for prefabricated assembled structures in metro stations. Urban Express Railw. Transp. 2019, 32, 83–90. [Google Scholar]
- Yang, X.; Huang, M.; Lin, F. Research Strategies on New Prefabricated Technology for Underground Metro Stations. Urban Rail Transit 2019, 5, 145–154. [Google Scholar] [CrossRef]
- Feng, K. Research on Mechanical Behaviour of Tube Sheet Lining Structure of Large Section Underwater Shield Tunnel. Ph.D. Thesis, Southwest Jiaotong University, Chengdu, China, 2012. [Google Scholar]
- Qin, X. Study on the Mechanical Properties of ECC Materials and Assembled Joints in Tunnels. Master’s Thesis, Chongqing Jiaotong University, Chongqing, China, 2024. [Google Scholar] [CrossRef]
- Lin, Z.; Zhang, G.; Lin, S.; Gan, J. Study on flexural performance of joints in assembled arch cut-and-cover tunnels. Highway 2024, 69, 396–403. [Google Scholar]
- Yang, W.; Gao, H.; Yang, G.; Zhu, Q.; Jiang, S. Research on shear performance of prefabricated assembled tube sheet joints for large section rectangular tunnels. Mod. Tunn. Technol. 2022, 59 (Suppl. S1), 583–594. [Google Scholar]
- Hefny, A.M.; Chua, H.C. An investigation into the behaviour of jointed tunnel lining. Tunn. Undergr. Space Technol. Inc. Trenchless Technol. Res. 2005, 21, 428. [Google Scholar] [CrossRef]
- Zhang, Y.; Zhou, X.; Yu, B.; Li, X.; Zhang, C. Study on the method of precast assembled secondary lining blocking in mine method tunnels based on the contact friction-beam-joint model. Mod. Tunneling Technol. 2024, 61, 35–44. [Google Scholar]
- Guan, H.; Zhou, X.; Wang, C.; Xu, W.; Zhang, C.; Li, X. Research on block mode and construction method of Large-Span prefabricated assembled openings for high-speed railway. Constr. Technol. 2023, 52, 66–74+121. [Google Scholar]
- Zhao, Y.; Wang, Z.; Wang, Z. Research and Prospect of Prefabricated Assembly Construction Technology for Railway Tunnels. China Railw. 2020, 12, 51–60. [Google Scholar] [CrossRef]
- Zhang, S.; Liu, Y.; Wang, Z.; Ma, W.; Wang, Z. Sensitivity analysis of structural selection and joint parameters of prefabricated assembled lining in single line tunnel. Railw. Constr. 2019, 59, 43–46. [Google Scholar]
- Luo, Y. Study on the Bearing Performance of Prefabricated Assembled Elevated Arch Joints in Tunnels. Master’s Thesis, Southwest University of Science and Technology, Chengdu, China, 2023. [Google Scholar]
- NB/T 11011-2022; Design Code for Hydraulic Concrete Structures. China Water Resources and Hydropower Press: Beijing, China, 2022.


| Material Type | Compressive Strength (MPa) | Modulus of Elasticity (GPa) |
| C50 concrete | 38.4 | 3.5 |
| Similar material | 1.65 | 1.78 |
| Loading Stage | Crack Development Characteristics | Crack Width Range (mm) | Key Observations | Structural State |
|---|---|---|---|---|
| 0.6 Fu | Initial cracking observed above left springing, crown, right haunch, and invert. Initial cracks formed at the following locations: above the left springing, the crown, the right haunch, and the invert. | <0.1 (Subtle) | No spalling observed | End of elastic stage |
| 0.6–0.8 Fu | New cracking developed below left springing. Existing cracks propagated longitudinally. Cracks in the invert/right haunch remained stable. | 0.1–0.5 | Stress redistribution | Stable propagation stage |
| 0.8 Fu | The crack below left springing propagated towards the mid-section of the invert. New cracking emerged above right springing. A triangular cracking zone formed within the invert. | 0.5–3.0 | Initiation of rockfall at the crown | Accelerated propagation stage |
| 0.9 Fu | The crack above left springing developed into a through crack. The crack below left springing propagated through the invert to become a through crack. | 3.0–7.0 | Spalling area > 15% | Plastic failure stage |
| 1.0 Fu | No new cracking was observed. Existing cracks widened significantly (rapidly). | Above left springing: 7.0 Below left springing: 10.0 | Spalling area > 30% Structural inclination > 5° to the left | Ultimate limit state |
| Failure Stage | The crack network interconnected, forming a major failure path. | >10.0 | Global tilting instability | Loss of load-bearing capacity |
| Density (kg/m3) | Modulus of Elasticity (N/m2) | Poisson’s Ratio | Shear Expansion Angle (°) |
| 2500 | 3.45 × 10¹⁰ | 0.2 | 30 |
| Sports Event | Joint Stiffness (MN-m/rad) | |||||||
|---|---|---|---|---|---|---|---|---|
| 0 | 5 | 10 | 20 | 30 | 40 | 50 | All-Cast | |
| axial force (kN) | −1878.6 | −1866.2 | −1853.2 | −1837.5 | −1820.8 | −1806.3 | −1794.4 | −1749.0 |
| kyphosis rectangle (kN-m) | 268.6 | 252.3 | 241.8 | 229.4 | 220.5 | 256.5 | 287.8 | 354.2 |
| transverse displacement (mm) | 7.83 | 7.41 | 6.94 | 6.55 | 6.38 | 6.19 | 6.03 | 5.28 |
| vertical displacement (mm) | −21.82 | −21.36 | −20.81 | −20.24 | −19.72 | −18.55 | −18.28 | −17.74 |
| Location | Joint Stiffness (MN-m/rad) | |||||||
|---|---|---|---|---|---|---|---|---|
| 0 | 5 | 10 | 20 | 30 | 40 | 50 | Monolithic Lining | |
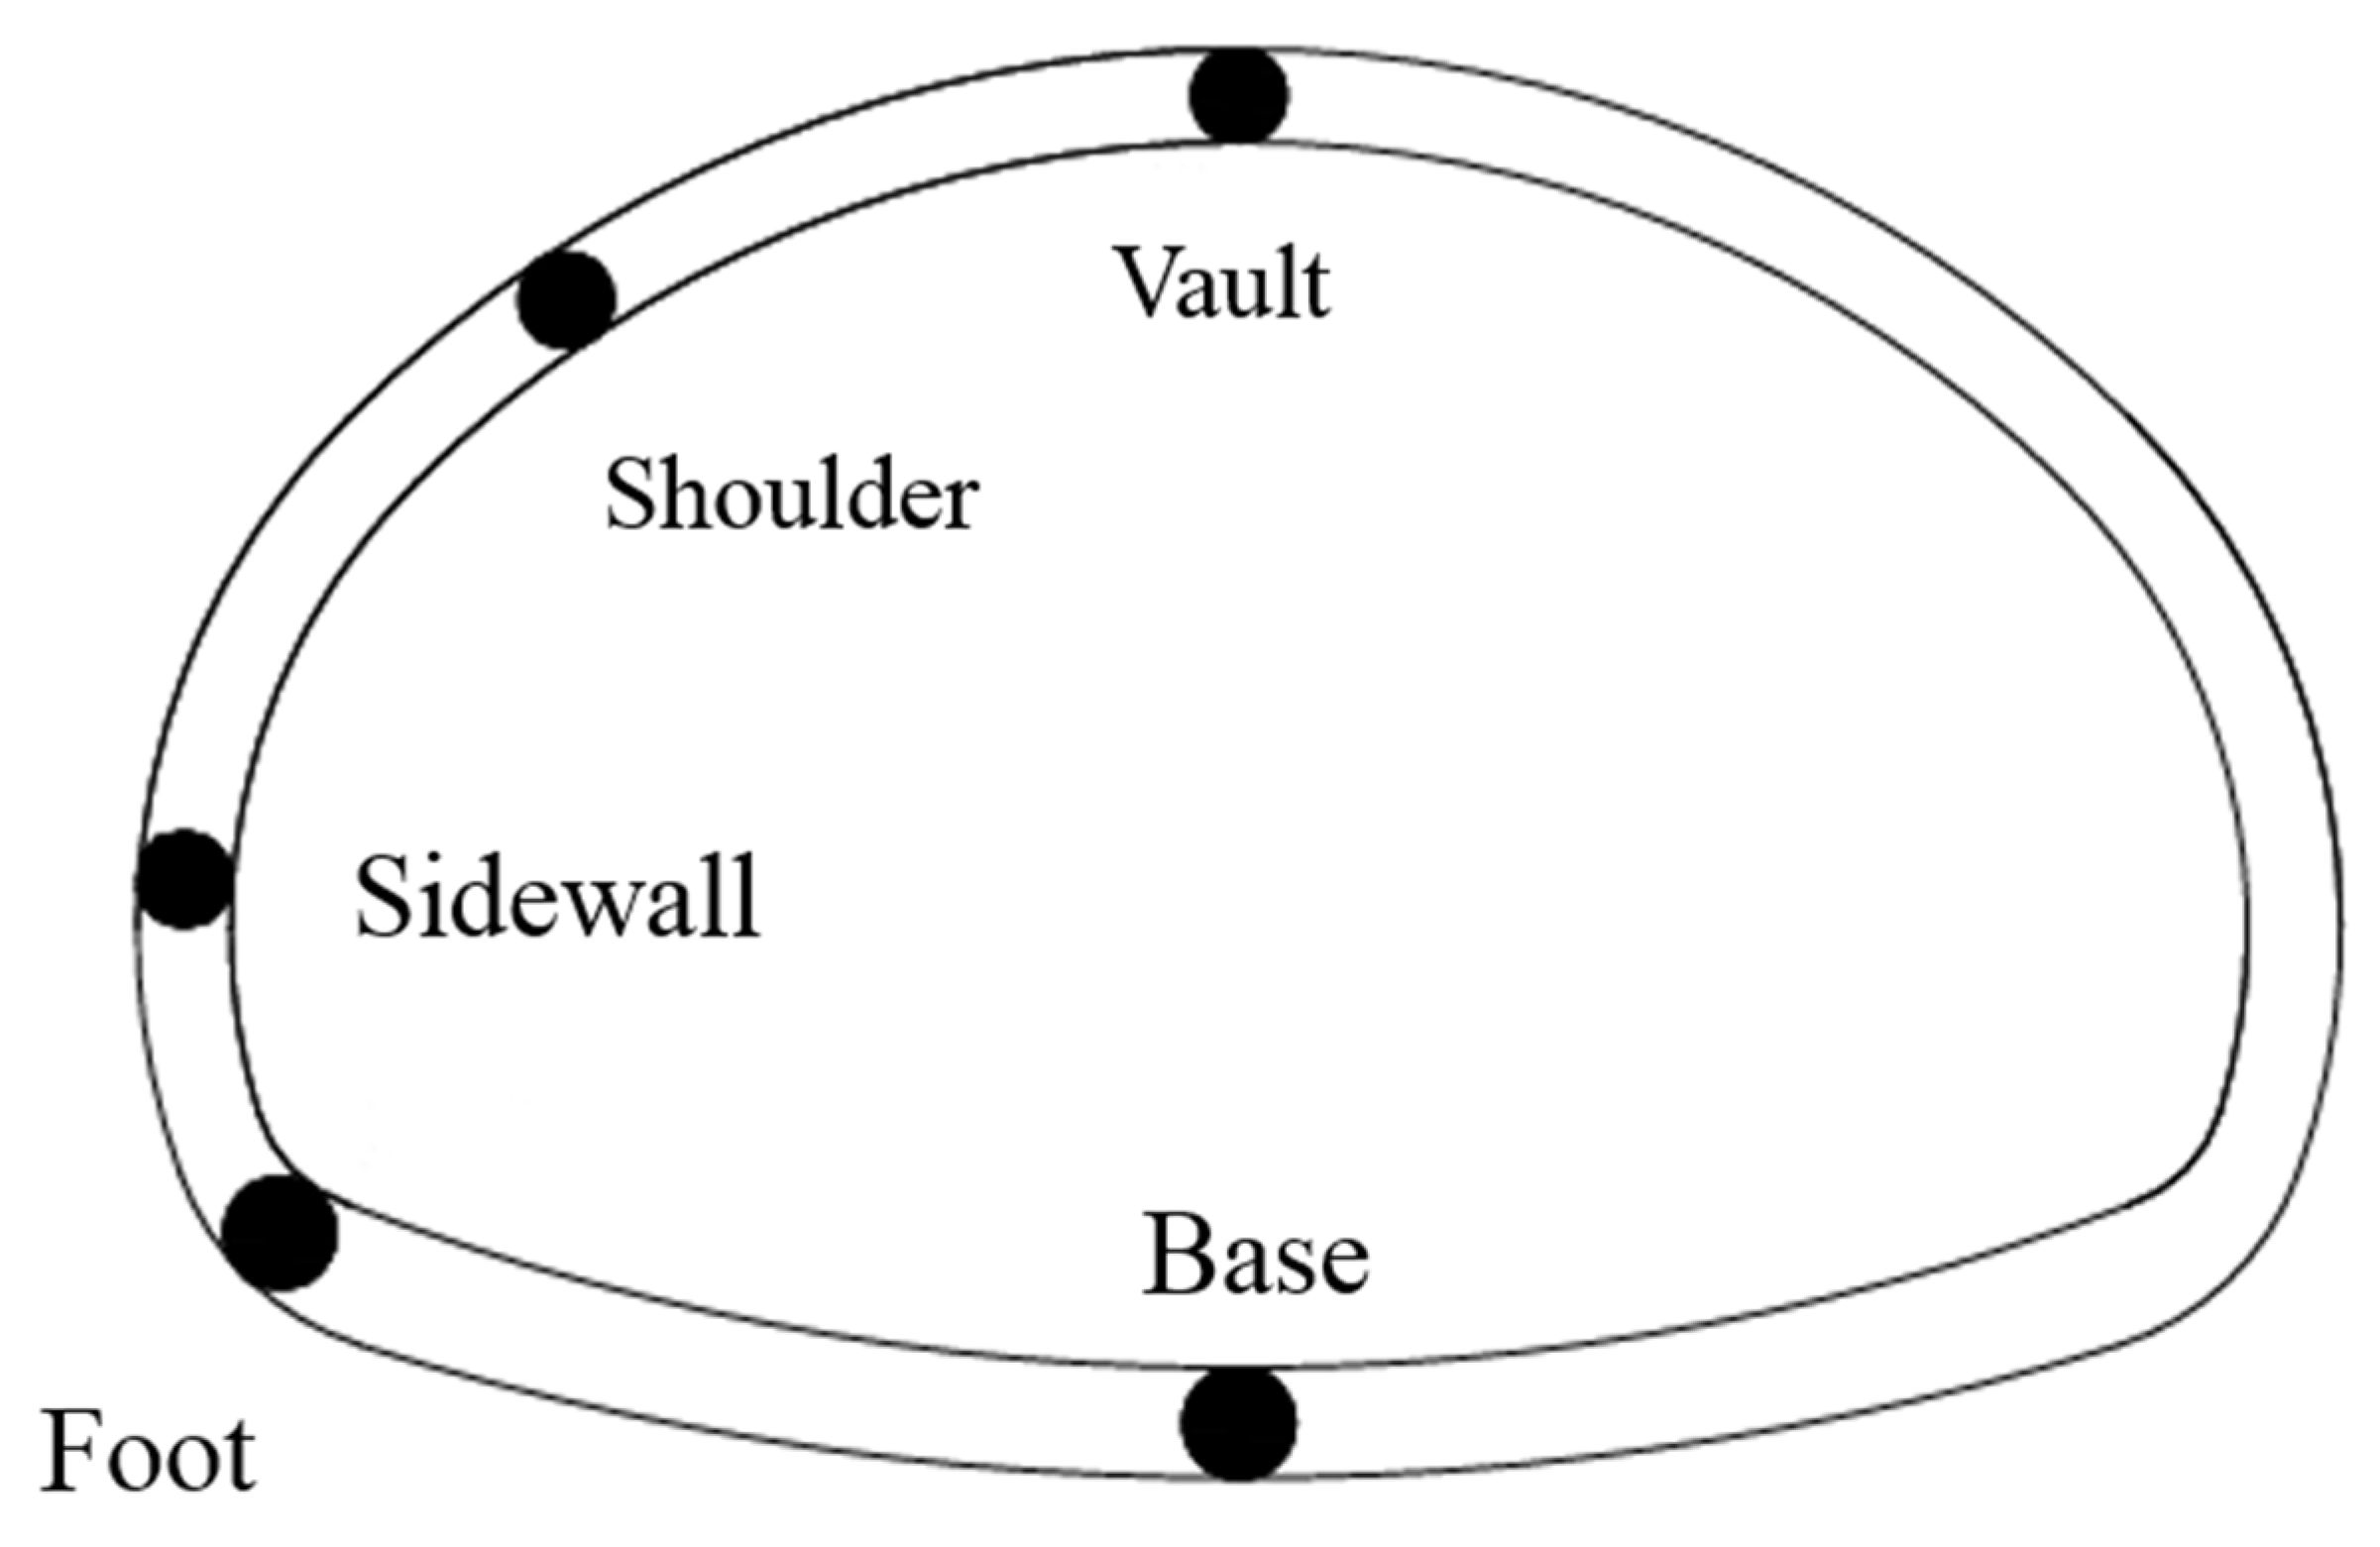
| Vault | 35.1 | 34.2 | 33.0 | 31.9 | 30.8 | 29.8 | 28.6 | 25.4 |
| Shoulder | 19.6 | 18.9 | 18.3 | 17.9 | 17.6 | 17.4 | 17.2 | 14.6 |
| Sidewall | 8.6 | 8.9 | 9.2 | 9.4 | 9.6 | 10.2 | 10.8 | 11.1 |
| Foot | 12.1 | 12.0 | 12.0 | 11.9 | 11.8 | 11.6 | 11.6 | 10.5 |
| Base | 17.0 | 17.0 | 16.9 | 16.9 | 16.8 | 16.8 | 16.7 | 16.4 |
Disclaimer/Publisher’s Note: The statements, opinions and data contained in all publications are solely those of the individual author(s) and contributor(s) and not of MDPI and/or the editor(s). MDPI and/or the editor(s) disclaim responsibility for any injury to people or property resulting from any ideas, methods, instructions or products referred to in the content. |
© 2025 by the authors. Licensee MDPI, Basel, Switzerland. This article is an open access article distributed under the terms and conditions of the Creative Commons Attribution (CC BY) license (https://creativecommons.org/licenses/by/4.0/).
Share and Cite
Wu, L.-M.; Li, H.-K.; Gao, F.; Wang, Z.-J.; Zhang, B.; Luo, W.-J.; Li, J.-J. Experimental Study on Mechanical Differences Between Prefabricated and Cast-In Situ Tunnel Linings Based on a Load-Structure Model. Buildings 2025, 15, 2522. https://doi.org/10.3390/buildings15142522
Wu L-M, Li H-K, Gao F, Wang Z-J, Zhang B, Luo W-J, Li J-J. Experimental Study on Mechanical Differences Between Prefabricated and Cast-In Situ Tunnel Linings Based on a Load-Structure Model. Buildings. 2025; 15(14):2522. https://doi.org/10.3390/buildings15142522
Chicago/Turabian StyleWu, Li-Ming, Hong-Kun Li, Feng Gao, Zi-Jian Wang, Bin Zhang, Wen-Jie Luo, and Jun-Jie Li. 2025. "Experimental Study on Mechanical Differences Between Prefabricated and Cast-In Situ Tunnel Linings Based on a Load-Structure Model" Buildings 15, no. 14: 2522. https://doi.org/10.3390/buildings15142522
APA StyleWu, L.-M., Li, H.-K., Gao, F., Wang, Z.-J., Zhang, B., Luo, W.-J., & Li, J.-J. (2025). Experimental Study on Mechanical Differences Between Prefabricated and Cast-In Situ Tunnel Linings Based on a Load-Structure Model. Buildings, 15(14), 2522. https://doi.org/10.3390/buildings15142522