Article

Mechanical Behavior of Fly-Ash Geopolymer Under Stray-Current and Soft-Water Coupling

1
Shaanxi Key Laboratory of Safety and Durability of Concrete Structures, Xijing University, Xi’an 710123, China
2
School of Civil Engineering, Dalian University of Technology, Dalian 116023, China
3
College of Hydraulic and Environmental Engineering, China Three Gorges University, Yichang 443002, China
*
Author to whom correspondence should be addressed.
Buildings 2025, 15(14), 2514; https://doi.org/10.3390/buildings15142514
Submission received: 19 June 2025 / Revised: 12 July 2025 / Accepted: 16 July 2025 / Published: 17 July 2025
(This article belongs to the Section Building Materials, and Repair & Renovation)

Abstract

Stray-current and soft-water leaching can induce severe corrosion in reinforced concrete structures and buried metal pipelines within subway environments. The effects of water-to-binder ratio (W/C), modulus of sodium silicate (Ms), and alkali content (AC) on the mechanical properties of fly-ash-based geopolymer (FAG) at various curing ages were investigated. The influence of curing temperature and high-temperature curing duration on the development of mechanical performance were examined, and the optimal curing regime was determined. Furthermore, based on the mix design of FAG resistant to coupled erosion from stray-current and soft-water, the effects of stray-current intensity and erosion duration on the coupled erosion behavior were analyzed. The results indicated that FAG exhibited slow strength development under ambient conditions. However, thermal curing at 80 °C for 24 h markedly improved early-age strength. The compressive strength of FAG exhibited an increase followed by a decrease with increasing W/B, Ms, and AC, with optimal ranges identified as 0.28–0.34, 1.0–1.6, and 4–7%, respectively. Soft-water alone caused limited leaching, while the presence of stray-current significantly accelerated degradation, with corrosion rates increasing by 4.1 and 7.2 times under 20 V and 40 V, respectively. The coupled corrosion effect was found to weaken over time and with increasing current intensity. Under coupled leaching conditions, compressive strength loss of FAG was primarily influenced by AC, with lesser contributions from W/B and Ms. The optimal mix proportion for corrosion resistance was determined to be W/B of 0.30, Ms of 1.2, and AC of 6%, under which the compressive strength after corrosion achieved the highest value, thereby significantly improving the durability of FAG in harsh environments such as stray-current zones in subways.

1. Introduction

Against the backdrop of sustainable development and the national “dual carbon” strategy, the research and application of green and low-carbon construction materials have been increasingly regarded as a key focus in the field of engineering materials [1,2,3,4]. As a novel inorganic cementitious material, geopolymers have been widely attracted in recent years due to their excellent mechanical properties, high corrosion resistance, and environmental sustainability [4,5,6]. The concept of geopolymers was first introduced by the French scholar Davidovits in the 1970s [7]. Essentially, geopolymers are aluminosilicate materials, in which a 3D amorphous to semi-crystalline network structure is formed through alkali activation. These materials can be synthesized from industrial by-products such as fly-ash and slag, thereby not only alleviating the environmental burden associated with industrial waste disposal, but also significantly reducing carbon emissions and energy consumption.
From an ecological perspective, geopolymers have been reported to reduce carbon footprint by up to 50% and energy demand by approximately 25% [8,9,10]. Studies have demonstrated that geopolymer materials exhibit excellent thermal resistance. Wastiels et al. [11] observed that fly-ash derived from coal combustion possesses a certain degree of alkali reactivity, suggesting its potential for geopolymer synthesis. This finding has accelerated the resource utilization of industrial solid wastes in geopolymer production. Furthermore, when immersed in 5% acetic and sulfuric acid solutions for 28 days, geopolymers were found to exhibit significantly lower mass and compressive strength losses compared to ordinary Portland cement (OPC) materials, indicating superior acid resistance [12]. These results suggest that geopolymers outperform OPC in acid environments. In addition, geopolymers have demonstrated enhanced resistance to sulfate attack, chloride ion penetration, and carbonation in comparison to conventional cement-based materials [13,14,15].
However, underground infrastructure is not only exposed to the long-term attack from corrosive agents such as chlorides and sulfates present in groundwater, but its service life may also be affected by stray-currents [16,17,18,19]. Stray-currents refer to unintended electrical currents that deviate from their designated pathways and are commonly encountered in urban subway systems, light rail networks, and other direct current (DC) electrified railway systems [20,21,22]. Among these, DC stray-currents are particularly harmful, with corrosion capabilities reported to be 20 to 100 times greater than those of alternating current stray-currents of equivalent intensity [23]. Through electrolysis action, stray-currents accelerate both the corrosion of steel reinforcement and the dissolution of surrounding materials by forming electrolytic corrosion cells, thereby significantly reducing the durability and safety of concrete structures. When coupled with corrosive ions in groundwater, the degradation process is further intensified, as ion migration and diffusion within the concrete matrix are enhanced, posing a serious threat to the service life of underground infrastructure [24,25].
Aghajani et al. [26] employed a stray-current simulation apparatus to investigate the combined effects of stray-current and soft-water on the permeability of concrete with varying water-to-binder (W/B) ratios and silica fume contents. Experimental results indicated that silica fume incorporation significantly increased the electrical resistivity of concrete, leading to a reduction in electric flux. Moreover, the resistivity degradation and the increase in electric flux after current application were both mitigated in concrete specimens containing silica fume. Meanwhile, other researchers [27,28,29] have reported that the presence of stray-currents can deteriorate the pore structure of concrete, reduce its electrical resistivity, and facilitate the ingress of corrosive ions—particularly chloride and sulfate—which are highly detrimental and to both reinforcement and the cementitious matrix, causing severe damage. Chloride ions are known to break down the passive film on steel surfaces, triggering localized corrosion, while sulfate ions tend to react with hydration products to form expansive corrosion compounds, thereby exacerbating cracking. In addition, under the influence of an applied electric field, cations such as Na+, K+, and Ca2+ migrate toward the cathode, while anions including OH, Cl, and S O 4 2 migrate toward the anode [30]. This ion migration accelerates the electrolytic process and alters the spatial distribution of corrosive species, thereby impacting the overall performance and durability of the material.
To address corrosion issues caused by stray-current, several studies have attempted to improve the durability of cement-based materials by incorporating mineral admixtures such as fly-ash, slag, and silica fume [31,32,33]. While these approaches have shown some improvement, most existing studies focus primarily on individual corrosion factors and rarely consider their combined effects under realistic service conditions. In this study, FAG was selected as the target material due to its potential for enhanced durability and environmental benefits. The coupled deterioration effects of stray-current and soft-water were experimentally reproduced to simulate actual underground service conditions. The evolution of mechanical properties and associated microstructural degradation mechanisms were systematically investigated. This work fills a critical research gap by elucidating the coupled erosion behavior of FAG under dual chemical–electrical attack. It offers theoretical and experimental support for applying geopolymer materials in underground infrastructure, thereby promoting the engineering implementation of green, environmentally friendly, and durable alternative cementitious materials in infrastructure development.

2. Raw Materials and Test Methods

2.1. Raw Materials

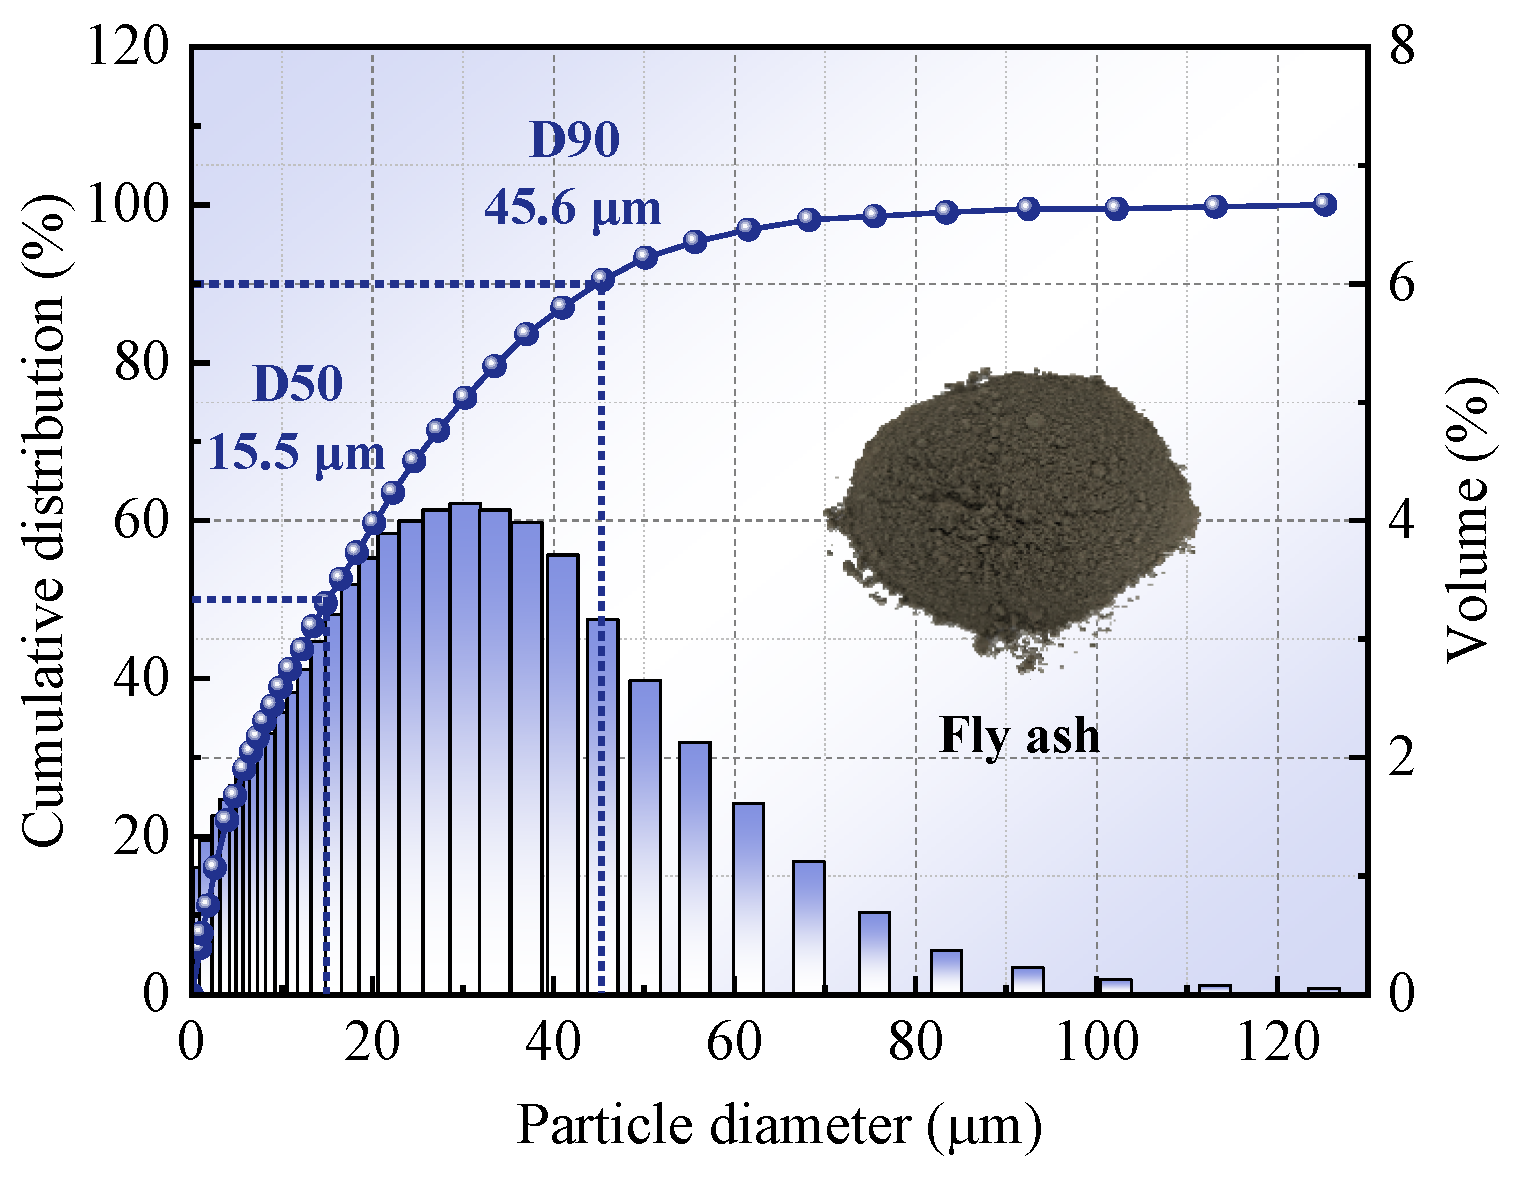
The Class I fly-ash used was obtained from the Huaneng Power Plant in Qingdao, Shandong Province. It had a density of 2300 kg/m3, a moisture content of 0.7%, a water demand ratio of 0.72%, and a strength activity index of 0.72. The chemical composition of the fly-ash is presented in Table 1. Its particle size distribution was analyzed using a laser particle size analyzer (Dandong Bettersize Instruments Co., Ltd., Dandong, China), and the results are shown in Figure 1. The microstructure characteristics of the fly-ash were observed using a field-emission scanning electron microscope (JEOL Ltd., Akishima, Japan), as illustrated in Figure 2.
Water glass (Na2O·nSiO2) and sodium hydroxide (NaOH) were mixed to produce the alkali activator. The liquid sodium silicate was supplied by Lvsan Chemical Co., Ltd., Linyi, China, with a density of 1.38 g/mL, a modulus of 3.3, Na2O content of 8.82%, a SiO2 content of 28.26%, and a Baumé degree of 39.9 Bé. The sodium hydroxide used was analytical-grade granular NaOH, supplied by Comeo Chemical Reagent Co., Ltd., Tianjin, China.
Deionized water, provided by Dalian Jinke Chemical Reagent Co., Ltd., Dalian, China. was used throughout the experiments. The metal electrodes consisted of 304 stainless steel mesh with a wire diameter of 0.6 mm and a mesh size of 8. The graphite electrodes were made from GHSM-5 graphite (Guanghui brand), with an electrical resistivity ranging from 8 to 10 μΩ·m.

2.2. Preparation and Curing of FAG

Five influencing factors were investigated: W/B, Ms, alkali content (AC, defined as Na2O-to-fly-ash mass ratio), curing temperature, and high-temperature curing duration. The designed mix proportions of FAG are listed in Table 2. Based on the mix design, the required quantities of sodium silicate solution, water, and sodium hydroxide were calculated. Initially, sodium silicate solution and water were mixed in a beaker and stirred uniformly using a glass rod. Sodium hydroxide was then added, and the mixture was stirred using a magnetic stirrer for 10 min until a clear and transparent activator solution was obtained. After stirring, the activator was allowed to stand at room temperature for more than 12 h. Subsequently, the prepared activator and pre-weighed fly-ash were mixed using a JJ-5 cement mortar mixer (Wuxi Jianyi Instrument & Machinery Co., Ltd., Wuxi, China) to form a uniform slurry. Two layers of slurry were sequentially cast into molds measuring 40 mm × 40 mm × 40 mm. The first half was added into the mold and vibrated on a vibrating table for 30 s. The remaining half was then added and vibrated again for 30 s. Excess paste on the surface was leveled, and the molds were wrapped in plastic wrap to evaporation moisture loss. In total, 348 specimens were prepared following this procedure.
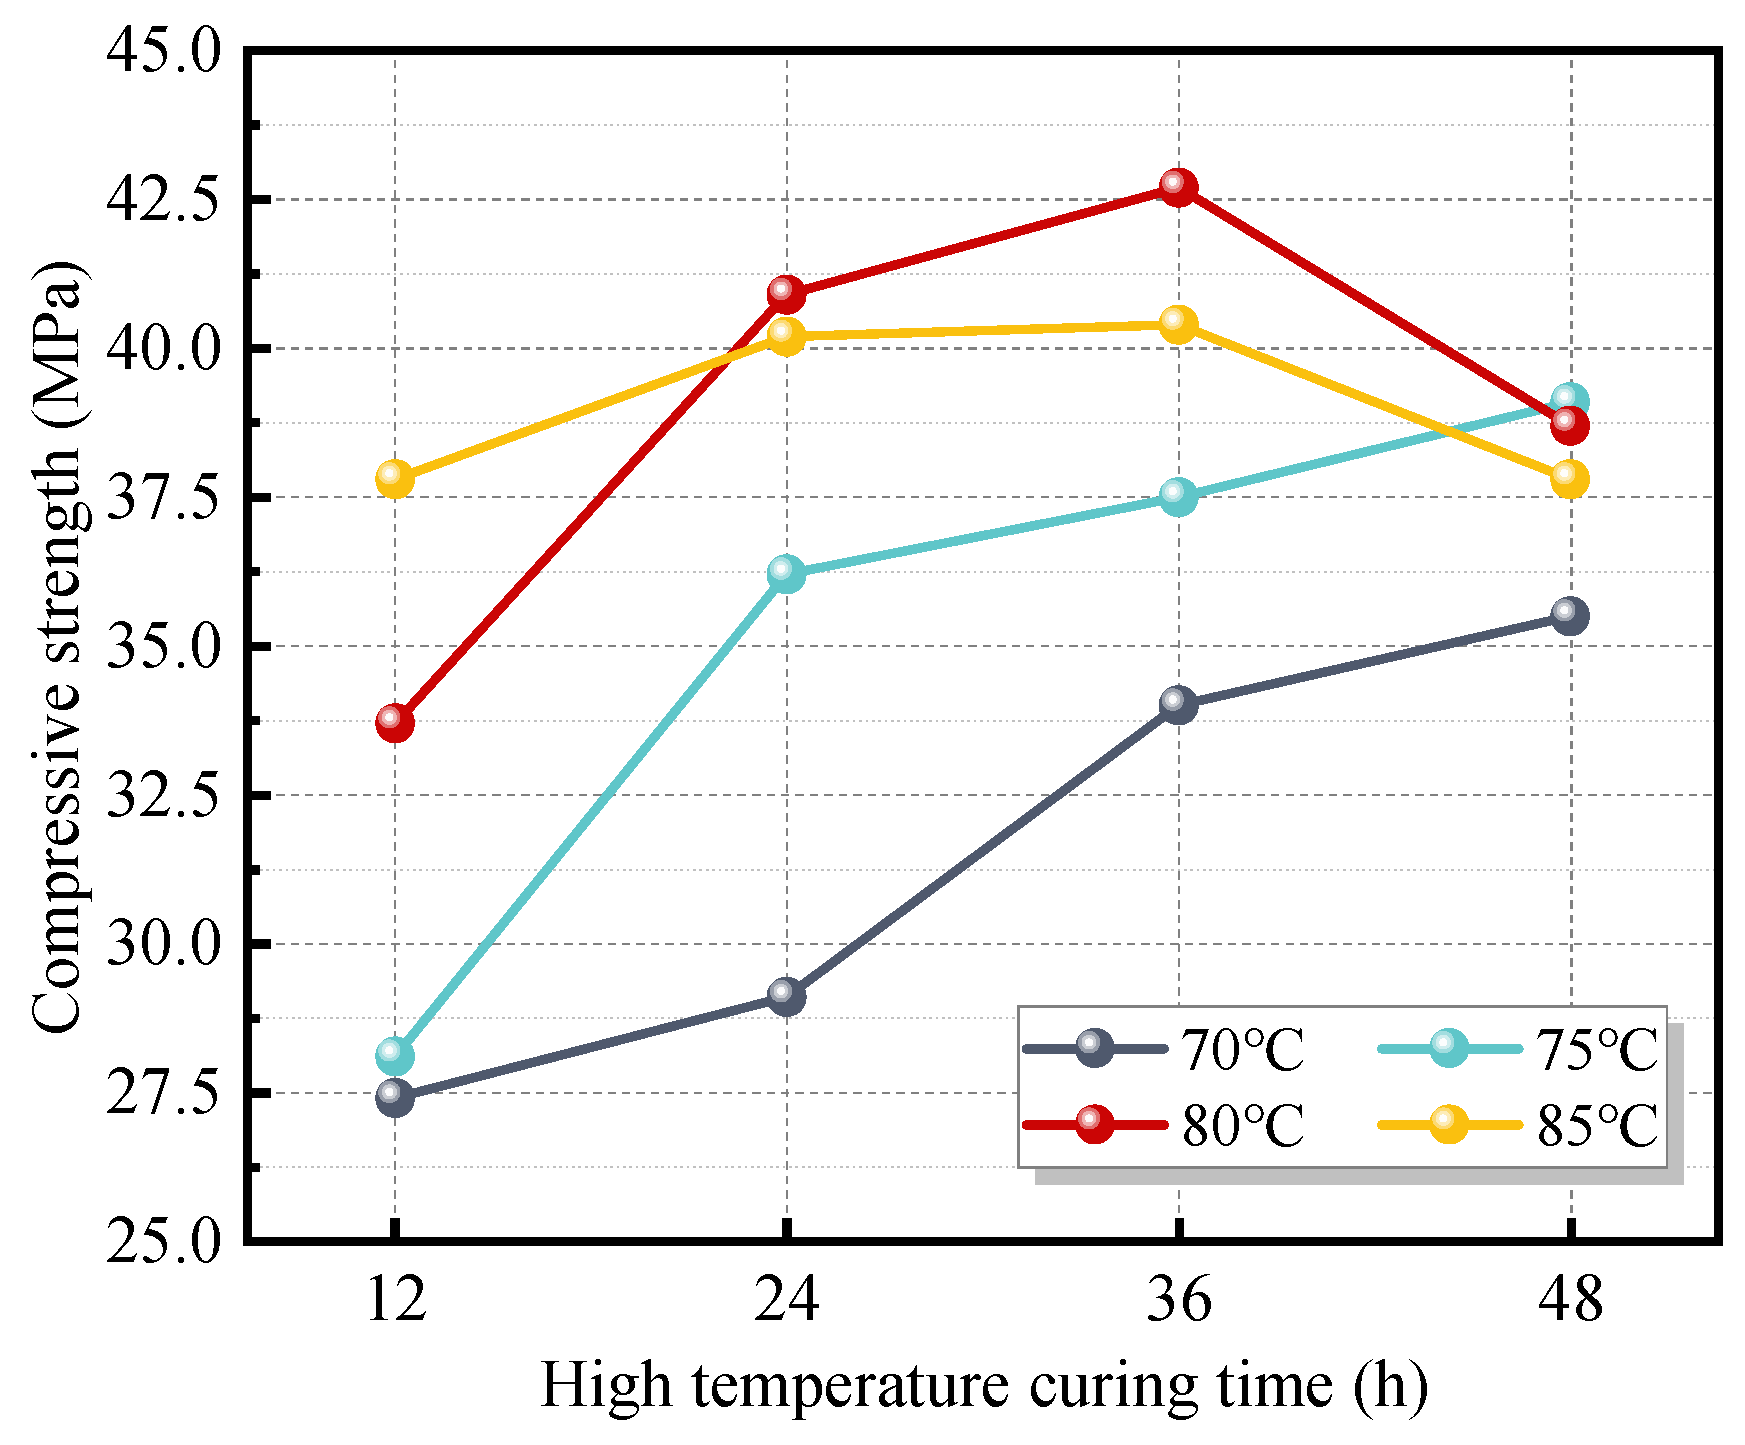
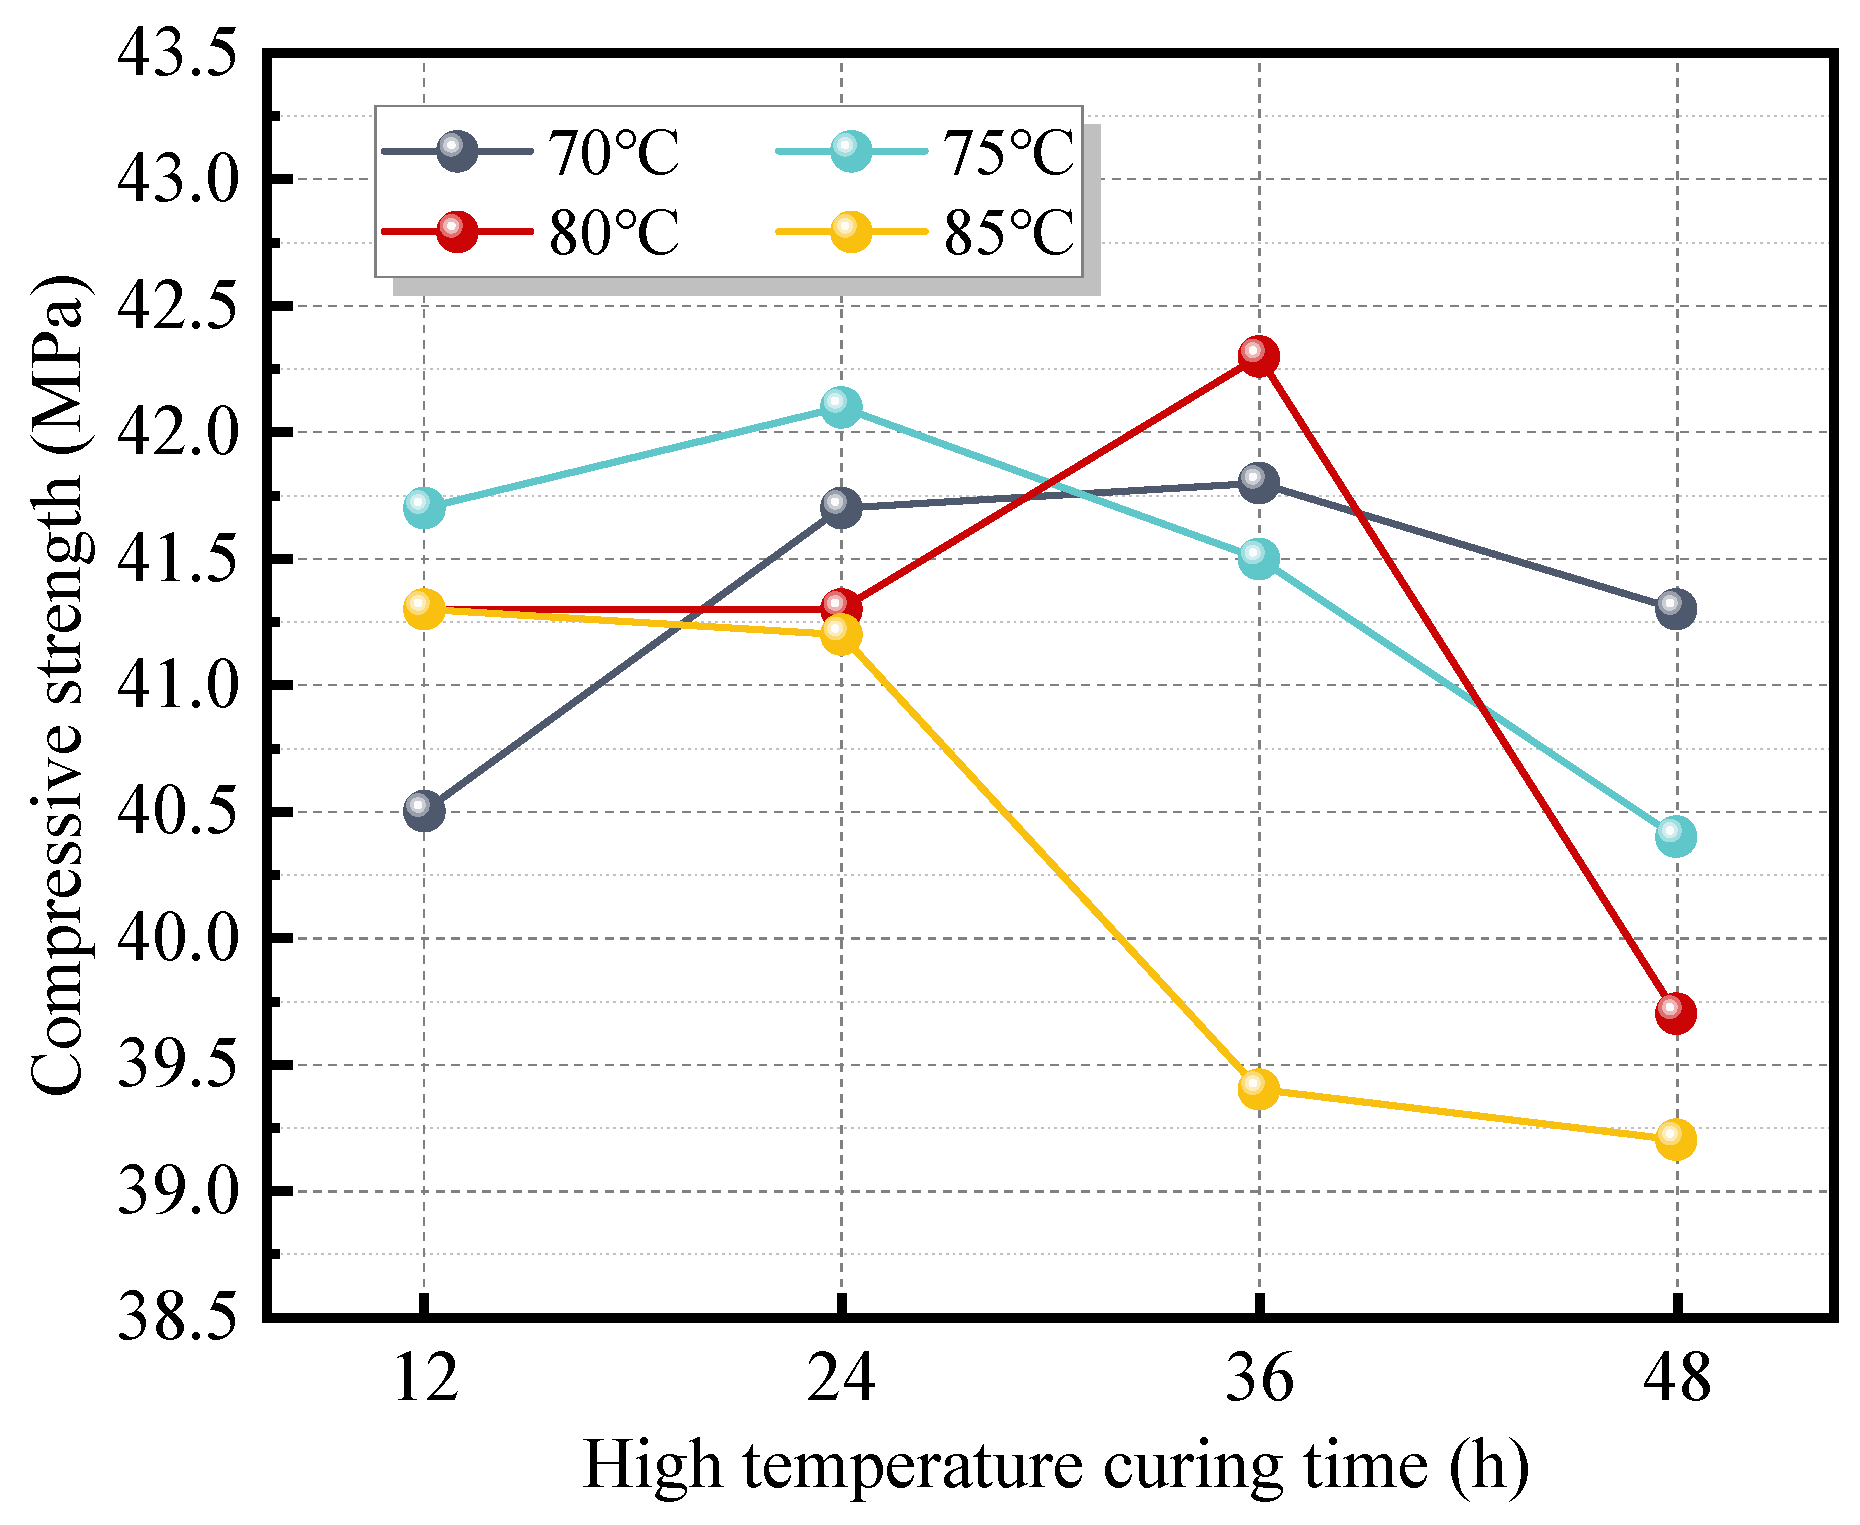
Two curing regimes were employed in this study. The first was ambient temperature curing. After being covered with plastic wrap, the freshly mixed paste was placed in a room maintained at a temperature of 20 ± 5 °C and a relative humidity of 70 ± 5%. Samples were demolded after 3 days and then continuously cured under the same conditions until the specified age. To accelerate the hydration reaction and promote early strength development, the second regime involved initial high-temperature curing followed by ambient curing. For this regime, the freshly cast paste, covered with plastic wrap, was sealed in a zip-lock bag and placed in a high-temperature curing chamber under the preset temperature and duration. As the strength of the FAG developed rapidly under elevated temperature, specimens requiring high-temperature curing durations exceeding 6 h were demolded after 6 h. The demolded specimens were then resealed in zip-lock bags and returned to the curing chamber to complete the scheduled curing period. Subsequently, the specimens were subjected to ambient curing identical to that used in the first regime until the designated testing age. The curing conditions for high-temperature treatment are presented in Table 3.

2.3. Test Methods

An L16 (45) orthogonal experimental design was utilized to evaluate the resistance of FAG to the coupled erosion of stray-current (20 V) and soft-water over a period of 90 days. Two evaluation indices were considered: compressive strength and compressive strength loss rate. The three factors included in the orthogonal design were W/B, Ms, and AC. Based on the results obtained in Section 2.2, four levels were selected for each factor. The specific factor-level arrangement is shown in Table 4. FAG specimens in each group were cured for 28 days according to the optimal curing regime identified previously, and their compressive strengths were tested and recorded as the pre-erosion compressive strength. Subsequently, another set of specimens from the same group was subjected to the coupled effect of 20 V stray-current and soft-water for 90 days, after which compressive strength was measured and recorded as the post-erosion compressive strength.
Based on the mix group that exhibited the lowest compressive strength loss rate after 90 days of coupled erosion by soft-water and 20 V stray-current, three sets of single-factor experiments were designed to investigate the influence of individual parameters—namely W/B, Ms, and AC—on the erosion behavior of FAG under stray-current. For the reference mix, additional tests were conducted under a standard curing environment and under coupled erosion environments involving 0 V, 20 V, and 40 V stray-currents combined with soft-water exposure for 30, 60, and 90 days. These tests aimed to assess the impact of stray-current intensity and erosion duration on the degradation of FAG.
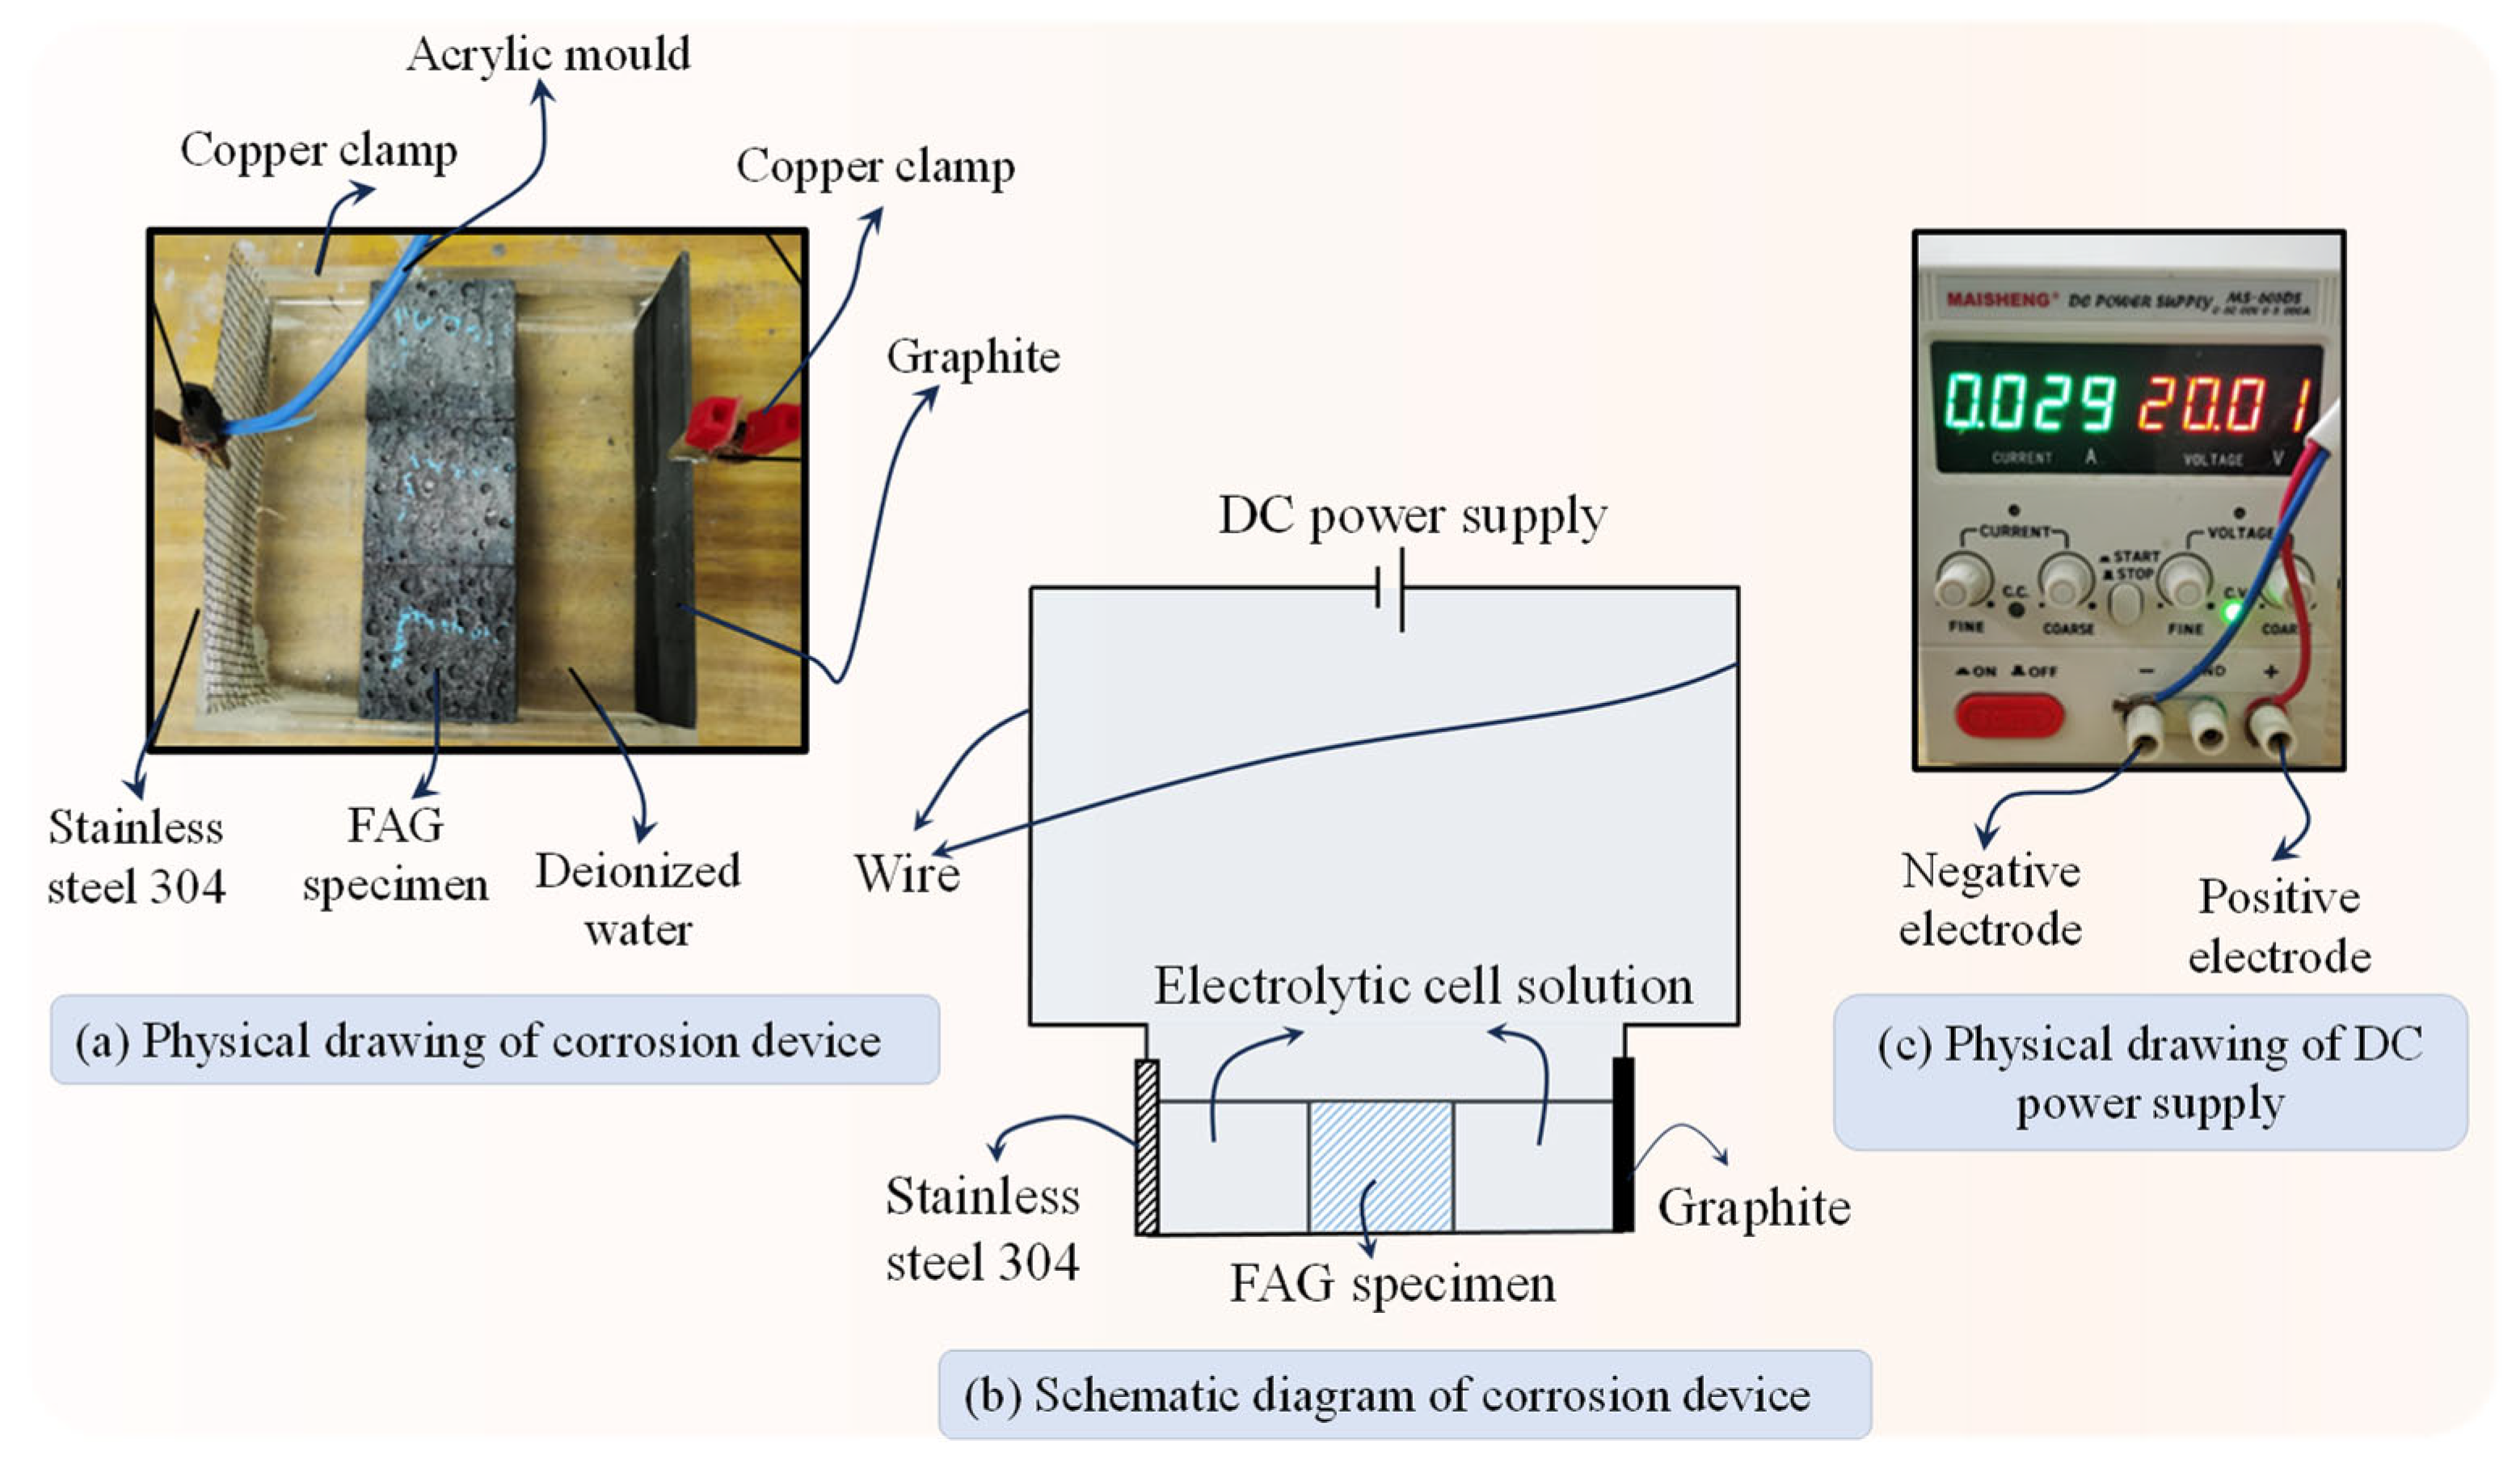
The apparatus used for the coupled erosion tests is shown in Figure 3. A mold with internal dimensions of 120 mm × 120 mm × 40 mm was fabricated using acrylic. Graphite was employed as the anode and 304 stainless steel as the cathode, which were linked to the positive and negative terminals of a DC power supply via copper wires, respectively. Deionized water was used as the electrolyte solution in the electrochemical cell.

3. Results and Discussion

3.1. Factors Influencing the Compressive Strength of FAG

Figure 4 illustrates the influence of the W/B, Ms, and AC on the compressive strength of FAG at different curing ages. Figure 4a illustrates that the early-age strength development of FAG was relatively slow. At 3 days, the highest compressive strength (2.1 MPa) was observed at a W/B of 0.26. At 7 days, the maximum strength (5.7 MPa) occurred at a W/B of 0.30. However, no clear correlation between W/B and strength was observed at these early ages. The 28-day compressive strength accounted for only 42.4–52.6% of the 90-day strength. At both 28 and 90 days, the compressive strength of FAG initially increased and then decreased with increasing W/B. Specifically, at 28 days, the highest strength (14.5 MPa) was obtained at a W/B of 0.30, whereas at 90 days, the peak strength (31.1 MPa) was recorded at a W/B of 0.28. This discrepancy is attributed to the influence of alkali concentration. When the W/B decreased from 0.30 to 0.28, the alkali concentration increased. Although higher alkali concentrations facilitate the dissolution of aluminosilicate species, they may hinder the formation of gel phases [34]. As a result, at 28 days, the W/B = 0.30 mix exhibited higher strength than the W/B = 0.28 mix. However, with extended curing, the continuous reaction between OH and aluminosilicates gradually reduces the alkali concentration, mitigating its inhibitory effect on the polymerization process. Consequently, at 90 days, the W/B = 0.28 mix achieved superior compressive strength. Therefore, a W/B of 0.28 was identified as optimal for FAG in this study.
As shown in Figure 4b, at the curing ages of 3 and 7 days, the compressive strength of FAG exhibited no clear trend with variations in Ms. However, at 28 and 90 days, the compressive strength was observed at an Ms of 1.2, reaching 18.3 MPa and 33.7 MPa, respectively. At 90 days, the strength increased with increasing Ms up to 1.2, followed by a decline as Ms continued to rise. A similar trend was observed at 28 days, although minor fluctuations in strength were noted when Ms ranged from 1.4 to 1.8. This behavior can be attributed to the structural characteristics of silicate species in the system. At Ms = 1.2, the concentration of [SiO4] tetrahedra was relatively high, and a considerable amount of low-polymerized [SiO4] tetrahedra was present, which favored the development of a dense and strong geopolymeric network. When Ms decreased to 1.0, the proportion of low-polymerized [SiO4] species increased; however, the overall concentration of [SiO4] tetrahedra in the system decreased, resulting in reduced strength. Conversely, when Ms exceeded 1.6, the amount of low-polymerized [SiO4] tetrahedra declined significantly, leading to a decrease in compressive strength. Therefore, an Ms value of 1.2 was identified as optimal for maximizing the mechanical performance of FAG.
As illustrated in Figure 4c, at the curing ages of 3 and 7 days, the compressive strength of FAG showed a slight increasing trend with higher AC, though the variation was not pronounced. At 28 and 90 days, however, the compressive strength increased initially and then decreased with increasing AC. From 3% to 7% AC, a continuous increase in strength was observed. This improvement is attributed to the higher concentrations of OH and [SiO4] tetrahedra, which enhance the dissolution of aluminosilicates [35,36] and promote the development of geopolymeric gels. Both factors contribute synergistically to the strength improvement of the material. However, when the AC ratio rose from 7% to 9%, the compressive strength started to decline. Although a higher AC ratio continued to raise the OH concentration and [SiO4] tetrahedra availability, the positive effect of additional [SiO4] on geopolymerization appeared to reach a plateau. Beyond this point, further increases in [SiO4] concentration no longer significantly enhanced the polymerization process. Similarly, while OH initially promoted the reaction by accelerating the dissolution of aluminosilicates and increasing [SiO4] concentration, excessive OH eventually exerted a suppressive effect on the polycondensation process. Consequently, when the AC exceeded 7%, the adverse effects of excessive alkalinity began to outweigh the benefits, leading to a reduction in compressive strength. Therefore, an AC of 7% was identified as optimal for achieving the highest strength performance in FAG.

3.2. Optimization of Curing Regime for FAG

Based on the single-factor experimental results in Section 3.1, the optimal W/B (0.28), Ms (1.2), and AC (7%) were selected as a combined mix to investigate the effects of curing temperature and elevated temperature duration on the compressive strength of FAG. The objective was to determine the most effective high-temperature curing regime.
Figure 5 presents the compressive strength of FAG at 28 days under different curing temperatures and durations of elevated-temperature curing followed by ambient curing. As shown, at 70 °C and 75 °C, the 28-day compressive strength was observed to increase with extended high-temperature curing, reaching maximum values of 35.5 MPa and 39.1 MPa after 48 h, respectively. This suggests that hydration reactions were continuously promoted under these temperatures within 48 h [37,38]. In contrast, at 80 °C and 85 °C, the compressive strength increased initially but declined after 36 h of curing. The peak strengths were observed at 36 h, reaching 42.7 MPa and 40.4 MPa, respectively. These results suggest that prior to 36 h, elevated temperatures accelerated the reaction process, while beyond 36 h, excessive thermal exposure likely caused microstructural expansion, thereby reducing compressive strength. Although the highest strength (42.7 MPa) was achieved at 80 °C for 36 h, the increase was only 4.4% compared to the value at 24 h (40.9 MPa), despite a 50% increase in curing time. This indicates diminishing returns in strength development with extended curing duration beyond a certain threshold. This may be due to microstructural degradation caused by prolonged thermal exposure, including shrinkage, moisture loss, and microcrack formation, as also reported in previous studies [39].
Figure 6 illustrates the 90-day compressive strength of FAG under the same high-temperature curing conditions by ambient curing. A comparison with Figure 5 reveals that, at 70 °C and 75 °C, the 90-day compressive strengths remained relatively consistent within 48 h of high-temperature curing, with maximum and minimum values of 42.1 MPa and 40.4 MPa, respectively, representing only a 4.2% difference. At 80 °C, the compressive strength remained stable within 36 h of curing but decreased at 48 h due to expansion effects. A similar trend was observed at 85 °C, where strength levels remained close within the first 24 h, but declined significantly during 36–48 h of curing, also attributed to expansion-induced damage. Among the groups unaffected by expansion, the 90-day compressive strengths were very similar, ranging from 40.4 MPa to 42.3 MPa, with the highest value exceeding the lowest by only 4.7%. Therefore, for the groups in which compressive strength was not reduced due to expansion caused by elevated-temperature curing, the 90-day compressive strengths were similar. Hence, the optimal high-temperature curing regime was determined based on the 28-day compressive strength, which was identified as curing at 80 °C for 24 h.
Figure 7 shows the compressive strength of FAG at different curing ages under ambient curing and under 80 °C curing for 24 h followed by ambient curing. For the specimens treated with 80 °C curing for 24 h, the compressive strengths at 3 d, 7 d, and 28 d reached 29.8 MPa, 35.4 MPa, and 40.9 MPa, respectively, corresponding to 70.5%, 83.7%, and 96.7% of their 90-day strength. In contrast, for specimens cured under ambient conditions alone, the compressive strengths at 3 d, 7 d, and 28 d were 4.2 MPa, 7.1 MPa, and 19.4 MPa, respectively, accounting for only 10.1%, 17.1%, and 46.8% of the 90-day strength. At the same curing ages, the compressive strengths of the high-temperature cured specimens were approximately 7.1, 5.0, and 2.1 times greater than those of the ambient-cured specimens, respectively. These results demonstrate that early-age strength development was significantly accelerated by thermal treatment. However, the acceleration effect diminished with curing age [40,41]. At 28 days, the compressive strength of the high-temperature cured specimens differed by less than 3% from the 90-day strength of the ambient-cured specimens, and the final 90-day strengths of both curing regimes differed by less than 2%. This suggests that the strength of FAG cured at 80 °C for 24 h followed by ambient curing reaches a stable value by 28 days. Thus, the early-age high-temperature treatment primarily serves to accelerate the reaction rate, rather than enhancing the overall degree of reaction [42,43].
In conclusion, the optimal high-temperature curing regime for FAG was determined to be 80 °C for 24 h. Under this condition, the compressive strength reached a stable value by 28 days. Accordingly, this curing regime was adopted for all subsequent experiments.

3.3. Mix Design of FAG Based on Resistance to Stray-Current and Soft-Water Coupled Corrosion

Range analysis was conducted to assess the impact of each factor in the orthogonal experiment on the predefined performance indicators and to determine the optimal level for each factor [44]. The range analysis results of the compressive strength loss rate after 90 days of coupled corrosion are presented in Table 5. It was found that under stray-current exposure, the effect of the three factors on the 90-day compressive strength loss rate of FAG followed the order: AC > W/B > Ms. Accordingly, the optimal factor level combination for minimizing the compressive strength loss rate after corrosion was identified as W2, M2, A3, corresponding to a W/B of 0.30, a Ms of 1.2, and an AC of 6%.
As shown in Table 6, the range analysis of compressive strength loss rate after 90 days of soft-water erosion under stray-current conditions indicates that the influence of the three factors on the loss rate follows the order: AC > W/B > Ms, which is consistent with the results of the range analysis. Both the W/B and AC exhibited significant or highly significant effects on the compressive strength loss rate, suggesting that their variation levels induce systematic changes in the degradation behavior of FAG under the coupled effect of stray-current and soft-water. In contrast, the modulus of water glass had no statistically significant effect on either compressive strength or its loss rate, indicating that its variation had a relatively minor influence on the deterioration behavior of FAG under the same conditions.

3.4. Effects of Different Factors on the Resistance of FAG to Coupled Stray-Current and Soft-Water Corrosion

FAG specimens were prepared using the optimal mix design—W/B of 0.30, Ms of 1.2, and AC of 6%—as the reference group. Following 28 d of curing, the specimens were exposed to different electro-corrosion environments (0 V, 20 V, 40 V) and a standard curing chamber. Their initial compressive strengths (defined as those at 0 d of erosion) and strengths after 30 d, 60 d, and 90 d of exposure were measured. The results are presented in Figure 8. Under 0 V (i.e., soft-water erosion without stray-current), the greatest reduction in compressive strength occurred during the first 30 d, with a loss rate of 3.2%. Between 30 d and 90 d, the loss rate decreased to 1.7%. This indicates that while soft-water does exert a certain erosive effect on FAG, the effect is not significant: the total loss in compressive strength over 90 days remained below 5%, and the corrosion rate declined over time. The slight strength loss under the 0 V condition may be attributed to the pH difference. It may also result from factors such as ionic leaching, immersion conditions, and evolving solution chemistry. Under 20 V, the compressive strength decreased progressively with increasing exposure duration. The loss rates at 30, 60, and 90 d were 11.3%, 17.5%, and 19.7%, respectively. A similar trend was observed under 40 V, though with more pronounced reductions: the corresponding loss rates were 23.2%, 29.4%, and 33.4%. By comparing the average loss rate per time interval, the corrosion rate at 20 V was approximately 4.1 times that observed under 0 V, while the rate at 40 V was about 7.2 times higher. These findings indicate that the presence of stray-current significantly accelerates the soft-water-induced deterioration of FAG. Furthermore, the compressive strength loss under 20 V during 0–30 d, 30–60 d, and 60–90 days was 11.3%, 7.0%, and 2.6%, respectively. Under 40 V, the losses for the same periods were 23.2%, 8.1%, and 5.7%. These trends suggest that the rate of compressive strength degradation decreases over time, similar to the pattern observed under pure soft-water exposure.
Figure 9 illustrates the evolution of compressive strength of FAG specimens with varying W/B ratios under 20 V stray-current over time. All specimens were designed with a fixed Ms of 1.2 and AC of 6%, while the W/B ratio ranged from 0.28 to 0.34 in equal intervals. At 0 d of erosion, the compressive strength of FAG decreased with increasing W/B ratio. After 90 d of erosion, an increase in W/B from 0.30 to 0.32 resulted in a compressive strength reduction from 29.8 MPa to 20.2 MPa, corresponding to a 32.2% loss. This indicates that when the W/B ratio exceeds 0.30, the resistance of FAG to coupled stray-current and soft-water erosion declines sharply.
During the 0–30 d period, the average strength loss was 13.9%. This decreased to 6.8% in the 30–60 d period, and to 6.0% in the 60–90 d period, showing a consistent reduction in the rate of strength loss over time. After erosion, the specimen with a W/B ratio of 0.28 shown the highest residual compressive strength of 30.6 MPa. Notably, the specimen with a W/B ratio of 0.30 showed the lowest compressive strength loss rate—dropping from 37.1 MPa before erosion to 29.8 MPa after erosion, corresponding to a 19.7% reduction. This suggests that a W/B ratio of 0.30 provides the most favorable balance between initial strength and durability under aggressive erosion conditions.
Figure 10 presents the evolution of compressive strength of FAG specimens under 20 V stray-current with varying sodium silicate moduli. All specimens were cast with a constant W/B of 0.30 and an AC of 6%, while the Ms ranged from 1.0 to 1.6 in equal intervals. As shown in the figure, at both the initial stage (prior to erosion) and at all designed erosion durations, the compressive strength of FAG revealed a trend of ascending initially and then declining with the increase in Ms. The specimens with a modulus of 1.2 consistently achieved the highest compressive strength before and after erosion. During the 0–30 d erosion period, the average compressive strength loss rate was 15.3%, decreasing to 7.3% over the 30–60 d period, and further to 4.3% over the 60–90 d period. This declining trend in strength loss rate. After 90 days of erosion, the difference between the maximum and minimum compressive strengths among specimens with moduli ranging from 1.0 to 1.4 was approximately 12.0%. However, when the modulus increased from 1.4 to 1.6, compressive strength dropped by 19.5%. These results indicate that a modulus of 1.2 yields the best erosion resistance under stray-current. Within the range of 1.0–1.4, the effect of Ms on erosion resistance is relatively minor. However, when the modulus exceeds 1.4, the accelerating effect of stray-current on soft-water-induced erosion becomes significantly more pronounced [45].
Figure 11 illustrates the evolution of compressive strength of FAG specimens under a 20 V stray-current with varying ACs. All specimens were prepared with a constant W/B of 0.30 and Ms of 1.2, while the AC ranged from 4% to 7% in equal increments. As shown in the figure, both before erosion and during the three erosion periods, the compressive strength of FAG increased with increasing AC. During the 0–30 d erosion period, the average compressive strength loss rate was 14.7%, while it decreased to 8.4% during the 60–90 d period, indicating a declining trend in the rate of strength loss with increasing erosion duration. The specimen with 7% AC exhibited the highest compressive strength both before and after 90 days of erosion, reaching 41.5 MPa and 32.5 MPa, respectively, with a strength loss rate of 21.7%. The specimen with 6% AC showed a comparable 90-day compressive strength, only 2.7 MPa lower, but with a reduced strength loss rate. However, when the AC was reduced from 6% to 5%, the 90-day compressive strength dropped by 28.9%, and the corresponding strength loss rate increased by 21.0%. These results suggest that when the AC is below 6%, the accelerating effect of stray-current on soft-water-induced erosion of FAG becomes significantly more pronounced.

4. Conclusions

This investigation focused on the effects of W/B, Ms, and AC on the mechanical properties of FAG at different ages. The influence of curing temperature and duration of high-temperature curing on the early and later development of FAG mechanical performance was also examined. Furthermore, the influence of stray-current coupled with soft-water erosion on FAG, under varying W/B, Ms, and AC, were explored to identify the optimal mix proportion resistant to the coupled erosion. The main conclusions are as follows:
(1)
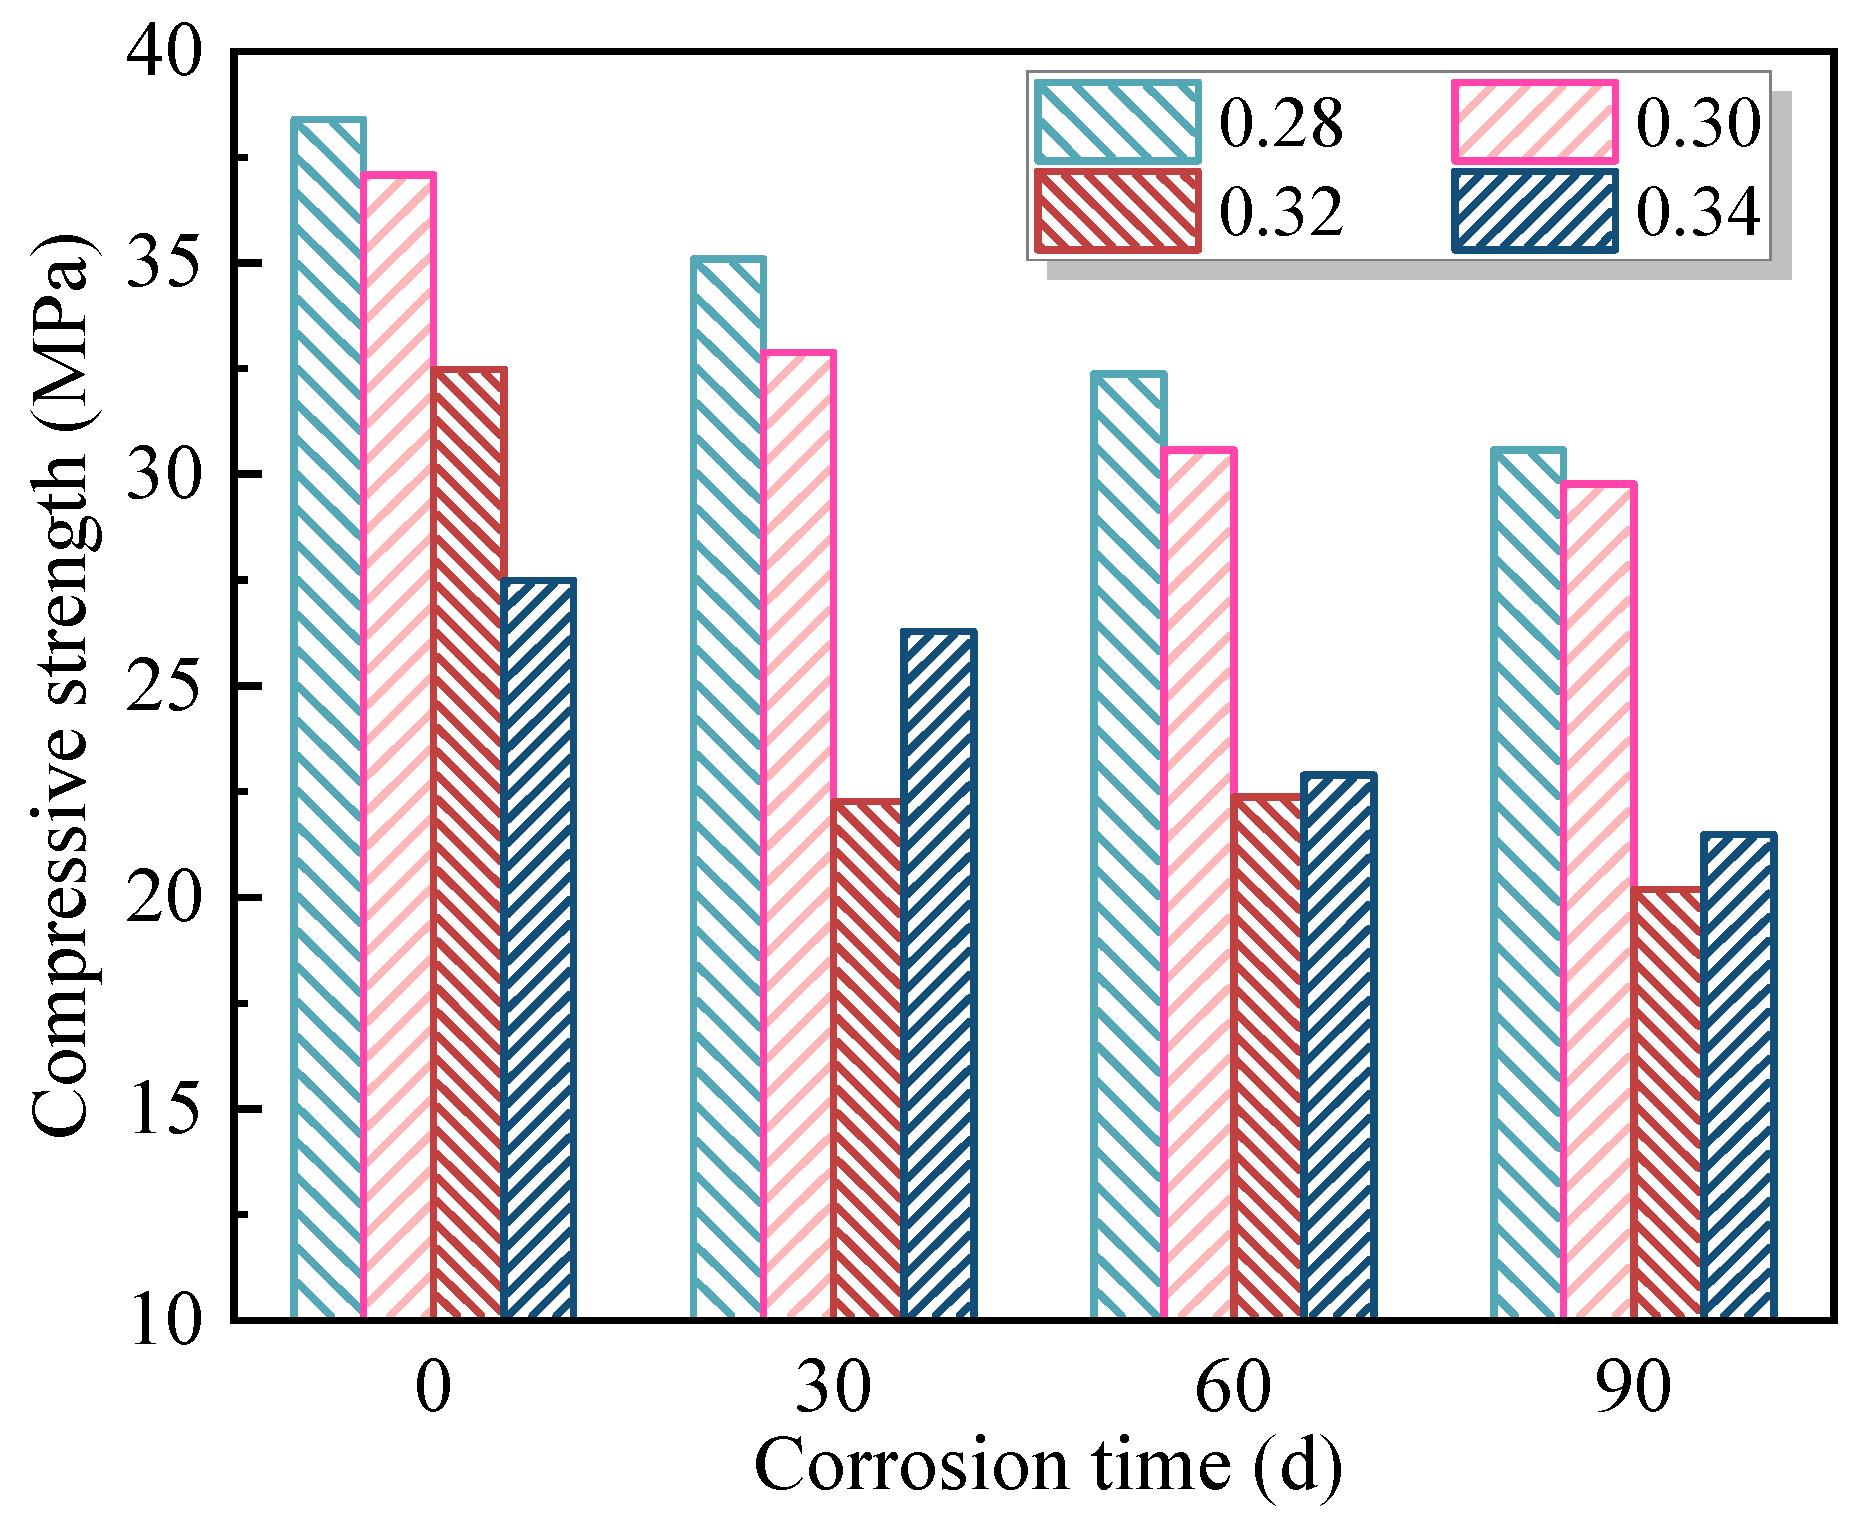
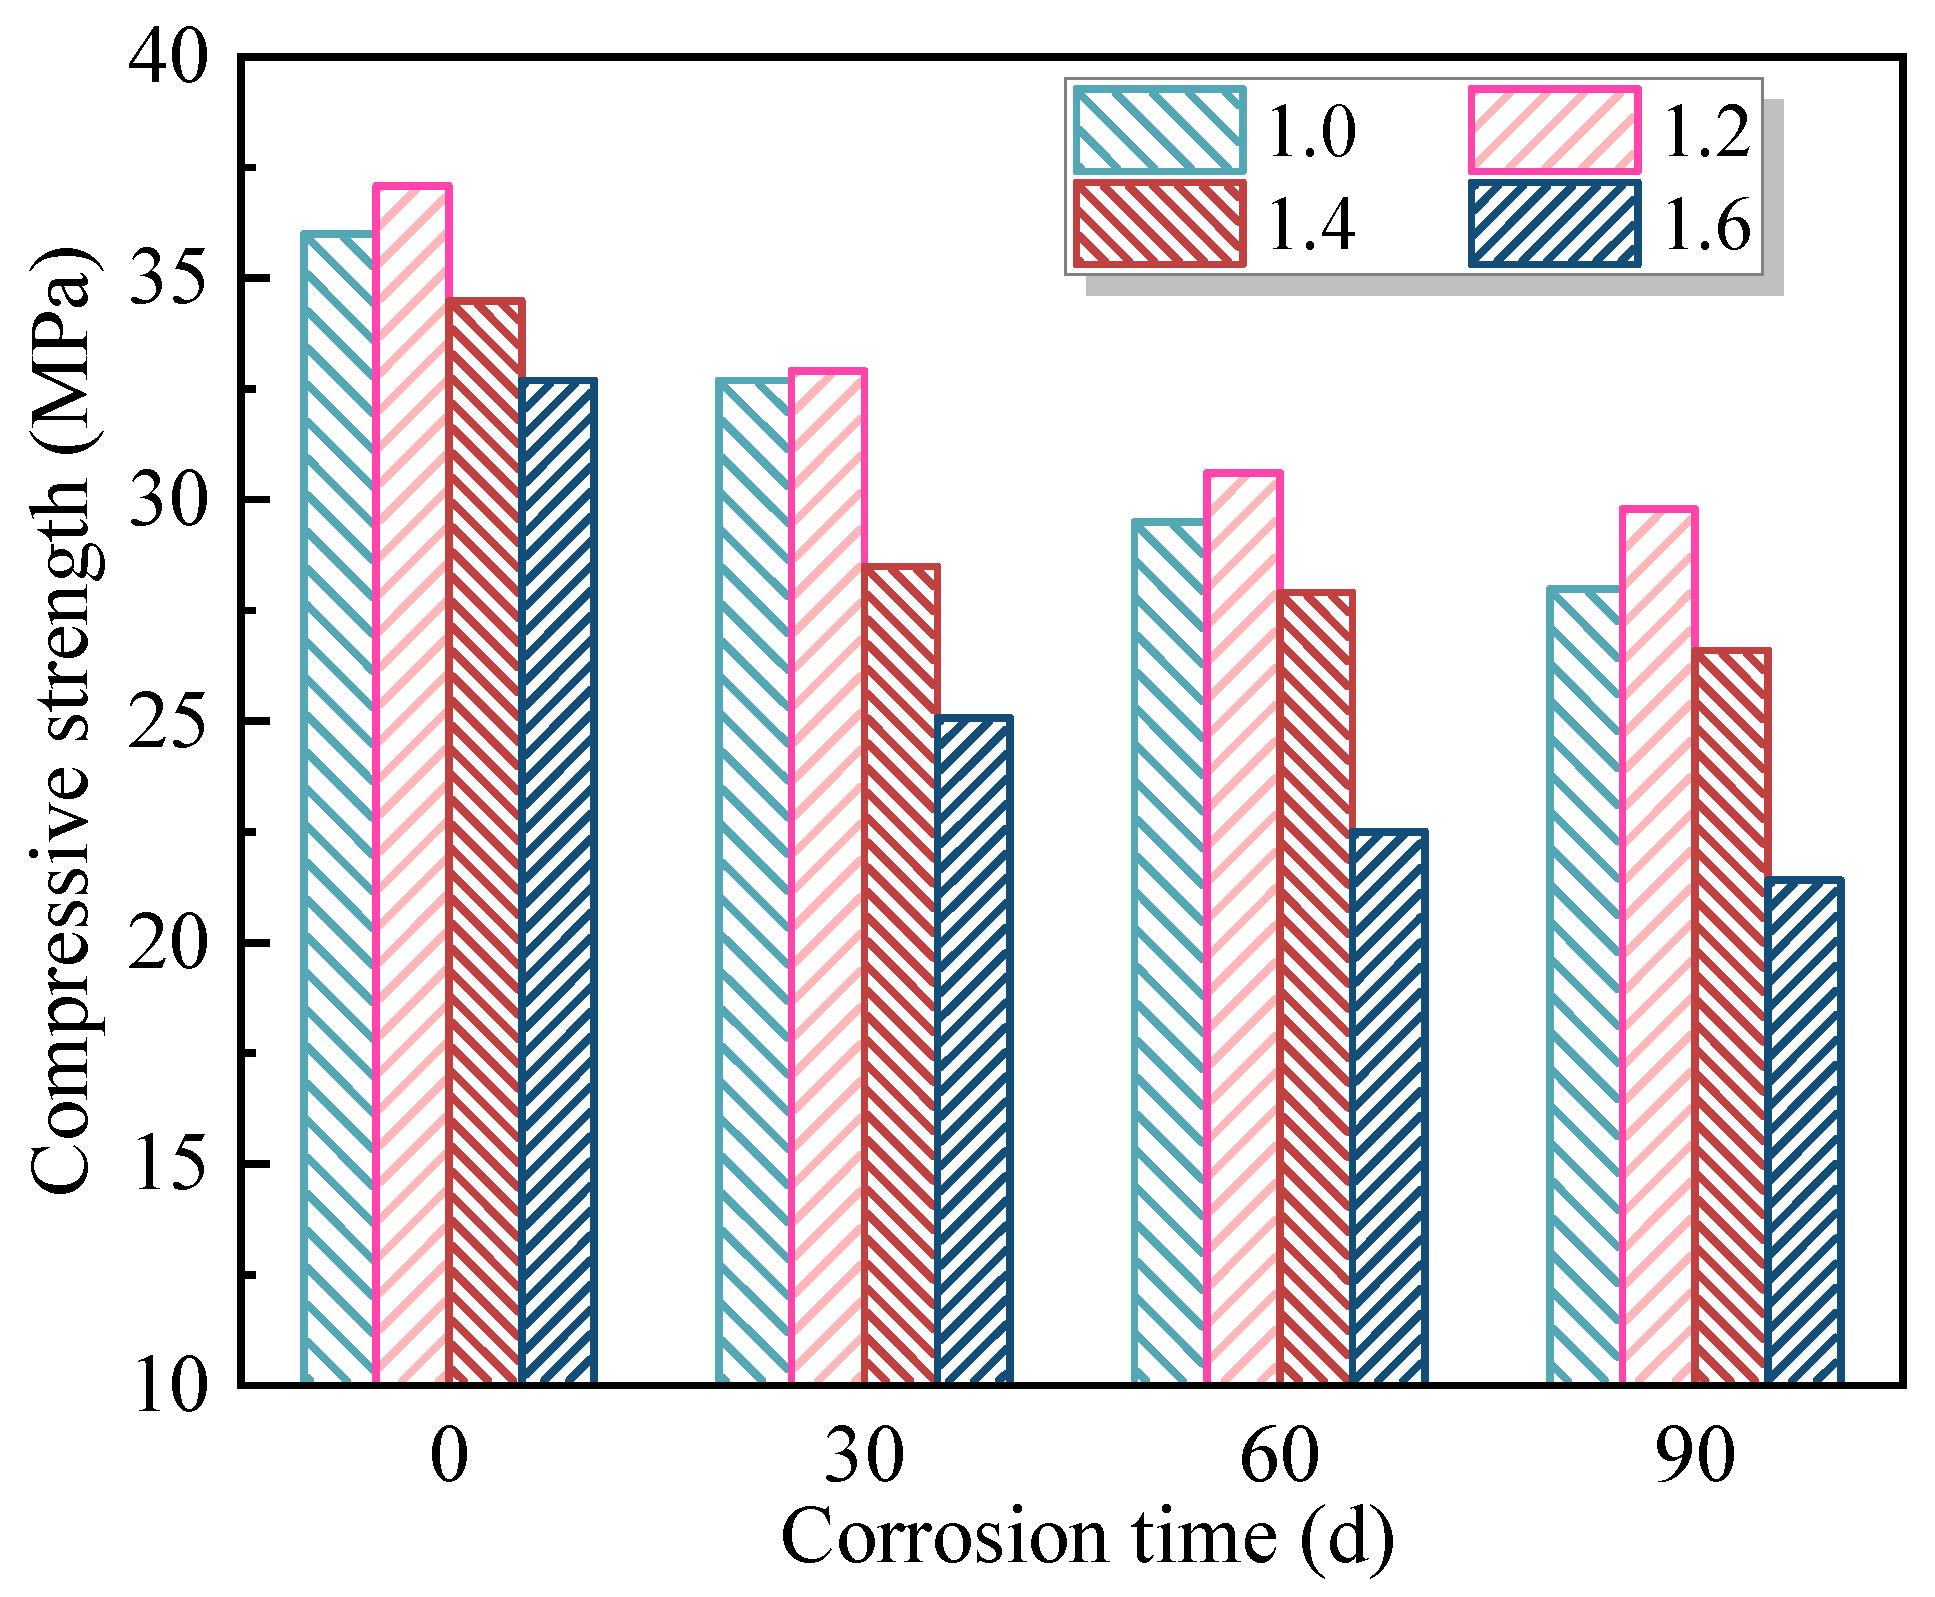
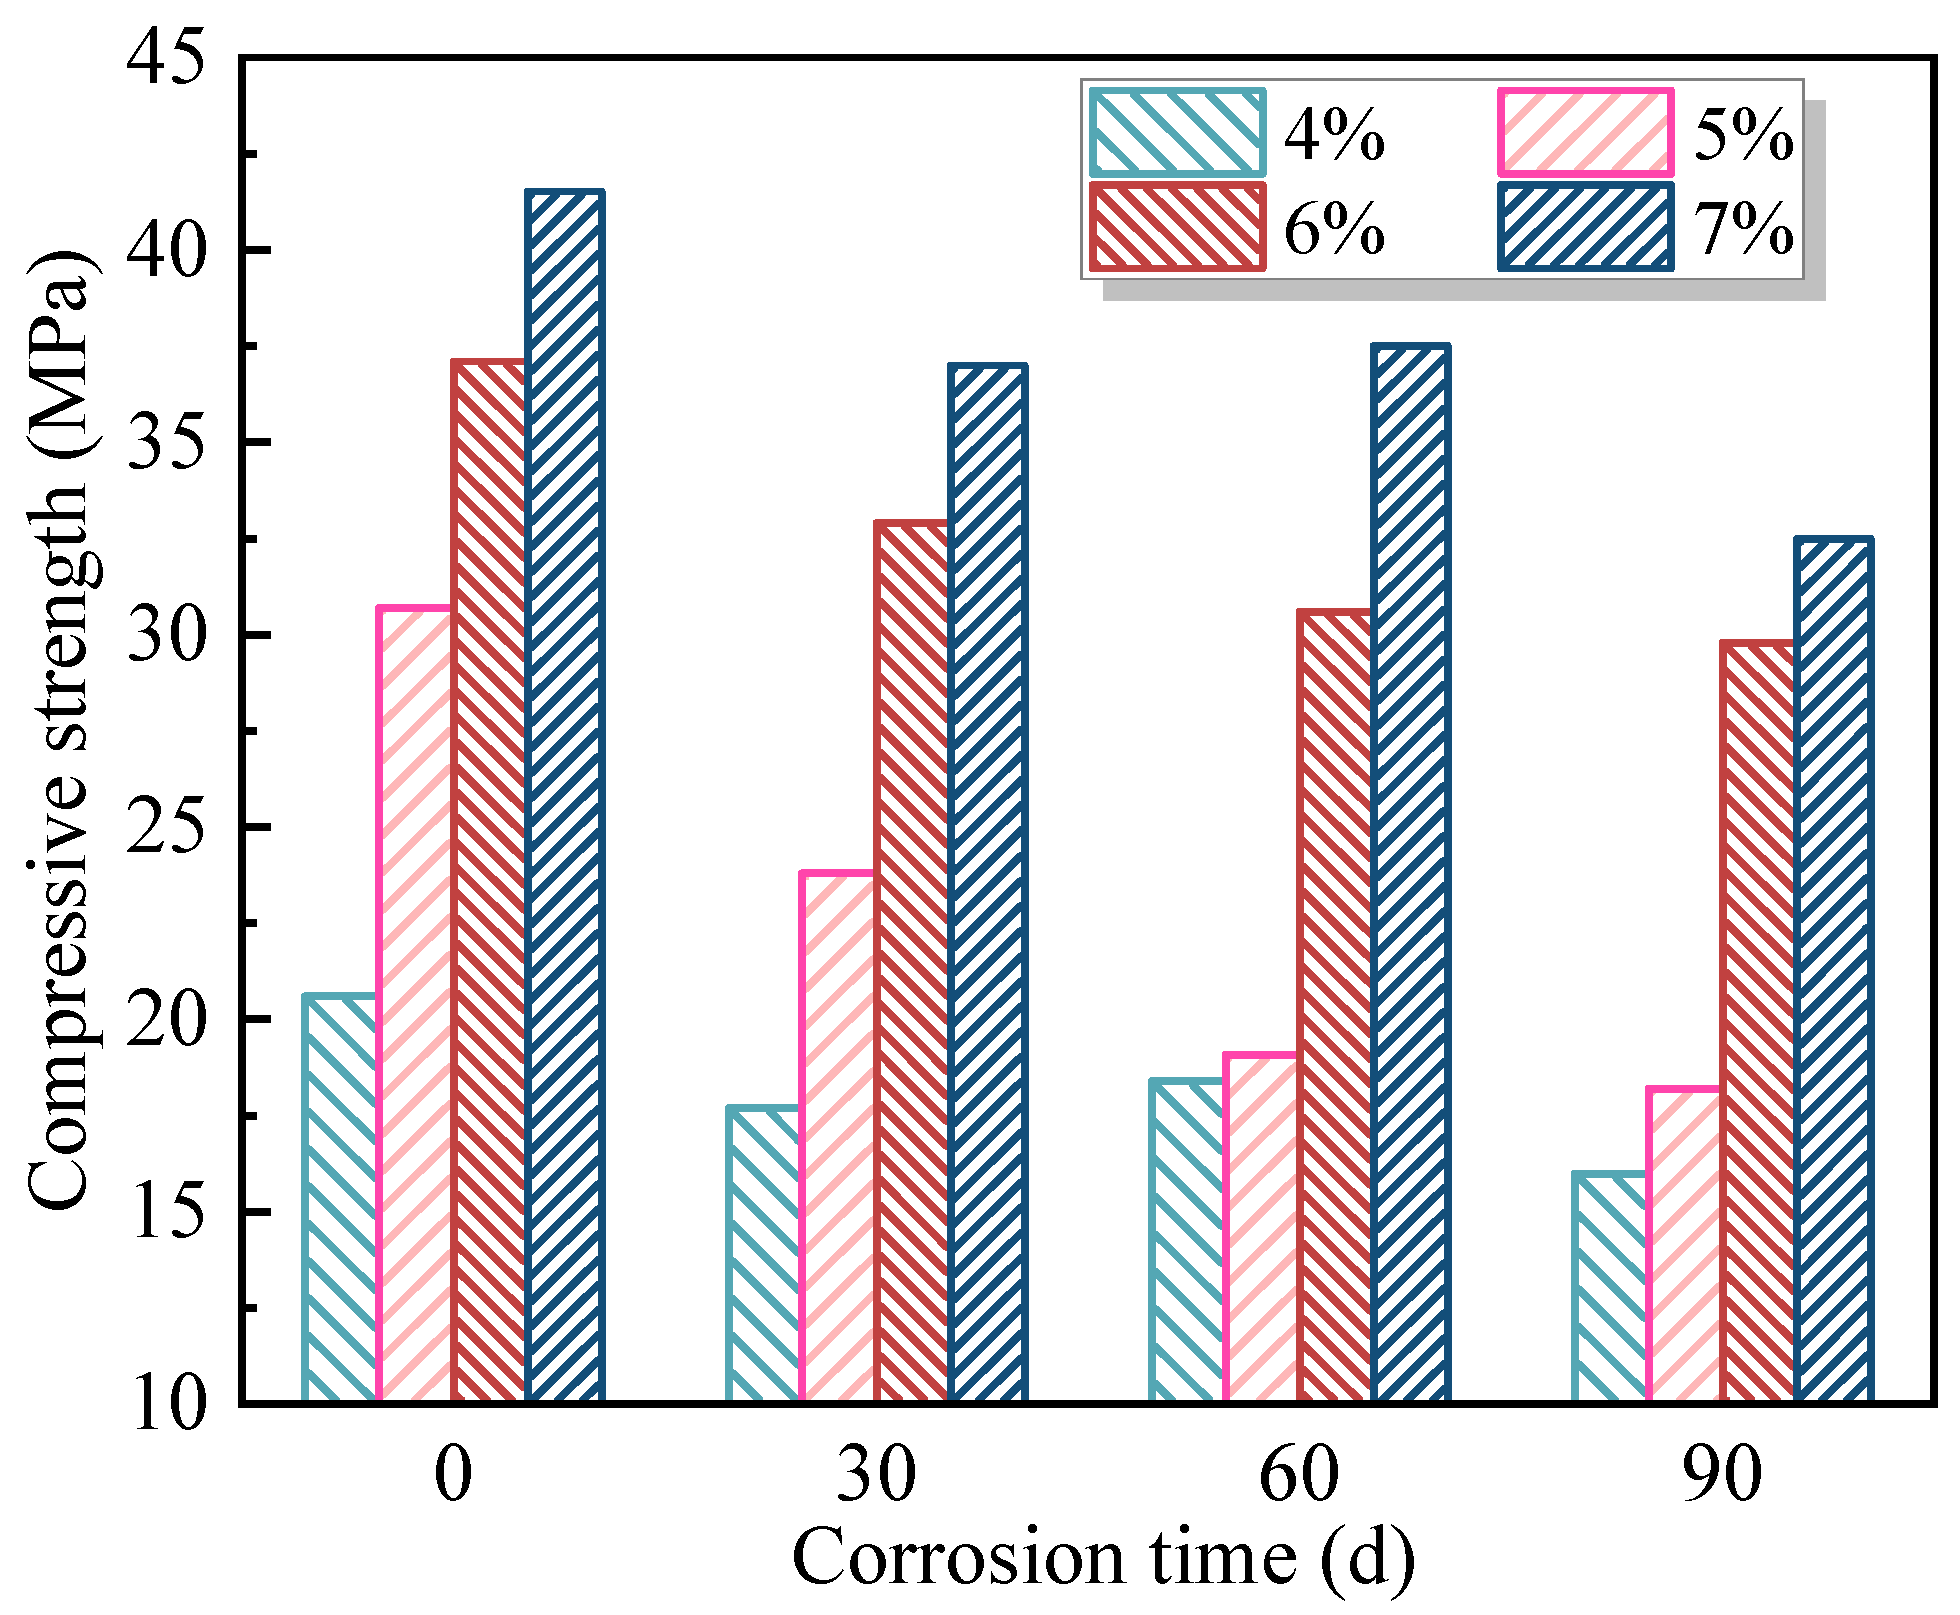
After 90 days of curing, the compressive strength of FAG displayed an initial increase followed by a decrease with the increase in W/B, Ms, and AC. The reasonable ranges for W/B, Ms, and AC were determined to be 0.28–0.34, 1.0–1.6, and 4–7%, respectively. Under normal-temperature curing, the strength development of FAG was slow. A moderate increase in early curing temperature and an extension of the high-temperature curing duration significantly accelerated strength development. However, excessively high curing temperatures (>80 °C) and prolonged high-temperature curing (>36 h) were found to adversely affect the mechanical performance of FAG. The optimal high-temperature curing regime was identified as 80 °C for 24 h.
(2)
The erosive impact of soft-water on FAG was limited, while the application of stray-current markedly enhanced the erosion caused by soft-water. Compared to soft-water alone, the erosion rate increased by factors of 4.1 and 7.2 when stray-currents of 20 V and 40 V were applied, respectively. Under varying current intensities, the coupled erosion effect weakened continuously with increasing erosion time, and the erosion rate exhibited a linearly decreasing trend over time.
(3)
The influence degree of stray-current coupled with soft-water erosion on FAG compressive strength and strength loss rate was ranked as AC > W/B > Ms. Both AC and W/B demonstrated significant or highly significant effects on these two indices. The mix proportion of W/B = 0.30, Ms = 1.2, and AC = 7% resulted in the highest post-erosion compressive strength of 32.5 MPa, with a strength loss rate of 21.7%. Meanwhile, the mix with W/B = 0.30, Ms = 1.2, and AC = 6% exhibited the lowest strength loss rate of 19.7%, with a residual compressive strength of 29.8 MPa after erosion.
Future research could focus on the coupling degradation effects of stray-current with multiple corrosive media such as chloride and sulfate ions, which are commonly present in subway groundwater environments. Additionally, the potential of mineral admixtures to enhance the durability of FAG under such complex conditions warrants further investigation.

Author Contributions

R.T.: Writing—original draft, Writing—review & editing, Methodology, Funding acquisition. F.L.: Writing—review & editing. B.W.: Resources, Investigation. X.W.: Data curation. C.H.: Visualization. X.Y.: Supervision. All authors have read and agreed to the published version of the manuscript.

Funding

This work was supported by the Shaanxi Provincial Department of Education Government-Enterprise Joint Funding Project (Grant No. 24JE025); the Special Fund for the Launch of Scientific Research in Xijing University (XJ21T01); the Youth Innovation Team of Shaanxi Universities.

Data Availability Statement

Data will be made available on request.

Conflicts of Interest

The authors declare no conflicts of interest.

Abbreviations

Water-to-binder ratioW/C
Modulus of sodium silicateMs
Alkali contentAC
Fly-ash-based geopolymerFAG
Ordinary Portland cementOPC
Direct currentDC
Water glassNa2O·nSiO2
Sodium hydroxideNaOH

References

  1. Elmesalami, N.; Celik, K. A critical review of engineered geopolymer composite: A low-carbon ultra-high-performance concrete. Constr. Build. Mater. 2022, 346, 128491. [Google Scholar] [CrossRef]
  2. Shehata, N.; Mohamed, O.A.; Sayed, E.T.; Abdelkareem, M.A.; Olabi, A.G. Geopolymer concrete as green building materials: Recent applications, sustainable development and circular economy potentials. Sci. Total Environ. 2022, 836, 155577. [Google Scholar] [CrossRef] [PubMed]
  3. El Fadili, H.; El Mahi, M.; Aziz, A.; Moussadik, A.; Devkota, S.; Lotfi, E.M. Preparation of greener geopolymer binder based fly-ash: An effective strategy toward carbon neutrality. Ceram. Int. 2024, 50, 27018–27026. [Google Scholar] [CrossRef]
  4. Yang, C.; You, J.J.; Huang, Y.W.; Ji, X.M.; Song, Q.Y.; Liu, Q.F. Low-carbon enhancement of fly-ash geopolymer concrete: Lateral deformation, microstructure evolution and environmental impact. J. Clean. Prod. 2023, 422, 138610. [Google Scholar] [CrossRef]
  5. Marathe, S.; Sadowski, Ł. Developments in biochar incorporated geopolymers and alkali activated materials: A systematic literature review. J. Clean. Prod. 2024, 469, 143136. [Google Scholar] [CrossRef]
  6. Lokuge, W.; Wilson, A.; Gunasekara, C.; Law, D.W.; Setunge, S. Design of fly-ash geopolymer concrete mix proportions using Multivariate Adaptive Regression Spline model. Constr. Build. Mater. 2018, 166, 472–481. [Google Scholar] [CrossRef]
  7. Davidovits, J. Geopolymers: Ceramic-like inorganic polymers. J. Ceram. Sci. Technol. 2017, 8, 335–350. [Google Scholar] [CrossRef]
  8. Jindal, B.B. Investigations on the properties of geopolymer mortar and concrete with mineral admixtures: A review. Constr. Build. Mater. 2019, 227, 116644. [Google Scholar] [CrossRef]
  9. Li, J.; Liu, X.; Cai, C.; Li, F.; Jin, H.; Zhang, S.; Sheng, N.; Wang, T.; Ngo, T. Microstructure, strength development mechanism and CO2 emission assessments of molybdenum tailings collaborative fly-ash geopolymers. Case Stud. Constr. Mater. 2024, 21, e03608. [Google Scholar] [CrossRef]
  10. Assi, L.N.; Carter, K.; Deaver, E.; Ziehl, P. Review of availability of source materials for geopolymer/sustainable concrete. J. Clean. Prod. 2020, 263, 121477. [Google Scholar] [CrossRef]
  11. Wastiels, J.; Wu, X.; Faignet, S.; Patfoort, G. Mineral polymer based on fly-ash. J. Resour. Manag. Technol. 1994, 22, 135–141. [Google Scholar]
  12. Bakharev, T. Resistance of geopolymer materials to acid attack. Cem. Concr. Res. 2004, 35, 658–670. [Google Scholar] [CrossRef]
  13. Zhang, B. Durability of sustainable geopolymer concrete: A critical review. Sustain. Mater. Technol. 2024, 40, e00882. [Google Scholar] [CrossRef]
  14. Ren, X.; Wang, F.; He, X.; Hu, X. Resistance and durability of fly-ash based geopolymer for heavy metal immobilization: Properties and mechanism. RSC Adv. 2024, 14, 12580–12592. [Google Scholar] [CrossRef] [PubMed]
  15. Zhang, P.; Sun, X.; Wang, F.; Wang, J. Mechanical properties and durability of geopolymer recycled aggregate concrete: A review. Polymers 2023, 15, 615. [Google Scholar] [CrossRef] [PubMed]
  16. Wang, C.; Chowdhury, S.; Liang, X. Transmission Structure Corrosion Due to Stray-currents and the Inspection and Mitigation Techniques: A Review. IEEE Trans. Ind. Appl. 2024, 60, 4677–4692. [Google Scholar] [CrossRef]
  17. Hu, Q.; Zhang, Z.; Zhang, Y.; Wang, F.; Su, Z.; Fang, H. Unraveling mechanisms and failures of stray-current corrosion in urban Subway adjacent pipeline networks through statistical insights and 3D simulation. Sci. Total Environ. 2024, 927, 172407. [Google Scholar] [CrossRef] [PubMed]
  18. Li, G.; Wang, B.; Panesar, D.K. Effect of stray-current on cement-based materials under sulfate attack. J. Mater. Civ. Eng. 2022, 34, 04021439. [Google Scholar] [CrossRef]
  19. Solgaard, A.O.S.; Carsana, M.; Geiker, M.R.; Küter, A.; Bertolini, L. Experimental observations of stray-current effects on steel fibres embedded in mortar. Corros. Sci. 2013, 74, 1–12. [Google Scholar] [CrossRef]
  20. Mariscotti, A. Electrical safety and stray-current protection with platform screen doors in DC rapid transit. IEEE Trans. Transp. Electrif. 2021, 7, 1724–1732. [Google Scholar] [CrossRef]
  21. Wang, C.; Qin, G. Corrosion of underground infrastructures under metro-induced stray-current: A review. Corros. Commun. 2024, 14, 23–38. [Google Scholar] [CrossRef]
  22. Lapiro, I.; Eid, R.; Kovler, K. Passive protection of reinforced concrete columns against stray-currents and chloride attack. Constr. Build. Mater. 2025, 472, 140814. [Google Scholar] [CrossRef]
  23. Wang, A.; Lin, S.; Hu, Z.; Li, J.; Wang, F.; Wu, G.; He, Z. Evaluation model of DC current distribution in AC power systems caused by stray-current of DC metro systems. IEEE Trans. Power Deliv. 2020, 36, 114–123. [Google Scholar] [CrossRef]
  24. Vranešić, K.; Bhagat, S.; Mariscotti, A.; Vail, R. Measures and prescriptions to reduce stray-current in the design of new track corridors. Energies 2023, 16, 6252. [Google Scholar] [CrossRef]
  25. Susanto, A.; Koleva, D.A.; Copuroglu, O.; van Beek, K.; van Breugel, K. Mechanical, electrical and microstructural properties of cement-based materials in conditions of stray-current flow. J. Adv. Concr. Technol. 2013, 11, 119–134. [Google Scholar] [CrossRef]
  26. Aghajani, A.; Urgen, M.; Bertolini, L. Effects of DC stray-current on concrete permeability. J. Mater. Civ. Eng. 2016, 28, 04015177. [Google Scholar] [CrossRef]
  27. Tennakoon, C.; Shayan, A.; Sanjayan, J.G.; Xu, A. Chloride ingress and steel corrosion in geopolymer concrete based on long term tests. Mater. Des. 2017, 116, 287–299. [Google Scholar] [CrossRef]
  28. Ekaputri, J.J.; Lie, H.A.; Fujiyama, C.; Shovitri, M.; Alami, N.H.; Setiamarga, D.H.E. The effect of alkali concentration on chloride penetration in geopolymer concrete. IOP Conf. Ser. Mater. Sci. Eng. 2019, 615, 012114. [Google Scholar] [CrossRef]
  29. Ganesan, N.; Abraham, R.; Raj, S.D. Durability characteristics of steel fibre reinforced geopolymer concrete. Constr. Build. Mater. 2015, 93, 471–476. [Google Scholar] [CrossRef]
  30. Bertolini, L.; Carsana, M.; Pedeferri, P. Corrosion behaviour of steel in concrete in the presence of stray-current. Corros. Sci. 2007, 49, 1056–1068. [Google Scholar] [CrossRef]
  31. Shahedan, N.F.; Hadibarata, T.; Abdullah, M.M.A.B.; Jusoh, M.N.H.; Abd Rahim, S.Z.; Isia, I.; Bras, A.A.; Bouaissi, A.; Juwono, F.H. Potential of fly-ash geopolymer concrete as repairing and retrofitting solutions for marine infrastructure: A review. Case Stud. Constr. Mater. 2024, 20, e03214. [Google Scholar] [CrossRef]
  32. Jin, H.; Li, Z.; Zhang, W.; Liu, J.; Xie, R.; Tang, L.; Zhu, J. Iodide and chloride ions diffusivity, pore characterization and microstructures of concrete incorporating ground granulated blast furnace slag. J. Mater. Res. Technol. 2022, 16, 302–321. [Google Scholar] [CrossRef]
  33. Shi, X.; Xie, N.; Fortune, K.; Gong, J. Durability of steel reinforced concrete in chloride environments: An overview. Constr. Build. Mater. 2012, 30, 125–138. [Google Scholar] [CrossRef]
  34. Chen, X.; Mondal, P. Effects of NaOH amount on condensation mechanism to form aluminosilicate, case study of geopolymer gel synthesized via sol–gel method. J. Sol-Gel Sci. Technol. 2020, 96, 589–603. [Google Scholar] [CrossRef]
  35. Crundwell, F.K. The mechanism of dissolution of minerals in acidic and alkaline solutions: Part II Application of a new theory to silicates, aluminosilicates and quartz. Hydrometallurgy 2014, 149, 265–275. [Google Scholar] [CrossRef]
  36. Han, W.; Lv, Y.; Wang, S.; Qiao, J.; Zou, C.; Su, M.; Peng, H. Effects of Al/Na and Si/Na molar ratios on the alkalinity of metakaolin-based geopolymer pore solutions. Materials 2023, 16, 1929. [Google Scholar] [CrossRef] [PubMed]
  37. Shen, Y.; Peng, C.; Hao, J.; Bai, Z.; Li, Y.; Yang, B. High temperature resistance of desert sand concrete: Strength change and intrinsic mechanism. Constr. Build. Mater. 2022, 327, 126948. [Google Scholar] [CrossRef]
  38. Xu, L.; Wang, J.; Li, K.; Hao, T.; Li, Z.; Li, L.; Ran, B.; Du, H. New insights on dehydration at elevated temperature and rehydration of GGBS blended cement. Cem. Concr. Compos. 2023, 139, 105068. [Google Scholar] [CrossRef]
  39. Hua, C.; Tang, R.; Lu, X. Radon emission characteristics and pore structure evolution of self-compacting concrete with silica fume-molybdenum tailings under different curing environments. J. Build. Eng. 2024, 97, 110769. [Google Scholar] [CrossRef]
  40. Lin, L.; Wang, S.; Zhang, P.; Li, J.; Wang, S.; Zhong, J.; Zeng, L.; Qiu, X. Effect of curing regime on the strength development and microstructure evolution of high strength concrete. J. Build. Eng. 2023, 78, 107750. [Google Scholar] [CrossRef]
  41. Xu, G.; Tian, Q.; Miao, J.; Liu, J. Early-age hydration and mechanical properties of high volume slag and fly-ash concrete at different curing temperatures. Constr. Build. Mater. 2017, 149, 367–377. [Google Scholar] [CrossRef]
  42. You, C.; Qian, J.; Qin, J.; Wang, H.; Wang, Q.; Ye, Z. Effect of early hydration temperature on hydration product and strength development of magnesium phosphate cement (MPC). Cem. Concr. Res. 2015, 78, 179–189. [Google Scholar] [CrossRef]
  43. Sun, L.; Pang, X.; Ghabezloo, S.; Wang, H.; Sun, J. Hydration kinetics and strength retrogression mechanism of silica-cement systems in the temperature range of 110° C–200° C. Cem. Concr. Res. 2023, 167, 107120. [Google Scholar] [CrossRef]
  44. Li, X.; Hao, J. Orthogonal test design for optimization of synthesis of super early strength anchoring material. Constr. Build. Mater. 2018, 181, 42–48. [Google Scholar] [CrossRef]
  45. Chen, Q.; Zhang, Q.; Zhu, T.; Li, B.; Liu, W.; Yang, H.; Xu, J.; Jiang, Z.; Zhu, H. Coupling effect of concrete cracks and stray-current on chloride-induced corrosion of rebar. Constr. Build. Mater. 2024, 449, 138403. [Google Scholar] [CrossRef]
Figure 1. Distribution of fly-ash particle size.
Buildings 15 02514 g001
Figure 2. Microscopic morphology of fly-ash.
Buildings 15 02514 g002
Figure 3. Experimental devices for coupled dissolution with stray-current and soft-water.
Buildings 15 02514 g003
Figure 4. Influencing factors of FAG compressive strength. (a) Compressive strength at different W/B ratios. (b) Compressive strength at different Ms values. (c) Compressive strength at different alkali contents (AC).
Buildings 15 02514 g004
Figure 5. The influence of curing temperatures and times on the 28 d compressive strength of FAG.
Buildings 15 02514 g005
Figure 6. Influence of curing temperatures and times on the 90 d compressive strength of FAG.
Buildings 15 02514 g006
Figure 7. Comparison of compressive strength of concrete under different curing conditions.
Buildings 15 02514 g007
Figure 8. Compressive strength of FAG at different corrosion times at different stray-current voltages.
Buildings 15 02514 g008
Figure 9. Compressive strength of FAG with different water to ash ratios at different corrosion times at 20 V voltage.
Buildings 15 02514 g009
Figure 10. Compressive strength of FAG with different moduli at different corrosion times at 20 V voltage.
Buildings 15 02514 g010
Figure 11. Compressive strength of FAG with different ACs at different corrosion times at 20 V voltage.
Buildings 15 02514 g011
Table 1. Main chemical components of fly-ash (%).
ComponentFe2O3CaOSiO2Al2O3TiO2SO3MgOK2OP2O5BaO Na2O
Content5.463.7153.8629.452.041.840.621.530.540.230.44
Table 2. Fly-ash geopolymer cementitious material ratio.
NumberW/BMsAC (%)Water Glass (g)NaOH (g)Water (g)
W10.261.46287.744.779.0
W20.281.46287.744.799.0
W30.301.46287.744.7119.0
W40.321.46287.744.7139.0
W50.341.46287.744.7159.0
W60.361.46287.744.7179.0
M10.301.06205.554.0170.7
M20.301.26246.649.4144.9
M30.301.46287.744.7119.0
M40.301.66328.740.093.2
M50.301.86369.835.367.3
M60.302.06410.930.741.4
A10.301.43143.822.3209.5
A20.301.44191.829.8179.3
A30.301.45239.737.2149.2
A40.301.46287.744.7119.0
A50.301.47335.652.188.8
A60.301.48383.559.658.7
A70.301.49431.567.028.5
Table 3. Curing system design of high-temperature curing.
NumberTemperature (°C)Time (h)
C1Normal temperature-
G17012
G27024
G37036
G47048
G57512
G67524
G77536
G87548
G98012
G108024
G118036
G128048
G138512
G148524
G158536
G168548
Table 4. The levels of factors in the orthogonal design.
FactorsW/BMsAC
10.281.04
20.301.25
30.321.46
40.341.67
Table 5. Range analysis of reduction rate of compressive strength.
FactorsK1K2K3K4k1k2k3k4R
W/B94.1282.01104.12 107.56 23.53 20.5026.0326.896.39
Ms95.0890.19 98.27 104.27 23.77 22.5524.5726.073.52
AC114.4999.37 84.93 89.02 28.62 24.8421.2322.267.39
Note: Ki denotes the sum of the evaluation index values corresponding to the i-th level of a given factor; ki represents the average value of the evaluation index at the i-th level, calculated as ki = Ki/number of repetitions; R denotes the range, defined as R = kmax − kmin.
Table 6. Variance of reduction rate of compressive strength.
VarianceSum of SquaresDegree of FreedomMean SquareFSignificance
W/B98.76332.925.10Significant
Ms26.1138.701.35Insignificant
AC130.23343.416.73Significant
e38.7066.45
Total293.8015
Disclaimer/Publisher’s Note: The statements, opinions and data contained in all publications are solely those of the individual author(s) and contributor(s) and not of MDPI and/or the editor(s). MDPI and/or the editor(s) disclaim responsibility for any injury to people or property resulting from any ideas, methods, instructions or products referred to in the content.

