1. Introduction
With the rapid advancement of urbanization, underground structures have become increasingly prevalent in civil engineering projects. Among these, municipal underground pipelines—constructed earlier than many modern standards—often preceded the development of normative design codes. After nearly half a century of service, these pipelines have experienced varying degrees of structural deterioration due to aging, environmental influences, and inadequate maintenance [
1]. Many pipelines show signs of deformation and damage after 20 to 30 years of operation, posing significant risks to urban infrastructure.
Concrete box culverts are widely used in municipal underground pipe networks due to their minimal excavation requirements, ease of installation, simple cross-sectional geometry, and high spatial utilization. These culverts serve multiple purposes, including flood drainage, stormwater and sewage conveyance [
2], large-capacity water storage, utility tunnels for electricity, telecommunications, heating, and gas, as well as underground pedestrian walkways and tundra passages. However, the rectangular geometry of box culverts results in non-uniform stress distribution, making them more prone to degradation under long-term loading compared to circular pipelines [
3]. This is especially problematic for older culverts built with low design fortification standards and without adequate seismic protection measures, leading to accelerated structural deterioration and increasing threats to surface-level transportation safety [
4].
Traditionally, the reinforcement of underground box culverts involves excavation along the road axis [
5], followed by direct structural strengthening or retrofitting. In some cases, the load path is modified using cast-in-place slabs and newly installed bored piles to redistribute vertical loads away from aging culverts [
6]. While effective, these interventions significantly disrupt road traffic and urban functionality [
7]. In contrast, trenchless rehabilitation technologies offer clear advantages: low cost, minimal disruption to surroundings, faster implementation, and improved construction safety.
Trenchless technologies for pipeline rehabilitation have been widely applied for over 40 years and are considered mature [
8]. Common methods include the sliplining method [
9,
10], traditional lining [
11,
12], cured-in-place pipe (CIPP) [
13,
14], spiral wound liners [
15], and pipe bursting techniques [
16,
17]. While their mechanisms differ, these methods generally focus on reinforcing the inner surface of damaged pipelines—largely evolved from solutions for circular pipes. In terms of scope, they range from localized reinforcement to full structural lining. Cement-mortar lining, for example, has been used since the early 1900s for the rehabilitation of riveted steel pipes [
18,
19,
20], and spray-applied cement mortar is now a mature repair method for underground pipelines [
21]. Hsu et al. [
22] validated CIPP through composite joint testing and showed it could restore hoop strength. Azoor and Benjamin [
23] demonstrated that polymer spray-lined pipes maintained working pressure under load. Shou et al. [
24] applied numerical modeling to explore the mechanical performance of pipelines repaired by CIPP and found it effective in reducing stress concentration. Allouche et al. [
13] reported excellent long-term results in a pilot study evaluating CIPP liners after up to 25 years of service.
Among the newer approaches, the 3S (Simple See-through Segment) modular rehabilitation method, developed in Japan, has shown promise for square-section box culvert rehabilitation. While this method has been successfully applied in multiple countries, it still has limitations. Most existing trenchless methods—including CIPP, spraying, and spiral lining—were designed for circular pipes and remain semi-structural when applied to rectangular culverts. They often reduce the effective flow cross-section and cannot adequately restore structural load-bearing capacity. Therefore, it is of great importance to develop a new and efficient structural repair technology and verify its reliability and feasibility.
The Finite Element Method (FEM) has become a cornerstone in analyzing complex underground structures due to its ability to model irregular geometries, material nonlinearity, and soil-structure interactions. This review synthesizes recent advancements in FEM applications for underground box culverts, focusing on structural behavior analysis and progressive extension to reinforcement strategies. Wang et al. [
25] employed 3D nonlinear FEM to simulate shield tunneling beneath railway box culverts, revealing deformation patterns and stress concentration zones. Their model accurately predicted culvert displacement and provided mitigation measures. Barros et al. [
26] integrated FEMIX 4.0 to model SFRC box culverts, demonstrating enhanced load-bearing capacity and energy dissipation under static/dynamic loads. The interface elements between soil and concrete were pivotal in simulating realistic behavior. Barros et al. [
27] proposed a Mohr-Coulomb-based interface model within FEMIX, enabling tensionless stress transfer simulations. This allowed partial replacement of traditional rebars with SFRC, reducing reinforcement by 95%. The same study by Barros et al. [
27] validated that FEM-driven optimization could cut reinforcement from 118.5 kg/m
3 to 5.1 kg/m
3 while maintaining safety, revolutionizing cost-effective culvert retrofitting. Feng and Gray (2018) [
28] utilized FEM to simulate fracture behaviors in wellbore strengthening (analogous to culverts). Their damage model predicted delamination under variable-mode loading, informing repair strategies for cracked culverts. Marinkovic and Zehn (2019) [
29] surveyed model-order reduction techniques for real-time FEM, crucial for monitoring rehabilitated culverts under live loads.
In this paper, a construction method based on prefabricated high-strength thin-walled concrete segments for lining reinforcement inside box culverts is proposed to address the limitations of existing trenchless rehabilitation technologies for box culvert structures. First, referring to a practical engineering project, the construction process is validated using a full-scale 1:1 underground box culvert mock-up. Following successful installation, a graded stacking load test is conducted on the upper part of the reinforced overall structure to investigate the deformation characteristics and the interaction behavior at the interface between the new lining and the original structure. These observations provide valuable guidance for optimizing reinforcement design. Finally, a finite element simulation of the stacking load test is performed to analyze the mechanical response during the experimental process and to explore key factors influencing reinforcement effectiveness. The approach draws inspiration from recent research on composite structural behavior, such as the axial bearing capacity improvements observed in concrete-filled steel tubular columns with internal prestressing [
30] and the influence of interfacial bonding and structural parameters on the load transfer mechanisms in reinforced CFST columns [
31], providing theoretical support for the proposed reinforcement method.
3. Construction Method and On-Site Construction
3.1. Construction Method
This section details the construction sequence, emphasizing critical procedures including segment transportation, assembly, and composite reinforcement. Where high groundwater levels are encountered, dewatering measures are recommended. Operational functions of the pipeline section must be suspended during pre-construction preparations.
Construction method selection depends on site-specific box culvert conditions, including internal dimensions and accessibility. Internal clearances dictate segment weight limitations and assembly space, directly influencing construction efficiency. Two methods are proposed based on segment placement approaches: pull-in installation (
Figure 2) and manual in situ assembly.
Pull-in installation (
Figure 2): Prefabricated concrete segments are lowered through maintenance shafts into the box culvert and assembled to form an internal liner. Longitudinal continuity is achieved via post-tensioned steel strands, followed by grout injection into the annular space between the original structure and new liner. Construction proceeded sequentially as follows:
Condition assessment of the existing culvert
Sediment removal and interior profiling
Guide rail installation
Segment hoisting
Manual assembly beneath maintenance shafts
Segment pull-in along the culvert axis
Post-tensioning of longitudinal strands
Grout injection and backfilling.
Manual in situ construction: Workers hoist prefabricated concrete segments through maintenance shafts and transport them to reinforcement positions using mechanical aids. Following preliminary assembly, connectors are secured to ensure longitudinal continuity, with subsequent grout injection into the interstructural void. The construction sequence comprises:
Condition assessment of the existing culvert
Sediment dredging and interior profiling
Segment hoisting
Mechanical transport within the culvert
In situ manual assembly
Grout injection and backfilling
Spatial constraints in small-to-medium box culverts impede worker mobility, reducing construction efficiency. For larger culverts permitting human access, segment weight often exceeds feasible handling limits, compromising longitudinal joint integrity in pull-in installations. Under such conditions, manual in situ construction provides a more viable alternative.
3.2. On-Site Construction
The testing site is an open area next to a materials warehouse belonging to Beijing Urban Drainage Group Co., Ltd. located in Changping District, Beijing. A full-scale 5m-long masonry drainage box culvert has been constructed manually. The top cover of the square ditch has a maintenance manhole (inspection well), the size of which is determined based on the actual situation.
The specific implementation method of trenchless reinforcement construction involves lifting and installing prefabricated segments for reinforcement in the full-scale masonry square ditch that was built manually. Then, grouting is carried out between the segments and the original walls through the grout hole that has been reserved on the segments. The upper part is subjected to a design bearing capacity verification heap load test after the reinforcement treatment meets the requirements.
Since it is currently winter, meeting the necessary strength requirements in a short amount of time after grouting treatment is proving to be difficult. In addition, the construction process is complex, and the structure becomes difficult to excavate after the testing is completed. Therefore, for this test, artificial sand filling is being used to fill the gap between the segments and the original wall. However, during the stacking test stage, it is challenging to manually set up instruments and observe the testing phenomenon by going down through the well. This method also poses potential safety hazards. Consequently, once the prefabricated structure is completed, one end of the pipeline is dug up to allow personnel access. The on-site tests are divided into two parts: prefabricated segment assembly construction implementation and the loading test. The ditch’s internal dimensions are W × H = 2000 × 1800 mm, and the maintenance manhole’s pore diameter is 700 mm.
In this experiment, the drainage box culvert was manually built temporarily, so there was no need for the original box culvert investigation, dredging, and trimming. Therefore, the main construction process for assembling the prefabricated concrete segments in the original box culvert included segment hoisting, transportation, and in-pipe assembly.
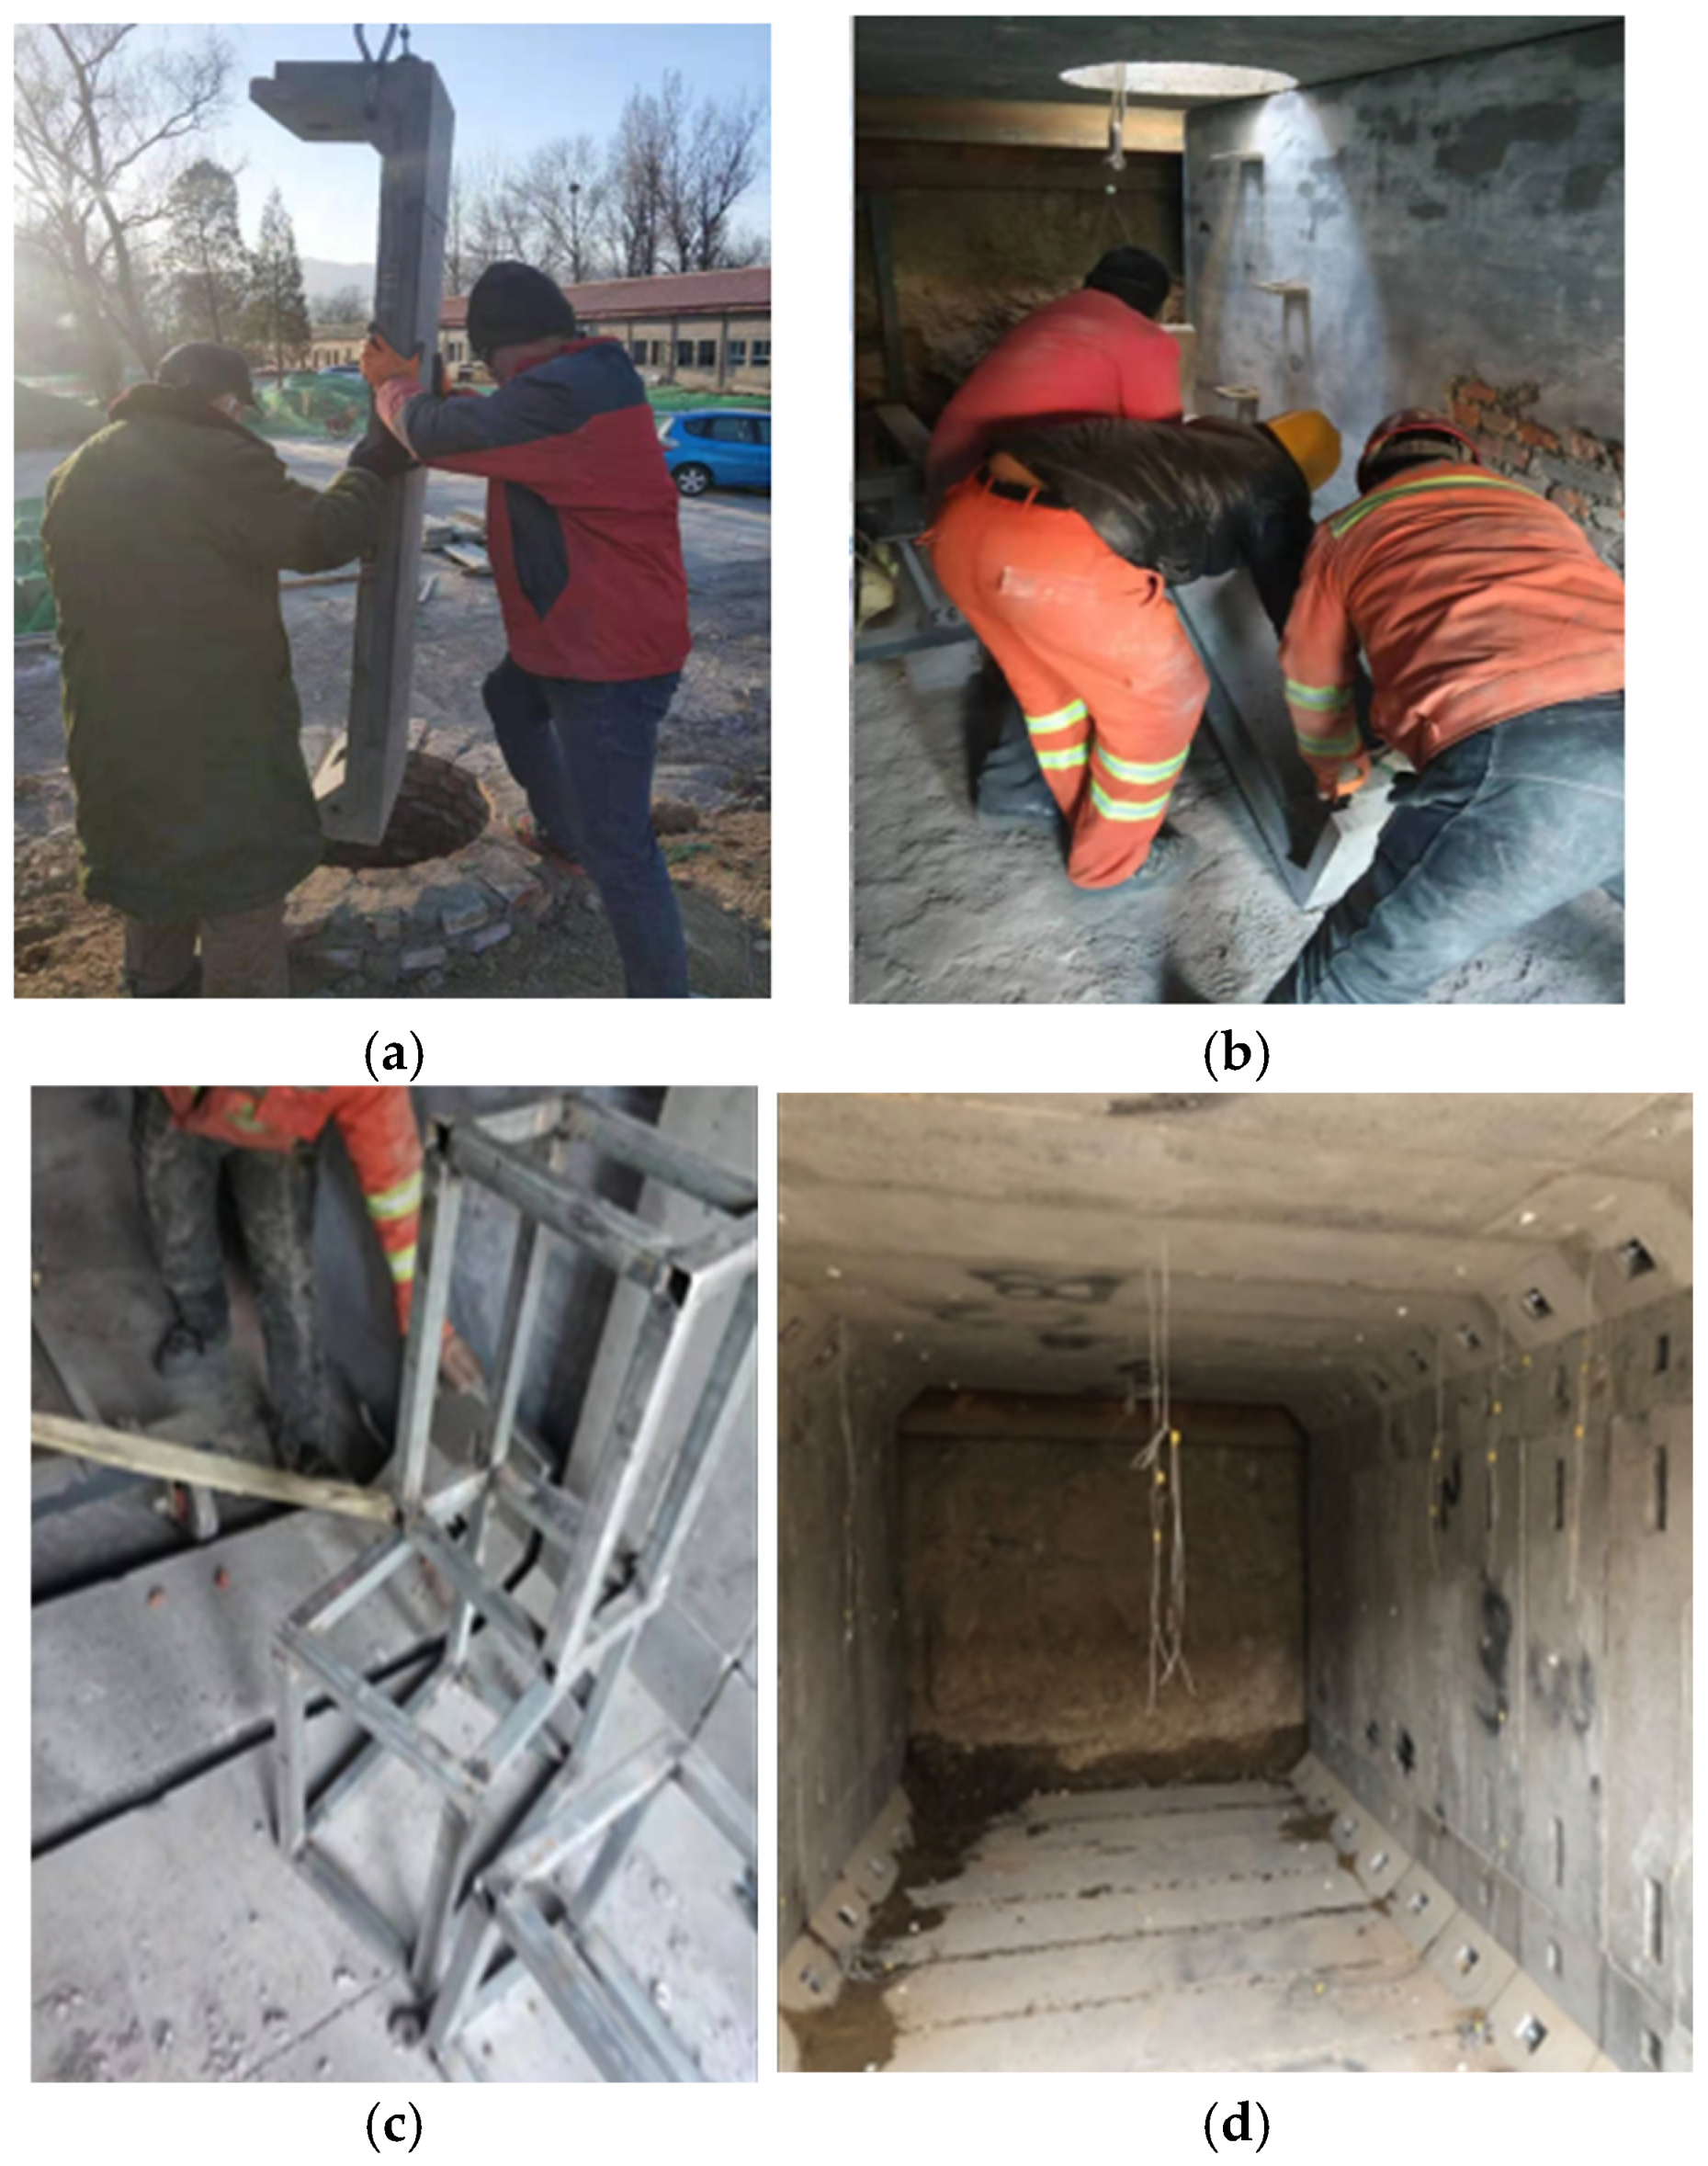
3.2.1. Hoisting and Transportation
To hoist and transport the prefabricated concrete segments, a crane with an 8-ton capacity was used for vertical transportation through the maintenance manhole. For horizontal transportation in the box culvert, a self-made mobile forklift was used. The hoisting and transportation process followed these steps:
Install special hoisting connection rings in the segment’s hoisting holes and connect the hook;
Lift the segment vertically and align the lower end with the maintenance manhole (shown in
Figure 3);
Assist in adjusting the position in the box culvert and lower the segment to the manhole’s bottom, manually adjusting the direction and position (
Figure 3);
Secure the segment’s lower end to the mobile forklift and move the forklift horizontally while simultaneously lowering the segment until it lands steadily on the forklift;
Manually push the mobile forklift to move the segment to the reinforced position.
3.2.2. Assembly In-Pipe
This process was primarily used to assess the feasibility of assembling prefabricated concrete segments in the box culvert. After passing the transportation test, the segments were installed in the box culvert ring by ring (
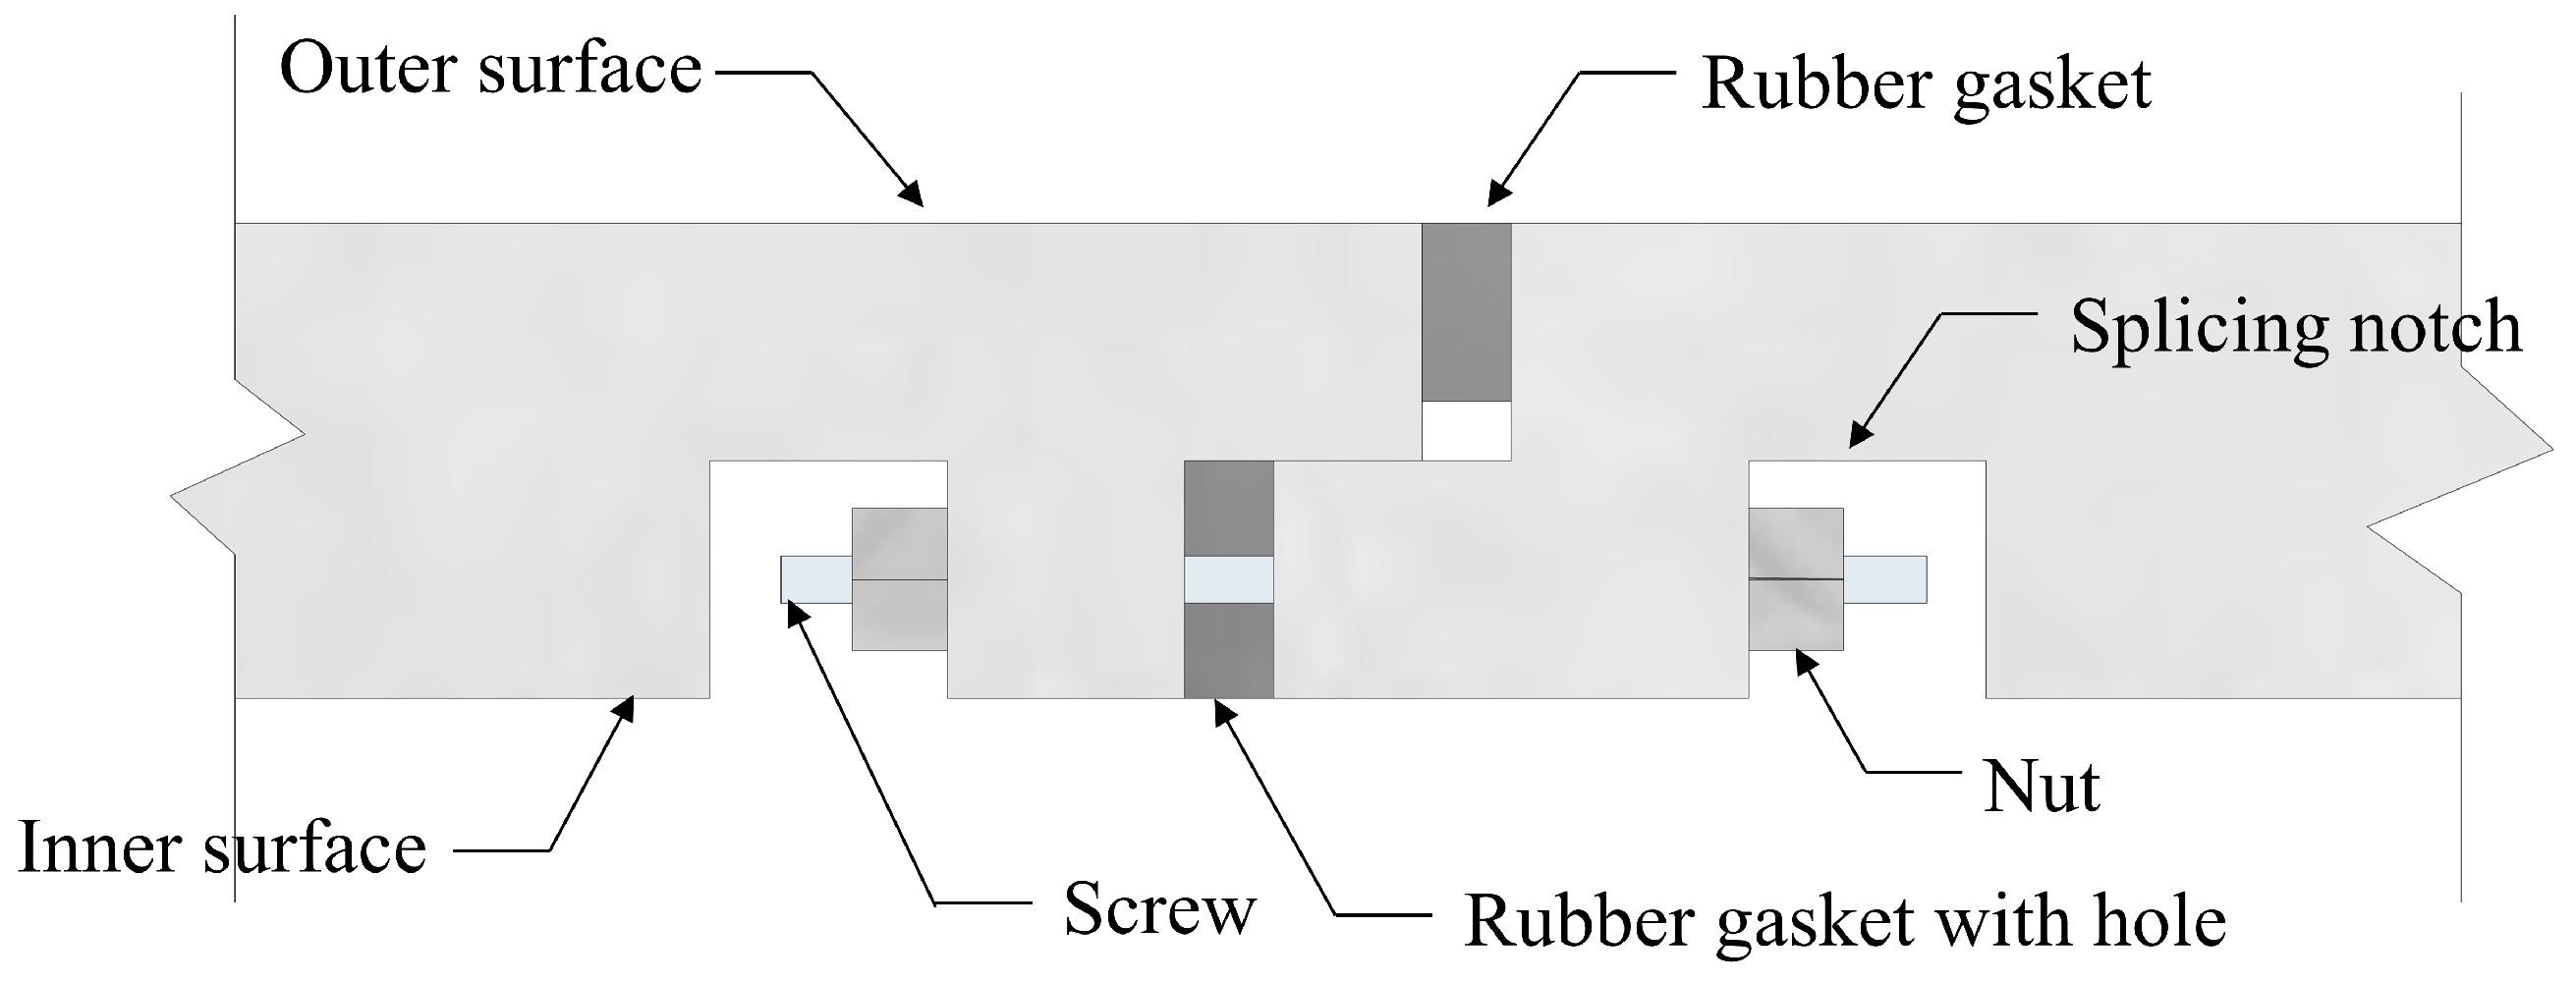
Figure 3). A detailed illustration of a splicing joint is shown in
Figure 4. The single-ring assembly mainly involves the following steps:
Use the mobile forklift to transport and position the bottom segment, side segment, and top segment vertically in sequence.
Install waterproof rubber gaskets (
Figure 4) and connectors to complete the single-ring assembly.
After splicing a single-ring, tighten the connecting nuts, and check the size and quality of the splicing joint.
Install a sealing rubber gasket on the longitudinal splicing socket after passing the quality check, and then bond it with structural glue or waterproof resin.
Tighten the longitudinal connection, and then tighten the splicing nuts in the single-ring again.
Fill the gap between the two-layer structures with grout and compact it.
It is worth noting that the assembly process should be carried out in strict accordance with the construction drawing and the assembly sequence to ensure the accuracy and quality of the assembly. Any problems found during the assembly process should be resolved in a timely manner to avoid affecting the construction progress and quality.
4. Stacking Load Test
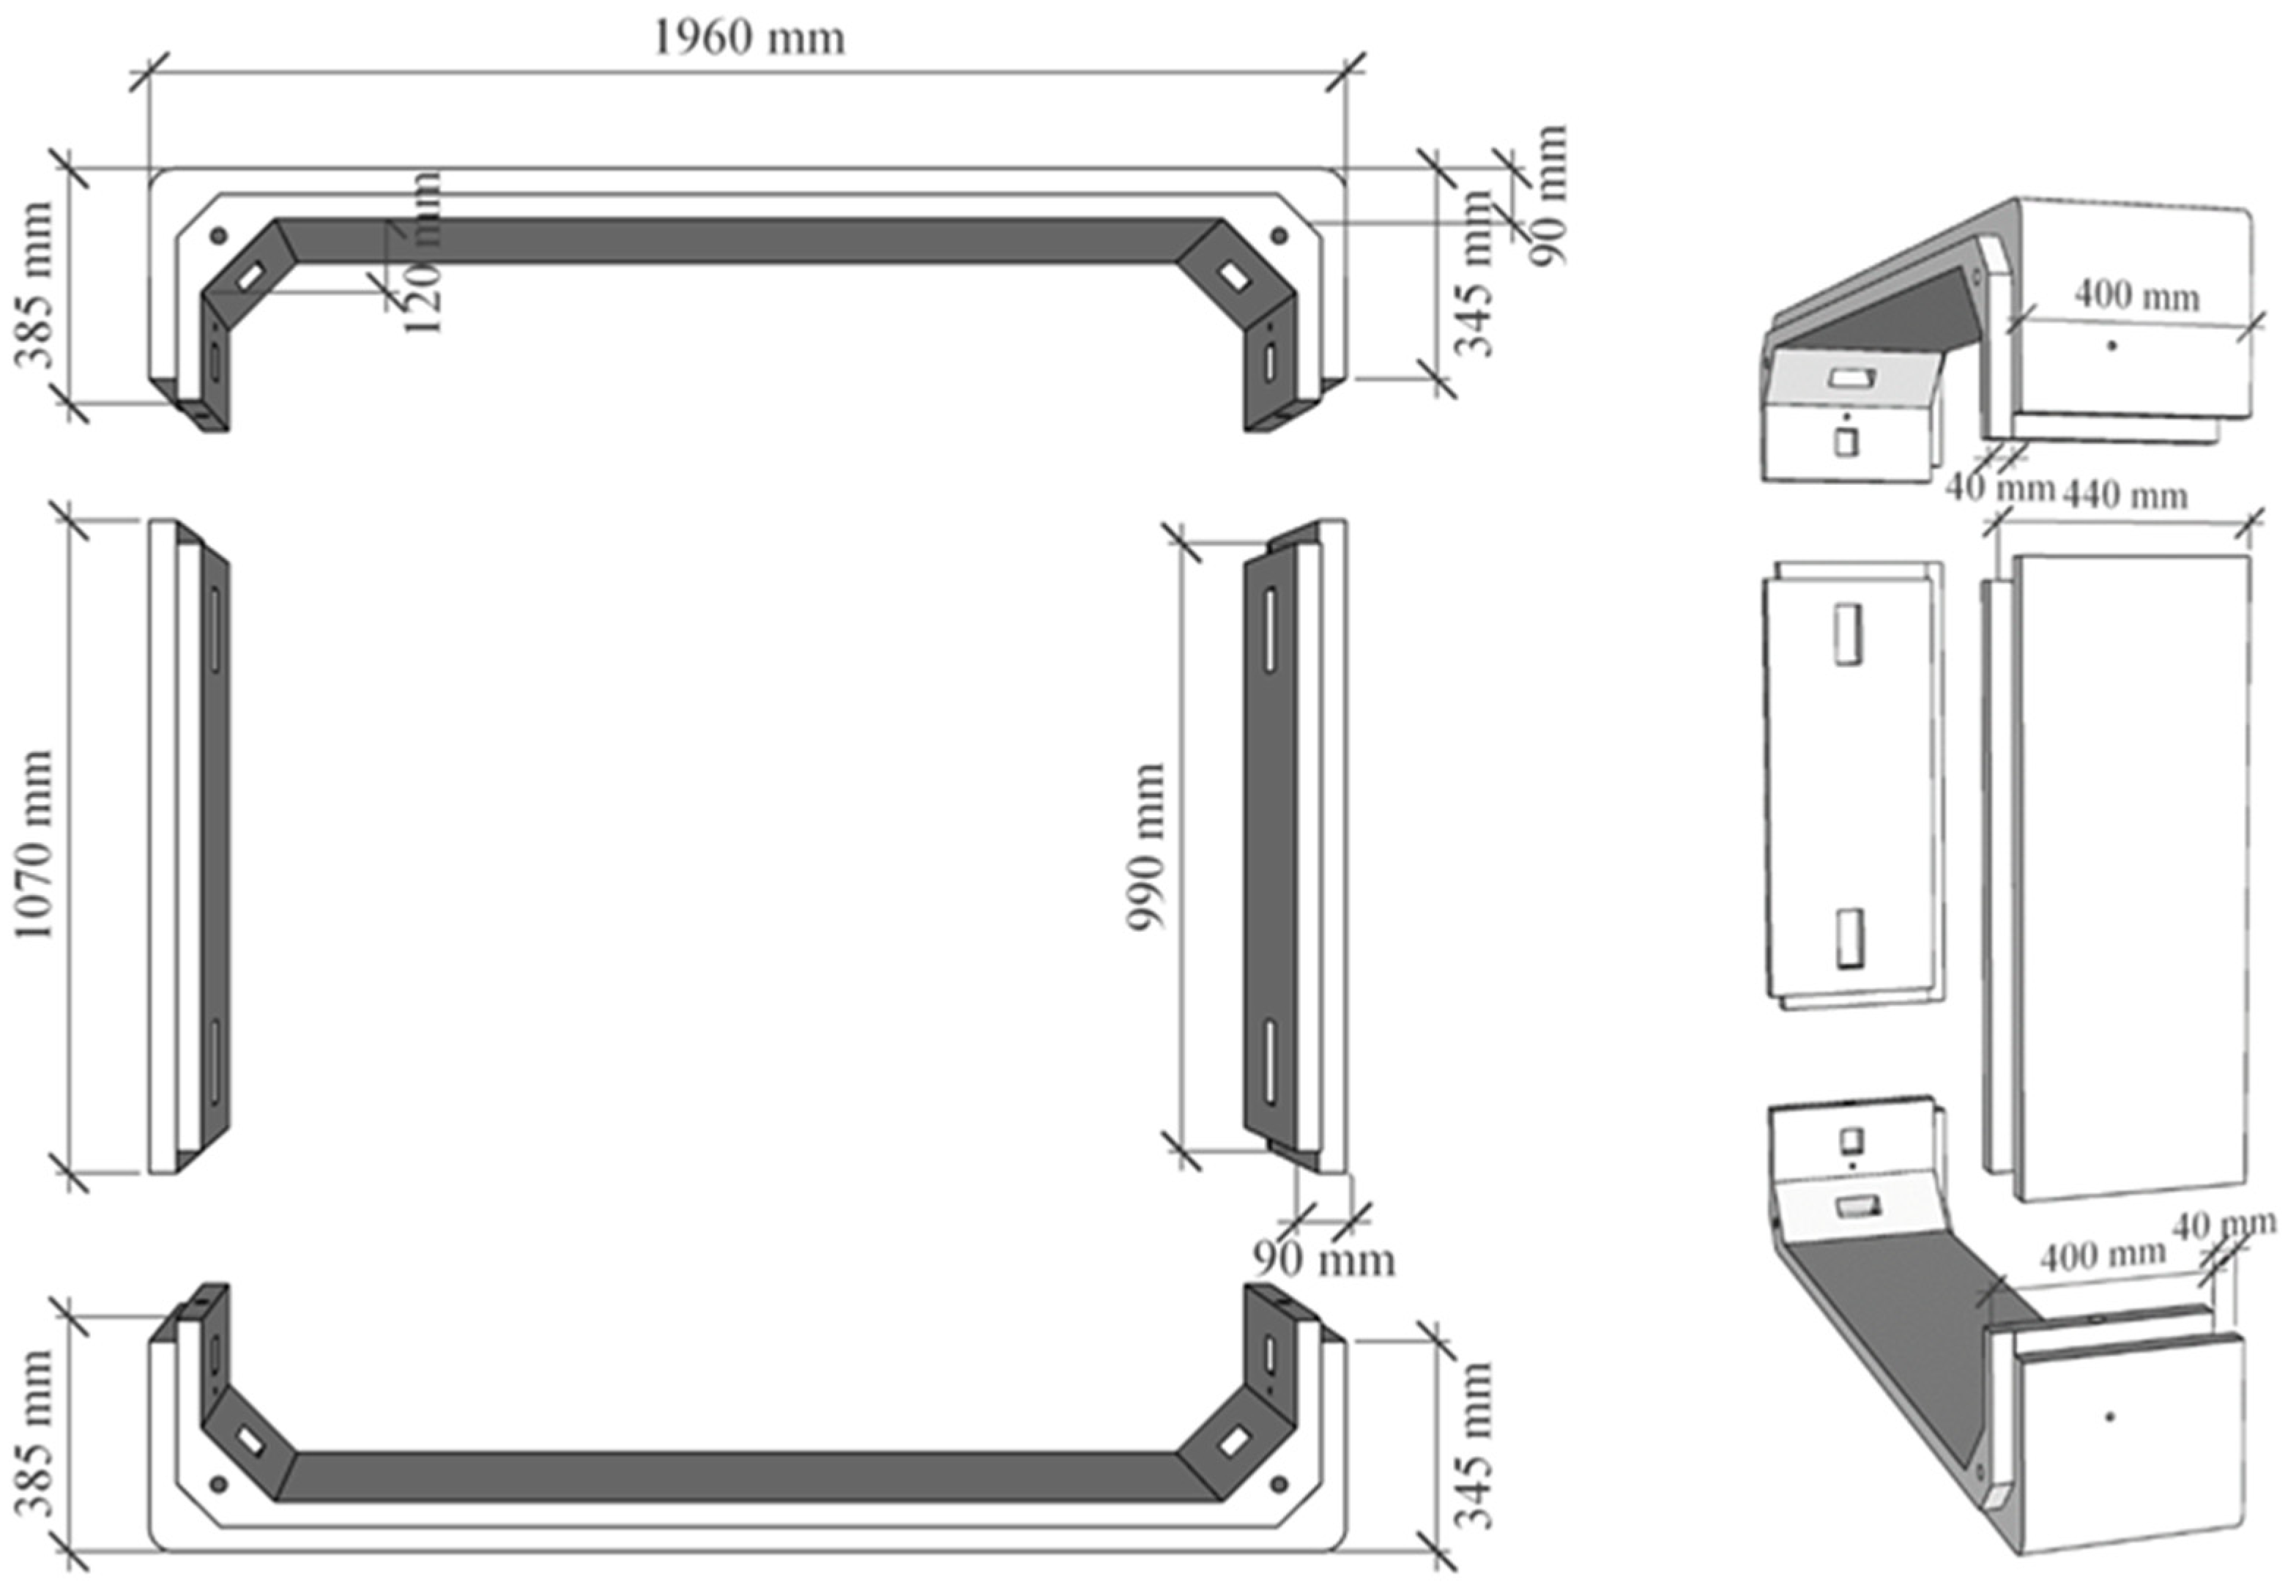
The material and geometric parameters of the prefabricated segments employed in this experimental study are detailed in
Figure 5 and
Table 1. This study focused on quantifying the bearing capacity [
32] and characterizing failure mechanisms of the segments when constrained by the original box culvert structure, replicating actual field conditions.
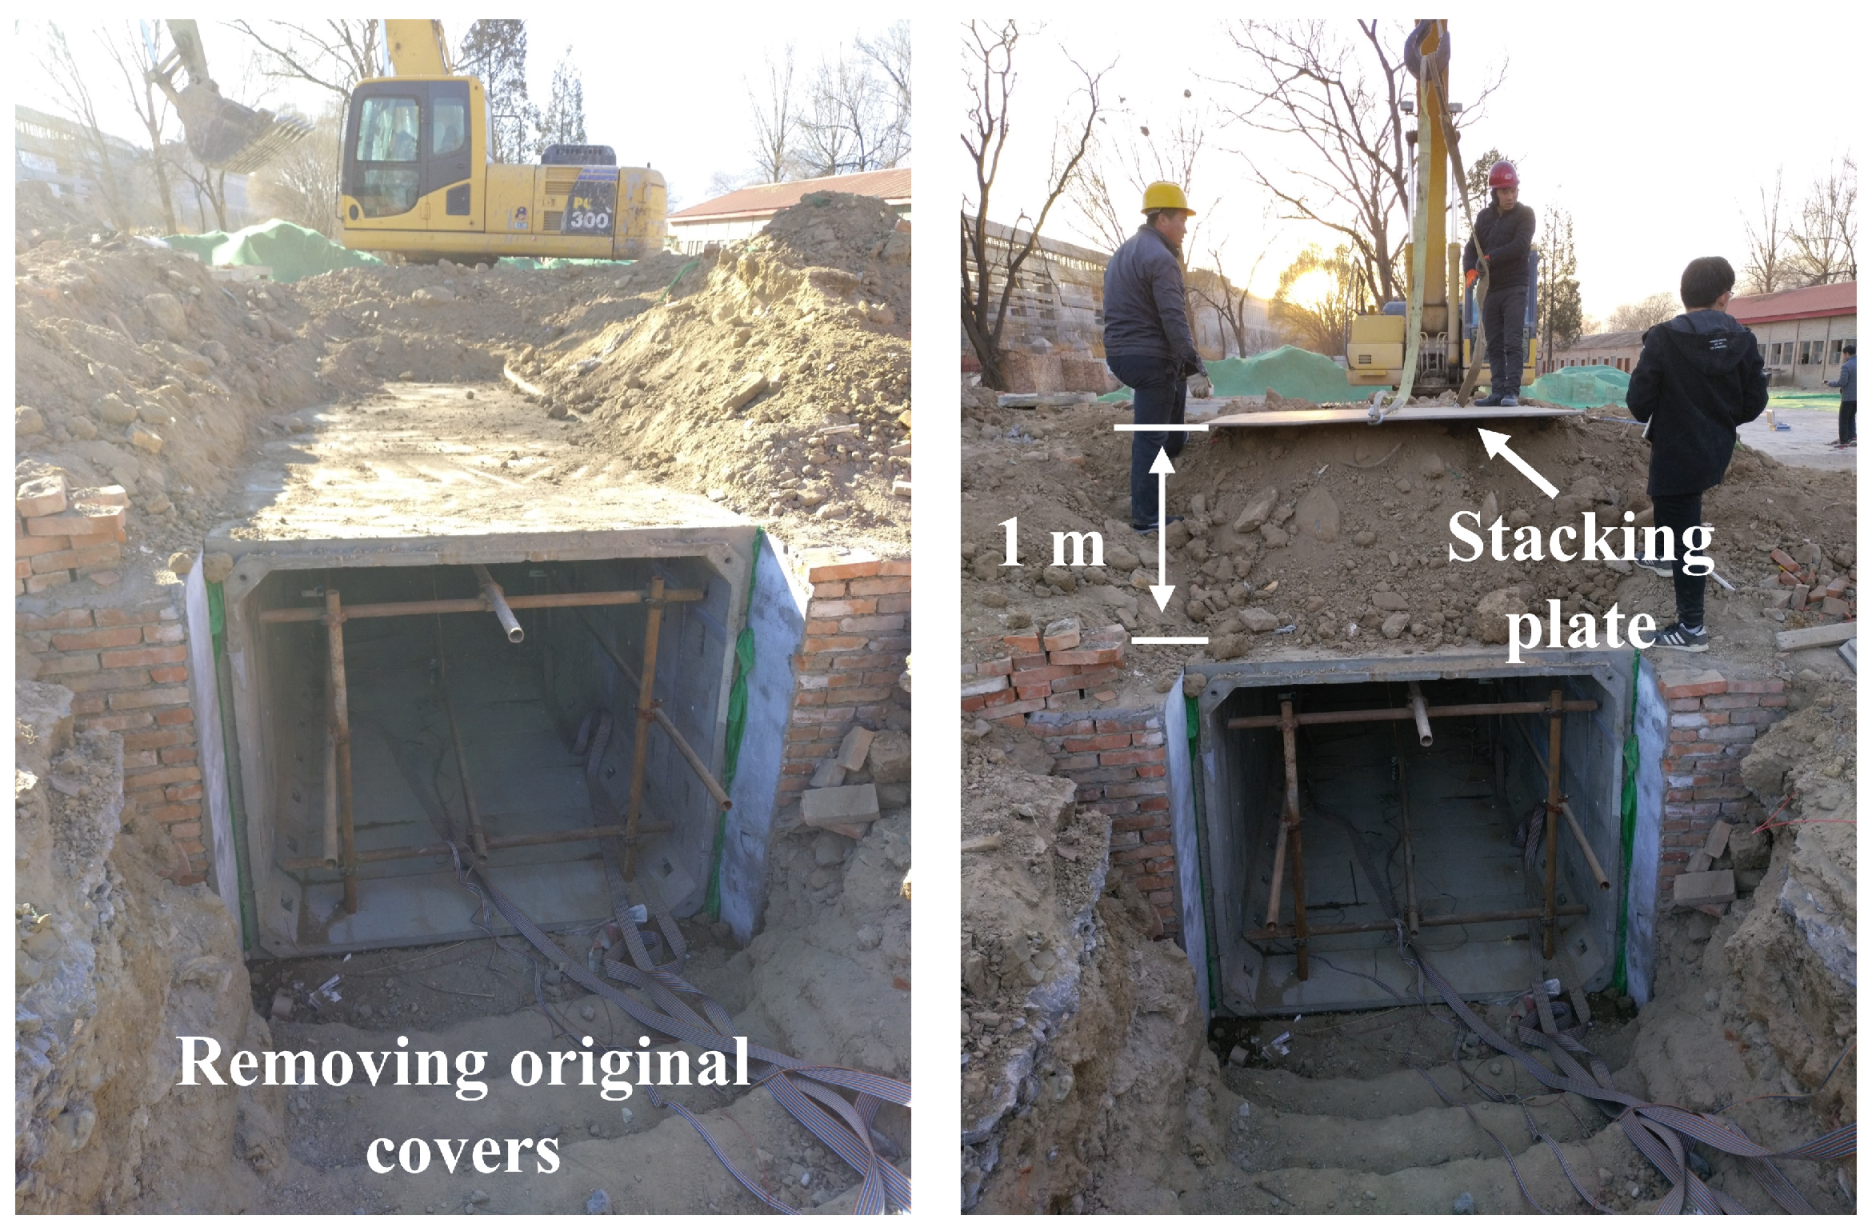
Prolonged service typically induces structural degradation in existing culverts, with roof slab deterioration posing particularly critical safety implications. Consequently, this experiment adopted the design rationale that the original roof slab would be relieved of overburden loads following reinforcement. During load testing, the existing roof slab was physically removed to validate this assumption.
After removing the upper cover plate, the stacking loading experiment was conducted directly above the reinforced prefabricated segment roof (
Figure 6). To minimize excavation and transportation, it was decided to cover the load with 1m of soil to simulate the soil’s diffusion effect on the upper load. In this pipe section, there were 13 prefabricated rings for reinforcement, and the stacking plate was 2.2 m × 2.3 m in size, positioned above the central five rings.
4.1. Sensorss and Loading Protocols
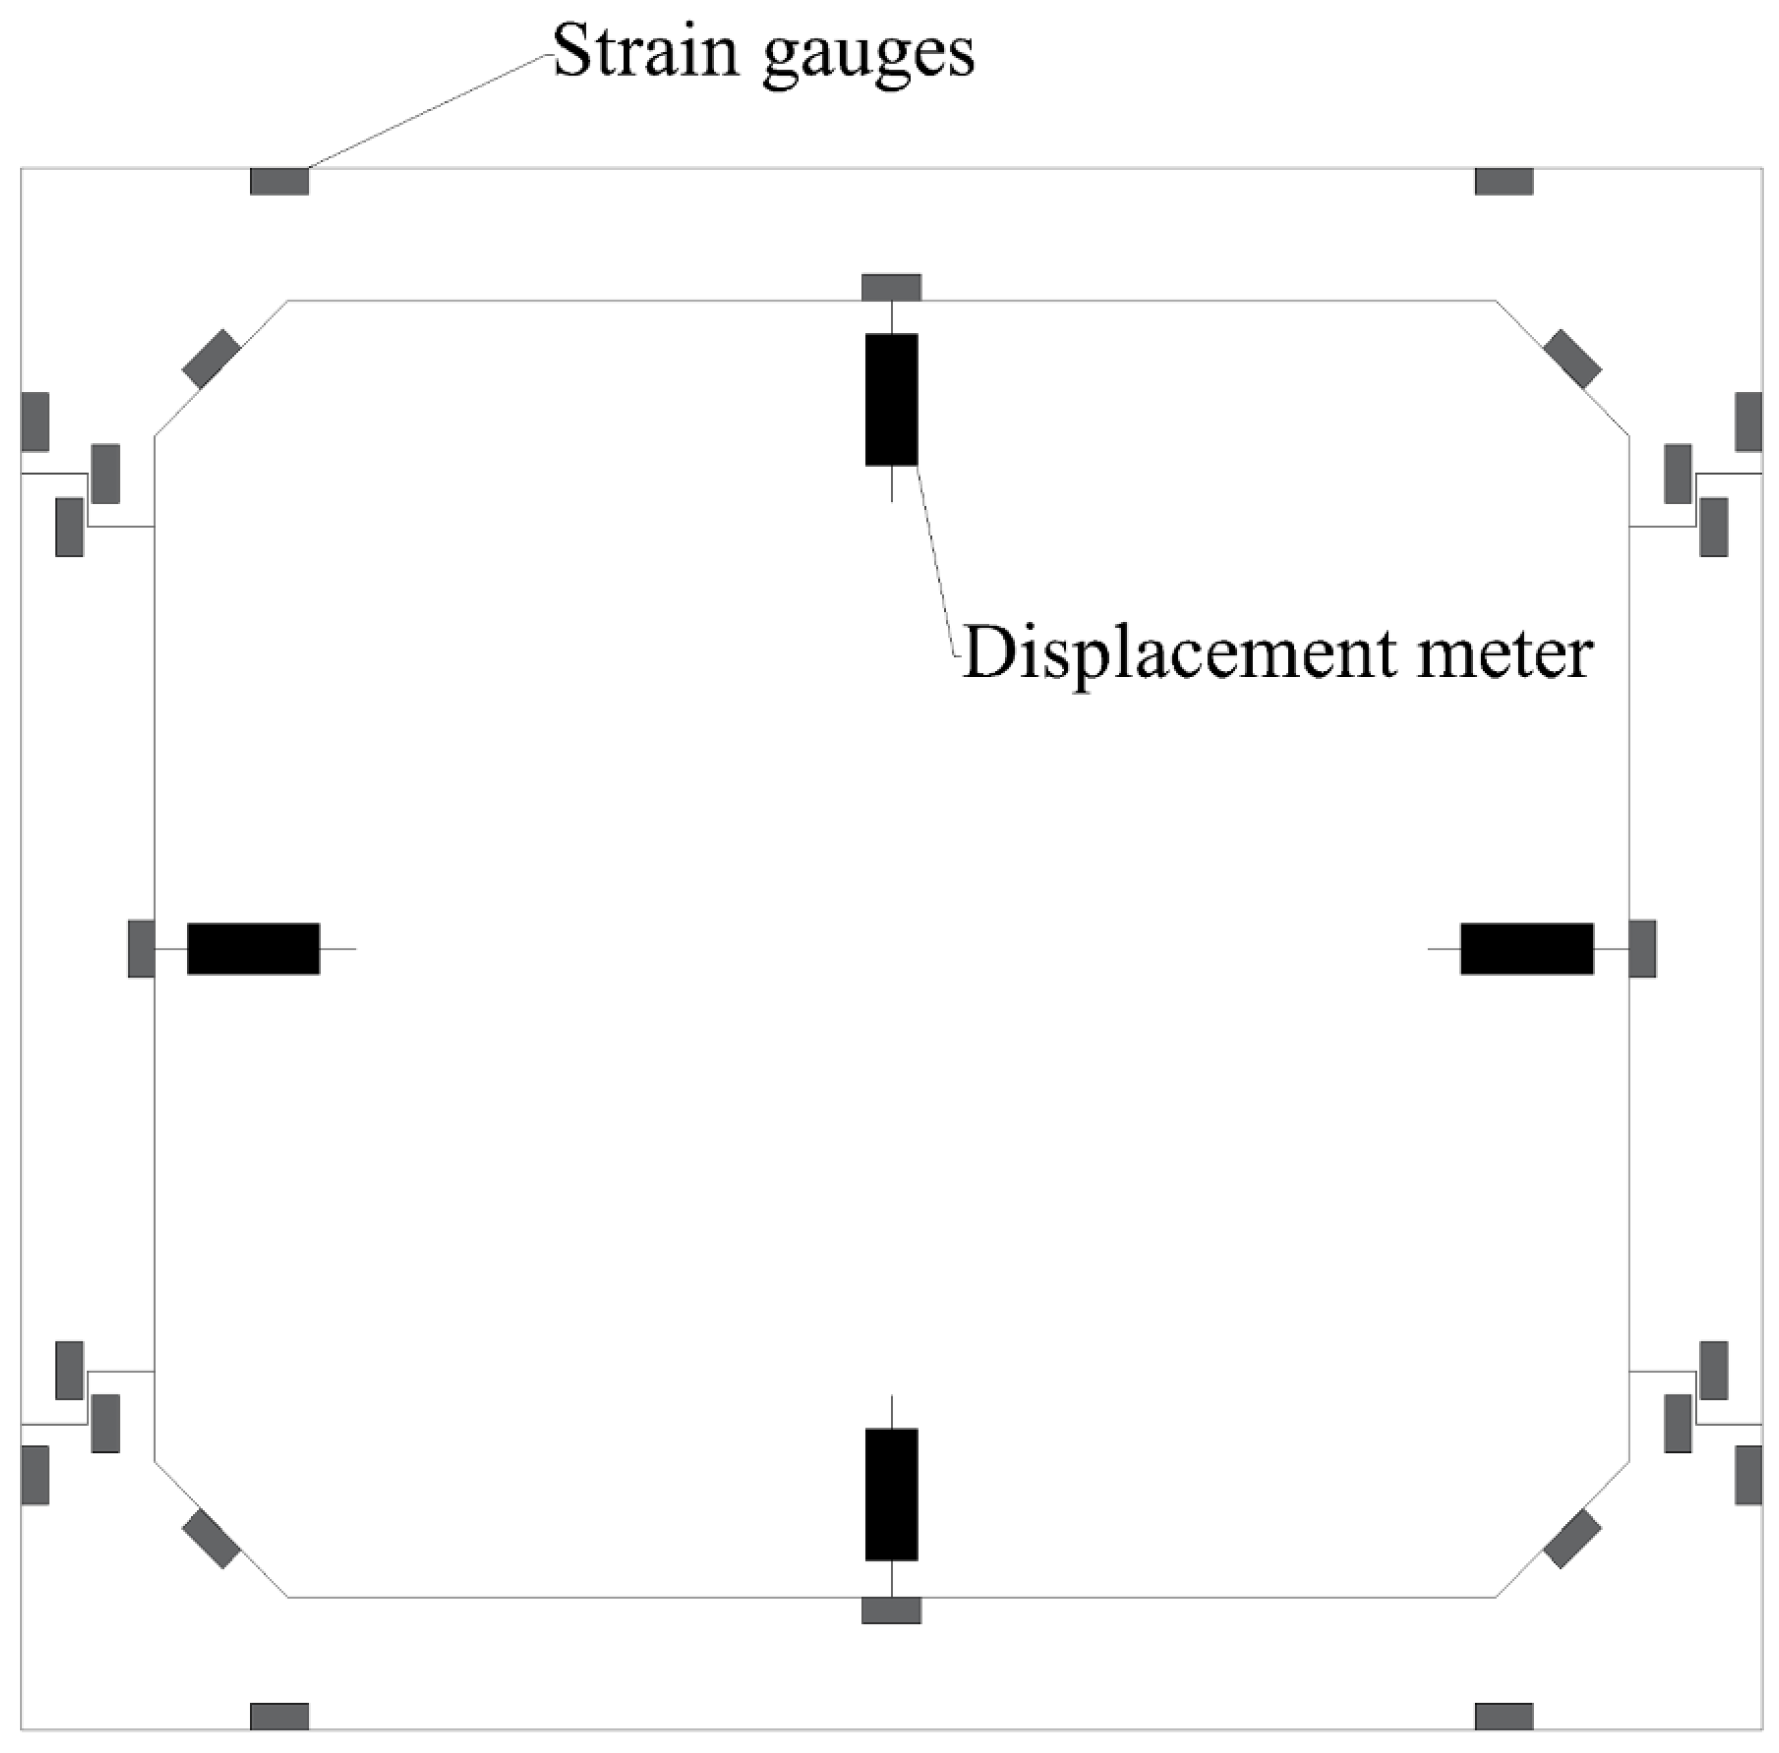
The data acquisition system integrates three core components: resistance strain gauges or displacement transducers, a strain data acquisition unit, and a computerized monitoring interface. Strain gauges interface with the acquisition unit via shielded twisted-pair cabling, while Ethernet protocol facilitates communication between the acquisition unit and computer.
Figure 7 details the sensor topology, noting that the depicted configuration represents composite instrumentation distributed across multiple rings rather than a single ring. Strategic measurement points target three critical regions:
Rebar strain: Reinforcement locations prone to preferential yielding [
33] (typically main longitudinal bars at maximum moment regions).
Mid-span displacement: Zones exhibiting peak relative displacement (crown, invert, and springlines of segments).
Concrete strain: Tensile-critical regions at crown intrados where initial cracking typically initiates.
The test assembly comprised 13 precast segments with a total length of 5.2 m (0.4 m × 13) (
Figure 8). To precisely locate loading points, segments were numbered sequentially from the entrance inward. Outer zone: Segments 4→3→2→1→0 (0–2.0 m from entrance); Central zone: Segments 4→3→2→1→0 (2.0–4.0 m from entrance); Inner zone: Three segments uniformly labeled 0-0-0 (4.0–5.2 m from entrance). Primary loading zones targeted Outer Segment 0 and Central Segments 4→1.
The loading capacity of the structure was determined based on the design value of the bearing capacity of buried rectangular pipes under 2 m overburden, as specified in Chinese ‘Specification for structural design of buried rectangular pipes in water supply and drainage works (CECS 145: 2002)’ [
34]. The loading was simplified to four levels (
Figure 9), with the first level being a 1.8-ton per square meter load (equivalent to a one-meter covering soil depth) after placing the stacking plate, followed by 3.6 tons per square meter and 5.5 tons per square meter for the subsequent levels. The segments were inspected for damage after each level of loading.
4.2. Observations
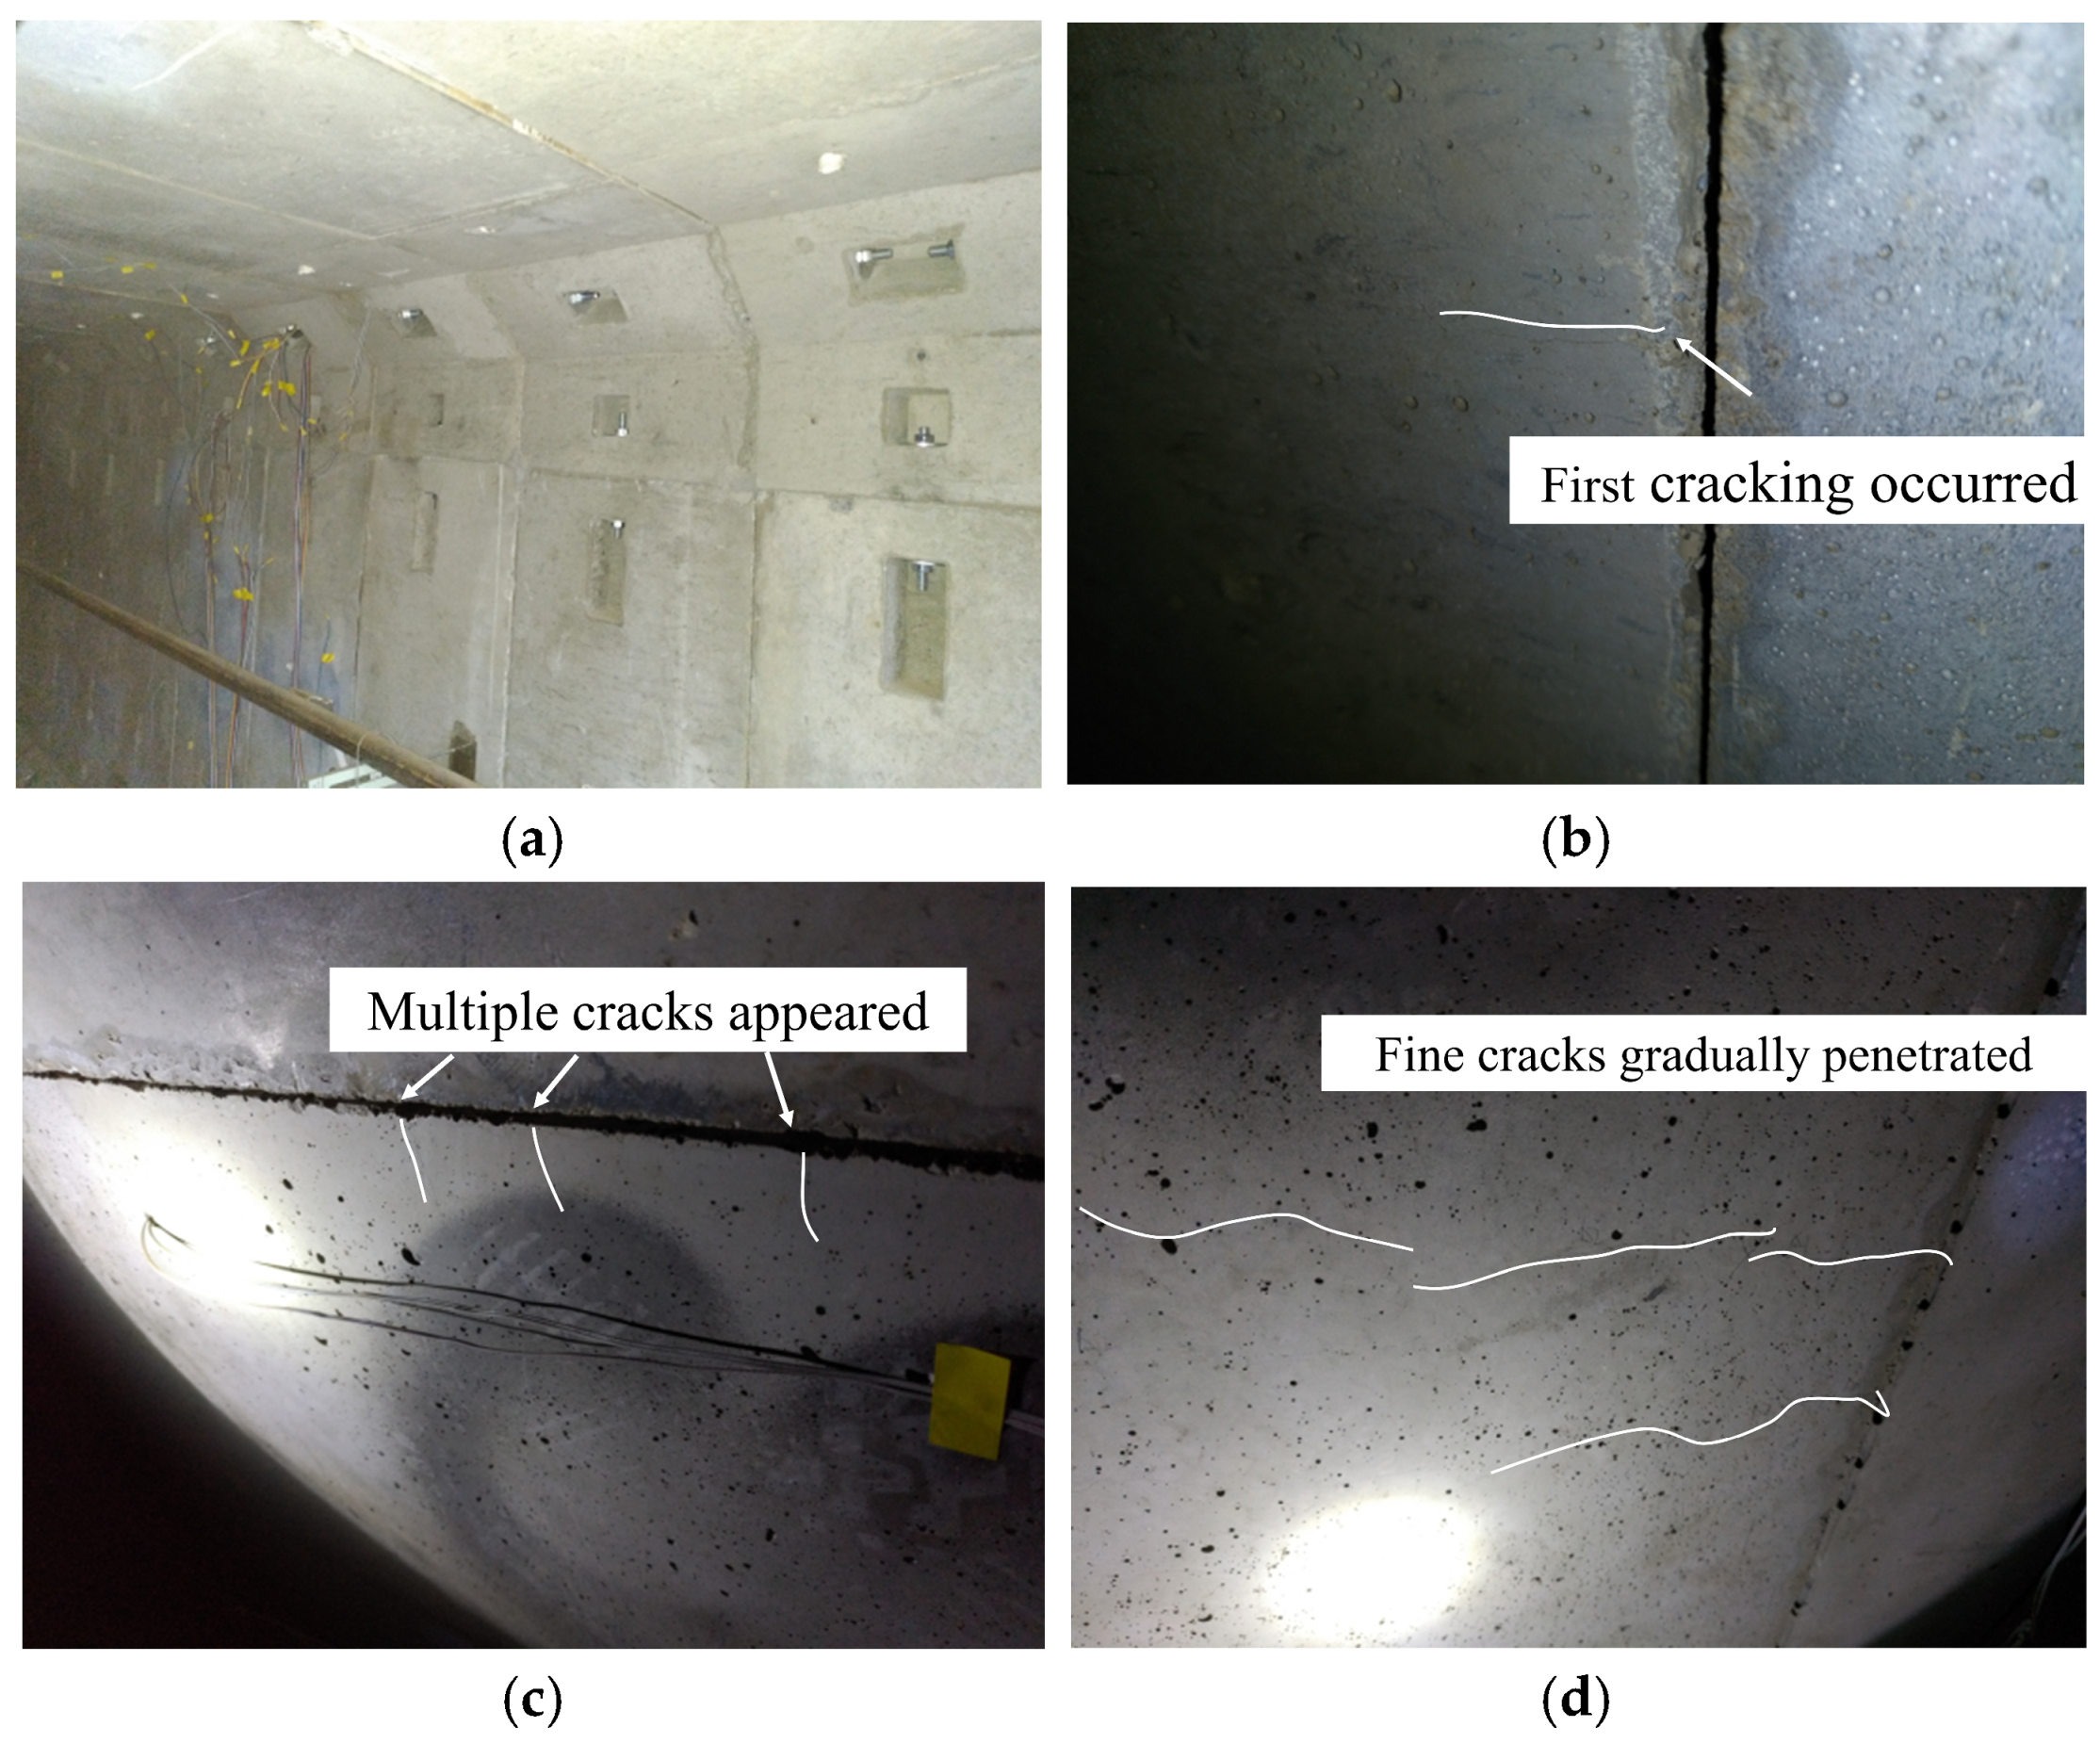
During the heap loading process under 1m soil overburden, no structural anomalies were detected and the concrete intrados remained uncracked (
Figure 10a). At 1.8 ton/m
2 surcharge load (equivalent to 9-ton point load), the sidewalls and invert segments exhibited negligible deformation. However, a 3cm-long hairline crack initiated at the crown intrados adjacent to the longitudinal joint (
Figure 10b). Joint integrity was maintained without concrete crushing, spalling, or distress indications. When loaded to 3.6 ton/m
2 (18-ton equivalent), multiple fine cracks propagated near the crown mid-span, with maximum lengths reaching 12cm (
Figure 10c). At the target 5.5 ton/m
2 load (28-ton equivalent), full-depth cracks developed at the crown mid-span exhibiting 0.10mm maximum crack width (
Figure 10d).
This damage pattern stems from construction constraints: During field implementation, the significantly stiffer existing sidewalls (relative to the precast segments) imparted rigid boundary conditions. This restrained lateral displacement of side segments, preventing their engagement in earth pressure resistance. Concurrently, the original sidewalls shielded the longitudinal joints from flexural moment transfer. Consequently, the side segments and joints functioned as compression struts during testing, explaining their minimal damage despite crown cracking.
4.3. Data Analysis
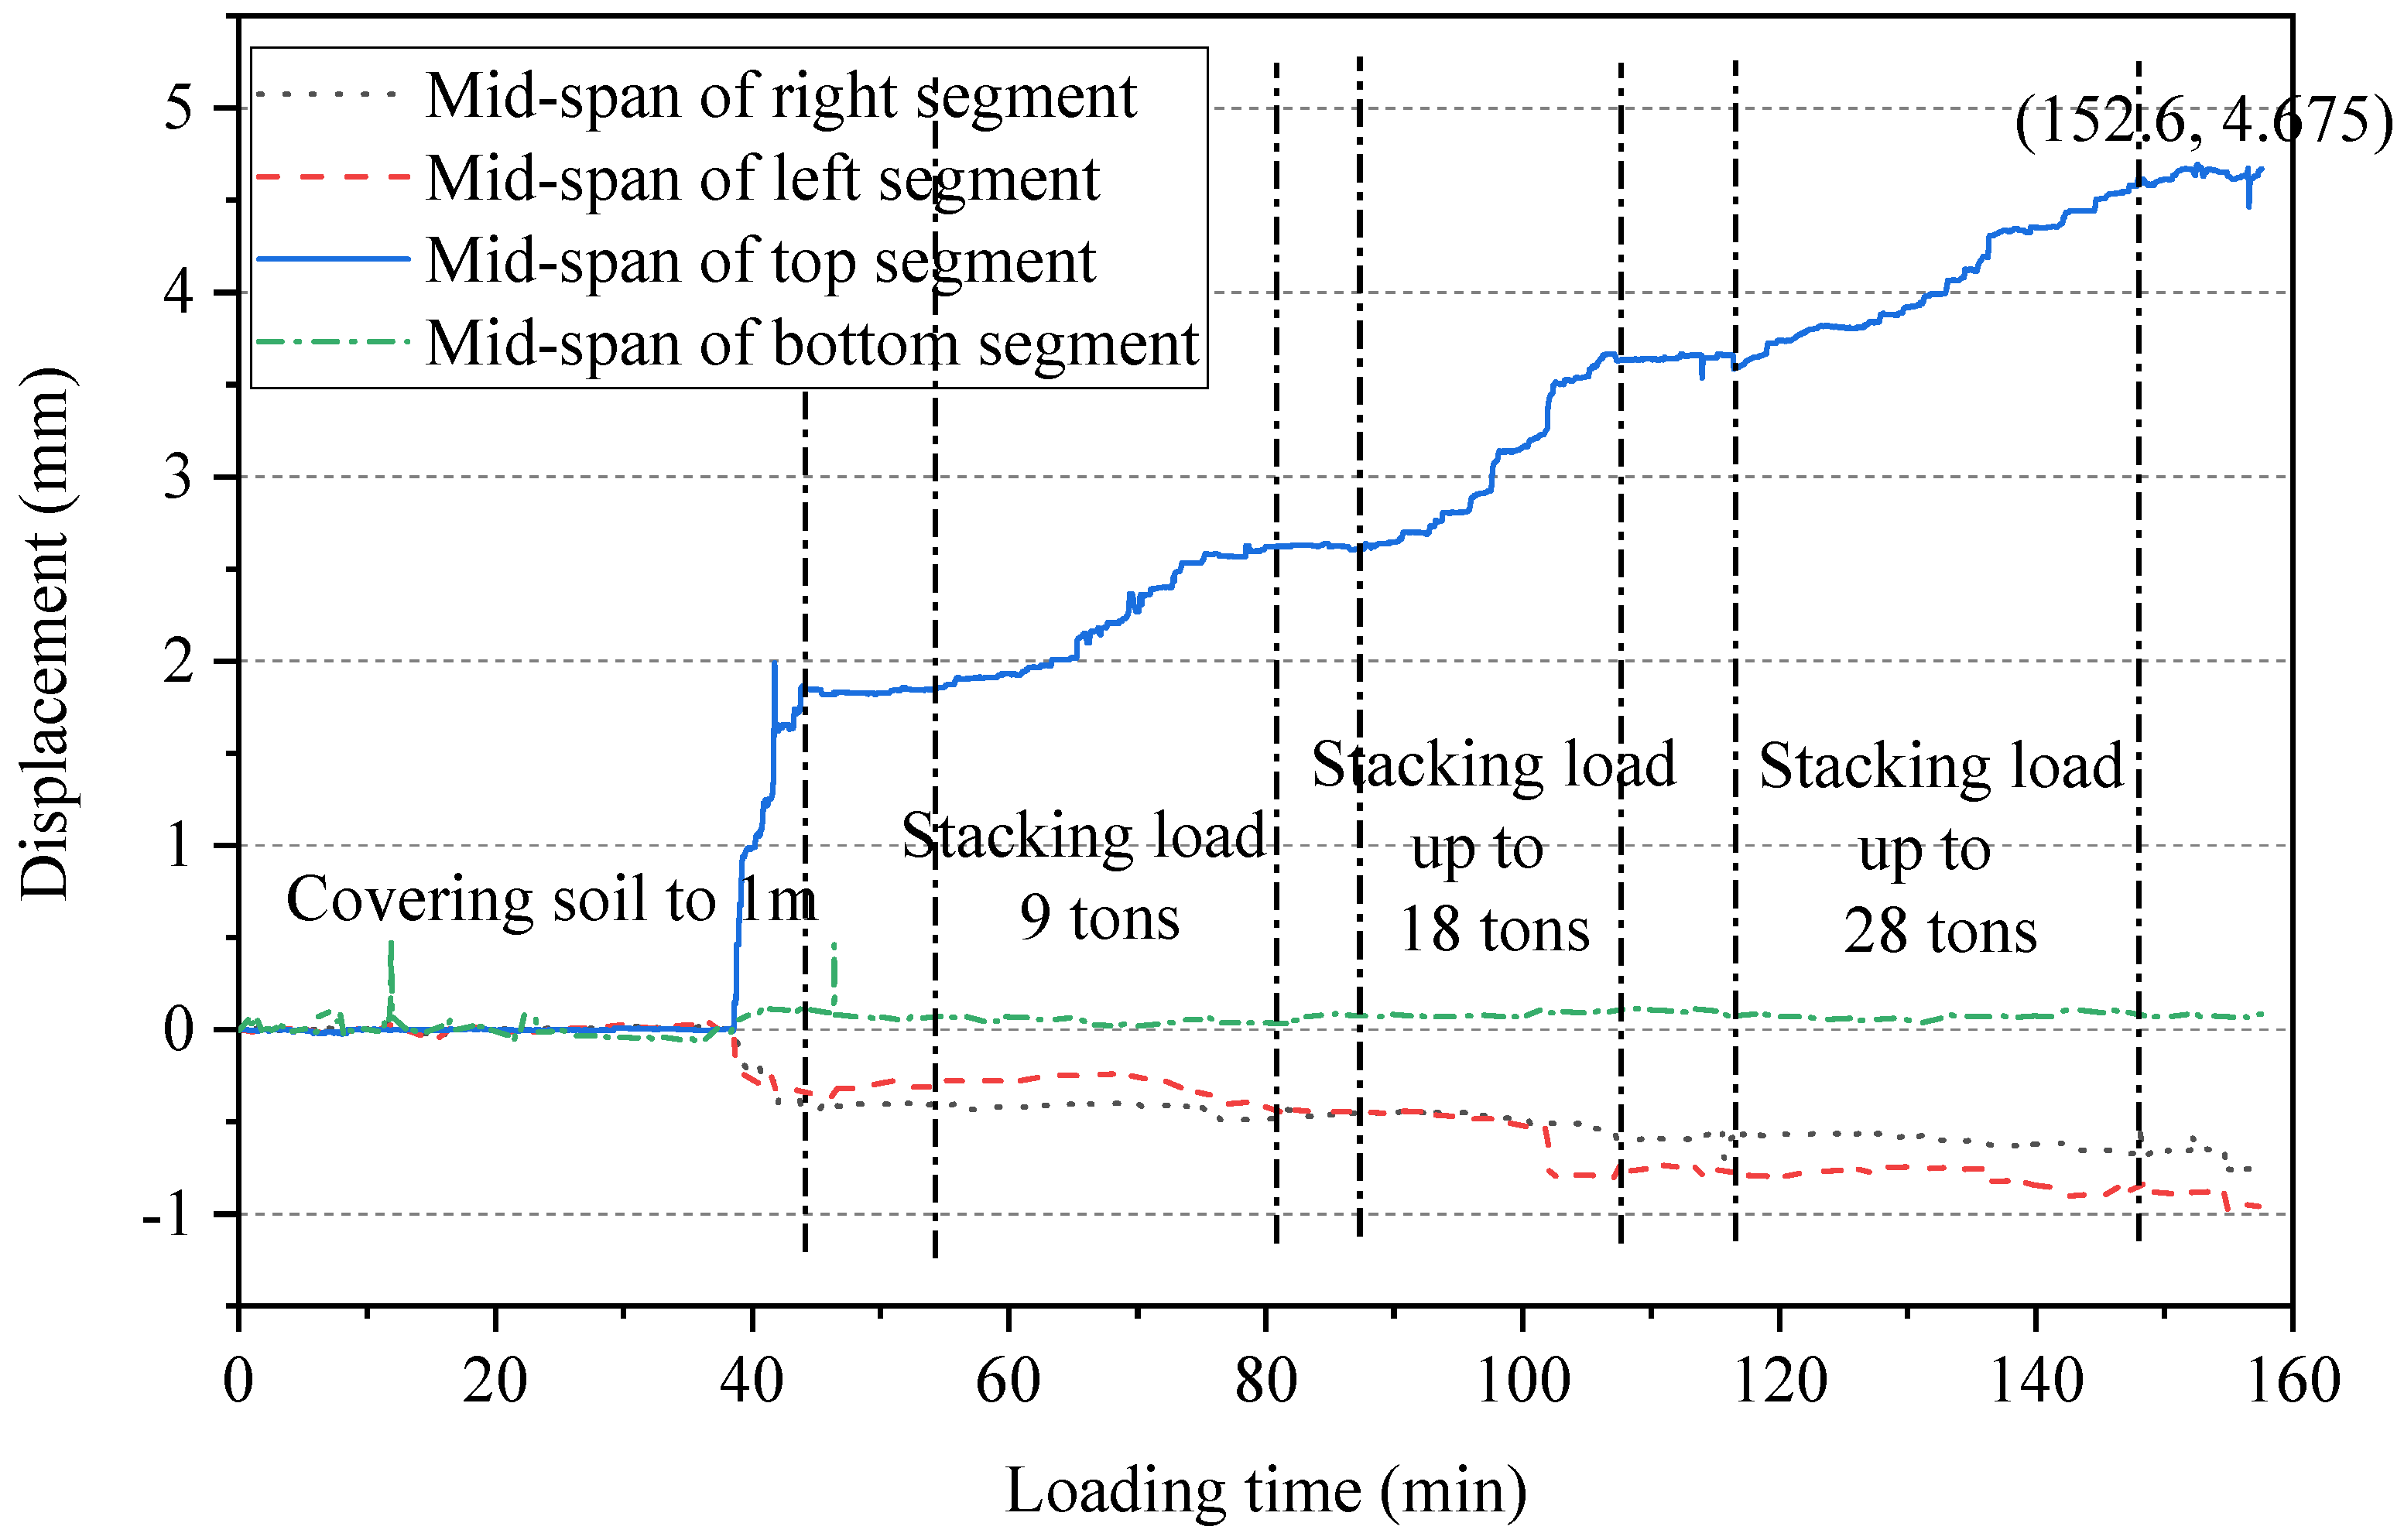
In light of the experimental observations, the data analysis should prioritize the key positions on the top plate. Specifically, the changes in the data from the four displacement meters located in the mid-span of the central pipe ring under the loading plate should be examined. As shown in
Figure 11, several trends can be observed: (1) the mid-span deflection of the bottom segment remained at zero due to the displacement coordination effect of the concrete cushion; (2) the displacement of the lateral segment was negative, indicating that the reinforced segments on both sides actively bore the load after outward displacement due to the limiting effect of the original structure’s side walls on the soil on both sides. This finding aligns with the hysteretic stress characteristics of the reinforced structure in an actual project; (3) the top segment’s mid-span experienced the largest displacement, with a deflection of 4.675 mm, which meets the specification requirement of L/200 = 10 mm; and (4) the displacement of the segments on both sides primarily occurred during the first loading stage, with little change in subsequent stages. However, at approximately t = 102 min of loading time, the displacement of the left and top segments showed a sudden small change simultaneously, indicating that the filler between the tested segment and the original structure had changed to some extent. This could be a result of the filler being squeezed out of the sides or insufficient filling. This phenomenon further underscores the importance of fillers in jointly exerting the structural bearing capacity of old and new structures.
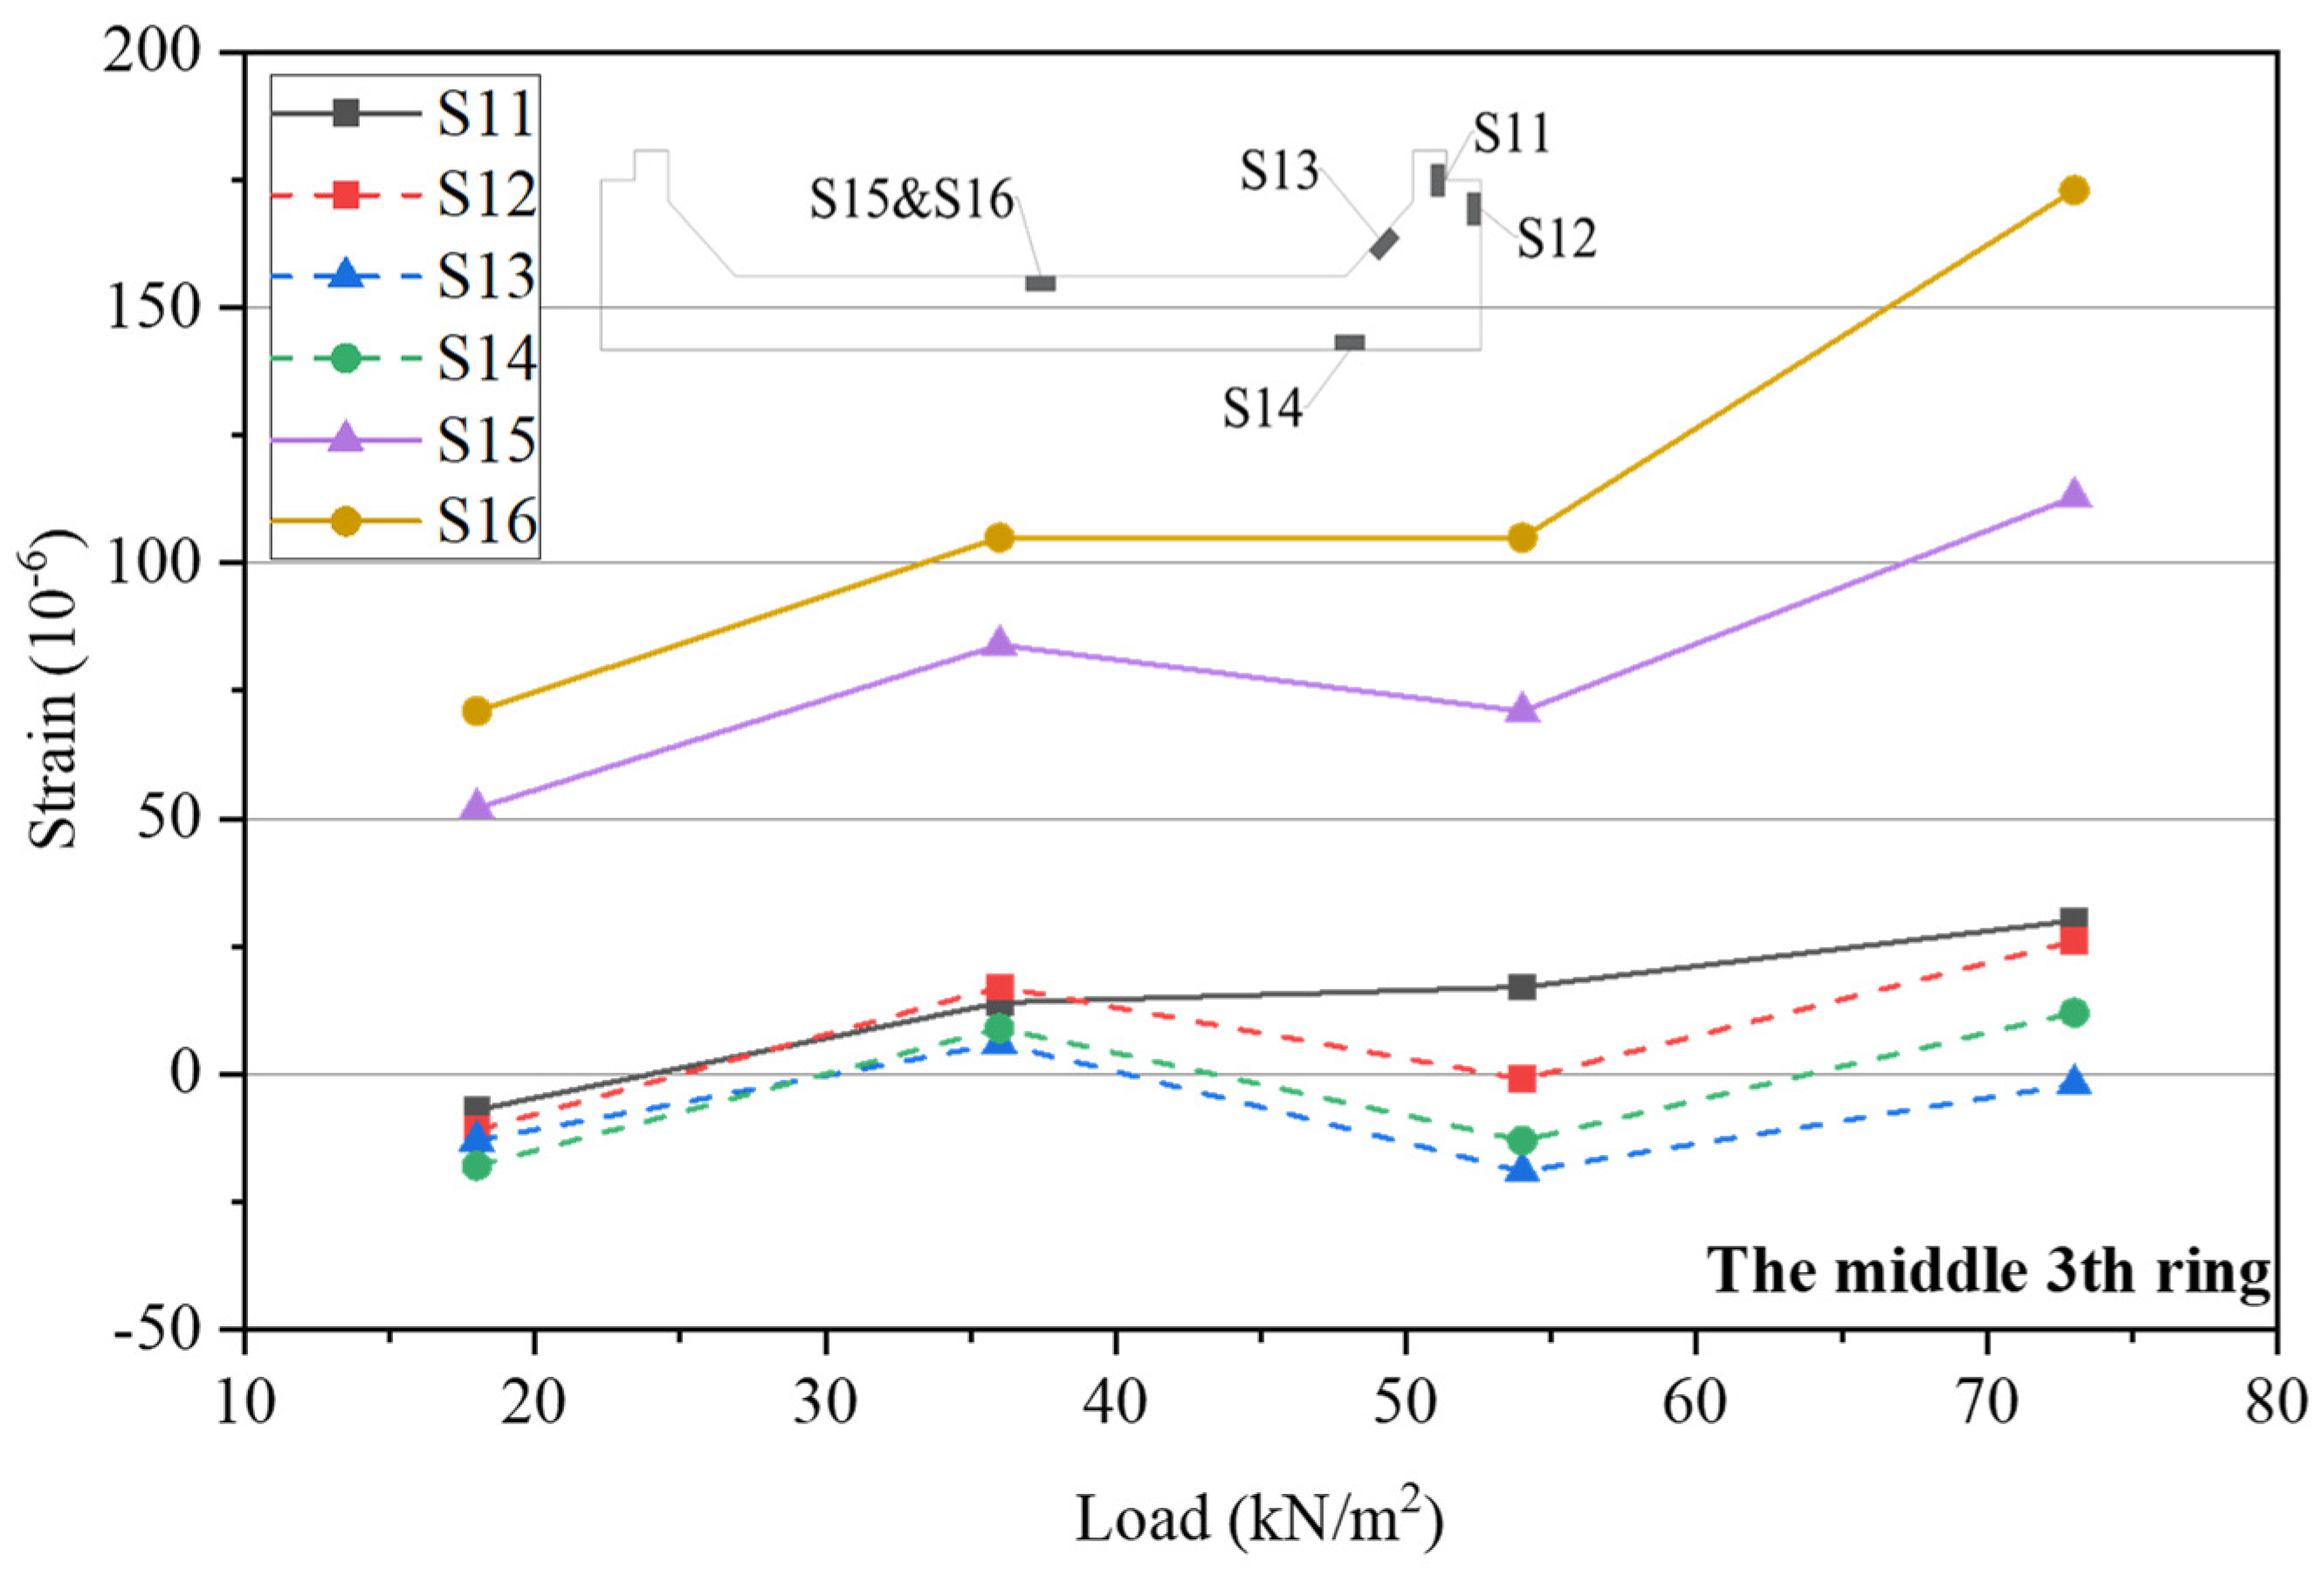
To determine the stress characteristics and the actual role of each segment in the single-ring structure under static load, the strain data of the rebar on the middle third ring segment were analyzed.
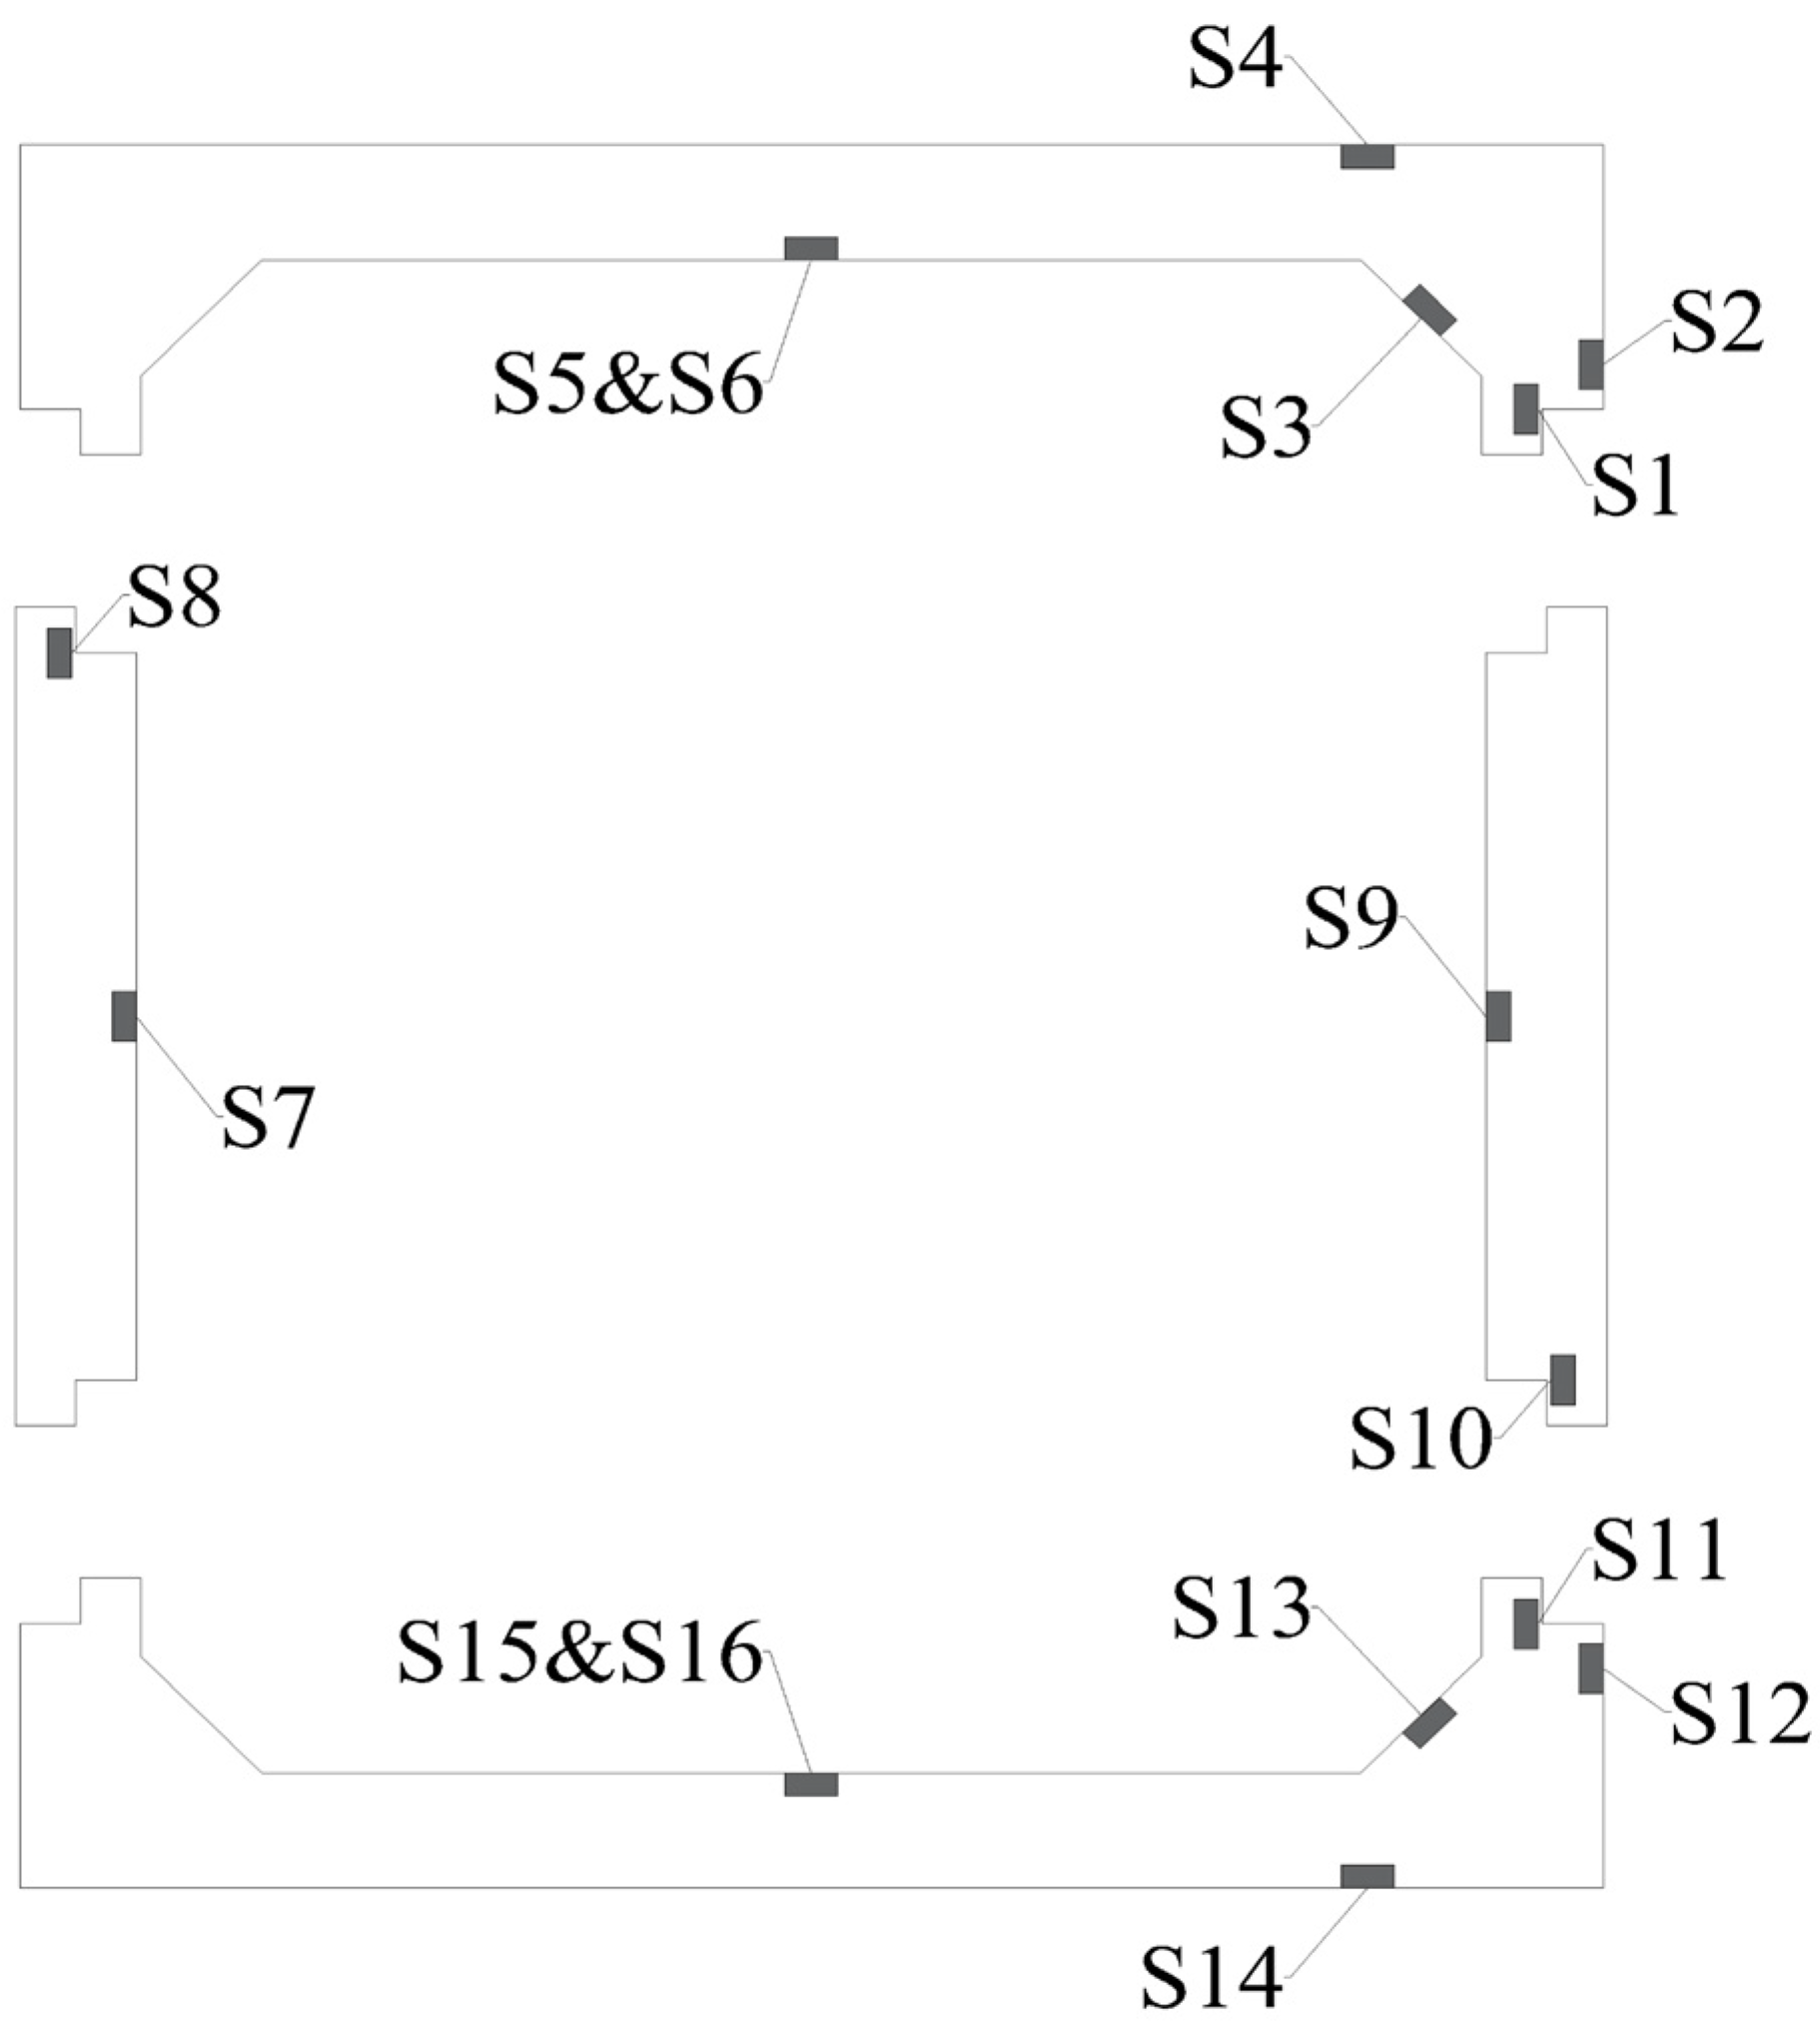
Figure 12 illustrates the positions of the strain gauges (S1–S16) attached to the single-ring prefabricated segment. Notably, strain gauges S5 and S6 were affixed to different transverse main rebars at the same location. S5 (S15) was positioned at the center of the top segment, while S6 (S16) was near the longitudinal splicing joint (the socket in the assembly of tongue and socket). Moreover, S1, S8, S10, and S11 were positioned at the weak point of the splicing joint, which is prone to tearing, and S3 (S13) was located in the middle of the enlarged armpit.
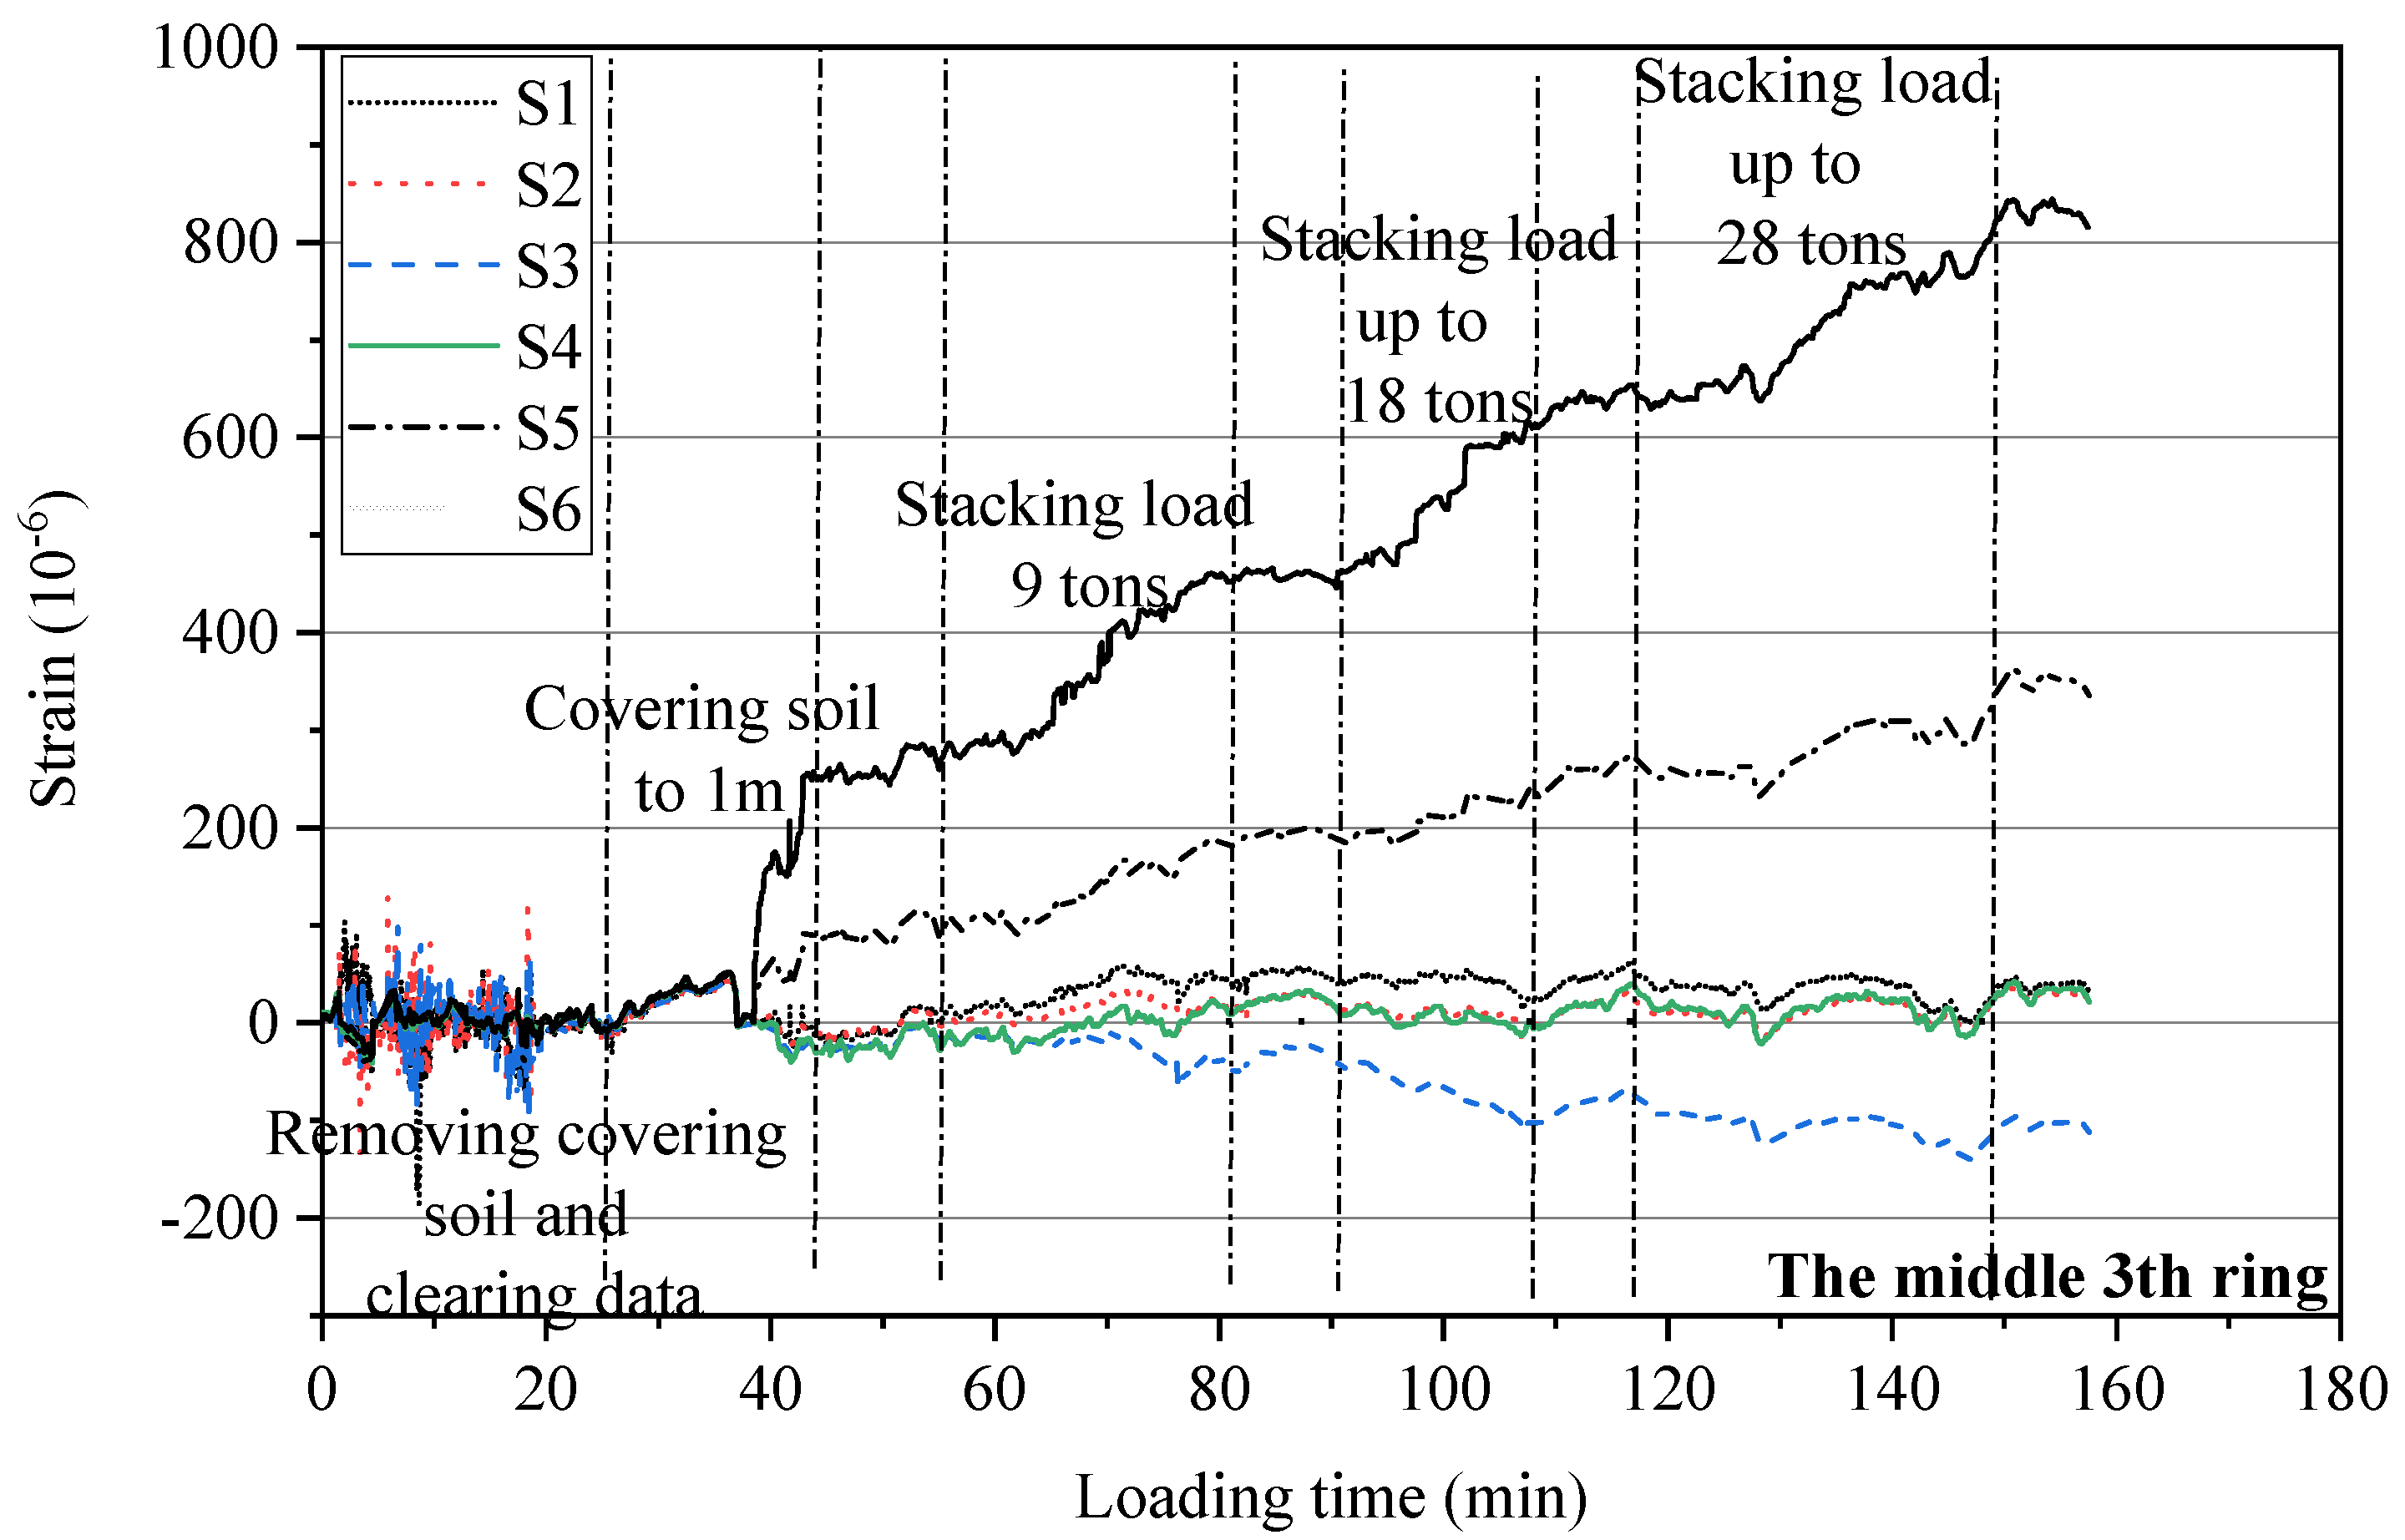
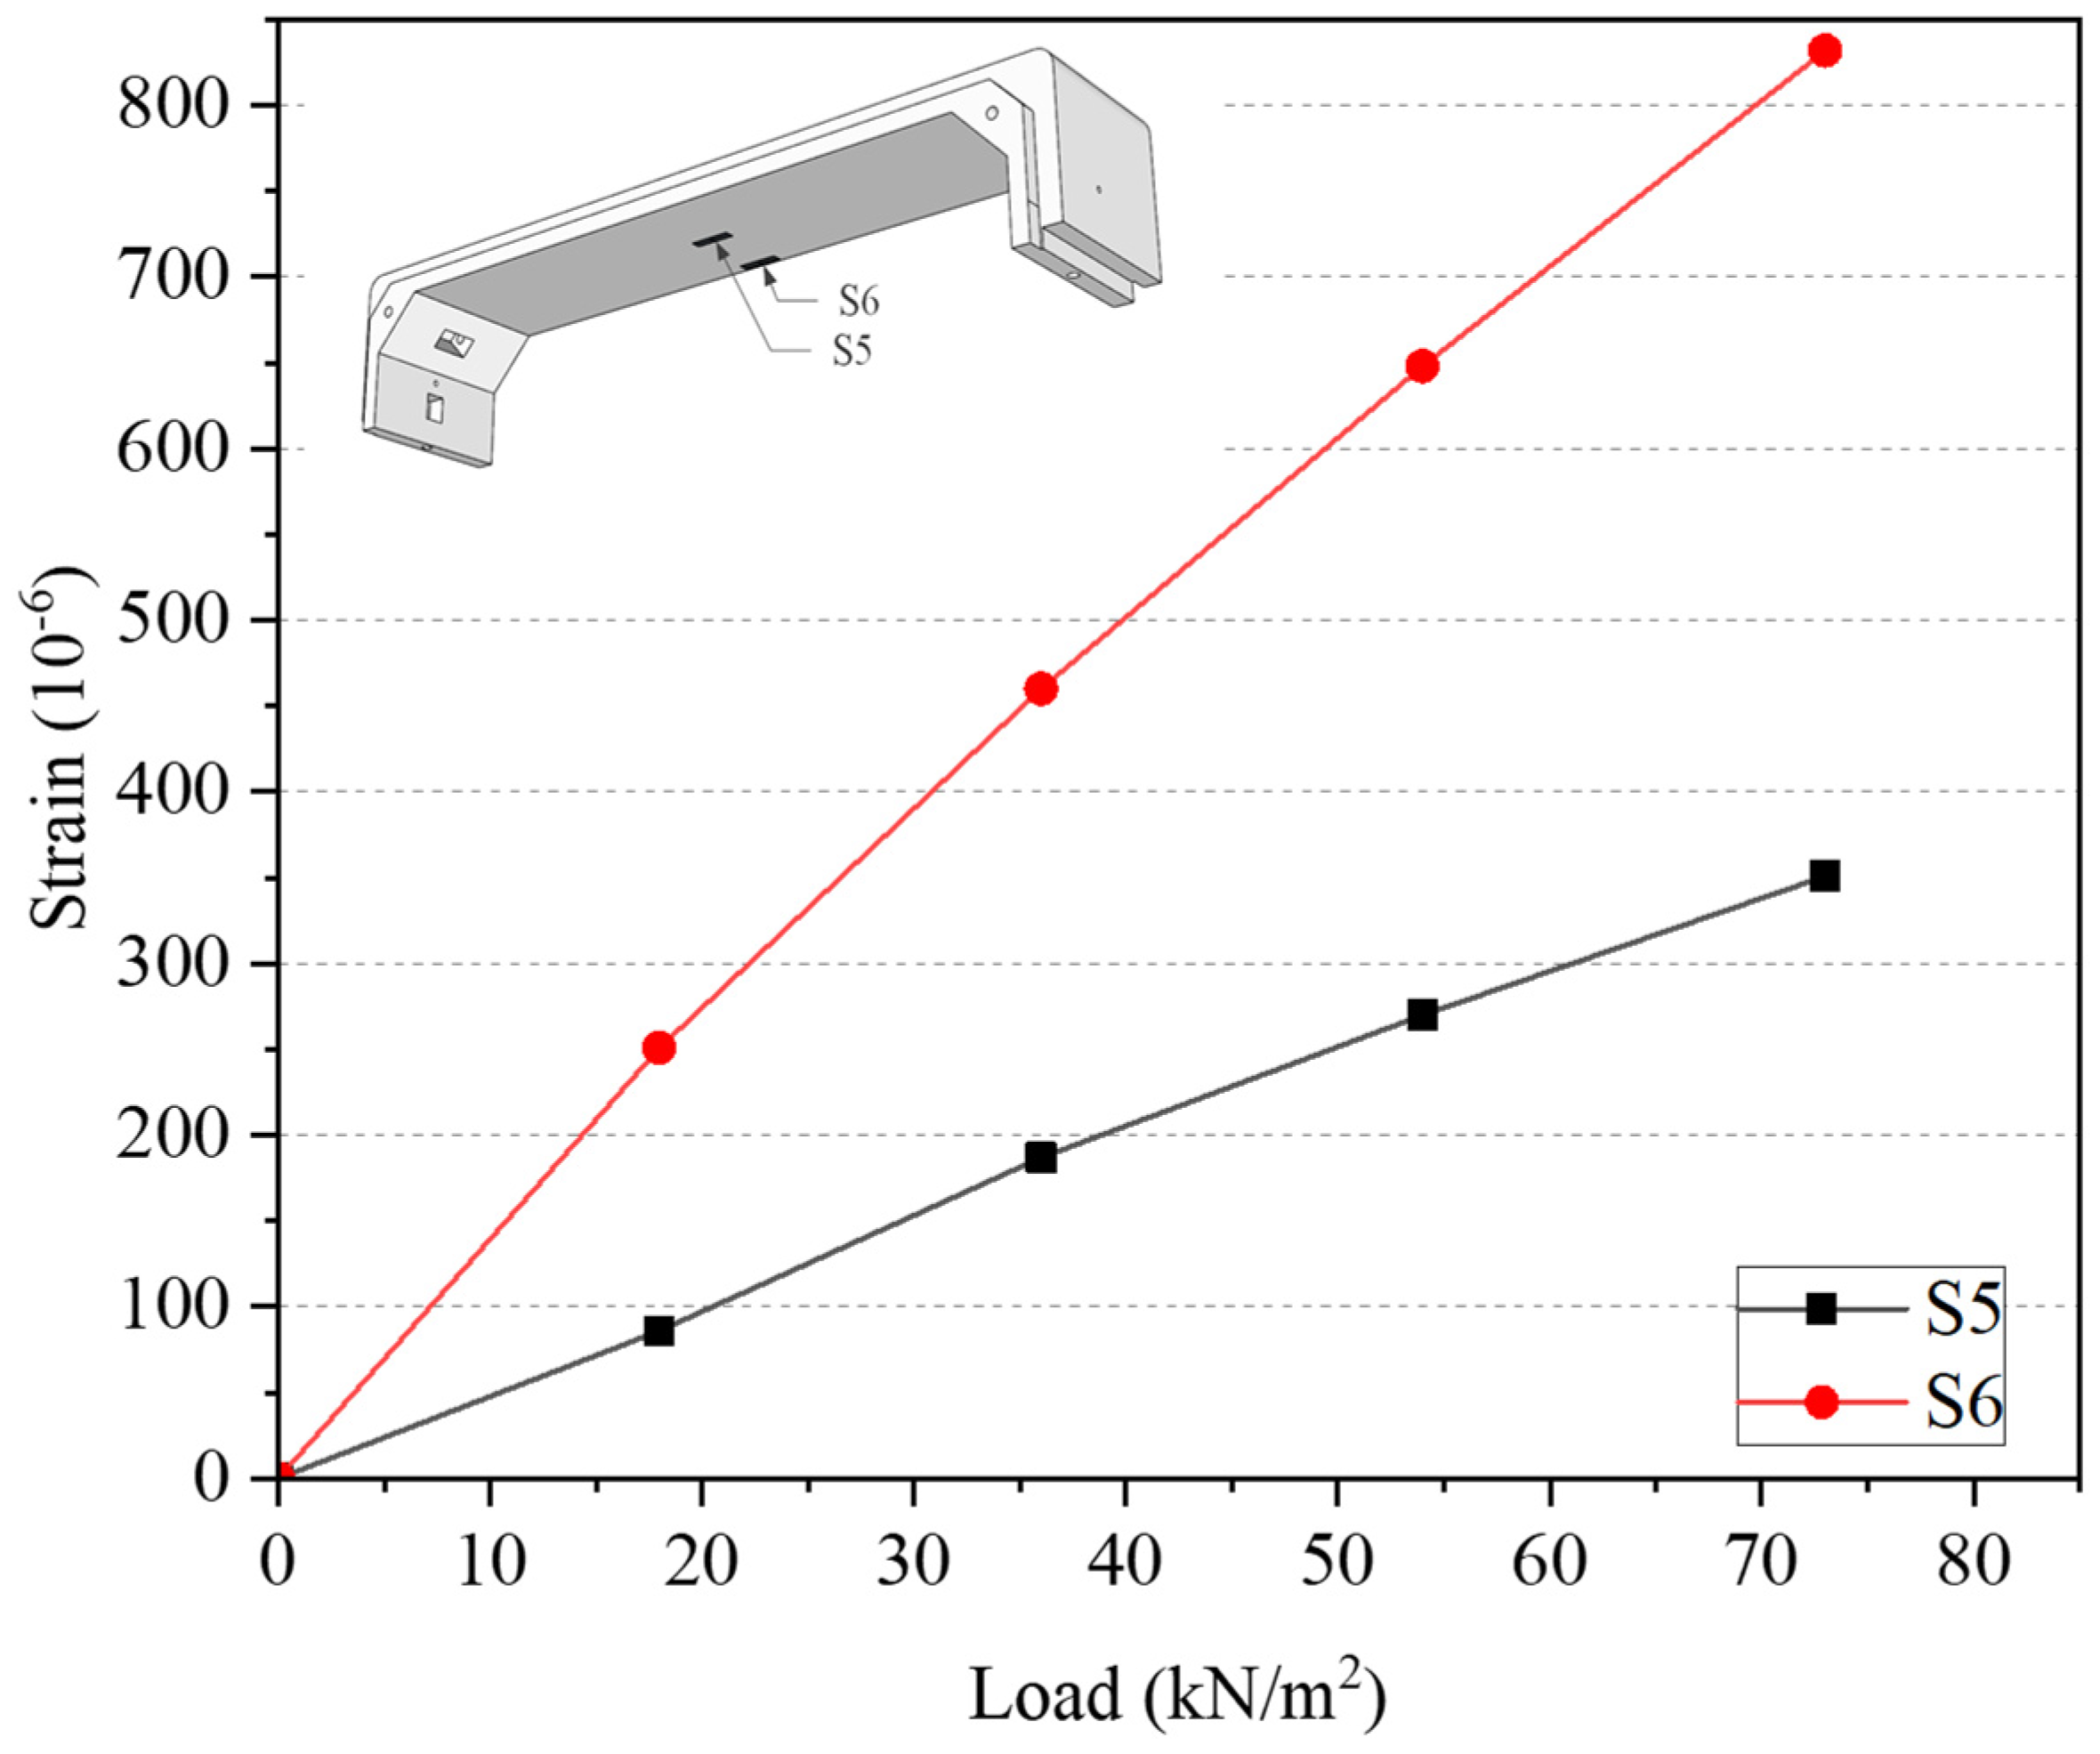
Figure 13 shows the strain data of the top segment’s rebar, which are affected by the loading process that involves hoisting heavy objects and causes significant environmental disruption. The curves exhibit non-smooth changes during the test. By analyzing the curve of S1, it is evident that the splicing joint’s weak area gradually changes from compression to tension, indicating that the outside of the joint opened while the inside closed, thereby enhancing the structure’s waterproofing. Similarly, the armpit was also in a safe state of compression, as observed from the curve of S3. The curves of S2 and S4 essentially overlap, suggesting that the bending moment did not significantly vary after the transmission of the corner nodes. This is because the side wall did not exert any force on the corner nodes on both sides of the top segment, consistent with the phenomenon where lateral earth pressure is applied to the original structural wall. Comparing curves S5 and S6, it is noticeable that the rebar’s deformation near the socket of the longitudinal joint is larger than that of the rebar at the center position, indicating that the socket contracts inward, thereby strengthening the joint’s waterproofing and demonstrating the effectiveness of this type of longitudinal splicing. The maximum strain of the rebar, which is 843, indicates an elastic stage for the structure and excess bearing capacity. Since the graded loading was strictly performed according to the load of 1m deep covering soil each time, the rebar strain is depicted as a straight line in
Figure 14, indicating that the structure was still in the elastic stage and safe and reliable under working conditions.
The strain data of the rebar on the bottom segment (
Figure 15) reveal that the strains of the four measuring points near the armpit are relatively small, similar to those on the top segment, indicating that the sections near the armpit of the bottom segment are in a state of small eccentric compression. When comparing S13 and S3, S13 has a much smaller value than S3, indicating that the bending moment at the armpit of the bottom segment is very small. This suggests that the internal force of the top segment under the upper load is difficult to transmit to the bottom segment due to the restraint of the side wall. Therefore, the bottom segment is equivalent to a beam placed on an elastic foundation and subjected to concentrated loads at both ends. This is different from the general assumption that it receives a uniform load reaction force and should be taken into account in the structural simplification calculation. The strain values of S15 and S16 are fairly evident, with S16 being greater than S15 at the same time, which is consistent with the results of S5 and S6. This phenomenon is caused by the asymmetry of the structure in the longitudinal direction. As shown in
Figure 14, due to the existence of sockets, the bending stiffness at the position of the reinforcement strain gauge S6 and S16 is less than that at the position of the reinforcement strain gauge S5 and S15. Therefore, the socket has a tendency to shrink inward, which is conducive to longitudinal connection and waterproofing with adjacent sockets. It is worth noting that the strain on the bottom segment is less than that on the top segment, which should be taken into account in the design to avoid overly conservative results.
Figure 16 displays the rebar strain data of the side segment. Rebar strain gauges S8-4 and S7-4 were located in the middle of the 4th ring segment, S8-3 and S7-3 in the middle of the 3rd ring segment, and S8-2 and S7-2 in the middle of the 2nd ring segment. From the first loading to the second loading, almost all strain changes indicate that the state of the measurement points shifts from compression to tension, demonstrating that the prefabricated segments for reinforcement interact with the original structure and start to work collaboratively. This means that the original structure imposes lateral restraints and loads on the prefabricated segments. However, from the second loading to the third loading, the strain changes mentioned above are no longer obvious or even reversed, indicating that the original structure significantly constrains the prefabricated segments for reinforcement and limits their deformation. Moreover, the strain values of the steel bars on the side segment are generally small, indicating that the side segment is in a state of small eccentric compression and is not prone to damage.
5. Finite Element Simulation
A finite element simulation was conducted to verify and further investigate the deformation characteristics and reinforcement mechanism of the structure during the reinforcement process. In addition, the choice of grouting material used for filling between the old and new structures during the reinforcement construction process may have a significant impact on the reinforcement effect of the structure. Therefore, a two-dimensional finite element model will be established below, and the necessary parameter analysis will be conducted.
5.1. Model Dimensions and Material Parameters
A finite element model was created based on the stacking loading test mentioned earlier. In
Figure 17, the width of the soil model is 10 m, and the depth is 7 m. The original structure’s side walls have a thickness of 300 mm. The bottom cushion has a thickness of 200 mm, and the grouting layer between the old and new structures is 20 mm thick.
The materials listed in
Table 1 were used to reinforce the concrete segments. The Mohr-Coulomb model is used for soil, the CDP model is used for concrete, and the double-polygonal constitutive model is used for reinforcing steel.
5.2. Element Types Mesh and Interaction
The assembly and mesh of the model built in ABAQUS 6.21-1 are shown in
Figure 17. The soil, original structure, grouting material and prefabricated segments are all CPE4R plane strain units, and the steel trusses are T2D2 TRUSS units.
Surface-to-surface contact is used between the soil mass and the original structure, the original structure and the prefabricated segment, the prefabricated segment and the grouting layer, and the interior of the prefabricated segment. In Surface-to-surface contact, the normal behavior is set to “hard contact”; for the tangential friction coefficient, it is taken as 0.8 between the concrete structure and the grout layer, and 0.4 between the existing structure and the soil.
Mesh Sensitivity Analysis
Mesh sensitivity analysis is used to evaluate the impact of meshing on computational accuracy and efficiency, with the core goal of obtaining mesh-independent solutions (mesh-independent solutions). Methods include step-by-step refinement of the mesh until the key results do not change, and verification of reliability by comparing experimental data or high-precision literature results.
The meshing was divided into four groups according to the fineness, and the meshing in
Figure 17 was recorded as the control group SL-1, and the number of grids in each group increased or decreased geometrically compared with the composition of the control.
In order to speed up the calculation and save time, only the first step (see
Section 5.3 for the specific calculation content of the first step) is calculated, and the results of the maximum vertical displacement of the soil are compared for grid sensitivity analysis.
Table 2 shows the meshing data and calculation results. The quality of the mesh is calculated according to Equation (6). The calculation results show that further refining the grid based on the control group will not result in significant changes to the calculation results, with a relative difference of about 1.5%. However, the computational time cost will increase substantially. Although the rough grid has a shorter computation time, it has a relatively larger error. Therefore, it is feasible and more economical to continue using the grid defined in the control group (
Figure 17) for subsequent analysis.
where
M is the mean of the Jacobian ratios and
S is the standard deviation of the Jacobian ratios, both of which can be queried in the software tool.
5.3. Simulation Process and Results
The simulation is divided into two steps, the first step of which is to simulate the order of Geostatic, soil excavation, structural installation, and rebalancing under self-weight. Among them, the Geostatic verifies the correctness of the soil model and parameters through the lateral pressure coefficient of the soil. In the second step, a uniform load is applied directly above the model based on the maximum load of the stacking experiment above.
The grouting material’s effect on the reinforcement effect and the internal force distribution of the prefabricated segment is studied by changing the material parameters of the grouting material. The grouting material’s elastic modulus is set to Es1 = 3.6 × 10⁴ MPa, Es2 = 2.0 × 10⁴ MPa, and Es3 = 1.0 × 10⁴ MPa, which are recorded as working conditions S1, S2, and S3 respectively. Among these conditions, S1 is the control group, with an elastic modulus consistent with the C60 concrete used in the field test.
After the soil excavation, original structure installation, and self-weight balance are completed in the first step, uniform pressure is directly applied to the upper surface of the prefabricated segment as the second loading process. Based on the aforementioned field test, the uniform pressure value is 0.07305 MPa.
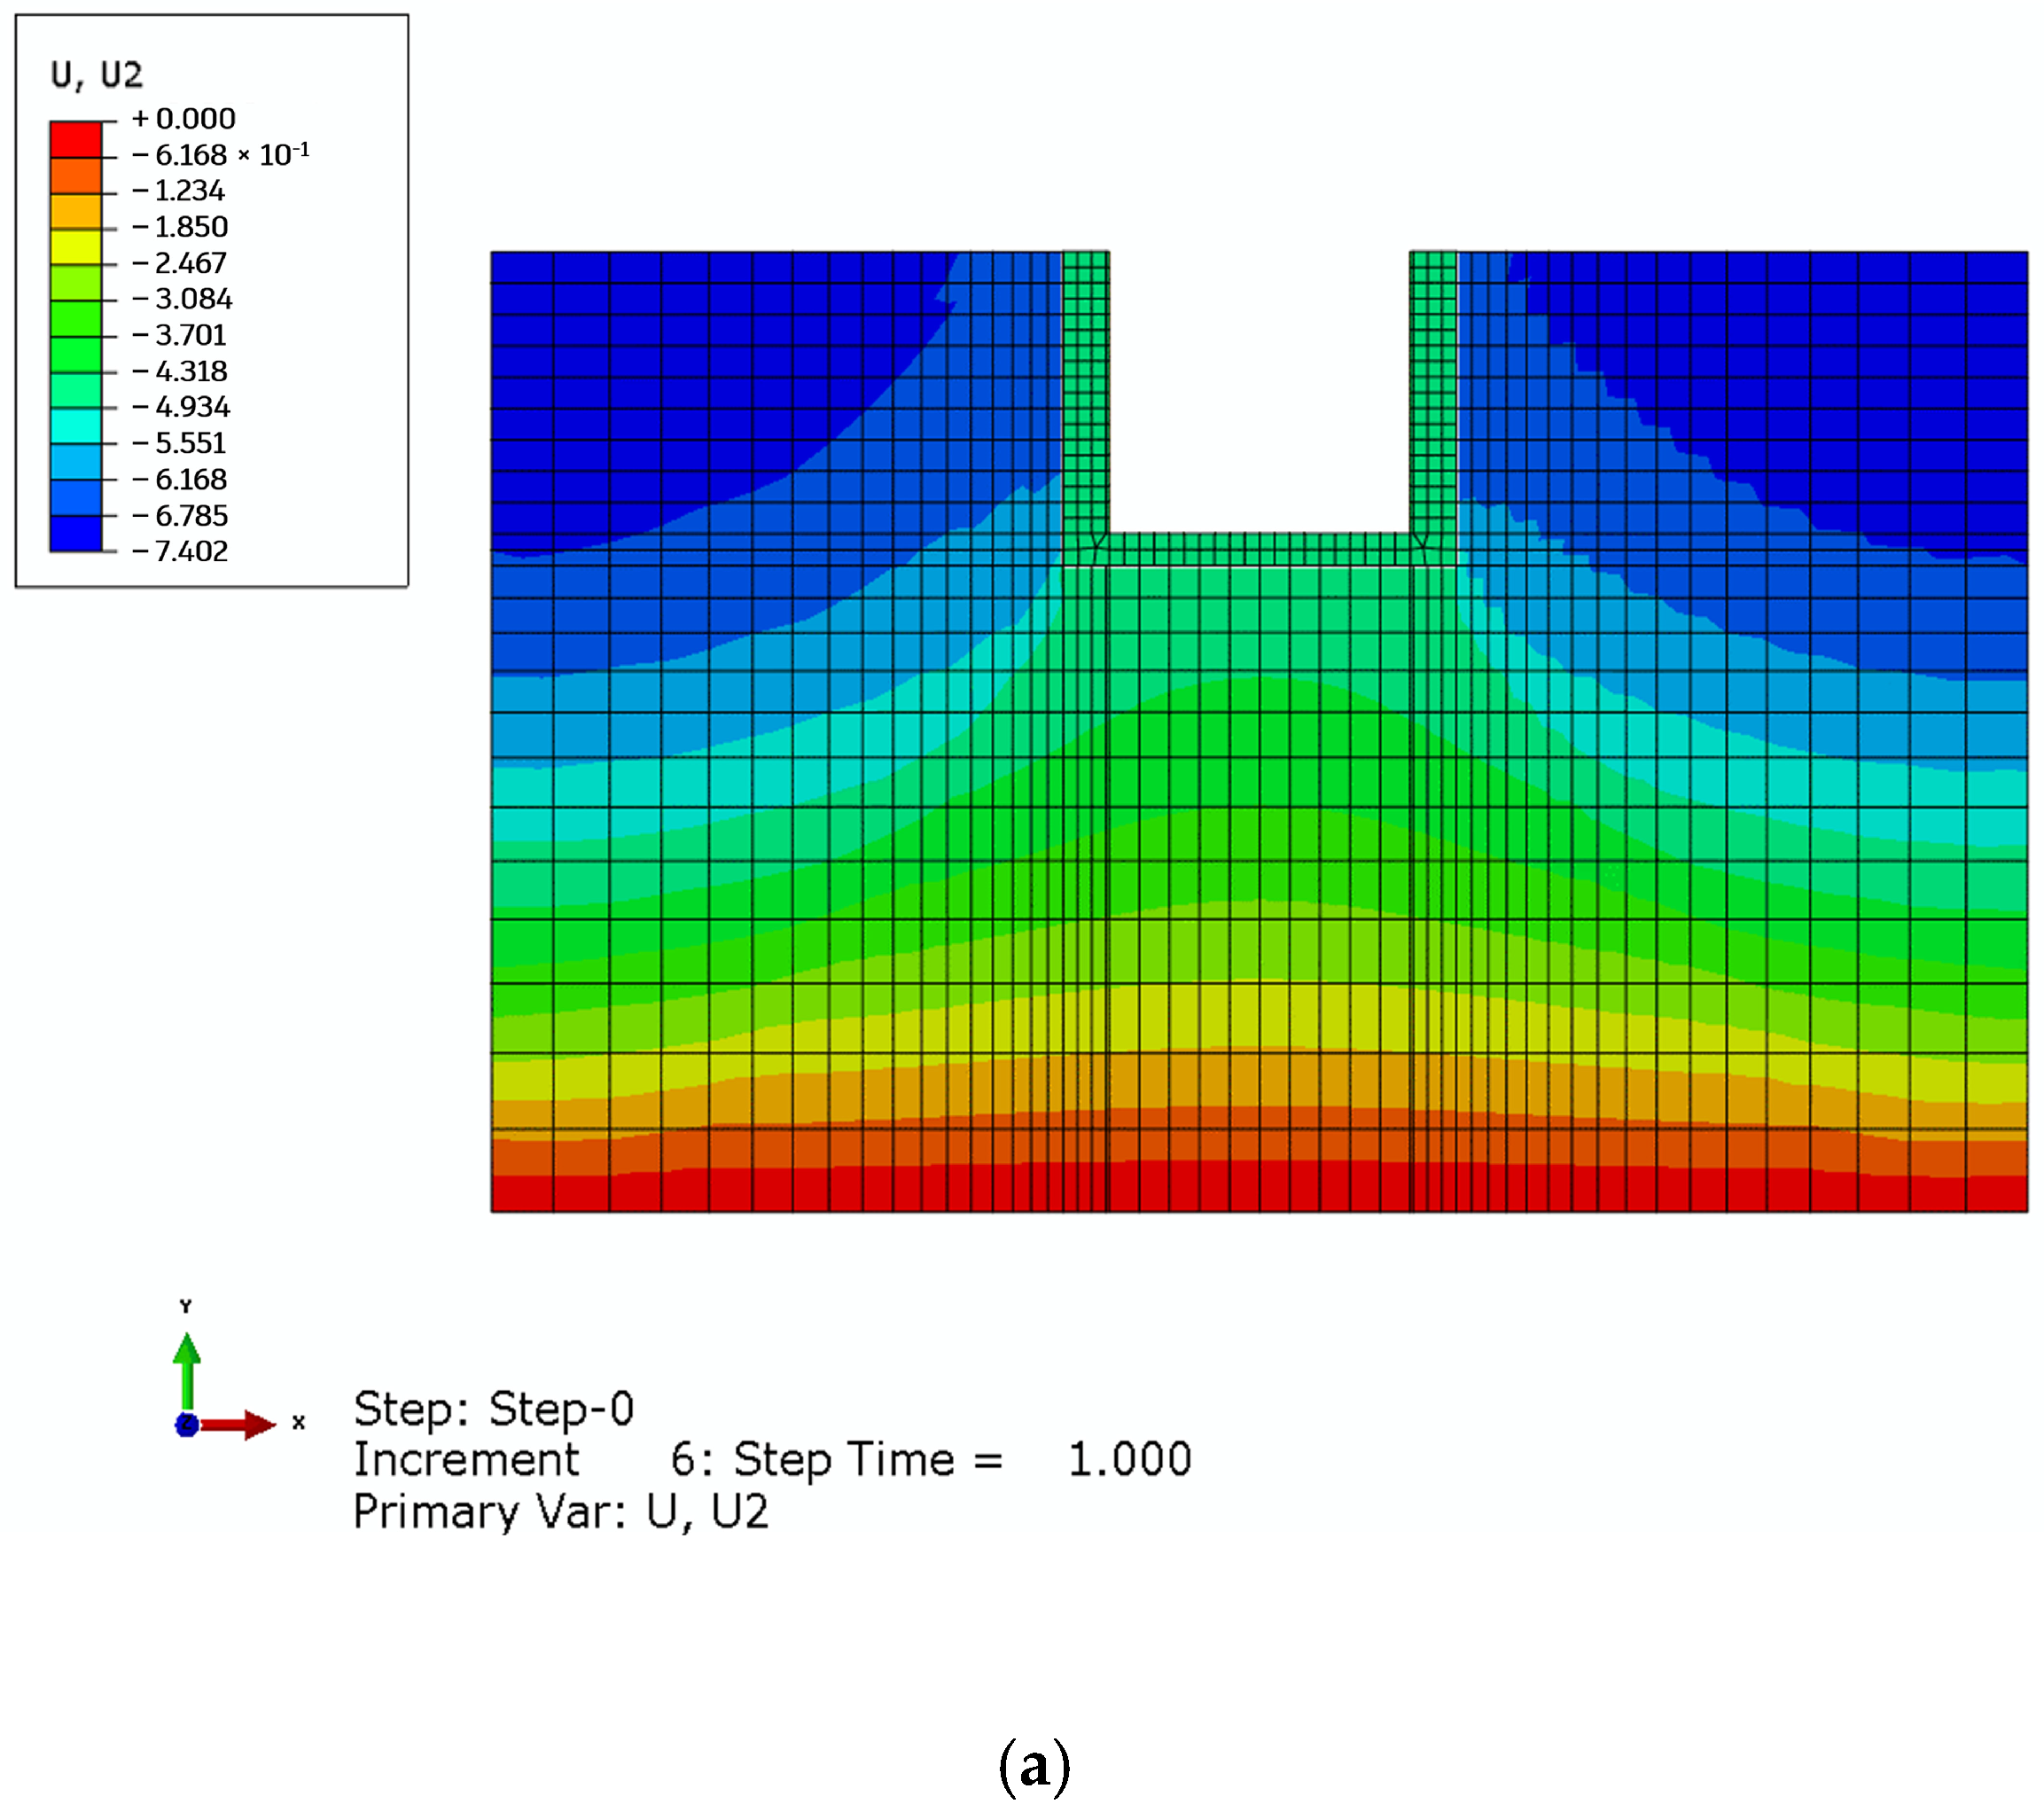
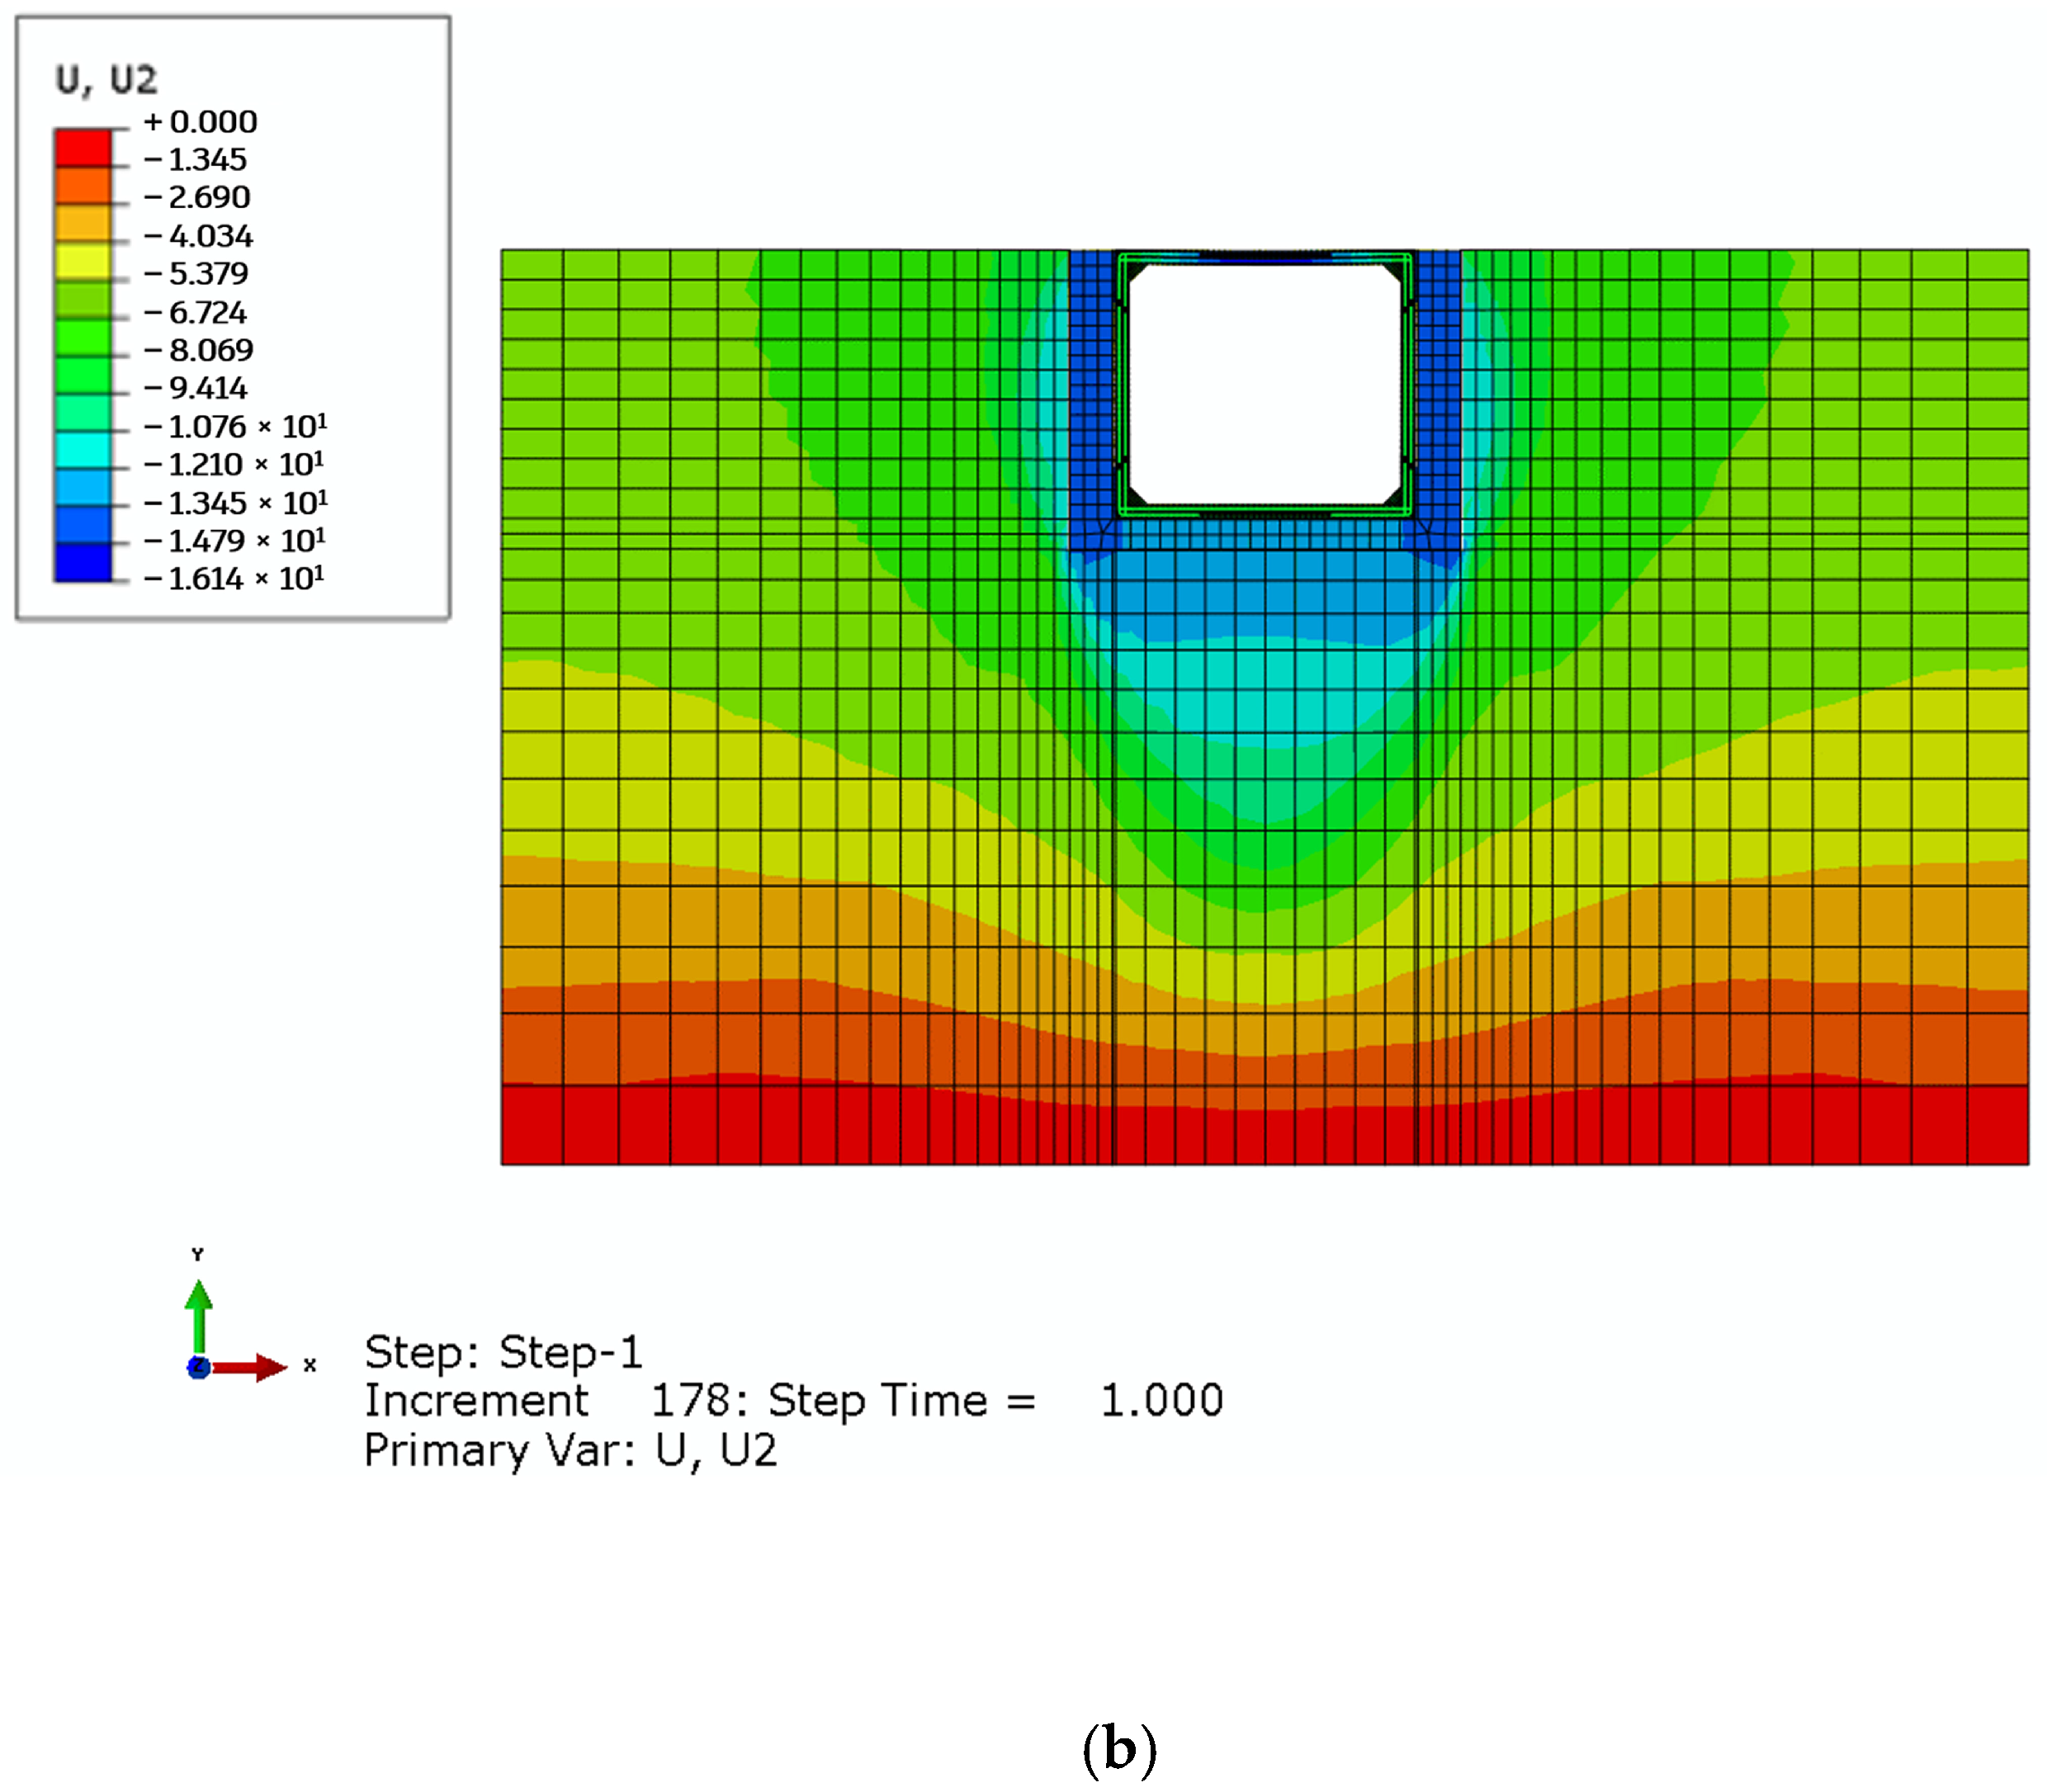
Figure 18 displays the distribution of vertical displacement of the model under various working conditions. During the first step of soil excavation (Step-0), it is evident that the soil under the middle excavation section and the installed original structure experience relative upward displacement in relation to the surrounding soil. Therefore, the subsequent structural deformation analysis should prioritize relative displacement after loading. In the second loading step (Step-1), a design load of 73.05 kN/m
2 is applied above the structure, causing the original structure and reinforced segment to sink into the surrounding soil as a whole. As a result, the relative displacement between the top and bottom segments should be the main focus of displacement analysis for prefabricated segments.
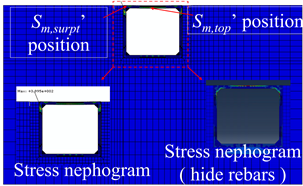
The results are presented in
Table 3, where
U2′ represents the relative displacement at the midspan of the top and bottom segments,
Sm represents the Mises stress,
Sm,top represents the Mises stress of the rebar at mid-span of the top segment,
Sm,suprt represents the Mises stress of the rebar at the supports at both ends of the top segment, and
Sm,max represents the maximum value of the Mises stress. The results show that the reduction in the elastic modulus of the grouting material does not significantly affect the strain of the rebars on the key sections of the reinforced segment, with the maximum change not exceeding 2%. Therefore, the material properties of the grouting material have little effect on the reinforcement effect of the prefabricated segment structure. In addition, the relative displacement change between the top and bottom segments is not visible, with a value of approximately 7.9 mm~8.1 mm. Based on these findings, it can be concluded that the choice of grouting material has no significant impact on the deformation characteristics, internal force distribution, or static bearing performance of the prefabricated reinforcement segments. Therefore, the simulation results can be used for further analysis and comparison with the field test results.
The stress contour map of the concrete in the prefabricated segment presented in
Table 3 indicates that the load on the upper surface of the structure is primarily borne by the soil below the structure’s bottom, resulting in higher stress at the soil bottom compared to the stress on both sides. Furthermore, the stress on the concrete of the top segment is higher, and its distribution characteristics are similar to those of beams fixed at both ends under uniform load. The strain value of the rebar at mid-span (average 1286 με
) is approximately 1.28 times the strain value of the rebar at the support (average value 1000 με), indicating that the top segment is semi-rigid-fixed. These results are consistent with the findings obtained from the field test, highlighting the importance of closely integrating the top segment and the original structure during reinforcement construction.


