Article

Demand-Responsive Evaluation and Optimization of Fitness Facilities in Urban Park Green Spaces

1
School of Art, Xi’an University of Architecture and Technology, Xi’an 710055, China
2
School of Architecture and Urban Planning, Guizhou Institute of Technology, GuiYang 550003, China
3
School of Architecture, South China University of Technology, Guangzhou 510641, China
*
Author to whom correspondence should be addressed.
Buildings 2025, 15(14), 2500; https://doi.org/10.3390/buildings15142500
Submission received: 3 June 2025 / Revised: 3 July 2025 / Accepted: 14 July 2025 / Published: 16 July 2025
(This article belongs to the Section Architectural Design, Urban Science, and Real Estate)

Abstract

(1) Background: The provision of monofunctional or inadequately distributed services in urban park green spaces often constrains residents’ opportunities and diversity for outdoor activities, particularly limiting access and participation for specific age groups or activity preferences. However, functional nodes with temporal and spatial flexibility demonstrate high-quality characteristics of resilient and shared services through integrated development. Accurately identifying user demand provides a solid basis for optimizing the functional configuration of urban parks. (2) Methods: This study took the old city area of Zhengzhou, Henan Province, China, as a case study. By collecting and integrating various types of data, such as geographic spatial data, field investigation data, and behavioral observations, we developed a population demand quantification method and a modular analysis approach for park service functions. This framework enabled correlation analysis between diverse user needs and park services. The study further classified and combined park functions into modular units, quantifying their elastic and shared service capabilities—namely, the adaptive flexibility and shared utilization capacity of park services. Additionally, we established a demand-responsive evaluation system for identifying and diagnosing problem areas in park services based on multi-source data. (3) Results: The demand response index and diagnostic results indicate that the supply of fitness facilities—particularly equipment-based installations—is insufficient within the old urban district of Zhengzhou. Among the three user groups—children, young and middle-aged adults, and the elderly—the elderly population exhibited the lowest demand response index, revealing a significant gap in meeting their specific needs. (4) Conclusions: Based on the research findings, a three-tier optimization strategy is proposed: A. improve green space connectivity to expand the service coverage of parks; B. implement multifunctional overlay and coordinated integration in spatial design based on site characteristics and demand diagnostics; and C. increase the total supply of facilities to enhance spatial efficiency in parks. By integrating the demand assessment data and diagnostic results, this approach enabled a data-driven reorganization of service types and targeted allocation of resources within existing park infrastructure, offering a practical tool and reference for the planning of urban outdoor activity spaces.

1. Research Background

1.1. Policy Context

In recent years, China has been actively promoting the transformation of urban park green spaces from traditional “ornamental” functions to “flexible and shared” models. In 2025, the Chinese government issued its guidelines on the construction of high-quality outdoor sports destinations, which proposed an integrated development approach of sports + culture and tourism + ecology. The policy encourages the construction of fitness trails, smart running tracks, and other recreational facilities within park green spaces, emphasizing the combination of standardization and adaptive management [1]. To align with this national agenda, the city of Zhengzhou introduced a series of measures, including the creation of over 1.6 million square meters of new green space, the establishment of more than ten new parks and gardens, and the promotion of integrated land-use models such as “park + sport.” Moreover, all newly built parks are required to include free playgrounds for children and dedicated fitness areas for the elderly [2]. These green spaces provide vital opportunities for physical activity and foster public and community engagement [3]. However, Zhengzhou’s old city area faces significant challenges due to the fragmented and insufficient supply of outdoor fitness venues. In response, the city issued the Implementation Plan for Building a Higher-Level Public Service System for National Fitness in Zhengzhou. This plan aimed to establish a comprehensive “15 min fitness circle” across the main urban area by 2025, with a focus on bridging gaps in community-level public fitness services and integrating fitness infrastructure into community service systems [4]. These policy shifts mark a transition from single-function parks to flexible and shared urban green spaces: spaces that dynamically adjust their usage modes to meet the needs of diverse user groups. In this context, “flexibility” refers to the capacity of a space or system to maintain functionality, adapt to changing demands, environmental conditions, or social structures, and recover or transform when necessary. In the realm of urban parks, flexibility extends beyond spatial structure and multifunctionality to include responsive management mechanisms, adaptable facility configurations, and service strategies aimed at achieving efficient and sustainable public space governance.
How to make urban parks more adaptive to the needs of various population segments—particularly with respect to recreation, fitness, safety, and social interaction—has become a critical issue in current urban planning and landscape design. Accordingly, this study had two primary research objectives: (1) to modularize the functional offerings of urban parks and to quantify their resilience-based service capacity across spatial and temporal dimensions; and (2) to refine and extend the demand–supply response index developed by Professor Conghui Zhou (2024) [5], creating an optimized evaluation tool capable of diagnosing the state of outdoor fitness demand responses across different demographic groups. This tool aims to support the precise optimization of urban park green space services under complex built environment conditions.

1.2. Literature Review

In recent years, the evaluation of supply and demand for urban parks has become a growing focus in academic research. To effectively plan and manage green infrastructure, greater attention is needed to understand the roles of different types of green spaces within urban environments [6]. Most studies employ accessibility analysis and outdoor activity path modeling to assess the spatial relationship between supply and demand. These studies commonly utilize static analyses based on the collection of POI (point of interest) data, surveys, and GIS tools. Weng Yicheng and colleagues applied methods such as the two-step floating catchment area (2SFCA), service area analysis, and origin–destination (OD) cost matrix analysis to evaluate urban park green space supply [7]. Yu Yang’s team developed a supply–demand evaluation framework comprising four dimensions: supply potential, supply opportunity, social demand, and material demand. Using a coupling coordination degree model, they explored the spatial distribution of urban park CESs (cultural ecosystem services) supply, demand, supply–demand matching types, and their coordination levels [8]. Liu Kun’s team proposed a child-friendly urban environment evaluation model based on the concept of “children’s daily life,” constructing a Brundtland-inspired framework [9]. Liu Pinghao’s team employed virtual reality (VR) technology to simulate spatial environments, combining it with user perception data to assess satisfaction with public fitness routes [10]. Chen Jintang’s team utilized mobile signaling data to track daily travel behavior across four age groups in Guangzhou. By applying multiple probability-based calculation methods, they introduced the visiting preference index (VPI) to quantify residents’ preferences for seven types of public service facilities within their daily travel range, thereby evaluating the supply–demand levels of these facilities [11]. Luo Chang’s team evaluated the supply of urban green spaces from the dimensions of capacity, quality, and accessibility. Based on large-scale trajectory data, they mapped the demand for physical activity services using indicators such as visiting frequency and duration, and then assessed the supply–demand match of these services through spatial clustering analysis [12]. Ning Ling’s team constructed a geographic information model of Jianghan District using multi-source data, including census statistics and path planning APIs. They analyzed the accessibility, service level, and supply–demand relationship of park green spaces for the elderly population in the district [13].
Although existing studies have made significant progress in evaluating the supply and demand of urban park green spaces—particularly in terms of spatial accessibility, functional matching, and differentiated user perceptions—a number of critical limitations remain. First, there is insufficient attention to the temporal dynamics of user demand, resulting in a limited understanding of residents’ behavioral patterns at different times of day. Second, many assessments neglect the actual maintenance status and accessibility of facilities, which can lead to inaccuracies in supply–demand matching results. Third, the reliance on static data in most current research makes it difficult to reflect the real-time resilience of urban park services under complex environmental conditions. These shortcomings hinder the effectiveness of current evaluation frameworks in supporting the precise optimization and dynamic management of urban green spaces. To address these gaps, this study proposes an innovative methodology that integrates field observation, GIS-based spatial analysis, and web-based surveys. Through multi-period, multi-group, and multi-indicator data collection, it captures the temporal behavioral characteristics of park usage across different population groups and time intervals. By incorporating facility conditions and topographic factors into the assessment, this approach improves upon traditional static analyses by enhancing the responsiveness to dynamic user needs and increasing the precision and adaptability of spatial service resilience identification.

2. Study Area and Multi-Source Data Integration

This study focused on the old urban district of Zhengzhou City, which encompasses five subdistricts: Zhongyuan, Erqi, Guancheng, Jinshui, and Huiji. Covering an area of approximately 152 km2, the district is structured by a grid formed through the intersection of 11 east–west and 11 north–south arterial roads, resulting in a total of 77 grid cells. Each grid cell represents a “living circle unit” used as the basic unit of analysis in this research. The district has a permanent population of approximately 4.3 million, with an average population density as high as 28,000 people per square kilometer. Considering the varying service capacities and coverage ranges of different types of parks, this study further refined the functional classification of parks. By integrating GIS-based spatial analysis, we assessed park utilization patterns and service provision across different zones. Based on the 12th Five-Year Plan Manual for the Construction of Public Sports Facilities, fitness facilities were categorized into five types: ball sports, track and field, exercise equipment, specialty sports, and comprehensive facilities [14]. In this study, we reclassified park activity spaces into three primary categories—field-based, trail-based, and equipment-based (Figure 1)—according to site characteristics. This categorization aimed to reflect the usage preferences and adaptability to demand among diverse user groups. Site-based facilities refer to fixed areas designated for group or individual activities such as sports and recreation—for example, basketball courts and public plazas. Trail-based facilities refer to pathway systems designed for walking, jogging, and cycling. Equipment-based facilities refer to spaces equipped with specific functional installations such as fitness equipment and children’s play structures.
We collected diverse datasets from both the supply and demand perspectives [15] and conducted data cleaning and integration of multiple sources, including residential area AOI (area of interest) data, area information, and facility POI (point of interest) data. These datasets were primarily obtained from online platforms and residential construction information published in statistical yearbooks. Based on the compiled data, we utilized the ArcGIS 10.8 platform to establish a residential community–living circle geographic information database, which provided a solid data foundation and technical support for subsequent urban development research [16].

3. Research Framework and Methodology

This study adopted a space–time–behavior network model that encompassesed four key components: spatial supply quantification, behavioral demand quantification, demand responsiveness index evaluation, and problem-area diagnosis (Figure 2).

3.1. Quantification of Supply-Side Factors

3.1.1. Data Collection

This study adopted a multi-source data integration approach to conduct a systematic investigation of park facilities in the old urban district. Taking into account factors such as area and function, the survey objects were categorized according to the park design standards, covering four main types of parks: comprehensive parks, specialized parks, community parks, and pocket parks [17]. Using field measurements, aerial imagery analysis, and GIS spatial analysis techniques, we comprehensively collected data on the distribution and usage patterns of park facilities. From January to May 2025, the research team conducted multidimensional data collection on 378 activity spaces in Zhengzhou’s old urban district: 265 site-based facilities, 66 trail-based facilities, and 47 equipment-based facilities. The implementation process comprised three levels.
In the preliminary stage, base road network data for the old city were obtained from the OpenStreetMap (OSM) platform. POI data on urban parks and delineated park boundaries within the study area were scraped using Python 3.12—based crawling tools. All datasets were cleaned and validated against real-world conditions (Table 1). The final data visualization and integration were carried out in ArcGIS 10.8, laying a solid foundation for subsequent field surveys and ensuring the scientific rigor and reliability of the results.
At the facility supply level, field investigations were conducted using GPS positioning to precisely capture POI data of all types of activity spaces along with information on facility maintenance status. A geospatial database of park facilities was developed to support spatial analysis. Observations were conducted in January, March, and May, with periodic recordings of peak foot traffic and facility utilization intensity across three daily time intervals: morning, midday, and evening.
At the level of human behavior analysis, a multidimensional behavioral monitoring system was implemented using synchronized aerial and ground-level image acquisition (Figure 3). Ten representative sites were selected for continuous dynamic monitoring over a 7-day period, covering both weekdays and weekends. High-resolution visual data were collected during three key daily time slots: period I (8:00–9:00), period II (13:00–14:00), and period III (18:00–19:00). For each slot, 10 min of continuous video footage was recorded to ensure temporal representativeness and behavioral data integrity.
Aerial perspectives were captured using a professional-grade drone equipped with a high-resolution camera. Flight paths were pre-programmed and automated via a ground control station to maintain consistent altitude and camera angles across all missions, enabling precise documentation of crowd distribution, movement trajectories, and activity types from above. This standardized approach ensured the acquisition of comparable datasets for analysis.

3.1.2. Modularization of Facility Service Functions

To accurately assess the responsiveness of various types of outdoor fitness facilities to the physical activity needs of different population groups, this study modularized the functional components of outdoor activity spaces. First, a combination of questionnaire surveys and behavioral observations was used to identify the types of outdoor activities preferred by various age groups within the old urban district. These activity types were then mapped to corresponding categories of service modules for outdoor fitness facilities.
Second, based on on-site investigations, each functional module was categorized in alignment with the urban park design standards, which specify spatial requirements and usage guidelines for different types of facilities. Considering the spatial distribution and utilization efficiency of park infrastructure within the study area, the facilities were further divided into distinct service modules to clarify their respective functional characteristics.
As a result, ten primary types of service modules were identified and classified (Table 2). Additionally, the calculation of usable area and capacity for each facility type in this study referenced the methodology proposed by Professor Zhou Conghui, which includes outdoor fitness facility capacity estimation and adjustment coefficients (Table 3).

3.2. Demand-Side Quantification and Spatial Projection

3.2.1. Data Collection

Based on the data from the Seventh National Population Census Bulletin of Zhengzhou City, this study integrated the population size and structural characteristics of the old urban area, focusing on analyzing the spatial distribution pattern of residents’ demand. At the data processing level, three levels of age stratification were used to rationally divide the population structure into three groups: children (0–14 years old), young adults (15–59 years old), and the elderly (≥60 years old) (Table 4).
Building on the WHO physical activity guidelines [19] and our preliminary surveys/observations, distinct outdoor activity preferences and requirements were identified for each age group:
Children: Primarily require spaces for active play, exploration, and gross motor skill development, often needing dedicated, safe equipment and supervised areas.
Young Adults: Engage in diverse activities including team sports (field-based), jogging/running (trail-based), and strength/cardio training (equipment-based), often seeking variety and efficiency.
Older Adults: Favor low-impact activities like walking, socializing, light exercises, and tai chi, prioritizing safety, accessibility, and seating.
In the construction of spatial analysis units, we innovatively established a two-level evaluation system of residential community–living circle. Firstly, based on the 15 min living circle delineation principle of Urban Residential Planning and Design Standard GB50180-2018 [20], the study area was divided into 77 standardized living circle units, and then, through the weighted allocation algorithm of residential floor area, the macro-population data at street level were precisely decomposed into 2662 micro-units of residential communities. Then, through the residential floor area weighted allocation algorithm, the macro-population data at the street level were precisely decomposed into 2662 micro-units of residential neighborhoods. This methodology not only ensured the completeness of the demographic data at the street level but also realized the spatial visualization of the demand characteristics of the residential community level (Figure 2).

3.2.2. Quantification of Reach

Regarding the study of park accessibility, firstly, based on the existing road network data in the old city, a refined road network dataset was constructed using the GIS platform (Figure 4). The process not only included the import of road geometry data but also combined street level, road attributes, intersection density, signal light settings, non-motorized lane settings and other information, cleaning, and repairing and structuring the original road network data to improve network connectivity and data integrity so as to provide a reliable basis for the subsequent network analysis.
After constructing the high-precision road network with the help of the Mapbox ArcGIS 10.8 platform isochronous circle calculation tool, set the walking speed as the standard 5 km/h, take the geometric center of mass of the park’s outer contour as the starting point of the analysis, and simulate the scope of urban pedestrians’ walking activities in 15 min to generate the isochronous circle. This process simulates the time required for the crowd to pass through different sections of the road, thus more realistically restoring the service coverage capacity of the park in the urban transportation network.
It is worth noting that the theoretical accessibility range constructed based on isochronous circles has strong spatial and temporal intuition, but it needs to be optimized and corrected with a series of spatial constraints in practical application. Walking comfort in different areas, traffic interference, waiting time at intersections, and the influence of building boundaries on path selection can all cause shifts in the accessibility results. In particular, accessibility, land use mix, and street connectivity affect activity participation by influencing the walking and self-care abilities of older adults [21]. Ultimately, this study overlaid the 15 min walking accessibility and neighborhood boundary data obtained from the analysis to explore the equity and disparity in the enjoyment of park services by residents in different areas (Figure 5). This not only helped to identify the “blind zones” or “marginal zones” of park services but also provided scientific and quantitative support for urban planning decisions, optimization of public resource allocation, and the location and functional flexibility of future urban parks.

3.3. Demand Response Index Review

Taking residential neighborhood K as an example, according to the spatial accessibility analysis, the area of the share of facilities and the intensity of demand that can be reached by each type of age group within 15 min were calculated, and the ratio of these two was the demand response index of each type of group in neighborhood K.
The demand response index calculation for residential neighborhood K involved five key steps (Figure 6).
Step 1: Calculate the proportion R of accessible facility resources suitable for each age group (Equation (1)). Here, Kj represents the support rate of facility j for the fitness activities of the specific age group residing in K, and N is the total number of fitness facilities accessible within a 15 min walk from K.
R = j = 1 n K j N × 100 %
Step 2: Compute the usage share F attributed to each age group by normalizing R by the proportion P of that age group within the total resident population (Equation (2)). This step adjusts for demographic composition.
F = R P
Step 3: Determine the effective supply area I S , z k allocated to age group z in neighborhood K. This is calculated as the sum of the area Aj of each accessible facility j, weighted by its age group-specific usage share F derived in Step 2 (Equation (3)).
I S , z k = j = 1 n F A j
Step 4: Based on the population size z of each age group within residential unit K and the corresponding demand intensity coefficient for different types of physical activity, the fitness activity demand intensity I D , z k for each age group is calculated. The demand intensity coefficients were derived from the World Health Organization report Global Recommendations on Physical Activity for Health [19], which recommends weekly physical activity durations of 420 min for children, and 112 min for both adults and the elderly. Accordingly, the demand intensity coefficients Yz for the three groups were calculated as 3.75 for children, 1.00 for adults, and 1.00 for the elderly, where Pzk represents the population of age group z in residential unit k (Equation (4)).
I D , z k = P z k Y z
Step 5: Calculate the demand response index.
I S D , z k = I S , z k I D , z k

3.4. Problem-Area Diagnosis

Based on the range characteristics of the demand response index in the old urban district, the demand response level was categorized into five grades: very low, low, medium, high, and very high. This classification was used to identify areas, population groups, and facility types with relatively low levels of outdoor demand responsiveness, thereby providing a basis for the formulation of targeted strategies.

4. Demand Response Index Analysis

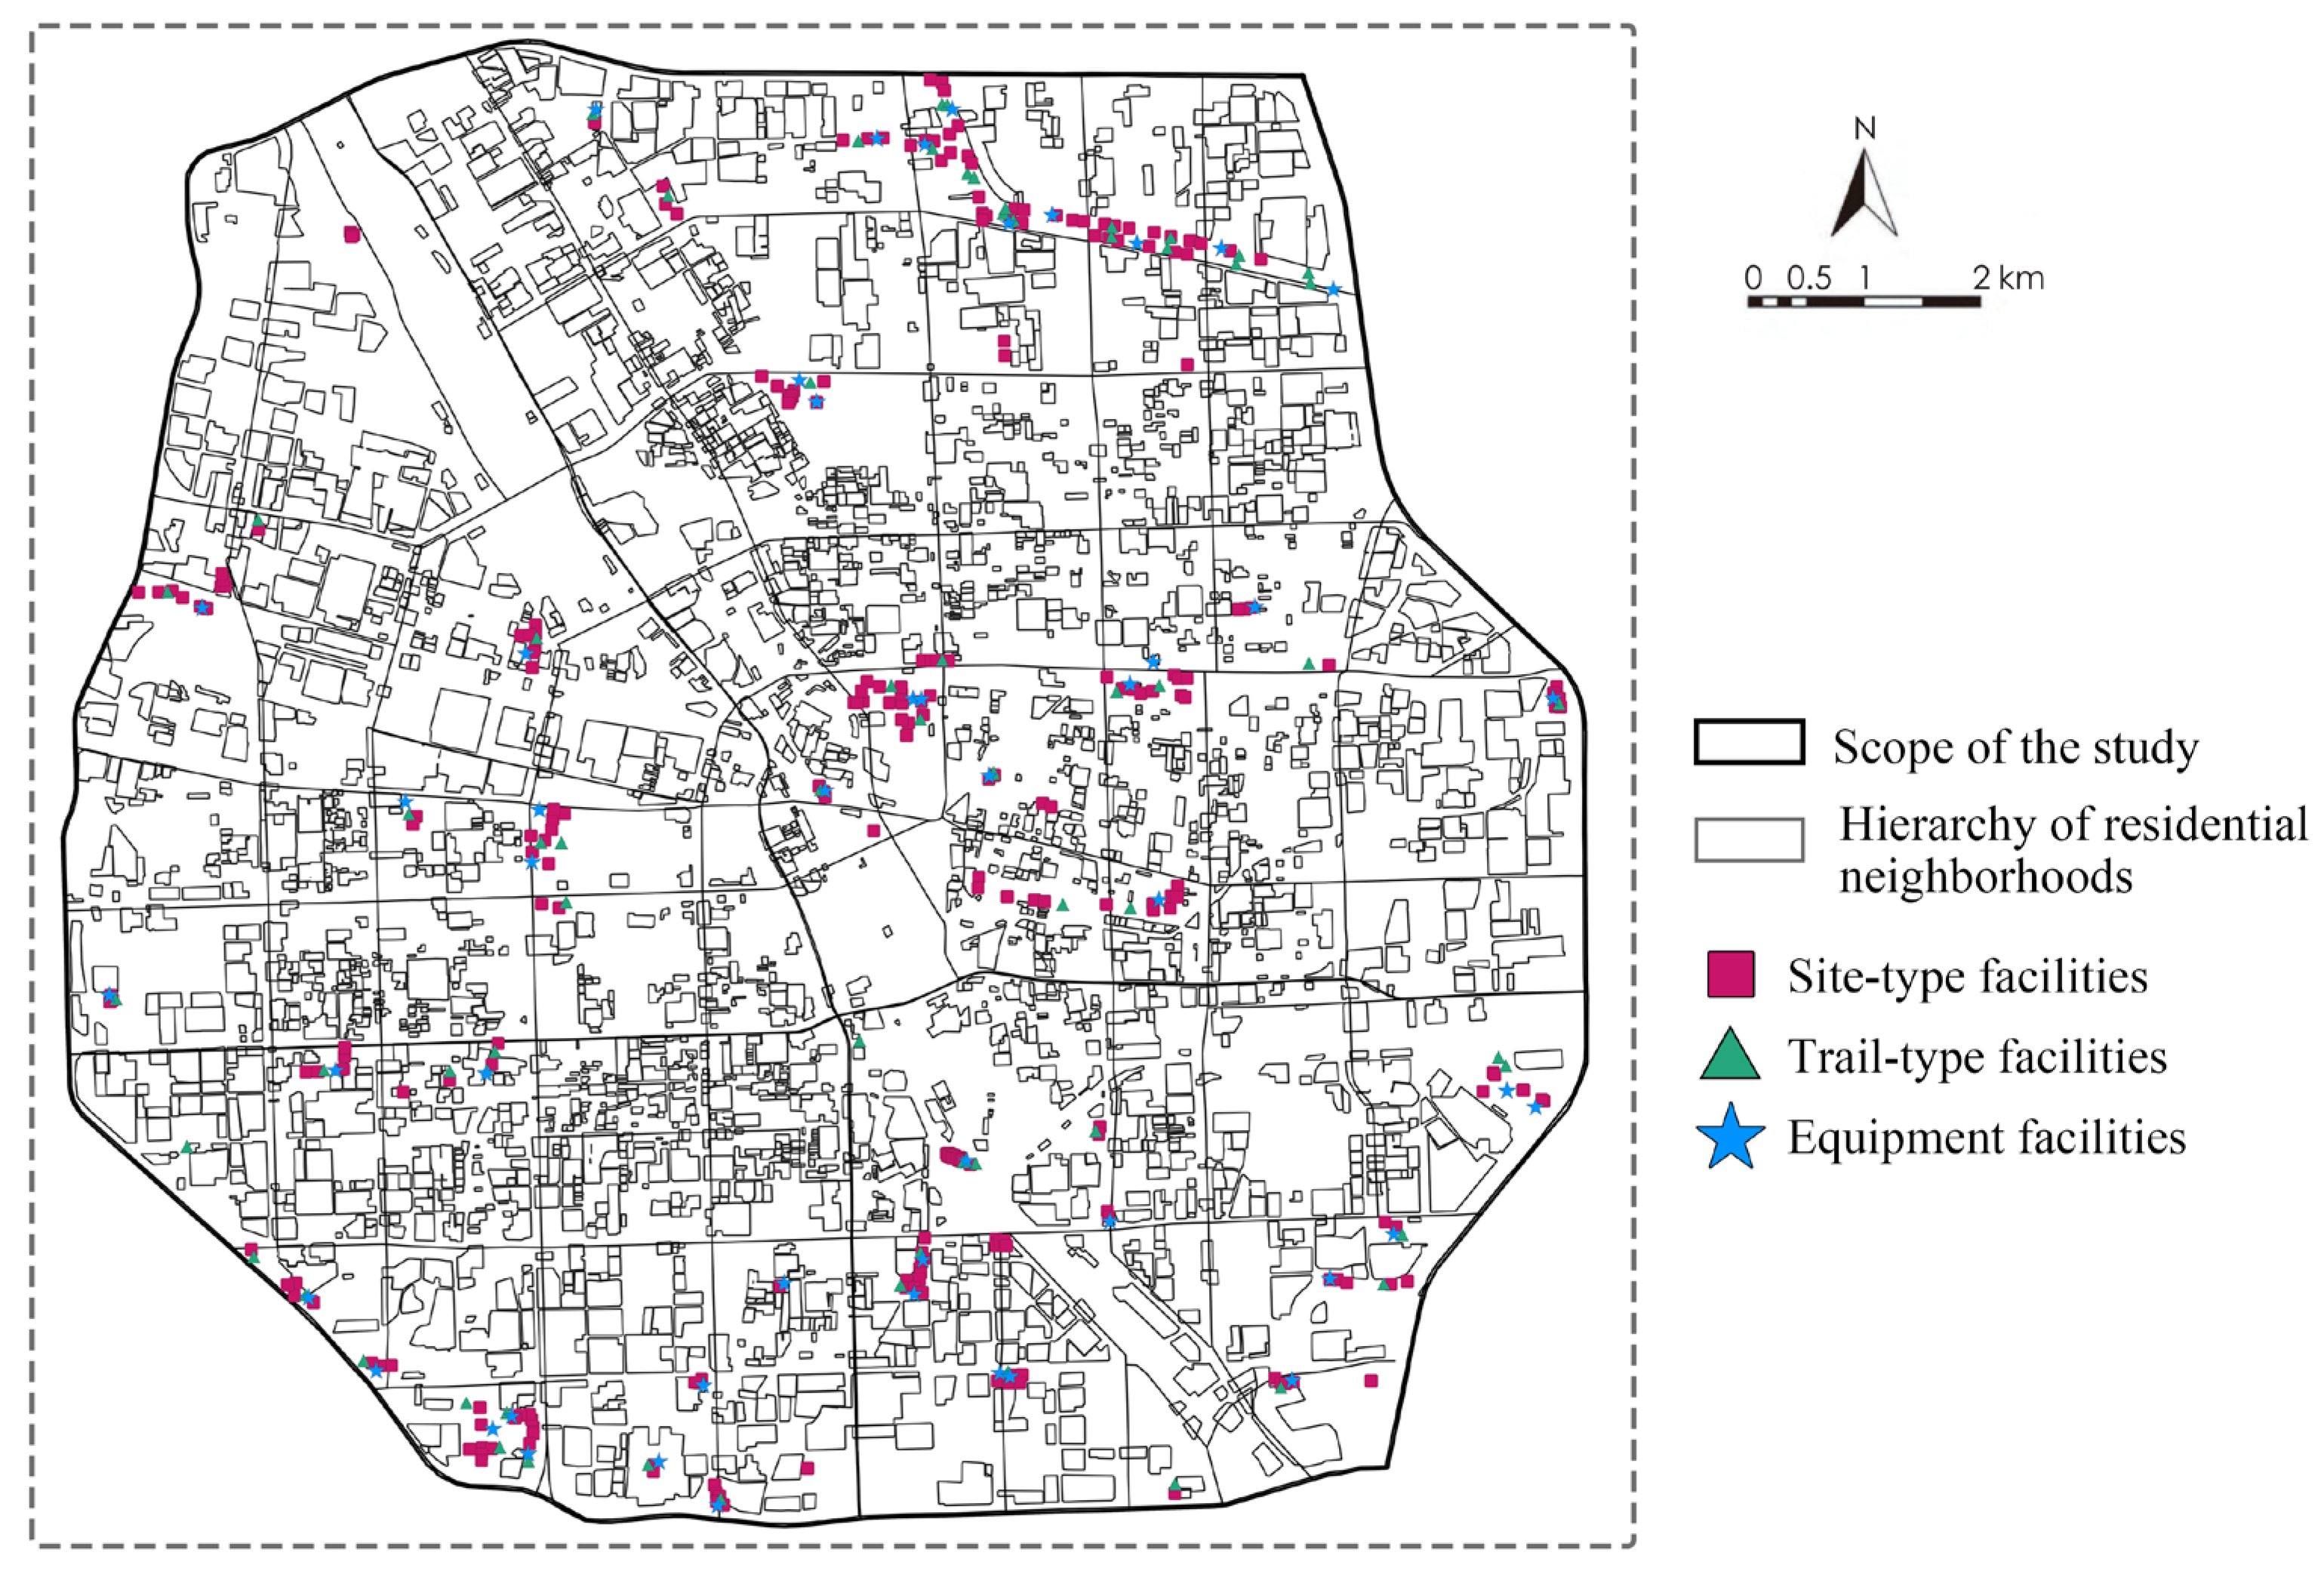
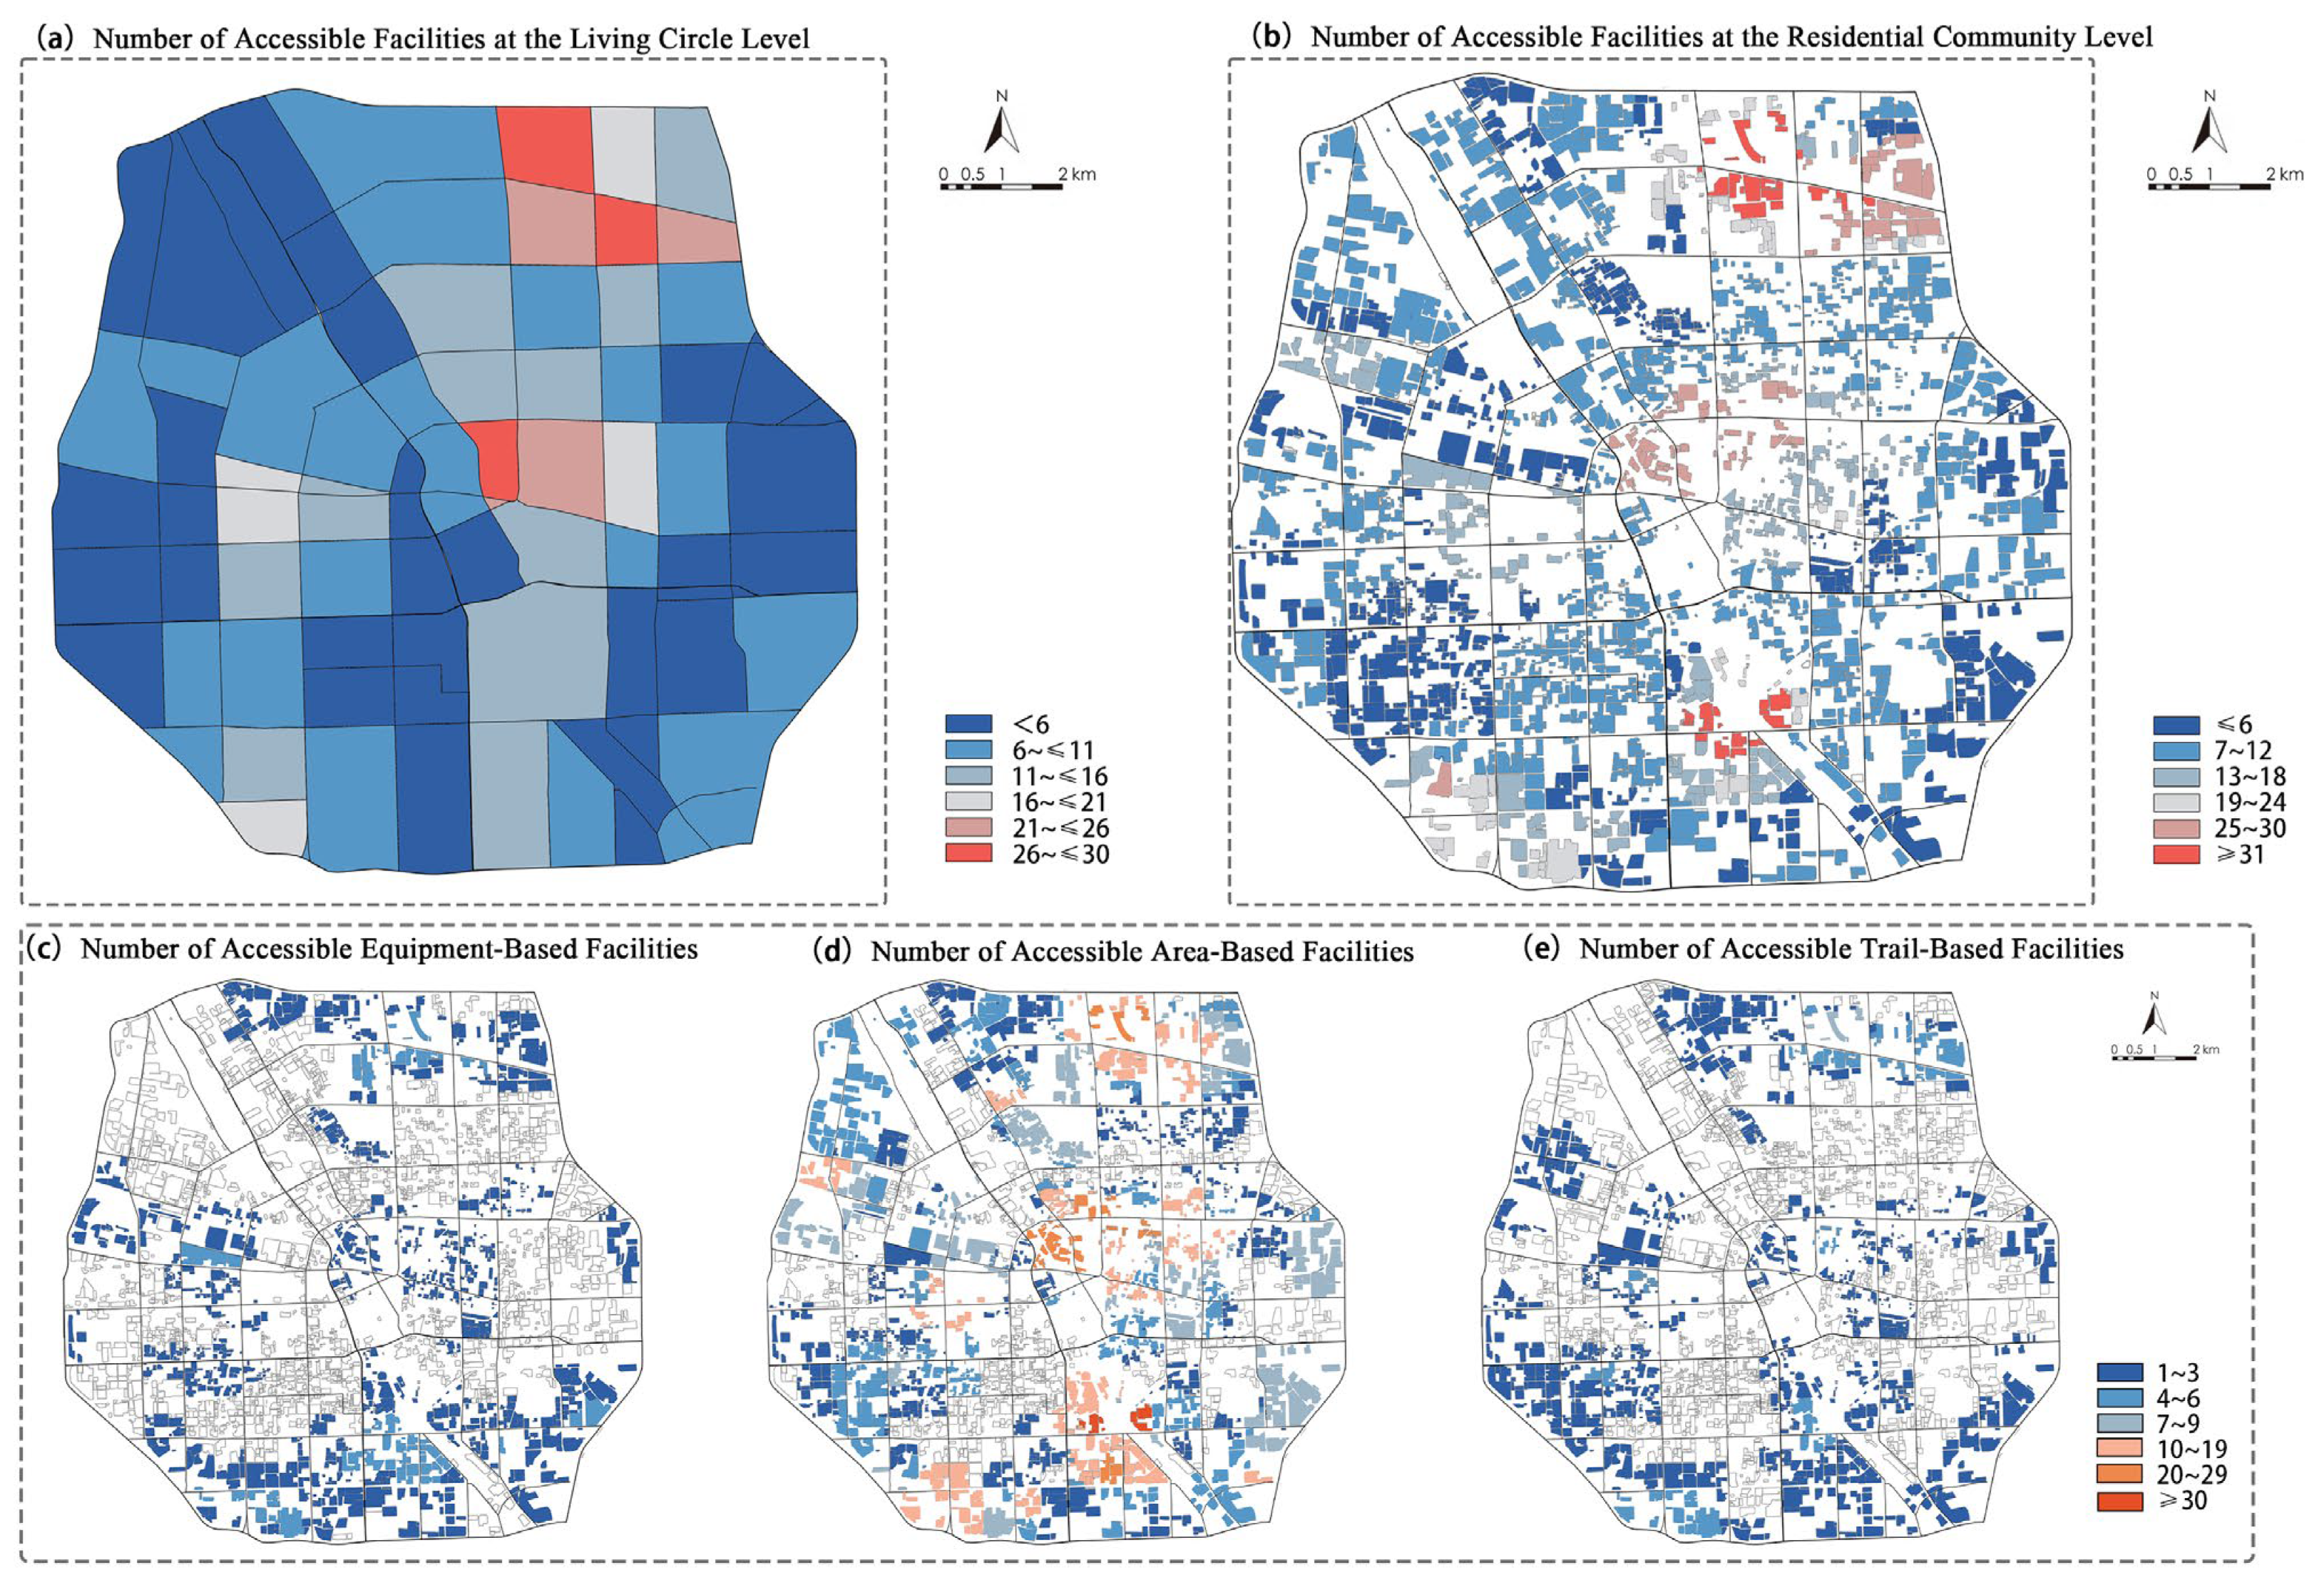
4.1. Spatial Supply-Side Status Analysis

From the perspective of spatial distribution characteristics, the distribution of parks in the old urban district is noticeably uneven, with overall spatial equity being relatively low. Medium-sized to large parks are primarily concentrated in the core area of the old district, creating a certain resource agglomeration effect. In contrast, Dongfeng Canal Riverside Park, owing to its unique geographical conditions, provides abundant outdoor activity spaces for nearby residents and plays a significant role in the provision of regional fitness resources.
Based on the survey results, the average number of service modules for outdoor fitness facilities within the old urban district is 5.65. Among these, the average module counts for site-type, trail-type, and equipment-type facilities are 3.69, 1.0, and 0.7, respectively. The high proportion of site-type modules mainly stems from their strong compatibility with various fitness activities, offering greater flexibility and potential for shared use. The distribution of trail-type facilities is relatively balanced, except for smaller pocket parks and street gardens, which lack the conditions to provide trails. Most parks with sufficient area generally feature one to two fitness trails suitable for brisk walking and jogging. In contrast, equipment-type fitness facilities are the least abundant, reflecting a notable deficiency in fitness equipment provision within the old district.
From the perspective of user group characteristics, the current fitness facilities in parks show the highest adaptability for the young and middle-aged population. This is related to their greater flexibility in physical capacity, types of activities, and time availability. The elderly group performs well in using highly shared site-type and trail-type modules, whereas the children’s group faces a clear shortage of suitable spaces. Specifically designed activity areas for children are relatively few, making it difficult to meet their daily activity and developmental needs. This disparity in adaptability indicates that future facility planning should pay greater attention to the spatial needs of children, thereby enhancing the overall equity and comprehensiveness of service provision.
Regarding international standards, the design of park facilities partially aligns with guidelines such as ISO 21542 [22] for accessibility. Notably, most trails meet minimum width requirements (>1.5 m), facilitating wheelchair access. However, significant gaps exist in children’s play areas, where safety surfacing and equipment maintenance fall short of international best practices (such as EN 1176 [23]). Similarly, elderly fitness zones often lack adequate signage and supportive seating compliant with universal design principles. These findings highlight the need for upgrading facilities to meet international safety and accessibility benchmarks, particularly for vulnerable groups identified in our demand response analysis.

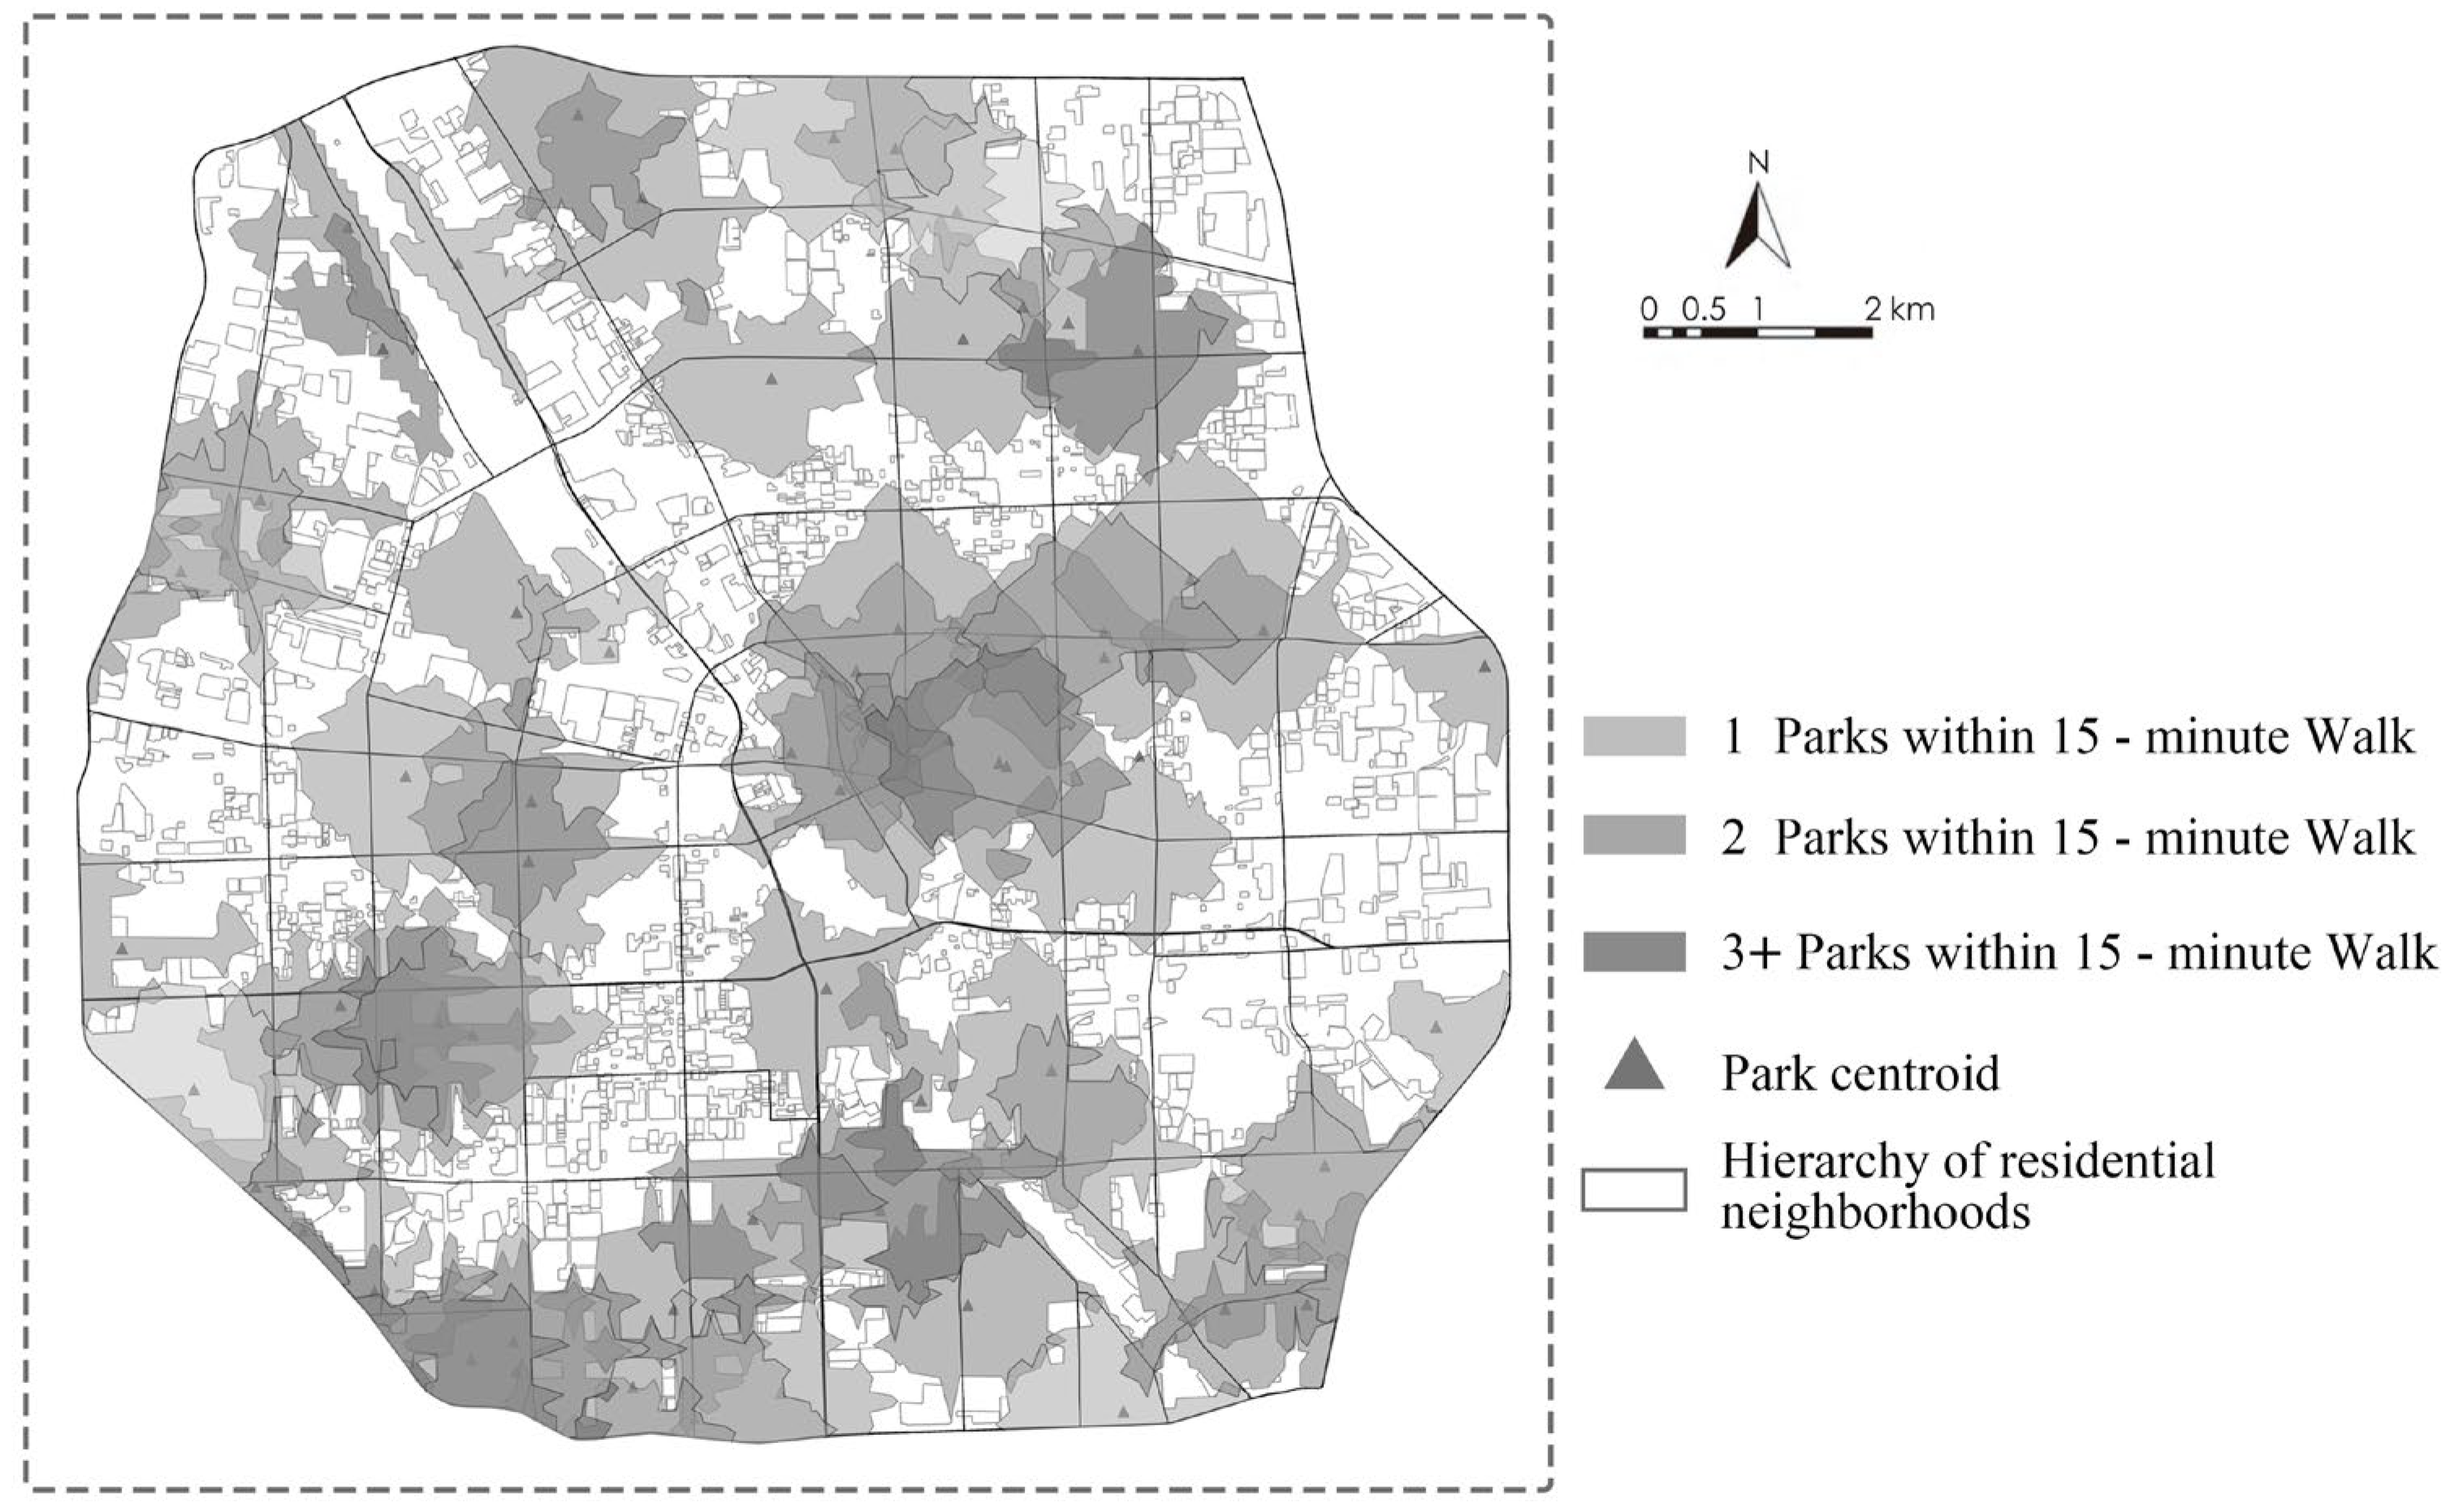
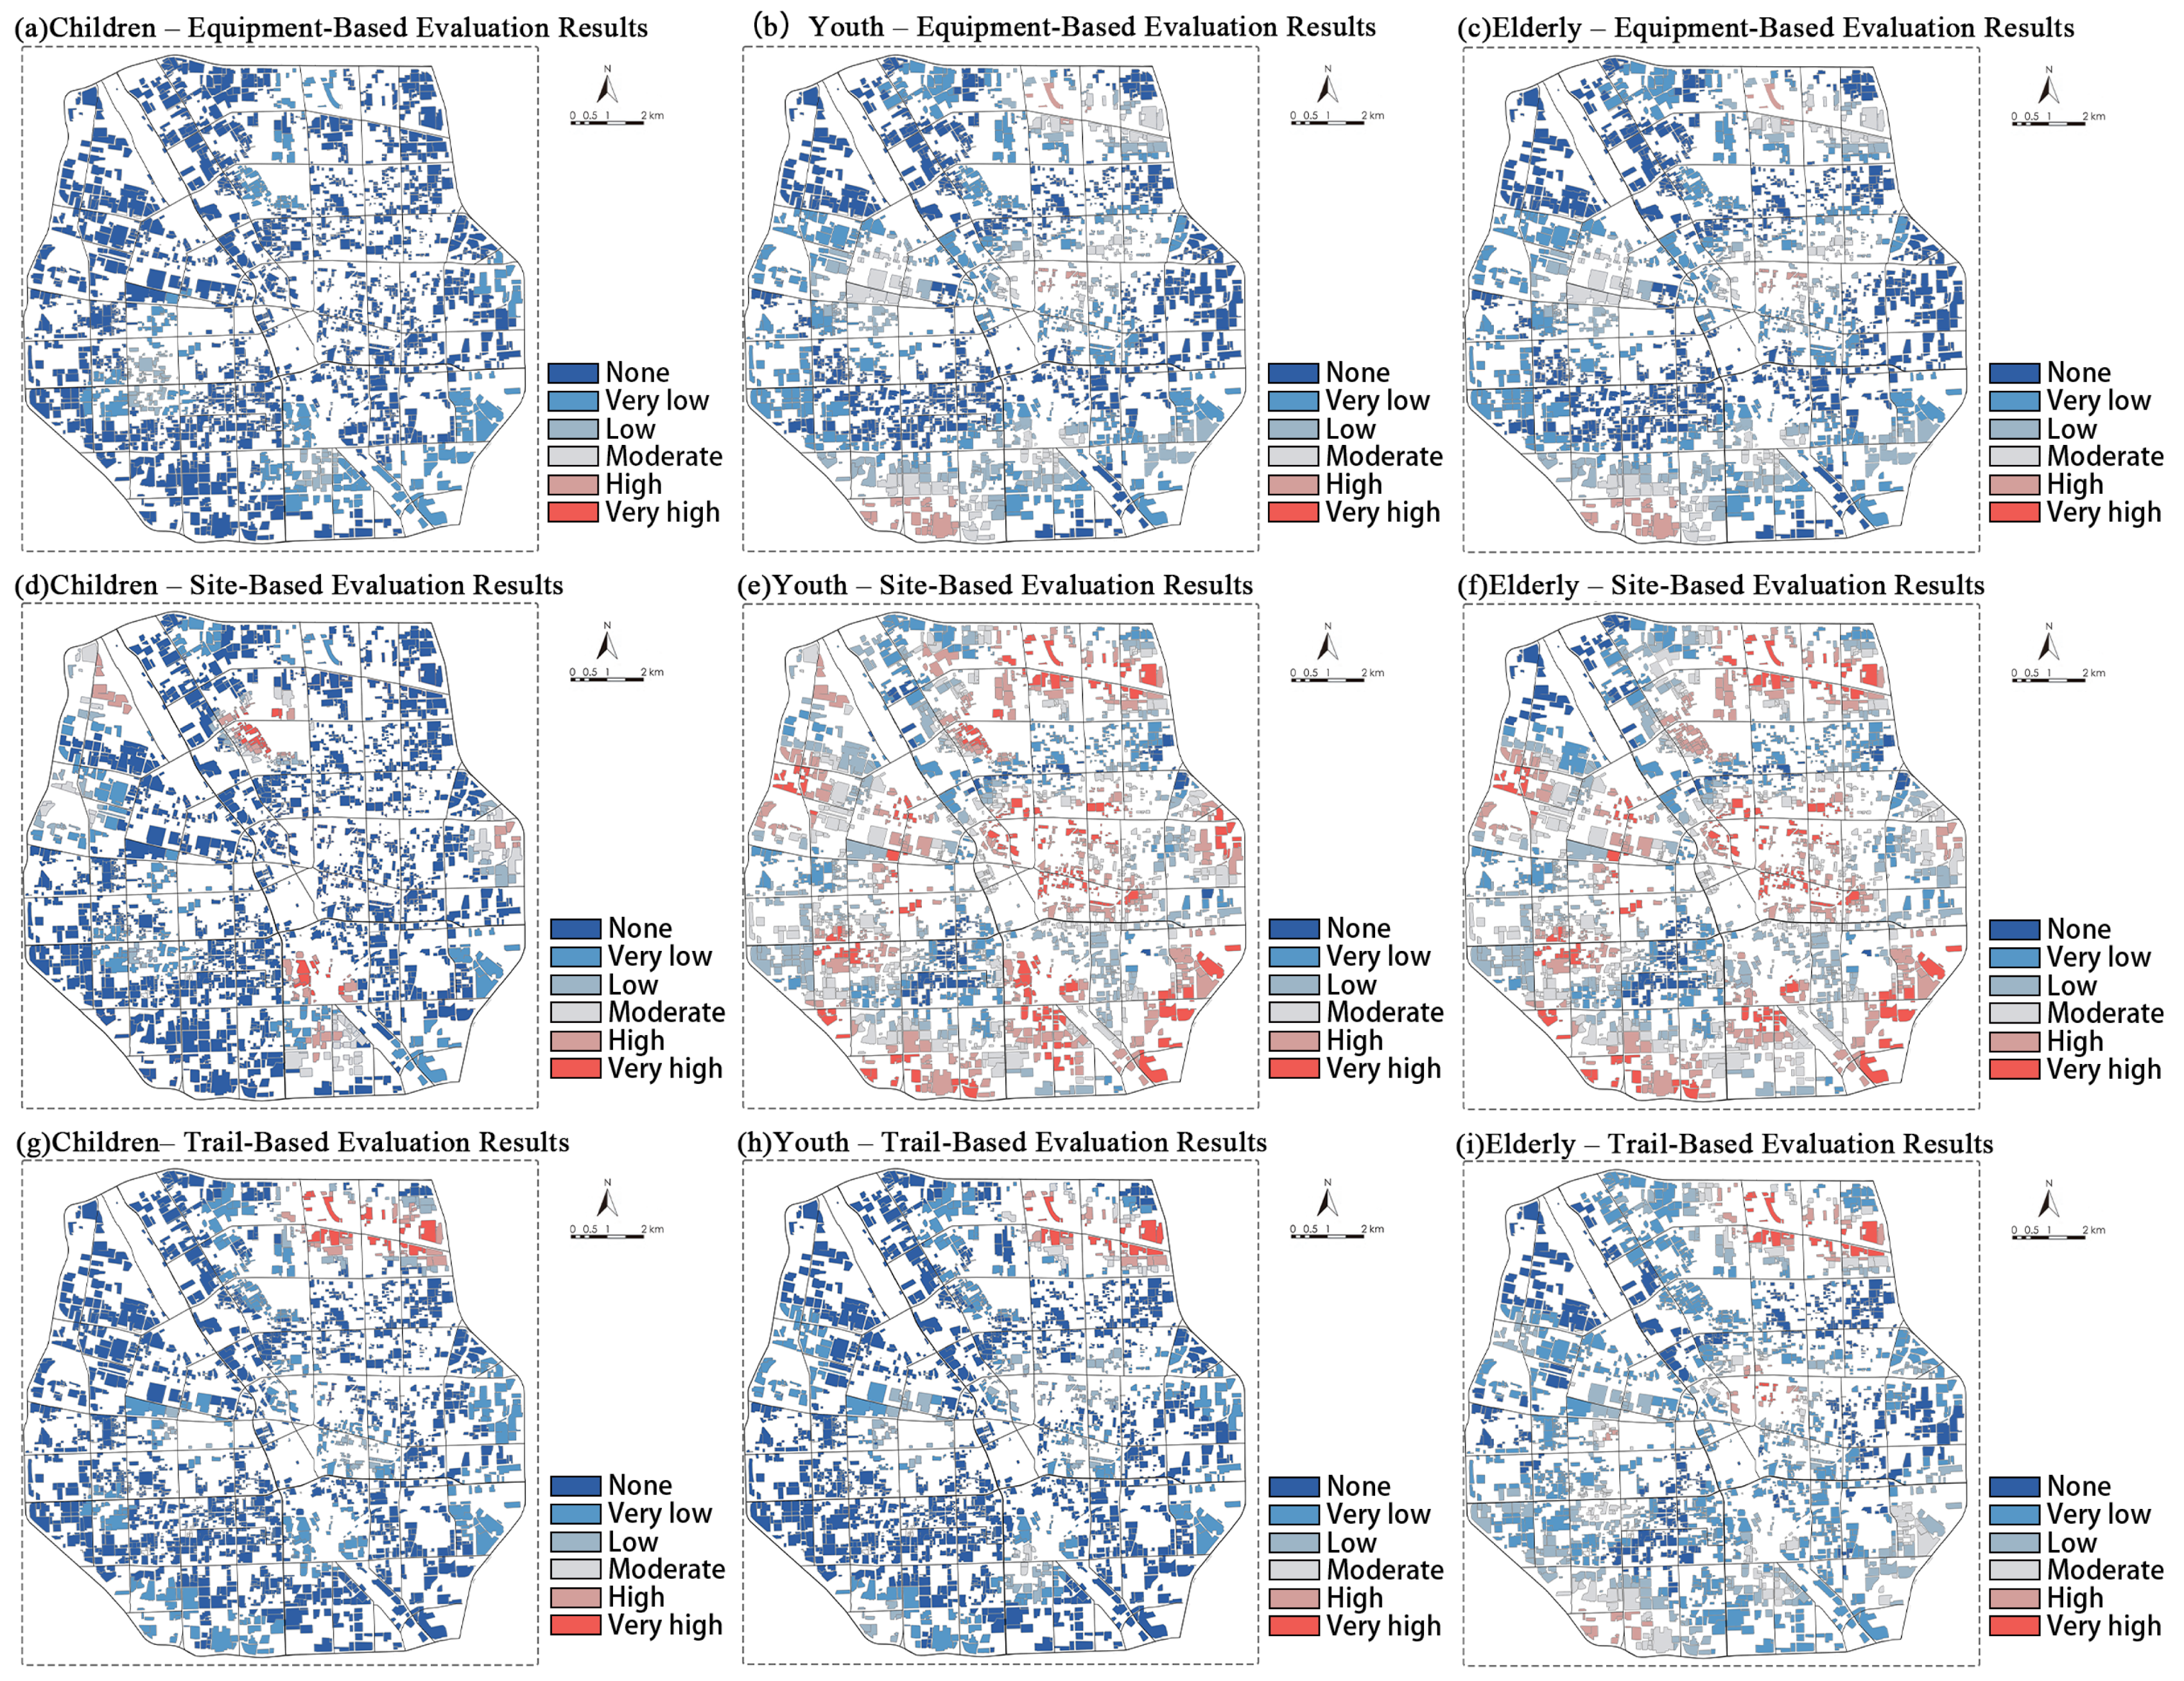
4.2. Behavioral Demand-Side Status Analysis

From the perspective of residents’ needs, the accessibility of park fitness facilities is an important indicator of the equity and effectiveness of spatial services. The results of the study show (Figure 7) that the accessibility of fitness service modules in the northeastern part of the old city, the central city, and the southwestern part of the city is relatively high, and the majority of the residents are able to reach a number of different types of fitness facilities within a 15 min walk to satisfy the diversified needs of daily fitness activities. In contrast, the accessibility of fitness facilities in the western and eastern parts of the city is significantly lower, making it difficult for residents to access high-quality outdoor fitness resources in their daily lives, and there are obvious service blind spots.
Further analyzing from the dimension of facility types, the overall number of accessible facilities of trail and equipment types is relatively low, and the space related to children’s activities is scarcer. Although some areas have certain advantages in terms of the number of total service modules, the balance of facility function types and the precise service for subdivided groups still need to be improved. Especially in terms of children’s activity spaces, based on the current distribution of spaces, it is difficult to meet their needs for fitness and play in the vicinity, which is not conducive to the development of children’s physical fitness or outdoor activity habits.

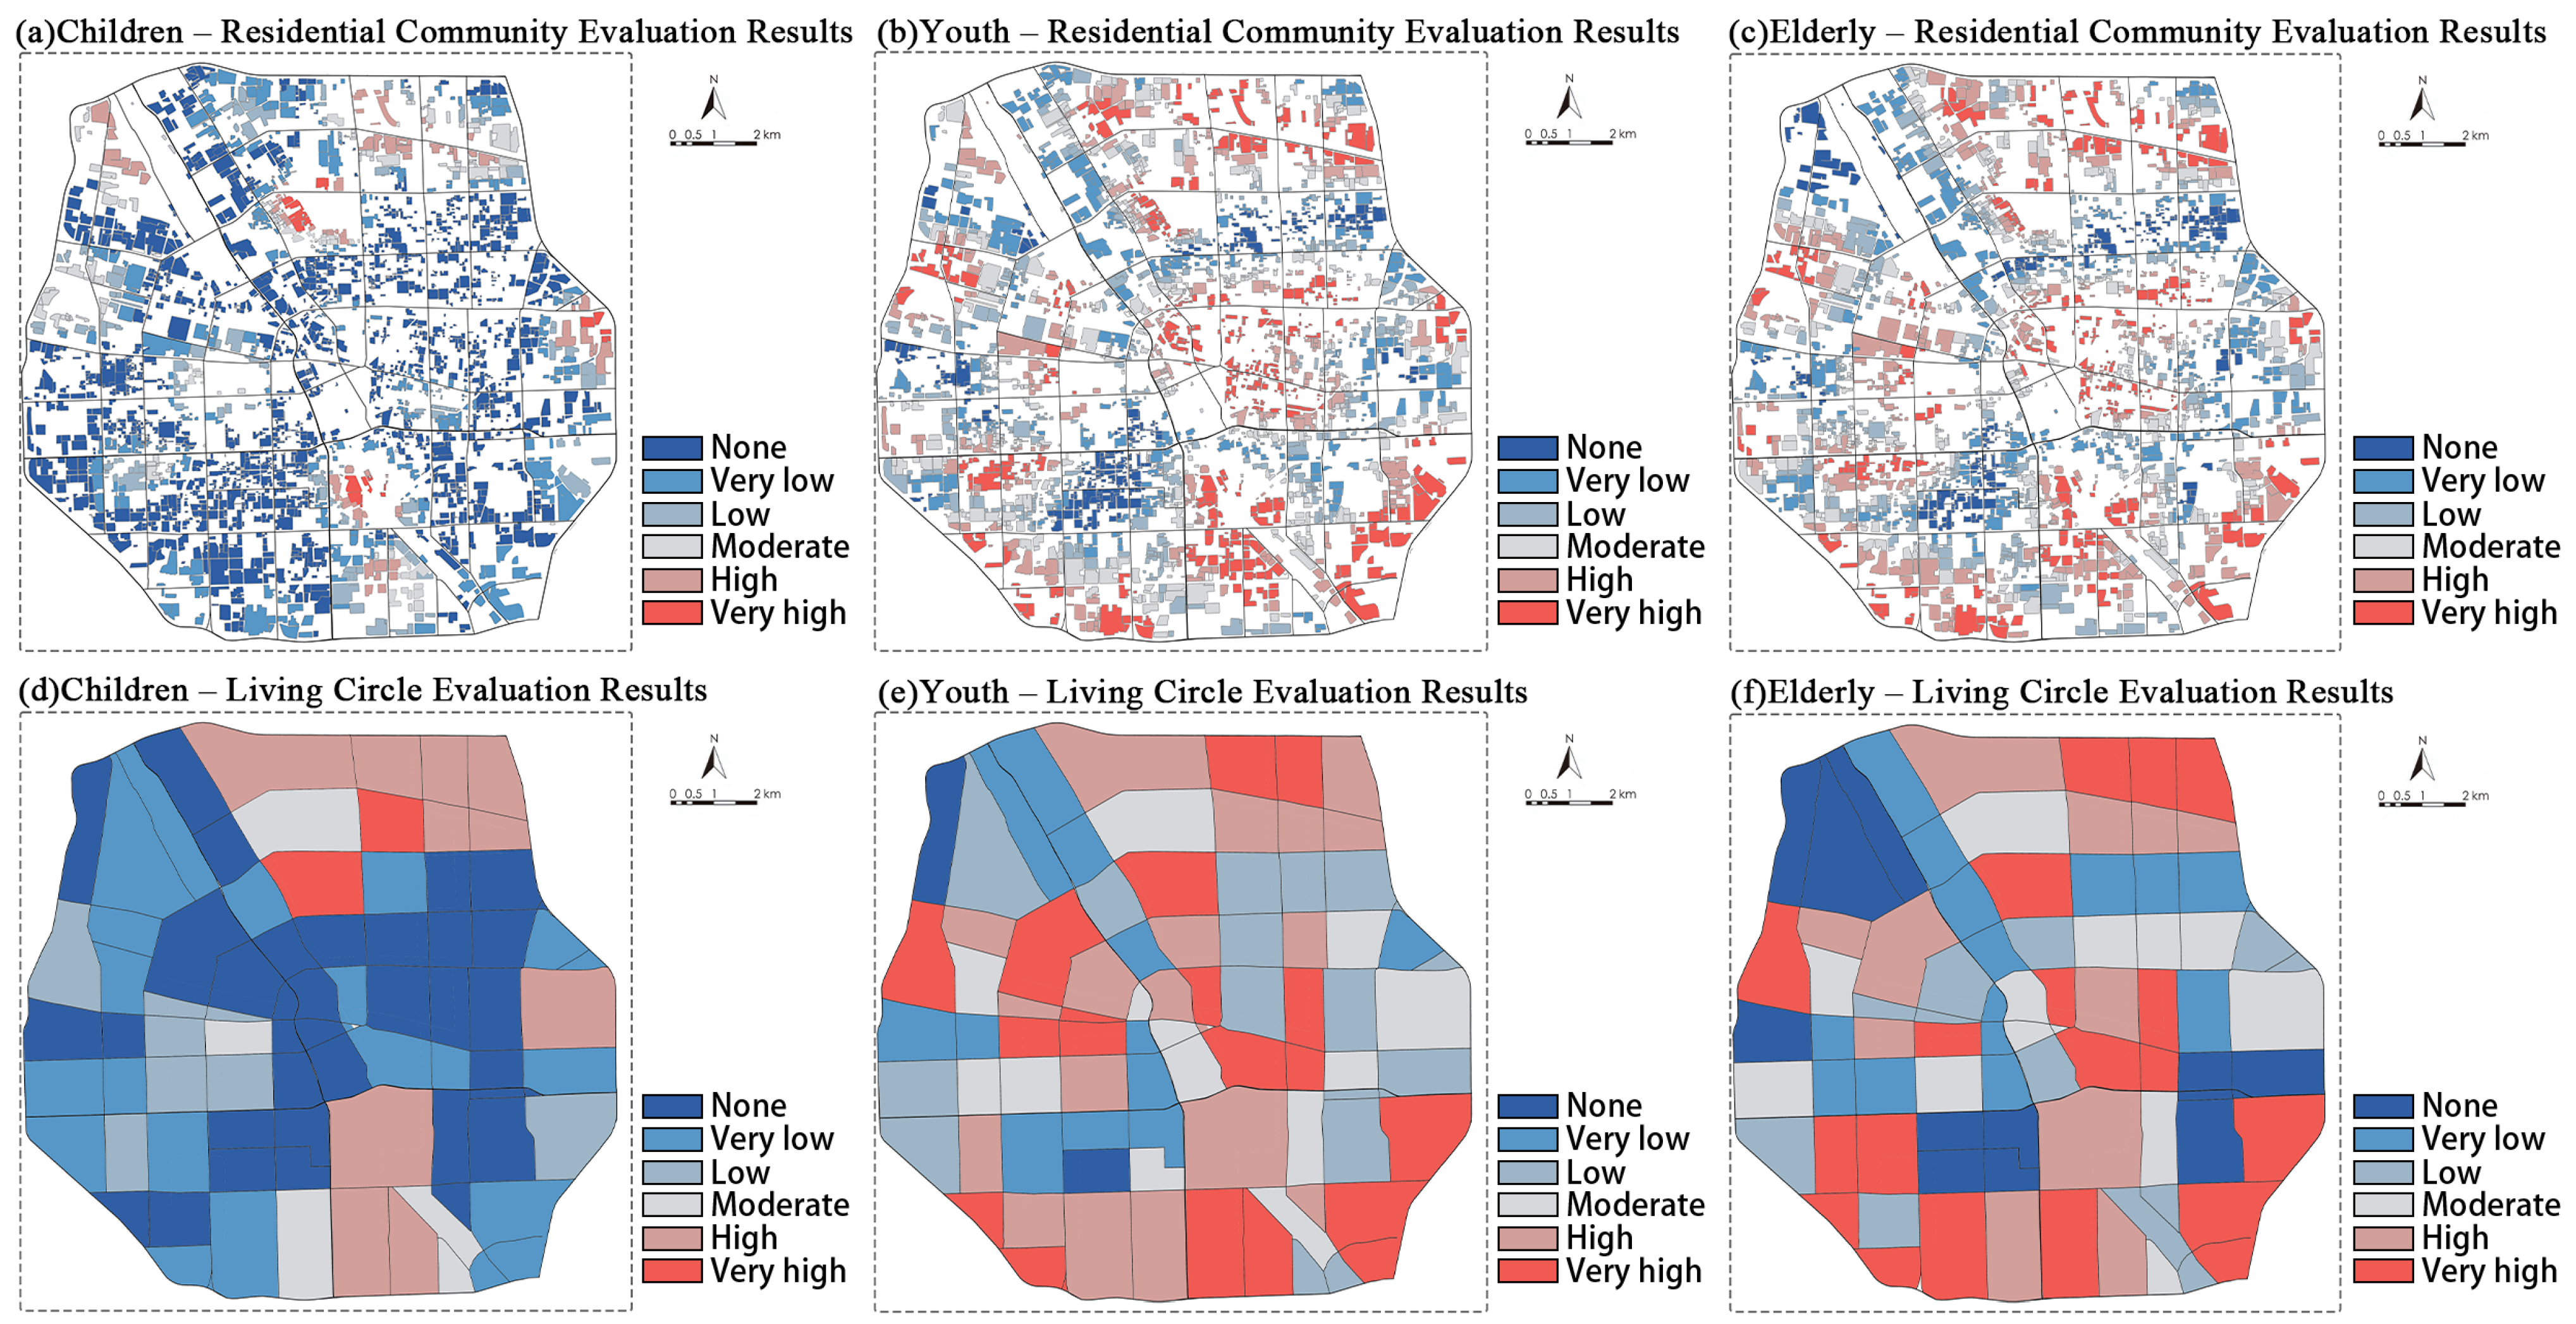
4.3. Demand Response Index Results and Problem Diagnosis

According to the results of the demand response index calculated by the study (Figure 8), the response index of equipment-based fitness facilities is at the lowest level, there is a lack of accessible equipment-based facilities around a large number of residential neighborhoods and the service coverage is obviously insufficient. Trail-based facilities are mainly distributed in the parks and riverfront trails on both sides of Dongfang Canal, Jinshui River, and other river segments, and thus show a higher demand response index in some areas. The response index of site-based facilities is the highest among the three types of fitness facilities, mainly due to their relatively large number and more even spatial distribution, which has become the most popular outdoor fitness mode. The response index is the highest among the three types of fitness facilities, mainly due to their relatively large number and even spatial distribution, which makes them the most popular outdoor fitness method.
Further analysis from the perspective of different age groups reveals that the demand response index of equipment facilities is generally low among the elderly, young adults and children, reflecting that all age groups are dissatisfied with the services of this type of facilities. The demand response index of the elderly group is significantly higher than that of the children and youth groups in the case of trail facilities, indicating that the elderly have stronger demand for recreational walks. The demand response indices of the youth and the elderly groups are relatively high in the case of field facilities, showing strong willingness to use and for activity, while the children’s group shows higher demand response only in localized areas. In the field facilities, the youth and elderly groups have relatively high demand response indices, showing strong willingness to use and for activity, while the children’s group only shows high demand response in localized areas.
Overall, the spatial distribution of the demand response index (Figure 9) shows that within the old urban area of Zhengzhou, the response index of the three groups of people to the equipment-based fitness facilities is generally low, presenting the obvious spatial characteristics of “insufficient supply of facilities—uneven service coverage.” Therefore, equipment-based fitness facilities should be used as an important complementary direction in the future planning and optimization of outdoor fitness space in old urban areas.
In the comparison of the comprehensive response of the three groups to fitness facilities, the youth group has the highest facility demand response index, followed by the elderly group, and the children’s group is relatively low, indicating that young people are the main users of urban public fitness space at present, and they should also be the key service targets in facility planning.

5. Conclusions and Recommendations

5.1. Conclusions of the Study

Taking the old urban area of Zhengzhou City as an example, based on the current situation of the spatial supply of outdoor fitness facilities and the behavioral needs of different groups, we conducted systematic research on the distribution pattern, service capacity, and crowd suitability of fitness facilities from the perspective of spatial fairness by means of GIS spatial analysis, calculation of the demand response index, etc. The main conclusions are as follows.
(1) There is significant unevenness in spatial supply. The overall layout of the parks in the old city shows a spatial pattern of “dense core and sparse edge,” especially in the eastern and western regions, where the supply of fitness facilities is insufficient and the service blind zones are obvious. The configuration of equipment facilities is the weakest, with the number of modules and coverage at the lowest level, which is the key shortcoming that restricts the service efficiency of the overall fitness space.
(2) There is a mismatch between the function of facilities and the needs of the population. Due to their strong sharing and adaptability, venue-based facilities perform well in terms of spatial distribution and frequency of use, and are currently the most popular type of fitness space. Trail facilities mainly meet the leisure and fitness needs of the elderly, but there is still room for optimization in terms of quantity and scope. The fitness space for children’s groups is seriously insufficient, with fewer exclusive facilities, making it difficult to meet their daily activities and physical development needs.
(3) The demand response index reveals potential optimization directions. By analyzing the demand response indices of different facility types and population groups, it was found that the response indices of equipment facilities were low in all groups, and there is an urgent need to make up for this in terms of spatial layout and quantity configuration. The youth group has the most urgent demand for fitness facilities, which should be the focus of planning and optimization. The children’s group has a low response index, suggesting that the accessibility and diversity of child-friendly fitness spaces should be improved in the future.
In addition, the findings of this study hold practical relevance for other cities. The uneven distribution of urban green space resources is a common challenge faced by many cities, particularly in aging or historically developed districts. Although this study focused on Zhengzhou as a case, its analytical framework and key insights are applicable to other cities with similar urban structures or socioeconomic contexts. Moreover, current demand-responsive evaluation models based primarily on static data still present certain limitations. Future research should incorporate dynamic behavioral data and real-time feedback mechanisms to improve the timeliness and adaptability of assessment outcomes.

5.2. Optimization Recommendations

Based on the diagnostic results of the demand response index, we propose the following targeted data-informed optimization strategies aimed at enhancing the equity and efficiency of park fitness services.
(1) Enhance the connectivity of parks and green spaces to expand the radius of services
Currently, some parks in the old city of Zhengzhou City have the phenomenon of “island” distribution, parks, and urban road networks and poor spatial connectivity between the residents’ living area, resulting in some parks have certain fitness facilities, but the actual service capacity is limited, and it is difficult to form an effective radiation. This should be based on the integration of urban slow-moving system ideas, opening the “cut-off road,” increasing the street–green space–park accessibility channel, and enhancing the accessibility of walking between the park and residential areas, as well as the construction of linear greenways, tandem recreation corridors, and other ways to realize the organic linkage of multiple small green spaces and large parks with the aim of forming a multi-node, multi-path green fitness network so that the radius of park services is no longer limited to a single fixed range, thereby expanding the use of fitness facilities crowd base and scope of services.
(2) Promote functional composite fitness space design based on site service characteristics
Given the acute shortage of dedicated spaces for children and equipment facilities identified by the low response indices and the constraints of limited space in the old city, maximizing the utility of existing areas is paramount. Single-function designs should move beyond towards multifunctional integration and composite utilization guided by specific site demand profiles. For instance:
Addressing Child Space Shortage and Equipment Need: Integrate compact, age-appropriate play equipment zones within larger field areas or along peripheral trails in community parks, creating combined “play-and-watch” spaces.
Catering to Elderly Needs: Combine gentle trail loops with strategically placed clusters of rehabilitation/supportive exercise equipment and ample seating areas, forming integrated “active aging hubs.”
Enhancing Youth and General Use: Design multifunctional sports field that can be flexibly used for various activities (such as basketball, badminton, and fitness classes), with fitness trails and gymnastic areas surrounding it. This “same space, multiple services” approach directly responds to the diagnosed imbalances in facility types (high field response, low equipment/trail response) and group needs (low child/elderly response) revealed by our index.
(3) Increase the total supply of facilities and improve the service efficiency of park space
The study found that there is a large gap in the supply of equipment-based fitness facilities in old urban areas in particular and that there are almost no accessible public fitness spots around some high-density residential areas, which seriously affects the convenience and motivation of residents to exercise on a daily basis. Therefore, it is necessary to further increase the total supply of facilities, especially in the vacant corners of existing parks, community gardens, and street green space to reasonably embed fitness facilities. In the process of adding new facilities, full consideration should be given to the applicability, safety, and maintenance convenience of the facilities, and at the same time encourage the installation of small, combined, and expandable fitness modules to adapt to different community-space scales and residents’ needs. By enhancing the service capacity of facilities per unit area and the carrying capacity of space, we can maximize the utility of limited space and create a fairer and more efficient public fitness service system in the limited space.
(4) Embed Universal Design Principles for Broader Inclusivity
While age remains a critical consideration, optimizing for equity necessitates addressing a broader spectrum of user needs. Future planning and retrofitting should systematically integrate universal design principles to ensure spaces meet the core requirements of all user groups, including individuals with mobility impairments. This entails fostering physical accessibility, enhancing universal perceptions of safety, accommodating diverse sociocultural activities, and ensuring economic accessibility. Implementation includes deploying compliant accessibility features, improving environmental safety through surveillance and maintenance, responding to community-identified variations in social interaction patterns and cultural preferences, and guaranteeing free admission to prevent economic exclusion. Incorporating these principles, particularly during the development of new facilities or the redesign of integrated spaces, will enhance the genuine inclusivity of parks, enabling them to effectively respond to the multidimensional nature of community needs beyond age-based segmentation.

Author Contributions

Data curation, X.L. and K.L.; investigation, K.L., J.C. and Z.R.; methodology, X.L., K.L., J.C. and Z.R.; writing—original draft, K.L.; writing—review and editing, X.L. and K.L.; supervision, Z.R.; funding acquisition, X.L. and K.L. All authors have read and agreed to the published version of the manuscript.

Funding

This research received no external funding.

Data Availability Statement

Due to privacy, the data presented in this study are available on request from the corresponding author.

Conflicts of Interest

The authors declare that the research was conducted in the absence of any commercial or financial relationships that could be construed as a potential conflict of interest.

References

  1. General Office of the State Council. Notice of Guidance on Building Quality Outdoor Destinations. 2025. Available online: https://www.gov.cn/zhengce/content/202501/content_7000444.htm (accessed on 26 April 2025).
  2. General Office of Zhengzhou Municipal People’s Government. On the Issuance of Zhengzhou City 2025 Urban Landscaping Work Implementation Plan Notice. 2025. Available online: https://public.zhengzhou.gov.cn/D0104X/9067761.jhtml (accessed on 26 April 2025).
  3. Wu, Y.; Zhou, W.; Zhang, H.; Liu, Q.; Yan, Z.; Lan, S. Relationships between Green Space Perceptions, Green Space Use, and the Multidimensional Health of Older People: A Case Study of Fuzhou, China. Buildings 2024, 14, 1544. [Google Scholar] [CrossRef]
  4. General Office of the Central Committee of the Communist Party of China. Opinions on Building a Higher Level of Public Service System for National Fitness. 2022. Available online: https://www.gov.cn/zhengce/2022-03/23/content_5680908.htm (accessed on 26 April 2025).
  5. Zhou, C.; Tao, C.; Liu, J.; Zhang, Q. Evaluation on Demand Responsiveness of Flexibly-Shared Outdoor Fitness Facilities. Landsc. Archit. 2024, 31, 48–55. [Google Scholar] [CrossRef]
  6. Daria, S.; Edyta, Ł.; Kinga, K.; Piotr, S. The role of informal green spaces in reducing inequalities in urban green space availability to children and seniors. Environ. Sci. Policy 2020, 108, 144–154. [Google Scholar] [CrossRef]
  7. Weng, Y.; Wang, N.; Chen, Z. Space Evaluation and Optimization of Urban Park Green From Perspective of Supply and Demand. J. Huaqiao Univ. (Nat. Sci. Ed.) 2025, 46, 60–70. [Google Scholar] [CrossRef]
  8. Yu, Y.; Yang, X.; Li, X.; Zhang, Y. Evaluation and Coupling Coordination of Cultural Ecosystem Services Supply and Demand in Urban Park Green Spaces. Landsc. Archit. 2025, 32, 90–99. [Google Scholar] [CrossRef]
  9. Liu, K.; Zeng, Z.; Zhang, C. Evaluation and Analysis of Child-Friendly Urban Environment Based on the Bluebee Model: A Case Study of Typical Districts in Shenzhen. Chin. Landsc. Archit. 2025, 41, 70–77. [Google Scholar] [CrossRef]
  10. Liu, P.; Zhang, H.; Li, Y. Research on the Satisfaction Evaluation and Influencing Factors of the National Fitness Paths of Residents in the Old Urban Area of Beijing with the Assistance of Virtual Reality. World Archit. 2025, 2, 70–77. [Google Scholar] [CrossRef]
  11. Chen, J.; Lu, W.; Zhou, S.; Wang, X.; Liu, B.; Hu, Y. Supply–demand matching assessment of public services facility among age groups from the perspective of travel behavior. Habitat Int. 2025, 161, 103421. [Google Scholar] [CrossRef]
  12. Luo, C.; Yu, H.; Liu, Y.; Yang, W. Supply and demand assessment of physical activity services provided by urban green spaces: A case study of Chongqing, China. Urban For. Urban Green. 2024, 95, 128315. [Google Scholar] [CrossRef]
  13. Ning, L.; Deng, Z.; Zou, Y. Evaluation of supply and demand of urban park green spaces from the perspective of aging: A case study of Jianghan District, Wuhan. For. Inventory Plan. 2024, 49, 221–230. [Google Scholar] [CrossRef]
  14. National Development and Reform Commission; General Administration of Sport of China. Guidelines for Public Sports Facility Construction during the 12th Five-Year Plan. 2012. Available online: https://www.sport.gov.cn/n315/n330/c564317/content.html (accessed on 26 April 2025).
  15. Liu, Z.; Zheng, W.; Hong, G.; Yu, H. An Evaluation of Spatial Equity in Community Park Layouts: A Study Based on the SE Index Method. South. Archit. 2025, 2, 1–9. [Google Scholar] [CrossRef]
  16. Shen, L.; Wang, L.; Yang, Q.; Ma, M. High-Resolution Mapping of Urban Residential Building Stock Using Multisource Geographic Data. Buildings 2024, 14, 1266. [Google Scholar] [CrossRef]
  17. Ministry of Housing and Urban-Rural Development of the People’s Republic of China. Code for Design of Urban Parks (CJJ 48-2020); China Planning Press: Beijing, China, 2020. [Google Scholar]
  18. Ministry of Housing and Urban-Rural Development of the People’s Republic of China. Code for Design of Urban Road Engineering (CJJ 37-2012); China Architecture & Building Press: Beijing, China, 2012. [Google Scholar]
  19. Bull, F.C.; Al-Ansari, S.S.; Biddle, S.; Borodulin, K.; Buman, M.P.; Cardon, G.; Carty, C.; Chaput, J.P.; Chastin, S.; Chou, R.; et al. World Health Organization 2020 guidelines on physical activity and sedentary behaviour. Br. J. Sports Med. 2020, 54, 1451–1462. [Google Scholar] [CrossRef] [PubMed]
  20. GB 50180-2018; Urban Residential Area Planning and Design Standards. Ministry of Housing and Urban-Rural Development of the People’s Republic of China: Beijing, China; China Architecture & Building Press: Beijing, China, 2018.
  21. Wang, C.; Chen, F.; Lin, Y.; Qiang, S.; Sun, J. Development of a Built Environment–Self-Efficacy–Activity Engagement–Self-Rated Health Model for Older Adults in Urban Residential Areas. Buildings 2025, 15, 1660. [Google Scholar] [CrossRef]
  22. ISO 21542:2011; Building Construction—Accessibility and Usability of the Built Environment. International Organization for Standardization: Geneva, Switzerland, 2011.
  23. EN 1176-1:2017; Playground Equipment and Surfacing—Part 1: General Safety Requirements and Test Methods. European Committee for Standardization: Brussels, Belgium, 2017.
Figure 1. Facility locations in the old urban area of Zhengzhou City.
Buildings 15 02500 g001
Figure 2. Research framework.
Buildings 15 02500 g002
Figure 3. Aerial footage taken by the drone (excerpt).
Buildings 15 02500 g003
Figure 4. Road network data.
Buildings 15 02500 g004
Figure 5. 15 min walking circle.
Buildings 15 02500 g005
Figure 6. Steps for calculating the demand response index.
Buildings 15 02500 g006
Figure 7. Number of accessible facilities.
Buildings 15 02500 g007
Figure 8. Facilities—demand response review results.
Buildings 15 02500 g008
Figure 9. Residential neighborhoods, circle of life—demand response review results.
Buildings 15 02500 g009
Table 1. Distribution and counts of sampled park facility types (excerpt).
NameType A *Type BType CTotalLngLat
1Bishagang Park82212113.63666634.757564
2Zijingshan Park102113113.6942334.767669
3Zhengzhou People’s Park162220113.66938234.767432
4Lvyin Park3104113.6492934.806946
5Dongfeng Nullah Riverfront Park3014549113.68701534.796662
6Wuyi Park 2114113.62429834.759733
7Wenbo Park 2002113.68095834.794268
8Menorah Park7119113.63570434.773112
9Youth park91111113.66167234.791722
10Cultural park5117113.67469234.810136
11Marine park2114113.71483534.725489
12Zhengzhou Shangcheng National
Archaeological Site Park
122115113.69745734.759501
13Shuangxiu Park4127113.67889234.715024
14Jingxiu Park 112215113.67038734.723149
15Shangcheng Park1102113.67844134.761431
16Children’s Park5117113.6172734.740924
17Century Park3115113.72621734.736776
18Lvcheng Park4116113.61307234.722452
19Cyber park3104113.68068834.804783
* Remarks: Type A—field category; Type B—trail category; Type C—equipment category.
Table 2. Modular classification of outdoor fitness activities.
Type of Fitness ActivityType of Service Module (Number)Spatial FeatureGroup of People
MaterialSite RequirementsMinimum Length/mMinimum Width/mMinimum Area per Capita/m2
BallsInformal badminton (A1)——Leveling of hard surfaces5.04.010.0A, B
Ping-pong (A2)Official table tennis tableLeveling of hard surfaces————10.0B, C
Informal basketball (A3)Informal Basketball StandMulti-purpose fitness area————20.0A, B
Informal other balls (A4)——Leveling of hard surfaces——————B
Types of venuesMulti-purpose fitness area (B1)——Multi-purpose fitness area10.010.04.0C
Running, Trails (B2)——Flat and step free, supports closed loop/foldback5.01.03.0A, B, C
InstrumentationFitness equipment sites (C1)Outdoor Fitness Equipment——4.51.06.0B, C
Children’s open space (C2)Children’s Activity EquipmentPlastic Soft Floor10.05.08.0A
SpecialtyTraditional ethnic and folk sports (D1)——Leveling of hard surfaces10.05.04.0B, C
General categorySports parks, green runway, etc. with a variety of fitness facilities such as ball games, fields, and equipment (E1)——Standard site——————B, C
Note: (a) Population groups A, B, and C refer to children (ages 0–<15), adults (ages 15–<60), and older adults (ages ≥60), respectively. (b) The classification of fitness activity types and corresponding site requirements is based on the Guidelines for the Construction of Public Sports Facilities during the 12th Five-Year Plan [16] and the Code for Design of Urban Road Engineering (CJJ 37—2012) [18].
Table 3. Capacity measurement of outdoor fitness facilities and methods of reduction.
Type of FacilityKey Measurement IndicatorsFacility Capacity Measurement IndicatorsSpecification/m2Area Discount/%
Equipment typeFitness facility movable area
Instrument specified capacity
Minimum per capita area of the module
Equipment capacity + field capacity<400
400~<1000
1000~<2000
≥2000
Non-reduced
65
50
35
Field typeFitness facility movable area
Minimum per capita area of the module
Facility movable areaPark type<400
400~<1000
1000~<2000
≥2000
Non-reduced
65
50
35
Plaza type<400
400~<2000
≥2000
Non-reduced
75
65
Trail typeTrail length and width
Width of walkway
Minimum front-to-rear/side-by-side pedestrian spacing
Trail area————
Table 4. Population size and data for old town.
AreaShare of total population/%Buildings 15 02500 i001
0–14 years15–59 years60 years and above
Zhengzhou19.0568.1112.84
Zhongyuan district19.0766.2314.70
Erqi district17.8769.3412.79
Guancheng district18.4070.8110.79
Jinshui district18.1969.4812.33
Huiji district18.6571.679.68
Disclaimer/Publisher’s Note: The statements, opinions and data contained in all publications are solely those of the individual author(s) and contributor(s) and not of MDPI and/or the editor(s). MDPI and/or the editor(s) disclaim responsibility for any injury to people or property resulting from any ideas, methods, instructions or products referred to in the content.

