1. Introduction
In the context of rapid urbanization, it is estimated that by 2050, 70% of the world’s population will live in urban areas. At the same time, this trend has prompted a renewed examination of the key factors essential for creating livable and healthy urban environments [
1]. Urban parks are an important component of urban green spaces, which not only provide residents with opportunities to connect with nature but also offer space to encourage physical activity [
2,
3,
4,
5] and other beneficial behaviors. The urban park landscape environment influences people’s perceptions [
6] and feelings [
7], which play a significant role in impacting human perception of urban spaces. It also affects individuals’ psychological states and behaviors. Moreover, high-quality landscape environments can effectively relieve stress and anxiety, thereby enhancing overall well-being [
8]. Among various types of perception, visual perception accounts for approximately 80% of the information humans acquire. It plays a crucial role in impacting individuals’ experiences of natural environments [
9]. Therefore, the urban park visual landscape design is important in enhancing resident environmental perception and psychological comfort.
With the growing public interest in the quality of the living environment, as an important component of urban environmental experience, the correlation between visual environment and landscape features has increasingly become a research hotspot [
10,
11,
12]. In recent years, more studies have begun to explore the impact of visual quality on human [
13,
14], as well as the ways and evaluation mechanisms by which different landscape features affect visual quality [
9,
15,
16]. Research in this field has gradually expanded traditional aesthetic evaluation to incorporate multidimensional perspectives, including psychological restoration [
17], social identity [
18], and ecological conservation [
19].
Meyer Granbastien et al. [
20] found that a high-quality urban park landscape environment can effectively promote psychological recovery, highlighting the regulatory role of landscape spatial structure on psychological effects. In discussions of visual landscape quality, landscape features play an important role as influencing factors. Wartmann et al. [
21], based on a national survey in Switzerland, pointed out that resident evaluations of visual landscape quality were influenced by individual factors such as length of residence and degree of visual openness, as well as landscape features. In research on park landscape features, scholars have generally focused on how different spatial elements affect the visual experiences of users.
By integrating image recognition technologies to extract objective landscape features and further quantify features such as green view index, spatial openness, and vegetation diversity [
22], it is possible to assess the visual quality of landscape environments and promote the vectorization and spatialization of visual quality evaluation [
15,
23]. At the same time, visual quality is also influenced by subjective perception. Studies have shown that people’s perception of landscapes is typically based on a comprehensive evaluation of features such as naturalness, sense of order, layering, and tranquility [
24,
25]. Therefore, understanding how different landscape features influence visual perception is important for optimizing landscape design and enhancing the quality of urban spaces. Some studies have assessed park quality by focusing solely on a single or a limited number of objective features, such as landscape elements and infrastructure. However, beyond these objective factors, subjective dimensions—such as human needs and user perceptions—also play a crucial role in defining park quality. In recent years, studies have emerged that combine subjective landscape features with objective landscape features [
26,
27], but their overall number remains limited. Further research is needed to fully reveal the integrated impact of landscape features on visual quality.
Now, lots of research methods are used for landscape visual evaluation, including the Scenic Beauty Estimation (SBE) method, BIB-LVJ, Analytic Hierarchy Process (AHP), and Psychophysiological Index (PPI) testing, among others [
28]. Among these, the SBE method is widely regarded as the most accurate and rigorous methodology [
29,
30,
31]. This method was proposed in 1976 by the American environmental psychologists Daniel and Boster [
32]. Due to its scientific and flexible nature, the SBE method has been widely applied in studies of visual landscape evaluation. Xuehong Tan et al. [
33] applied the SBE method to the aesthetic evaluation of plant landscapes, showing that it effectively quantifies public visual perception and preferences for different types of plant landscapes [
34].
Based on an analysis of the factors influencing landscape perception, Tempesta evaluated the agricultural landscape of the Veneto Plain in Italy and developed a mathematical model for assessing landscape aesthetic quality [
35]. The Semantic Differential method (SD method) is a psychological technique commonly used to measure subjective perceptions and attitudes toward specific objects. It was proposed by Osgood and his colleagues. In landscape feature research, the SD method is widely applied to assess subjective cognition and emotional responses to visual environments [
36]. It offers advantages such as ease of use [
37], a high degree of quantification, and strong comparability of results [
38]. Sun [
39] systematically evaluated the subjective perceptions of resident for visual landscape quality in urban waterfront parks using both the SBE and SD methods and quantified 22 subjective landscape features. Cao applied the SD method to assess the quality of urban waterfront landscapes from the perspective of users’ psychological perception [
40]. It further confirms the objectivity and validity of the SD method in landscape evaluation. Overall, the greatest advantage of the SD method lies in its ability not only to study visual aesthetics but also to quantitatively analyze various types of sensory experiences beyond vision. This is difficult to achieve with other traditional methods [
41].
With the age of the big data era, traditional data collection methods, which often rely on extensive field surveys, are gradually becoming obsolete due to their time-consuming nature, high labor demands, and costly implementation. The rapid development of remote sensing technology, computer vision, and deep learning algorithms, along with the widespread accessibility of image data resources such as Google Maps [
42] and Baidu Maps [
43], has opened a new way to overcome the limitations of traditional methods [
44]. For example, Xia et al. [
45] used panoramic images to assess the visual accessibility of streetside greenery in Mizushima, Japan.
At the same time, with the emergence of advanced deep learning algorithms such as SegNet and DeepLab [
46], the automatic recognition of landscape elements has become more efficient and accurate [
47]. Using high-resolution imagery, Sun et al. [
48] successfully identified and analyzed various streetscape elements in Los Angeles County. Similarly, Lyu et al. [
49] employed semantic segmentation techniques based on deep learning to extract the Green View Index (GVI) and analyzed the relationship between perceived greenery and visual comfort (VICO) along coastal streets in Qingdao. These technological advancements have brought unprecedented operability and precision to the analysis of large-scale park landscape features.
Existing studies have shown that landscape features such as greenery and openness often have nonlinear effects on visual quality [
50,
51]. However, many studies still rely on linear models for analysis, making it difficult to effectively capture the complex nonlinear relationships and potential interaction mechanisms between landscape features and visual quality. In addition, quantitative research on threshold effects remains limited, and there is a lack of interpretable nonlinear modeling approaches to uncover the mechanisms by which key variables influence visual perception. Therefore, to more accurately reflect the mechanisms of visual perception, it is necessary to introduce nonlinear models that can capture complex relationships and potential interaction effects among variables. With the advancement of artificial intelligence, new perspectives and tools have been introduced into urban spatial research. Machine learning methods—such as Gradient Boosting Decision Trees (GBDTs), the ensemble learning algorithm XGBoost, Random Forests (RFs), and Multilayer Perceptrons (MLPs) [
52,
53,
54]—are increasingly applied in urban studies due to their strong data processing capabilities and high predictive accuracy.
Among these methods, the XGBoost (Extreme Gradient Boosting) model has shown superior fitting ability and predictive performance in handling high-dimensional, nonlinear, and multivariable interaction structures [
55,
56,
57]. To enhance model interpretability, many studies have further employed SHAP (SHapley Additive exPlanations) to interpret model outputs, thereby revealing the importance of various landscape elements in visual quality perception as well as identifying threshold effects [
58,
59].
The main research questions addressed in this study are the following: 1. Among the subjective landscape features, which factor has the greatest impact on visual quality? 2. What is the mechanism through which subjective landscape features influence the visual quality of park landscapes? 3. Among the objective landscape features, which factor has the greatest impact on visual quality? 4. What are the nonlinear relationships and threshold effects between objective landscape features and the visual quality of urban parks?
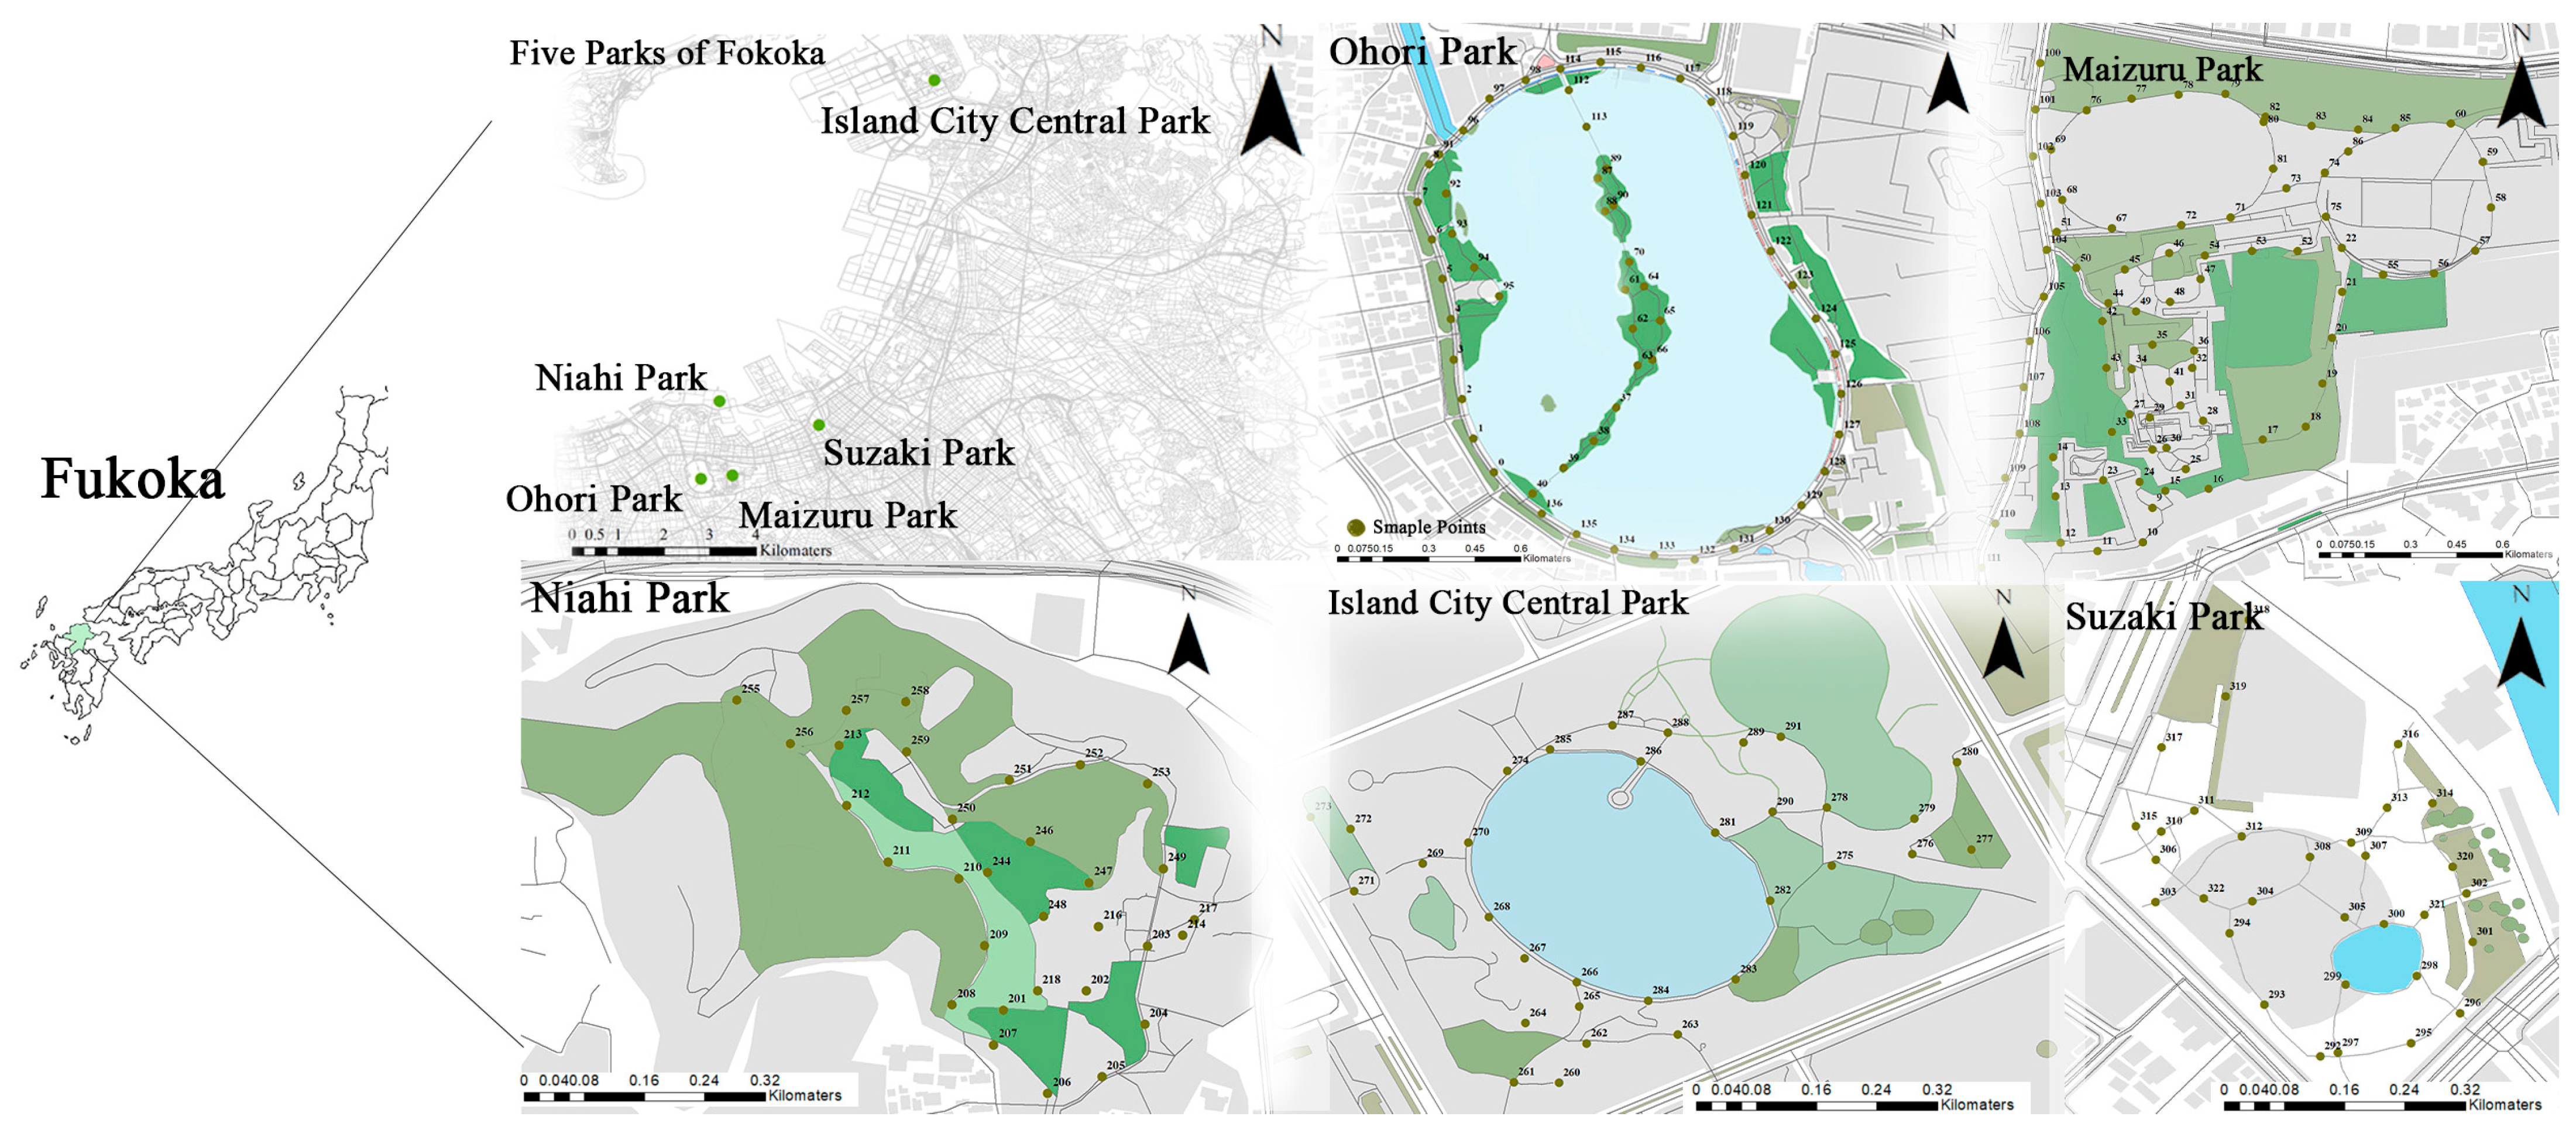
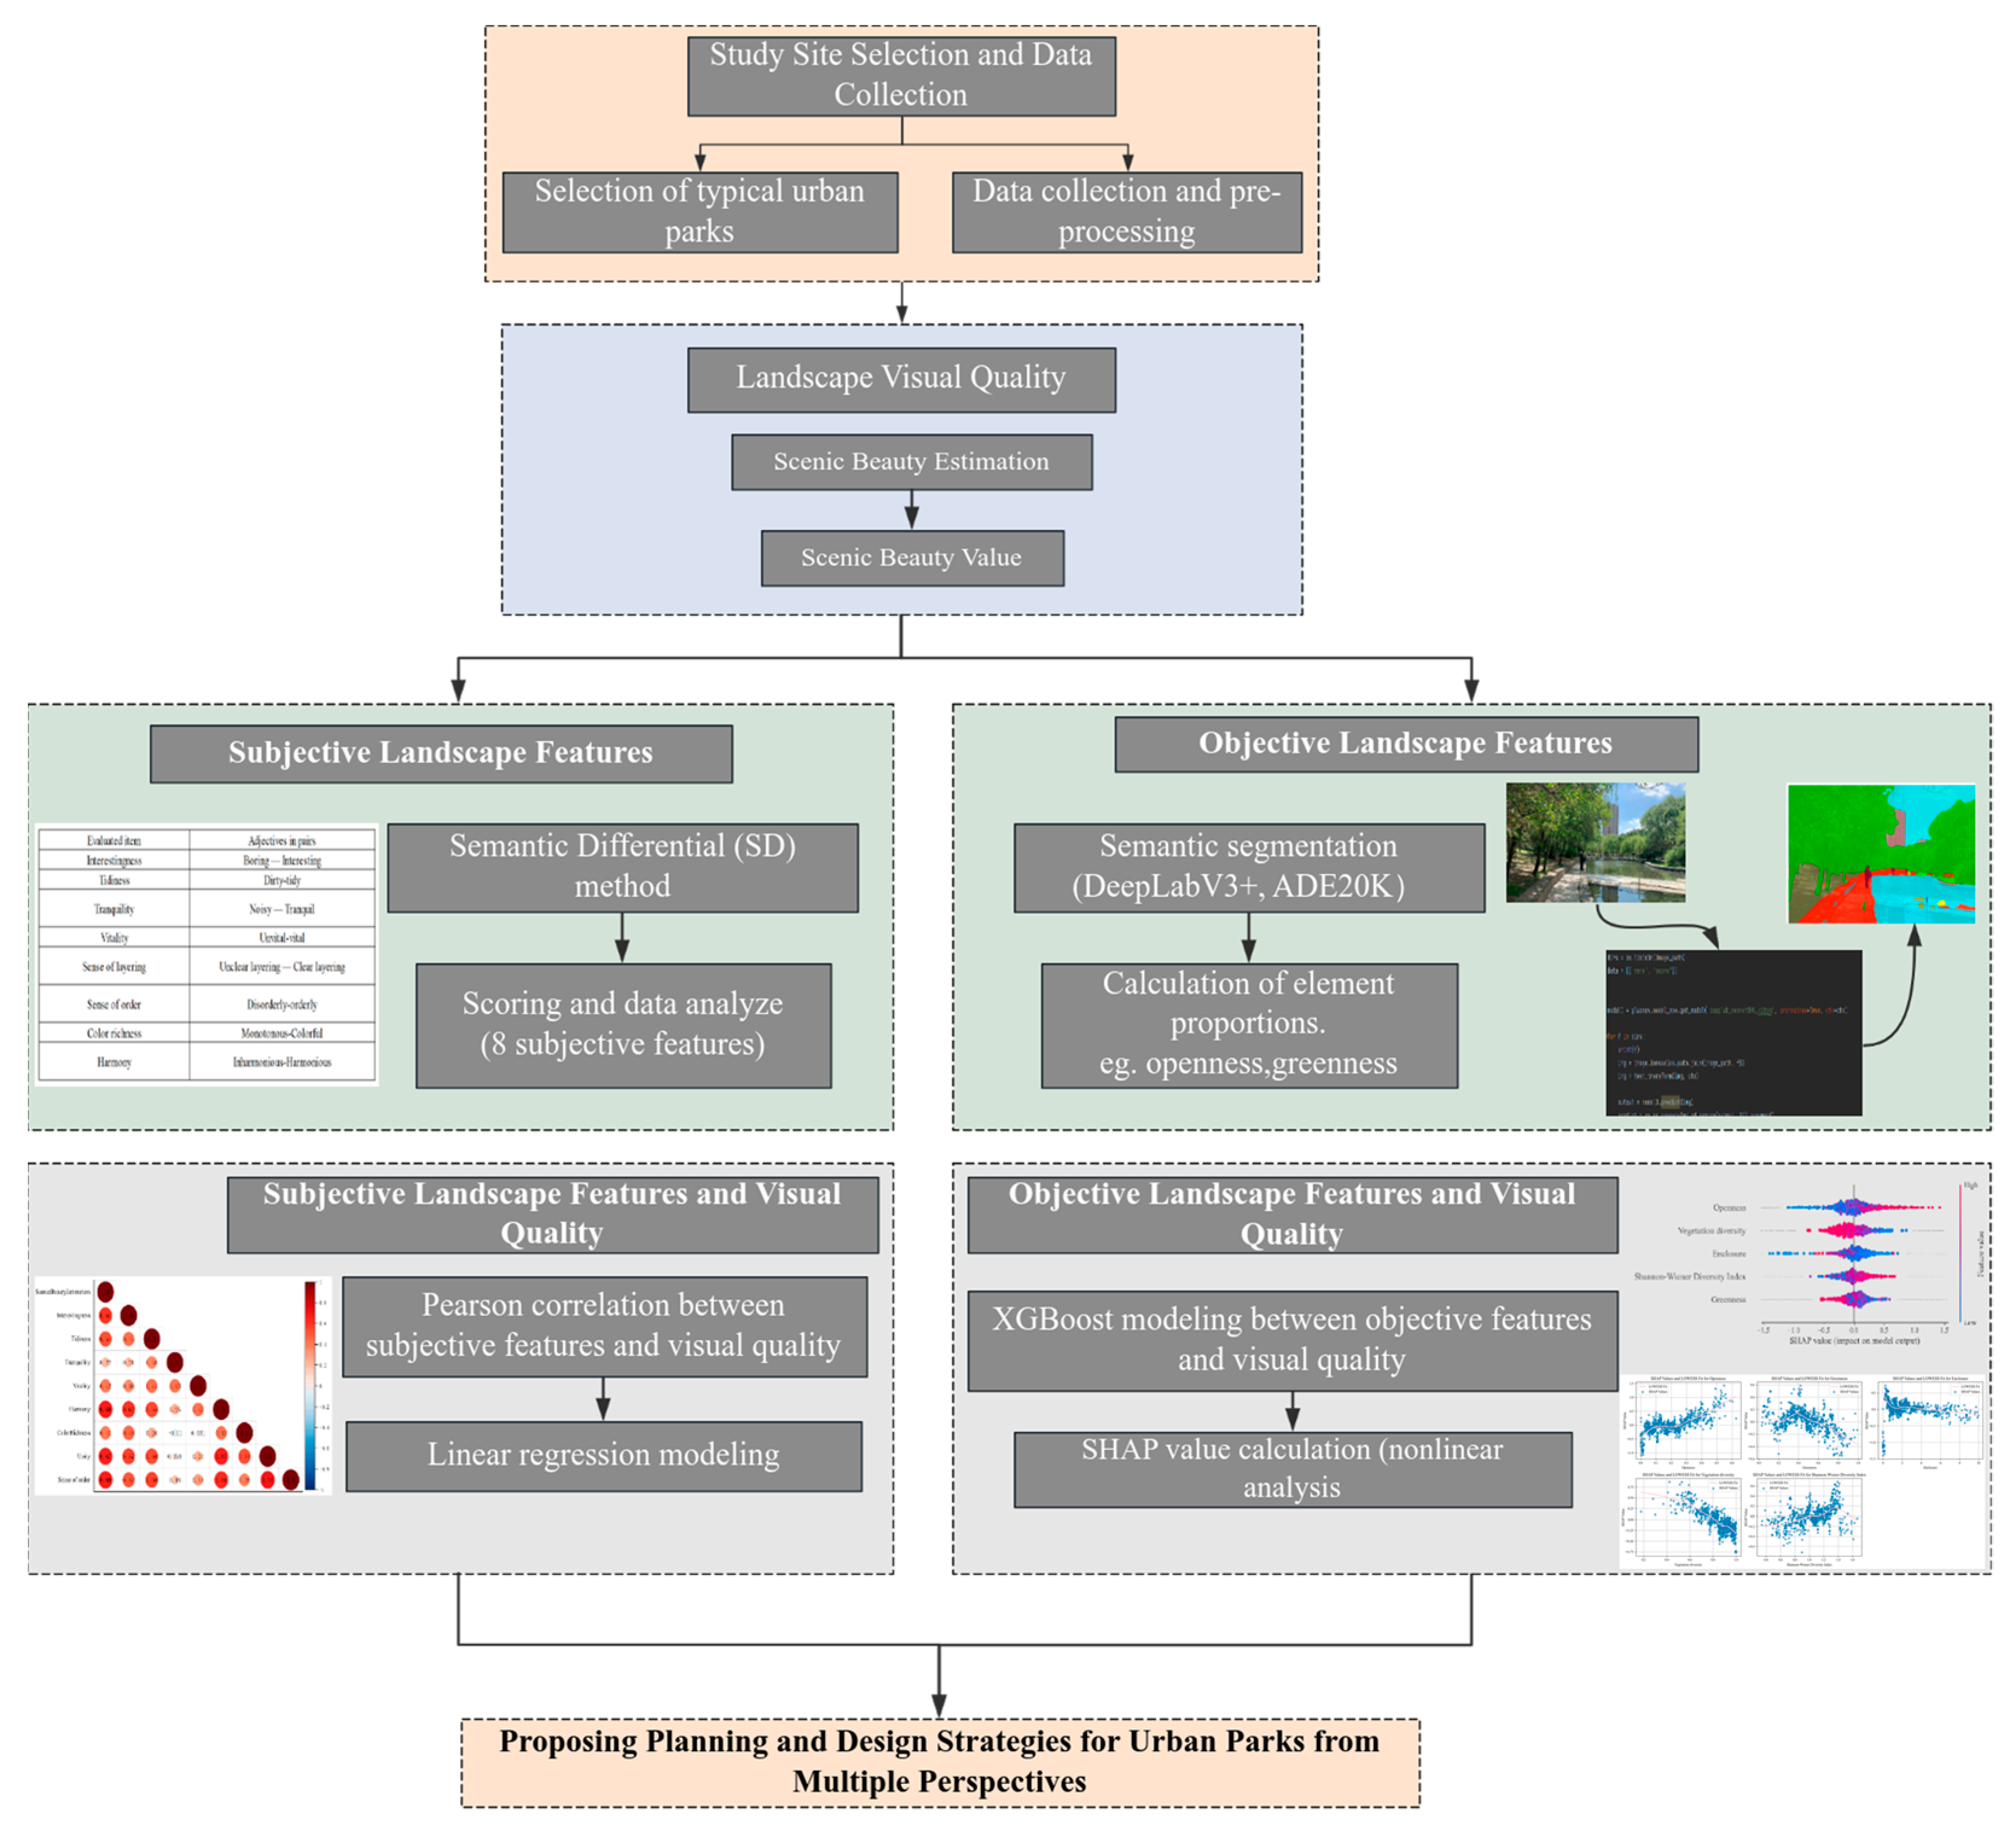
To address the above research questions, this study takes urban parks in Fukuoka City as the research site to explore the complex relationship between landscape features and visual quality. The SBE method is used to obtain visual quality ratings of park landscapes. Subjective and objective landscape features are extracted using the SD method and deep learning-based semantic segmentation techniques. In terms of analytical methods, a linear regression model was first employed to examine the impact mechanism of subjective landscape features on visual quality. Additionally, machine learning techniques were introduced. The XGBoost model combined with the SHAP (SHapley Additive exPlanations) interpreter reveal the nonlinear influence patterns and threshold effects of objective landscape features on visual quality. The complementary analysis of subjective and objective features provides a new methodological framework and support for gaining a deeper understanding of the relationship between landscape features and visual quality in urban parks. This study integrates subjective evaluations with objective computational methods to propose a comprehensive landscape assessment framework, enriching theoretical research on landscape quality and visual aesthetics. By introducing deep learning and interpretable machine learning techniques into landscape studies, it enhances the accuracy and interpretability of landscape feature identification and analysis, providing a scientific basis for the design, renewal, and management of urban park landscapes.
3. Results
3.1. Evaluation of SBE
By comparing the mean values of the SBE score of the parks (
Table 3), it can be seen that SBE Ohori Park (0.049) > SBE Island City Central Park (0.028) > SBE Susaki Park (−0.042) > SBE Maizuru Park (−0.053) > SBE Nishi Park (−0.203). Ohori Park showed significantly higher landscape visual quality than the others among the five parks. It meant greater attractiveness in landscape design and the arrangement of natural elements. This suggests that Ohori Park can provide residents with a better visual experience. In contrast, Nishi Park had the lowest score for visual quality. It may be caused by its relatively confusing landscape layout and conflicting vegetation combinations that fail to give a pleasant visual impression.
In terms of the proportion of low-quality samples, Nishi Park showed the highest proportion at 45.2%, indicating a higher level of negative perception. This reflected the presence of many sheltering elements, such as dense vegetation and enclosing walls. Horizontal sightlines of pedestrians were blocked, making it difficult to form a good vista extension and spatial accessibility. In contrast, Ohori Park had the lowest proportion of low-quality samples at only 19.3%, further confirming its better overall evaluation. Additionally, Maizuru Park and Island City Central Park showed relatively similar proportions of high- and low-quality samples, indicating a moderately low evaluation trend.
According to the standard deviation data, although Ohori Park had the highest visual quality score, it had the relatively highest standard deviation. It indicated that the different opinions in the public perception of Ohori Park led to inconsistent visual quality assessments. Nishi Park had the lowest mean visual quality but also exhibited a high standard deviation. It suggested different opinions, with some individuals giving positive evaluations to Nishi Park. Island City Central Park showed both a moderate average value and standard deviation, indicating they had consistent evaluations among respondents. In contrast, Maizuru Park and Suzaki Park had both low visual quality scores and low standard deviations, reflecting generally unfavorable and similar perceptions, with a consistent evaluation trend.
3.2. Evaluation of SD and Spatial Analysis
By using Excel to calculate the landscape feature values for each sample, the average feature values for each park, and the overall feature values for all 924 samples, a comparison of the landscape features across the 924 samples was conducted. In terms of the overall subjective evaluation across parks, the ranking of landscape features was as follows: Vitality (3.591) > Sense of layering (3.303) > Color richness (3.297) > Tidiness (3.241) > Interestingness (3.238) > Sense of order (3.153) > Tranquility (3.106) > Harmony (3.100).
By comparing the mean values of subjective landscape features for the five parks with the overall mean values as shown in
Table 4, the result can be seen: Ohori Park has higher scores than the overall sample average in seven subjective landscape features, namely vitality, sense of layering, color richness, tidiness, natural interestingness, tranquility, and harmony, with tranquility being significantly higher than the sample mean. In Maizuru Park, the sense of layering, sense of order, and harmony were all higher than the overall sample averages. Island City Central Park had only two subjective landscape features—sense of layering and interestingness—that exceeded the overall sample mean. In Suzaki Park, only the sense of layering was higher than the overall sample mean.
By comparing the subjective landscape features of each park, the following conclusions can be seen: In Maizuru Park, the sense of layering (3.450) was the highest score, indicating a clear spatial structure and well-organized landscape layout. In contrast, vitality (3.417) was relatively low, suggesting that there is still a need for improvement in vegetation conditions within the park. Ohori Park performed notably well in terms of interestingness (3.738) and tranquility (3.538), highlighting its strengths in creating a natural atmosphere and a serene environment. However, the sense of order (3.088) was the lowest-scoring feature, possibly reflecting a weaker sense of spatial organization in certain areas.
In Nishi Park, vitality (4.050) received the highest score, indicating good vegetation conditions and a strong sense of liveliness. The sense of order (3.025) was the lowest, suggesting that improvements are needed in plant composition and spatial design. Suzaki Park showed generally lower scores across all features, but vitality (3.150) performed relatively better. Interestingness (2.225) and harmony (2.450) had the lowest scores, reflecting weaknesses in naturalness and landscape integration. In Island City Central Park, interestingness (3.450) and sense of layering (3.475) had higher scores, highlighting a comfortable environment and rich spatial layering. However, tranquility (2.975) had the lowest score, possibly due to the impact of high pedestrian density or functional disturbances.
By comparing the standard deviations of the eight subjective landscape features, it was found that vitality and color richness both had relatively high overall mean values and low standard deviations. This indicates that most parks performed well in terms of vegetation vigor and ecological conditions, with rich color presentation and relatively consistent visual perceptions. In contrast, both harmony and tranquility showed relatively low overall mean values and low standard deviations, suggesting that landscape composition across the parks generally lacked coordination, with some disorganized plant arrangements. The standard deviations for sense of layering and interestingness were relatively high, with sense of layering showing the highest variability. Sense of layering was the highest value, indicating that some of the park landscapes are organized, and some are more chaotic. The values fluctuate widely.
3.3. Objective Landscape Features Results and Spatial Analysis
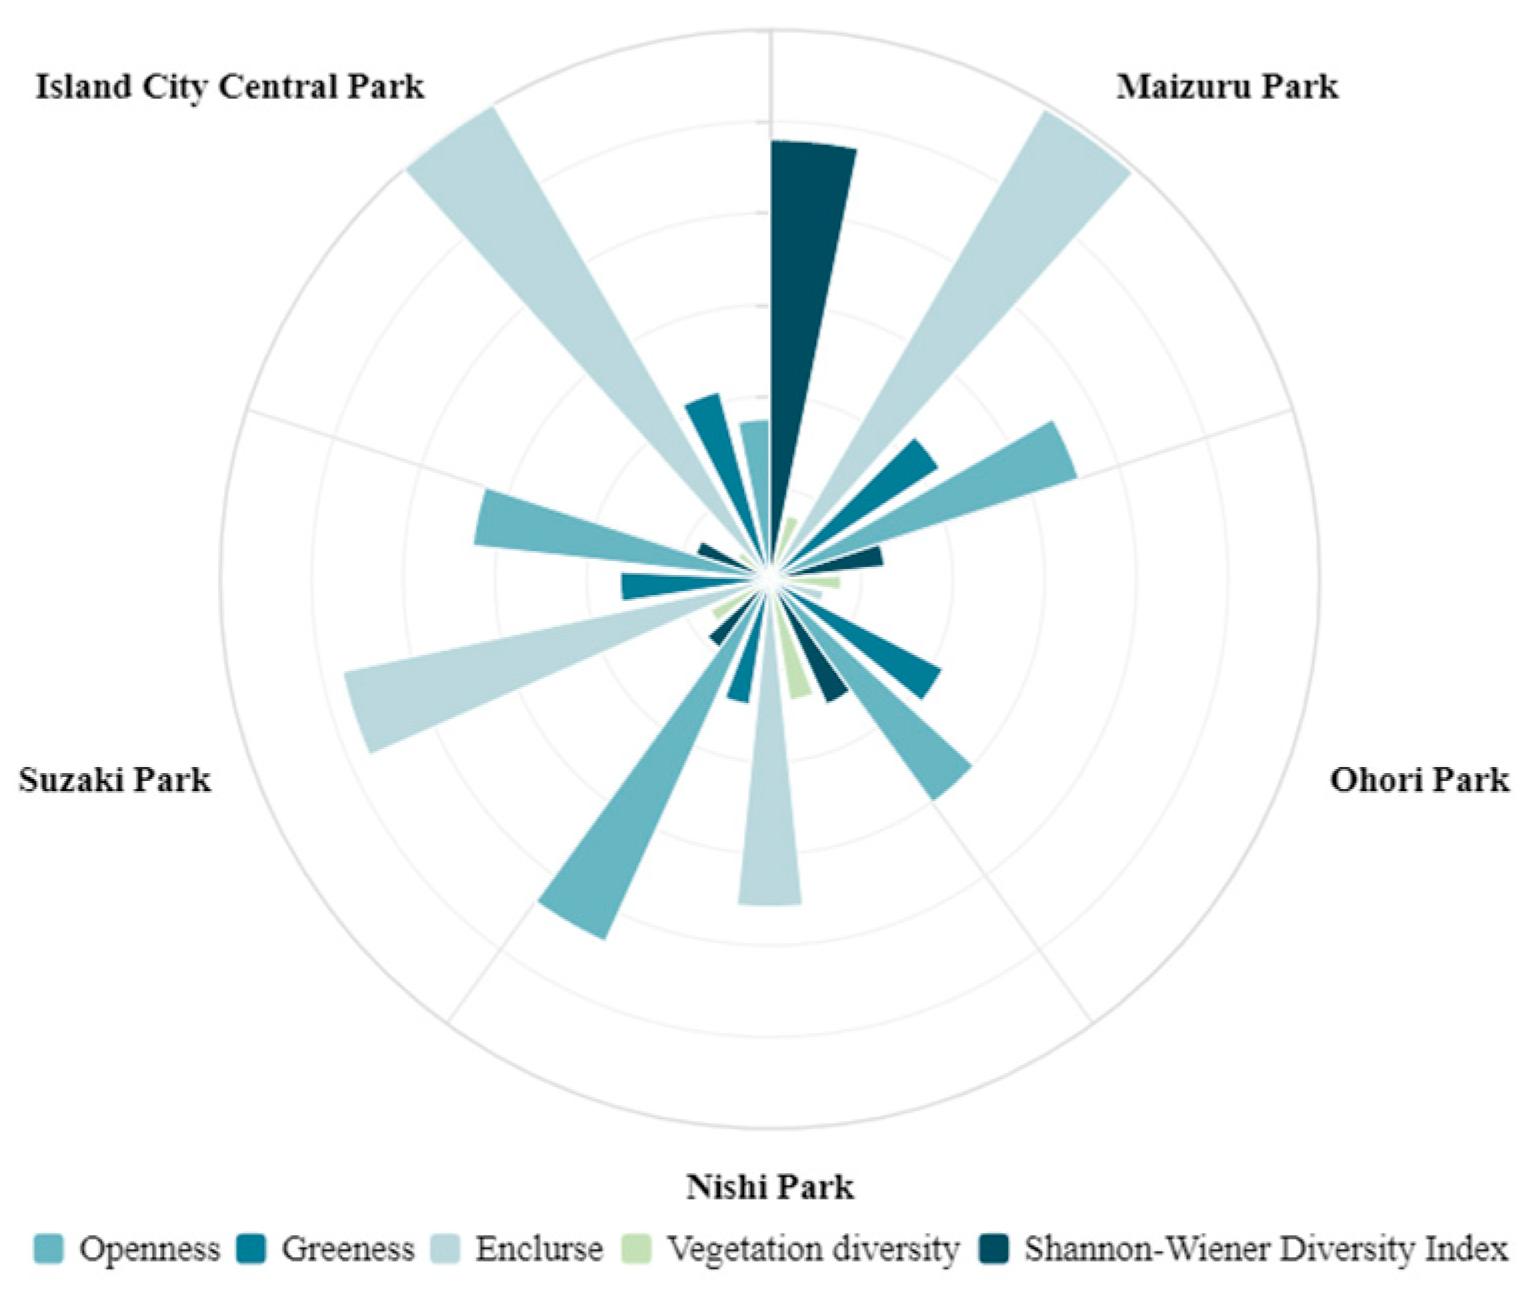
Table 5 shows the objective landscape features of the five parks and the overall mean values. The table shows that Island City Central Park had the highest openness value (0.334), indicating the strongest sense of spatial openness. Nishi Park had the lowest openness value (0.123), reflecting a more enclosed space. Island City Central Park had lots of lawns combined with waterside vegetation, creating a natural and open spatial environment. Additionally, the park is surrounded by fewer buildings, providing a wide field of vision. In contrast, Nishi Park contains abundant greenery, but the dense vegetation along both sides of the pathways blocks the sky, resulting in a lower degree of openness.
In terms of greenness, Nishi Park showed the highest value (0.668), indicating a significant level of vegetation coverage. Island City Central Park had the lowest green view index (0.401), reflecting relatively less greenery. From the enclosure, Nishi Park showed a much higher enclosure value (7.591) compared to the other parks, primarily due to its dense vegetation and strongly enclosed spatial layout. In contrast, Island City Central Park showed the lowest enclosure value (2.137), corresponding to its open spatial structure. The landscape of Island City Central Park is characterized by extensive lawns combined with low-growing plants and open boundaries, creating a transparent space with a strong sense of spatial extension. The dense planting within Nishi Park, especially the continuous green walls formed along both sides of the pathways, results in a high sense of enclosure.
In terms of vegetation diversity, Island City Central Park showed the highest value (0.904), indicating a rich variety of plant species. Nishi Park showed the lowest diversity (0.660), reflecting a relatively single plant composition. Island City Central Park has a diverse range of plant species with well-defined structural layers, and a variety of plants contribute to its high landscape vegetation diversity. In contrast, although Nishi Park has relatively high vegetation coverage, its plant species are single and poorly layered, resulting in lower vegetation diversity.
In terms of the Shannon–Wiener Diversity Index, Suzaki Park had the highest value (1.191) and Nishi Park showed the lowest value (0.916). The high value in Suzaki Park is largely attributed to its well-organized spatial function and rich landscape design, which includes a variety of plant compositions, water features, landscape structures, and paving elements. The diverse combinations of these elements enhance the visual layer and overall landscape quality. In contrast, Nishi Park lacks diversified landscape compositions and distinct landscape nodes.
Table 6 and
Figure 4 show the coefficients of variation for the objective landscape features of the five parks. Combined with the mean value comparisons discussed above, Nishi Park had the highest greenness among the five parks, and the coefficient of variation for this indicator was the lowest (0.278). This suggests that Nishi Park had excellent performance in terms of greenery coverage, with a relatively uniform distribution of greenery in the park, leading to a consistently high level of visual greening across space.
In Island City Central Park, the vegetation diversity was the highest among the five parks, and the coefficient of variation for this indicator was also the lowest (0.171). This indicates that the park not only had a rich variety of plant species and a complex ecological structure but also exhibited a relatively balanced spatial distribution of vegetation, with stable vegetation diversity across the park. At the same time, Nishi Park had the lowest enclosure value among the five parks, and its coefficient variation for enclosure was also the lowest (0.716), suggesting that the strong sense of spatial enclosure and privacy is consistently distributed throughout the park. It lacks significant enclosure changes.
In addition, several indicators exhibited relatively high coefficients of variation across the five parks, reflecting significant spatial differences. In Maizuru Park, both the openness (0.710) and the Shannon–Wiener Diversity Index (0.960) showed high coefficients of variation, indicating big fluctuations in spatial openness and ecological diversity. This suggests that there were significant differences in spatial visibility within the park. Meanwhile, the species distribution was uneven.
In Ohori Park, the greenness was the highest coefficient of variation (0.426). It shows the highly uneven spatial distribution of the park in terms of the degree of greening, and there are large differences in green plant cover in different areas of the park. Nishi Park showed the highest coefficient of variation in Vegetation diversity (0.269), while Island City Central Park recorded the highest coefficient of variation in enclosure (1.299) among the five parks.
3.4. Visual Landscape Quality Modeling Through Urban Informatics Tools
3.4.1. Impact of Subjective Landscape Features on Visual Landscape Quality
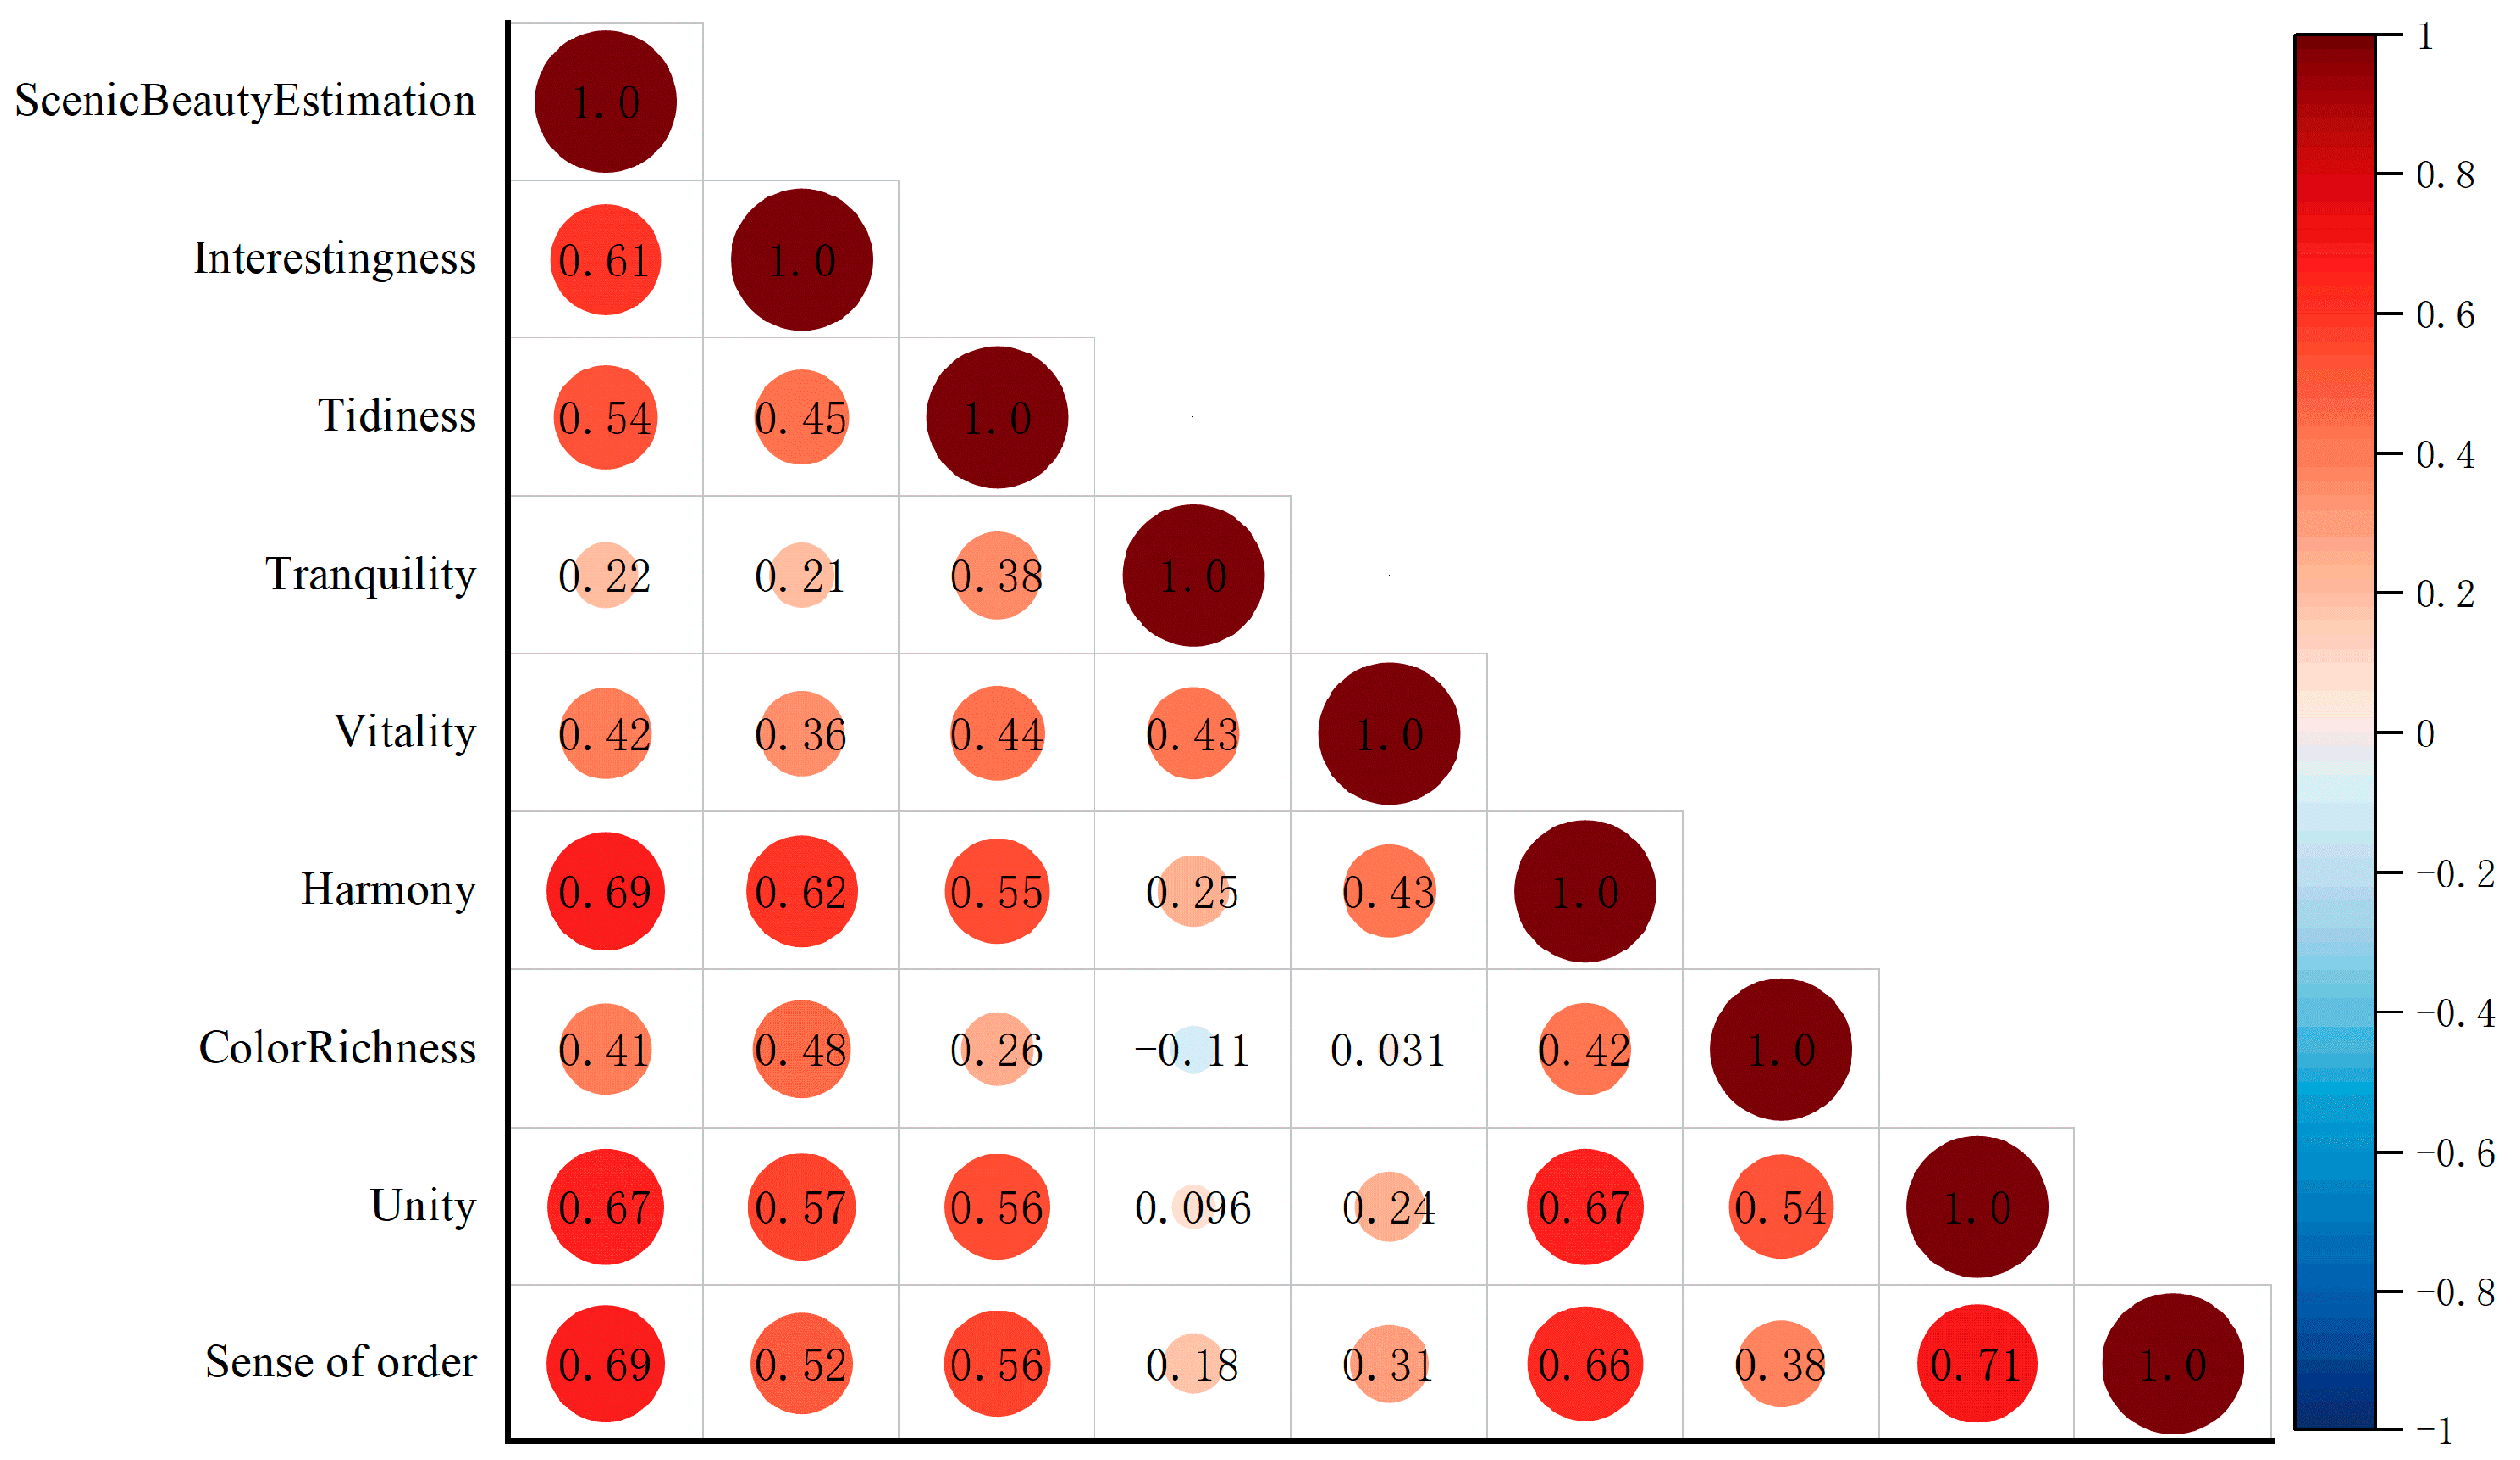
After standardizing the landscape visual quality scores, correlation analysis was conducted between park landscape visual quality and eight subjective landscape features, such as vitality, harmony, sense of order, and sense of layering, using SPSS version 25.0 statistical software. According to the correlation analysis results (see
Figure 5), all eight indicators showed a highly significant relationship with landscape visual quality (
p < 0.05) and were positively correlated. Among them, interestingness, tidiness, harmony, sense of layering, and sense of order exhibited stronger correlations.
3.4.2. Construction of the Evaluation Model
A multiple linear regression analysis was conducted with landscape visual quality as the dependent variable and eight subjective landscape features as independent variables. The results are shown in
Table 7 and
Table 8. According to the regression results, the correlation coefficient (R) was 0.794, and the R squared was 0.625, indicating a good model fit. The F-value for the model significance test was 107.401 with a significance level of
p = 0.000 (
p < 0.005), meaning that the model is statistically significant. The variance inflation factors (VIF) for the five selected independent variables were all less than 10, suggesting that there is no severe multicollinearity among the subjective landscape features, and the linear relationship between the dependent and independent variables is significant. The final regression equation describing the relationship between landscape visual quality and subjective landscape features was as follows:
where X
1 = Sense of order, X
2 = Harmony, X
3 = Interestingness, X
4 = Sense of layering, and X
5 = Vitality.
The results of the regression analysis indicated that all five subjective landscape features had significant positive effects on landscape visual quality. Among them, the sense of order had the highest regression coefficient (0.381), suggesting that it had the most significant influence on visual quality. As the organizational foundation of landscape space, the sense of order enhances spatial legibility and stability through structured and orderly layouts. It serves as a critical factor in improving visual appeal and cognitive comfort. The sense of layering (0.281) also contributed positively to visual quality by enriching spatial diversity through the effective organization of foreground, mid-range, and long-range views elements, thereby enhancing the overall spatial experience.
Harmony (0.266) shows consistency among landscape elements in terms of style, material, and proportion, contributing to the creation of a uniform overall image. The positive effect of interestingness (0.224) indicates that the inclusion of wild natural elements plays an important role in enhancing landscape attractiveness and natural perception, strengthening emotional and nature-friendly experiences. Vitality (0.206) is primarily reflected by dynamic natural elements such as plant growth, flowing water, and biological activity, injecting ecological liveliness into the landscape. In summary, all five subjective landscape features positively influence landscape visual quality through different mechanisms, providing multi-dimensional perceptual optimization directions for landscape design.
3.5. Correlation Analysis Between Visual Landscape Quality and Objective Landscape Features
3.5.1. The Relative Importance of Objective Landscape Features to Visual Landscape Quality
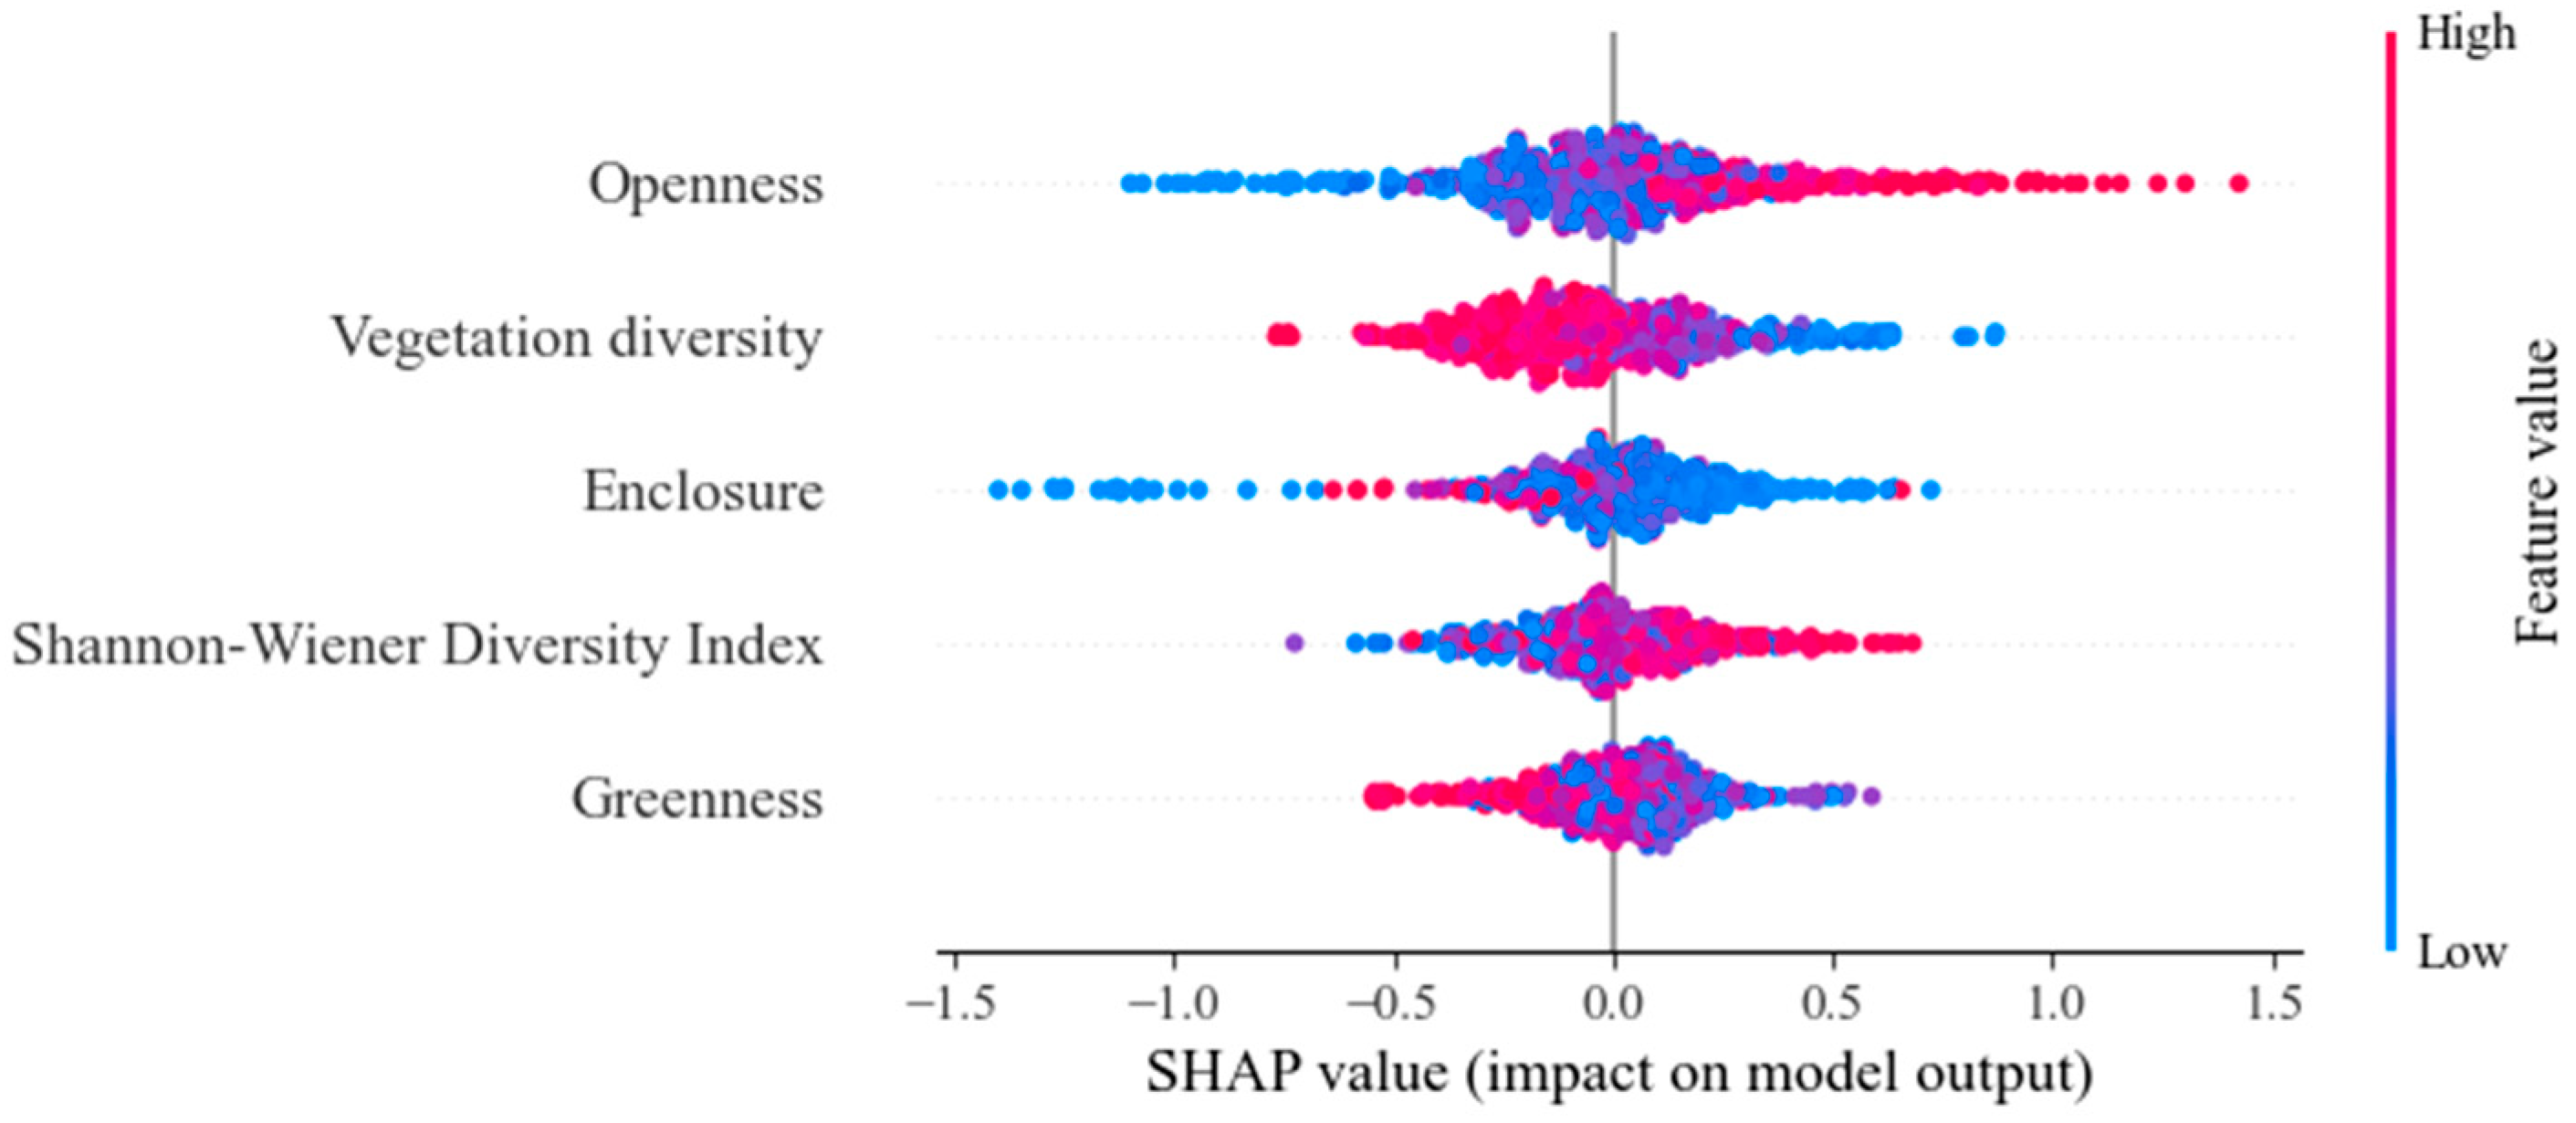
Figure 6 shows the importance of ranking and the swarm plot of objective landscape features about landscape visual quality. The importance ranking chart visually presents the relative importance of objective landscape features in influencing landscape visual quality. The swarm plot reflects the distribution and spread of SHAP values for each feature in the model. It displays the significance of each feature in contributing to the prediction. Each point represents a sample for the analyzed feature, with its horizontal position indicating the SHAP value. According to the color used in the figure, red represents points with greater influence, while blue represents points with lesser influence. Therefore, the horizontal location of the colored points also allows us to see whether their impact on prediction is positive or negative.
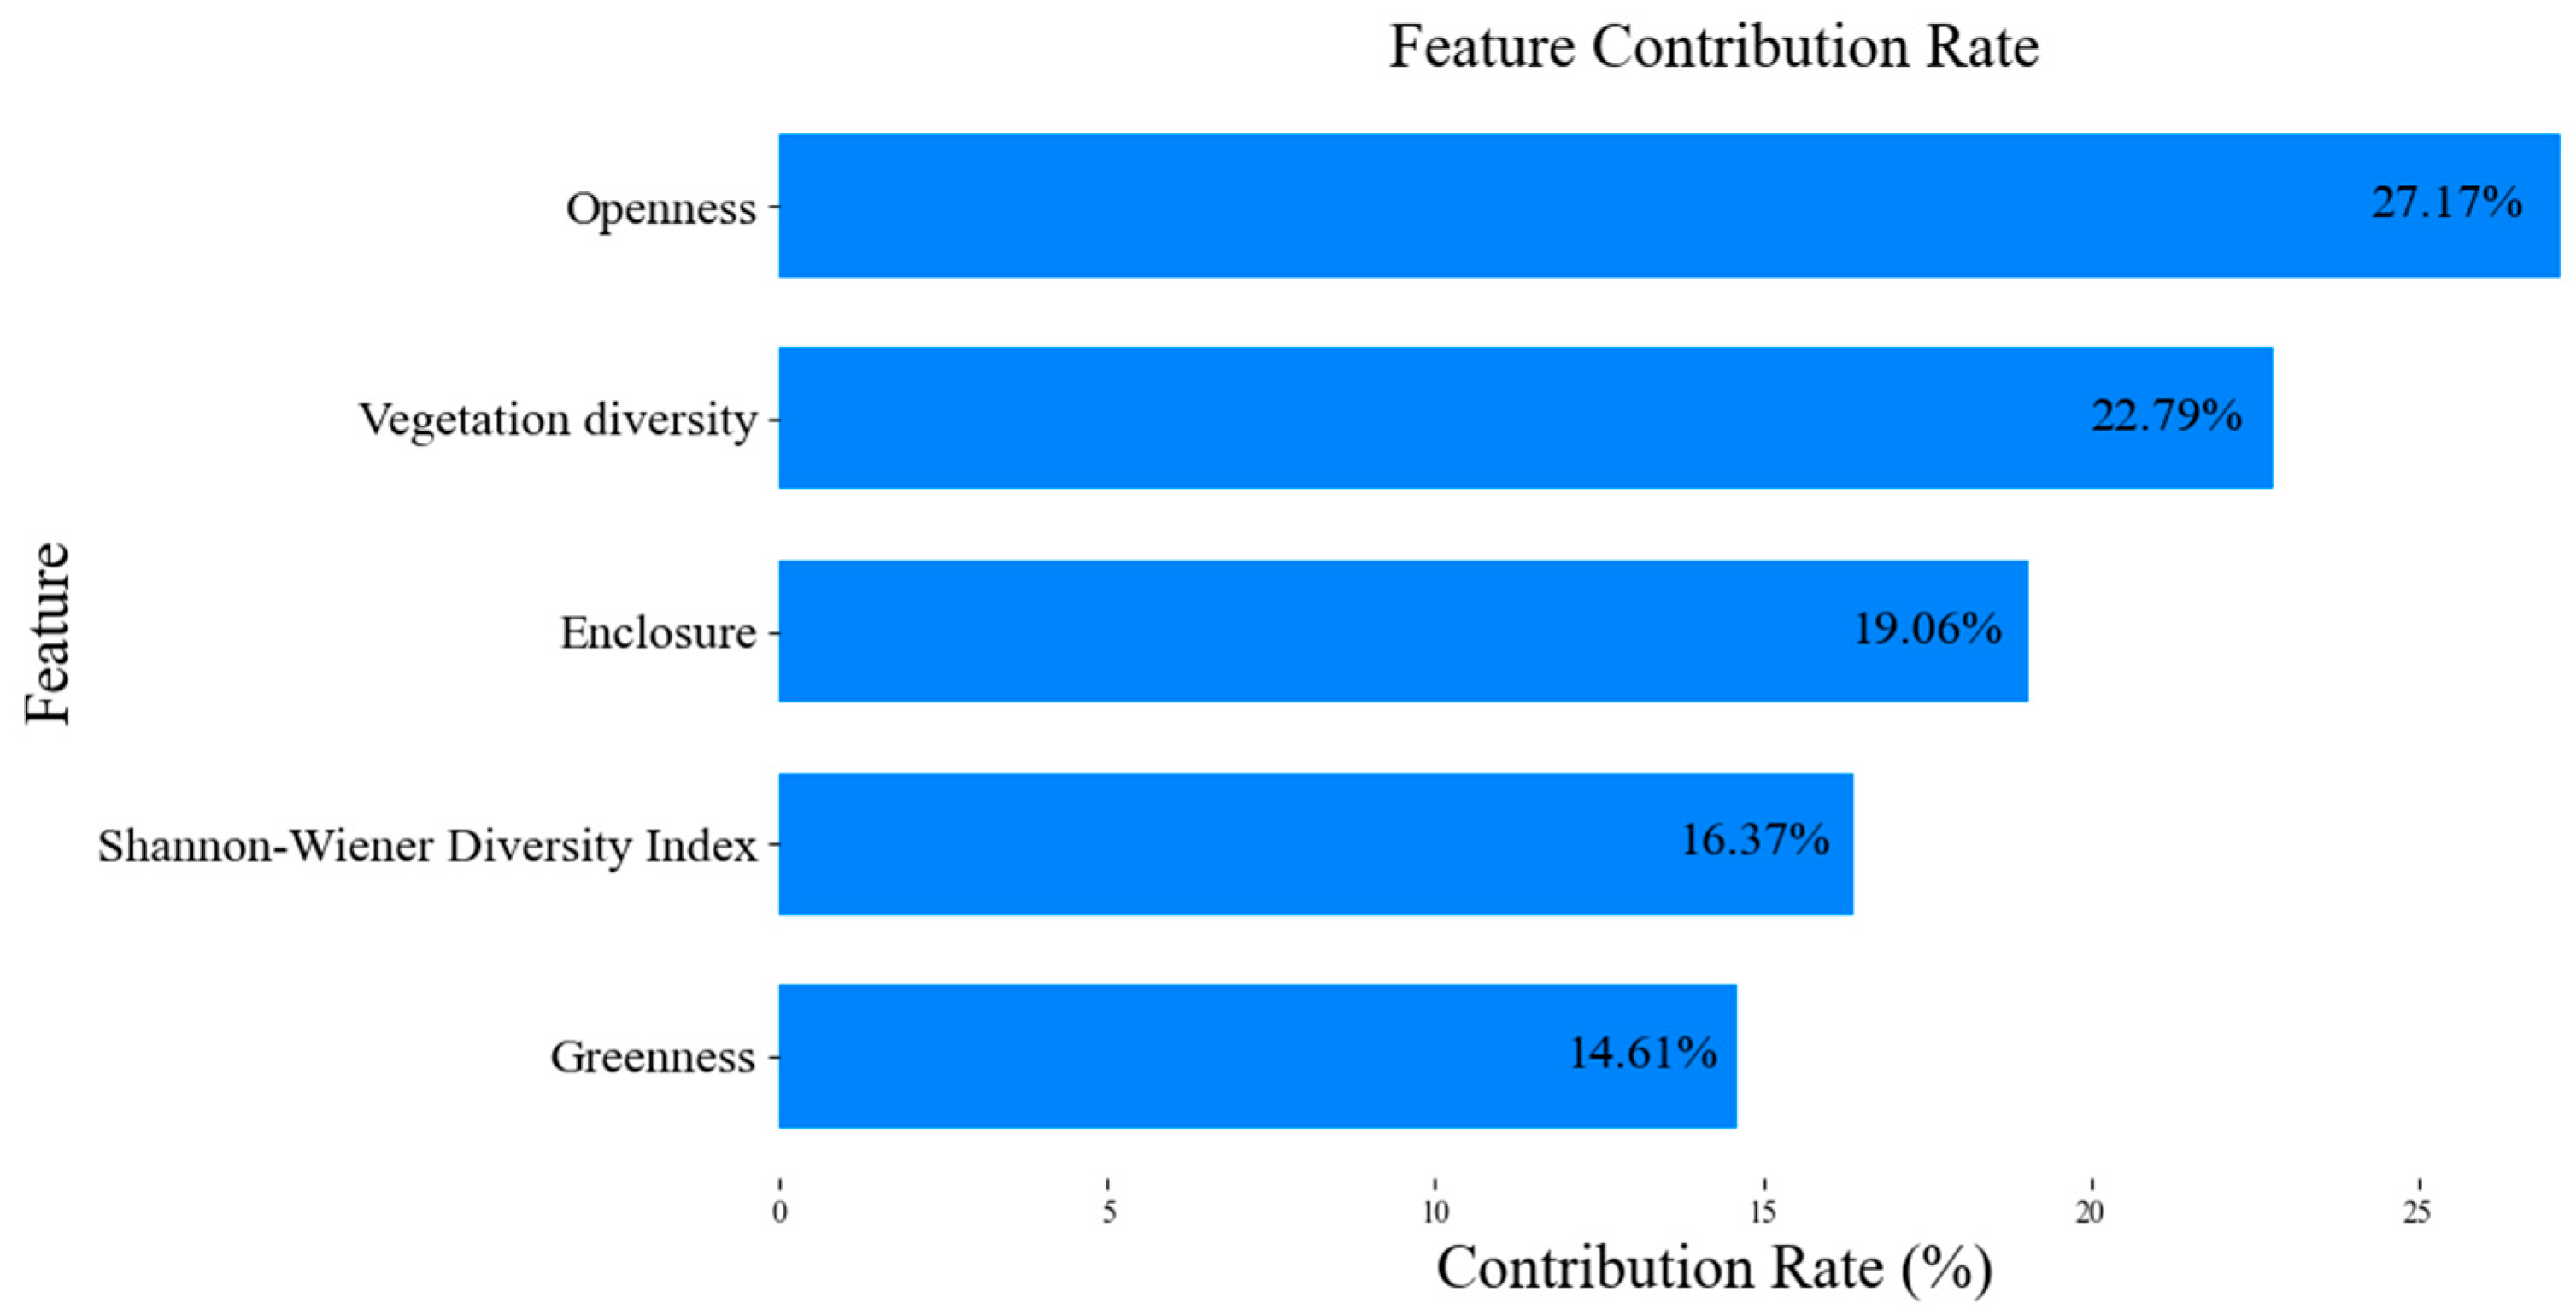
The research findings show significant differences in the importance of various objective landscape features in shaping landscape visual quality (
Figure 7). Among these features, openness showed the greatest influence, followed by the Shannon–Wiener Diversity Index and enclosure. These three factors contribute over 65% to the overall effect, highlighting their role as the core determinants of visual quality in urban landscapes. These three factors contribute over 65% to the overall effect, indicating their role as the core determinants of visual quality in urban landscapes. Openness directly affects the transparency of sightlines and spatial perception, thereby playing a critical role in the overall evaluation of the visual experience. Meanwhile, enclosure and the Shannon–Wiener Diversity Index enhance visual layering and spatial richness, improving both the aesthetic appeal and the experiential interest of the landscape. In contrast, greenness showed the lowest contribution, which may be attributed to its limited ability to reflect the quality of greenery, as it primarily measures the quantity rather than the qualitative aspects of vegetation. Consequently, it may not fully capture the comprehensive perceptual experience of the landscape.
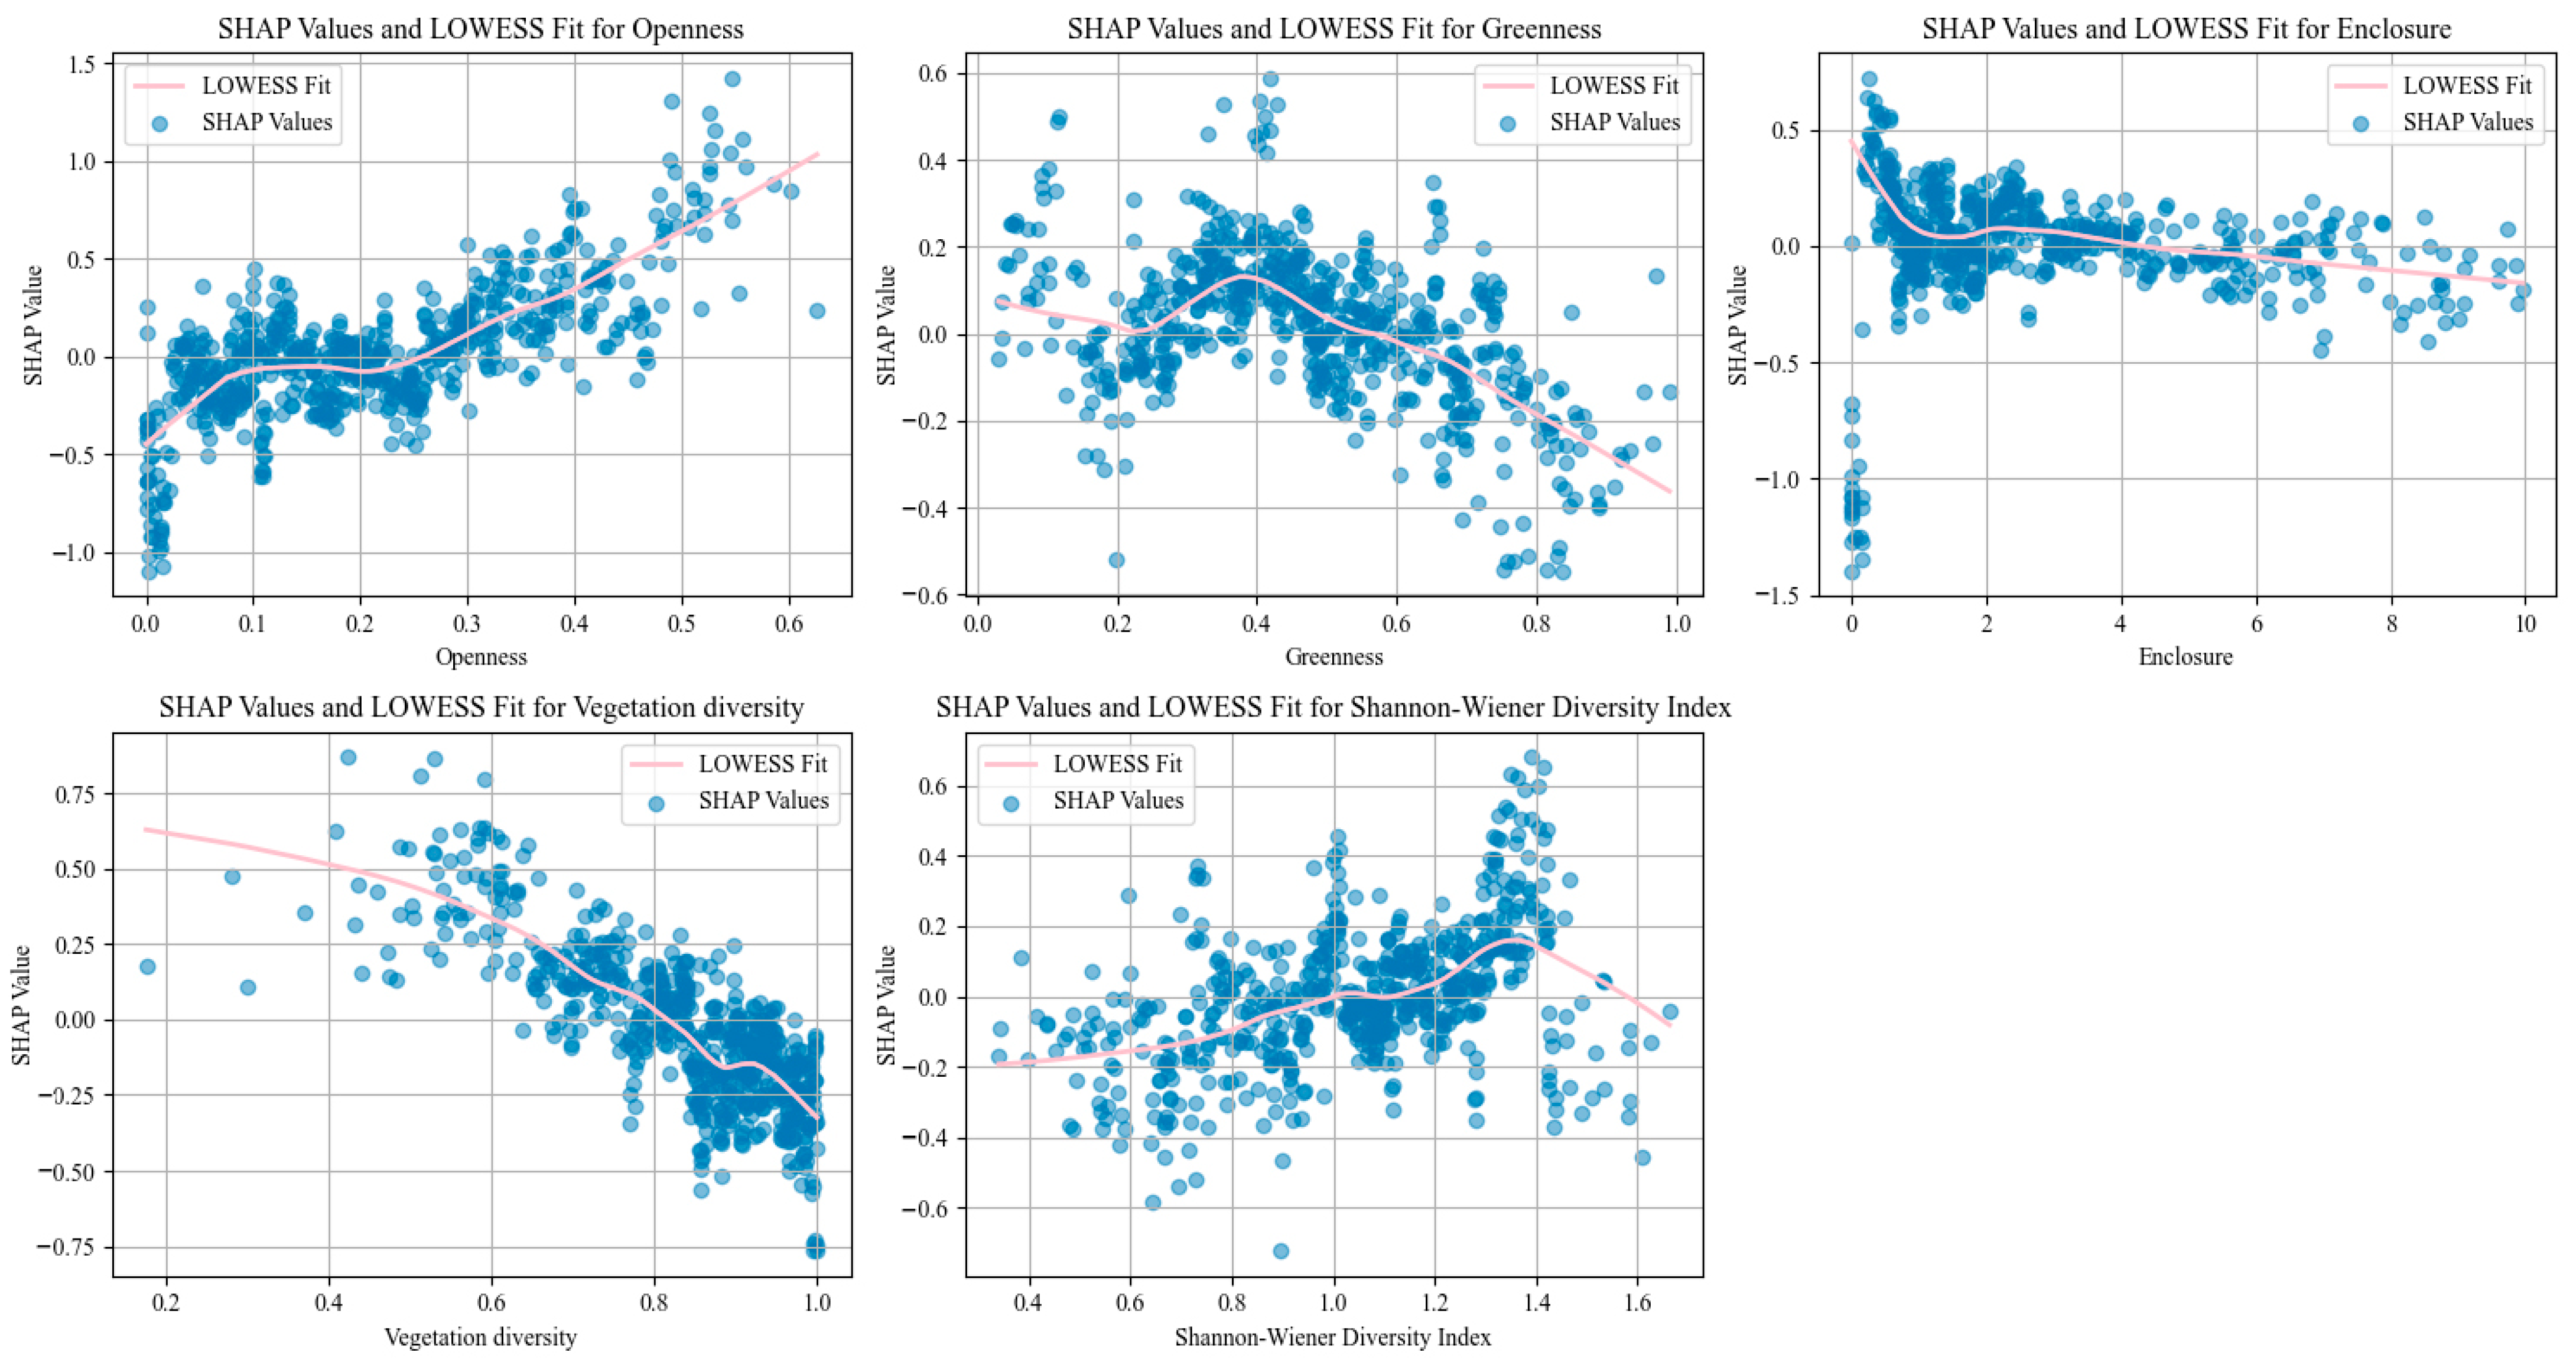
3.5.2. The Nonlinear Effects of Objective Landscape Features on Visual Landscape Quality
Figure 8 shows the nonlinear effects and threshold of objective landscape features on landscape visual quality. Openness exhibits an approximately linear increasing trend, with its influence on visual quality turning positive when the openness exceeds 0.27. This indicates that higher levels of openness help to enhance spatial transparency and a sense of openness. After reaching a certain threshold, a wide field of view not only reduces the feeling of oppression but also improves visual extension, thereby becoming a positive factor contributing to visual quality.
Greenness exhibited an approximately inverted U-shaped curve. When greenness is in the range of 0 to 0.48, it has a positive effect on landscape visual quality, reaching its maximum positive impact at a value of 0.38. This result suggests that at this range, moderate levels of green coverage can enhance the sense of ecological quality, visual comfort, and natural affinity, thereby improving the aesthetic experience of the landscape. However, as green coverage continues to increase beyond 0.48, the local impact of the green view index on the SHAP value turns negative.
Enclosure showed an approximately linear decreasing trend. When enclosure is in the range of 0 to 0.42, it exerts a positive effect on landscape visual quality. The positive effect of SHAP decreases with increasing enclosure. This indicates that a moderate degree of enclosure provides a sense of encompassing feeling and security from a visual perspective. However, when the enclosure degree exceeds approximately 0.42, its effect on the SHAP value turns negative, suggesting that excessive enclosure can decrease visual quality and lead to a bad visual experience.
Vegetation diversity also exhibited an approximately linear decreasing trend. Within the range close to 0 to 0.82, the SHAP values are generally positive but gradually decline. As the vegetation diversity approaches 0.82, its influence on the SHAP value shifts to negative. This suggests that high vegetation diversity may lead to an overly mixed plant composition and confused spatial layout, which can disrupt the visual arrangement of the space and negatively impact the overall landscape visual quality.
The Shannon–Wiener Diversity Index exhibited an approximately inverted V-shaped curve, showing an initial increase followed by a decline. When the Shannon–Wiener Diversity Index approaches 0.97, its impact on the SHAP value shifts from negative to positive, reaching the maximum positive effect around 1.37. Beyond this point, the positive impact gradually decreases and turns negative when the diversity index reaches approximately 1.6. This pattern suggests that a moderate level of landscape element diversity enhances spatial complexity and visual attractiveness, thereby increasing people’s interest and engagement with the landscape.
5. Conclusions
This study was in the five city parks of Fukuoka, Japan, specifically Ohori Park, Maizuru Park, Nishi Park, Suzaki Park, and Island City Central Park. In this paper, five objective landscape features and eight subjective landscape features were calculated using SBE, SD, and semantic segmentation to analyze the quality of landscape visual quality in Fukuoka City urban parks. We established a linear regression model for visual quality and subjective landscape features and analyzed the nonlinear relationship between objective landscape features and landscape visual quality, in addition to the threshold effect.
Specifically, among subjective landscape features, the visual quality of urban parks is most affected by five features: a sense of order, harmony, interestingness, a sense of layering, and vitality. According to the regression coefficient, all of them have a significant positive influence on the visual quality of the landscape, among which the sense of order has the most significant influence on the visual quality of the landscape, which is a key factor in constructing a high-quality landscape perceptual experience. The threshold for openness in objective landscape features was greater than 0.27, and exceeding or falling below this threshold range hurt visual quality, while the optimal threshold for greenness was 0.38, and an increase in greenness could effectively enhance visual quality. However, above this value, the positive effect gradually diminishes or even turns negative. Enclosure has shown the same effect with an optimal threshold of 0–4.2, as well as vegetation diversity with an optimal threshold of 0–0.82, below which the visual quality is negatively affected. The optimal threshold for the Shannon–Wiener diversity index is 1.37, which was the highest point of positive effect on visual quality.
In the design of urban parks and public spaces, it is recommended that the visual proportion between sky and tree be carefully balanced in landscape design, with the sky proportion maintained above 0.27 to ensure an appropriate sense of openness. When arranging vegetation, it should consider its density to create a moderate sense of enclosure, enhancing feelings of safety and intimacy within the space. The variety of vegetation should be neither overly simplistic nor excessively complex; keeping it below 0.82 can help improve the visual experience. The diversity of landscape elements is ideally close to 1.37. In addition, design should emphasize subjective perceptual qualities such as a sense of order, harmony, and interestingness by optimizing spatial structure, coordinating colors, and integrating natural elements. The design of urban parks should follow a human-centered approach and serve multiple functions within the broader urban public space system. It should aim to achieve a harmonious integration of ecological performance, aesthetic value, and perceptual experience, thereby enhancing the overall quality and efficiency of urban spaces.


