
Machine Learning Prediction of Mechanical Properties for Marine Coral Sand–Clay Mixtures Based on Triaxial Shear Testing


Abstract
1. Introduction
2. Materials and Methods
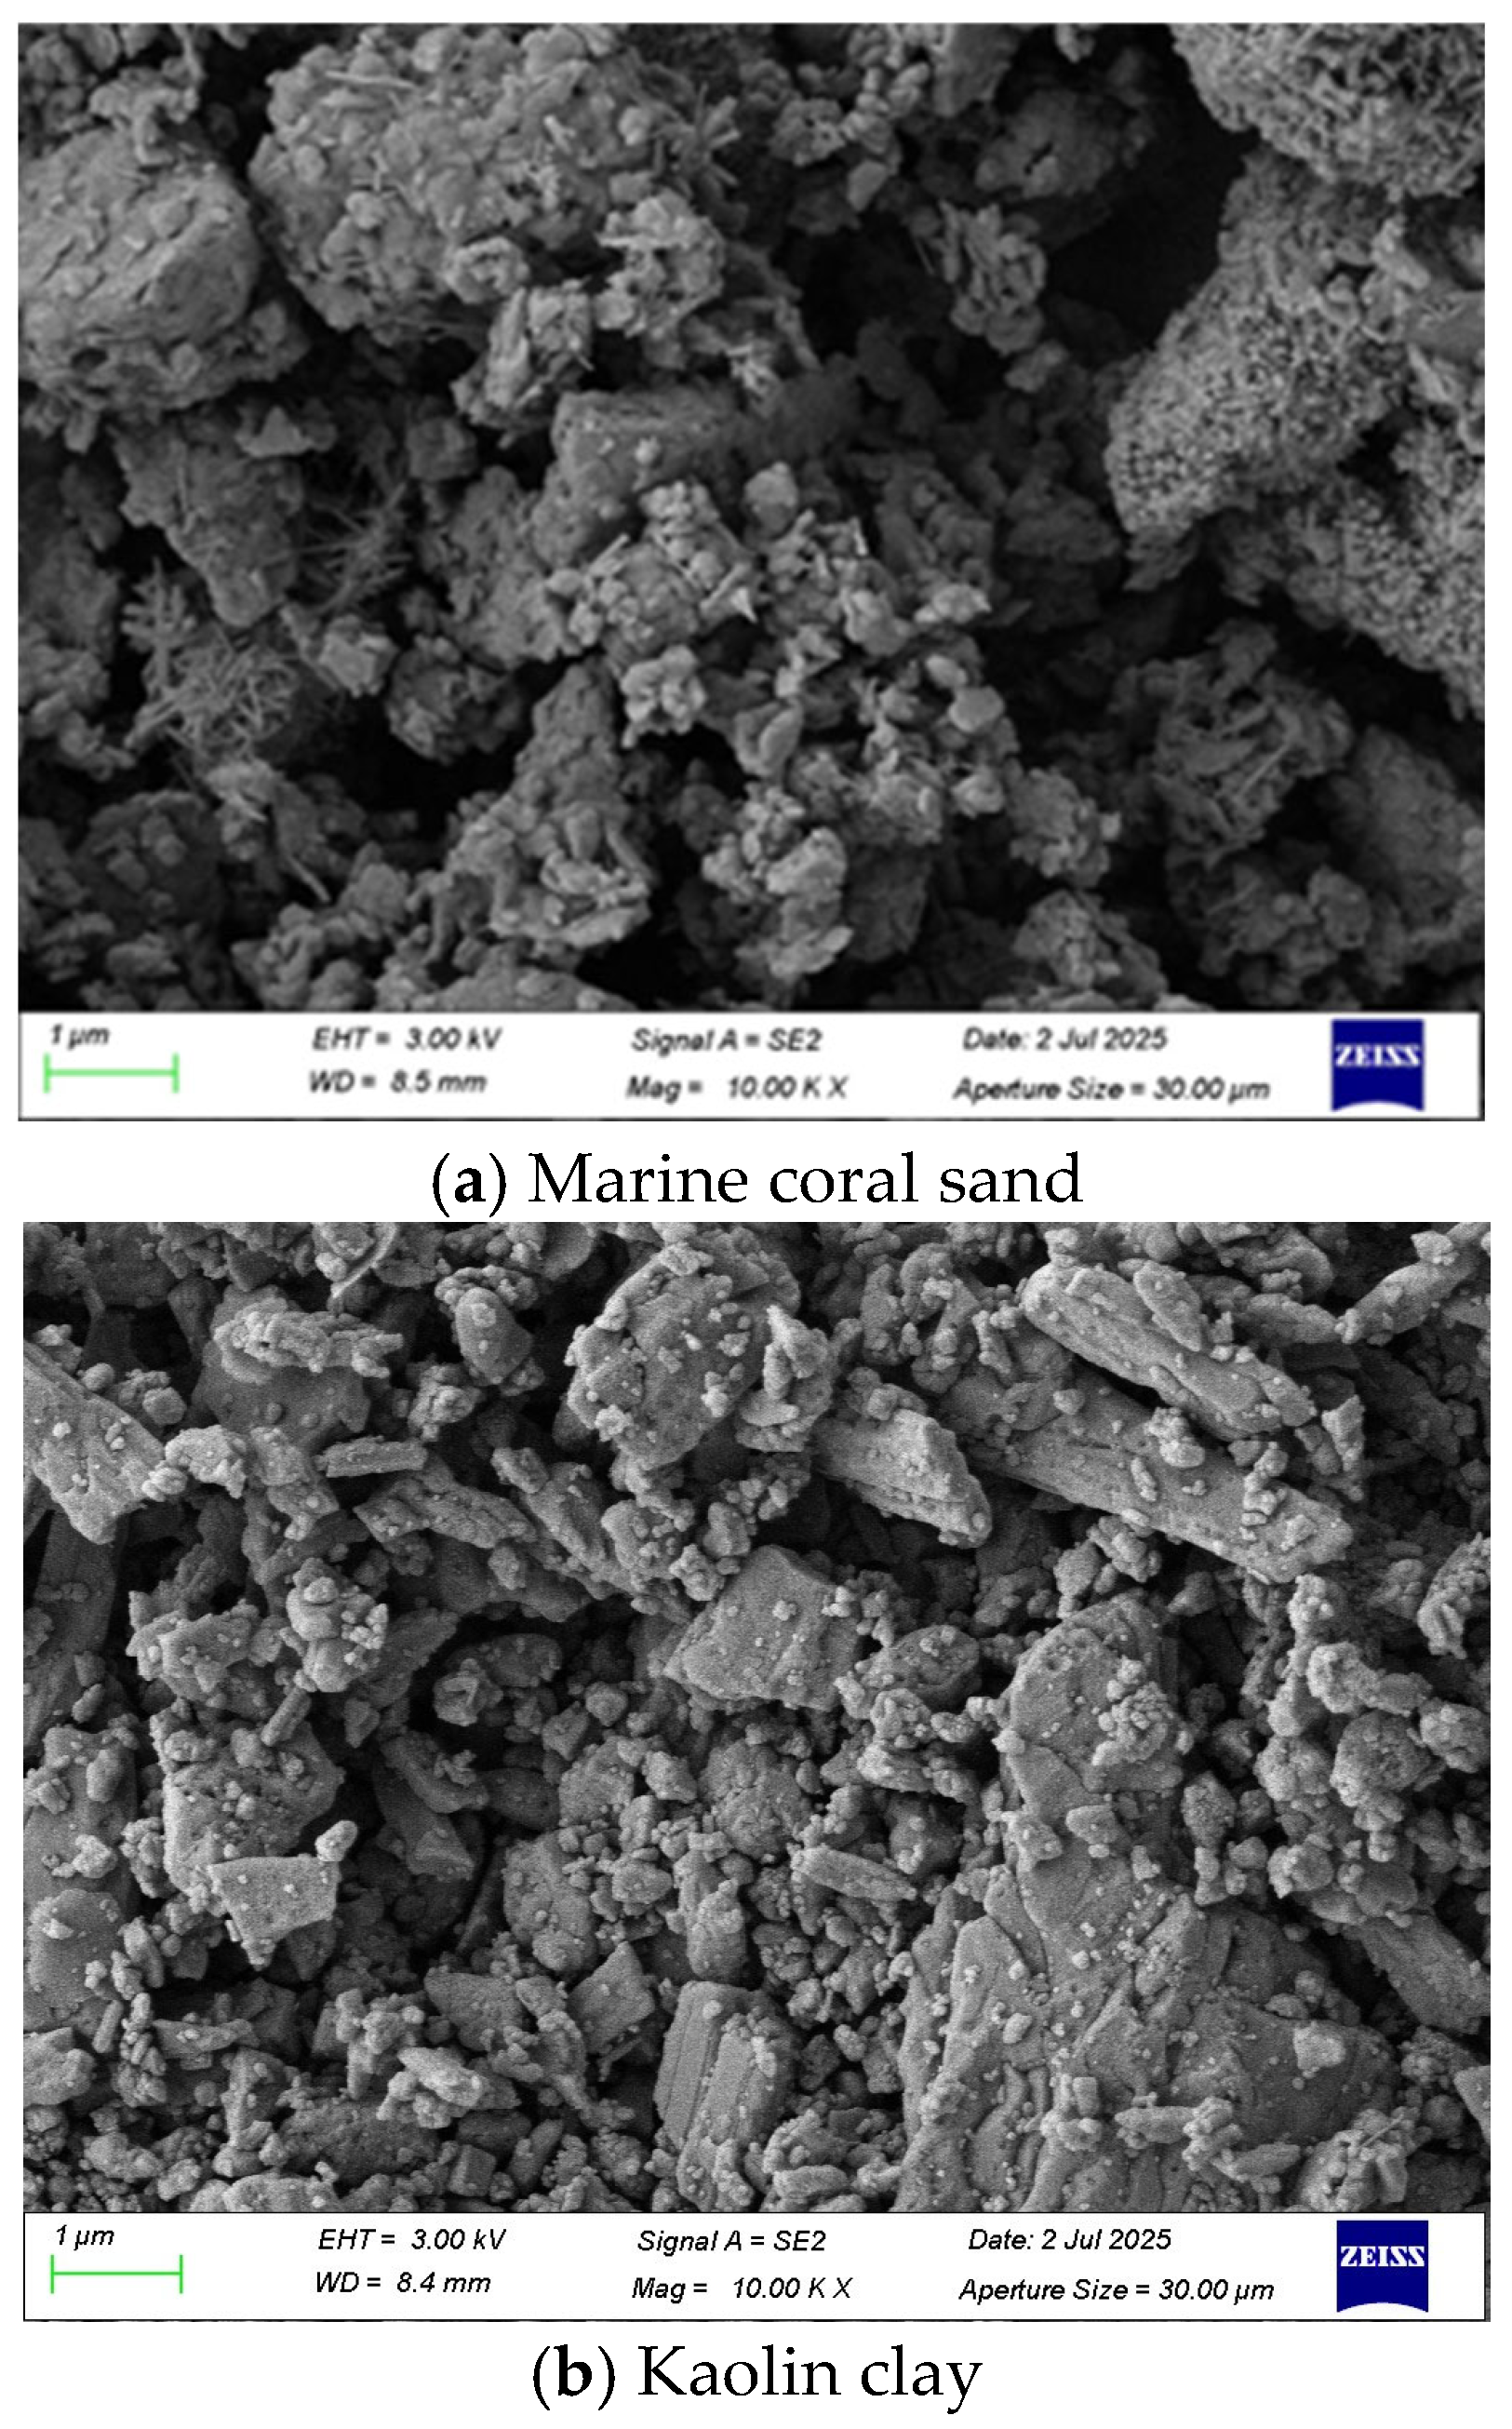
2.1. Materials
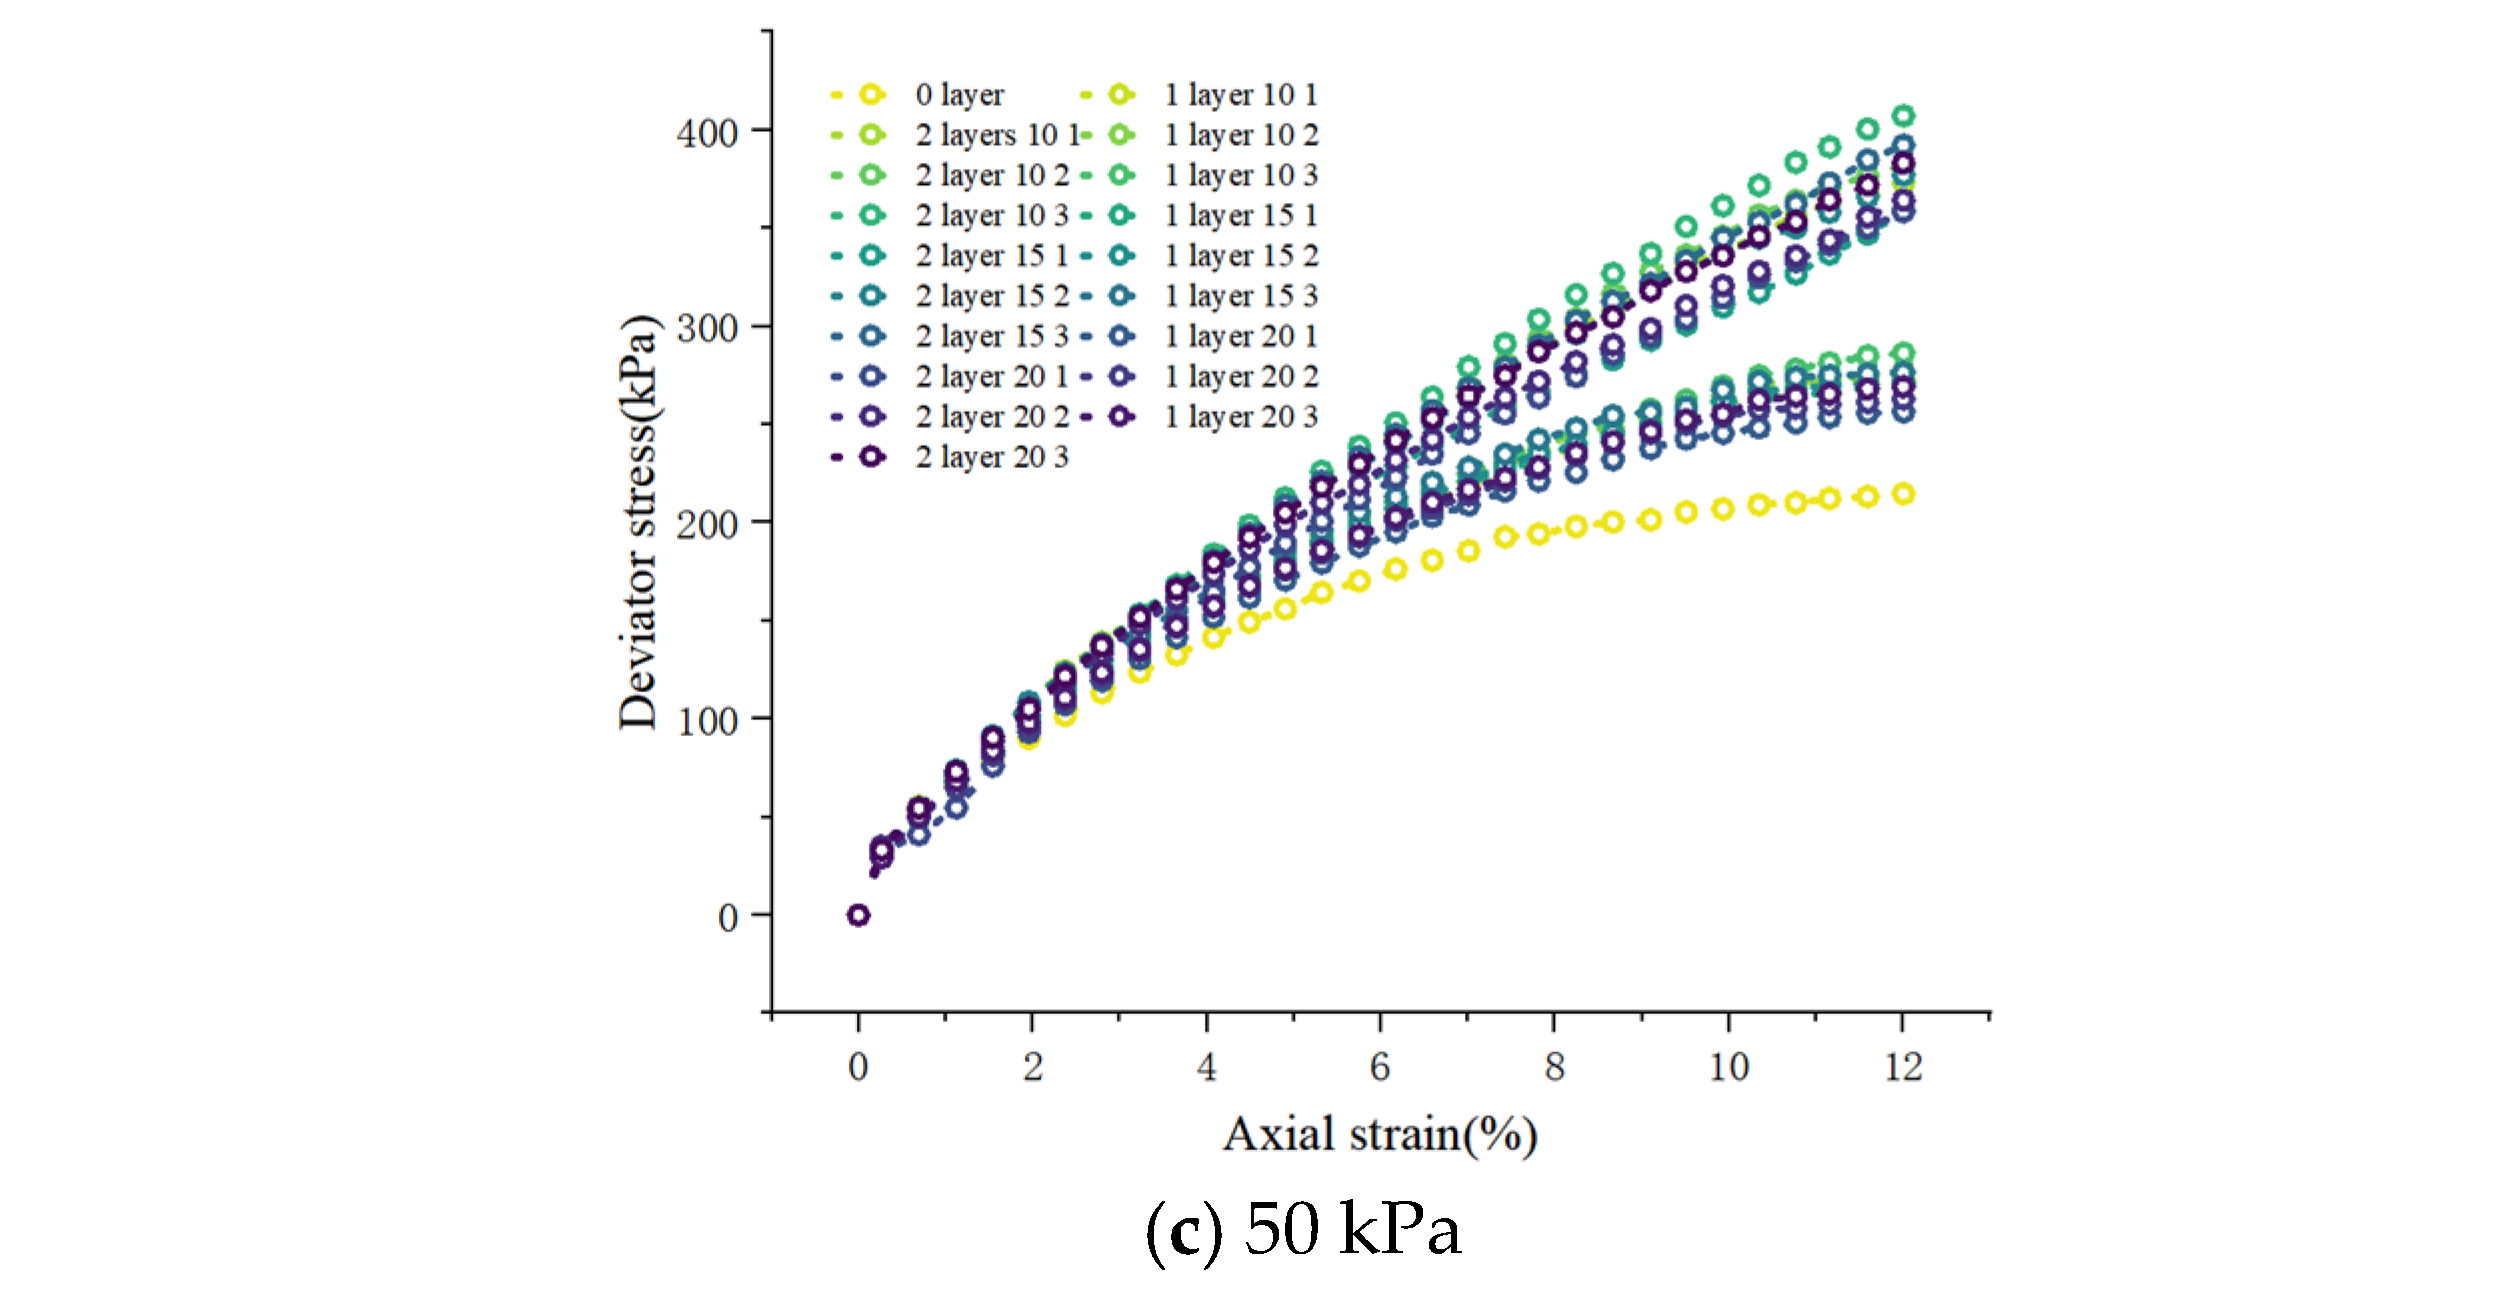
2.2. Experimental Procedure
2.3. The Influence of Each Variable on the Strength Characteristics of MCCM
3. Methodology
3.1. Machine Learning Algorithms
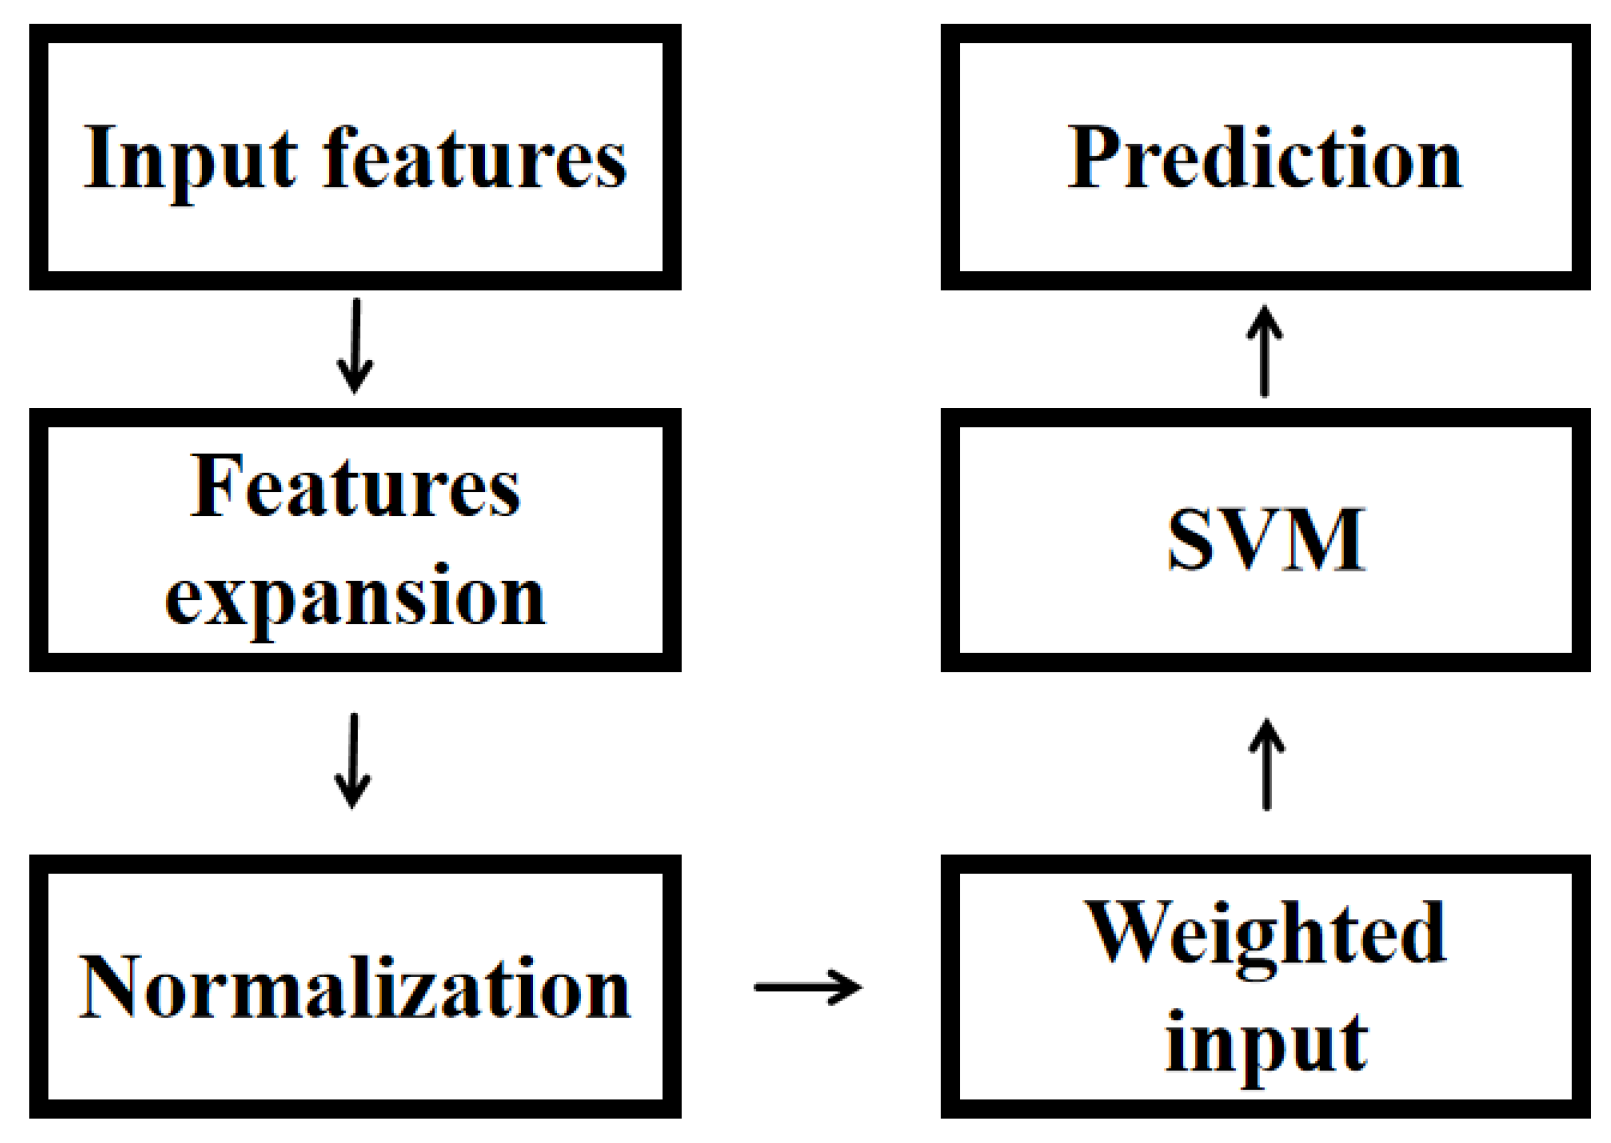
3.1.1. SVM
3.1.2. GA and PSO
3.1.3. LDA
3.2. Model Parameter Setting
3.2.1. Hyperparameter Optimization
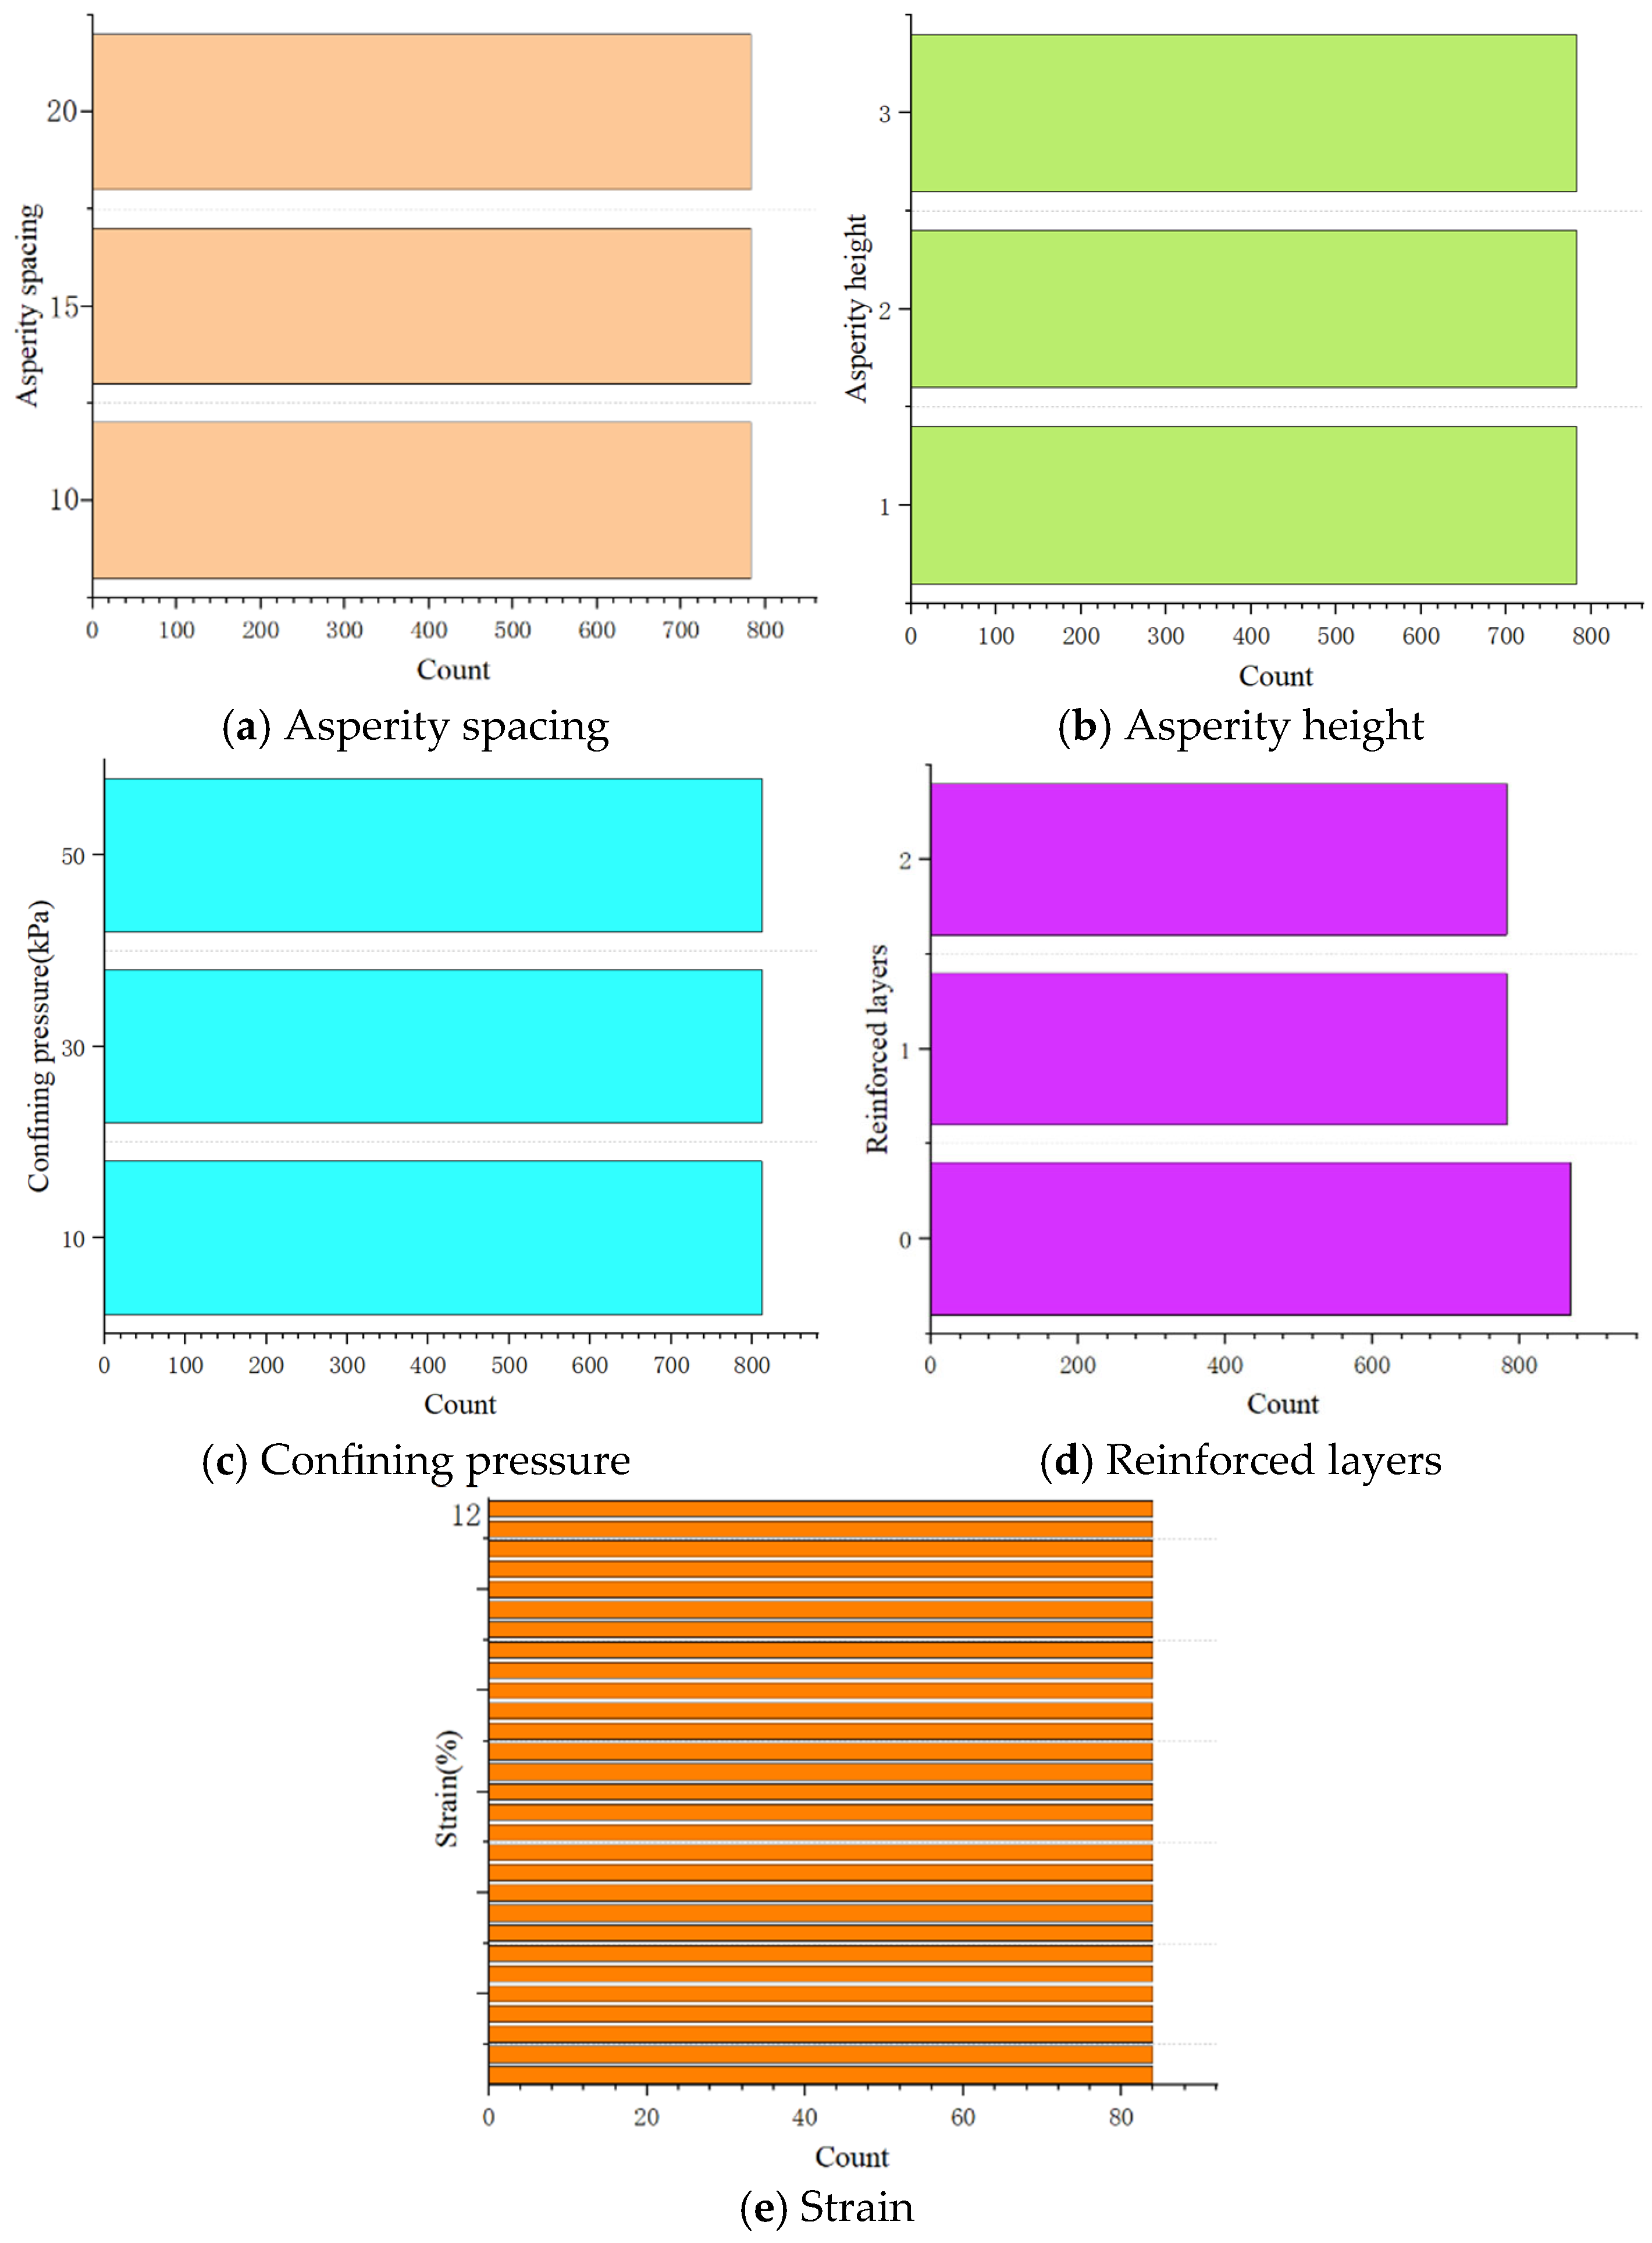
3.2.2. Establishment of Database and Data Processing
3.3. Predictive Performance Assessment Index
4. Results and Analysis
4.1. Establishment of Datasets
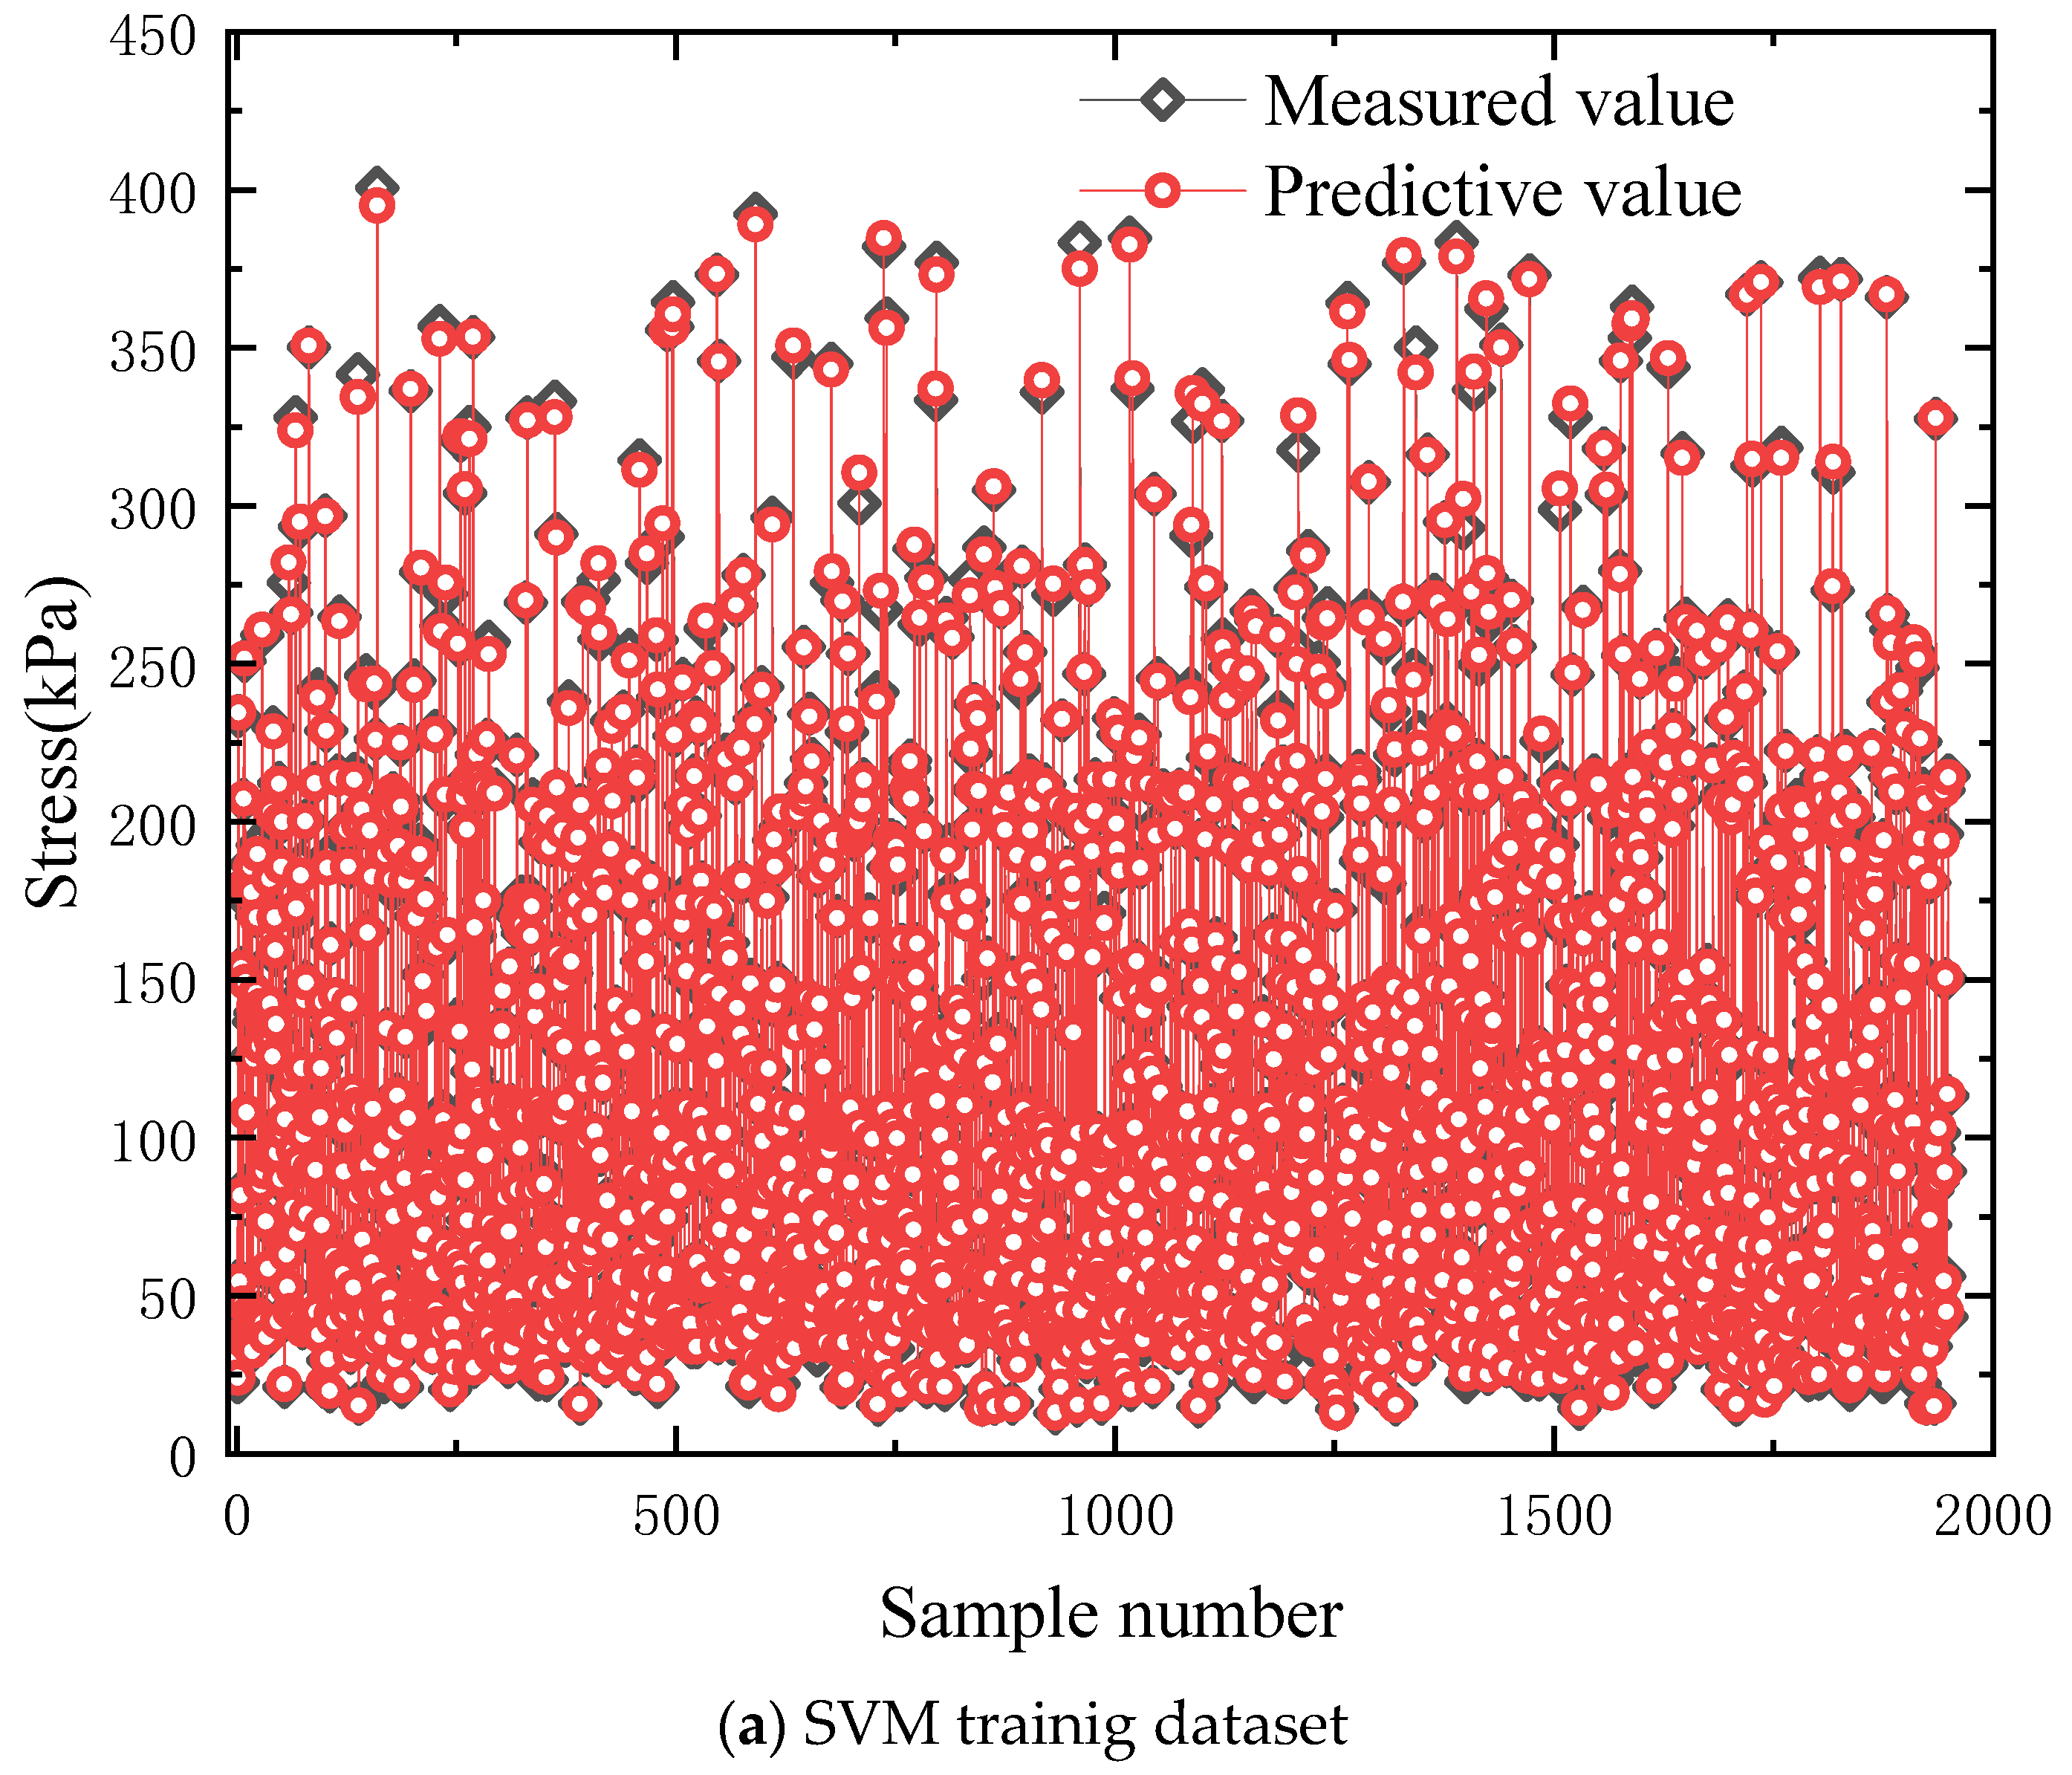
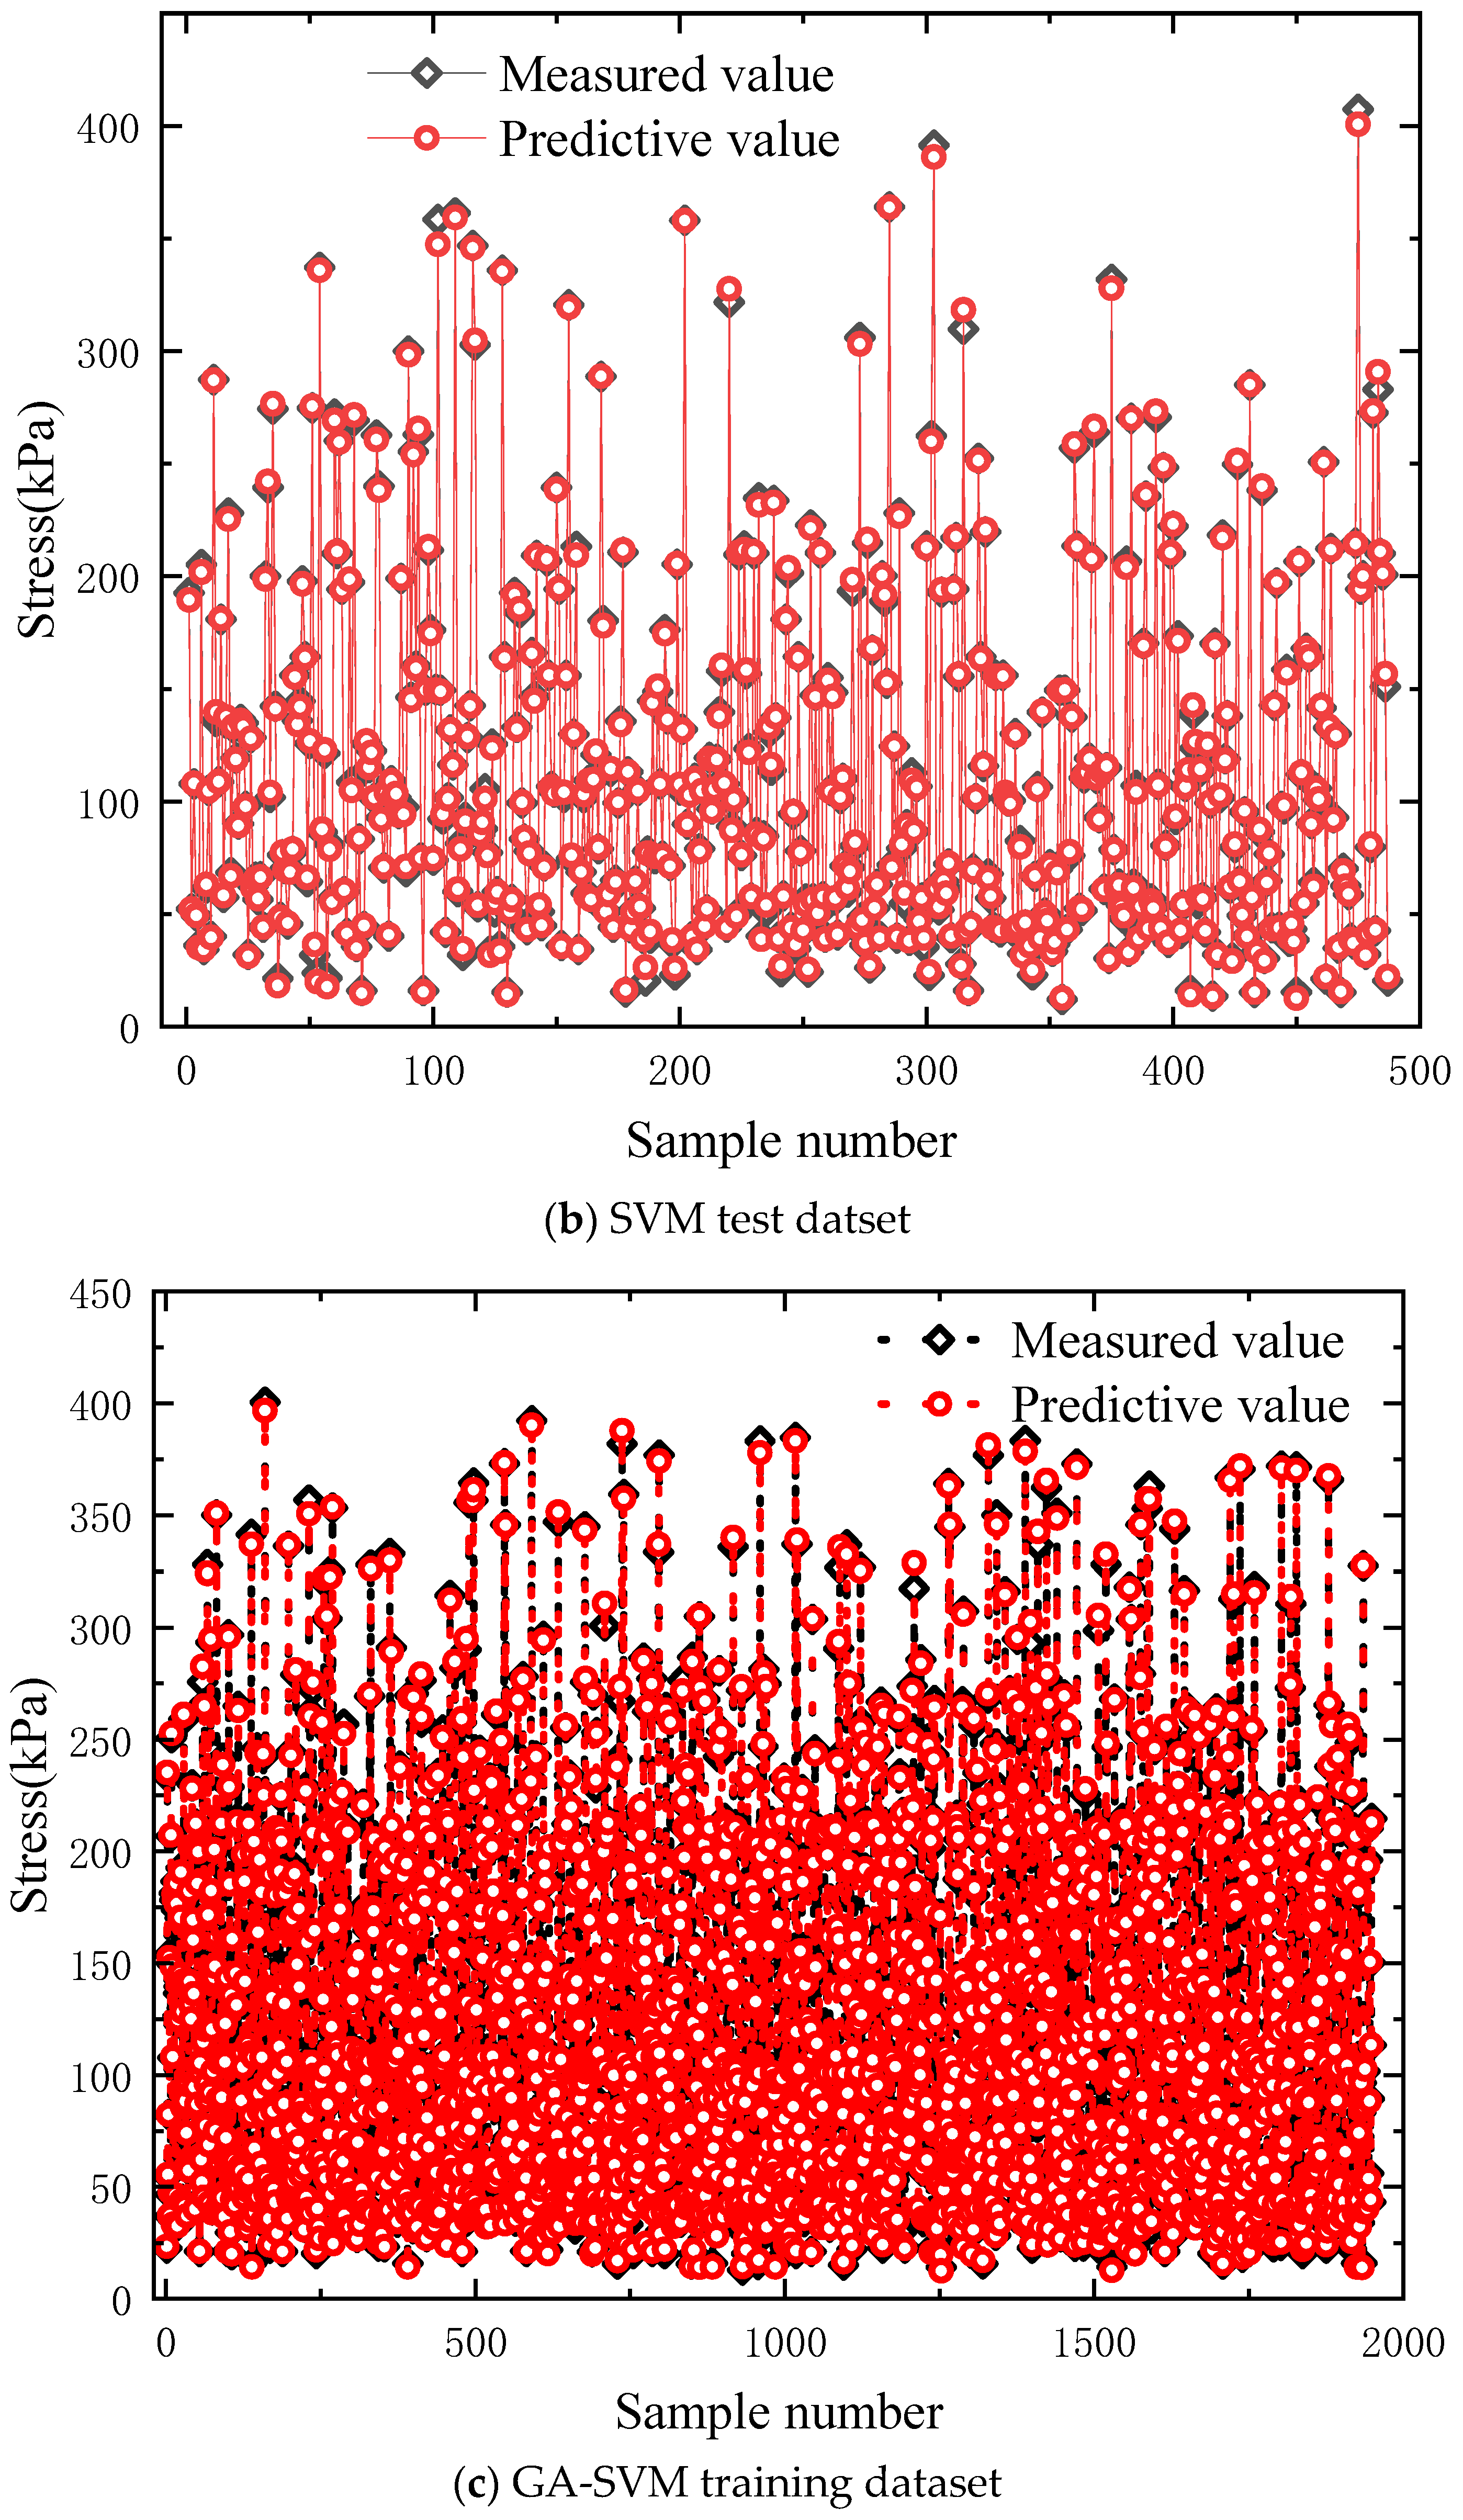
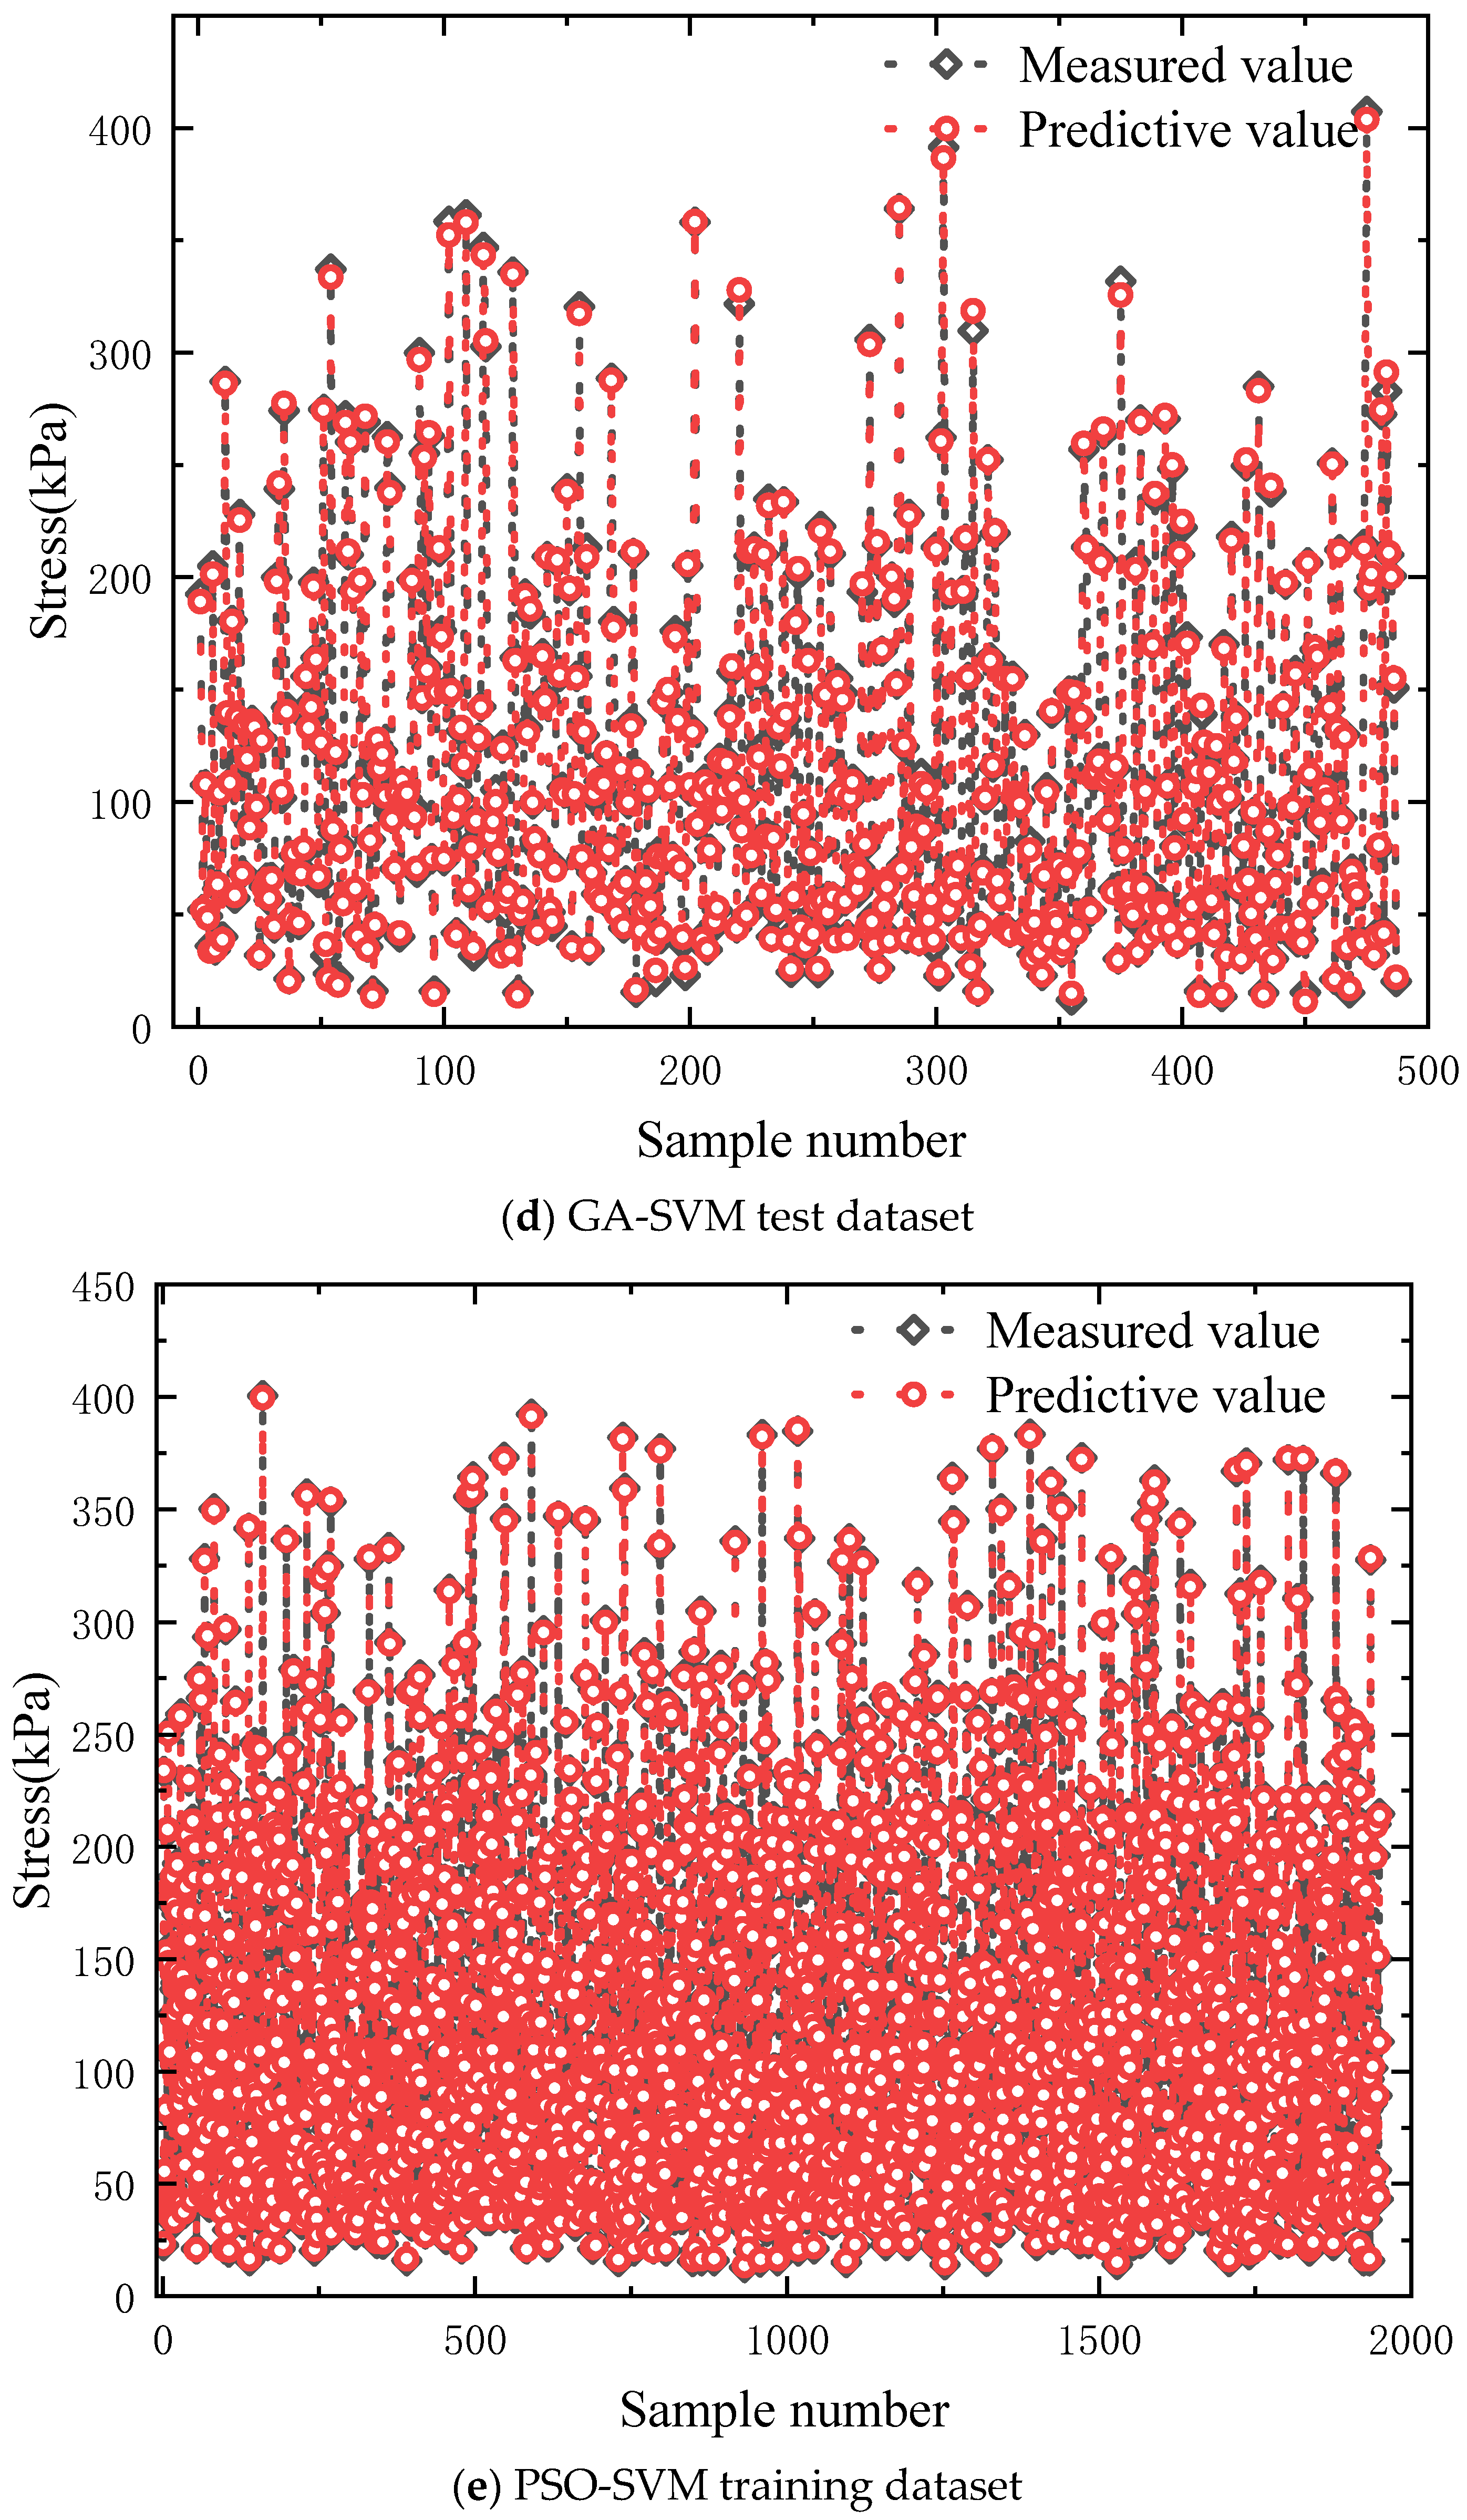
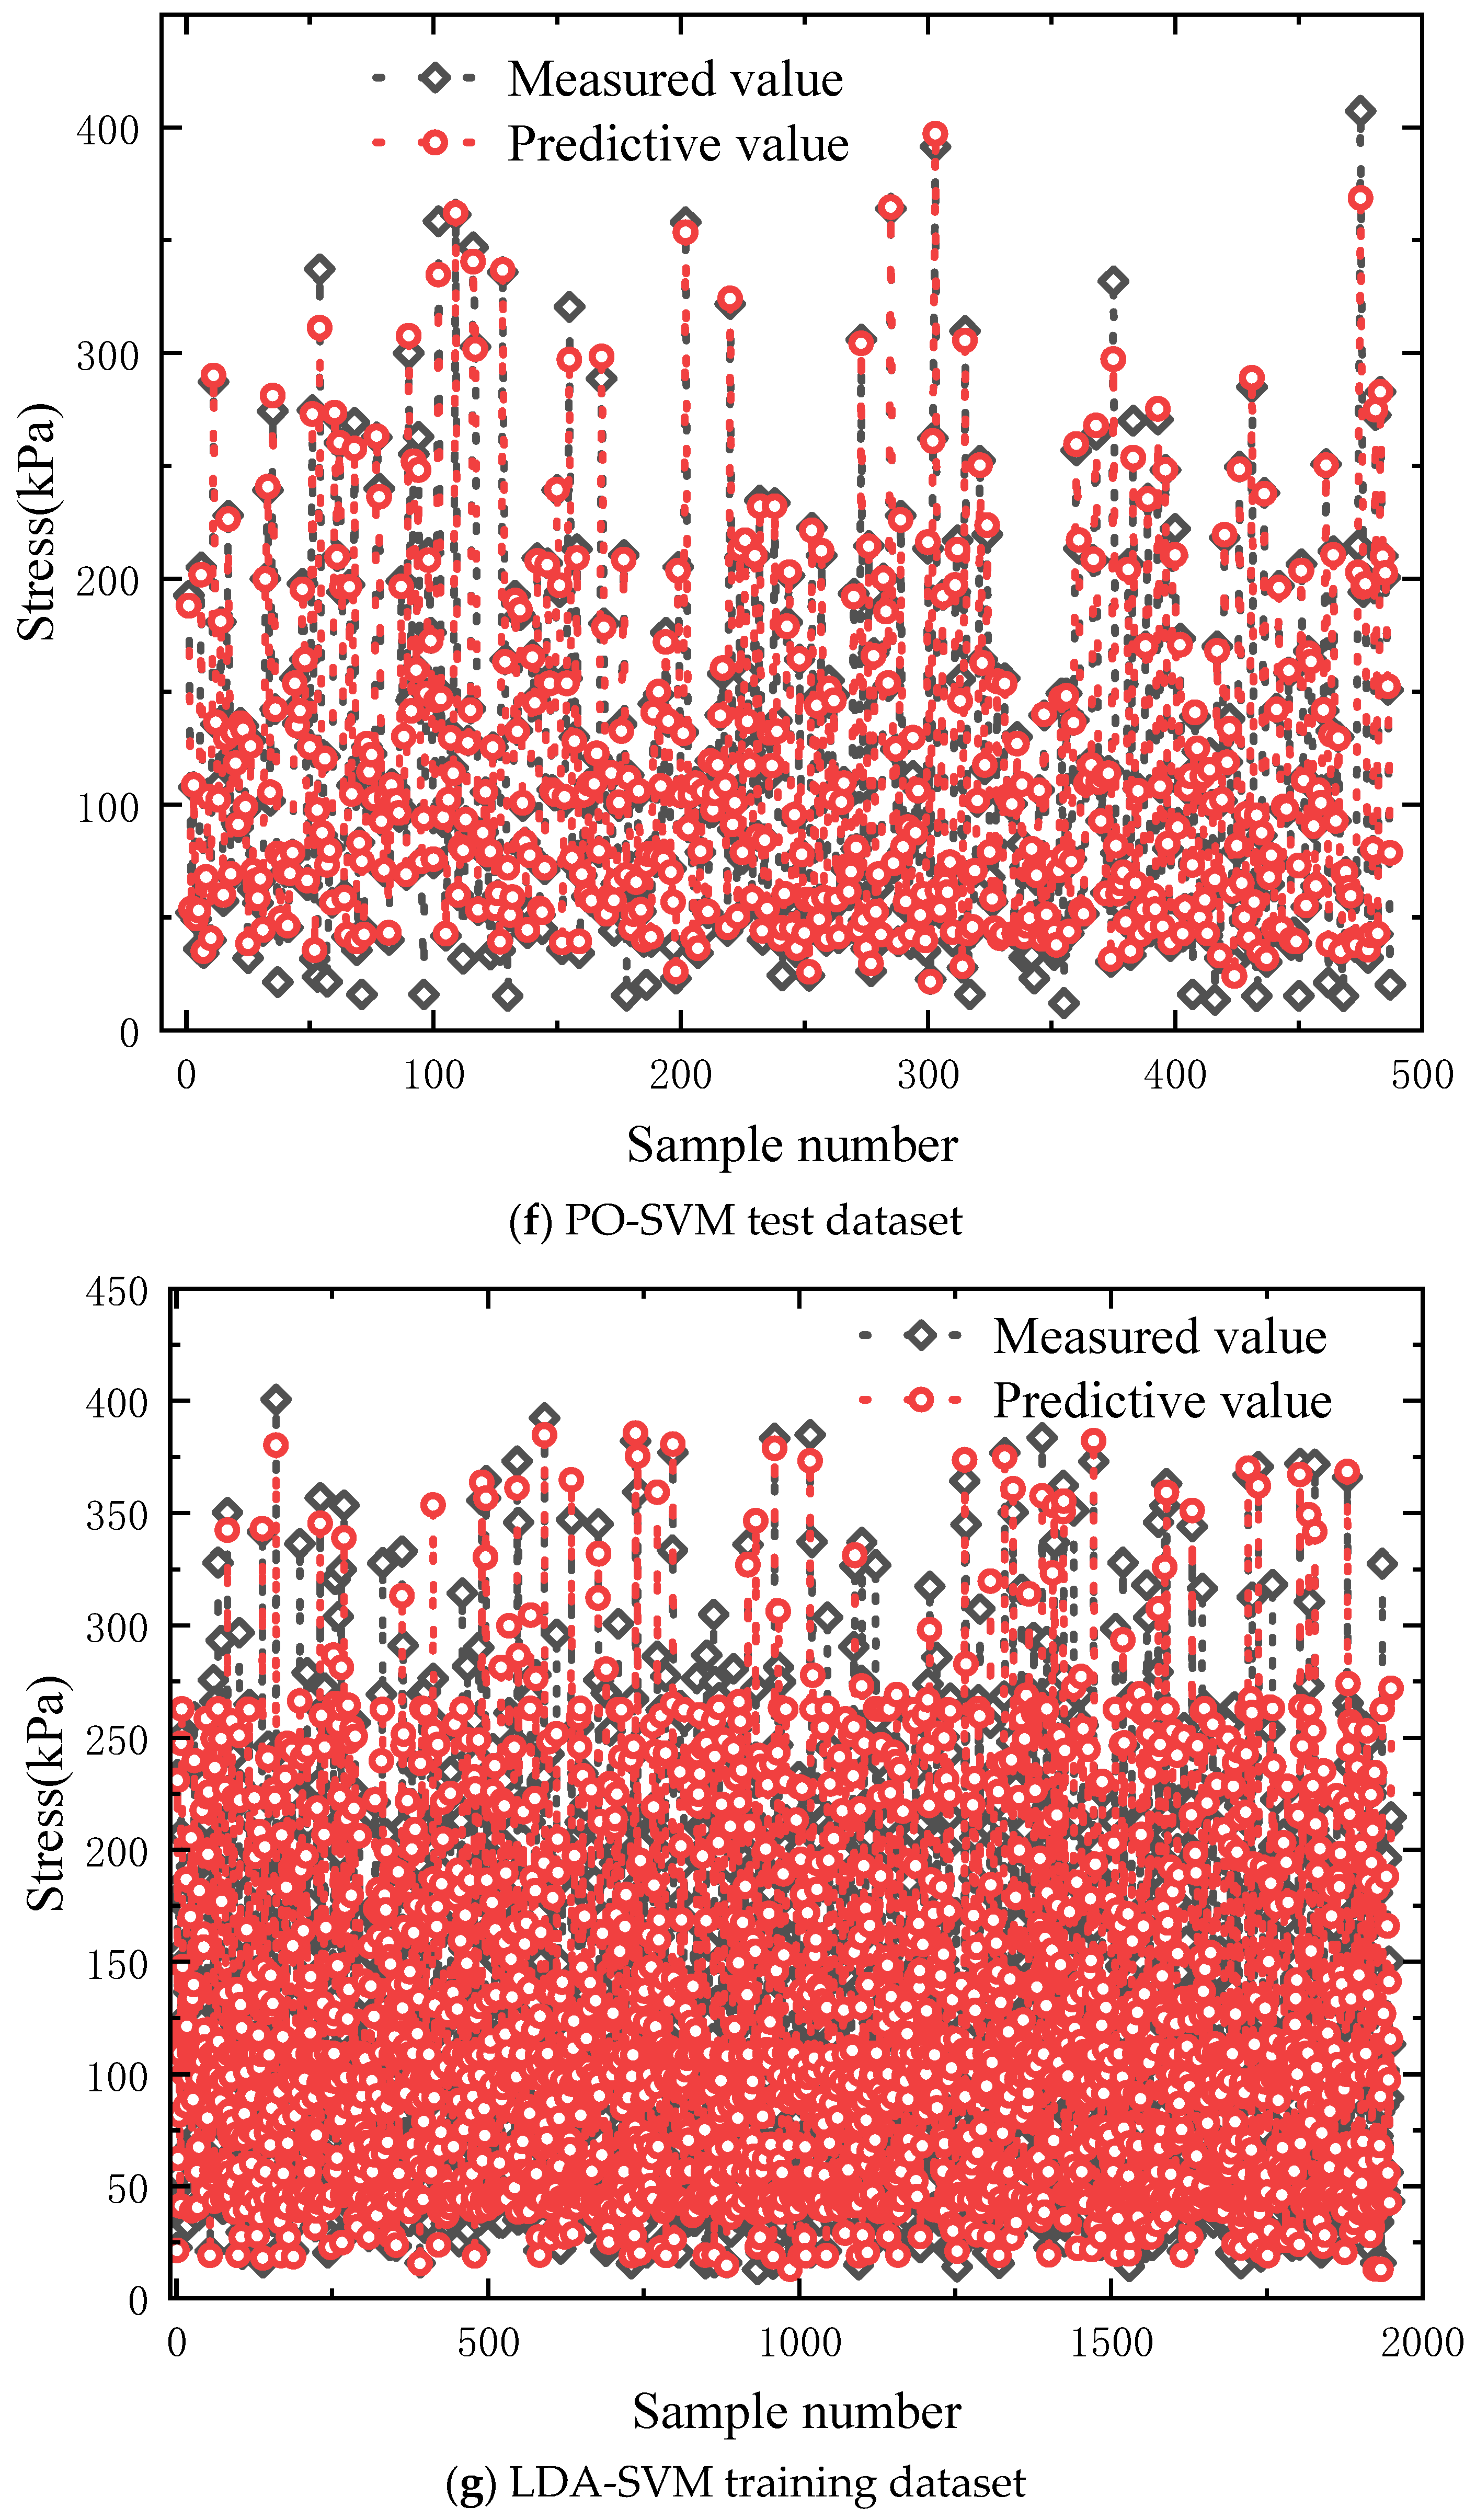
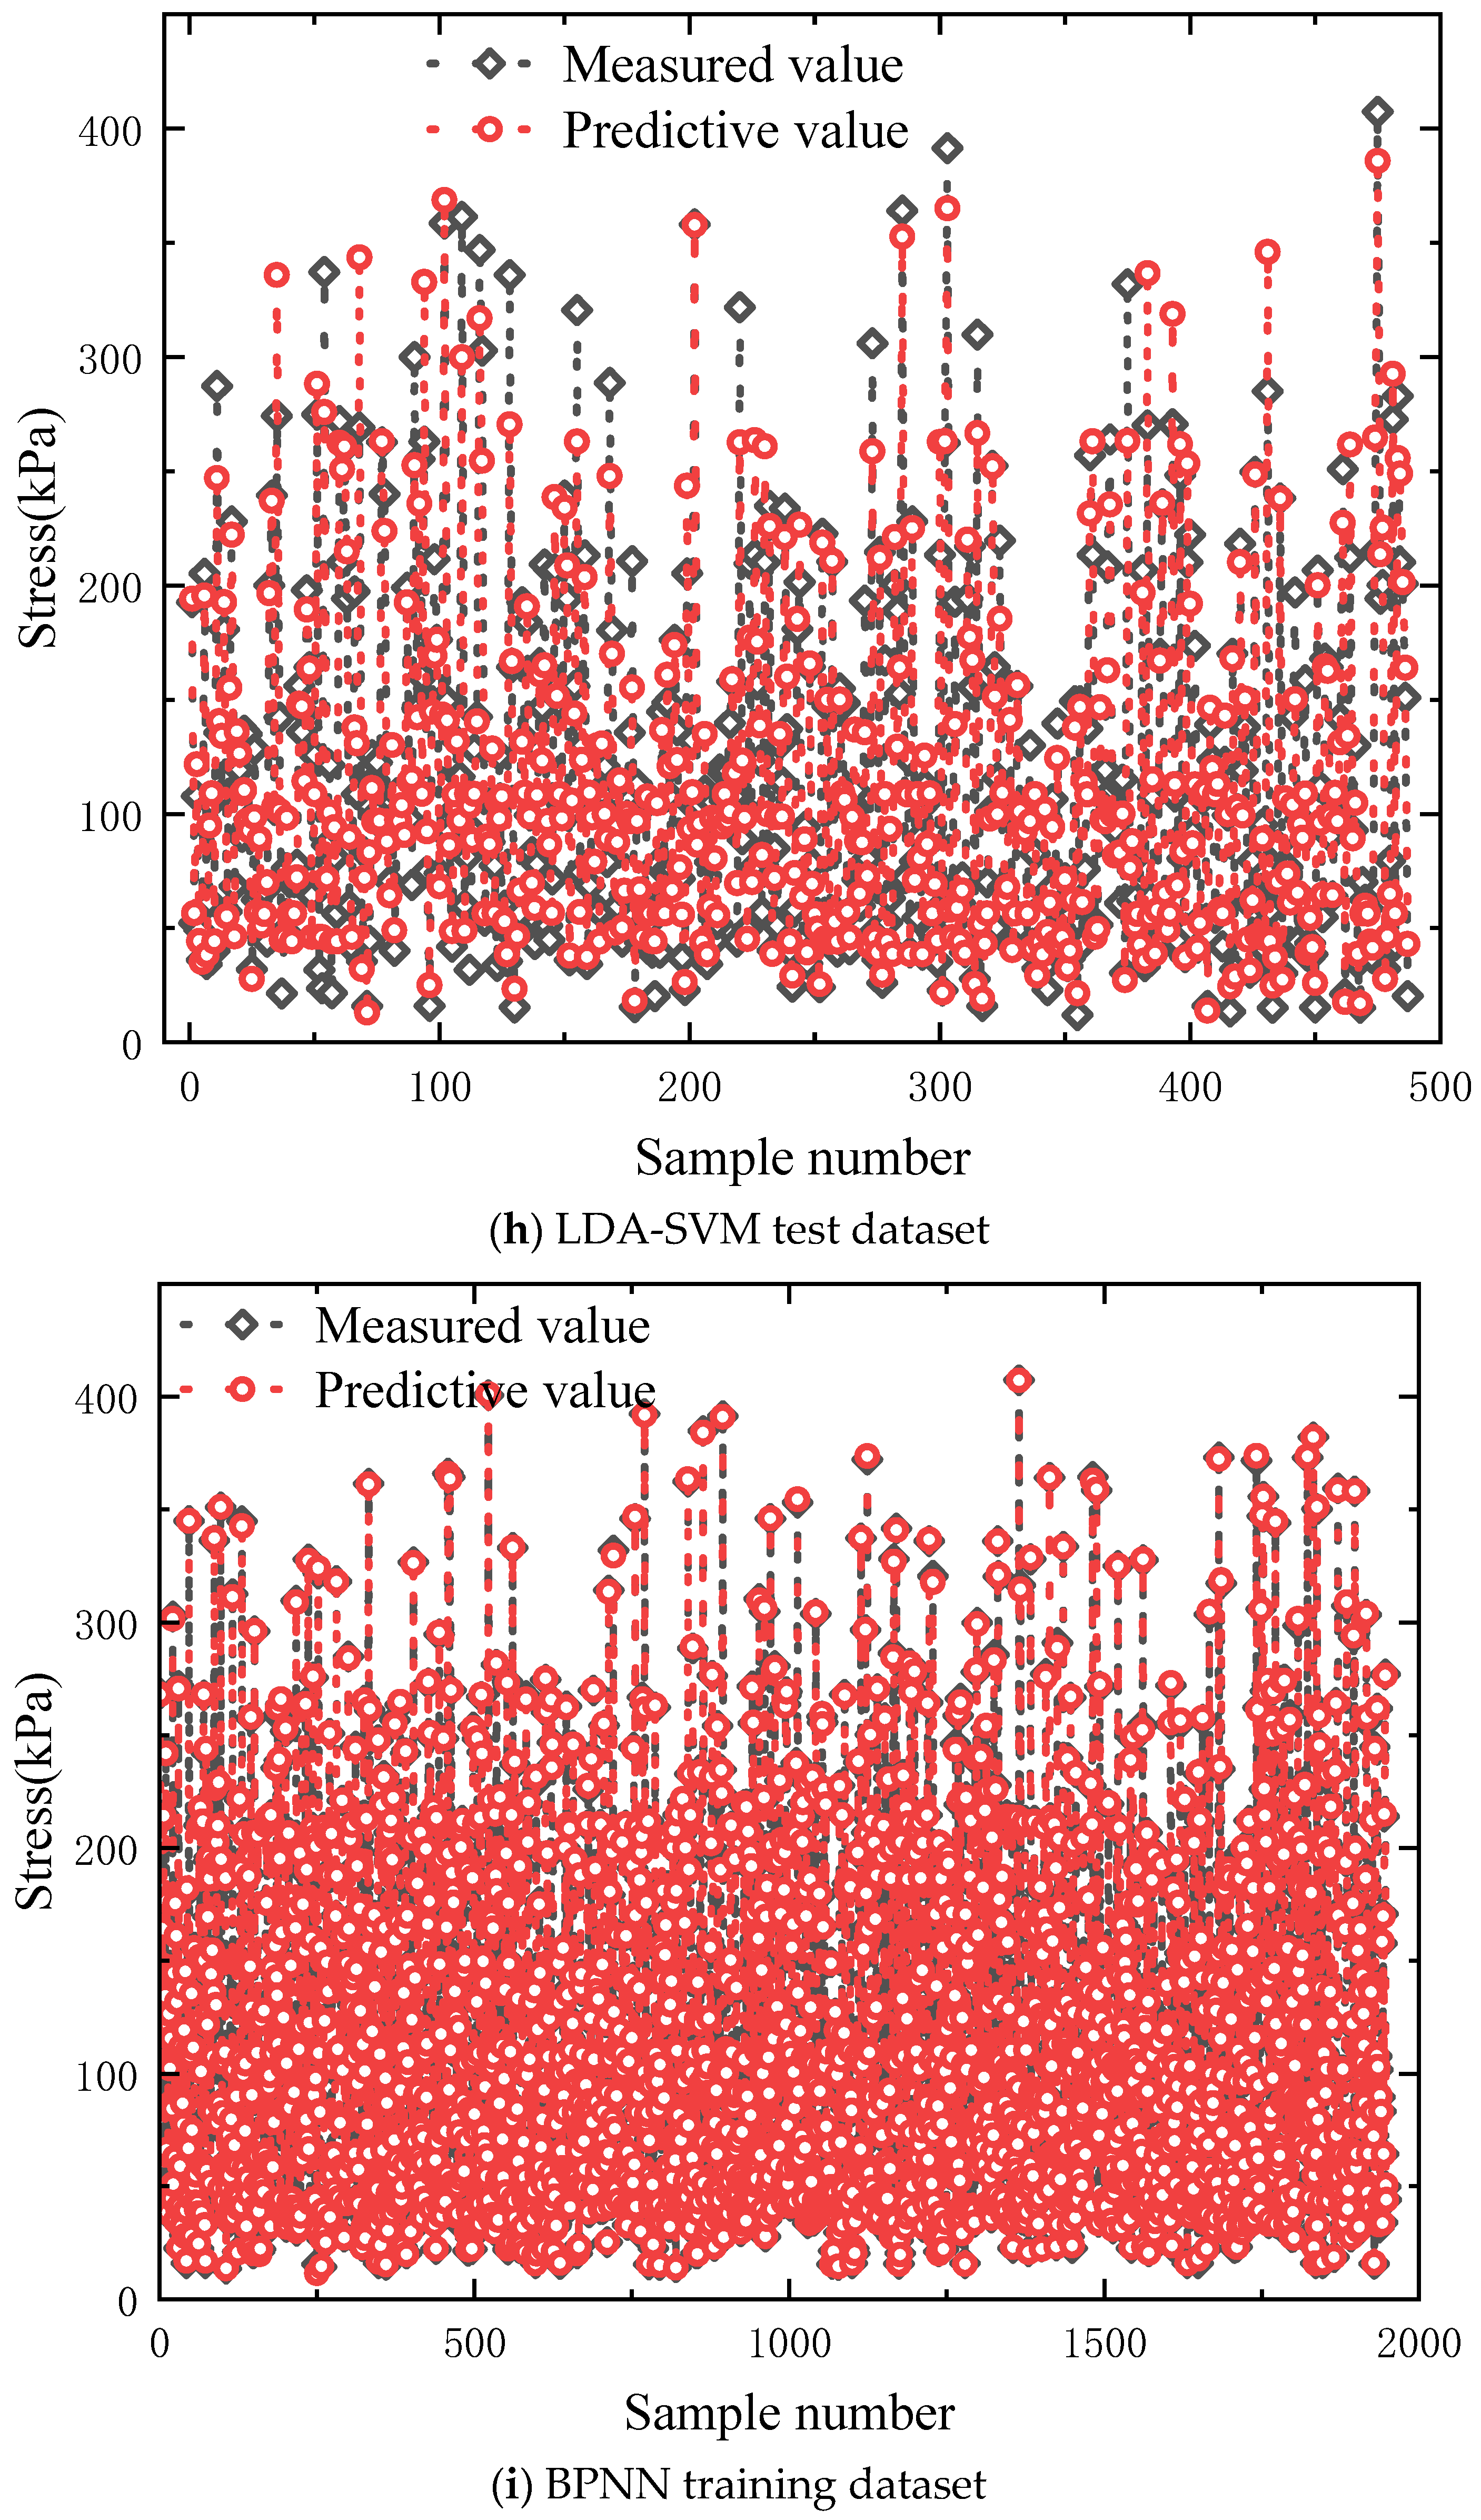
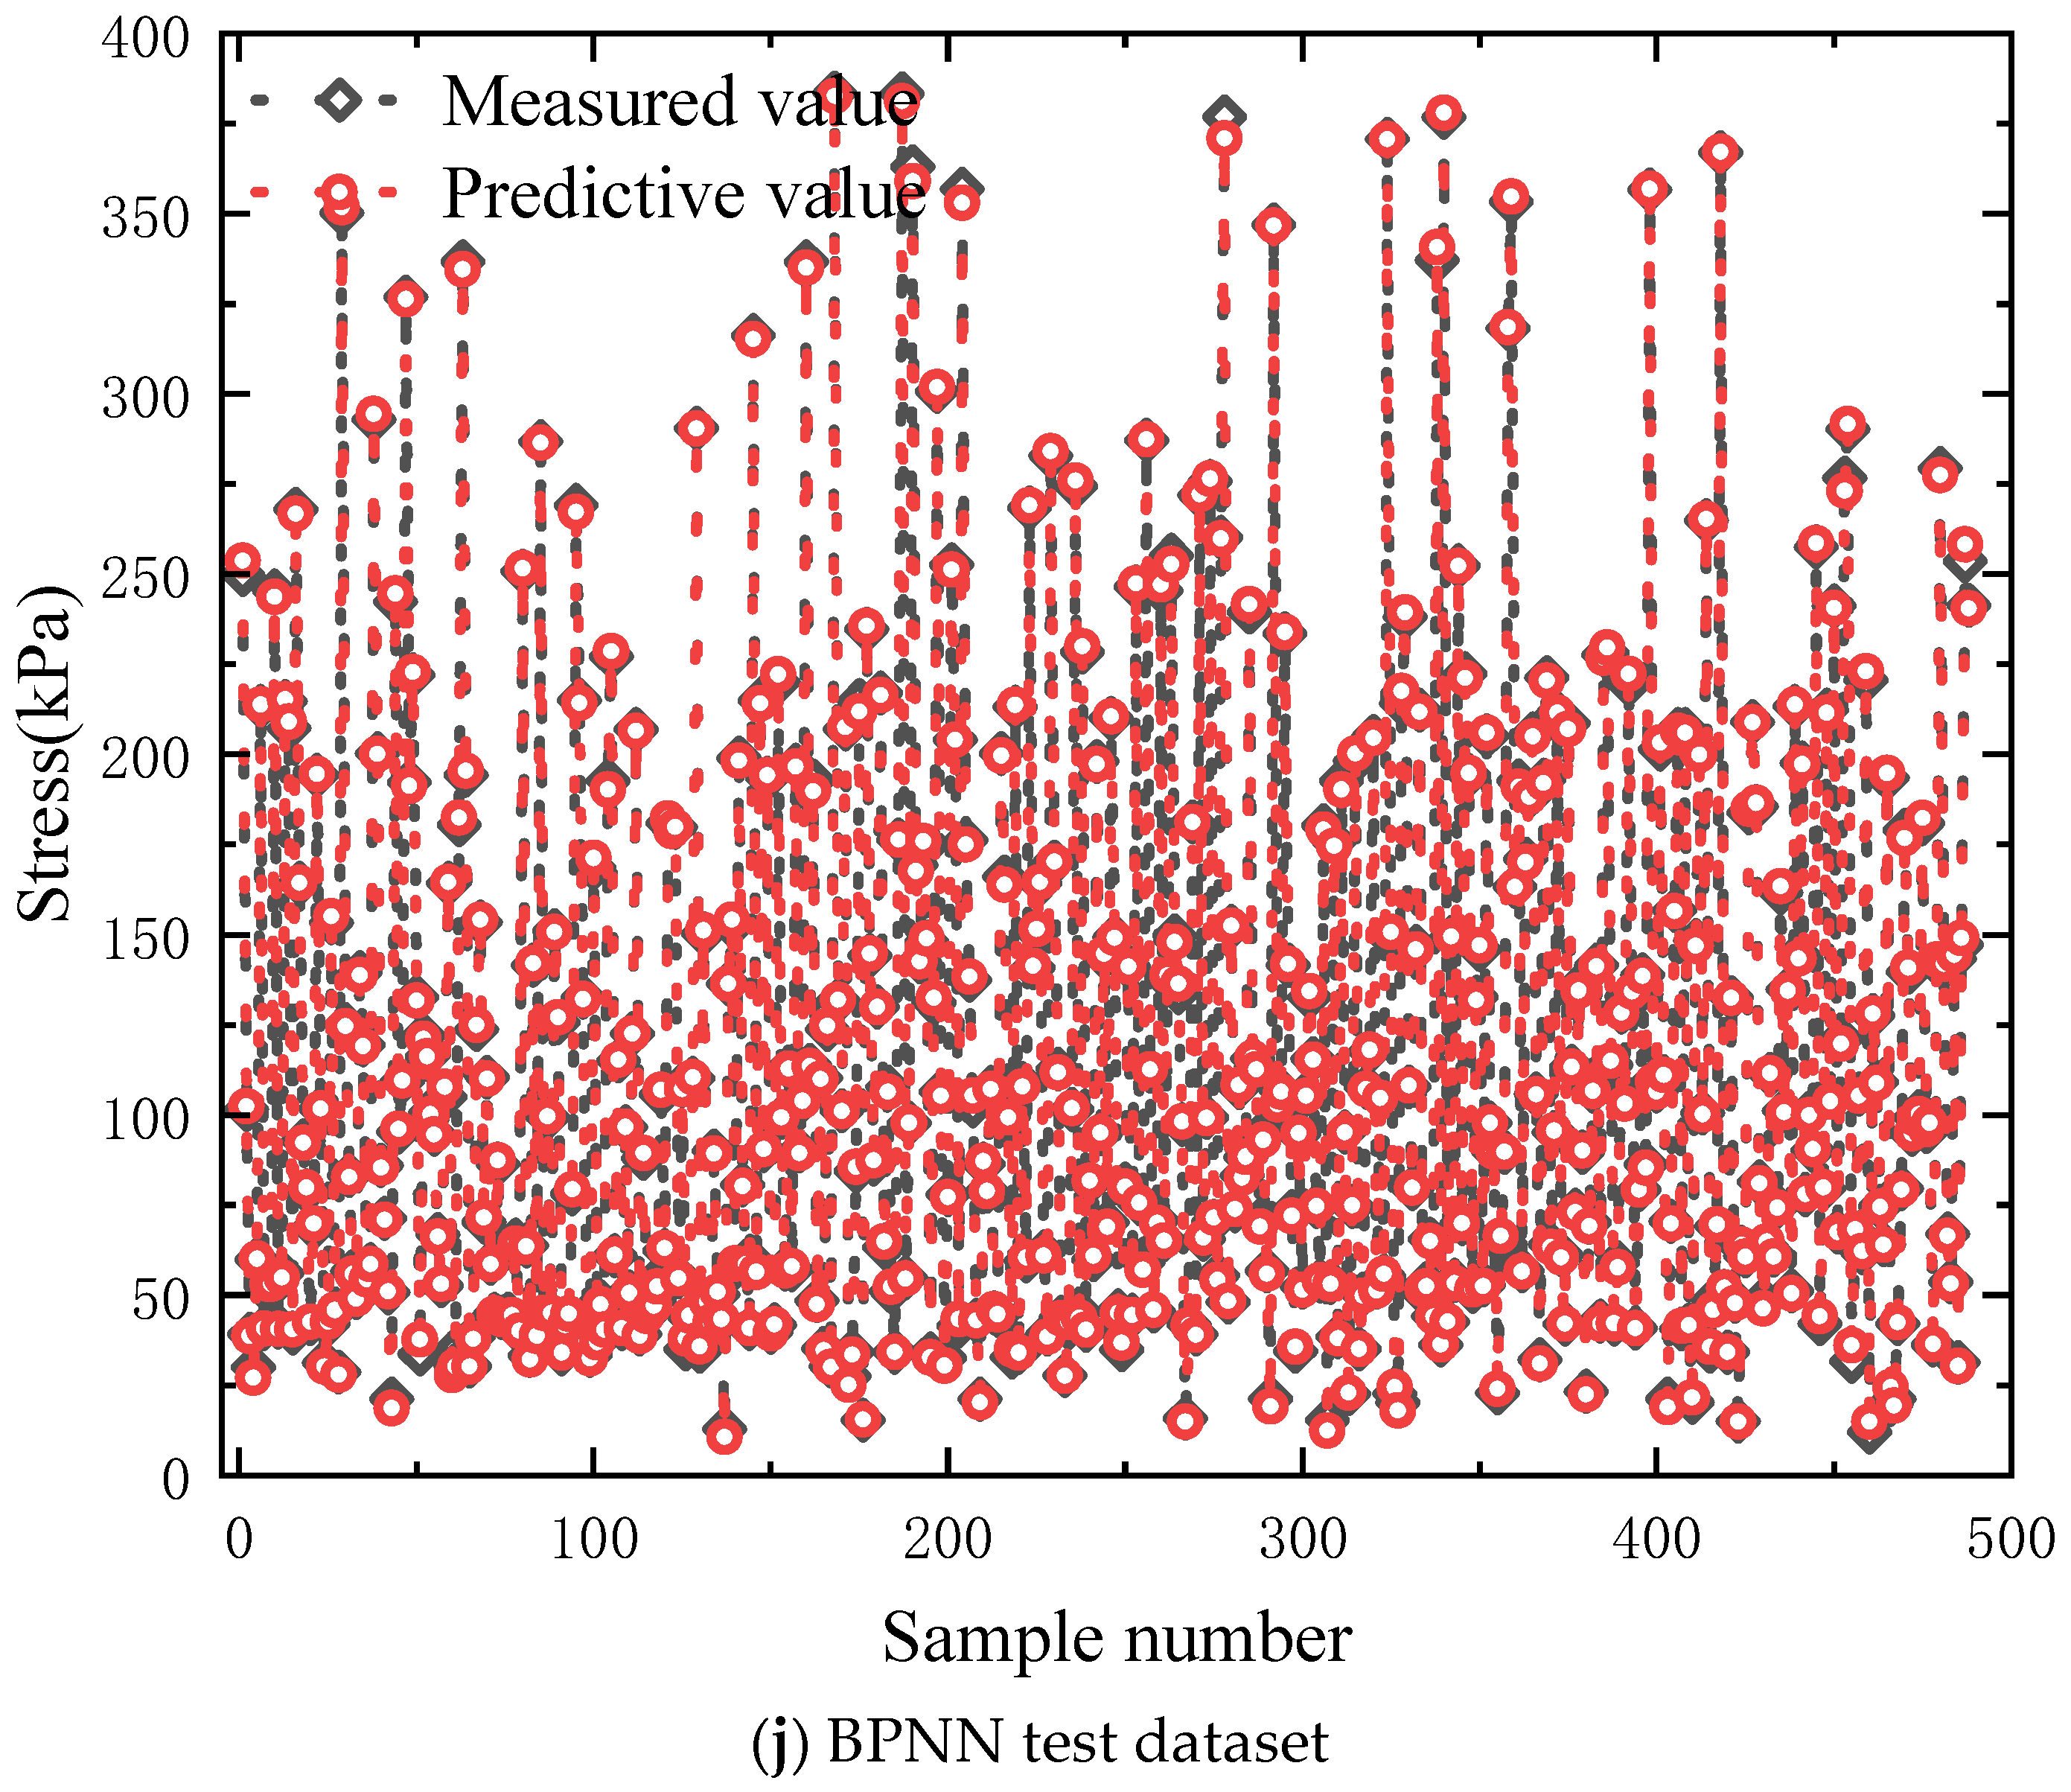
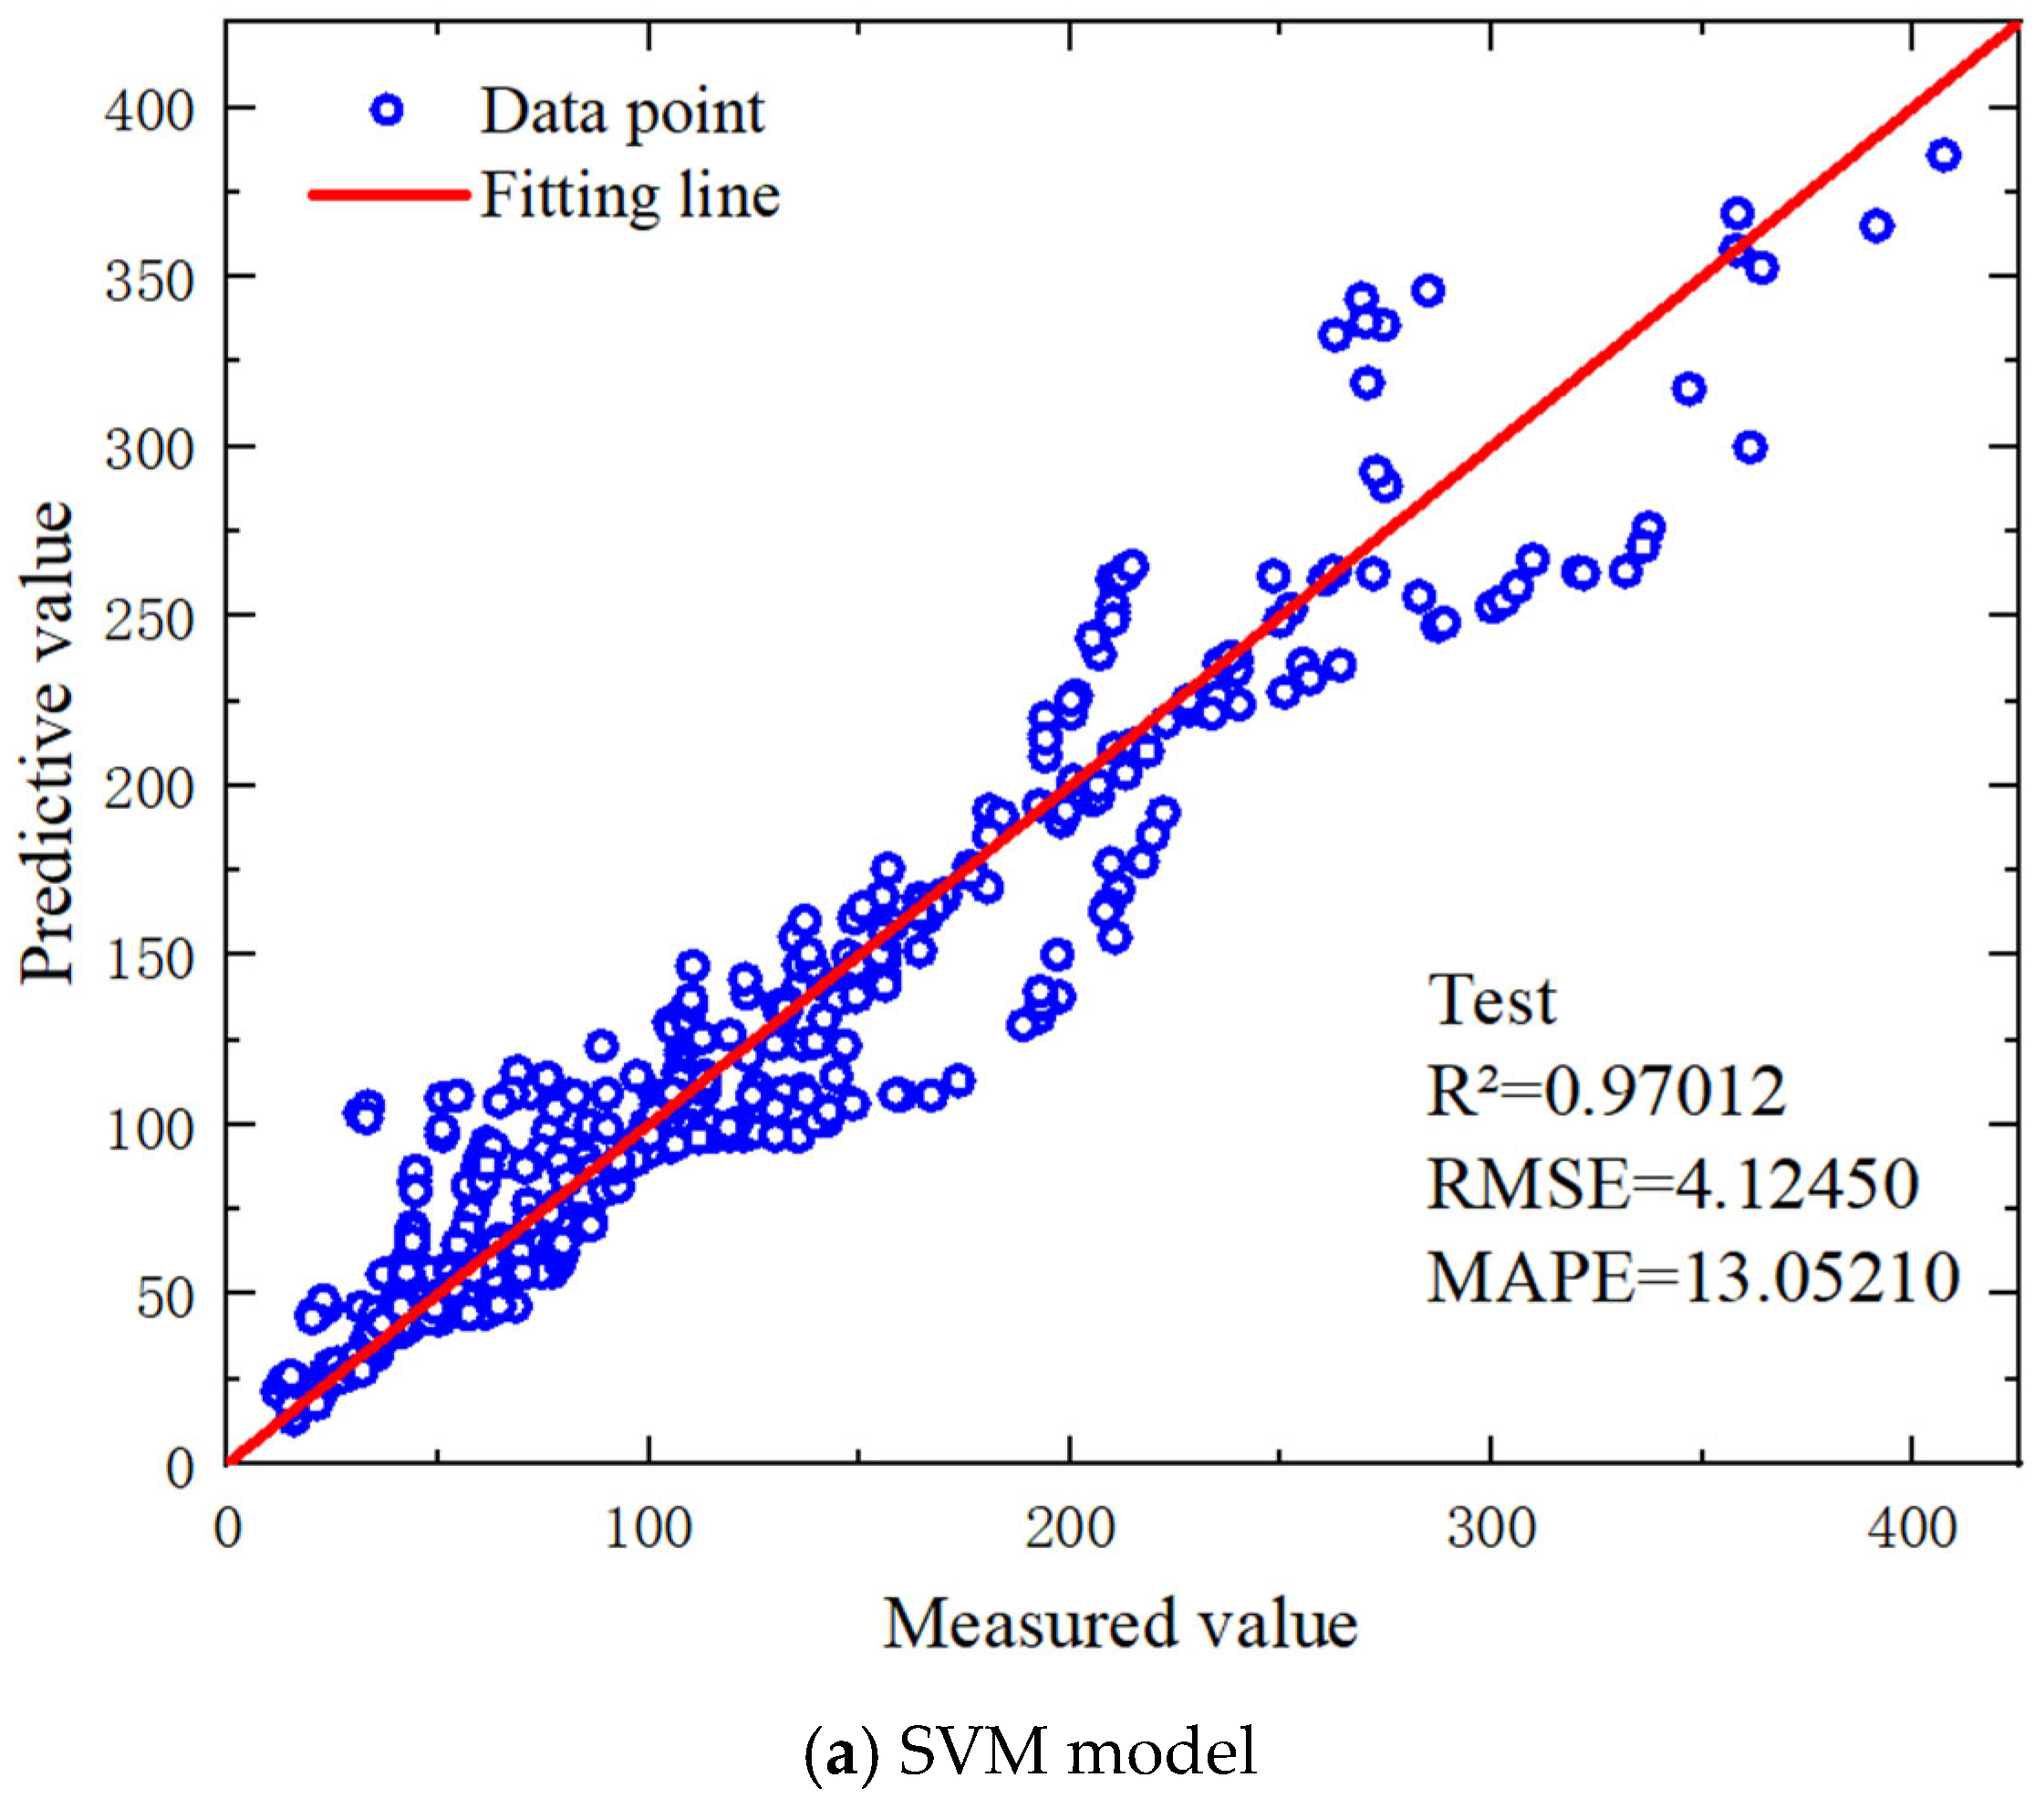
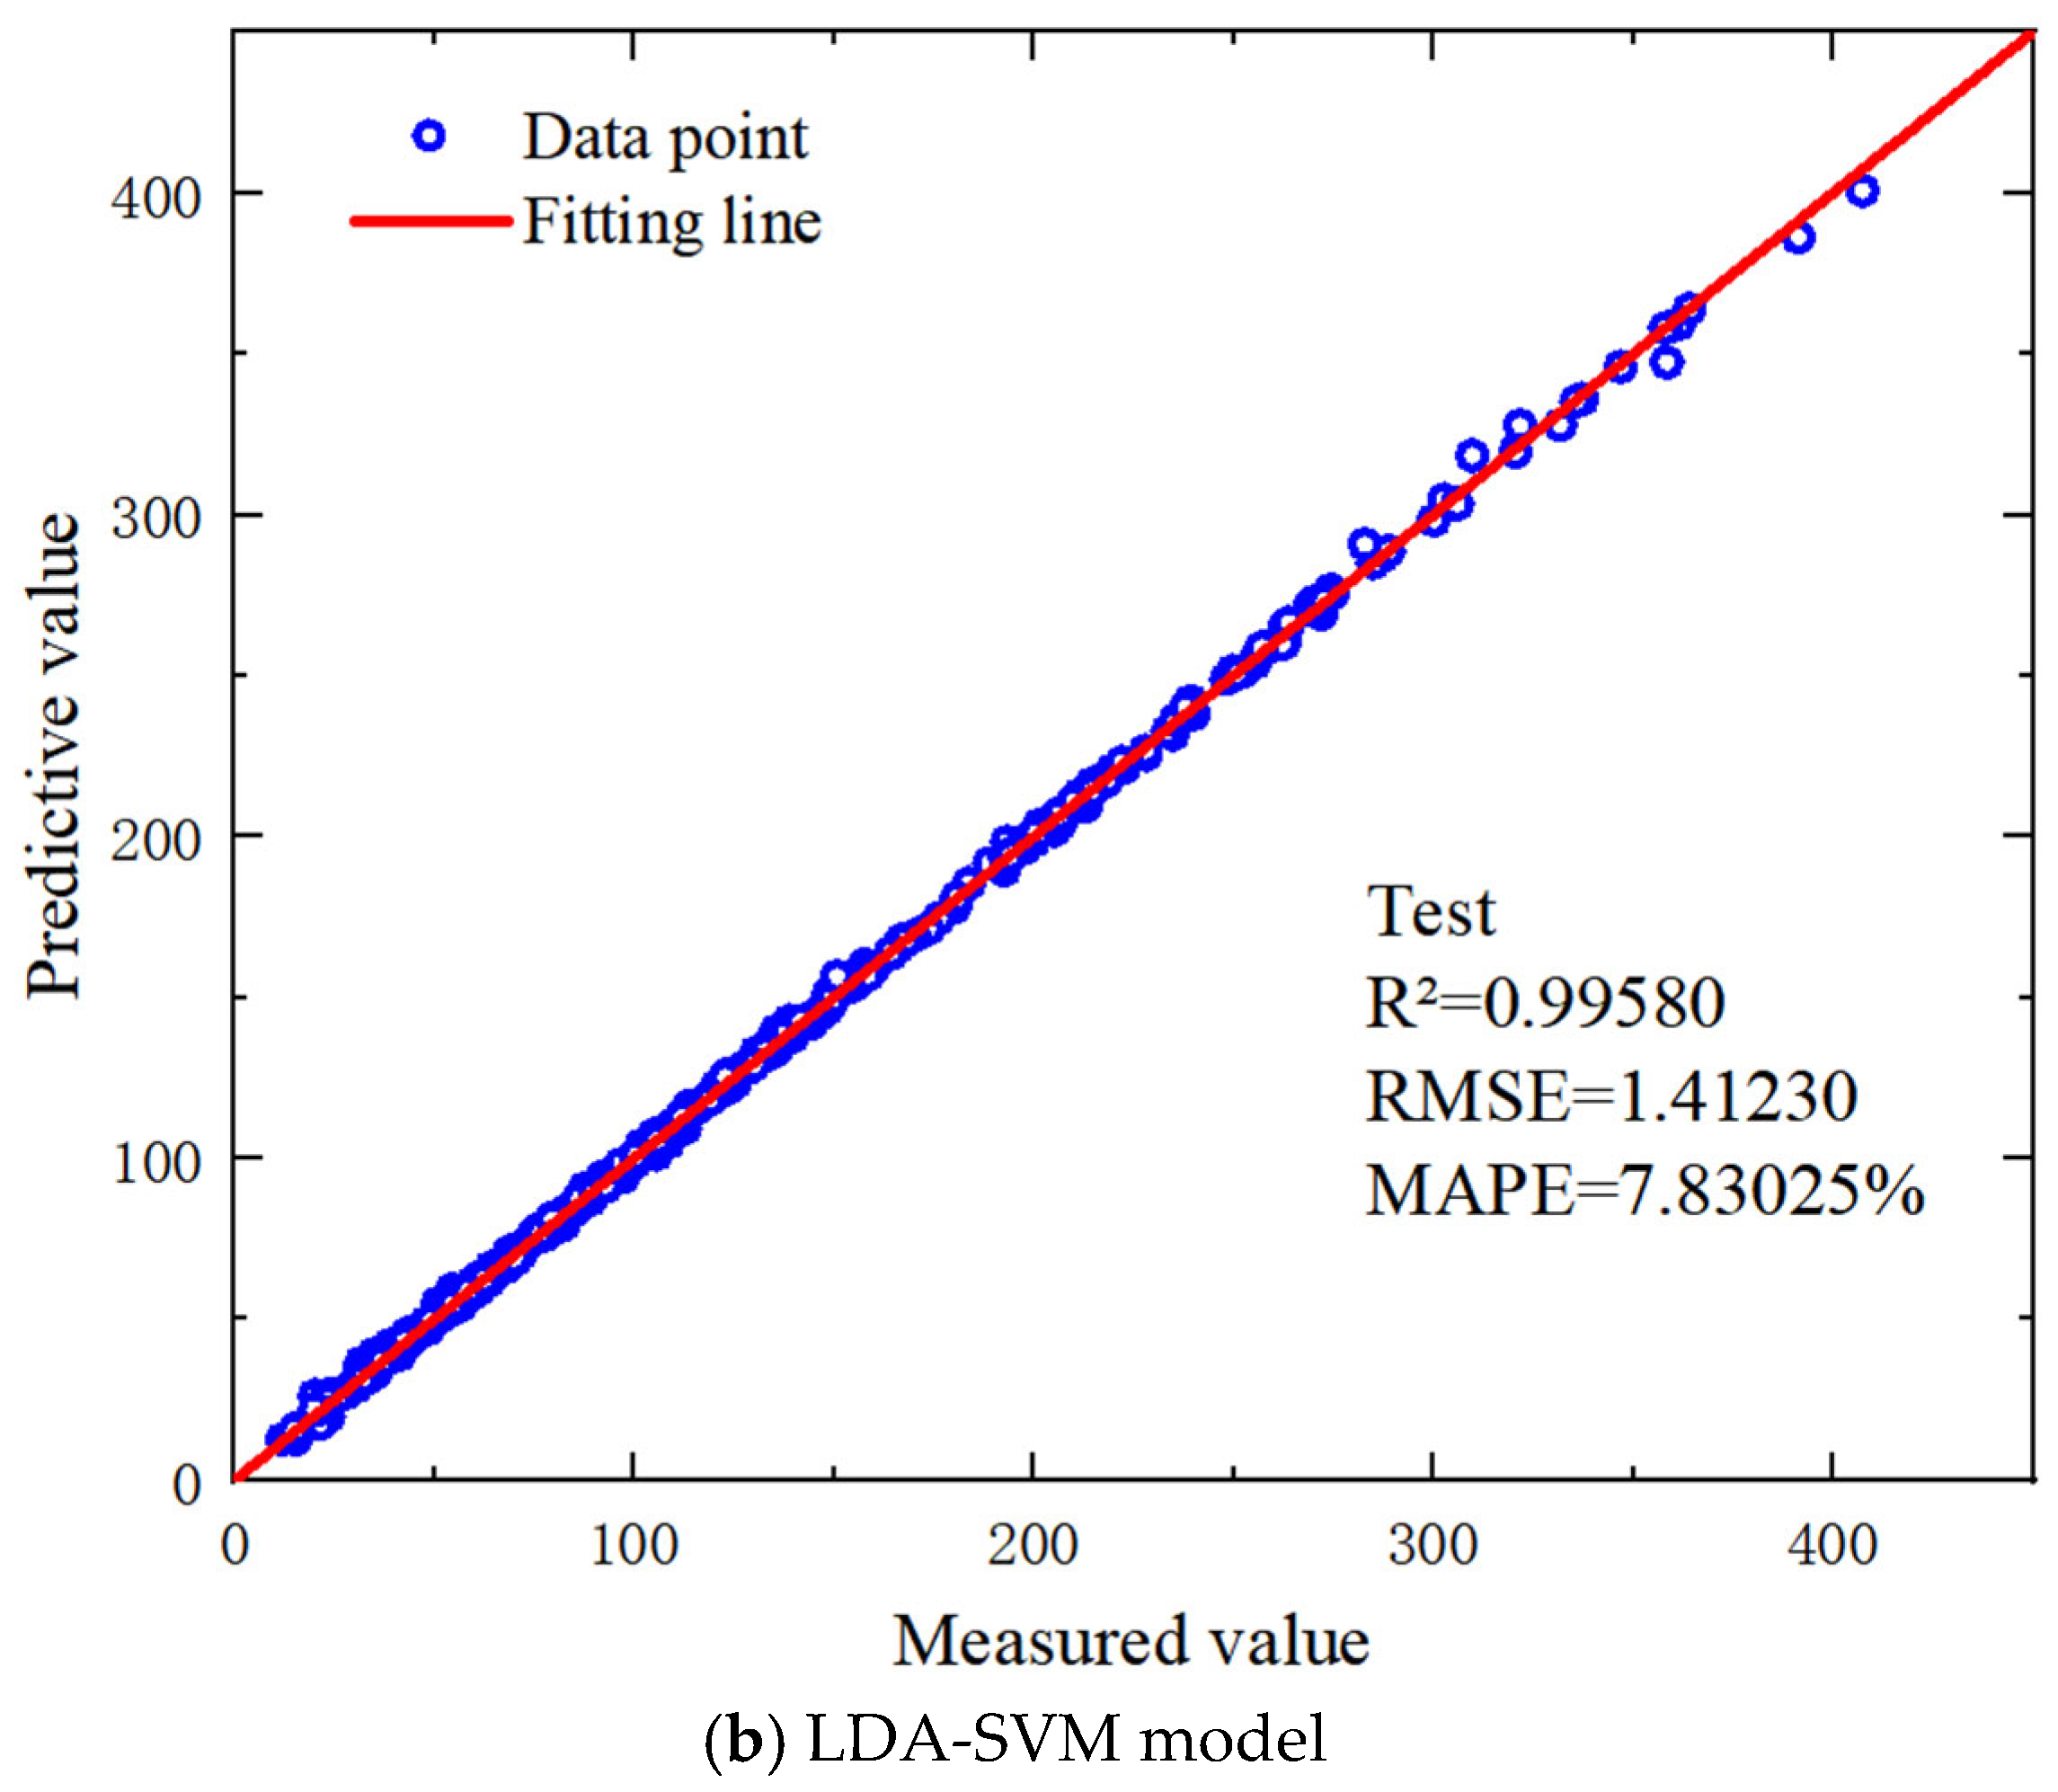
4.2. Machine Learning Predicting Performances
4.3. Sensitivity Analysis
4.4. Empirical Formulas
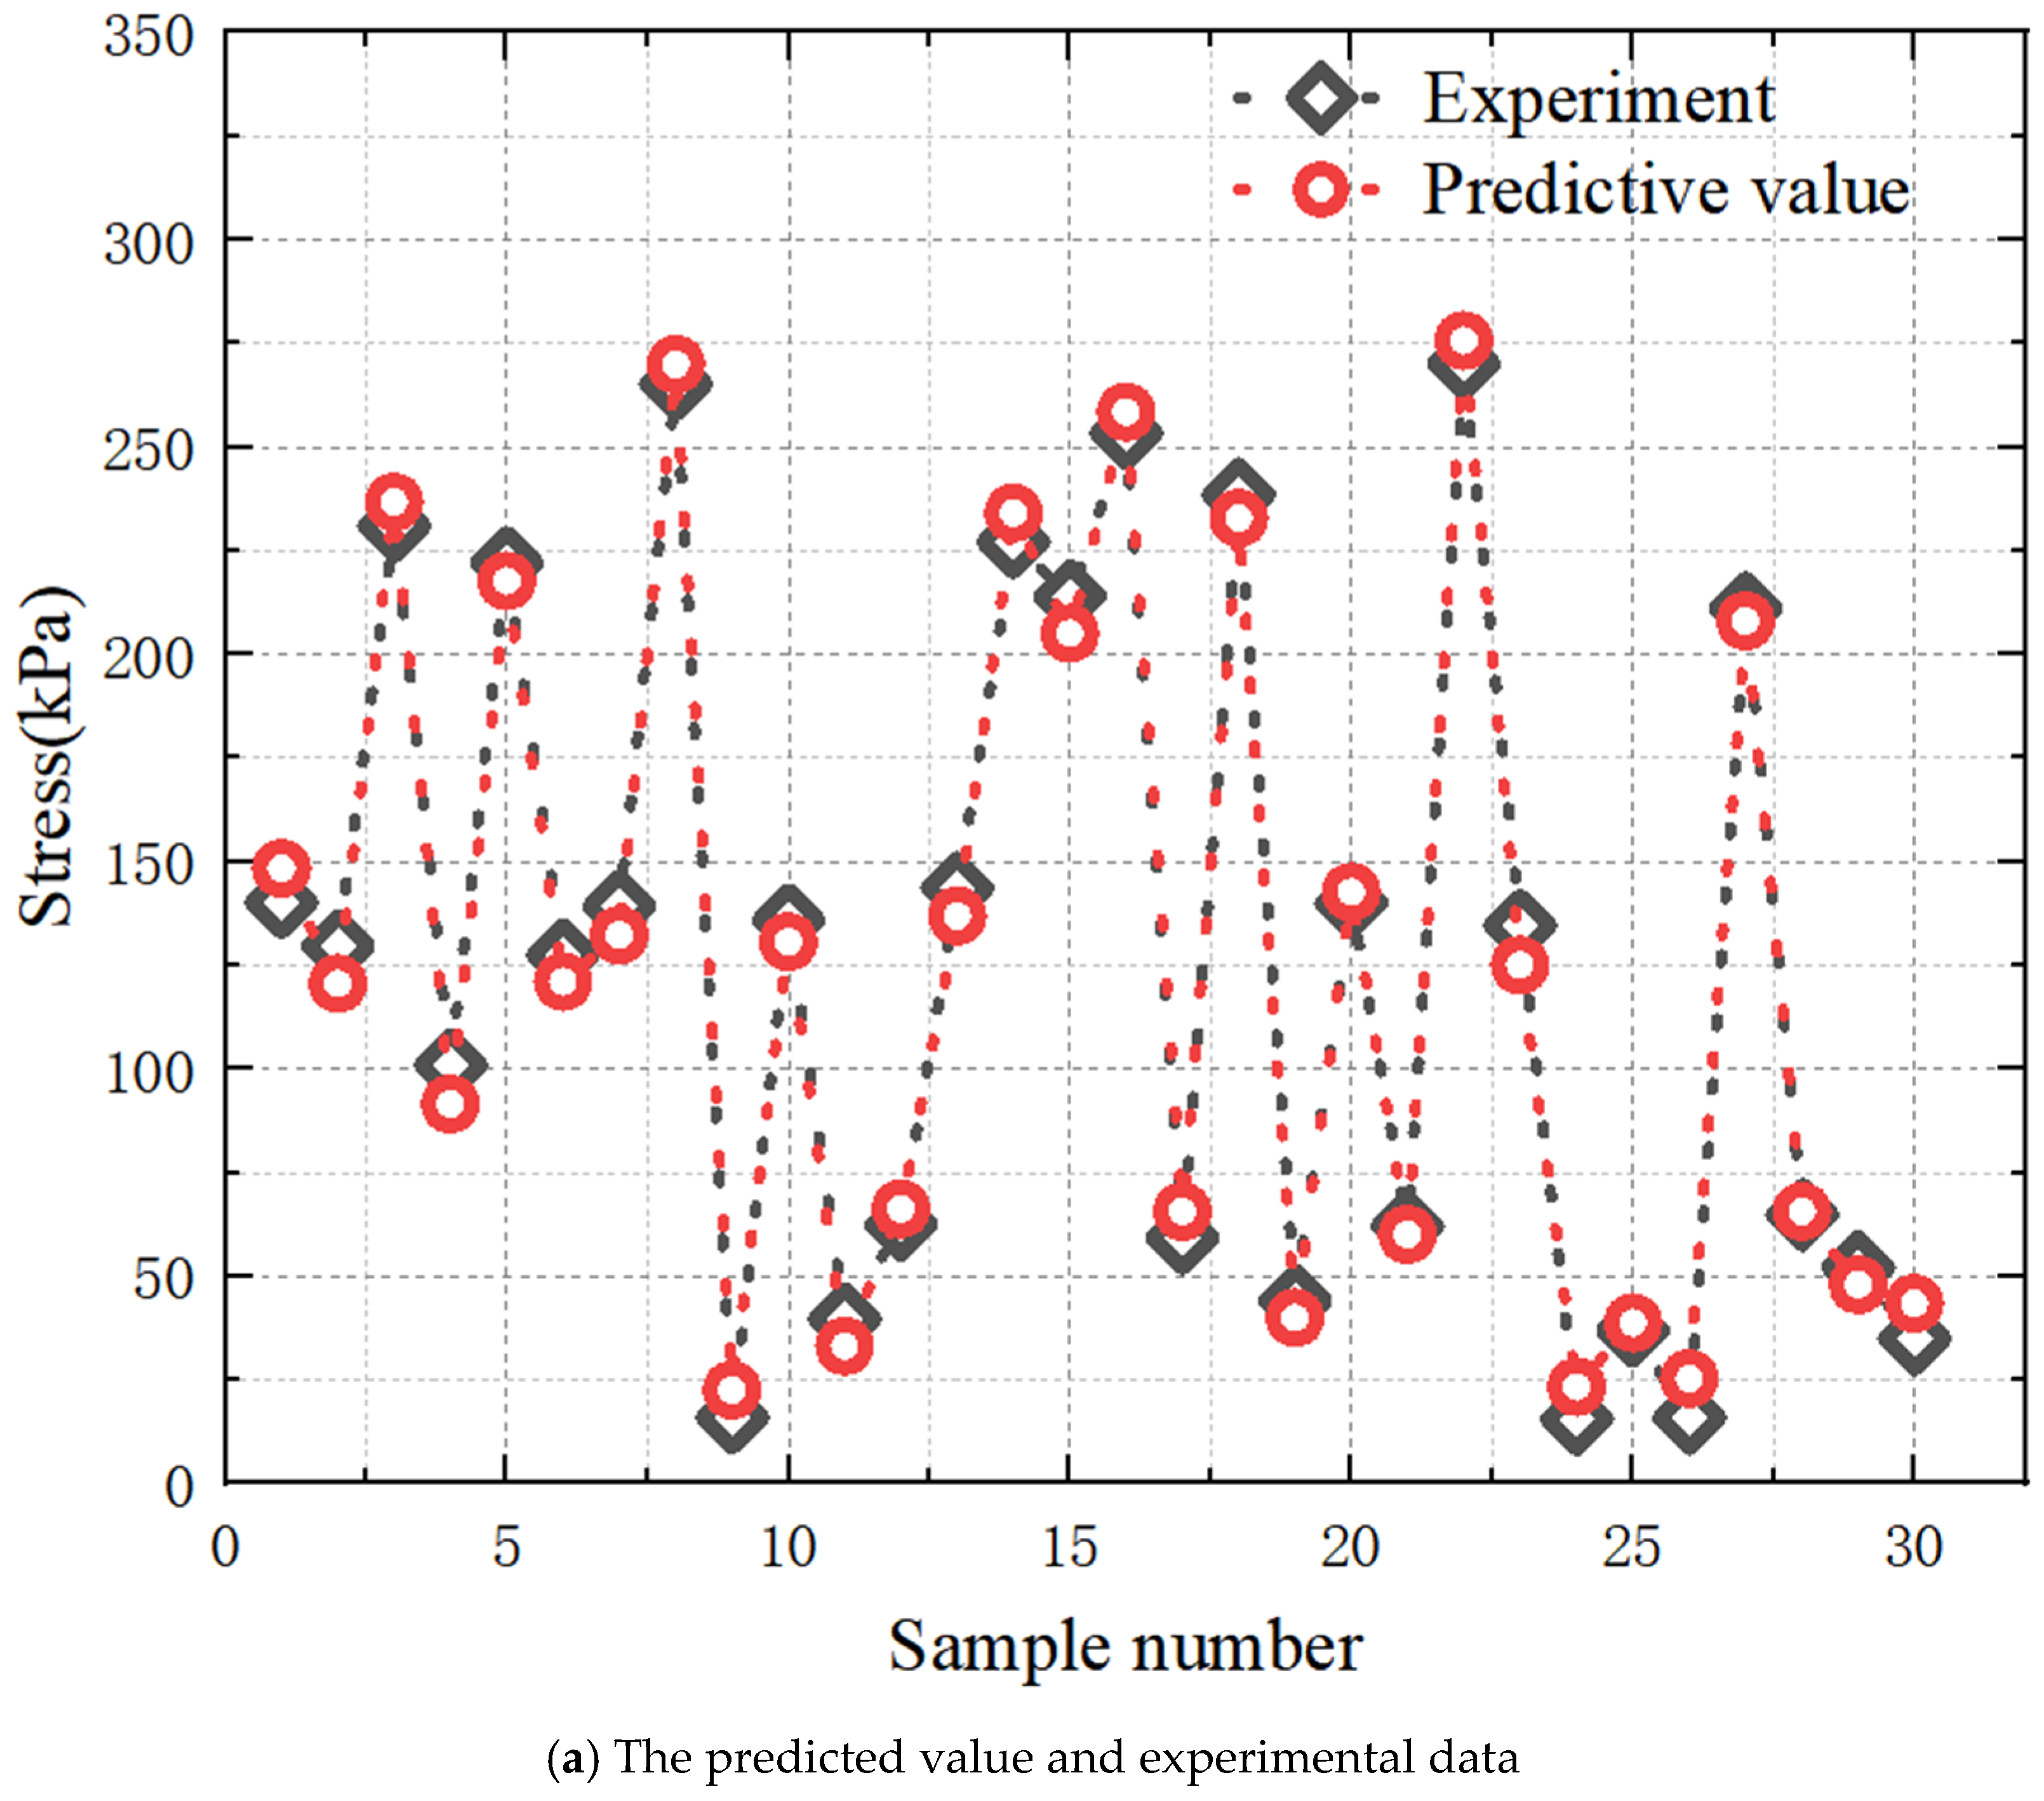
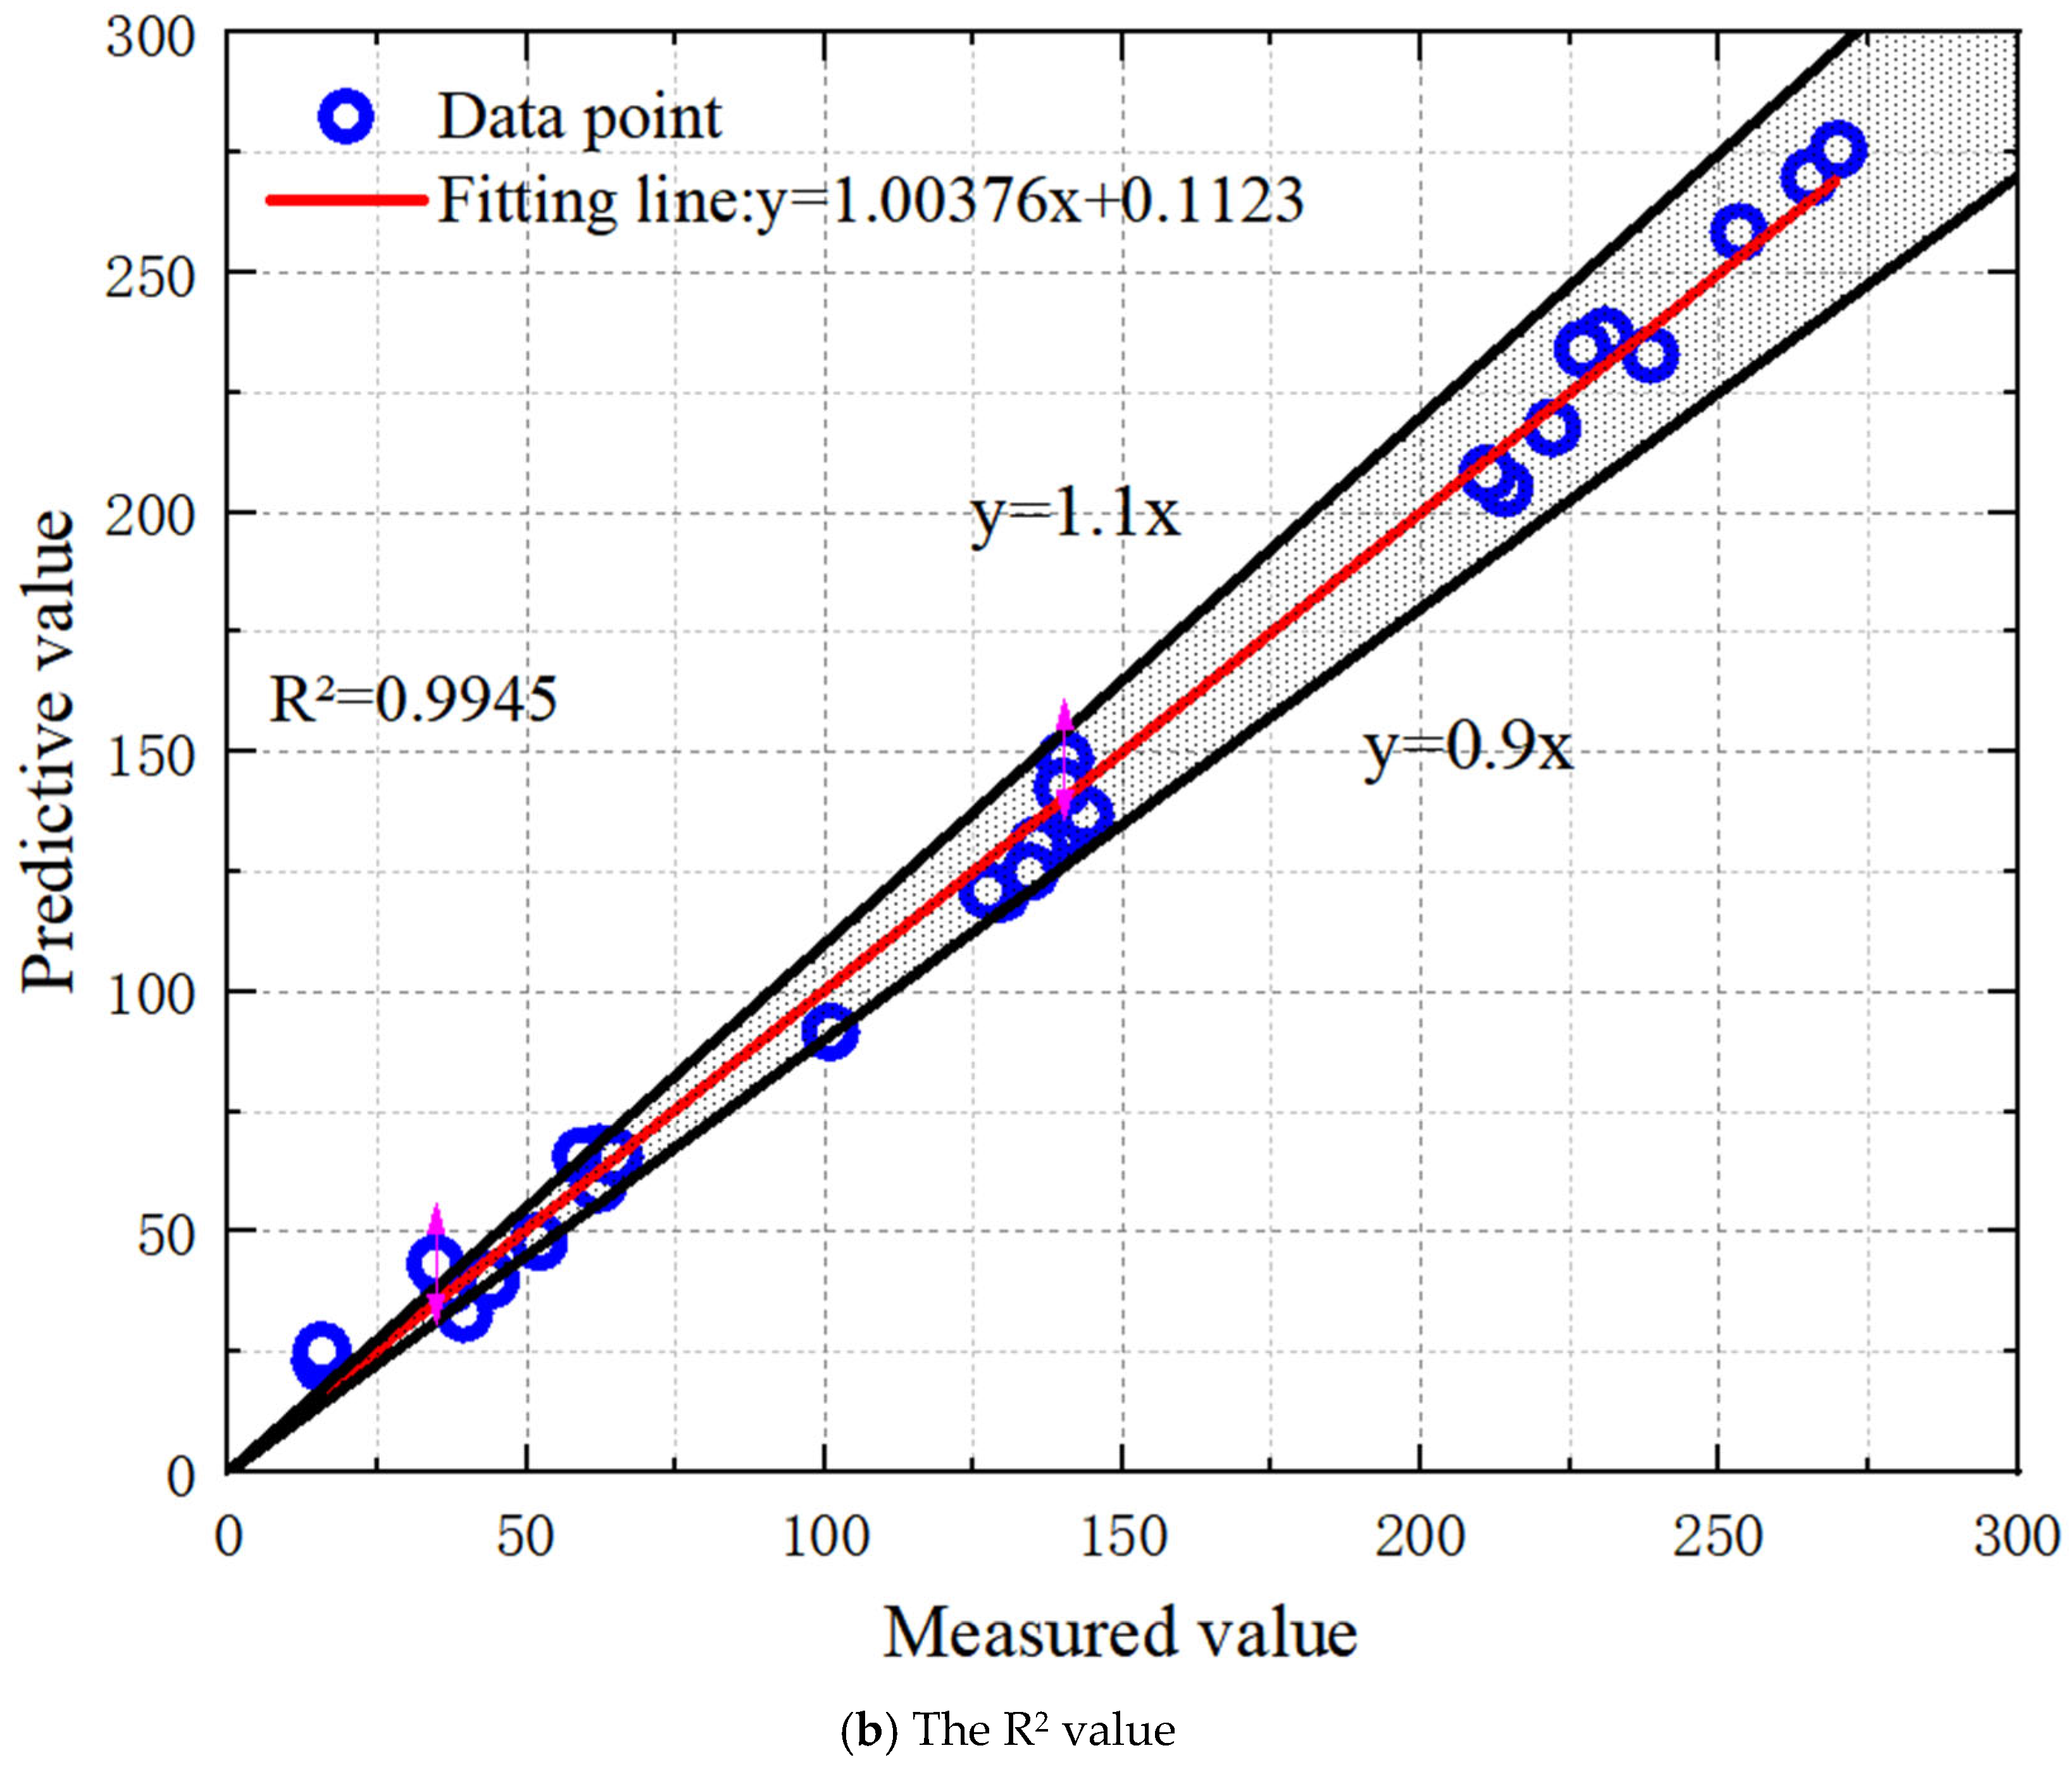
4.5. Experimental Verifications
5. Conclusions
- (1)
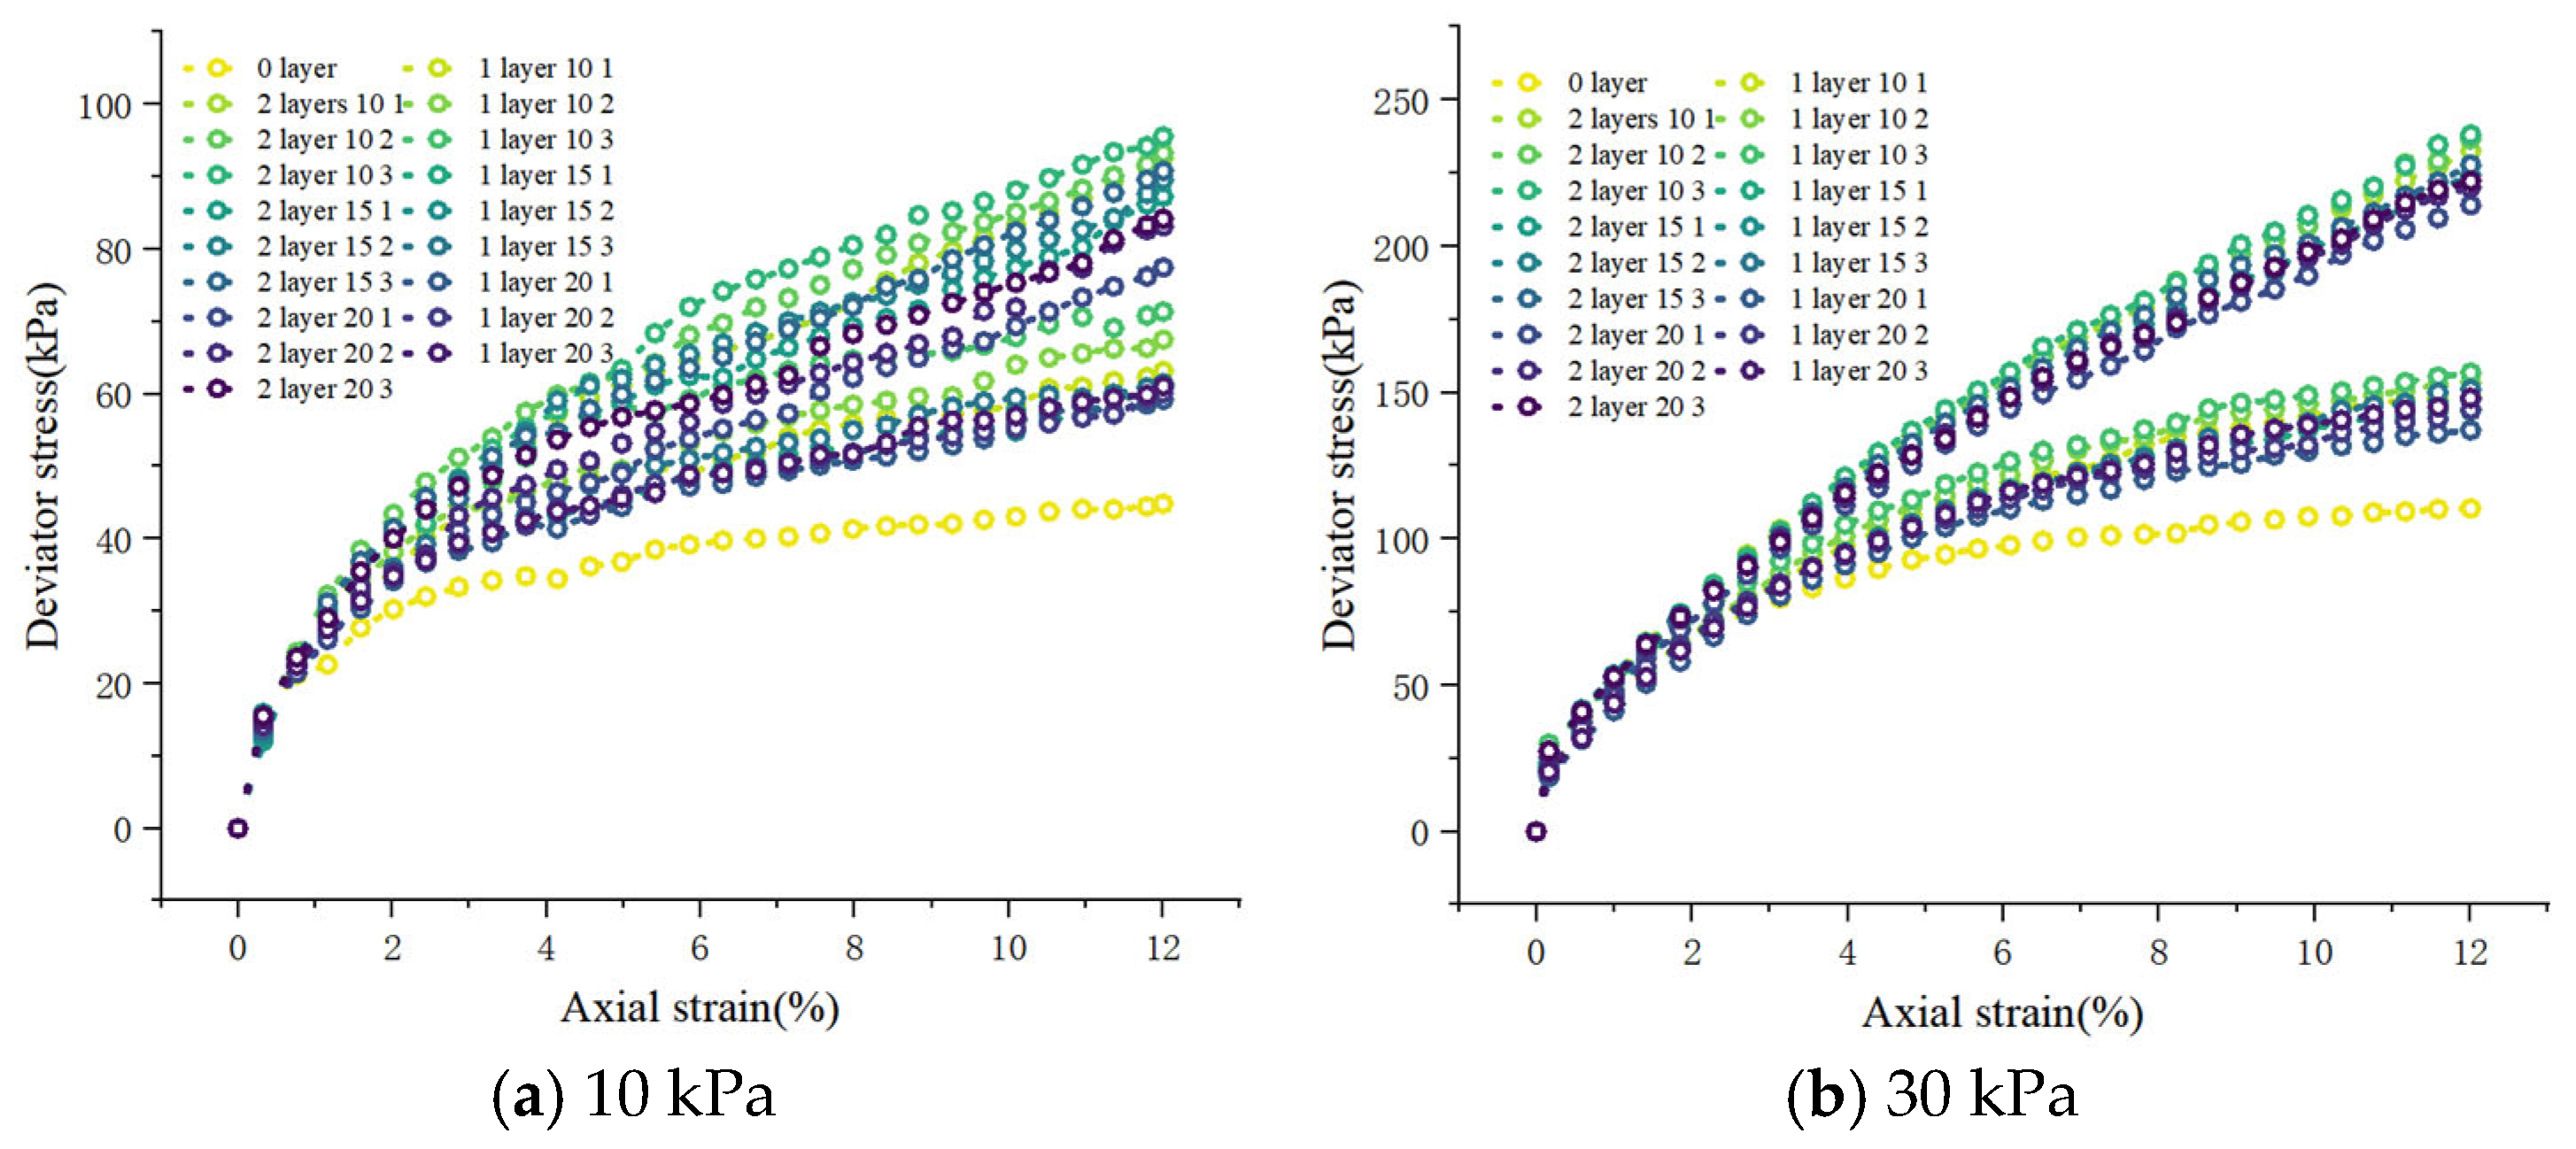
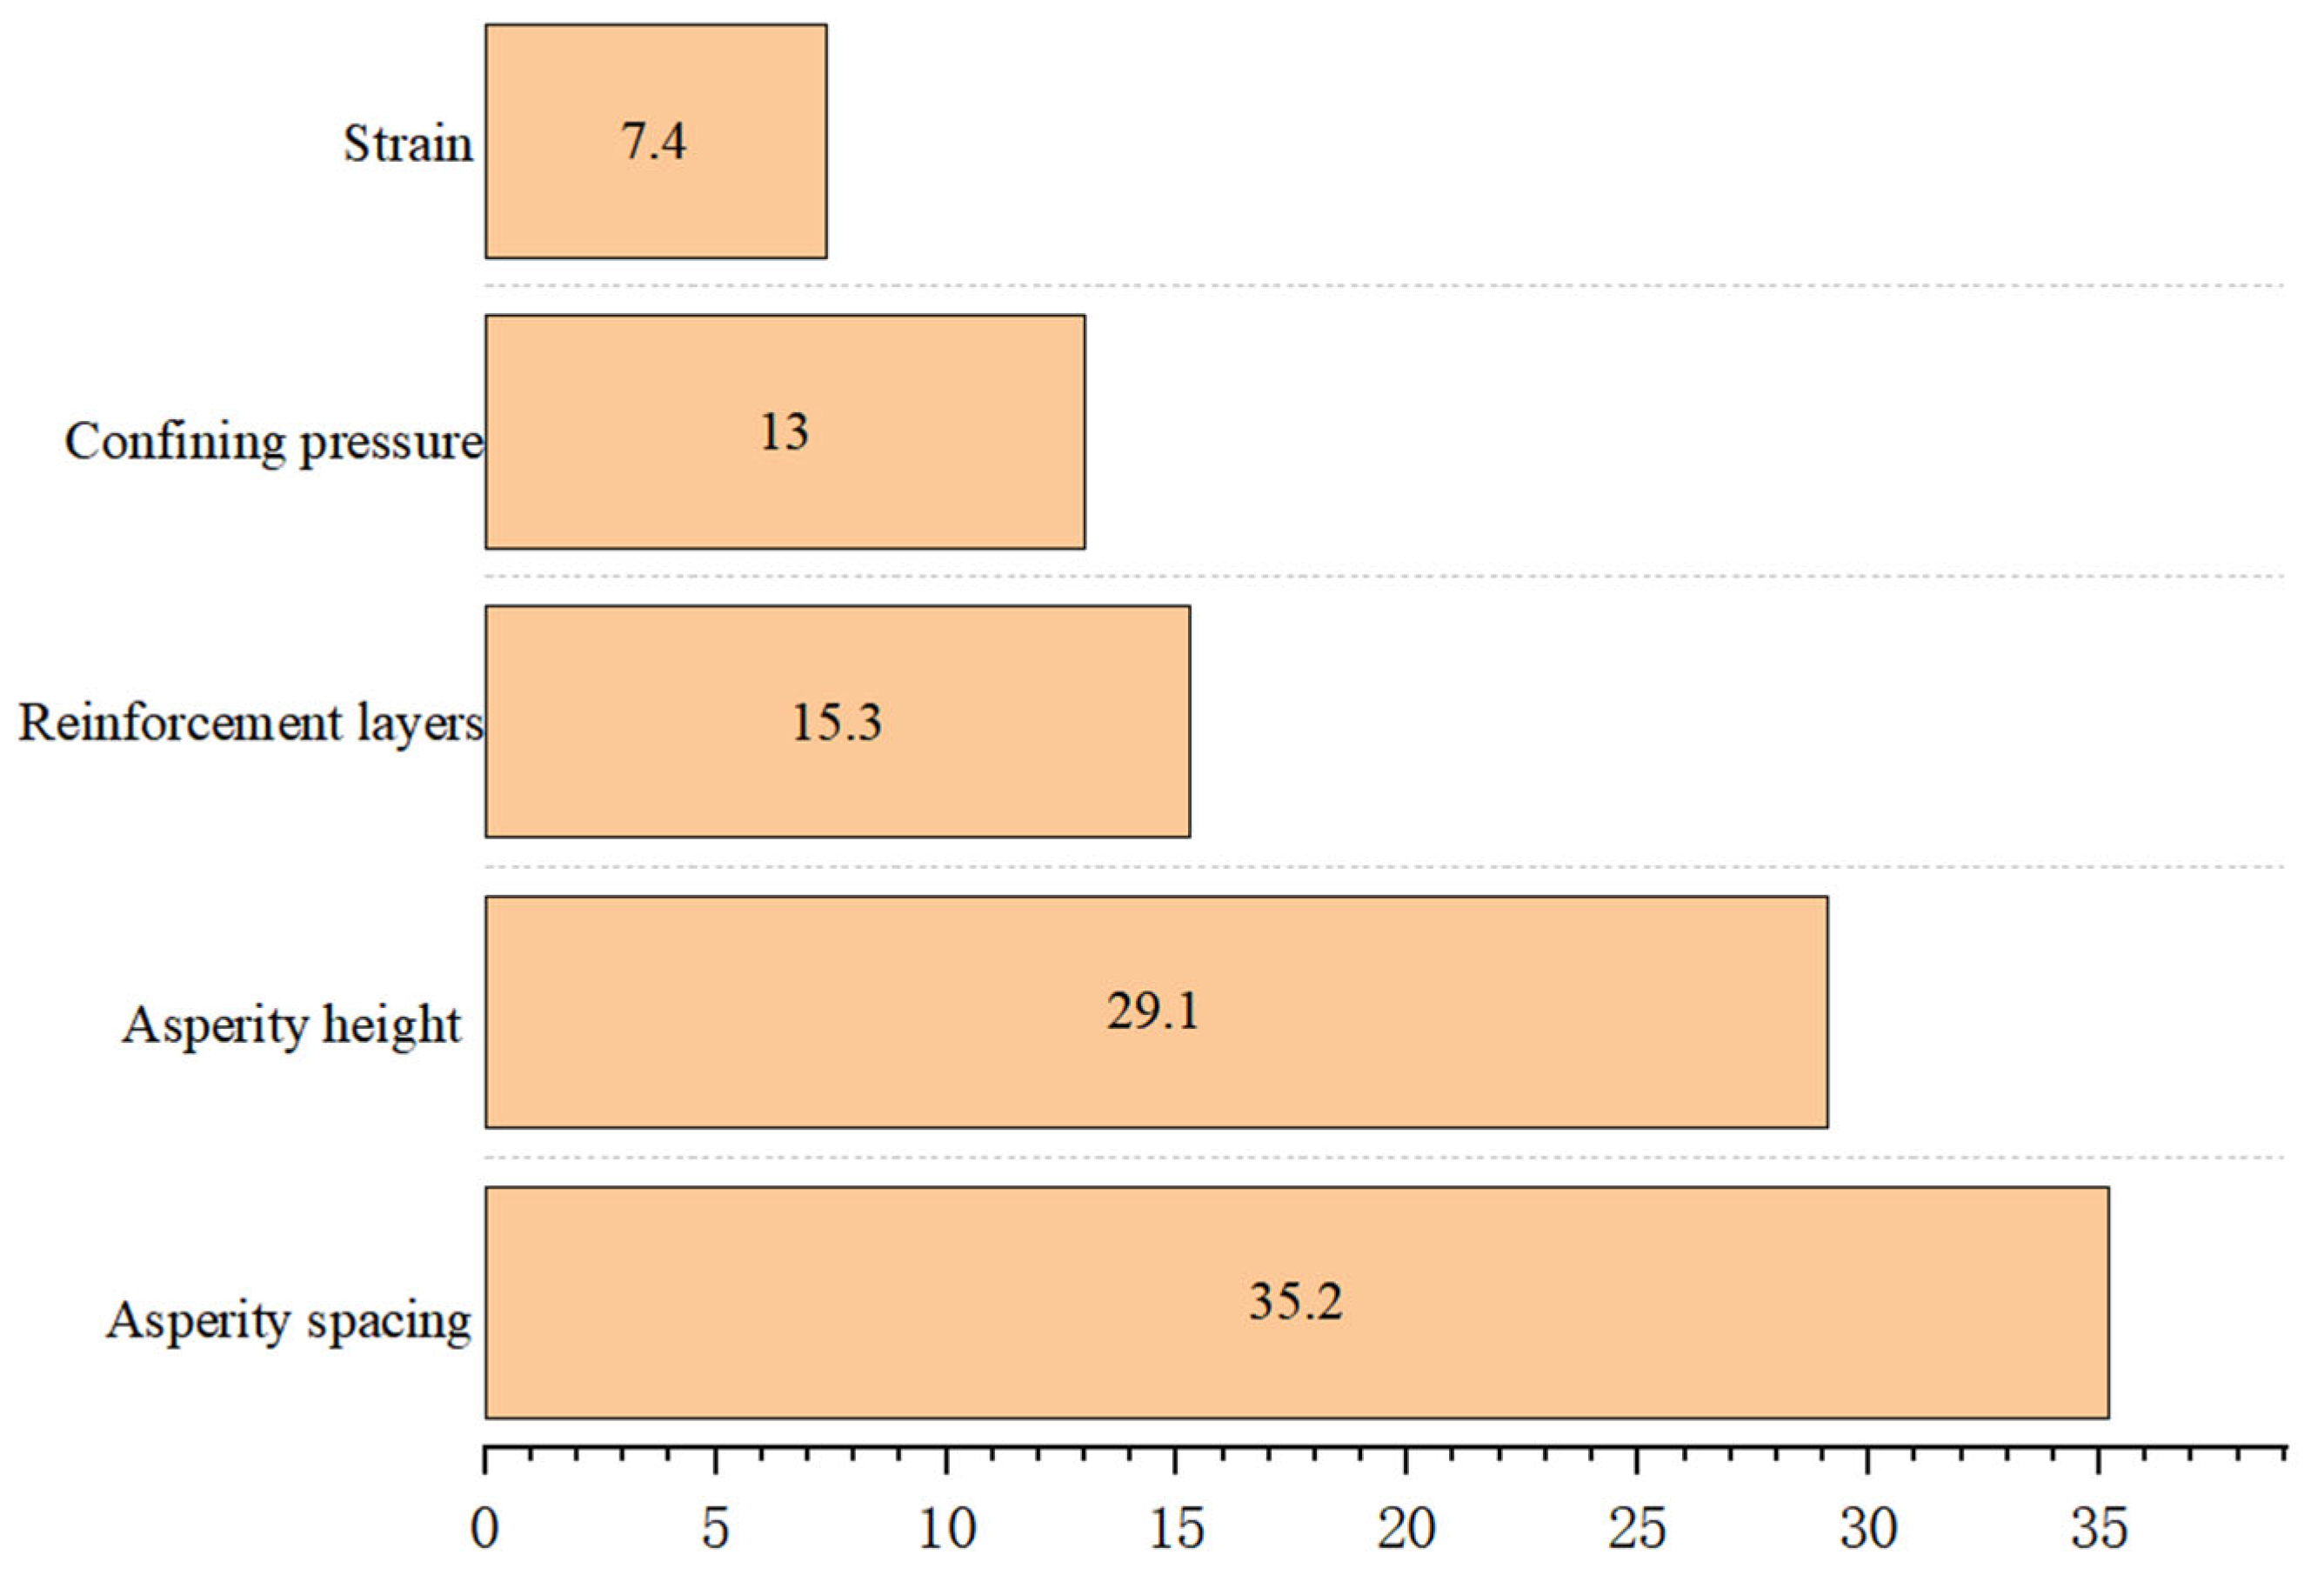
- Experimental findings show that asperity spacing, asperity height, confining pressure, reinforcement layer count, and strain are the dominant factors affecting MCCM strength. Among these, asperity spacing and height notably enhance strength. These insights can assist in optimizing material composition and design parameters in engineering practice.
- (2)
- The LDA-SVM model demonstrated superior accuracy and generalization in predicting MCCM strength, outperforming benchmark models such as SVM, GA-SVM, and PSO-SVM by achieving lower RMSE values. This highlights the benefit of combining the Logic Development Algorithm (LDA) with Support Vector Machines (SVM) in complex marine geotechnical modeling.
- (3)
- Sensitivity analysis identified asperity spacing as the most influential factor on MCCM strength, followed by asperity height and confining pressure. This knowledge supports prioritizing critical design parameters for efficient engineering management.
- (4)
- The empirical formula derived provides clear interpretability and practical value, enabling accurate strength prediction without requiring advanced machine learning tools. This approach benefits engineers with limited ML background and supports decision-making when computational resources are limited.
6. Limitations
Author Contributions
Funding
Data Availability Statement
Conflicts of Interest
References
- Wu, Q.; Liu, Q.; Zhuang, H.; Xu, C.; Chen, G. Experimental investigation of dynamic shear modulus of saturated marine coral sand. Ocean Eng. 2022, 264, 112412. [Google Scholar] [CrossRef]
- Wu, Q.; Liu, Q.; Zhuang, H.; Chen, G.; Du, X. Liquefaction characteristics of saturated marine coral sand with different non-plastic fines content subjected to complex cyclic stress paths. Ocean Eng. 2023, 281, 114794. [Google Scholar] [CrossRef]
- Akosah, S.; Zhou, L.; Chen, J.; Yao, T.; Gidigasu, S.S. Undrained dynamic behavior of geogrid-reinforced coral sand. Mar. Georesour. Geotechnol. 2025, 43, 244–259. [Google Scholar] [CrossRef]
- Shahnazari, H.; Rezvani, R. Effective parameters for the particle breakage of calcareous sands: An experimental study. Eng. Geol. 2013, 159, 98–105. [Google Scholar] [CrossRef]
- Yang, Z.; Qin, Y.; Xue, C.; Xiao, X.; Ding, J.; Chen, G. Experimental study on the generalized dynamic modulus of saturated marine coral sand subjected to different cyclic loading patterns. Ocean Eng. 2024, 310, 118507. [Google Scholar] [CrossRef]
- Wu, Q.; Ding, X.; Zhang, Y.; Chen, Z.; Zhang, Y. Numerical simulations on seismic response of soil-pile-superstructure in coral sand. Ocean Eng. 2021, 239, 109808. [Google Scholar] [CrossRef]
- Wang, X.-Z.; Jiao, Y.-Y.; Wang, R.; Hu, M.-J.; Meng, Q.-S.; Tan, F.-Y. Engineering characteristics of the calcareous sand in Nansha Islands, South China Sea. Eng. Geol. 2011, 120, 40–47. [Google Scholar] [CrossRef]
- Prakasha, K.; Chandrasekaran, V. Behavior of marine sand-clay mixtures under static and cyclic triaxial shear. J. Geotech. Geoenviron. Eng. 2005, 131, 213–222. [Google Scholar] [CrossRef]
- Bray, N.; Cohen, M. Dredging for Development; International Association of Dredging Companies: Hague, The Netherlands, 2004. [Google Scholar]
- Bose, B.P.; Dhar, M. Dredged sediments are one of the valuable resources: A review. Int. J. Earth Sci. Knowl. Appl. 2022, 4, 324–331. [Google Scholar]
- Xu, D.-s.; Huang, M.; Zhou, Y. One-dimensional compression behavior of calcareous sand and marine clay mixtures. Int. J. Geomech. 2020, 20, 04020137. [Google Scholar] [CrossRef]
- Chen, J.; Bao, N.; Ma, C.; Sun, R. Triaxial behavior of unreinforced and geogrid-reinforced calcareous gravelly sand: Experiment and discrete element modelling. Constr. Build. Mater. 2024, 430, 136405. [Google Scholar] [CrossRef]
- Chen, X.; Dai, G.; Liu, H.; Ouyang, H.; Gong, W. A microstructural investigation on hydraulic conductivity of calcareous clay. Appl. Ocean Res. 2024, 150, 104133. [Google Scholar] [CrossRef]
- Wang, S.; Zhou, Z.; Liu, P.; Yang, Z.; Pan, Q.; Chen, W. On the critical particle size of soil with clogging potential in shield tunneling. J. Rock Mech. Geotech. Eng. 2023, 15, 477–485. [Google Scholar] [CrossRef]
- Gao, J.; Zhu, G.; Wang, J.; Yang, Y.; Li, Y. Study on the dynamic characteristics of geogrids combined with rubber particles reinforced with calcareous sand. Acta Geotech. 2024, 19, 7031–7047. [Google Scholar] [CrossRef]
- Shen, J.-H.; Hu, M.-J.; Wang, X.; Zhang, C.-Y.; Xu, D.-S. SWCC of calcareous silty sand under different fines contents and dry densities. Front. Environ. Sci. 2021, 9, 682907. [Google Scholar] [CrossRef]
- Ding, X.-M.; Luo, Z.-G.; Ou, Q. Mechanical property and deformation behavior of geogrid reinforced calcareous sand. Geotext. Geomembr. 2022, 50, 618–631. [Google Scholar] [CrossRef]
- Landivar Macias, A.; Jacobsen, S.D.; Rotta Loria, A.F. Electrodeposition of calcareous cement from seawater in marine silica sands. Commun. Earth Environ. 2024, 5, 442. [Google Scholar] [CrossRef]
- Chao, Z.; Shi, D.; Fowmes, G.; Xu, X.; Yue, W.; Cui, P.; Hu, T.; Yang, C. Artificial intelligence algorithms for predicting peak shear strength of clayey soil-geomembrane interfaces and experimental validation. Geotext. Geomembr. 2023, 51, 179–198. [Google Scholar] [CrossRef]
- Zhang, W.; Li, H.; Shi, D.; Shen, Z.; Zhao, S.; Guo, C. Determination of Safety Monitoring Indices for Roller-Compacted Concrete Dams Considering Seepage–Stress Coupling Effects. Mathematics 2023, 11, 3224. [Google Scholar] [CrossRef]
- Han, X.; Wang, X.; Zhu, Y.; Huang, J.; Yang, L.; Chang, Z.; Fu, F. An experimental study on concrete and geomembrane lining effects on canal seepage in arid agricultural areas. Water 2020, 12, 2343. [Google Scholar] [CrossRef]
- Xu, G.; Shi, J.; Li, Y. Change pattern of geomembrane surface roughness for geotextile/textured geomembrane interfaces. Geotext. Geomembr. 2023, 51, 88–99. [Google Scholar] [CrossRef]
- Wang, X.; Cui, J.; Wu, Y.; Zhu, C.; Wang, X. Mechanical properties of calcareous silts in a hydraulic fill island-reef. Mar. Georesour. Geotechnol. 2021, 39, 1–14. [Google Scholar] [CrossRef]
- Rowe, R.K.; Fan, J. Effect of geomembrane hole geometry on leakage overlain by saturated tailings. Geotext. Geomembr. 2021, 49, 1506–1518. [Google Scholar] [CrossRef]
- Han, S.; Jung, S.; Na, W.-B. Estimation of seabed settlement during initial installation of a box-type artificial reef considering different seabed soil compositions and incident angles. Ocean Eng. 2020, 218, 108269. [Google Scholar] [CrossRef]
- Monteiro, C.; Araújo, G.; Palmeira, E.; Cordão Neto, M. Soil-geosynthetic interface strength on smooth and texturized geomembranes under different test conditions. In Proceedings of the 18th International Conference on Soil Mechanics and Geotechnical Engineering, Paris, France, 2–5 September 2013. [Google Scholar]
- Bacas, B.M.; Konietzky, H.; Berini, J.C.; Sagaseta, C. A new constitutive model for textured geomembrane/geotextile interfaces. Geotext. Geomembr. 2011, 29, 137–148. [Google Scholar] [CrossRef]
- Junior, S.L.d.C.; Aparicio-Ardila, M.A.; Palomino, C.F.; Lins da Silva, J. Analysis of textured geomembrane–soil interface strength to mining applications. Int. J. Geosynth. Ground Eng. 2023, 9, 3. [Google Scholar] [CrossRef]
- Chao, Z.; Fowmes, G. Modified stress and temperature-controlled direct shear apparatus on soil-geosynthetics interfaces. Geotext. Geomembr. 2021, 49, 825–841. [Google Scholar] [CrossRef]
- Mahamat, A.A.; Boukar, M.M.; Ibrahim, N.M.; Stanislas, T.T.; Linda Bih, N.; Obianyo, I.I.; Savastano, H., Jr. Machine learning approaches for prediction of the compressive strength of alkali activated termite mound soil. Appl. Sci. 2021, 11, 4754. [Google Scholar] [CrossRef]
- Chao, Z.; Fowmes, G. The short-term and creep mechanical behaviour of clayey soil-geocomposite drainage layer interfaces subjected to environmental loadings. Geotext. Geomembr. 2022, 50, 238–248. [Google Scholar] [CrossRef]
- Chao, Z.; Dang, Y.; Pan, Y.; Wang, F.; Wang, M.; Zhang, J.; Yang, C. Prediction of the shale gas permeability: A data mining approach. Geomech. Energy Environ. 2023, 33, 100435. [Google Scholar] [CrossRef]
- Rehman, Z.U.; Ijaz, N.; Ye, W.; Ijaz, Z. Design optimization and statistical modeling of recycled waste-based additive for a variety of construction scenarios on heaving ground. Environ. Sci. Pollut. Res. 2023, 30, 39783–39802. [Google Scholar] [CrossRef] [PubMed]
- ur Rehman, Z.; Khalid, U.; Ijaz, N.; Mujtaba, H.; Haider, A.; Farooq, K.; Ijaz, Z. Machine learning-based intelligent modeling of hydraulic conductivity of sandy soils considering a wide range of grain sizes. Eng. Geol. 2022, 311, 106899. [Google Scholar] [CrossRef]
- ur Rehman, Z.; Aziz, Z.; Khalid, U.; Ijaz, N.; ur Rehman, S.; Ijaz, Z. Artificial intelligence-driven enhanced CBR modeling of sandy soils considering broad grain size variability. J. Rock Mech. Geotech. Eng. 2024, 17, 3161–3179. [Google Scholar] [CrossRef]
- Ur Rehman, Z.; Hussain, S.; Tahir, M.; Sherin, S.; Mohammad, N.; Dasti, N.; Raza, S.; Salman, M. Numerical modelling for geotechnical assessment of rock mass behaviour and performance of support system for diversion tunnels using optimized Hoek-Brown parameters. Min. Miner. Depos. 2022, 16, 1–8. [Google Scholar] [CrossRef]
- Phoon, K.-K.; Zhang, W. Future of machine learning in geotechnics. Georisk: Assess. Manag. Risk Eng. Syst. Geohazards 2023, 17, 7–22. [Google Scholar] [CrossRef]
- Daviran, M.; Maghsoudi, A.; Ghezelbash, R. Optimized AI-MPM: Application of PSO for tuning the hyperparameters of SVM and RF algorithms. Comput. Geosci. 2025, 195, 105785. [Google Scholar] [CrossRef]
- Zhang, J.; Li, P.; Yin, X.; Wang, S.; Zhu, Y. Back analysis of surrounding rock parameters in pingdingshan mine based on BP neural network integrated mind evolutionary algorithm. Mathematics 2022, 10, 1746. [Google Scholar] [CrossRef]
- Hasanipanah, M.; Amnieh, H.B.; Arab, H.; Zamzam, M.S. Feasibility of PSO–ANFIS model to estimate rock fragmentation produced by mine blasting. Neural Comput. Appl. 2018, 30, 1015–1024. [Google Scholar] [CrossRef]
- Chao, Z.; Liu, H.; Wang, H.; Dong, Y.; Shi, D.; Zheng, J. The interface mechanical properties between polymer layer and marine sand with different particle sizes under the effect of temperature: Laboratory tests and artificial intelligence modelling. Ocean Eng. 2024, 312, 119255. [Google Scholar] [CrossRef]
- Chao, Z.; Wang, H.; Hu, S.; Wang, M.; Xu, S.; Zhang, W. Permeability and porosity of light-weight concrete with plastic waste aggregate: Experimental study and machine learning modelling. Constr. Build. Mater. 2024, 411, 134465. [Google Scholar] [CrossRef]
- Jie, J.; Zeng, J.; Ren, Y. Improved mind evolutionary computation for optimizations. In Proceedings of the Fifth World Congress on Intelligent Control and Automation (IEEE Cat. No. 04EX788), Hangzhou, China, 15–19 June 2004. [Google Scholar]
- Chao, Z.; Wang, H.; Zheng, J.; Shi, D.; Li, C.; Ding, G.; Feng, X. Temperature-Dependent Post-Cyclic Mechanical Characteristics of Interfaces between Geogrid and Marine Reef Sand: Experimental Research and Machine Learning Modeling. J. Mar. Sci. Eng. 2024, 12, 1262. [Google Scholar] [CrossRef]
- Ahmadi, M.A.; Chen, Z. Comparison of machine learning methods for estimating permeability and porosity of oil reservoirs via petro-physical logs. Petroleum 2019, 5, 271–284. [Google Scholar] [CrossRef]
- Chengyi, S.; Yan, S.; Keming, X. Mind-evolution-based machine learning and applications. In Proceedings of the 3rd World Congress on Intelligent Control and Automation (Cat. No. 00EX393), Hefei, China, 26 June–2 July 2000. [Google Scholar]
- Li, D.; Jiang, Z.; Tian, K.; Ji, R. Prediction of hydraulic conductivity of sodium bentonite GCLs by machine learning approaches. Environ. Geotech. 2025, 12, 154–173. [Google Scholar] [CrossRef]
- Liu, Z.; Shao, J.; Xu, W.; Wu, Q. Indirect estimation of unconfined compressive strength of carbonate rocks using extreme learning machine. Acta Geotech. 2015, 10, 651–663. [Google Scholar] [CrossRef]
- Chao, Z.; Wang, M.; Sun, Y.; Xu, X.; Yue, W.; Yang, C.; Hu, T. Predicting stress-dependent gas permeability of cement mortar with different relative moisture contents based on hybrid ensemble artificial intelligence algorithms. Constr. Build. Mater. 2022, 348, 128660. [Google Scholar] [CrossRef]
- Wang, J.; Goyanes, A.; Gaisford, S.; Basit, A.W. Stereolithographic (SLA) 3D printing of oral modified-release dosage forms. Int. J. Pharm. 2016, 503, 207–212. [Google Scholar] [CrossRef] [PubMed]
- Zhao, H.; Gao, Y.; Lin, F.; Zheng, J.; Jeng, D.-S.; Han, S.; Liu, J.; Sun, Y. Transitional behavior of calcareous sand with different clay contents. Front. Mar. Sci. 2025, 12, 1549597. [Google Scholar] [CrossRef]
- Kardani, N.; Zhou, A.; Nazem, M.; Shen, S.-L. Estimation of bearing capacity of piles in cohesionless soil using optimised machine learning approaches. Geotech. Geol. Eng. 2020, 38, 2271–2291. [Google Scholar] [CrossRef]
- Samui, P. Application of statistical learning algorithms to ultimate bearing capacity of shallow foundation on cohesionless soil. Int. J. Numer. Anal. Methods Geomech. 2012, 36, 100–110. [Google Scholar] [CrossRef]
- Zhou, J.; Shi, X.; Du, K.; Qiu, X.; Li, X.; Mitri, H.S. Feasibility of random-forest approach for prediction of ground settlements induced by the construction of a shield-driven tunnel. Int. J. Geomech. 2017, 17, 04016129. [Google Scholar] [CrossRef]
- Wang, H.; Hu, D. Comparison of SVM and LS-SVM for regression. In Proceedings of the 2005 International Conference on Neural Networks and Brain, Beijing, China, 13–15 October 2005. [Google Scholar]
- Lambora, A.; Gupta, K.; Chopra, K. Genetic algorithm-A literature review. In Proceedings of the 2019 International conference on Machine Learning, Big Data, Cloud and Parallel Computing (COMITCon), Faridabad, India, 14–16 February 2019. [Google Scholar]
- Wang, W.; Tang, R.; Li, C.; Liu, P.; Luo, L. A BP neural network model optimized by mind evolutionary algorithm for predicting the ocean wave heights. Ocean Eng. 2018, 162, 98–107. [Google Scholar] [CrossRef]
- Chao, Z.; Li, Z.; Dong, Y.; Shi, D.; Zheng, J. Estimating compressive strength of coral sand aggregate concrete in marine environment by combining physical experiments and machine learning-based techniques. Ocean Eng. 2024, 308, 118320. [Google Scholar] [CrossRef]
- Hodson, T.O. Root mean square error (RMSE) or mean absolute error (MAE): When to use them or not. Geosci. Model Dev. Discuss. 2022, 2022, 1–10. [Google Scholar] [CrossRef]
- Chicco, D.; Warrens, M.J.; Jurman, G. The coefficient of determination R-squared is more informative than SMAPE, MAE, MAPE, MSE and RMSE in regression analysis evaluation. Peerj Comput. Sci. 2021, 7, e623. [Google Scholar] [CrossRef] [PubMed]
- Yang, H.; Li, H.; Zhao, Z. Modeling prediction of bond strength between rebar and recycled aggregate concrete by deep learning approach based on attention mechanism. Constr. Build. Mater. 2025, 471, 140753. [Google Scholar] [CrossRef]
- Lundberg, S.M.; Lee, S.-I. A unified approach to interpreting model predictions. Adv. Neural Inf. Process. Syst. 2017, 30, 4768–4777. [Google Scholar]
- Goh, A.T.; Kulhawy, F.H.; Chua, C. Bayesian neural network analysis of undrained side resistance of drilled shafts. J. Geotech. Geoenviron. Eng. 2005, 131, 84–93. [Google Scholar] [CrossRef]

| GS | D50/mm | Cu | Cc | emin | emax |
|---|---|---|---|---|---|
| 2.81 | 3.3 | 1.32 | 1.08 | 0.99 | 1.49 |
| Standard | Tensile Modulus | Tensile Strength | Elongation at Break | Flexural Modulus | Impact Strength | Distortion Temperature |
|---|---|---|---|---|---|---|
| ASTM | 2450 Mpa | 50 Mpa | 10% | 2400 Mpa | 45 J/m | 56 °C |
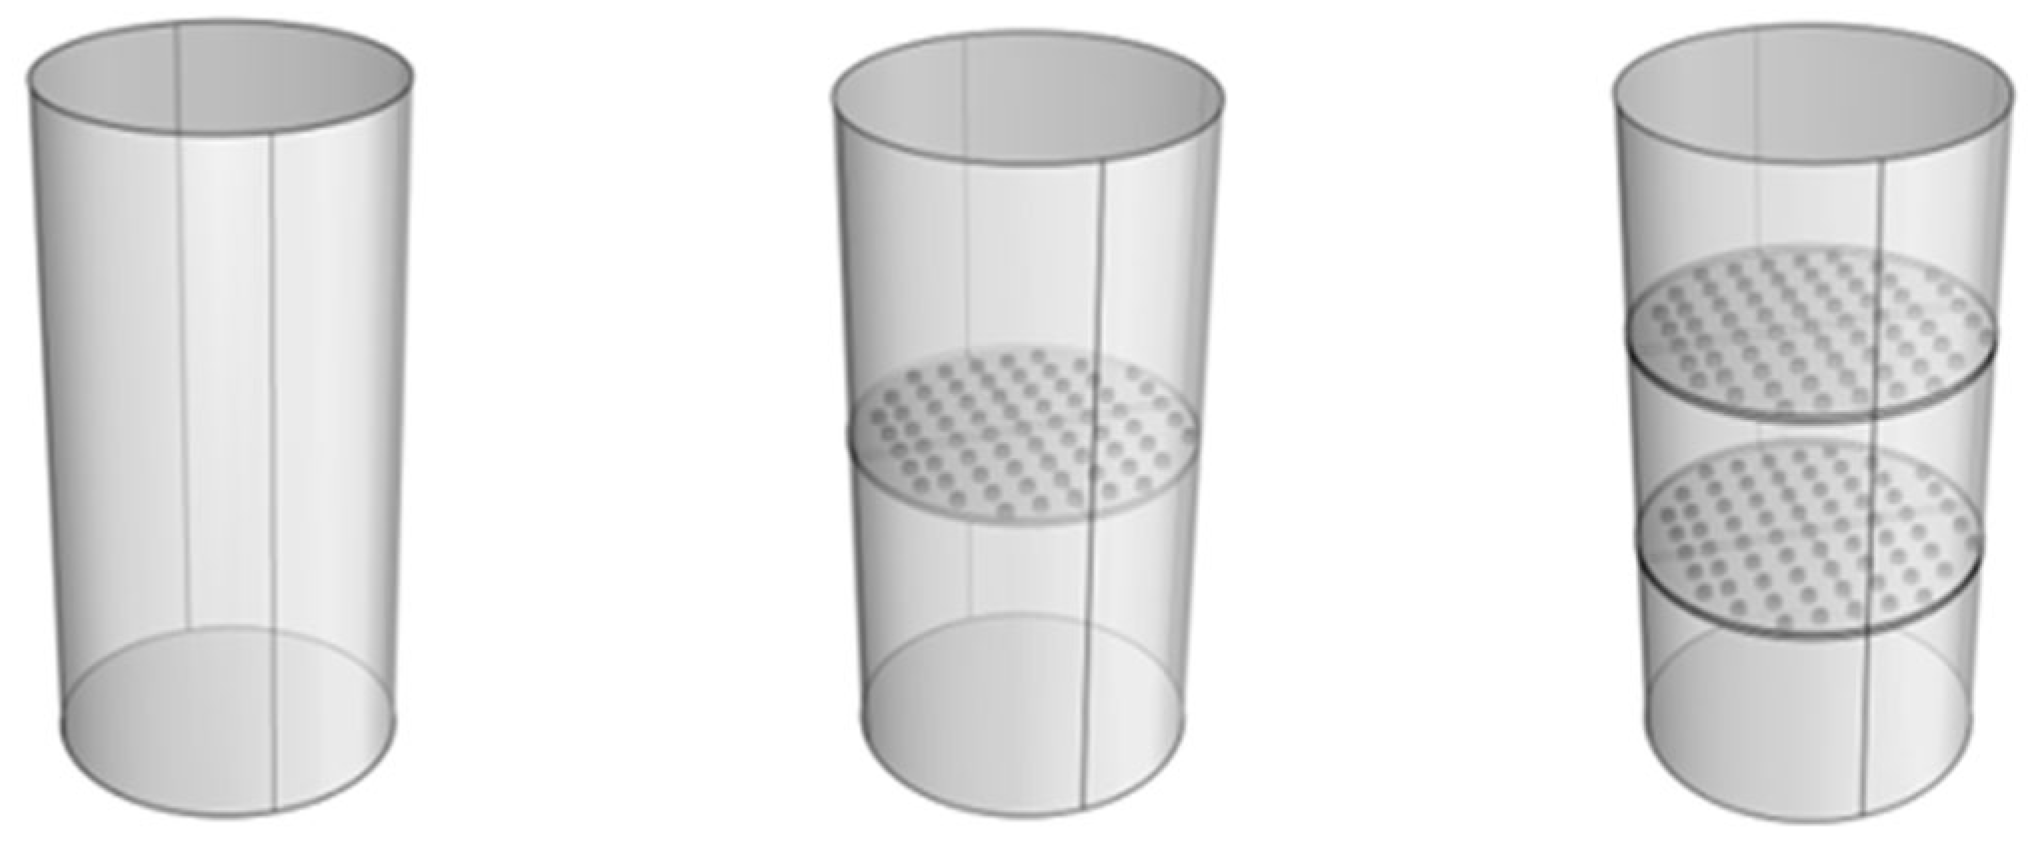
| Number | Asperity Spacing (mm) | Asperity Height (mm) | Confining Pressure (kPa) | Geomembrane Layers |
|---|---|---|---|---|
| T1 | - | - | 10, 30, 50 | 0 |
| T2 | 10, 15, 20 | 1, 2, 3 | 10 | 1, 2 |
| T3 | 10, 15, 20 | 1, 2, 3 | 30 | 1, 2 |
| T4 | 10, 15, 20 | 1, 2, 3 | 50 | 1, 2 |
| Algorithm | LDA | PSO | GA |
|---|---|---|---|
| Population size (pop_num) | 30 | 30 | 15 |
| Genetic generations (gen) | - | - | 100 |
| Selection function parameter (normGeomSelect) | - | - | 0.15 |
| Crossover function parameter (arithXover) | - | - | 1.5 |
| Mutation function parameter (nonUnifMutation) | - | - | [0.2, 50, 3] |
| Optimal solution tolerance (maxGenTerm) | - | 1 | 1 × 10⁻⁶ |
| Learning factors (c1, c2) | - | 2.1 | - |
| Maximum position (popmax) | - | 2.0 | - |
| Minimum position (popmin) | - | −2.0 | - |
| Maximum number of iterations (max_iter) | 80 | - | - |
| Mutation factor (F) | 0.7 | - | - |
| Crossover probability (CR) | 0.9 | - | - |
| Argument | Type | Min Value | Max Value | Mean Value | Standard Deviation |
|---|---|---|---|---|---|
| Asperity spacing | Numerical type | 10 | 20 | 15 | 5 |
| Asperity height | 1 | 3 | 2 | 1 | |
| Confining pressure (Kpa) | 10 | 50 | 30 | 20 | |
| Number of reinforcement layers | 0 | 2 | 1 | 1 | |
| Strain (mm) | 1 | 12 | 7.27 | 3.26 |
| Hidden Layer | Weight | Bias | ||||||
|---|---|---|---|---|---|---|---|---|
| Input | Output | Hidden Layer | Output | |||||
| S | H | P | L | Y | H | |||
| 1 | 0.42 | −0.44 | 0.21 | 0.44 | −0.27 | 0.23 | 1.05 | 0.51 |
| 2 | 1.18 | 1.16 | −0.14 | 1.03 | 0.15 | −0.18 | −0.72 | |
| 3 | 0.91 | −1.32 | 1.05 | −1.15 | 0.57 | 0.12 | 0.45 | |
| 4 | −1.12 | 0.34 | −1.17 | 1.78 | −0.93 | 0.03 | 0.84 | |
| 5 | 1.24 | 1.45 | 0.92 | −1.67 | 1.23 | −0.01 | 1.09 | |
| Asperity Spacing | Asperity Height | Confining Pressure (Kpa) | Reinforced Layers | Strain (%) |
|---|---|---|---|---|
| 0 | 0 | 10 | 0 | 3 |
| 30 | 0 | 6 | ||
| 50 | 0 | 10 | ||
| 10 | 1 | 10 | 1 | 2 |
| 3 | 30 | 2 | 3 | |
| 2 | 50 | 1 | 6 | |
| 10 | 1 | 50 | 2 | 9 |
| 3 | 10 | 1 | 10 | |
| 2 | 30 | 2 | 11 | |
| 10 | 1 | 30 | 1 | 8 |
| 3 | 50 | 2 | 7 | |
| 2 | 10 | 1 | 1 | |
| 15 | 1 | 10 | 1 | 2 |
| 3 | 30 | 2 | 3 | |
| 2 | 50 | 1 | 6 | |
| 15 | 1 | 50 | 2 | 9 |
| 3 | 10 | 1 | 10 | |
| 2 | 30 | 2 | 11 | |
| 15 | 1 | 30 | 1 | 8 |
| 3 | 50 | 2 | 7 | |
| 2 | 10 | 1 | 1 | |
| 20 | 1 | 10 | 1 | 2 |
| 3 | 30 | 2 | 3 | |
| 2 | 50 | 1 | 6 | |
| 20 | 1 | 50 | 2 | 9 |
| 3 | 10 | 1 | 10 | |
| 2 | 30 | 2 | 11 | |
| 20 | 1 | 30 | 1 | 8 |
| 3 | 50 | 2 | 7 | |
| 2 | 10 | 1 | 1 |
Disclaimer/Publisher’s Note: The statements, opinions and data contained in all publications are solely those of the individual author(s) and contributor(s) and not of MDPI and/or the editor(s). MDPI and/or the editor(s) disclaim responsibility for any injury to people or property resulting from any ideas, methods, instructions or products referred to in the content. |
© 2025 by the authors. Licensee MDPI, Basel, Switzerland. This article is an open access article distributed under the terms and conditions of the Creative Commons Attribution (CC BY) license (https://creativecommons.org/licenses/by/4.0/).
Share and Cite
Yang, B.; Xu, K.; Wang, Z.; Sun, H.; Cui, P.; Chao, Z. Machine Learning Prediction of Mechanical Properties for Marine Coral Sand–Clay Mixtures Based on Triaxial Shear Testing. Buildings 2025, 15, 2481. https://doi.org/10.3390/buildings15142481
Yang B, Xu K, Wang Z, Sun H, Cui P, Chao Z. Machine Learning Prediction of Mechanical Properties for Marine Coral Sand–Clay Mixtures Based on Triaxial Shear Testing. Buildings. 2025; 15(14):2481. https://doi.org/10.3390/buildings15142481
Chicago/Turabian StyleYang, Bowen, Kaiwei Xu, Zejin Wang, Haodong Sun, Peng Cui, and Zhiming Chao. 2025. "Machine Learning Prediction of Mechanical Properties for Marine Coral Sand–Clay Mixtures Based on Triaxial Shear Testing" Buildings 15, no. 14: 2481. https://doi.org/10.3390/buildings15142481
APA StyleYang, B., Xu, K., Wang, Z., Sun, H., Cui, P., & Chao, Z. (2025). Machine Learning Prediction of Mechanical Properties for Marine Coral Sand–Clay Mixtures Based on Triaxial Shear Testing. Buildings, 15(14), 2481. https://doi.org/10.3390/buildings15142481