
Experimental Study on Compressive Capacity Behavior of Helical Anchors in Aeolian Sand and Optimization of Design Methods

Abstract
1. Introduction
2. Field Testing Program
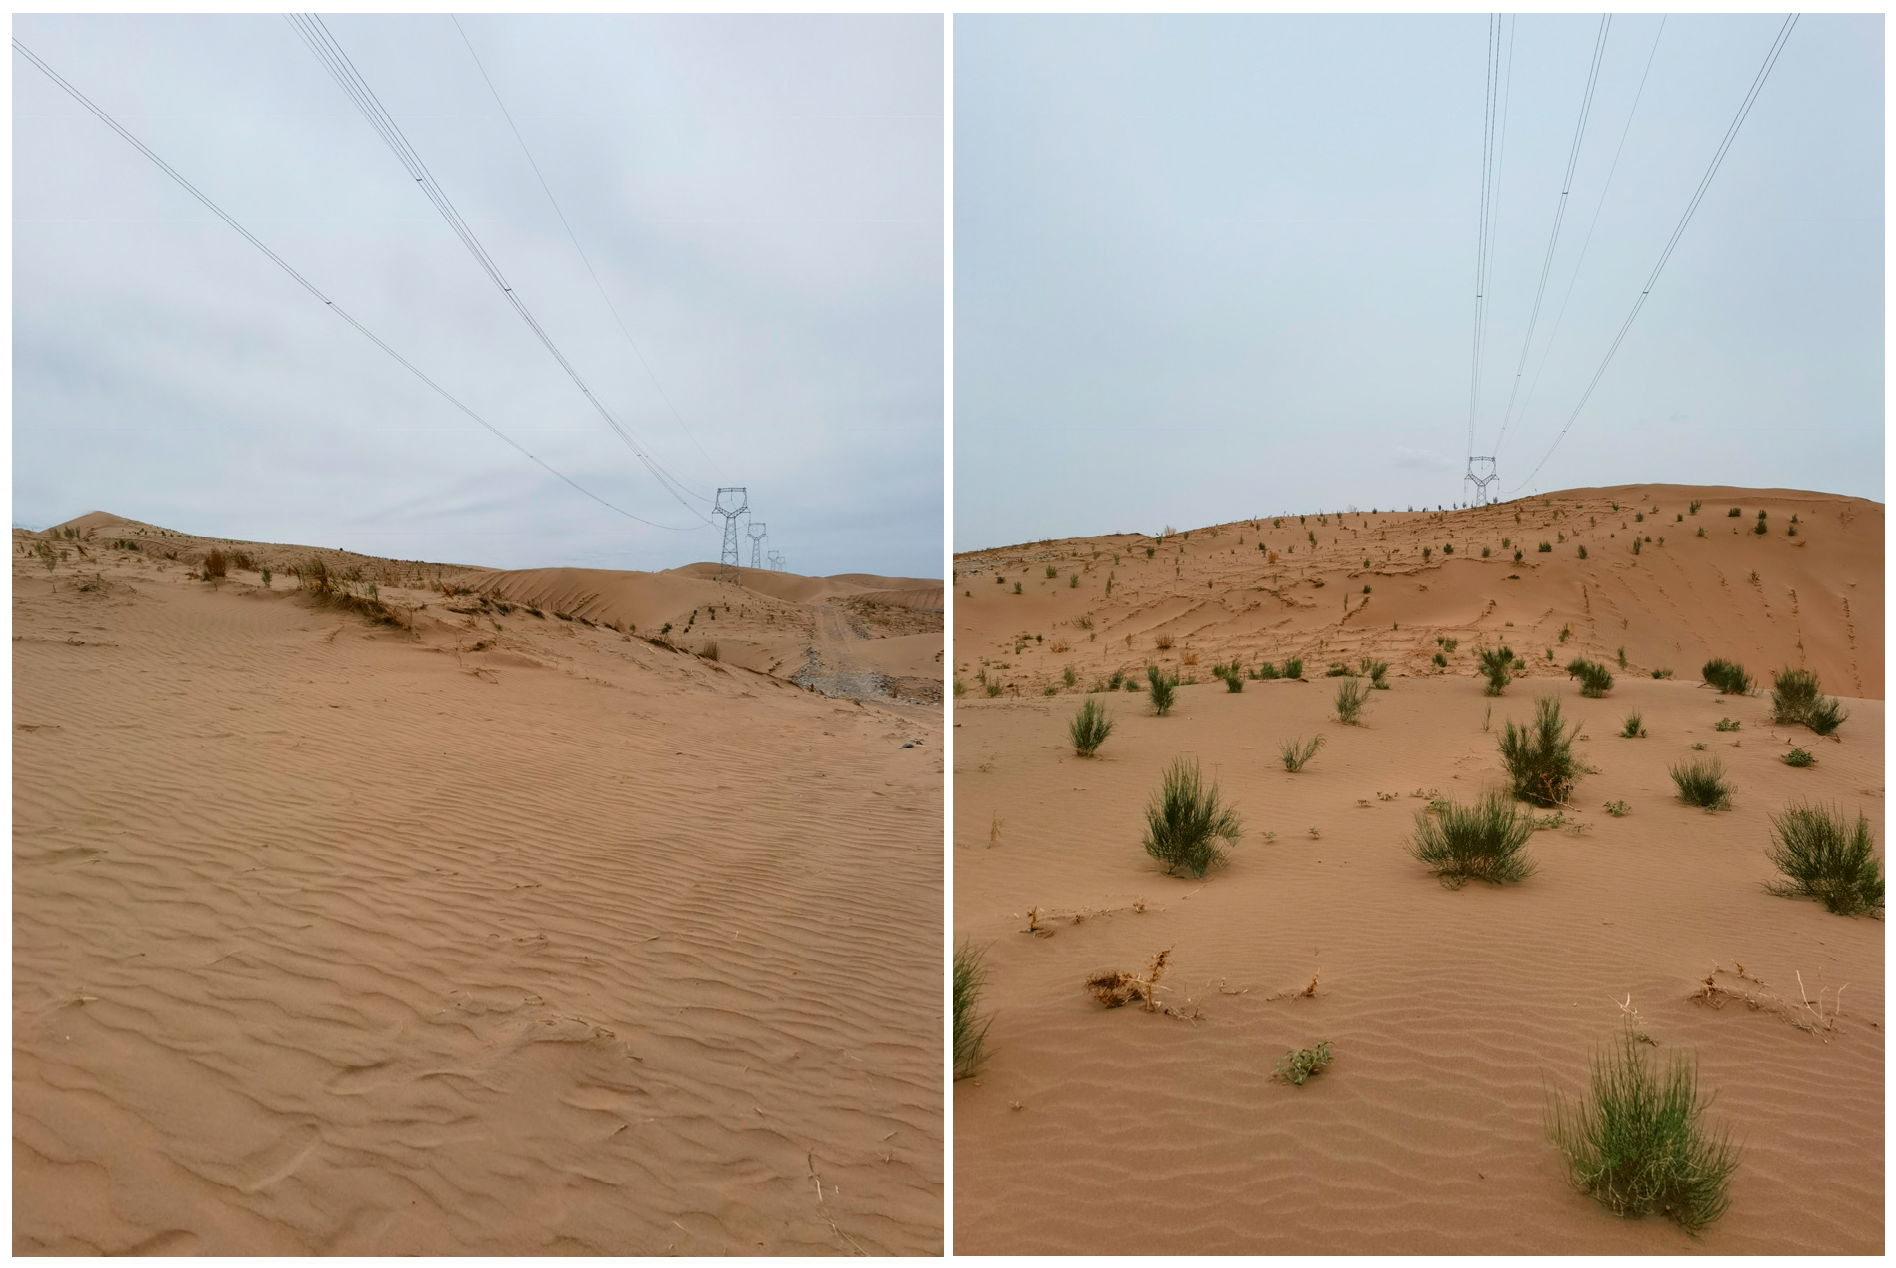
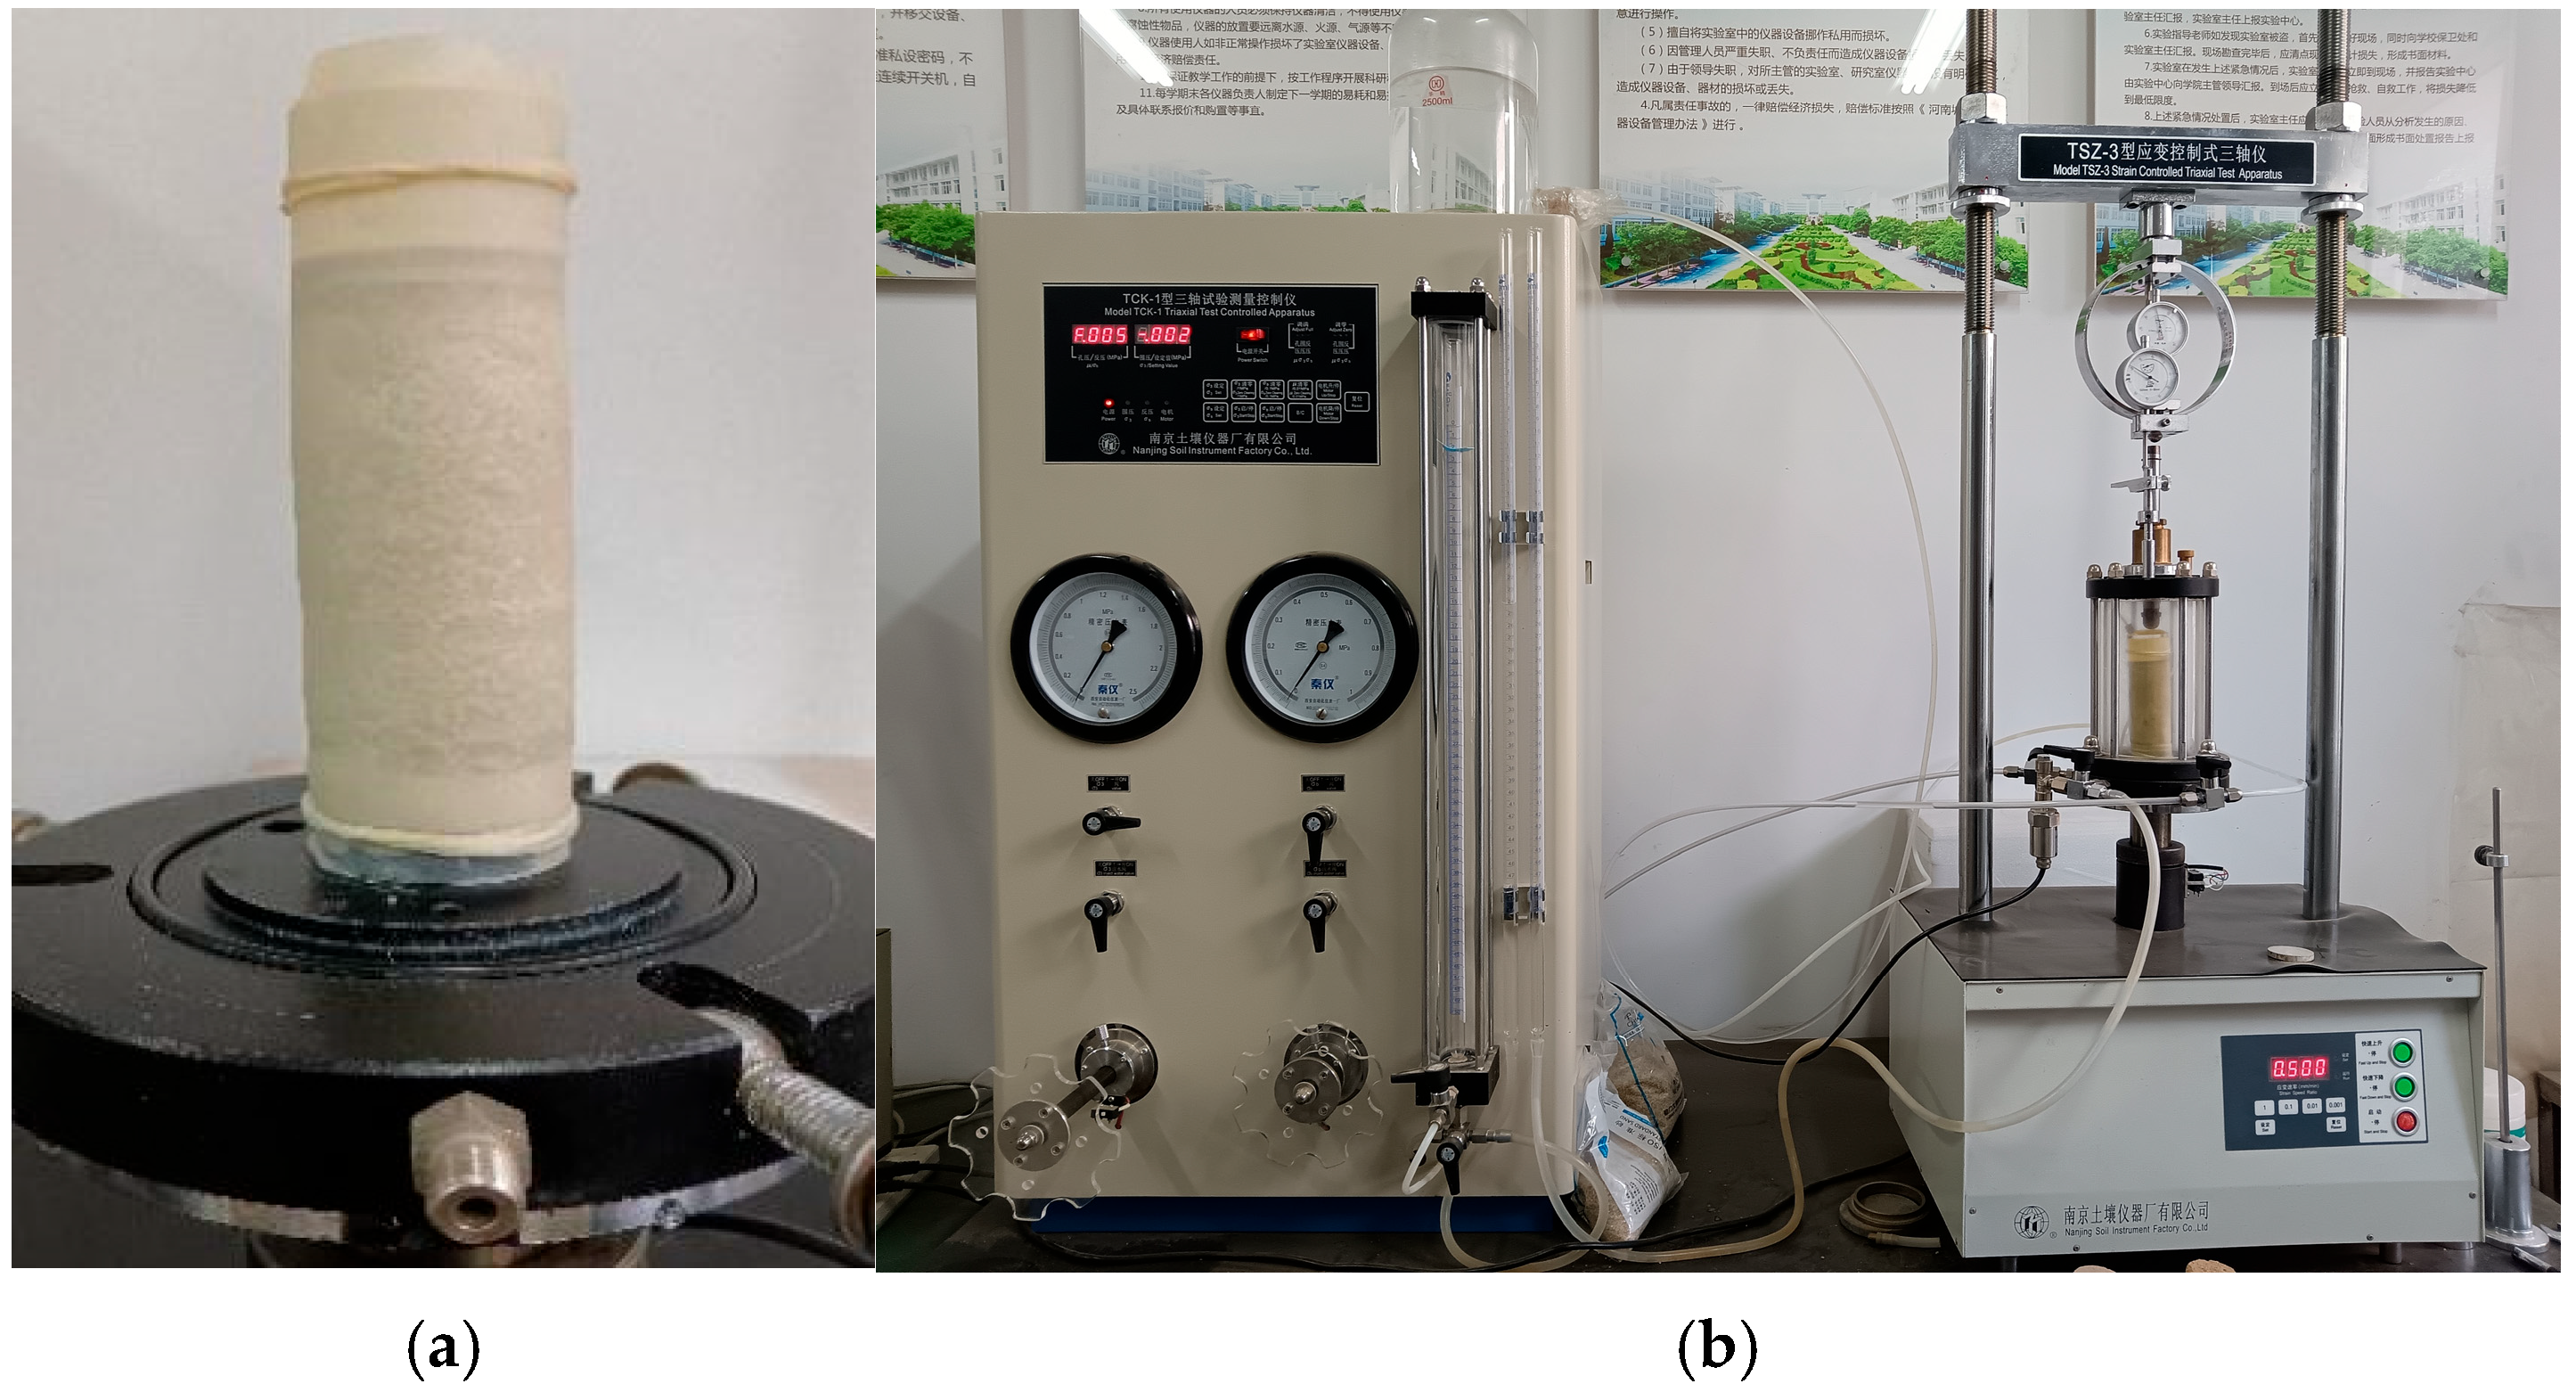
2.1. In Situ Testing Conditions
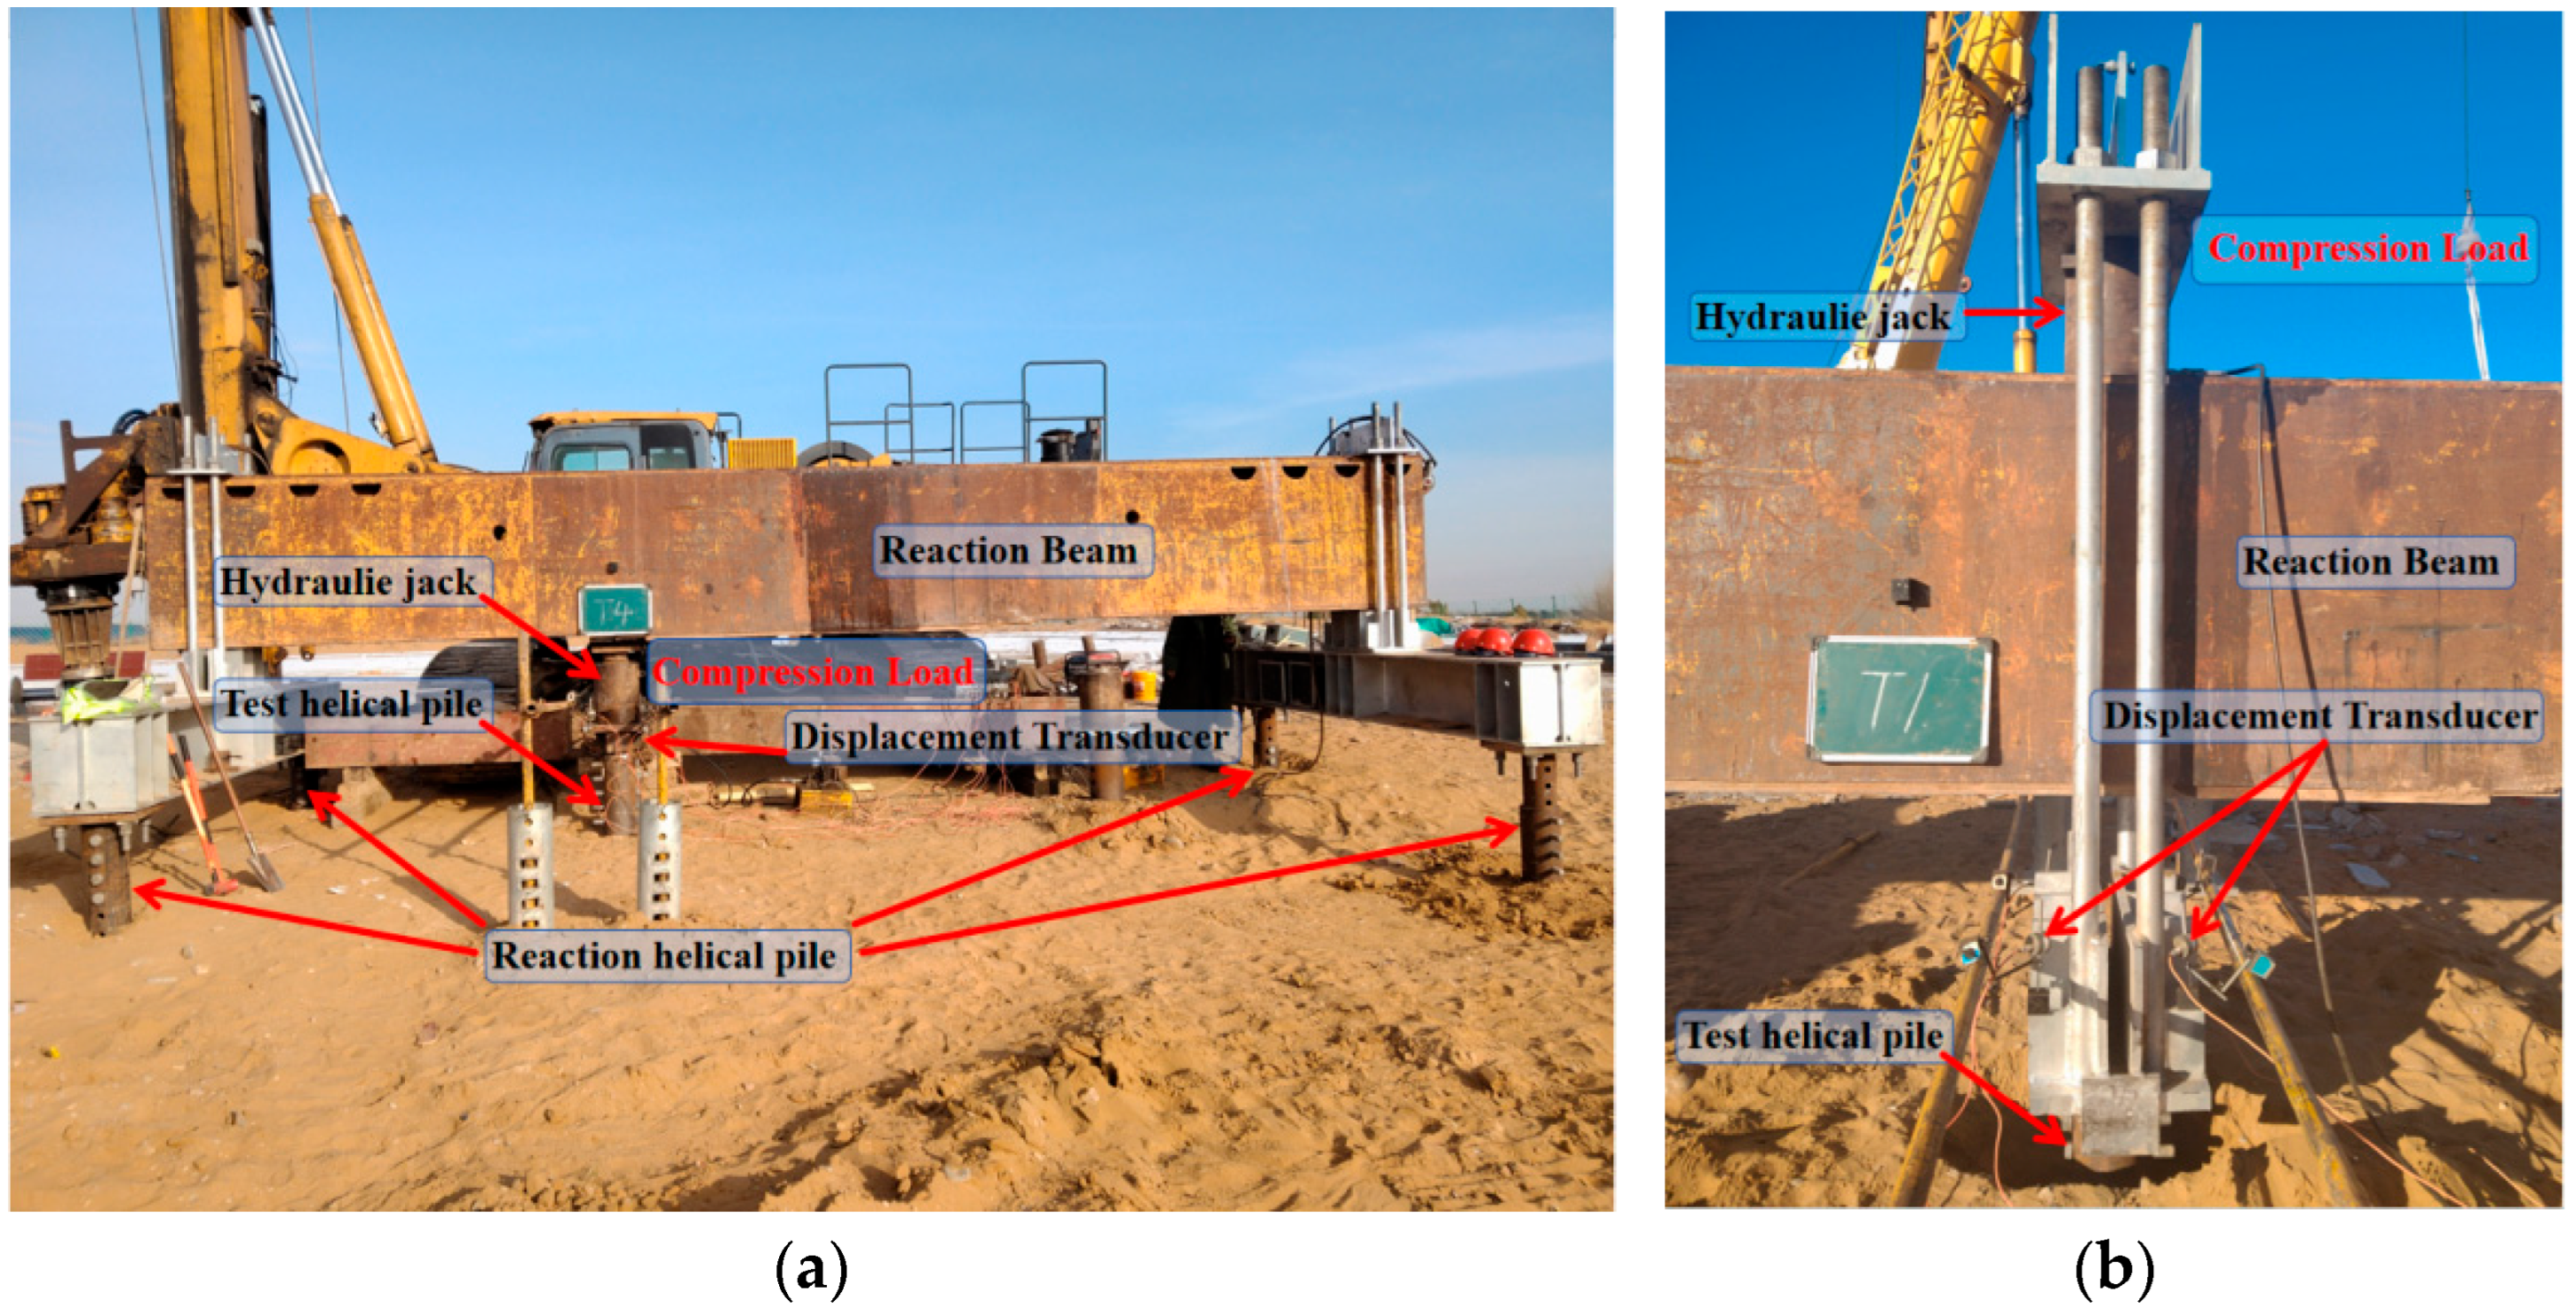
2.2. Static Load Test
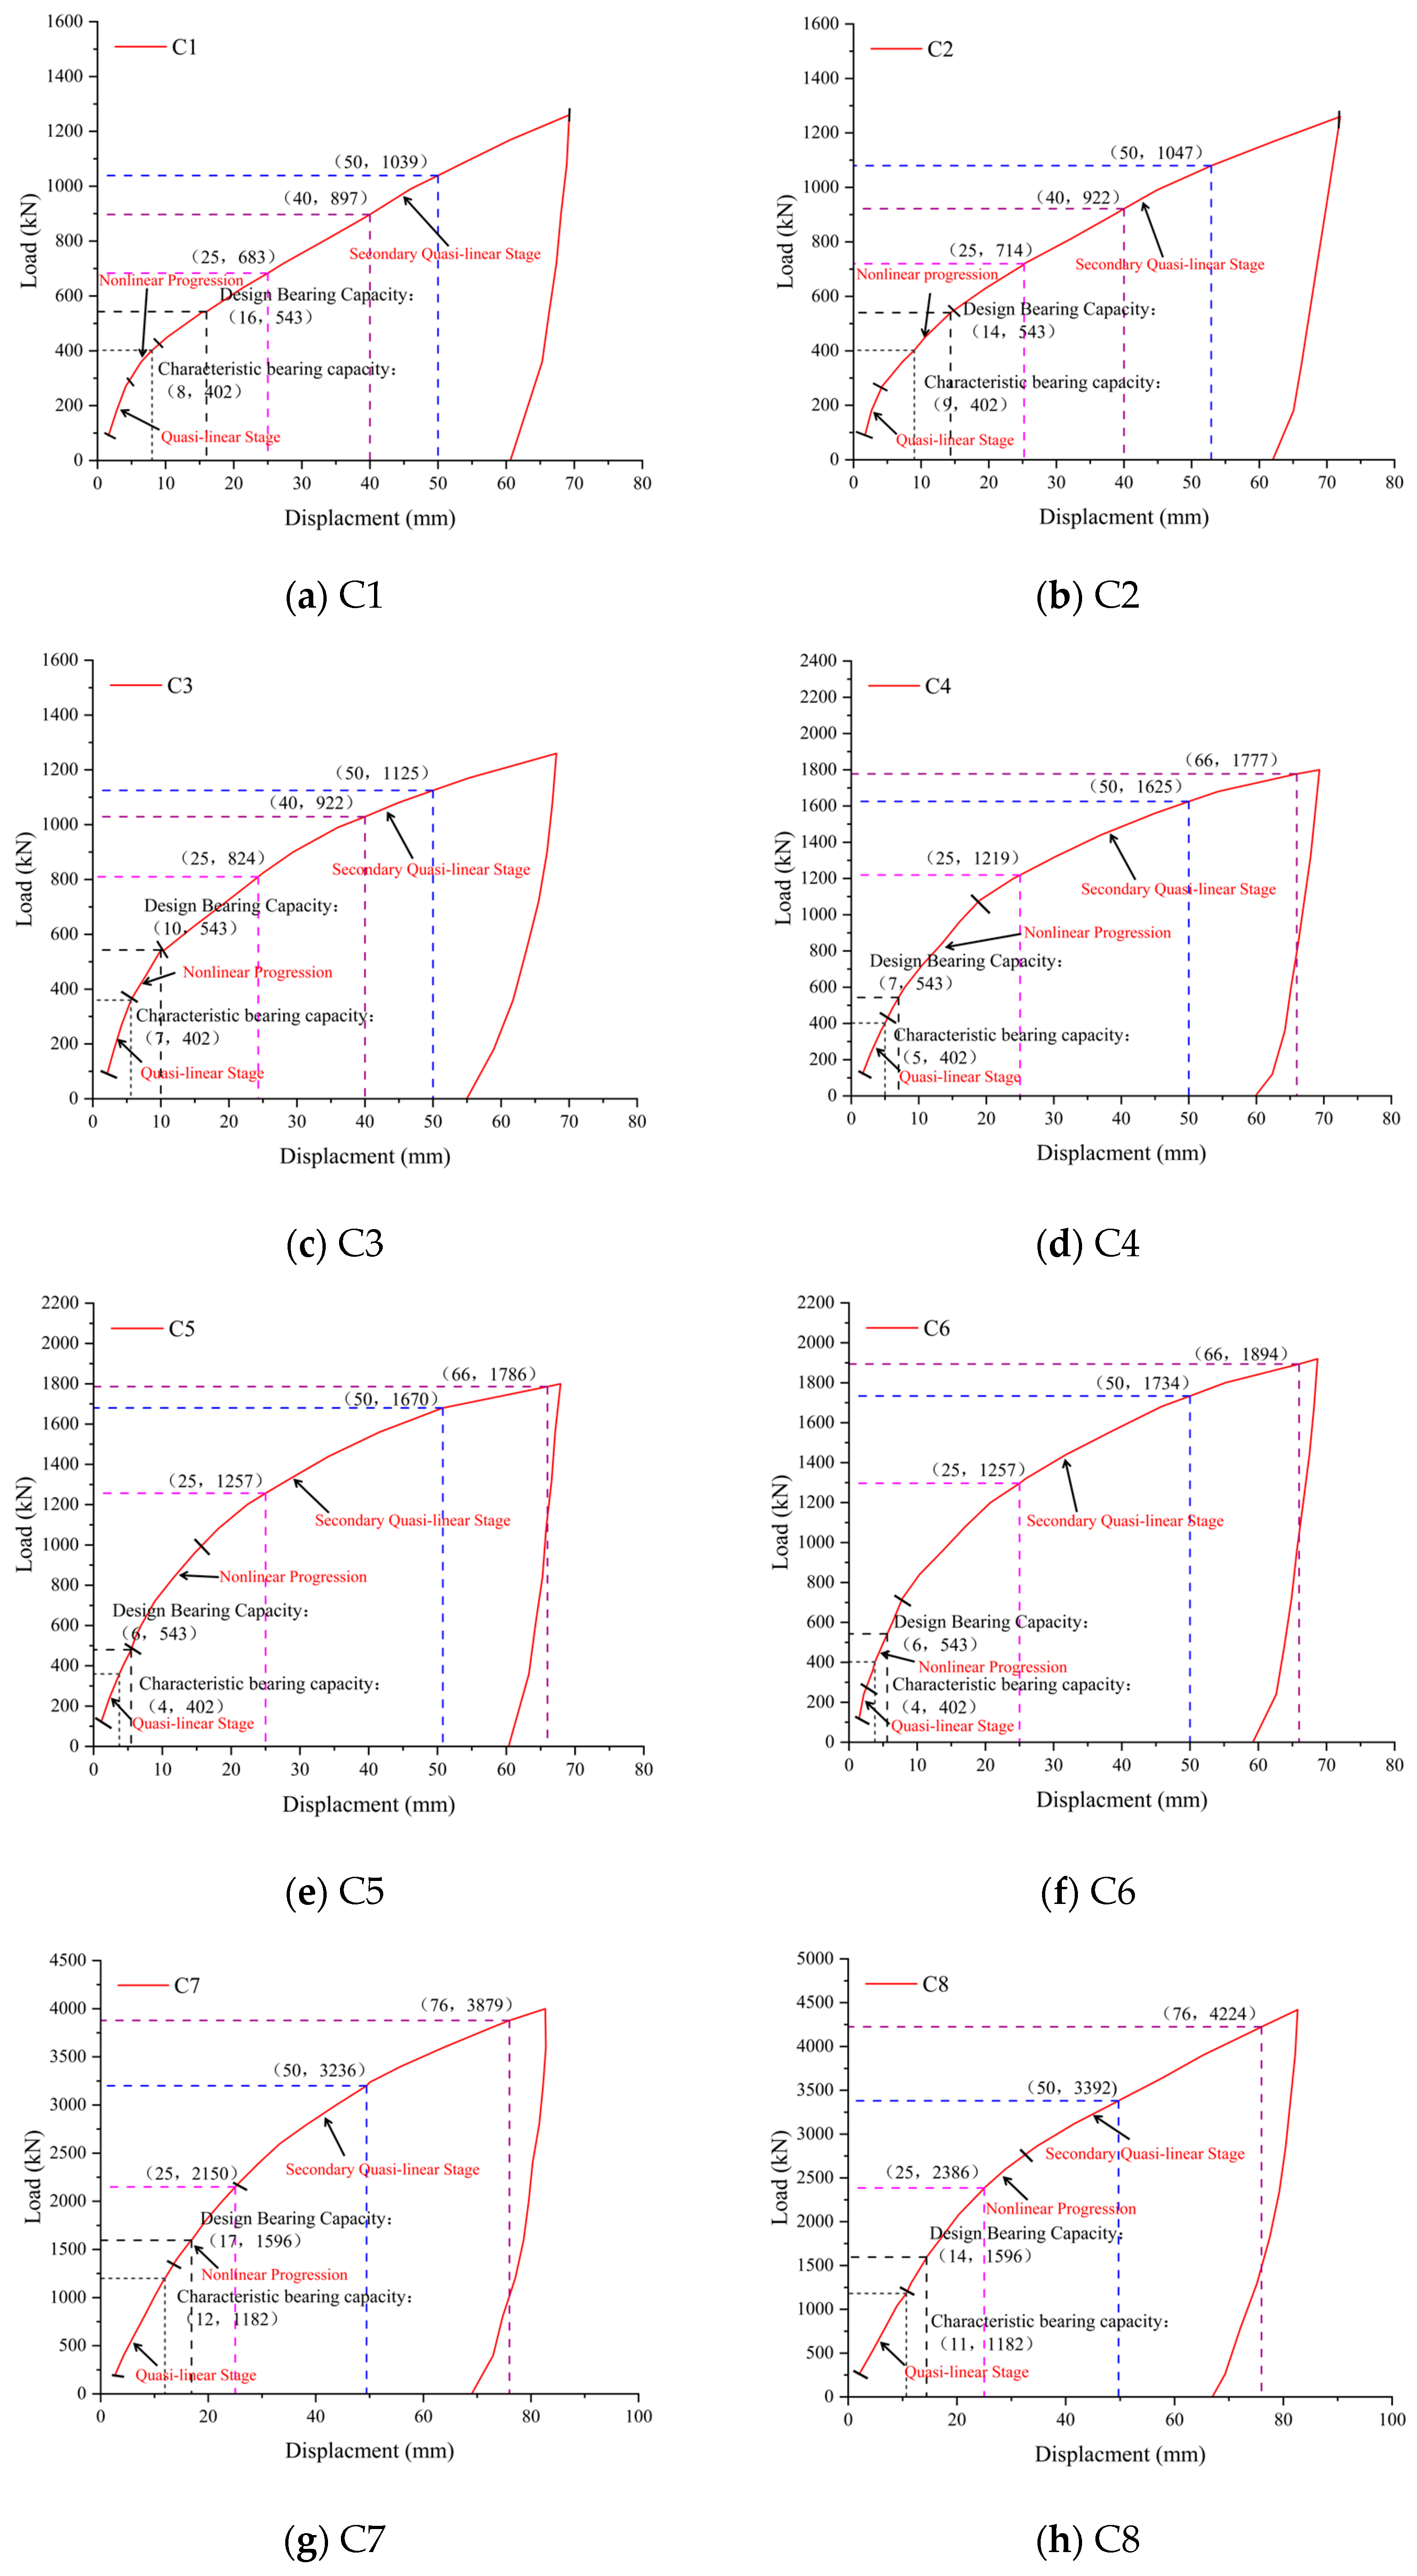
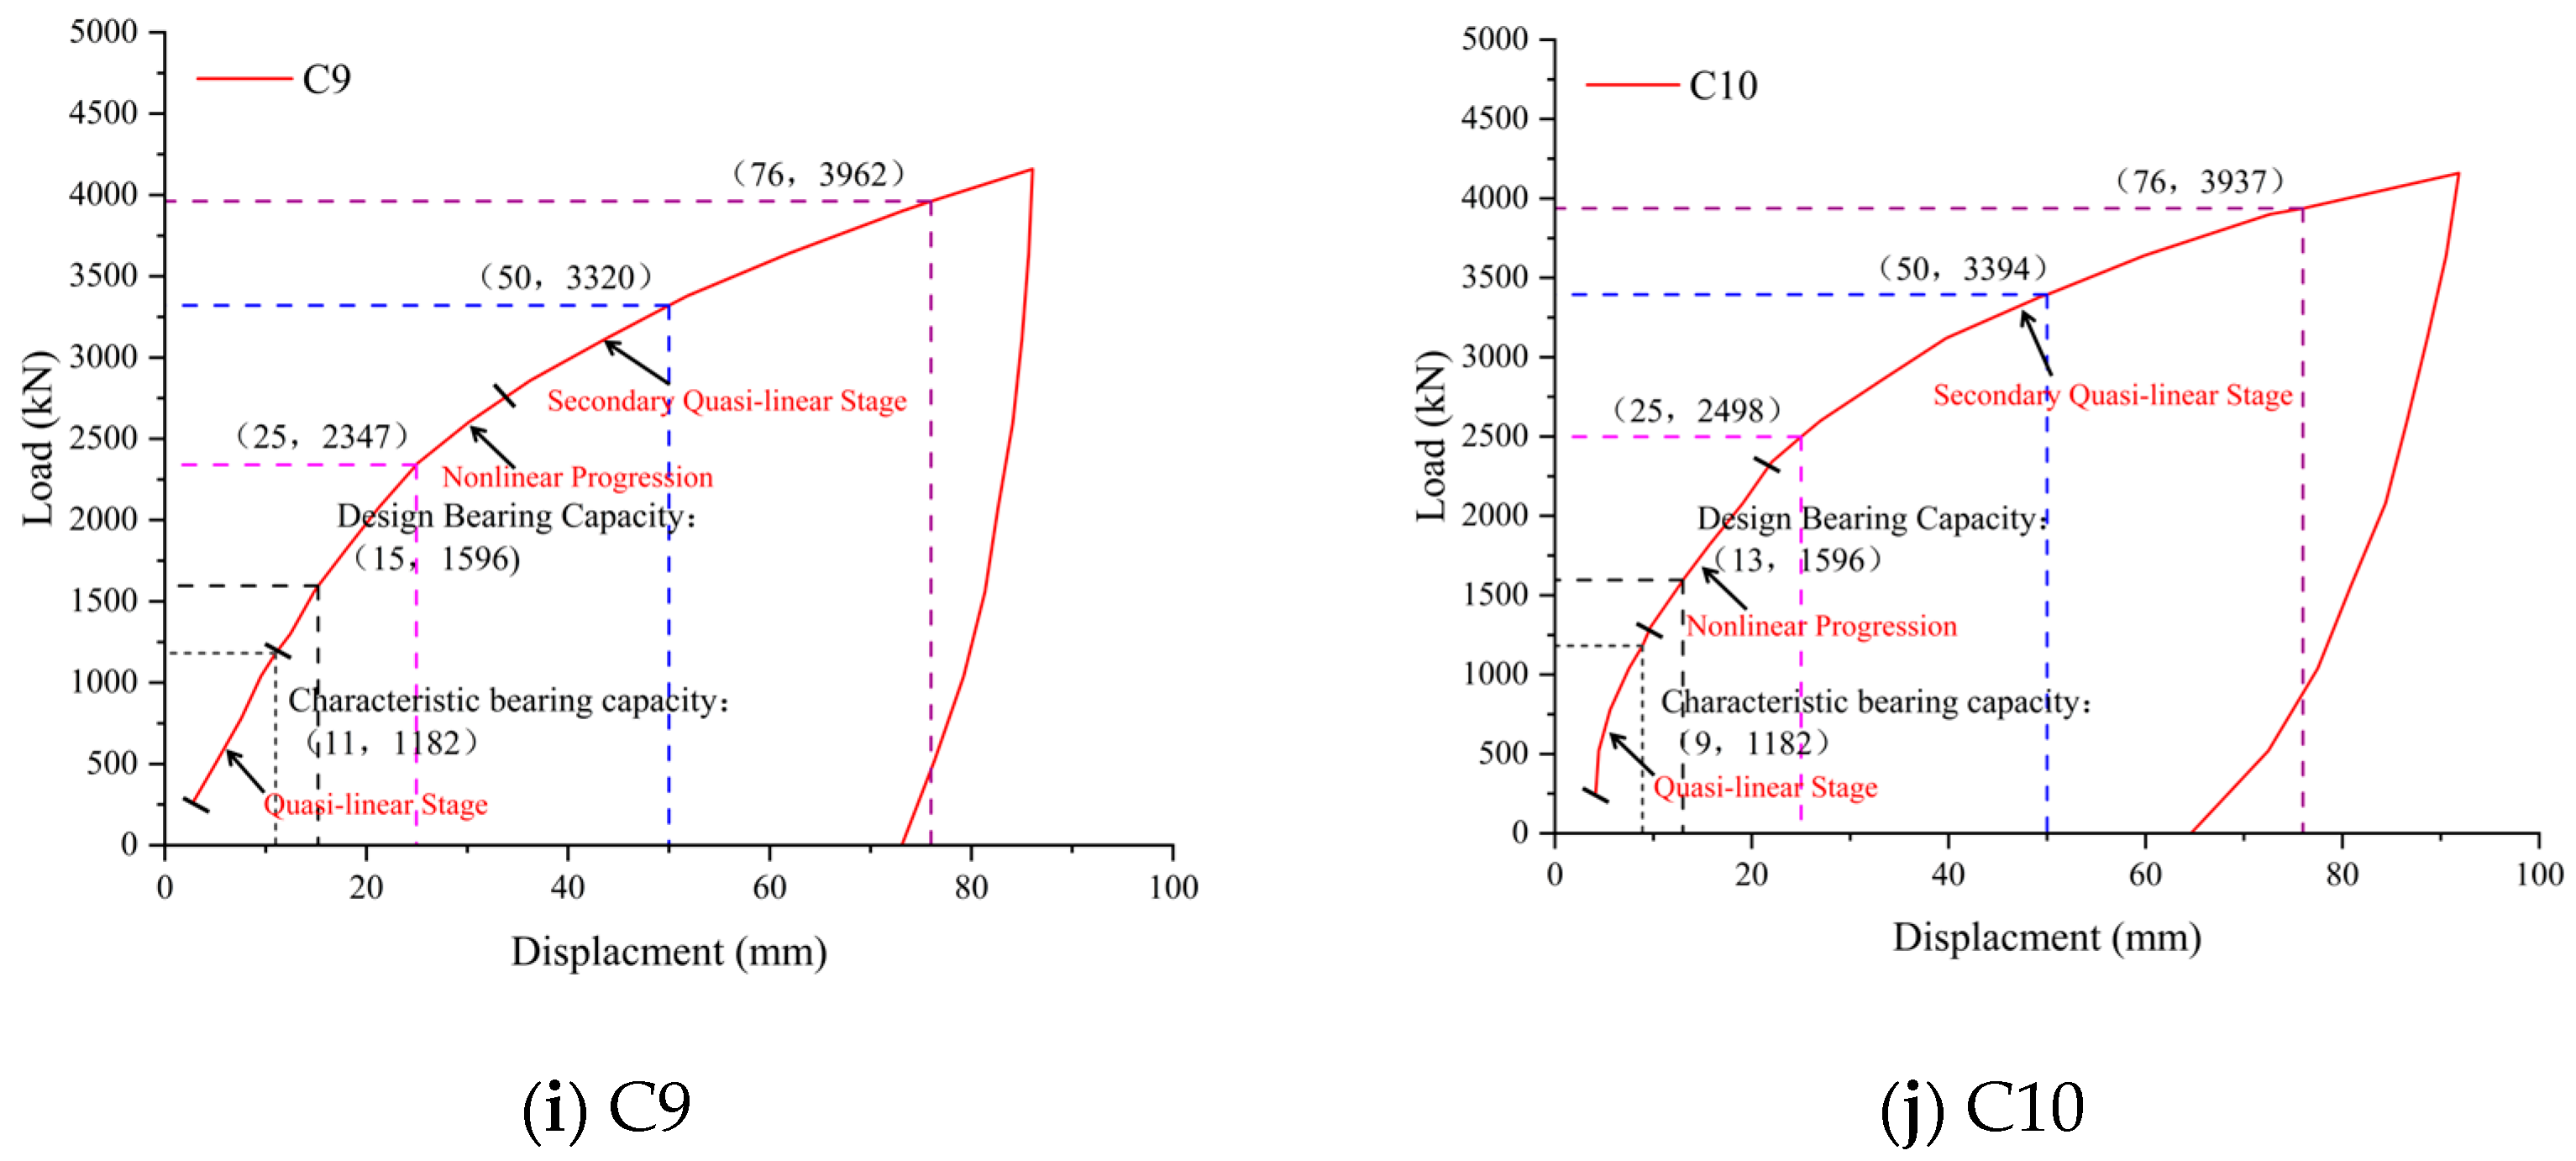
2.3. Test Results and Analysis
- (1)
- Diameter effect: The three-helix anchors (C1, C4, and C7) showed capacity scaling with diameter—C4 (65% larger diameter; 172% greater base area) achieved 92% higher capacity than C1; C7 (90% larger diameter, 261% greater base area) exhibited a 309% capacity increase. These measurements defined an exponential capacity–diameter relationship (R2 > 0.98).
- (2)
- Helix quantity effect: Despite identical top-helix embedment and diameters, the four-helix anchor (C8) provided merely 4% higher axial compressive capacity than the three-helix configuration (C7), indicating the negligible influence of helix count.
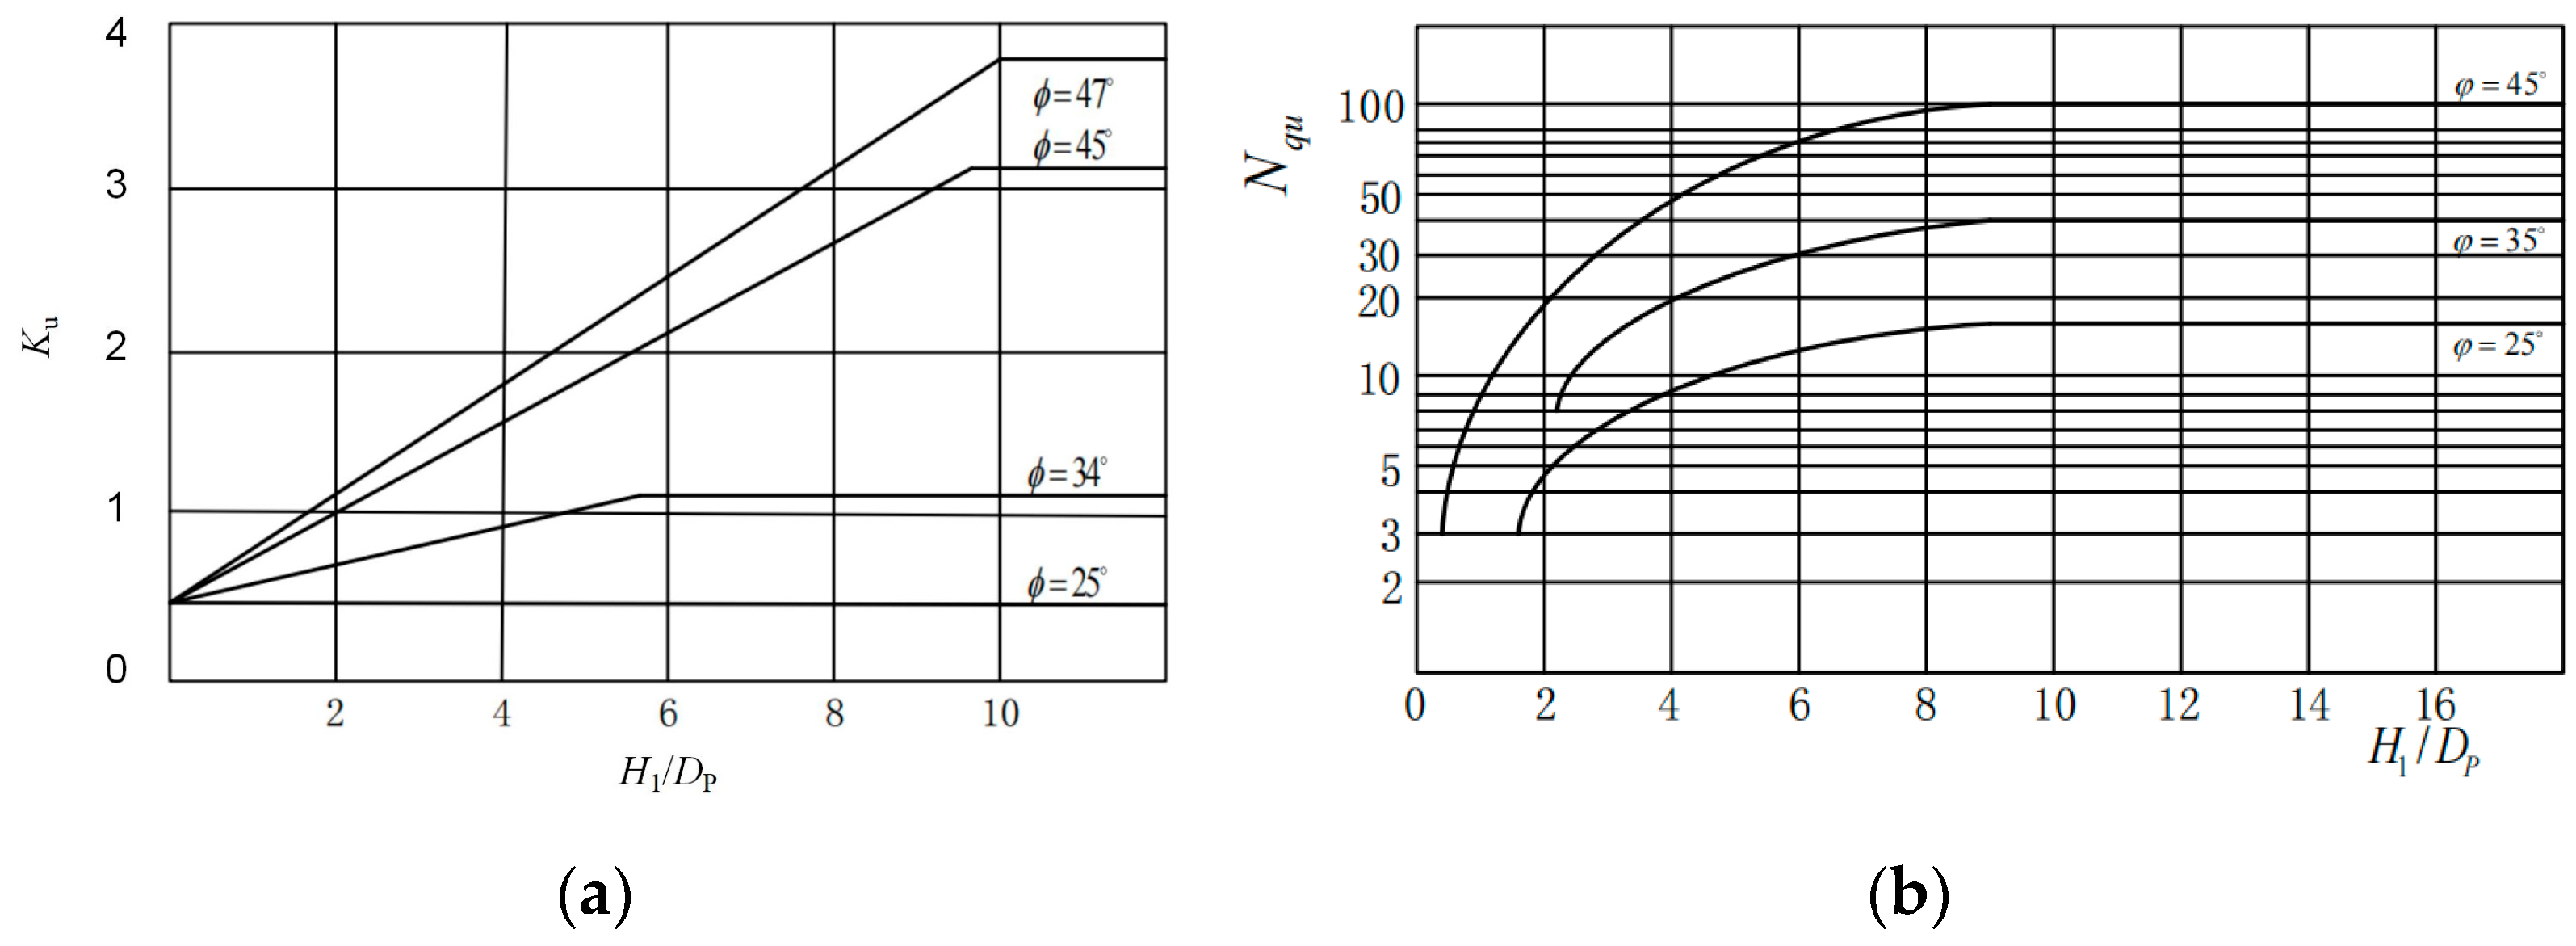
2.4. Bearing Capacity Calculation Methods
3. Numerical Analysis
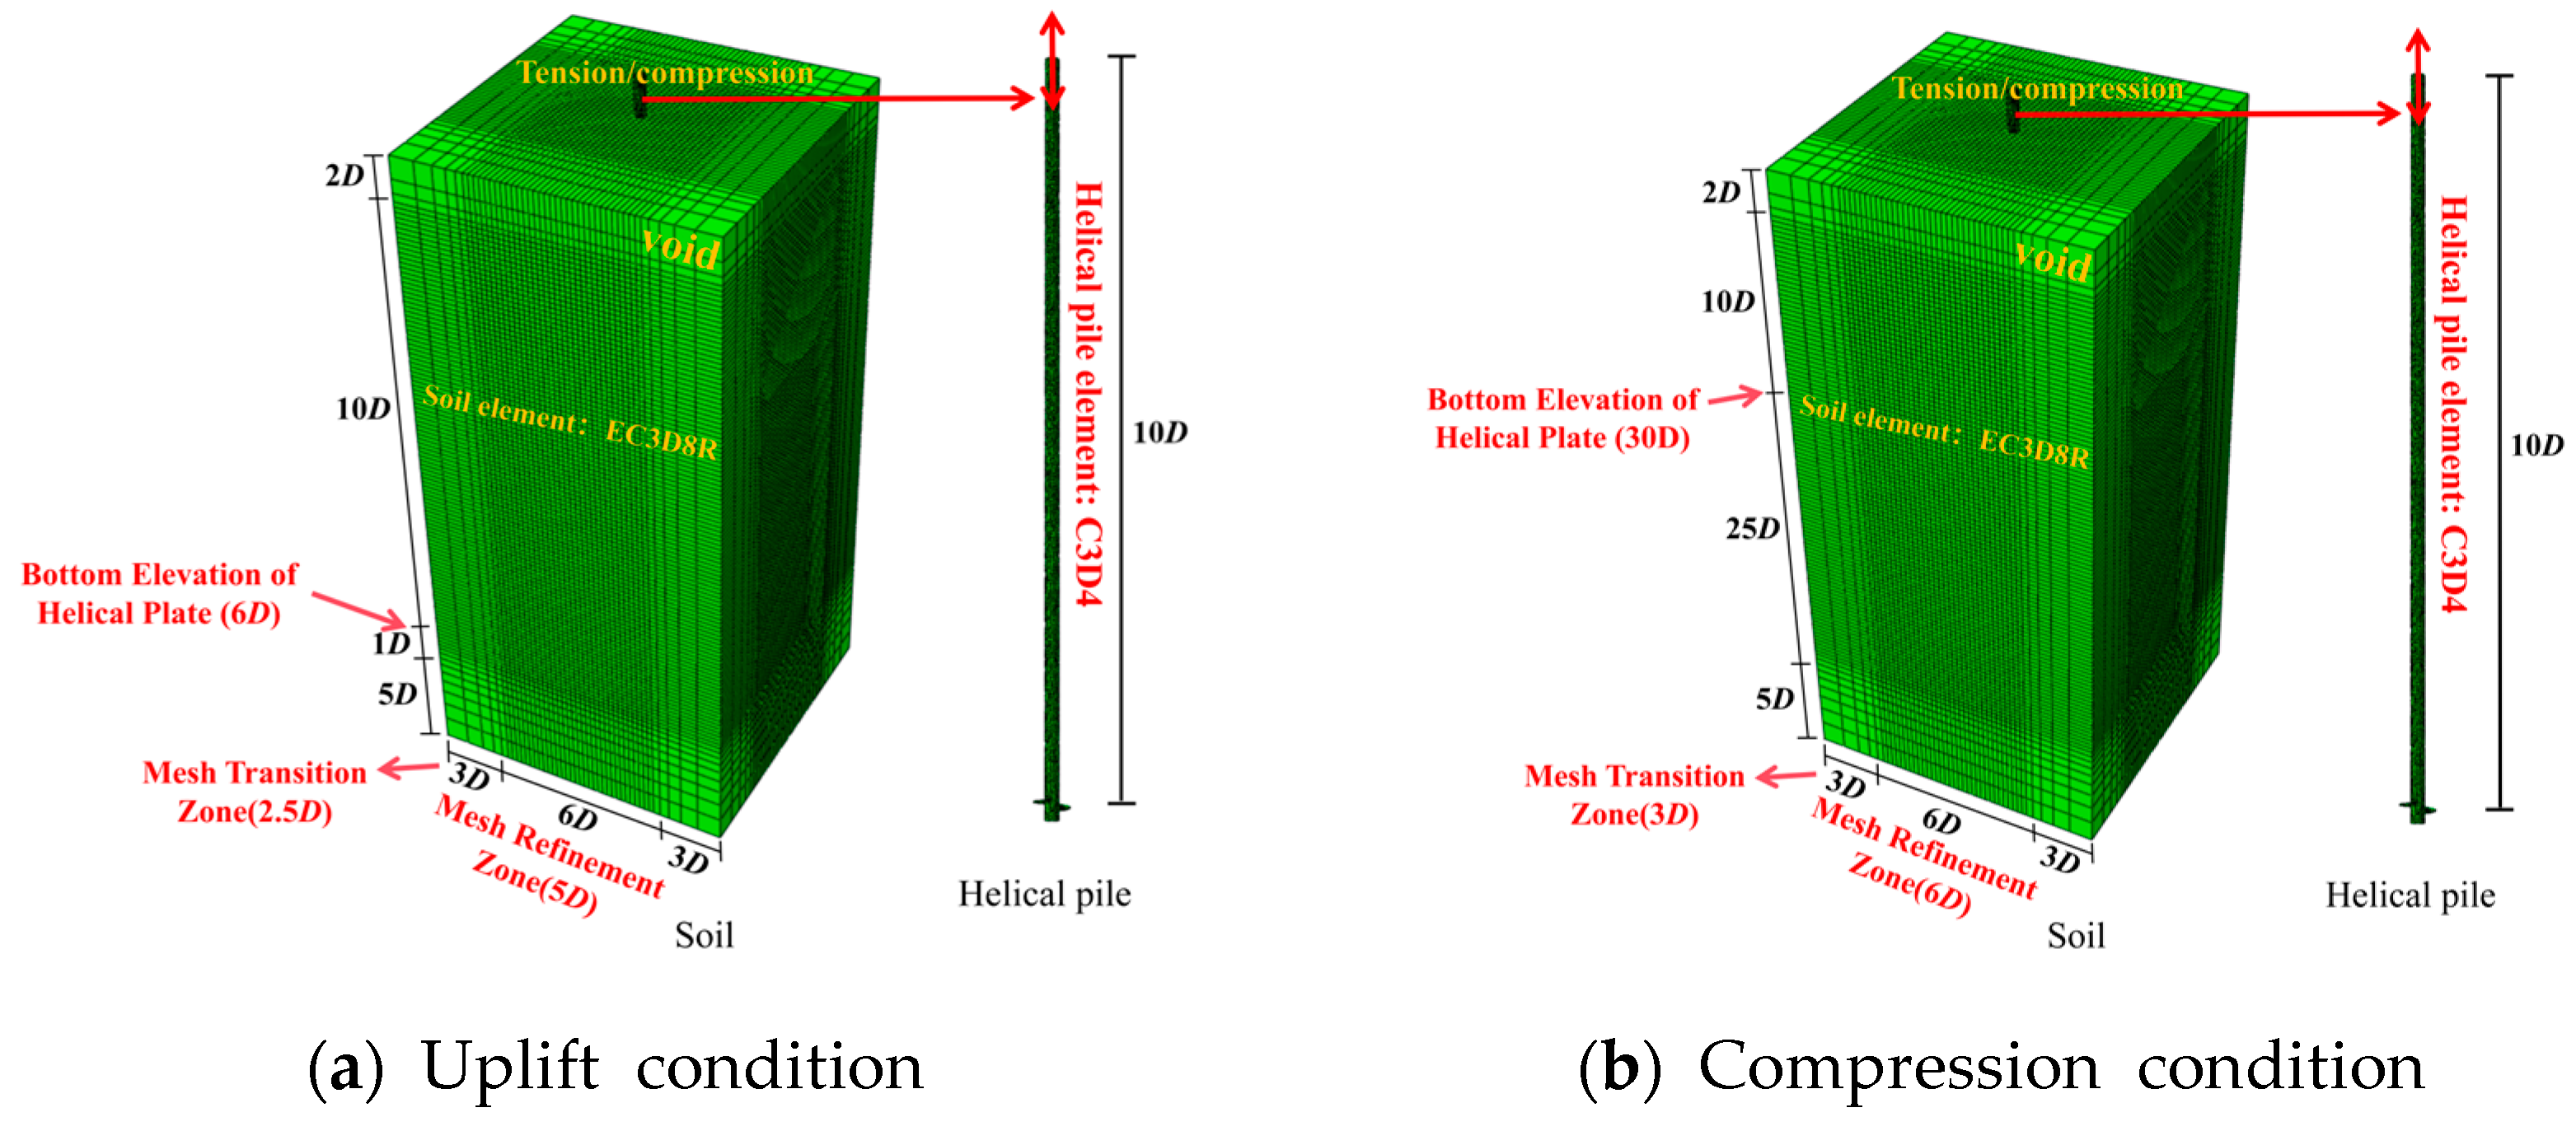
3.1. Model Overview
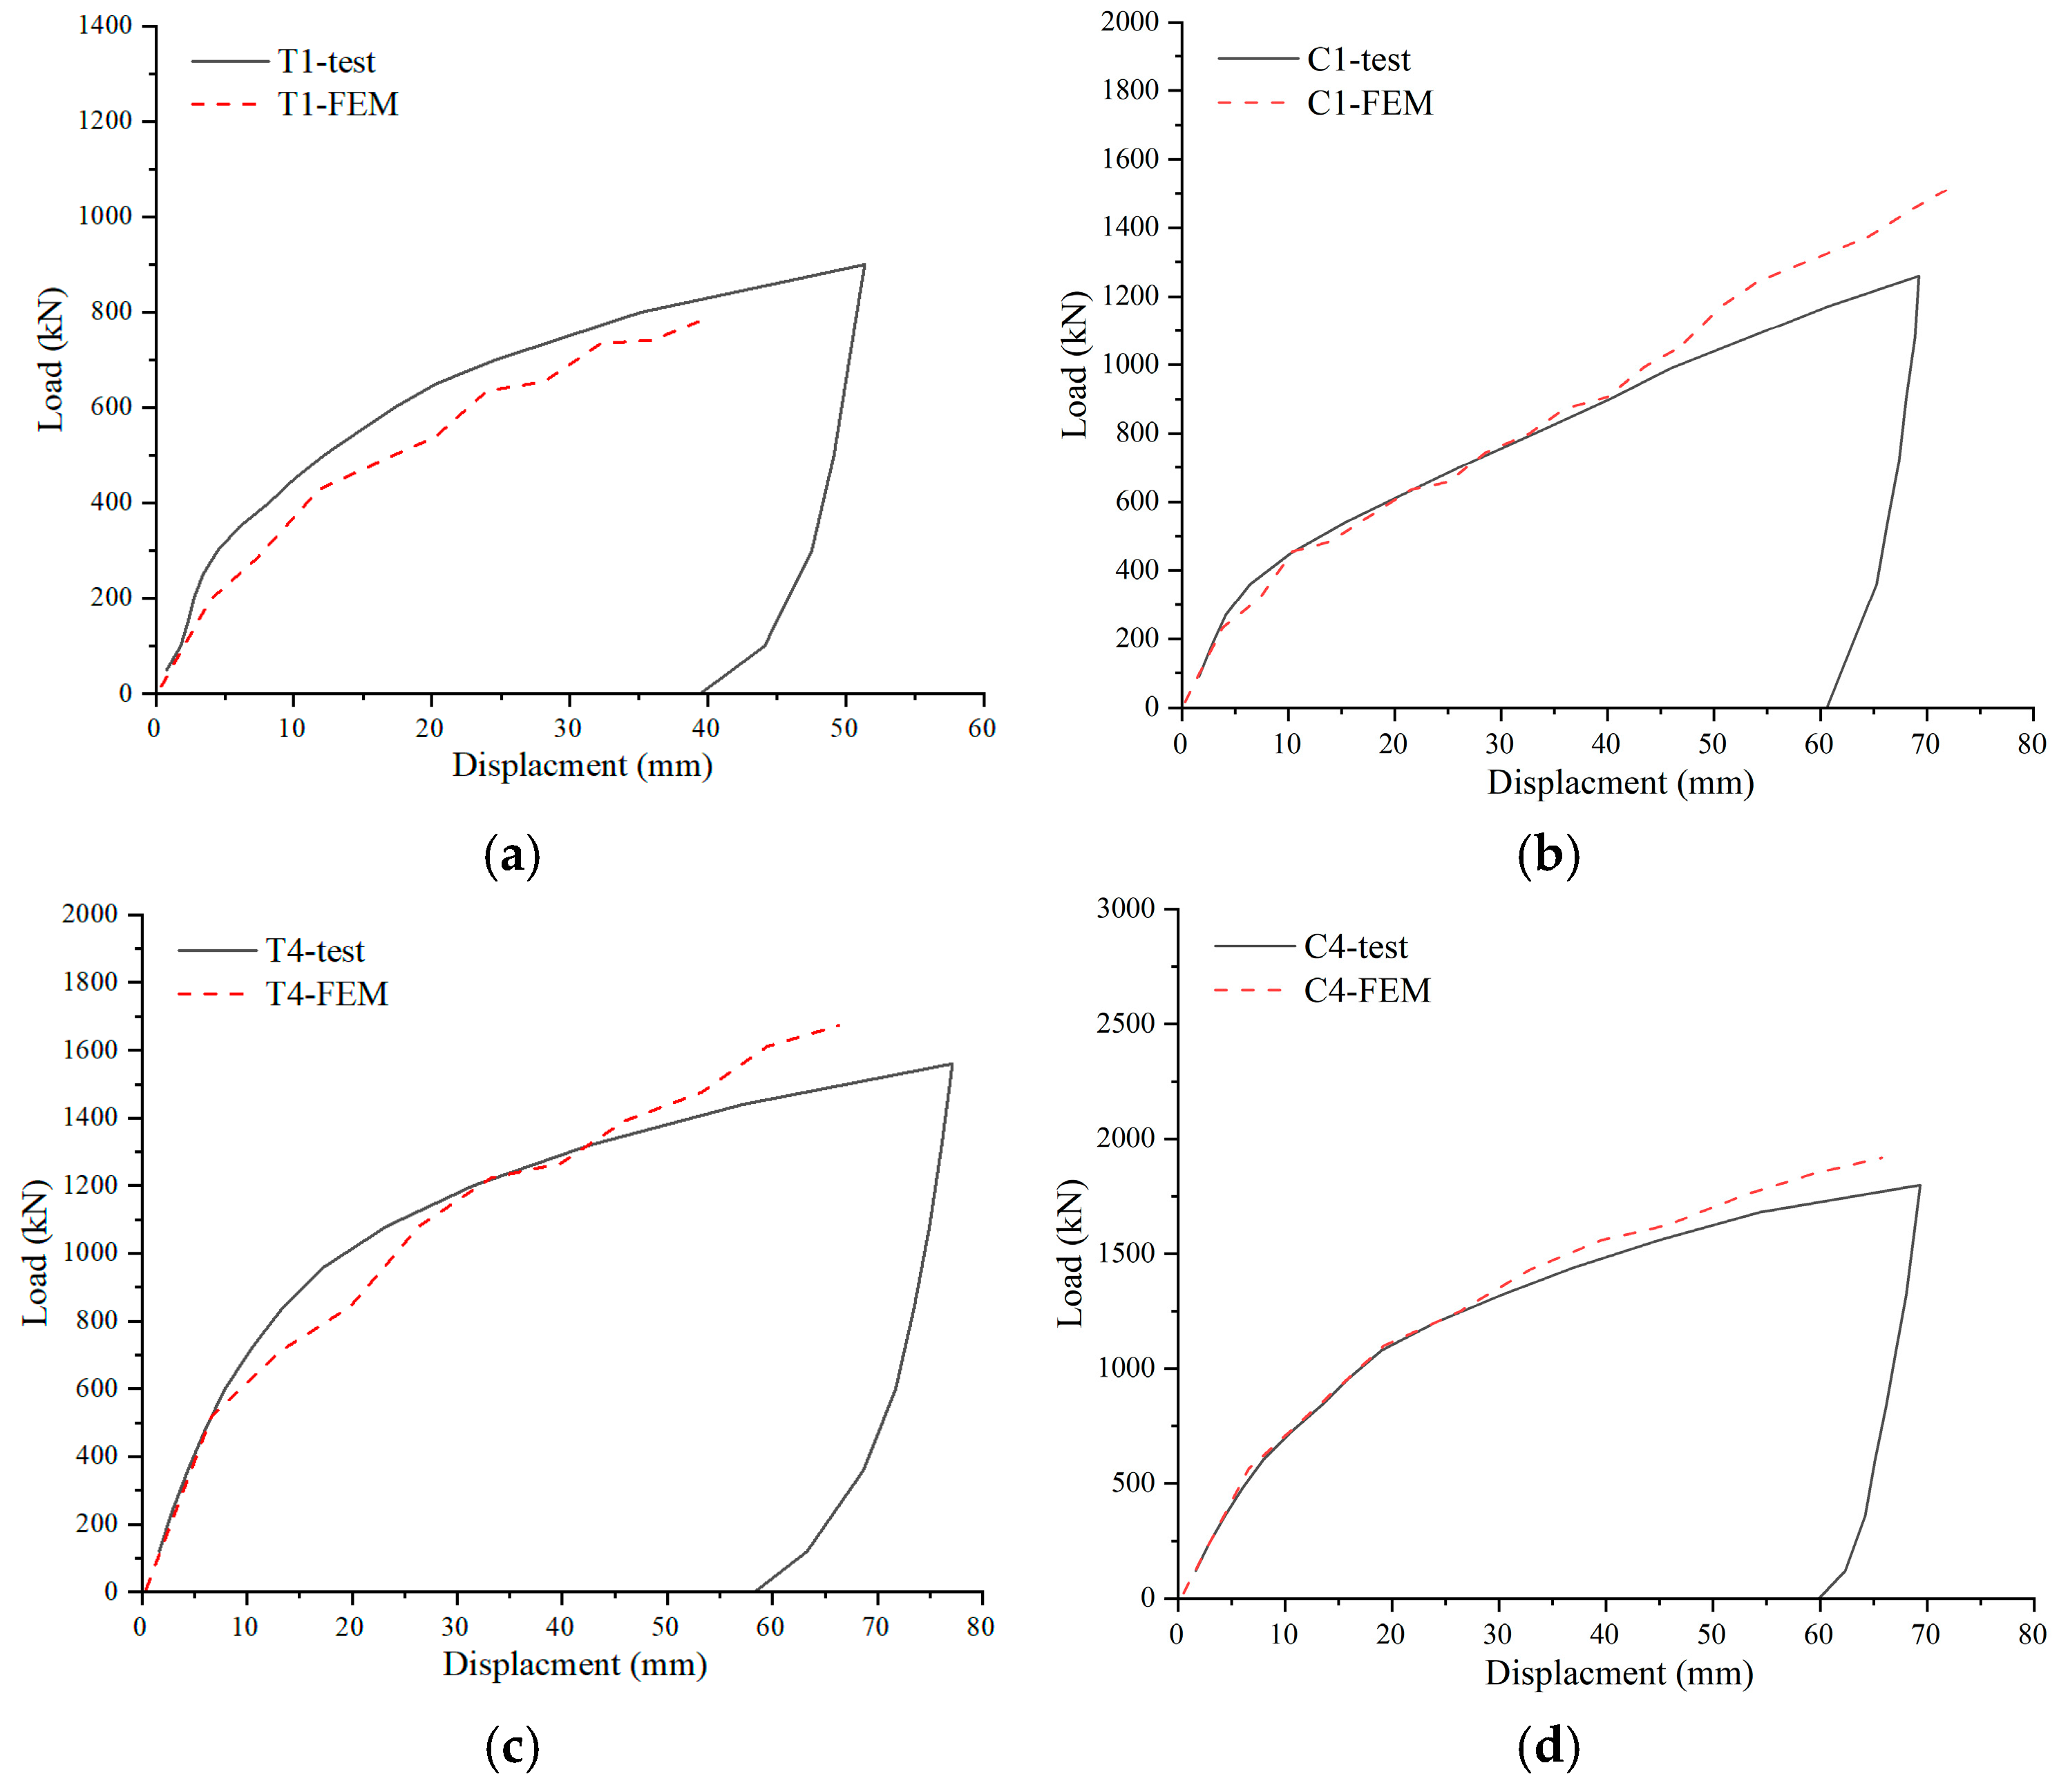
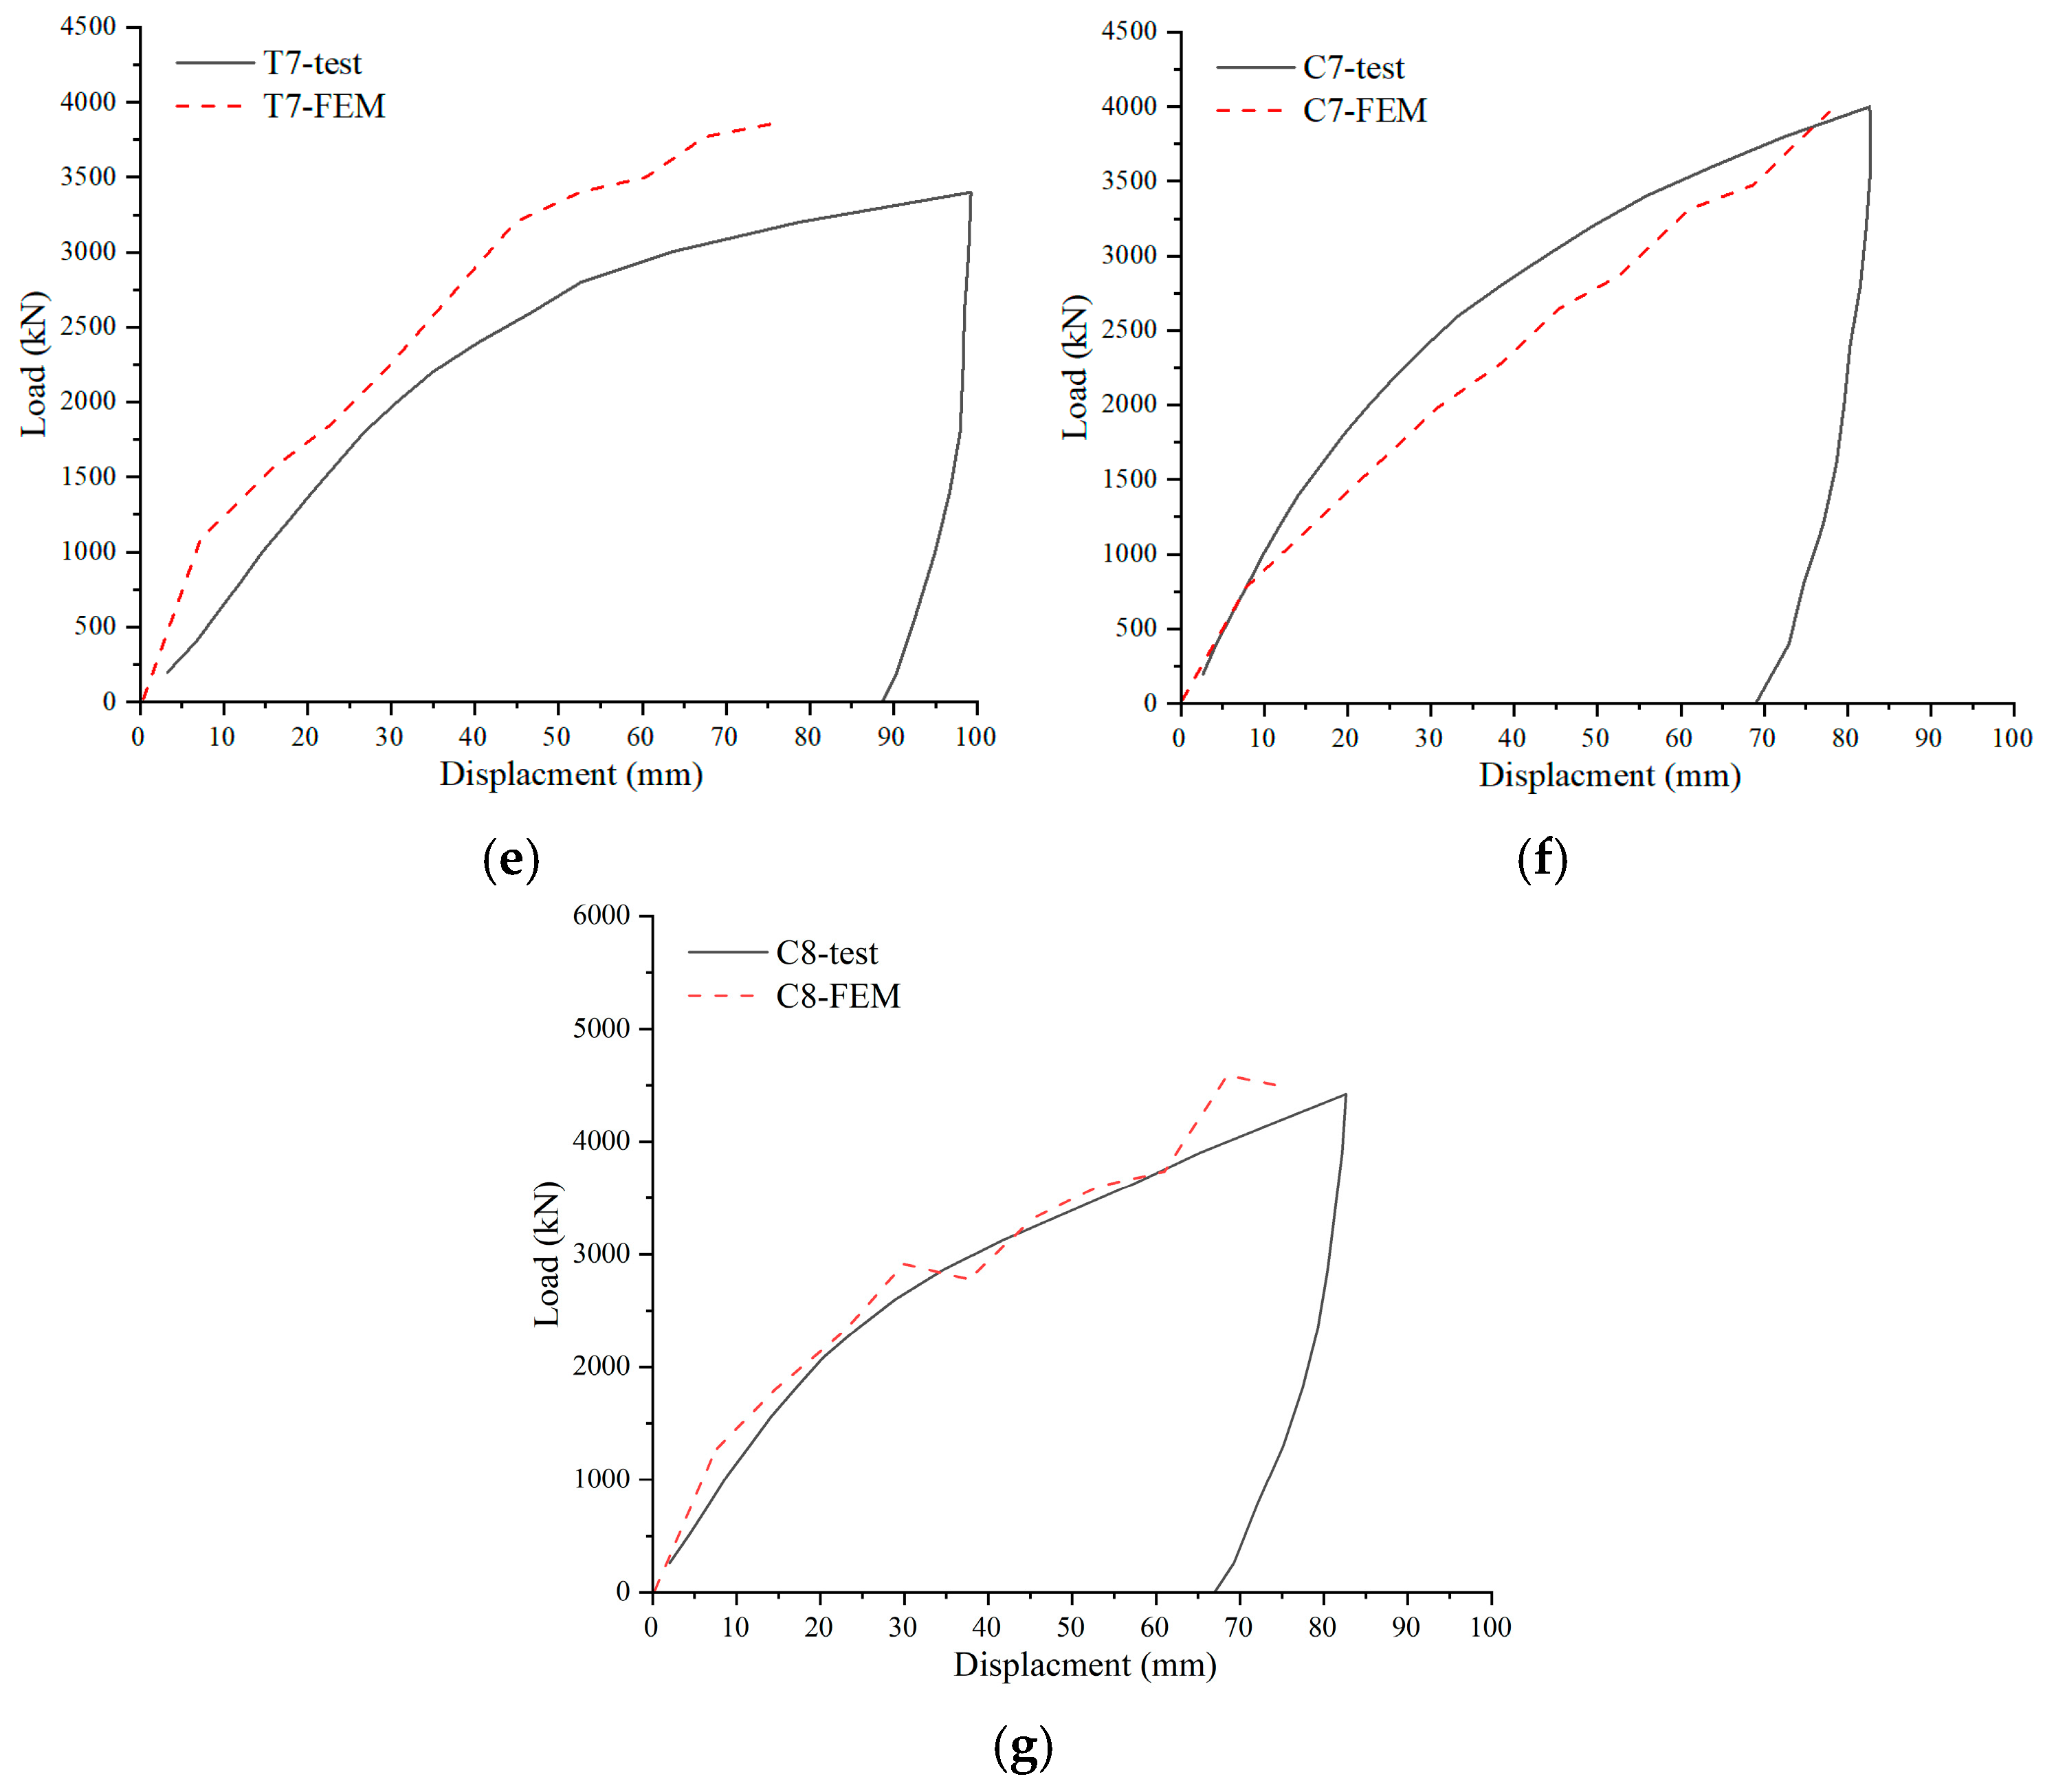
3.2. Model Validation
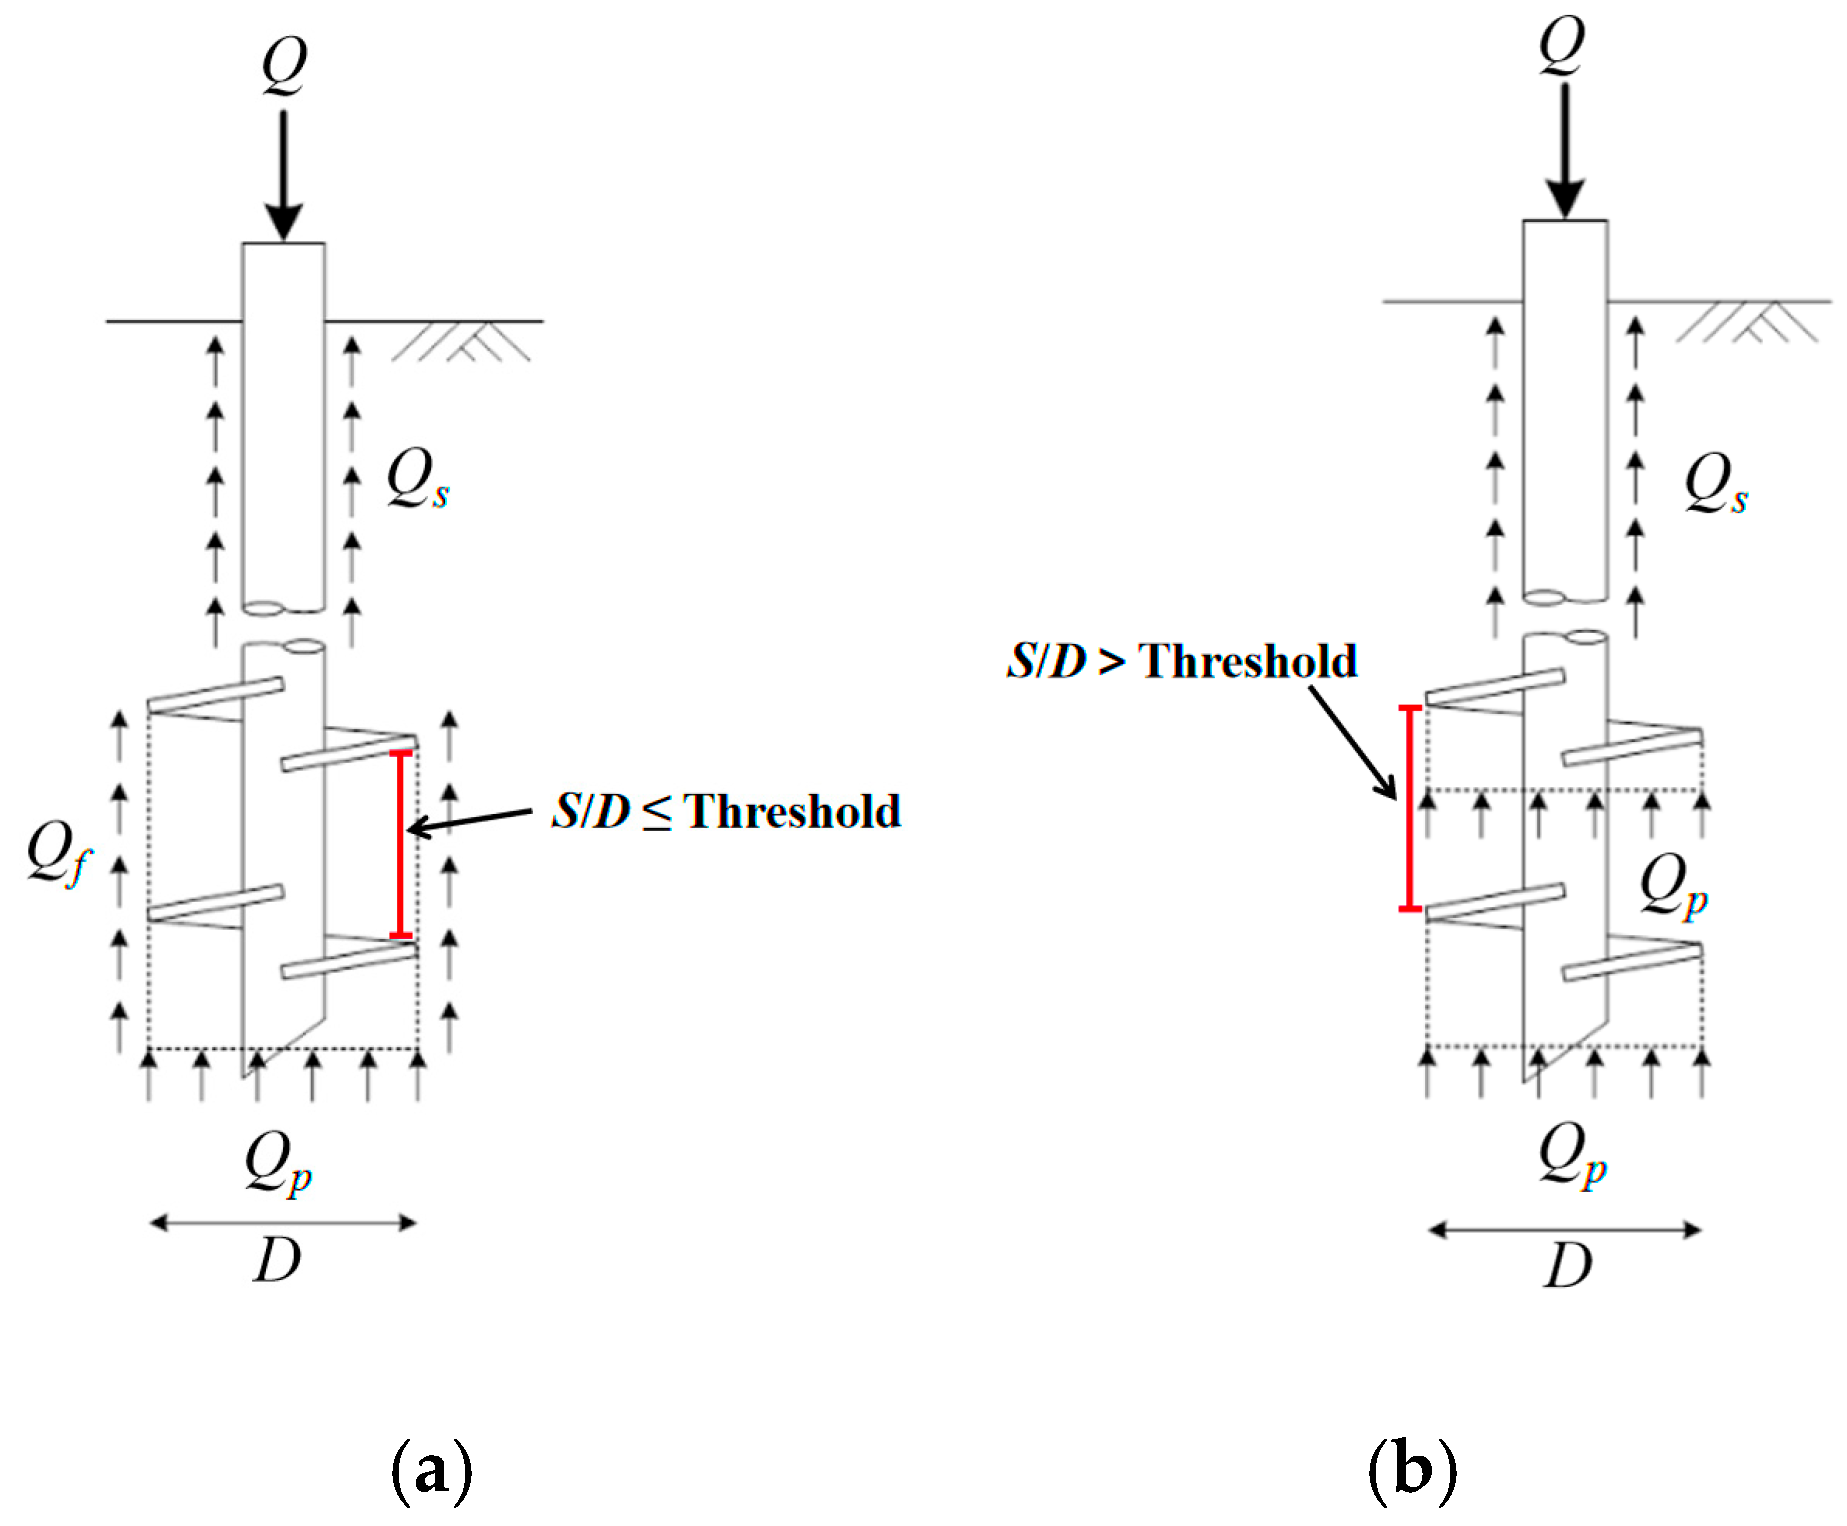
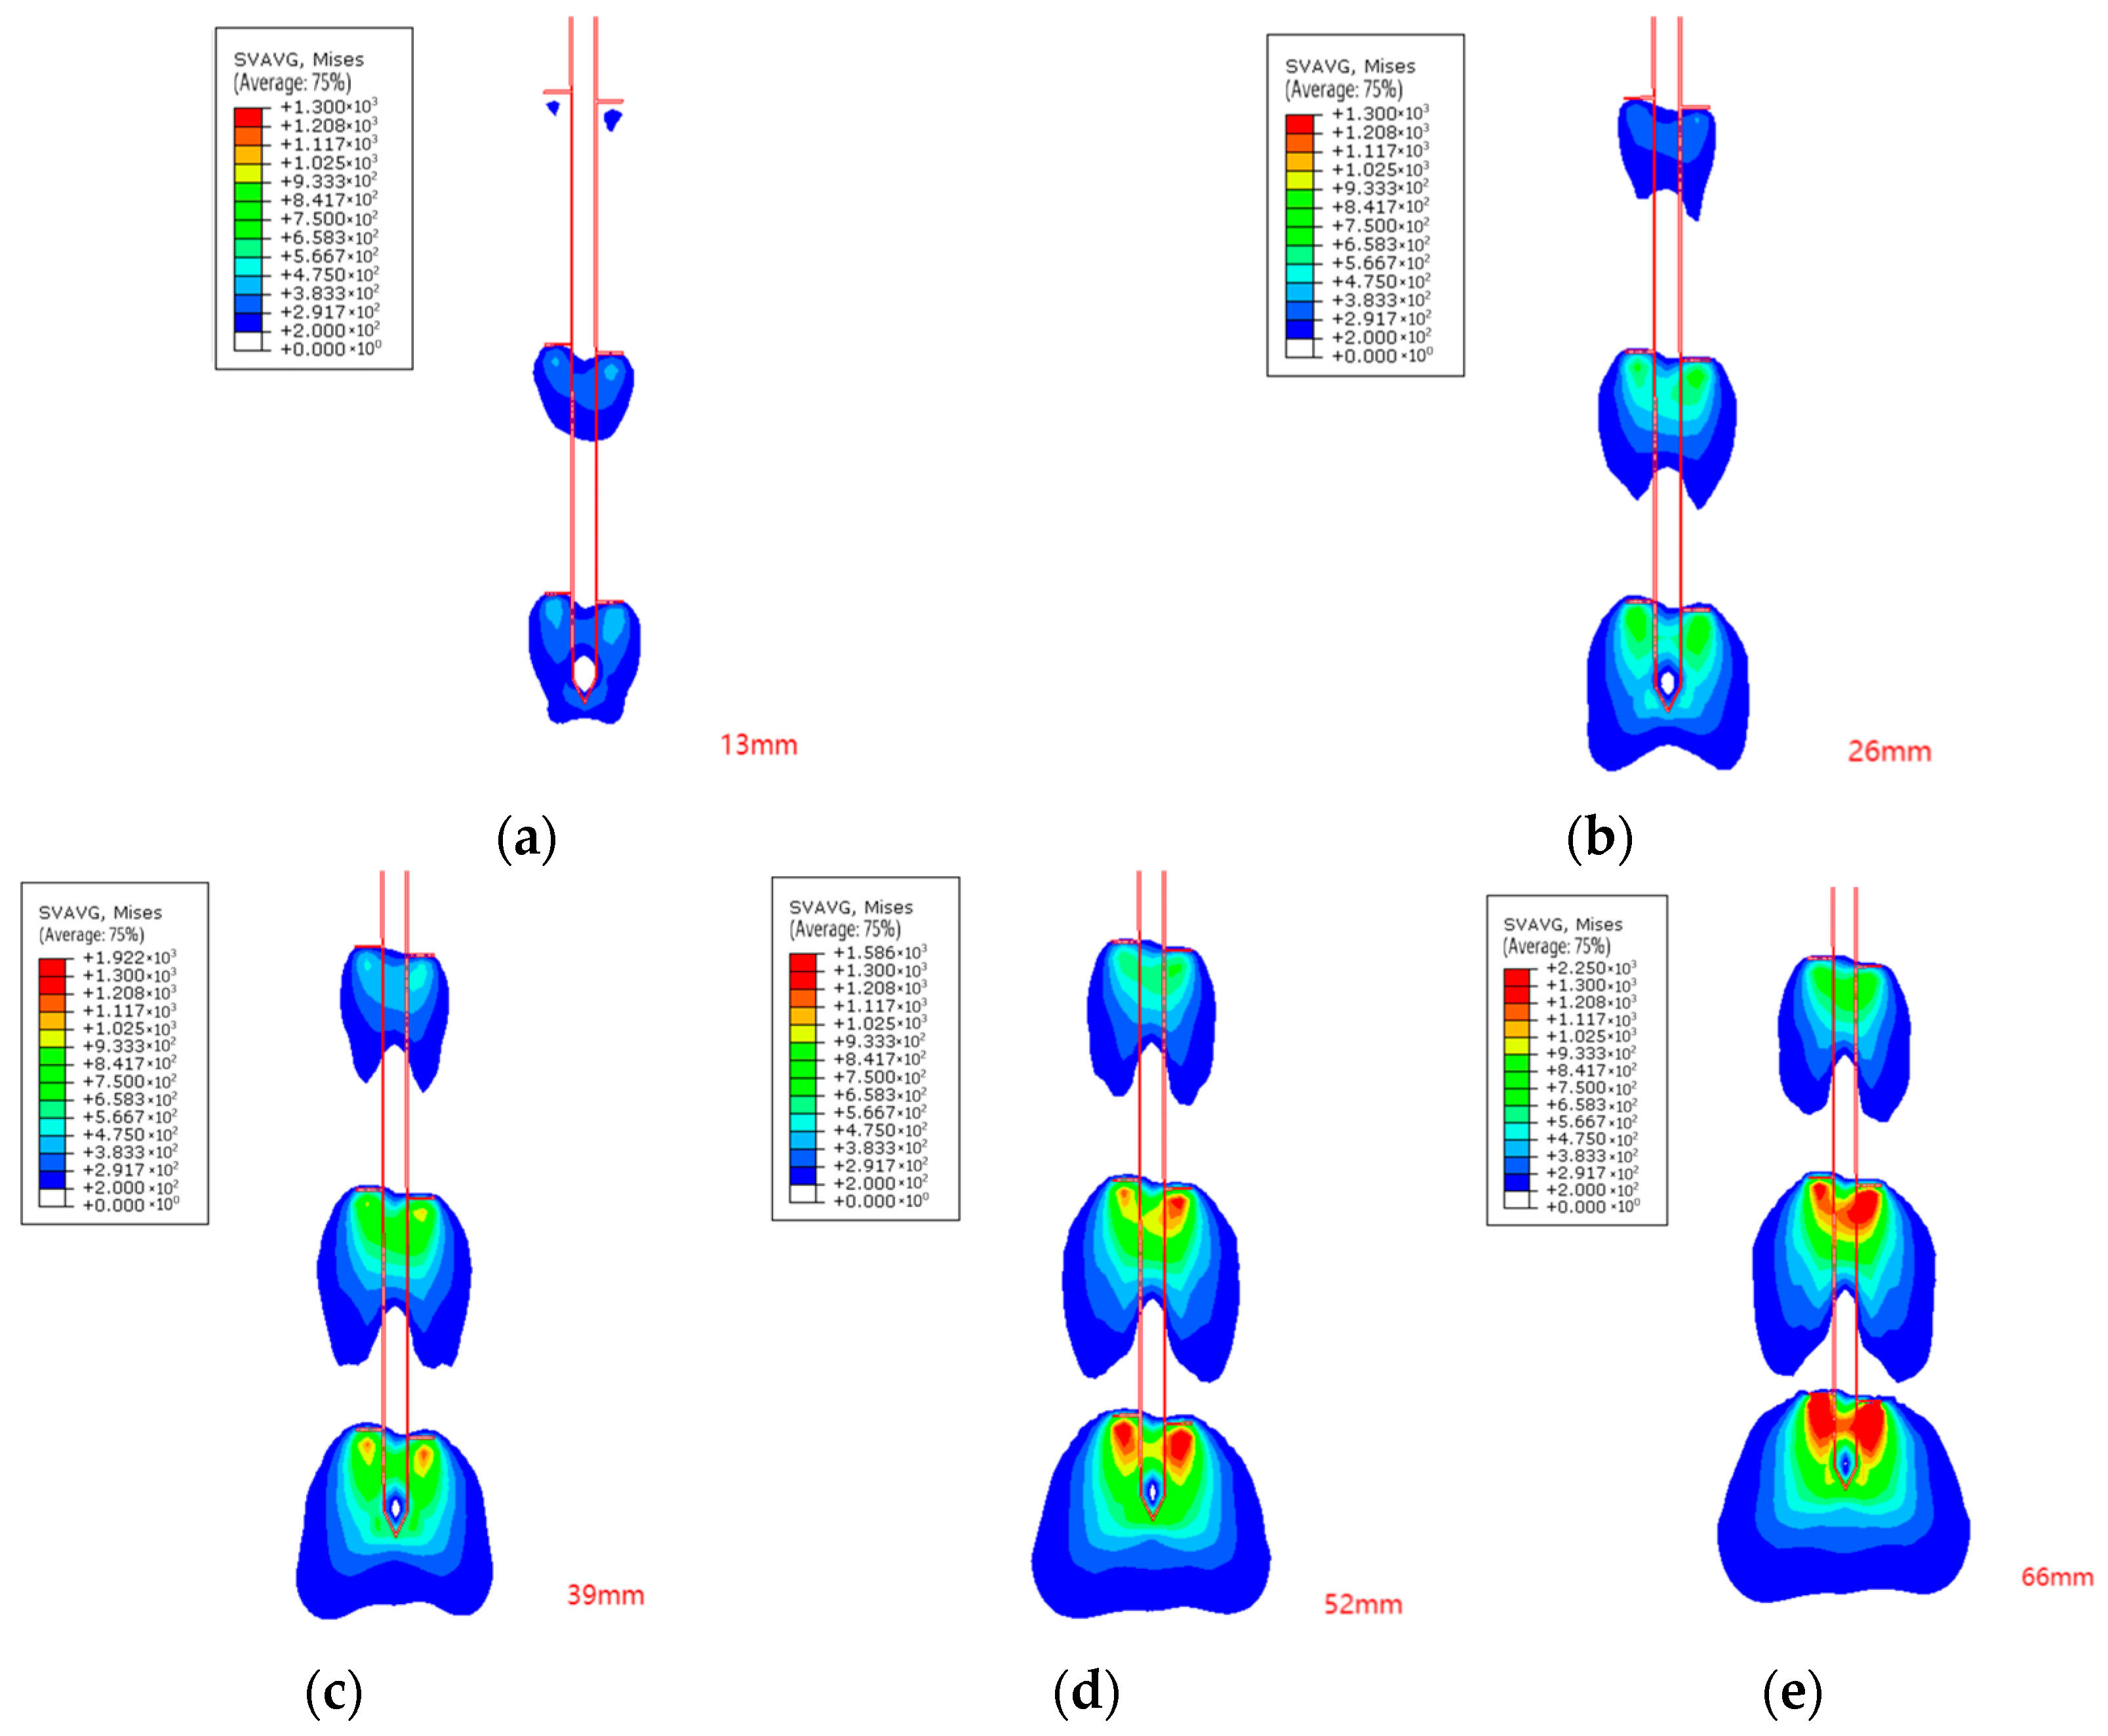
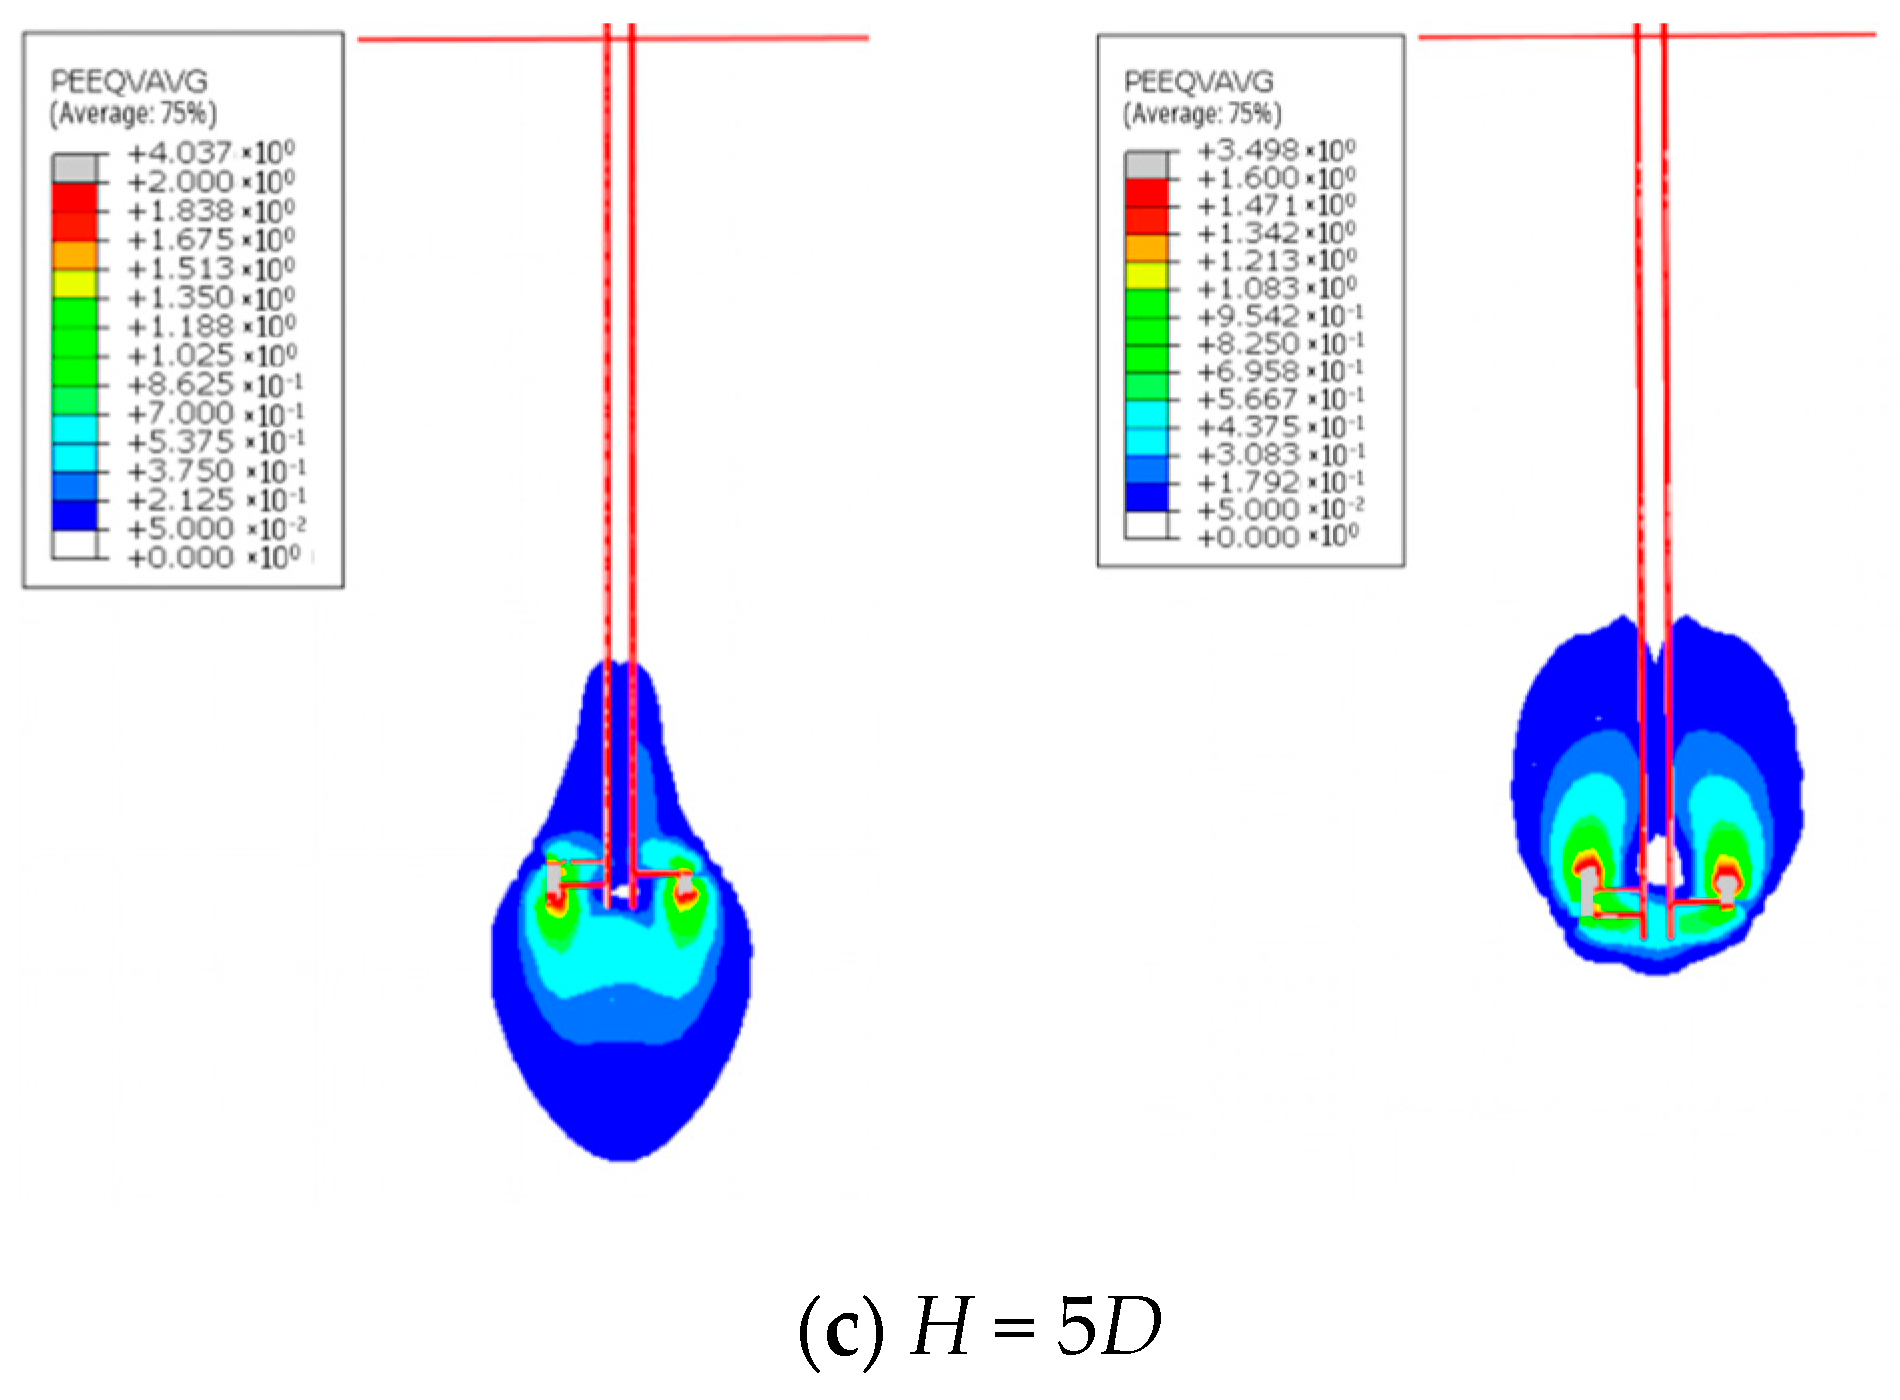
3.3. Failure Mechanism
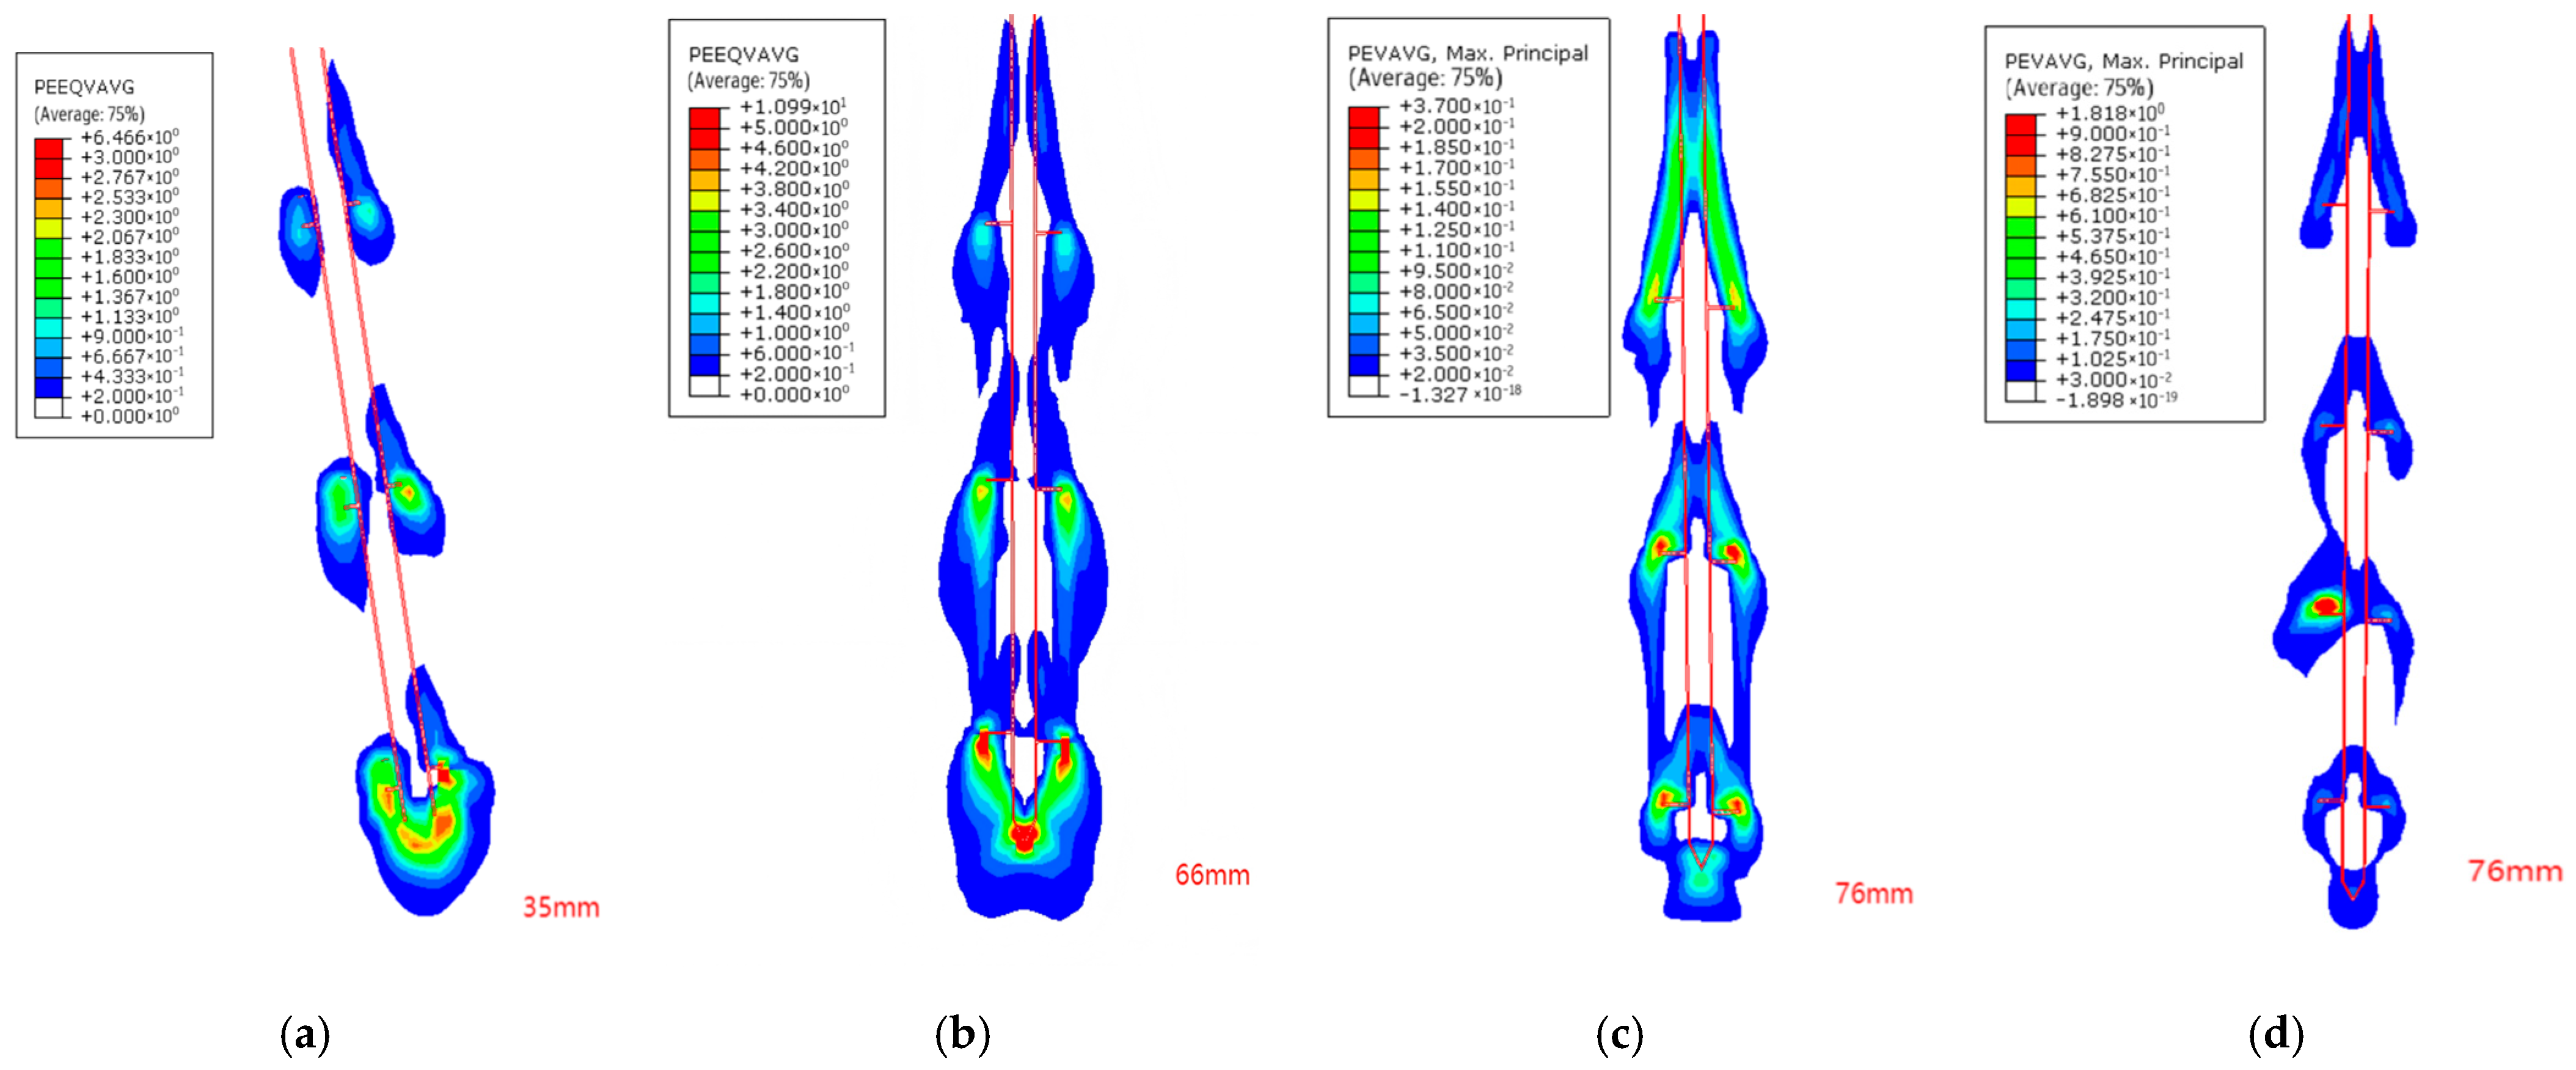
- (1)
- For C4–C10 cases (Figure 9b–d), plastic strain concentrated around anchor plates, forming maximum high-PEEQ zones beneath the bottom plate, consistent with the end-bearing mechanism in the CS model. Progressively expanding continuous shear bands developed along plate edges, exhibiting embedment depth-dependent spatial distribution that aligned with lateral earth pressure effects. The axisymmetric cylindrical plastic zone distribution matched the CS-predicted failure mode.
- (2)
- For C1–C3 cases (Figure 9a), isolated plastic strain zones between plates showed no interconnected shear bands, conforming to the localized punch-through failure of the IB model. The linear correlation between the bottom plate plastic zone radius and the geometric radius indicated plate-area-dominated end resistance.
- (1)
- CS failure mode: The compression capacity exhibits positive correlations with the bottom plate radius (R) and embedment depth (H):
- (2)
- IB failure mode: Capacity follows an exponential relationship with plate radius:
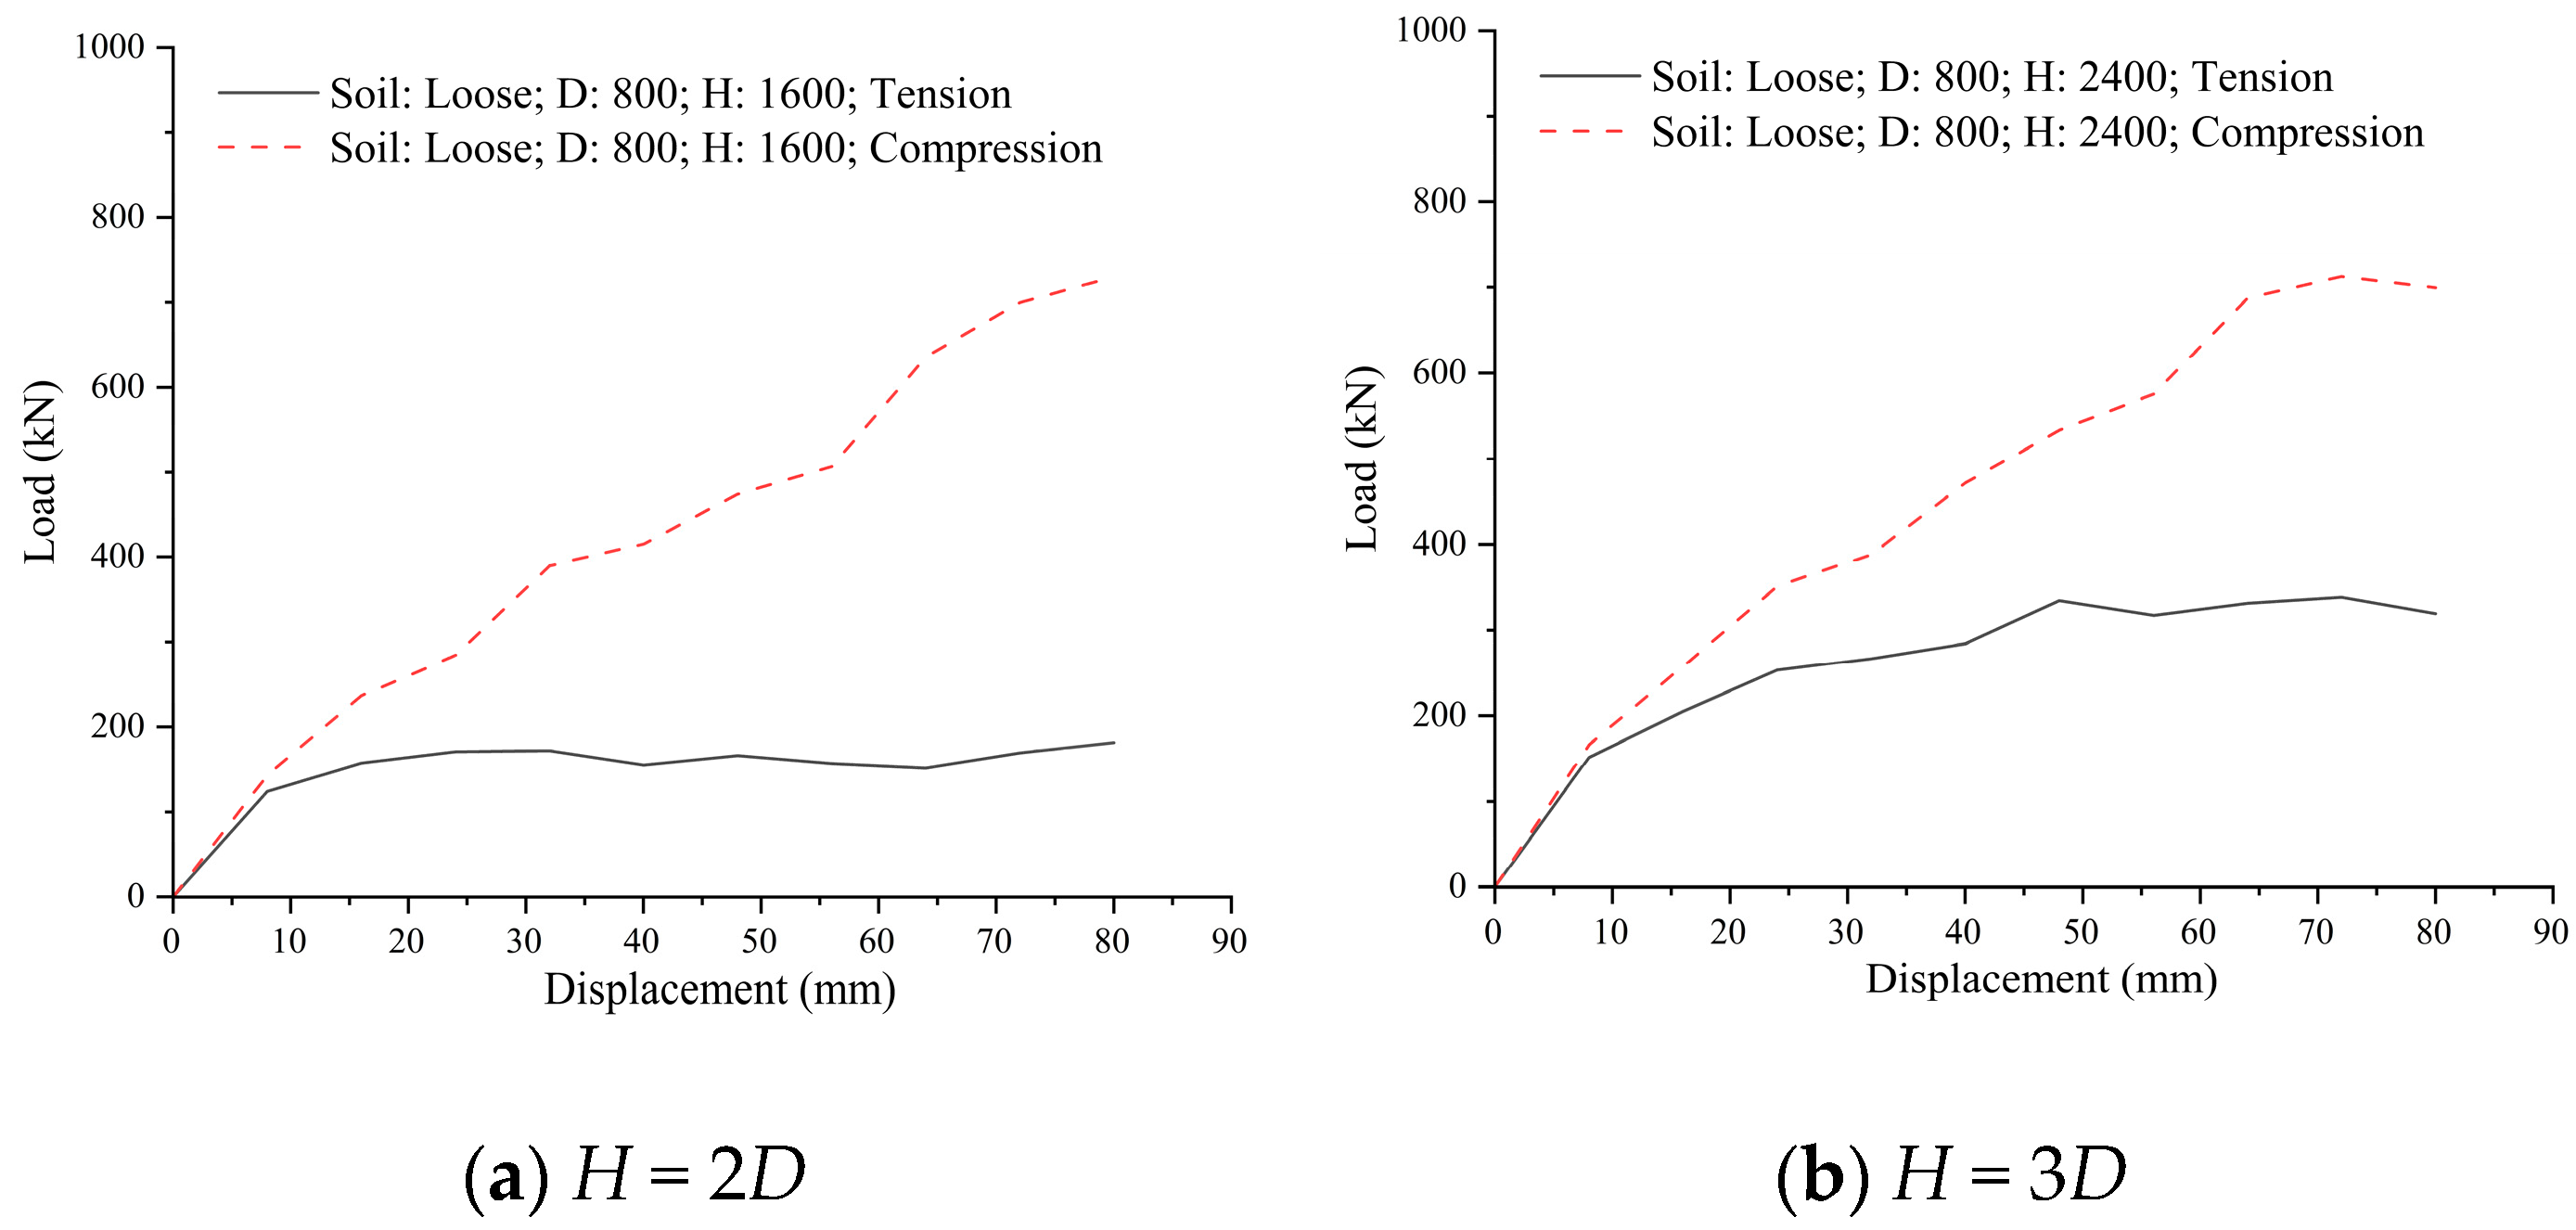
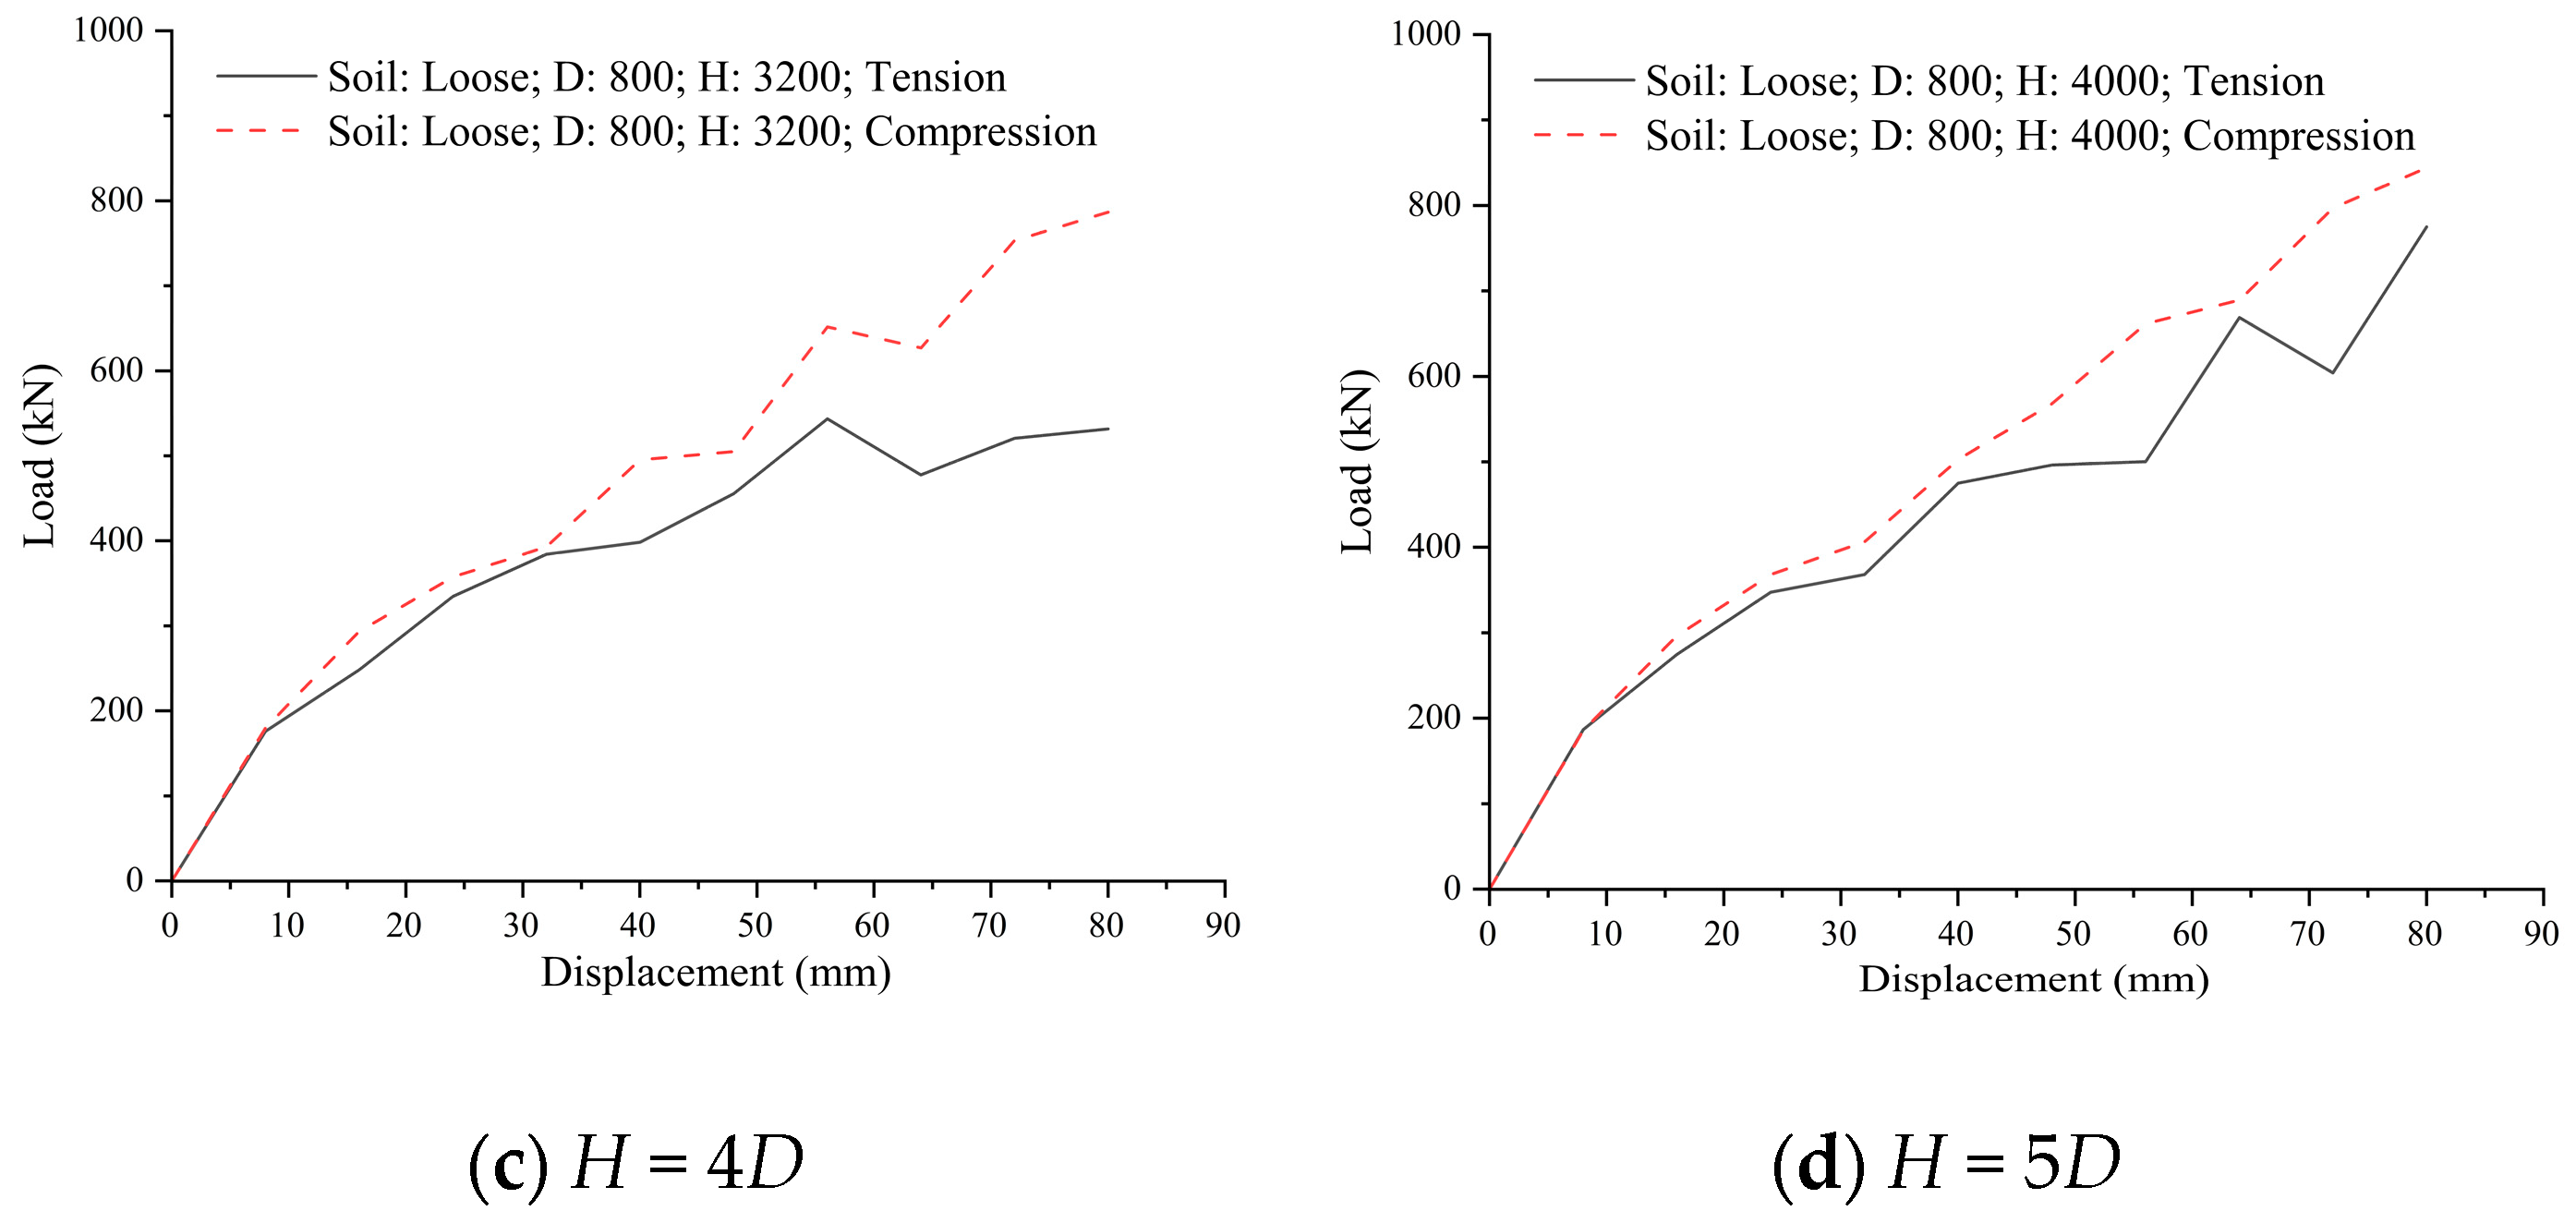
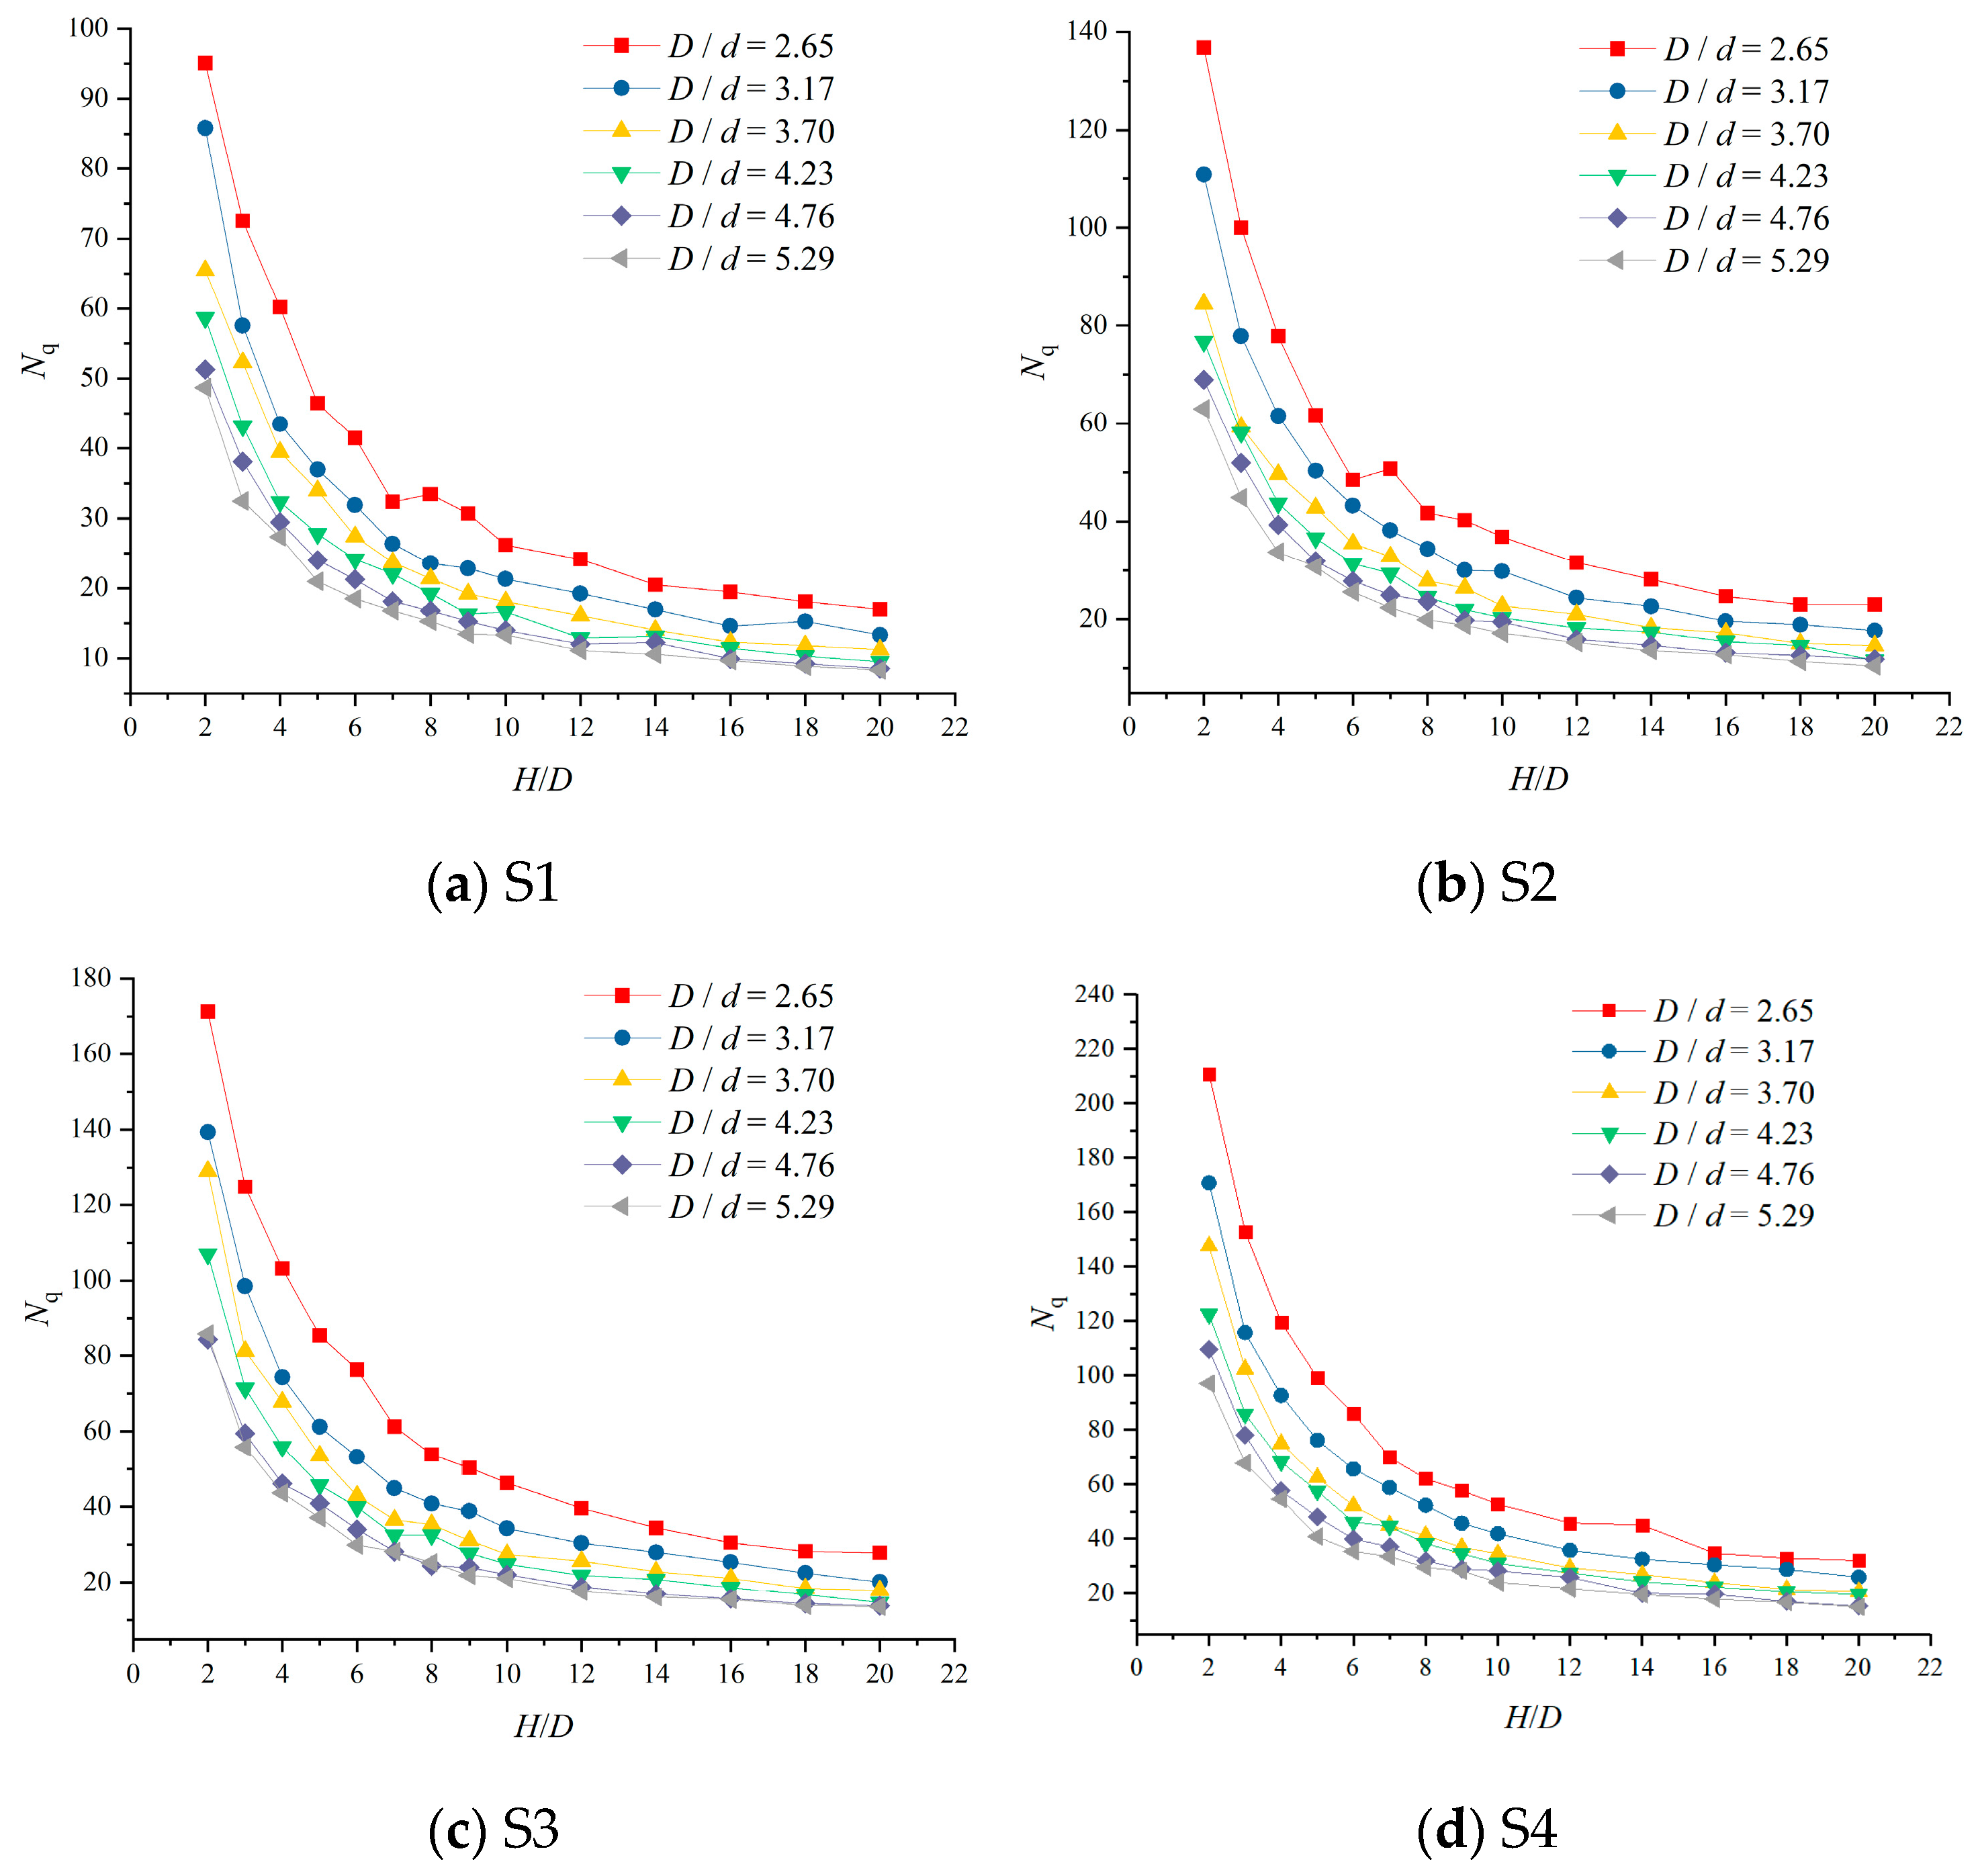
4. Parametric Analysis
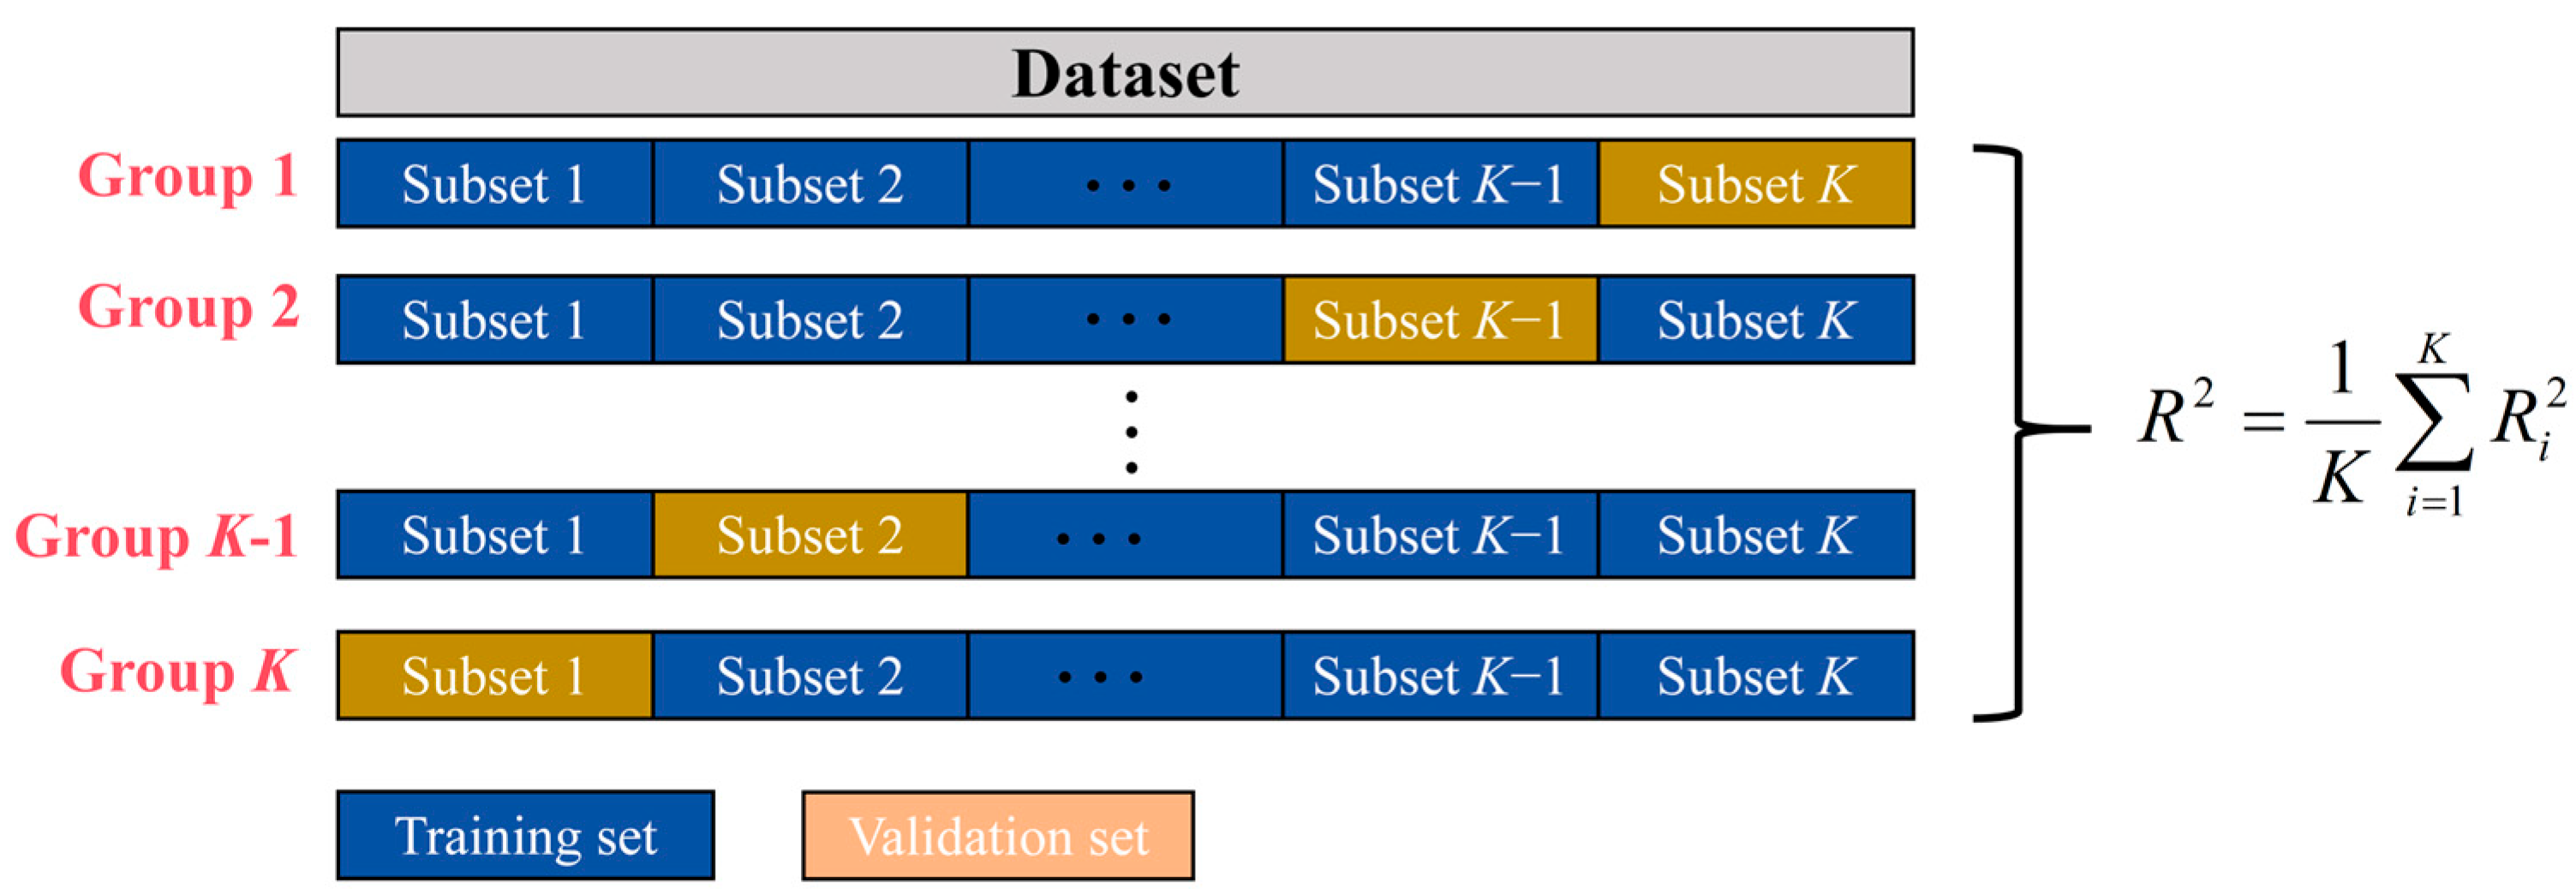
5. Formula Fitting
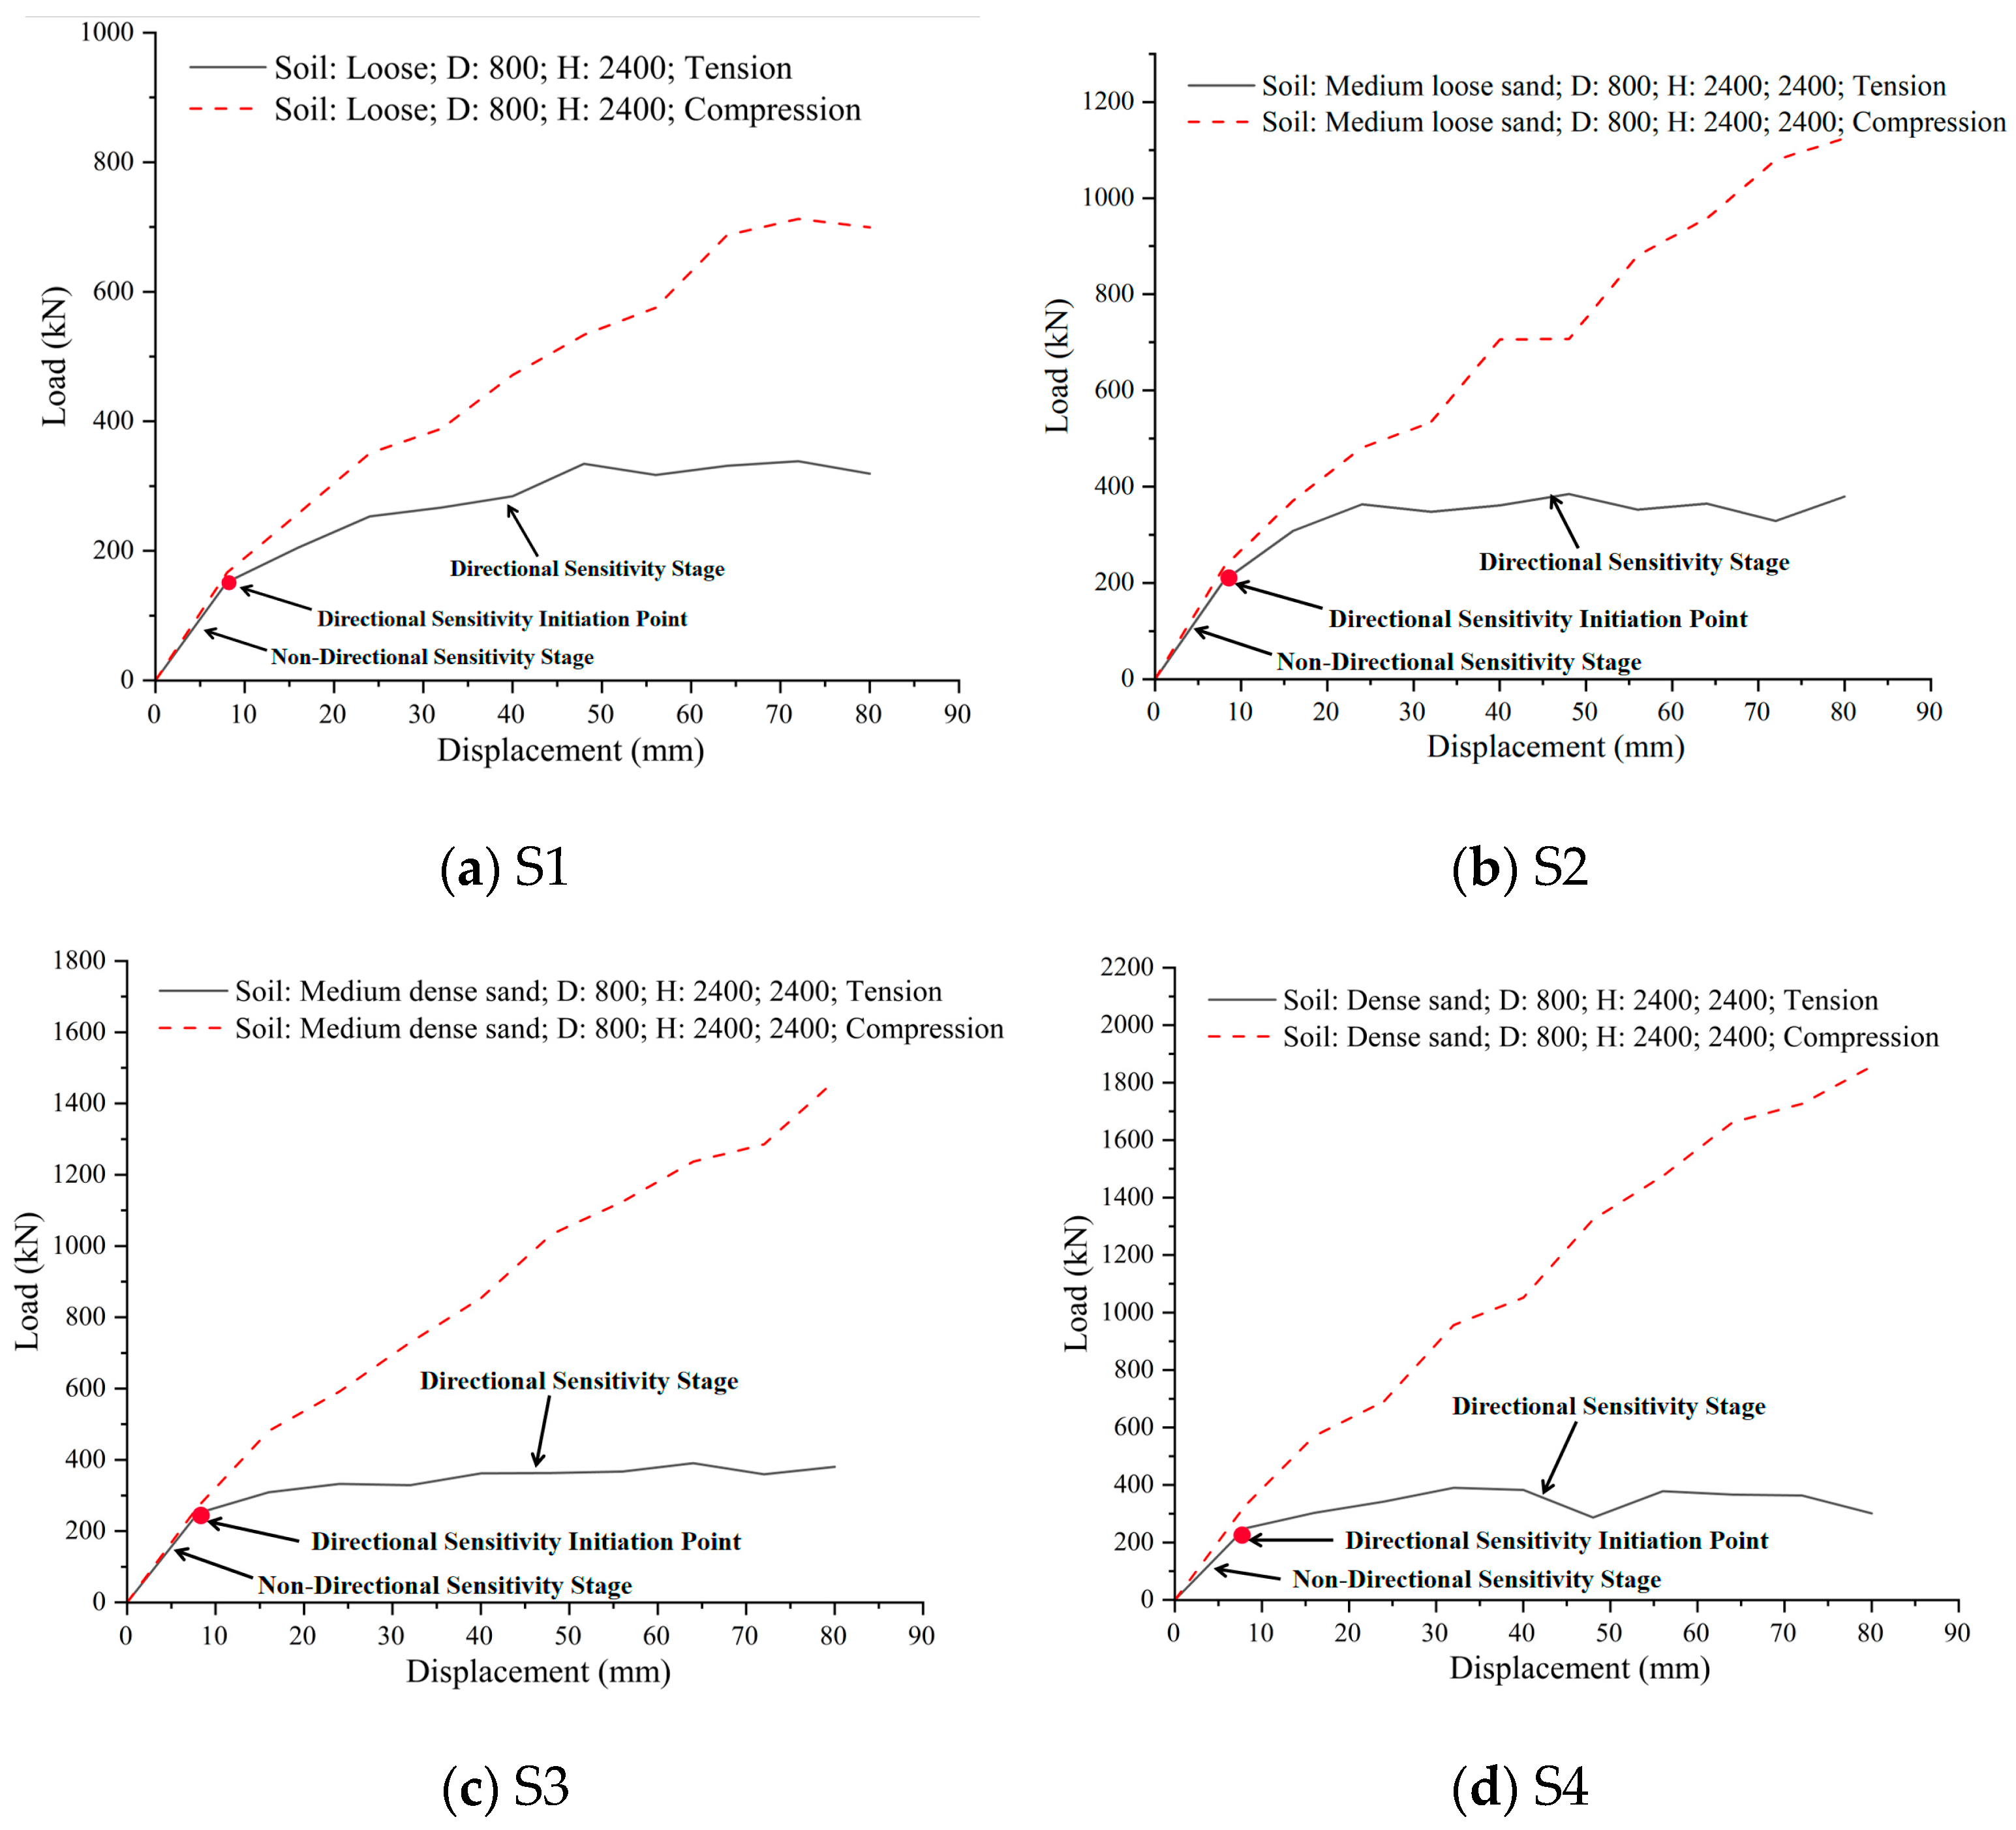
5.1. Key Parameter Extraction
5.2. Compressive Capacity Factor
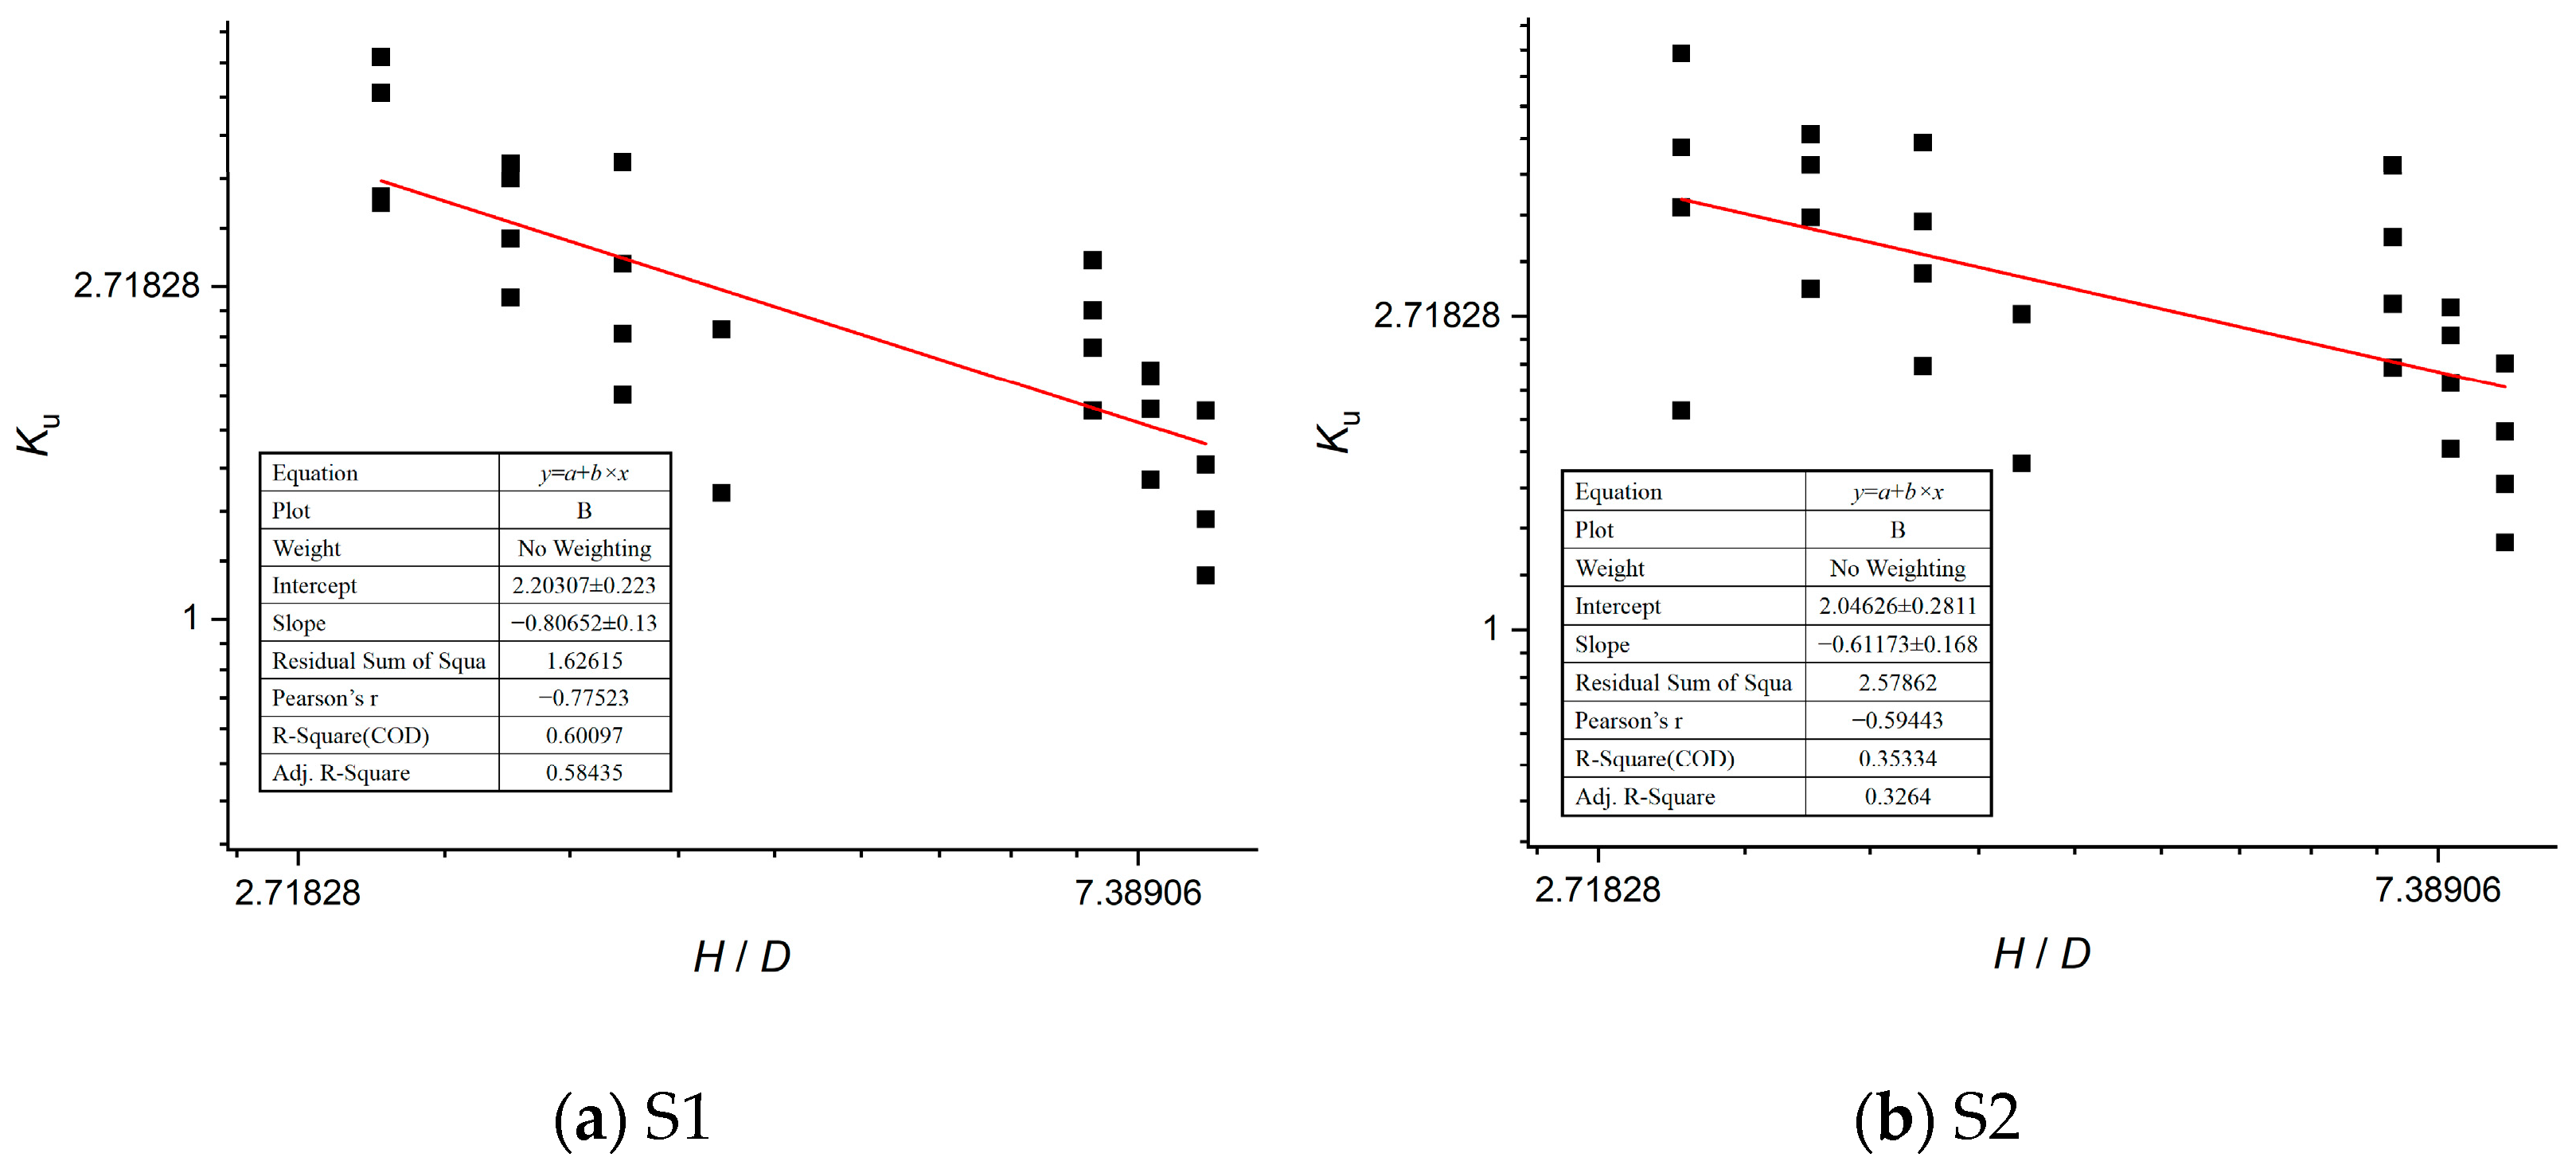
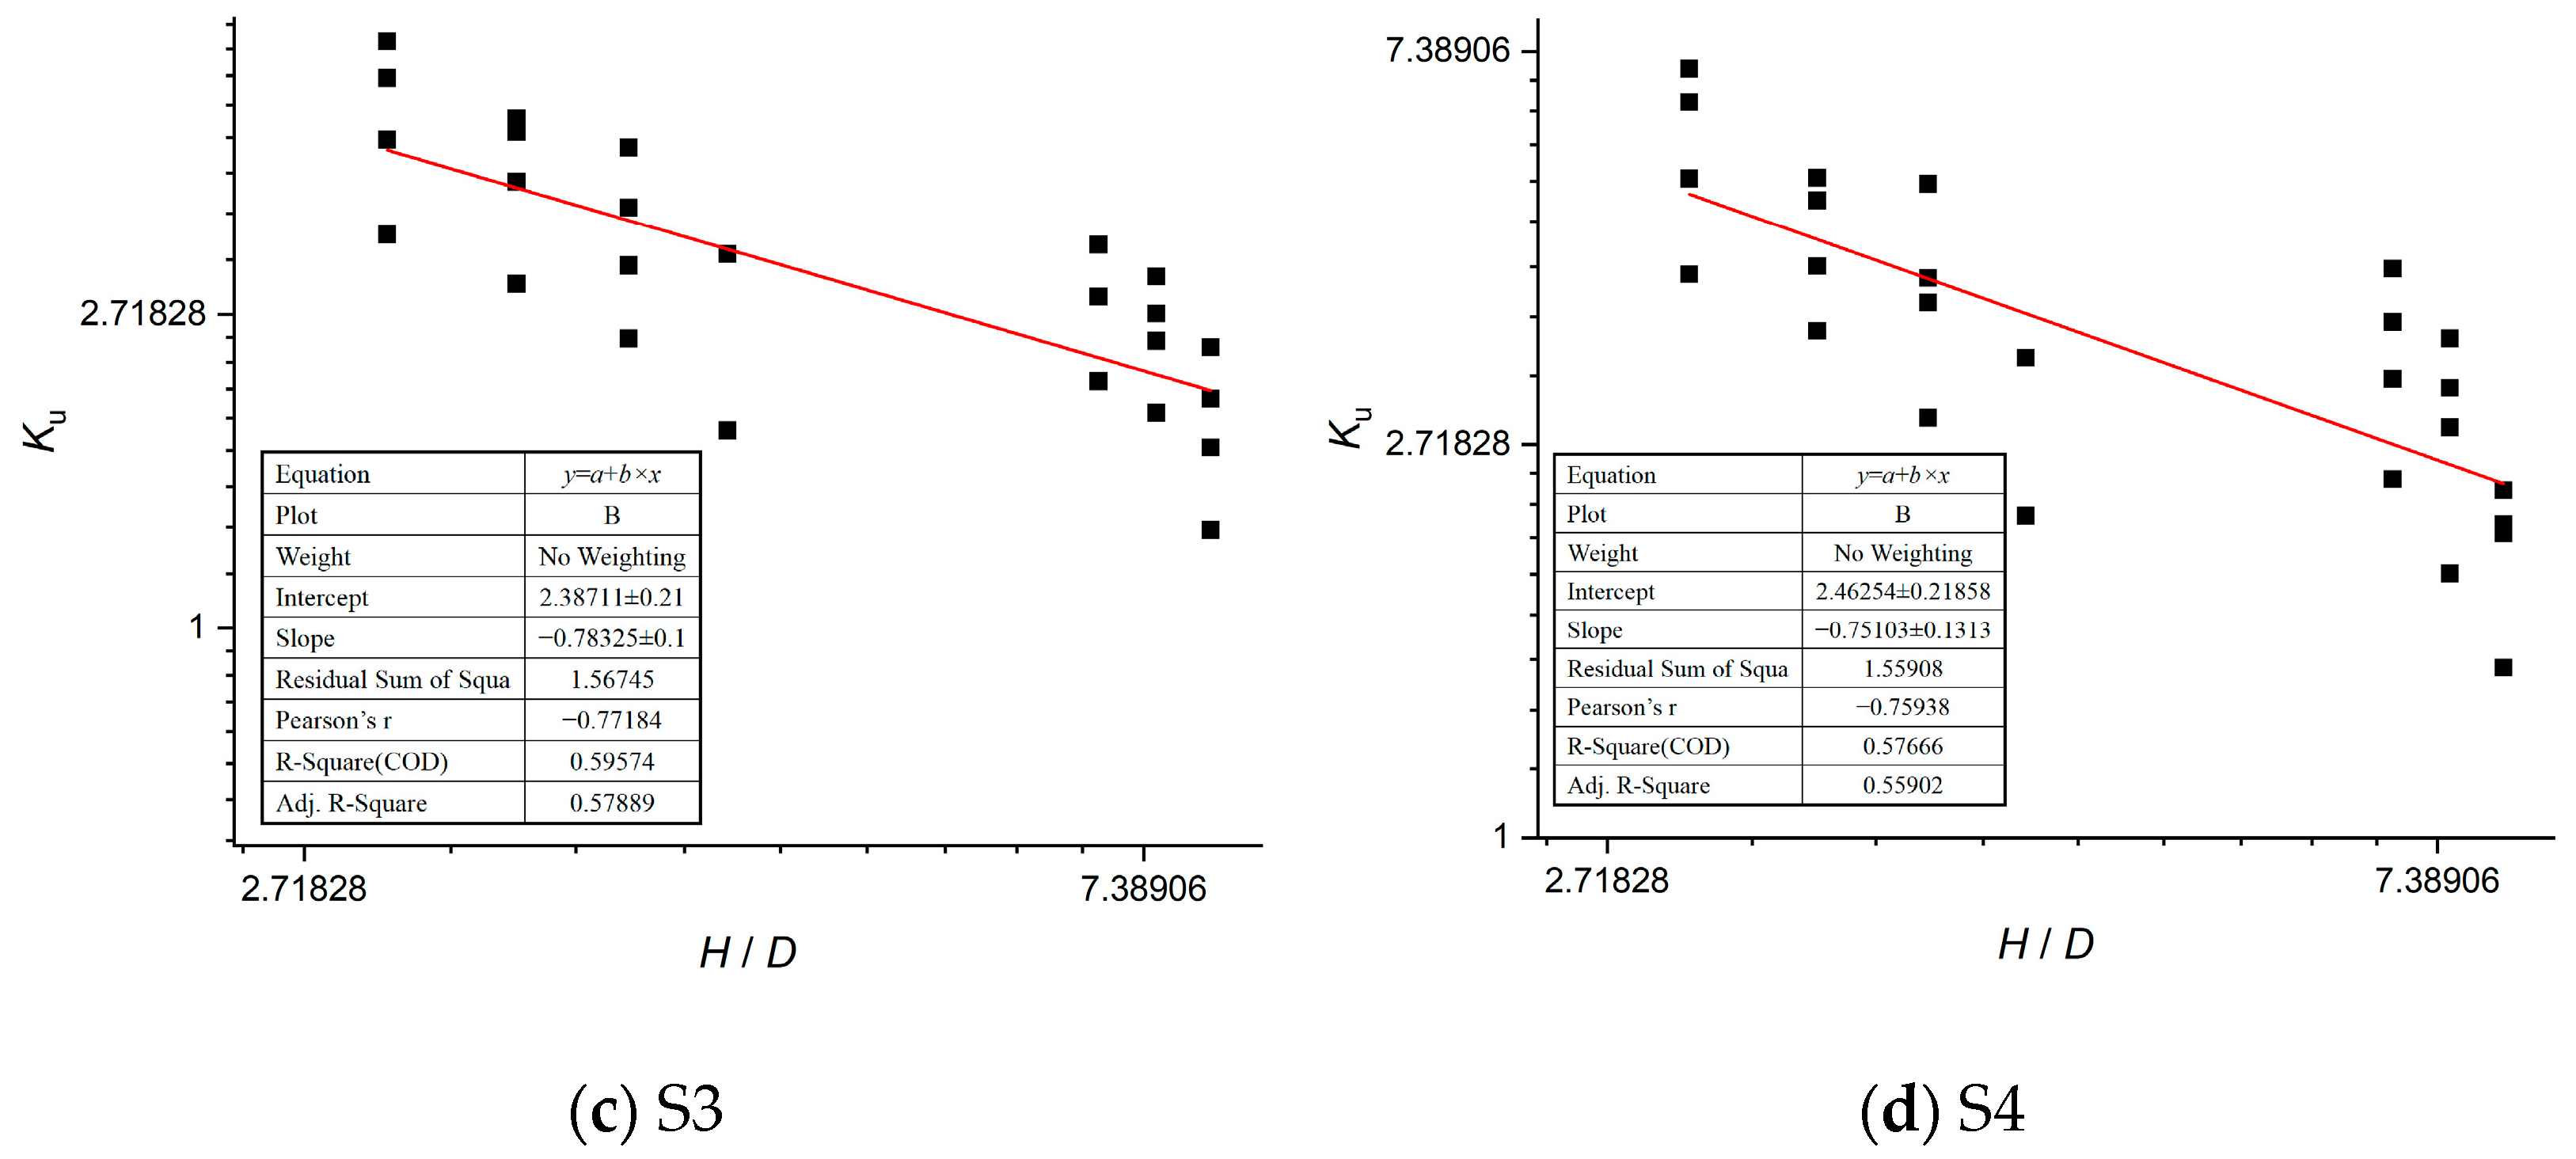
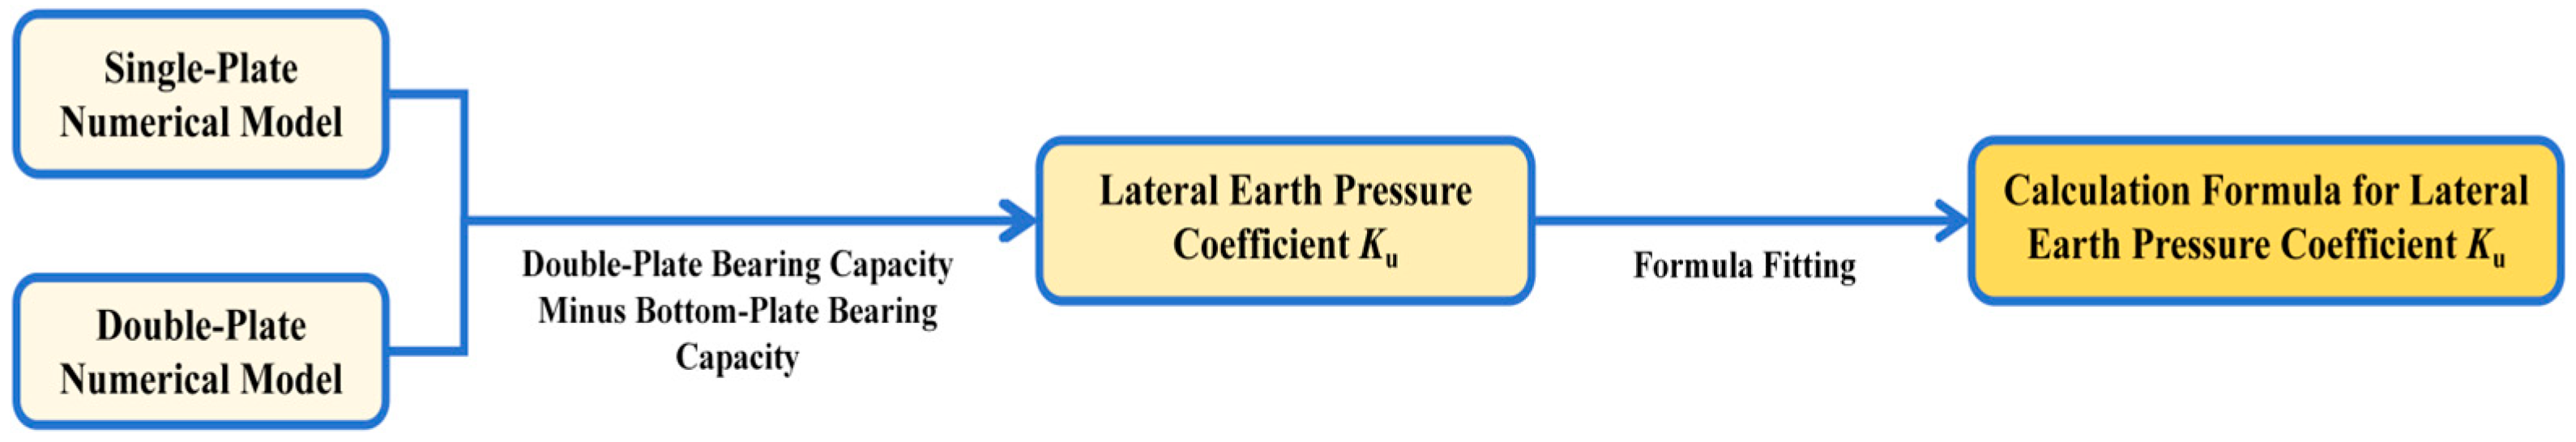
5.3. Lateral Earth Pressure Coefficient
5.4. Formula Validation
6. Conclusions
- (1)
- During compressive loading, the load–displacement curve progresses through sequential phases: an initial near-linear stage, a non-linear transition, and a subsequent near-linear stage. The curve slope decreases with displacement, indicating the progressive degradation of soil–helix interlock. Compressive capacity exhibits an exponential relationship with helix diameter.
- (2)
- Under CS failure mode, a maximum high-plastic-strain zone develops near the bottom helix, reflecting its end-bearing function. Progressively expanding shear slip bands form at helix edges, with spatial distribution positively correlating with embedment depth, consistent with lateral earth pressure mechanisms. Under the IB mode, plastic strain localizes beneath helices. CS capacity correlates positively with bottom helix radius and embedment depth, while IB capacity shows an exponential relationship with helix radius. This elucidates the geometric correspondence between CS/IB models and physical failure mechanisms, providing a theoretical foundation for failure mode analysis.
- (3)
- For multi-helix anchors, soil stress beneath helices increases significantly with embedment depth. This phenomenon is attributed to depth-dependent variation in the lateral earth pressure coefficient (CS model perspective) and depth-dependent helix bearing capacity (IB model perspective), confirming both the model’s validity and their fundamental interrelation.
- (4)
- The shallow-to-deep embedment transition is defined as H = 5D. Shallow conditions (H < 5D) exhibit bowl-shaped axisymmetric failure zones and significant directional capacity sensitivity (deviations ≤ 80%). Deep conditions (H ≥ 5D) demonstrate elliptical axisymmetric failure zones with markedly reduced directional sensitivity (deviations ≈ 10%).
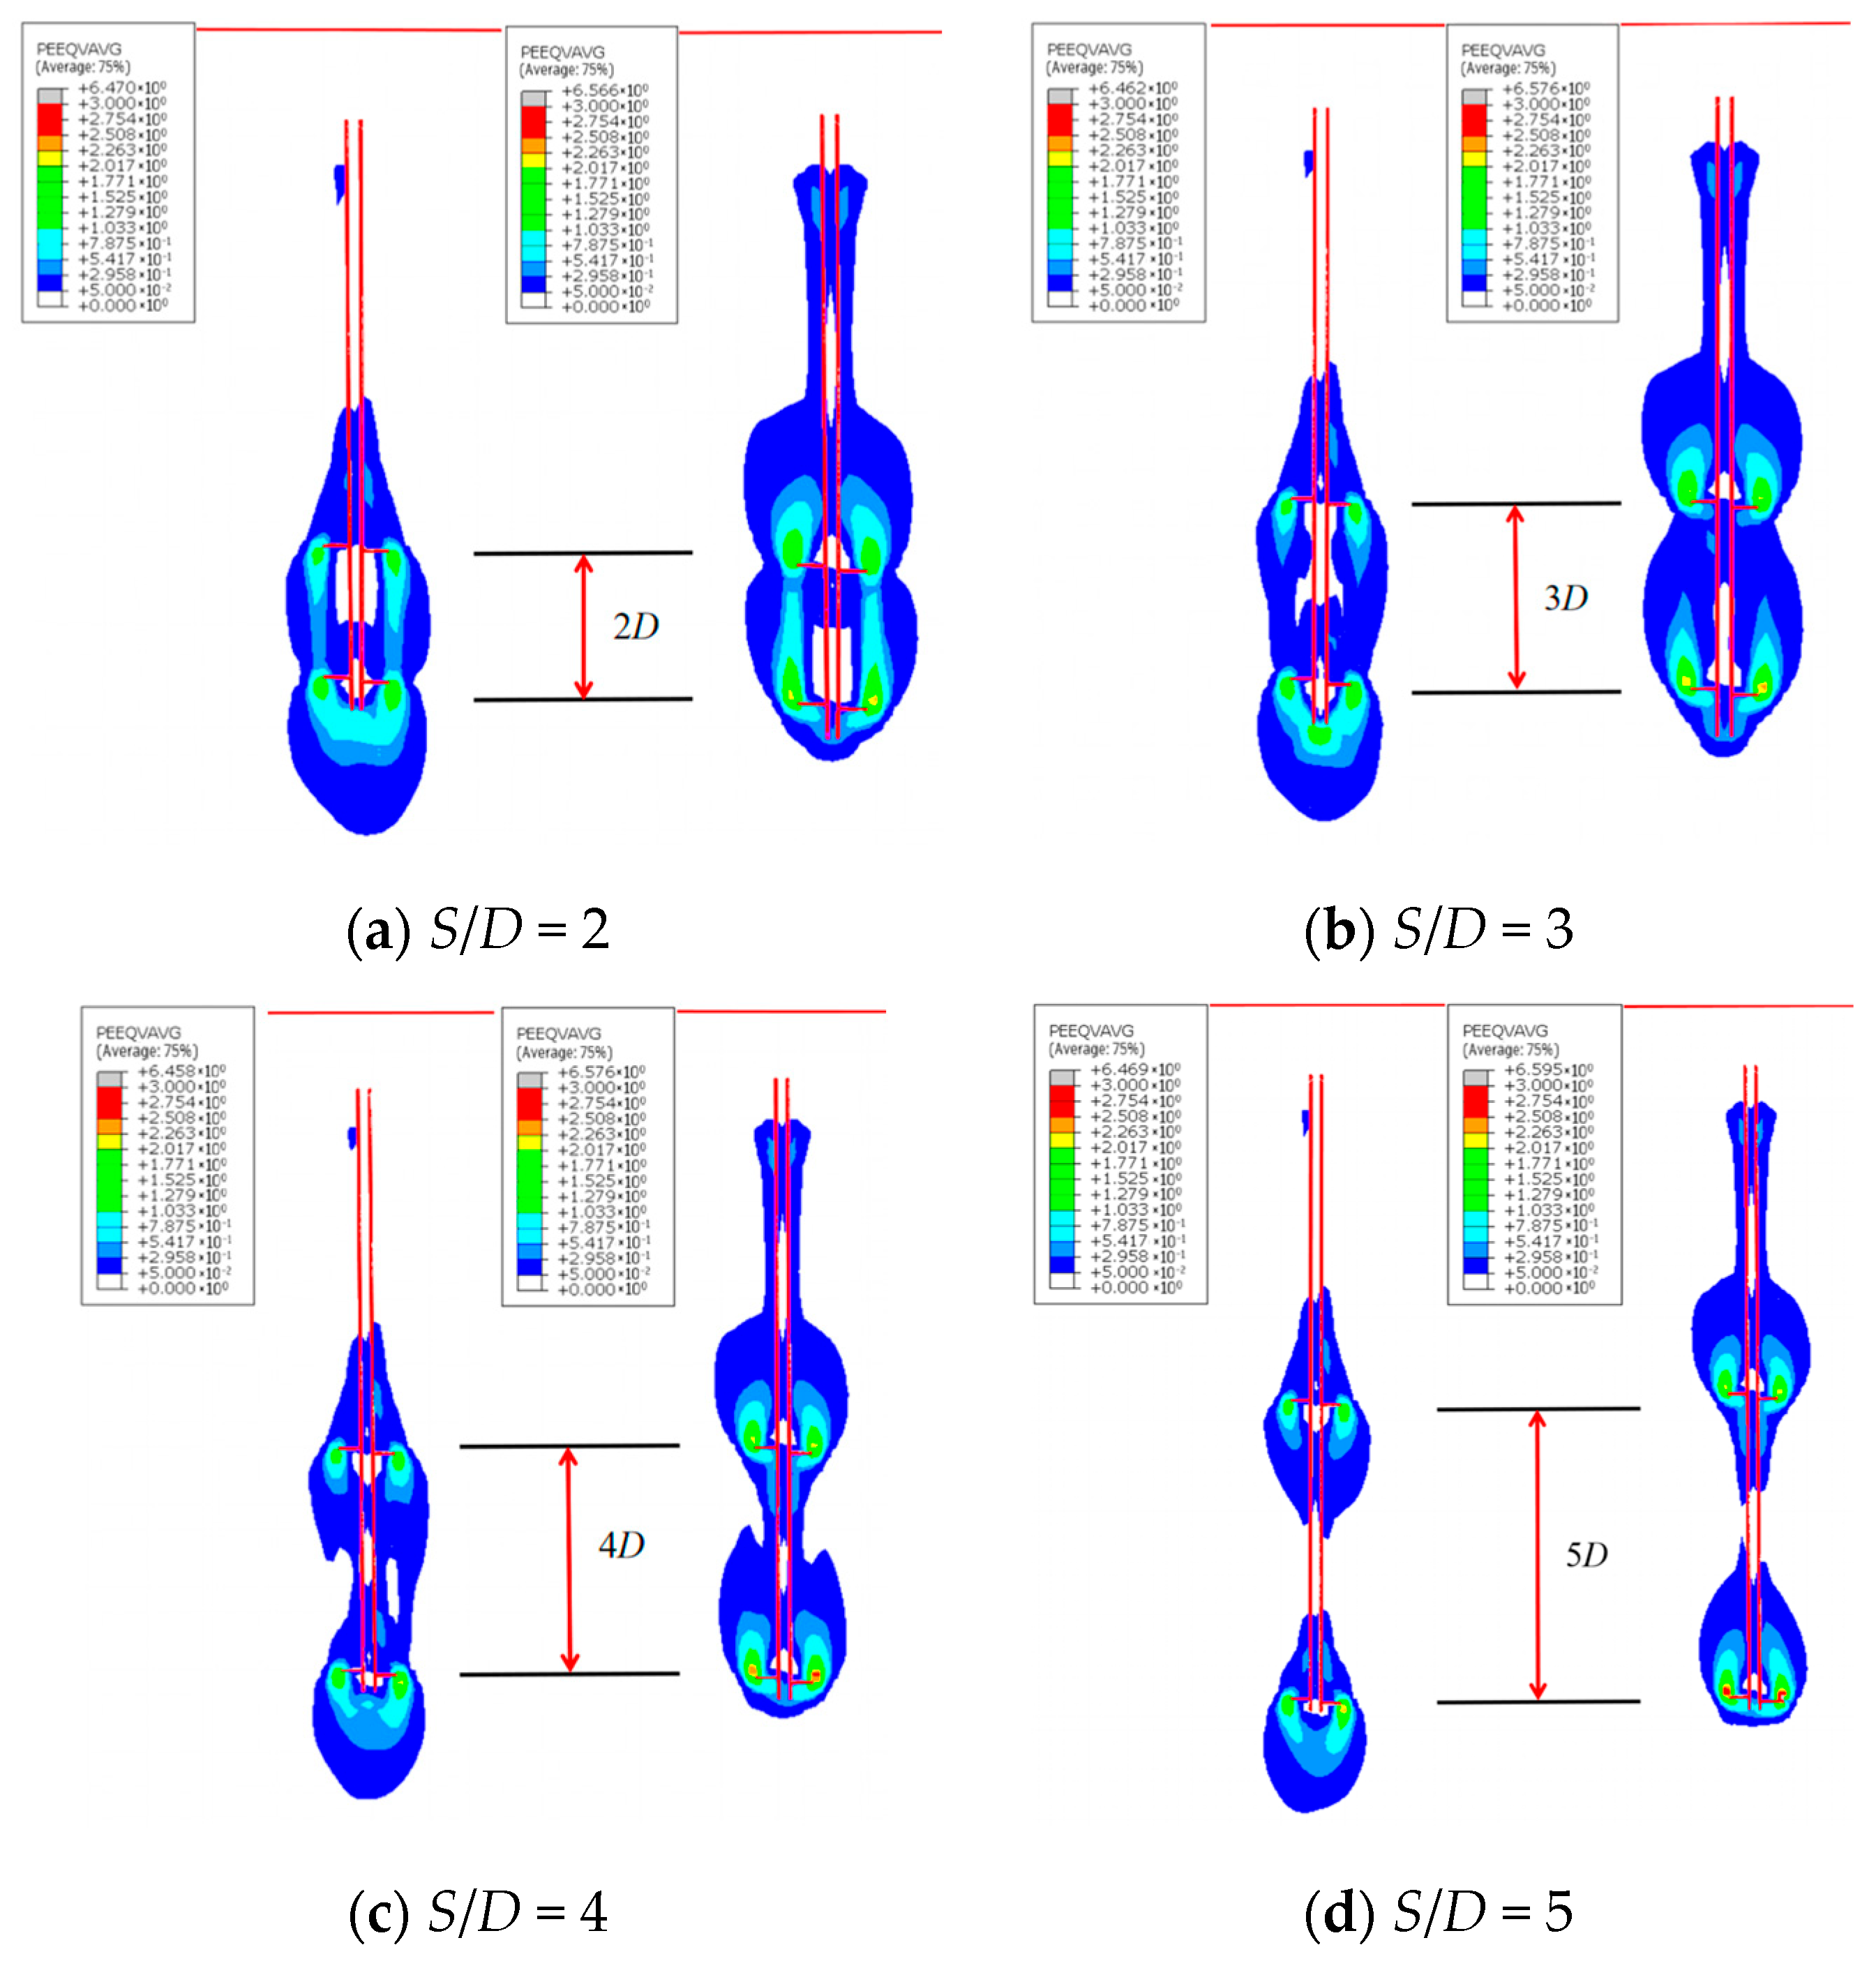
- (5)
- The CS-to-IB failure mode transition occurs at S/D ≥ 4. When S/D < 4, failure manifests as a CS mode with progressive shear slip bands at helix edges. When S/D ≥ 4, the IB mode prevails with stress concentration beneath helices (compression) or above them (tension), enabling independent bearing contribution.
- (6)
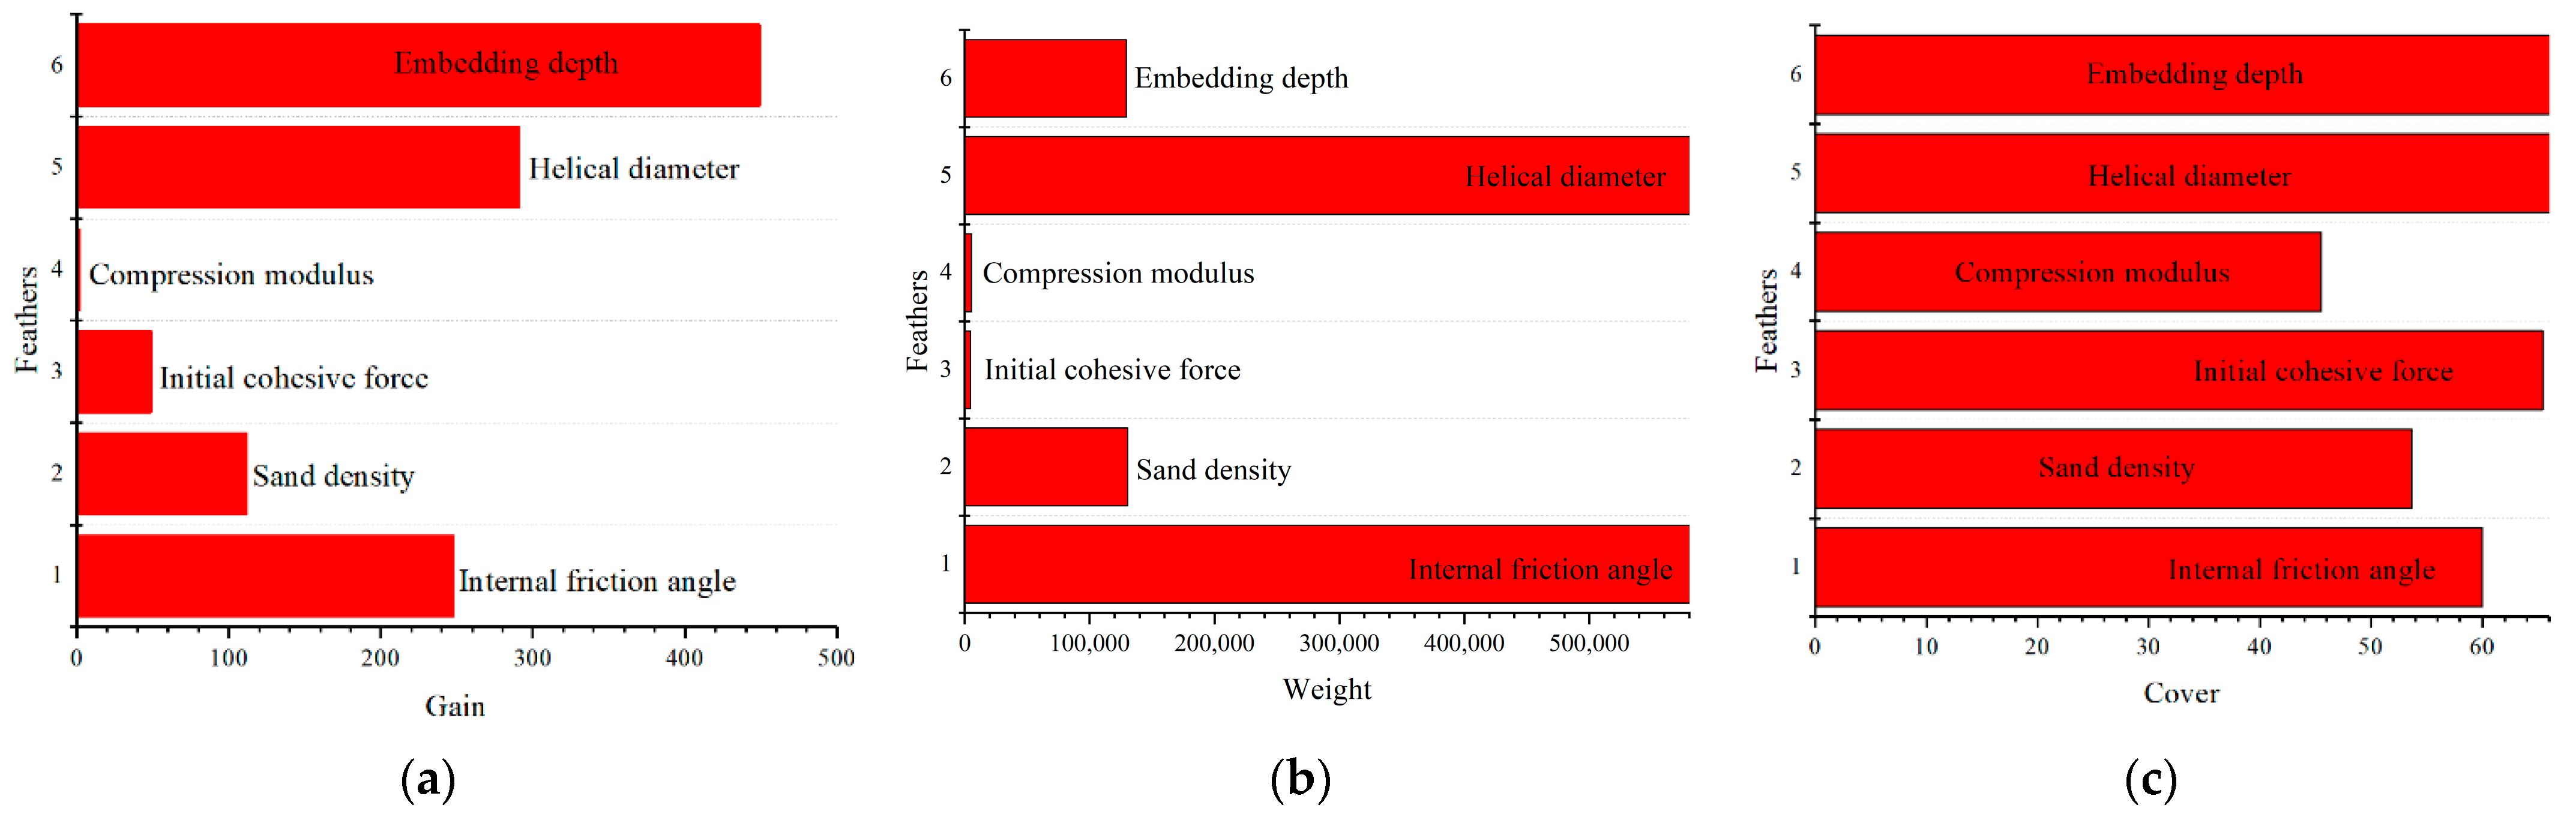
- Embedment depth, helix diameter, and internal friction angle are the most influential capacity parameters. Feature importance analysis revealed that embedment depth has the highest gain (450); helix diameter and internal friction angle show the highest weight (580,000); and all three parameters exhibit maximum cover (65).
- (7)
- Innovative formulas are proposed for calculating compressive bearing capacity and lateral earth pressure coefficients across the four sand densities. Compared with current design codes (mean calculated/analyzed ratio = 1.51; variance = 0.06), the proposed formulas demonstrate superior accuracy (mean ratio = 1.03) and reduced dispersion (variance = 0.012).
Research Limitations and Future Perspectives
Author Contributions
Funding
Data Availability Statement
Acknowledgments
Conflicts of Interest
References
- Livneh, B.; El Naggar, M.H. Axial testing and numerical modeling of square shaft helical piles under compressive and tensile loading. Can. Geotech. J. 2008, 45, 1142–1155. [Google Scholar] [CrossRef]
- Mohajerani, A.; Bosnjak, D.; Bromwich, D. Analysis and design methods of screw piles: A review. Soils Found. 2016, 56, 115–128. [Google Scholar] [CrossRef]
- Merifield, R.S. Ultimate uplift capacity of multiplate helical type anchors in clay. J. Geotech. Geoenviron. Eng. 2011, 137, 704–716. [Google Scholar] [CrossRef]
- Tang, C.; Phoon, K.K. Model uncertainty of cylindrical shear method for calculating the uplift capacity of helical anchors in clay. Eng. Geol. 2016, 207, 14–23. [Google Scholar] [CrossRef]
- Tang, C.; Phoon, K.K. Statistics of model factors and consideration in reliability-based design of axially loaded helical piles. J. Geotech. Geoenviron. Eng. 2018, 144, 04018050. [Google Scholar] [CrossRef]
- Pratama, I.T.; Lestari, A.S.; Oktavianus, I. Numerical study on the effects of helix diameter and spacing on the helical pile axial bearing capacity in cohesionless soils. Proc. Civ. Eng. Forum 2024, 10, 173–186. Available online: https://api.semanticscholar.org/CorpusID:268949950 (accessed on 11 July 2025). [CrossRef]
- Schiavon, J.A. Behaviour of Helical Anchors Subjected to Cyclic Loadings. Ph.D. Thesis, École centrale de Nantes, Universidade de São Paulo, São Paulo, Brazil, 2016. Available online: https://theses.hal.science/tel-02185307v1 (accessed on 11 July 2025).
- Ho, H.M.; Malik, A.A.; Kuwano, J.; Brasile, S.; Tran, T.V.; Mazhar, M.A. Experimental and Numerical Study on Pressure Distribution. Int. J. Geomech. 2022, 22, 9. [Google Scholar] [CrossRef]
- Shuman, N.M.; Khan, S.; Amini, F. Settlement based load capacity curve for single helix helical pile in c-ϕ soil. Soils Found. 2023, 63, 101265. [Google Scholar] [CrossRef]
- Garakani, A.A.; Serjoie, K.A. Ultimate Bearing Capacity of Helical Piles as Electric Transmission Tower Foundations in Unsaturated Soils: Analytical, Numerical, and Experimental Investigations. Int. J. Geomech. 2023, 9, 04023119. [Google Scholar] [CrossRef]
- Sakr, M. Performance of helical piles in oil sand. Can. Geotech. J. 2009, 46, 1046–1061. [Google Scholar] [CrossRef]
- Sakr, M. Installation and performance characteristics of high capacity helical piles in cohesionless soils. DFI J. 2011, 5, 39–57. [Google Scholar] [CrossRef]
- Vignesh, V.; Mayakrishnan, M. Design parameters and behavior of helical piles in cohesive soils—A review. Arab. J. Geosci. 2020, 13, 1194. [Google Scholar] [CrossRef]
- Igoe, D.; Zahedi, P.; Soltani-Jigheh, H. Predicting the compression capacity of screw piles in sand using machine learning trained on finite element analysis. Geotechnics 2024, 4, 807–823. [Google Scholar] [CrossRef]
- Chen, Y.; Deng, A.; Zhao, H.; Gong, C.; Sun, H.; Cai, J. Model and numerical analyses of screw pile uplift in dry sand. Can. Geotech. J. 2024, 61, 1144–1158. [Google Scholar] [CrossRef]
- Cheng, L.; Han, Y.R.; Wu, Y.Q.; Kim, Y.H. Numerical investigation of pullout capacity for inclined strip plate anchors in sand. Appl. Ocean Res. 2023, 130, 103414. [Google Scholar] [CrossRef]
- Wang, L.; Wu, M.; Chen, H.; Hao, D.; Tian, Y.; Qi, C. Efficient machine learning models for the uplift behavior of helical anchors in dense sand for wind energy harvesting. Appl. Sci. 2022, 12, 10397. [Google Scholar] [CrossRef]
- Yuan, C.; Hao, D.; Chen, R.; Zhang, N. Numerical investigation of uplift failure mode and capacity estimation for deep helical anchors in sand. J. Mar. Sci. Eng. 2023, 11, 1547. [Google Scholar] [CrossRef]
- Lin, Y.; Xiao, J.; Le, C.; Zhang, P.; Chen, Q.; Ding, H. Bearing characteristics of helical pile foundations for offshore wind turbines in sandy soil. J. Mar. Sci. Eng. 2022, 10, 889. [Google Scholar] [CrossRef]
- GB/T 50123-2019; Ministry of Housing and Urban-Rural Development of the People’s Republic of China (MOHURD). Standard for Geotechnical Testing Method. China Electric Power Press: Beijing, China, 2019.
- BS EN 1993-1-1:2022; Eurocode 3: Design of Steel Structures—Part 1-1: General Rules and Rules for Buildings. British Standards Institution (BSI): London, UK, 2022.
- GB 50007-2011; Ministry of Housing and Urban-Rural Development of the People’s Republic of China (MOHURD). Code for Design of Building Foundation. China Architecture & Building Press: Beijing, China, 2011.
- DL/T 5219-2023; National Energy Administration of China. Technical Code for Basic Design of Overhead Transmission Line. China Electric Power Press: Beijing, China, 2024.
- JGJ 106-2014; Ministry of Housing and Urban-Rural Development of the People’s Republic of China. Technical Code for Testing of Building Foundation Piles SS. China Architecture & Building Press: Beijing, Chian, 2014.
- Lutenegger, A.J. Cylindrical shear or plate bearing uplift behavior of multi-helix screw anchors in clay. In Contemporary Topics in Deep Foundations; Iskander, M., Laefer, D.F., Hussein, M.H., Eds.; ASCE Library: Reston, VA, USA, 2009; pp. 456–463. [Google Scholar] [CrossRef]
- Salhi, L.; Nait-Rabah, O.; Deyrat, C.; Roos, C. Numerical modeling of single helical pile behavior under compressive loading in sand. Electron. J. Geotech. Eng. 2013, 18, 4319–4338. [Google Scholar]
- Nabizadeh, F.; Choobbasti, A.J. Field study of capacity helical piles in sand and silty clay. Transp. Infrastruct. Geotechnol. 2017, 4, 3–17. [Google Scholar] [CrossRef]
- IEEE Std 691-2001; IEEE Standards Association (IEEE SA). IEEE Guide for Transmission Structure Foundation Design and Testing. IEEE: Piscataway, NJ, USA, 2001.
- Kwon, O.; Lee, J.; Kim, G.; Kim, I.; Lee, J. Investigation of pullout load capacity for helical anchors subjected to inclined loading conditions using coupled Eulerian-Lagrangian analyses. Comput. Geotech. 2019, 111, 66–75. [Google Scholar] [CrossRef]
- Schiavon, J.A.; Tsuha, C.H.C.; Thorel, L. Scale effect in centrifuge tests of helical anchors in sand. J. Phys. Model. Geotech. 2016, 16, 185–196. [Google Scholar] [CrossRef]
- Dassault Systèmes. ABAQUS Analysis User’s Guide, Version 2019; Dassault Systèmes Simulia Corp: Johnston, RI, USA, 2019.
- Sui, C.Y.; Shen, Y.S.; Wen, Y.M.; Gao, B. Application of the modified Mohr-Coulomb yield criterion in seismic numerical simulation of tunnels. Shock. Vib. 2021, 2021, 9968935. [Google Scholar] [CrossRef]
- Fan, C.; Yang, P.Y.; Li, L.; Wang, R. Poisson’s ratio of granular materials for Mohr-Coulomb elastoplastic model. Int. J. Min. Reclam. Environ. 2023, 37, 780–804. [Google Scholar] [CrossRef]
- Ghiba, I.D.; Rizzi, G.; Madeo, A.; Neff, P. Cosserat micropolar elasticity: Classical Eringen vs. dislocation form. J. Mech. Mater. Struct. 2023, 18, 93–123. [Google Scholar] [CrossRef]
- Andersen, K.H.; Schjetne, K. Database of friction angles of sand and consolidation characteristics of sand, silt, and clay. J. Geotech. Geoenviron. Eng. 2013, 139, 1140–1155. [Google Scholar] [CrossRef]
- Mortazavi Bak, H.; Mostafaei, H.; Shahbodagh, B.; Vahab, M.; Hashemolhosseini, H.; Khoshghalb, A. Effect of Sample Preparation on the Reliability of Large-Scale Physical Modeling in Geotechnical Systems: A Case Study. Geotech. Geol. Eng. 2024, 42, 2693–2707. Available online: https://link.springer.com/article/10.1007/s10706-023-02699-9 (accessed on 11 July 2025). [CrossRef]
- Hossain, M.S.; Randolph, M.F. Effect of strain rate and strain softening on the penetration resistance of spudcan foundations on clay. Int. J. Geomech. 2009, 9, 122–132. [Google Scholar] [CrossRef]
- Hastie, T.; Tibshirani, R.; Friedman, J. The Elements of Statistical Learning: Data Mining, Inference, and Prediction, 2nd ed.; Springer: Berlin/Heidelberg, Germany, 2009. [Google Scholar] [CrossRef]
- Kuhn, M.; Johnson, K. Applied Predictive Modeling; Springer: Berlin/Heidelberg, Germany, 2013. [Google Scholar] [CrossRef]
- Chen, T.; Guestrin, C. XGBoost: A scalable tree boosting system. In Proceedings of the 22nd ACM SIGKDD International Conference on Knowledge Discovery and Data Mining, San Francisco, CA, USA, 13 August 2016; ACM: New York, NY, USA, 2016; pp. 785–794. [Google Scholar] [CrossRef]


| No. | Dense State of Sandy Soil | ρ (g/cm3) | σ3 (kPa) | φ (°) | SD(φ) (°) | Es (MPa) | SD(Es) (MPa) | H (m) |
|---|---|---|---|---|---|---|---|---|
| S1 | Loose sand | 1.60 | 100 | 36 | 1.1 | 20 | 2.3 | 3 |
| 200 | ||||||||
| 300 | ||||||||
| S2 | Medium loose sand | 1.70 | 100 | 37 | 0.7 | 30 | 2.7 | 0.75 |
| 200 | ||||||||
| 300 | ||||||||
| S3 | Medium dense sand | 1.80 | 100 | 39 | 0.9 | 40 | 3.0 | 3.5 |
| 200 | ||||||||
| 300 | ||||||||
| S4 | Dense sand | 1.90 | 100 | 42 | 0.6 | 50 | 2.7 | 8 |
| 200 | ||||||||
| 300 |
| No. | Number of Helices | Helix Diameter (mm) | Shaft Outer Diameter (mm) | Helix Spacing (mm) | Embedment Depth of Bottom Helix (m) | Embedment Depth of Top Helix (m) | Installation Inclination |
|---|---|---|---|---|---|---|---|
| C1 | 3 | 400 | 219 | 1800 | 7.2 | 3.6 | 8.1° inclination |
| C2 | 3 | 400 | 219 | 1800 | 7.2 | 3.6 | |
| C3 | 3 | 400 | 219 | 1800 | 7.2 | 3.6 | |
| C4 | 3 | 660 | 219 | 1976 | 7.26 | 3.3 | Vertical anchor |
| C5 | 3 | 660 | 219 | 1976 | 7.26 | 3.3 | |
| C6 | 3 | 660 | 219 | 1976 | 7.26 | 3.3 | |
| C7 | 3 | 760 | 245 | 2280 | 8.42 | 3.8 | |
| C8 | 4 | 760 | 245 | 2280 | 10.7 | 3.8 | |
| C9 | 4 | 760 | 245 | 2280 | 10.7 | 3.8 | |
| C10 | 4 | 760 | 245 | 2280 | 10.7 | 3.8 |
| Specimen ID | Ultimate Load at 0.1 D (kN) | Capacity at 50 mm Disp. (kN) | Capacity at 25 mm Disp. (kN) | Code-Calculated Ultimate (kN) | Code/Test Ratio |
|---|---|---|---|---|---|
| C1 | 897 | 1039 | 683 | 502.947 | 0.56 |
| C2 | 922 | 1047 | 714 | 502.947 | 0.54 |
| C3 | 1029 | 1125 | 824 | 502.947 | 0.48 |
| C4 | 1777 | 1625 | 1219 | 1501.46 | 0.84 |
| C5 | 1786 | 1670 | 1257 | 1501.46 | 0.84 |
| C6 | 1894 | 1734 | 1297 | 1501.46 | 0.79 |
| C7 | 3879 | 3236 | 2150 | 2406.02 | 0.62 |
| C8 | 4224 | 3392 | 2386 | 3299.74 | 0.78 |
| C9 | 3962 | 3320 | 2347 | 3299.74 | 0.83 |
| C10 | 3937 | 3394 | 2498 | 3299.74 | 0.84 |
| Mean value | 0.712 | ||||
| Variance | 0.019 | ||||
| Type | Density ρ/(g/cm3) | Elastic Modulus E/kPa | Poisson’s Ratio |
|---|---|---|---|
| Helical anchor | 7.85 | 2.06 × 10⁸ | 0.3 |
| Soil Layer | Thickness of Soil (m) | Density ρ/(g/cm3) | Elastic Modulus E/kPa | Poisson’s Ratio | Internal Friction Angle φ (°) | Dilatancy Angle (°) |
|---|---|---|---|---|---|---|
| Soil-1 | 3 | 1.6 | 20,000 | 0.2 | 36 | 18 |
| Soil-2 | 0.75 | 1.7 | 30,000 | 0.2 | 37 | 18.5 |
| Soil-3 | 3.5 | 1.8 | 40,000 | 0.2 | 39 | 19.5 |
| Soil-4 | 8 | 1.9 | 50,000 | 0.2 | 42 | 21 |
| D (mm) | Embedment Depth (mm) | |||||||||||||
|---|---|---|---|---|---|---|---|---|---|---|---|---|---|---|
| 500 | 1000 | 1500 | 2000 | 2500 | 3000 | 3500 | 4000 | 4500 | 5000 | 6000 | 7000 | 8000 | 9000 | 10,000 |
| 600 | 1200 | 1800 | 2400 | 3000 | 3600 | 4200 | 4800 | 5400 | 6000 | 7200 | 8400 | 9600 | 10,800 | 12,000 |
| 700 | 1400 | 2100 | 2800 | 3500 | 4200 | 4900 | 5600 | 6300 | 7000 | 8400 | 9800 | 11,200 | 12,600 | 14,000 |
| 800 | 1600 | 2400 | 3200 | 4000 | 4800 | 5600 | 6400 | 7200 | 8000 | 9600 | 11,200 | 12,800 | 14,400 | 16,000 |
| 900 | 1800 | 2700 | 3600 | 4500 | 5400 | 6300 | 7200 | 8100 | 9000 | 10,800 | 12,600 | 14,400 | 16,200 | 18,000 |
| 1000 | 2000 | 3000 | 4000 | 5000 | 6000 | 7000 | 8000 | 9000 | 10,000 | 12,000 | 14,000 | 16,000 | 18,000 | 20,000 |
| D (mm) | Top-Plate Embedment Depth (mm) | Helix Plate Spacing (mm) | ||||
|---|---|---|---|---|---|---|
| 500 | 1000 | 1000 | 1500 | 2000 | 2500 | 3000 |
| 3000 | 1000 | 1500 | 2000 | 2500 | 3000 | |
| 800 | 1600 | 1600 | 2400 | 3200 | 4000 | 4800 |
| 4800 | 1600 | 2400 | 3200 | 4000 | 4800 | |
| Model Hyperparameters | Values for Uplift Training | Values for Compressive Training |
|---|---|---|
| Max depths | 5 | 4 |
| Etas | 0.1489 | 0.1435 |
| Subsamples | 0.6272 | 0.6581 |
| Colsample Bytrees | 0.7806 | 0.6983 |
| Gammas | 0.0045 | 0.0001 |
| Min child weights | 3 | 2 |
| Lambdas | 0.7133 | 0.6706 |
| Alphas | 0.6977 | 0.6994 |
| No. | Num. Results (kN) | Conv. Nq | Conv. Ku | Conv. Value (kN) | Conv./Num. Ratio | Proposed Value (kN) | Proposed/Num. Ratio |
|---|---|---|---|---|---|---|---|
| C1 | 1106 | 40 | 2.2 | 1907 | 1.72 | 970 | 0.88 |
| C2 | 1106 | 40 | 2.2 | 1907 | 1.72 | 970 | 0.88 |
| C3 | 1106 | 40 | 2.2 | 1907 | 1.72 | 970 | 0.88 |
| C4 | 2658 | 40 | 2.4 | 3094 | 1.16 | 3013 | 1.13 |
| C5 | 2658 | 40 | 2.4 | 3094 | 1.16 | 3013 | 1.13 |
| C6 | 2658 | 40 | 2.4 | 3094 | 1.16 | 3013 | 1.13 |
| C7 | 3963 | 50 | 2.6 | 5609 | 1.41 | 4806 | 1.21 |
| C8 | 5600 | 60 | 2.8 | 9562 | 1.70 | 5799 | 1.03 |
| C9 | 5600 | 60 | 2.8 | 9562 | 1.70 | 5799 | 1.03 |
| C10 | 5600 | 60 | 2.8 | 9562 | 1.70 | 5799 | 1.03 |
| Mean value | 1.51 | 1.03 | |||||
| Variance | 0.06 | 0.012 | |||||
Disclaimer/Publisher’s Note: The statements, opinions and data contained in all publications are solely those of the individual author(s) and contributor(s) and not of MDPI and/or the editor(s). MDPI and/or the editor(s) disclaim responsibility for any injury to people or property resulting from any ideas, methods, instructions or products referred to in the content. |
© 2025 by the authors. Licensee MDPI, Basel, Switzerland. This article is an open access article distributed under the terms and conditions of the Creative Commons Attribution (CC BY) license (https://creativecommons.org/licenses/by/4.0/).
Share and Cite
Chen, Q.; Liu, W.; Li, L.; Wu, Y.; Zhang, Y.; Qu, S.; Zhang, Y.; Liu, F.; Guo, Y. Experimental Study on Compressive Capacity Behavior of Helical Anchors in Aeolian Sand and Optimization of Design Methods. Buildings 2025, 15, 2480. https://doi.org/10.3390/buildings15142480
Chen Q, Liu W, Li L, Wu Y, Zhang Y, Qu S, Zhang Y, Liu F, Guo Y. Experimental Study on Compressive Capacity Behavior of Helical Anchors in Aeolian Sand and Optimization of Design Methods. Buildings. 2025; 15(14):2480. https://doi.org/10.3390/buildings15142480
Chicago/Turabian StyleChen, Qingsheng, Wei Liu, Linhe Li, Yijin Wu, Yi Zhang, Songzhao Qu, Yue Zhang, Fei Liu, and Yonghua Guo. 2025. "Experimental Study on Compressive Capacity Behavior of Helical Anchors in Aeolian Sand and Optimization of Design Methods" Buildings 15, no. 14: 2480. https://doi.org/10.3390/buildings15142480
APA StyleChen, Q., Liu, W., Li, L., Wu, Y., Zhang, Y., Qu, S., Zhang, Y., Liu, F., & Guo, Y. (2025). Experimental Study on Compressive Capacity Behavior of Helical Anchors in Aeolian Sand and Optimization of Design Methods. Buildings, 15(14), 2480. https://doi.org/10.3390/buildings15142480