Article

Hybrid Gaussian Process Regression Models for Accurate Prediction of Carbonation-Induced Steel Corrosion in Cementitious Mortars

Department of Teacher Training in Mechanical Engineering, King Mongkut’s University of Technology North Bangkok, Bangkok 10800, Thailand
Buildings 2025, 15(14), 2464; https://doi.org/10.3390/buildings15142464
Submission received: 7 June 2025 / Revised: 4 July 2025 / Accepted: 10 July 2025 / Published: 14 July 2025
(This article belongs to the Section Building Materials, and Repair & Renovation)

Abstract

Steel corrosion prediction in concrete infrastructure remains a critical challenge for durability assessment and maintenance planning. This study presents a comprehensive framework integrating domain expertise with advanced machine learning for carbonation-induced corrosion prediction. Four Gaussian Process Regression (GPR) variants were systematically developed: Baseline GPR with manual optimization, Expert Knowledge GPR employing domain-driven dual-kernel architecture, GPR with Automatic Relevance Determination (GPR-ARD) for feature selection, and GPR-OptCorrosion featuring specialized multi-component composite kernels. The models were trained and validated using 180 carbonated mortar specimens with 15 systematically categorized variables spanning mixture, material, environmental, and electrochemical parameters. GPR-OptCorrosion achieved superior performance (R2 = 0.9820, RMSE = 1.3311 μA/cm2), representing 44.7% relative improvement in explained variance over baseline methods, while Expert Knowledge GPR and GPR-ARD demonstrated comparable performance (R2 = 0.9636 and 0.9810, respectively). Contrary to conventional approaches emphasizing electrochemical indicators, automatic relevance determination revealed supplementary cementitious materials (silica fume and fly ash) as dominant predictive factors. All advanced models exhibited excellent generalization (gaps < 0.02) and real-time efficiency (<0.006 s), with probabilistic uncertainty quantification enabling risk-informed infrastructure management. This research contributes to advancing machine learning applications in corrosion engineering and provides a foundation for predictive maintenance strategies in concrete infrastructure.

1. Introduction

1.1. Background and Motivation

Steel corrosion represents one of the most significant challenges in modern infrastructure management, with global economic implications reaching trillions of dollars annually. In reinforced concrete structures, corrosion-induced deterioration constitutes the primary durability concern, particularly affecting structures built during the massive infrastructure expansion of the 1960s–1980s [1,2,3]. The complexity of corrosion processes, involving simultaneous material aging and diverse uncertainties, necessitates sophisticated predictive frameworks capable of capturing the intricate relationships between material composition, environmental conditions, and electrochemical behavior [4].
Recent convergent findings across multiple research domains have identified the multi-scale nature of corrosion processes as a fundamental challenge requiring advanced modeling approaches. Studies spanning physics-based modeling [4], electrochemical analysis [5], and environmental corrosion assessment [6] consistently emphasize that corrosion operates simultaneously across atomic-level reactions and macroscopic environmental influences, necessitating modeling frameworks capable of capturing these concurrent multi-scale phenomena.
Carbonation-induced corrosion has emerged as a particularly critical concern due to the widespread adoption of supplementary cementitious materials (SCMs) aimed at reducing the environmental footprint [3,5,7]. The propagation phase of corrosion may become a significant component of total service life for structures incorporating blended cements, making accurate prediction essential for maintenance-free operation [8]. Traditional assessment approaches, which focus predominantly on carbonation initiation without considering corrosion behavior during propagation, lead to significantly conservative deterioration estimates [9].
Current corrosion prediction methodologies suffer from fundamental limitations that restrict their practical applicability. Empirical models, while providing direct relationships between the corrosion rate and influencing factors, are applicable only to scenarios characterized by similar material and environmental conditions, losing accuracy when significant variations occur in binder composition and exposure settings [1,10]. The inherent heterogeneity of reinforced concrete structures and the significant effects of environmental factors remain major challenges in data interpretation [11].
Electrochemical models, despite their theoretical foundation, encounter substantial practical obstacles including time-consuming and costly parameter determination, numerical difficulties in solving governing equations due to non-linear boundary conditions, and complexities in modeling complicated geometries and non-homogeneous material properties [12,13]. Most critically, existing models frequently ignore time-variant material aging to avoid numerical complexity and invoke arbitrary chloride thresholds for corrosion initiation determination, potentially leading to false assessments [4].
The fundamental challenge lies in the multiscale nature of corrosion processes, which operate simultaneously across atomic-level electrochemical reactions and macroscopic environmental influences. Traditional single-parameter approaches fail to capture these complex interactions, necessitating more sophisticated modeling frameworks [6].
Machine learning (ML) methodologies have demonstrated significant potential in addressing the limitations of traditional corrosion prediction approaches, offering enhanced accuracy and flexibility in handling complex, non-linear relationships. The corrosion community has increasingly recognized the value of ML techniques for extracting patterns from large, heterogeneous datasets that characterize real-world corrosion scenarios [14].
Support Vector Regression (SVR) has shown promising results in corrosion rate prediction, with studies achieving R2 values exceeding 0.90 for steel corrosion in carbonated cementitious mortars [1]. Artificial Neural Network (ANN) has been successfully applied to various corrosion problems, including pipeline corrosion and atmospheric metal corrosion, demonstrating high fidelity in predicting corrosion rates across diverse environments [15]. Random Forest algorithms have proven effective in atmospheric corrosion studies, achieving strong correlations between environmental factors and corrosion rates [16].
Advanced ensemble methods combining multiple algorithms have shown superior performance, with hybrid metaheuristic approaches achieving Mean Absolute Percentage Errors as low as 1.26% for corrosion rate prediction [17]. Transfer learning methodologies have enabled the successful application of laboratory-trained models to natural exposure conditions, achieving an R2 = 0.815 for field validation studies [18].
The corrosion prediction community exhibits a methodological divide between domain-driven feature selection and automatic relevance determination (ARD). While manual feature engineering leverages established electrochemical principles [1,19], automatic selection methods demonstrate superior objectivity in feature ranking [16,20]. This study uniquely addresses both perspectives through the parallel implementation of expert-guided and automatic feature selection methodologies, providing a comparative assessment of each approach’s merits.

1.2. Literature Review

The evolution of corrosion prediction methodologies reflects the progression from empirical correlations to mechanistically informed approaches. Early empirical models established direct relationships between corrosion rate and easily measurable parameters such as chloride content, pH values, the water-to-binder ratio, and relative humidity [1]. These approaches, while providing practical utility, suffer from limited generalizability and fail to capture the fundamental physics governing corrosion processes.
Electrochemical models represent a significant advancement, incorporating principles of electrochemistry with governing differential equations implemented through finite element methods to simulate electrochemical reactions on steel surfaces [1]. However, these approaches face substantial challenges in parameter determination and computational complexity, particularly for real-world applications involving heterogeneous concrete properties and variable environmental conditions.
Recent developments have emphasized the importance of considering combined environmental effects, with studies demonstrating that chloride-induced corrosion exhibits more severe damage under simultaneous carbonation exposure compared to individual exposure conditions [21,22]. The synergistic effects of temperature and pore saturation have been identified as critical factors in warm climates, with corrosion rates showing exponential relationships with both parameters [9].
Gaussian Process Regression (GPR) has emerged as a particularly promising approach for materials science applications due to its ability to provide probabilistic predictions with inherent uncertainty quantification. While GPR applications in corrosion prediction remain limited, related fields have demonstrated its effectiveness in handling complex, non-linear relationships with sparse data availability.
The probabilistic nature of GPR makes it particularly suitable for corrosion applications where prediction uncertainty is critical for risk-informed decision making. Unlike deterministic approaches, GPR provides confidence intervals that can be integrated with reliability-based design methodologies, enabling more sophisticated maintenance optimization strategies [2].
Kernel selection and design represent critical aspects of GPR implementation, with different kernel functions capturing the distinct characteristics of underlying physical processes. RBF kernels excel at modeling smooth, global trends characteristic of diffusion-controlled processes, while Matérn kernels provide flexibility for potentially discontinuous derivatives typical of threshold phenomena in corrosion initiation [4].
Composite kernel architectures have shown promise in capturing multi-scale phenomena, combining different kernel types to model simultaneous processes operating at various temporal and spatial scales. The development of specialized kernels for materials science applications represents an active area of research with significant potential for advancing predictive capabilities.

1.3. Research Objectives

Based on the identified limitations in current corrosion prediction approaches, this research develops four novel hybrid GPR models specifically designed for carbonation-induced corrosion prediction. The primary research objectives are as follows:
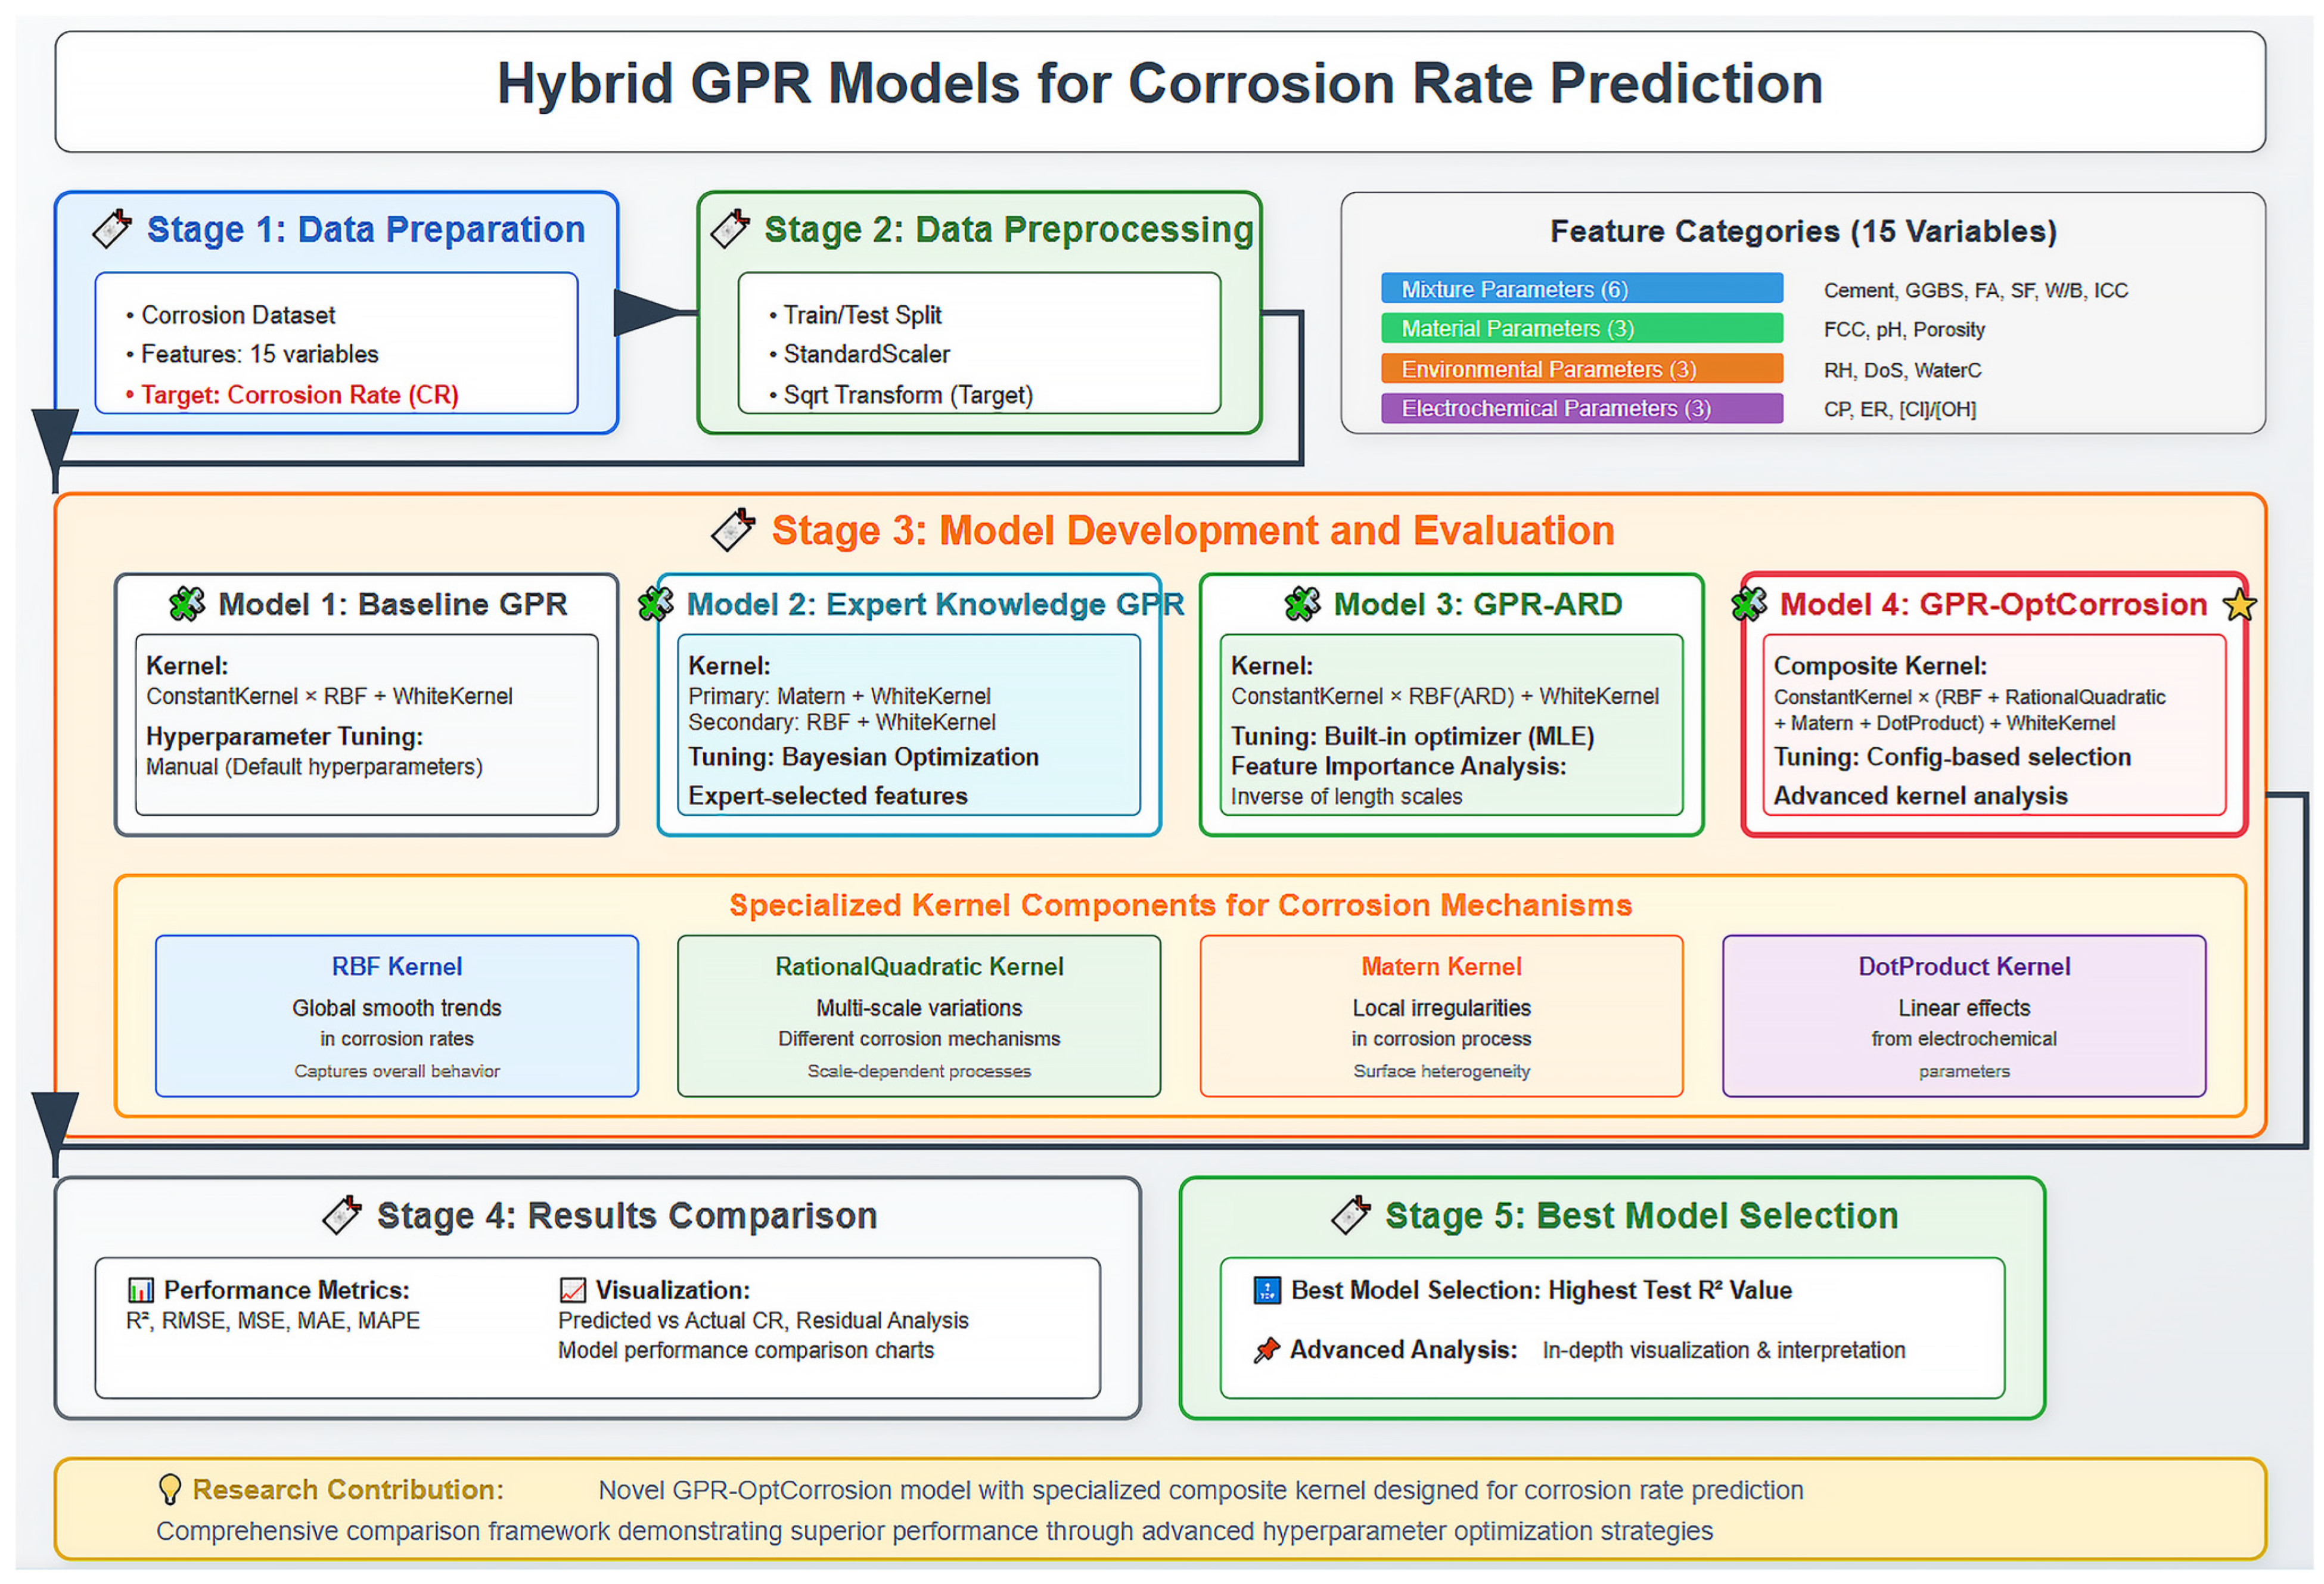
  • Development of Domain-Informed GPR Architecture: Create a novel Expert Knowledge GPR model that systematically integrates electrochemical principles with ML capabilities through specialized dual-kernel architecture and feature classification based on mechanistic understanding.
  • Advanced Kernel Design for Corrosion Applications: Develop the GPR-OptCorrosion model featuring a specialized composite kernel architecture combining the RBF, RationalQuadratic, Matérn, and DotProduct components to capture multi-scale corrosion phenomena.
  • Automatic Feature Relevance Assessment: Implement GPR-ARD methodology to provide quantitative feature importance analysis through ARD, enabling data-driven validation of domain expertise.
  • Comprehensive Uncertainty Quantification: Establish a probabilistic prediction framework with inherent uncertainty quantification suitable for risk-informed decision making in corrosion management.
  • Systematic Performance Evaluation: Conduct a comprehensive comparison of GPR variants against baseline approaches using multiple performance metrics and statistical validation procedures.
This research establishes general frameworks extending beyond corrosion prediction to multi-mechanism modeling in complex physical systems where multiple processes operate simultaneously across different scales. The developed methodology addresses fundamental challenges identified in recent comprehensive reviews [2], where traditional approaches demonstrate a limited ability to capture the complex, non-linear relationships characteristic of real-world corrosion scenarios. The probabilistic uncertainty quantification capabilities offer improvements over deterministic prediction methods, enabling enhanced risk assessment and maintenance optimization strategies.
The methodology consists of five main stages: (1) Data preparation involving corrosion dataset with 15 input variables and corrosion rate as the target variable; (2) data preprocessing including train/test split, standardization, and square root transformation; (3) model development comprising four GPR approaches with increasing sophistication; (4) results comparison through comprehensive performance metrics and visualizations; and (5) best model selection based on highest test R2 value. The proposed GPR-OptCorrosion model incorporates specialized kernel components designed to capture different corrosion mechanisms across multiple scales.
The remainder of this paper is organized as follows: Section 2 describes the materials and methods, including the dataset characteristics and GPR model development. Section 3 presents the results and discussion of model performance comparisons. Section 4 discusses practical implications, while Section 5 addresses limitations and future work. Section 6 provides conclusions. The comprehensive methodology framework is illustrated in Figure 1, which demonstrates the systematic approach employed for developing and evaluating the four GPR variants.

2. Materials and Methods

2.1. Experimental Dataset

2.1.1. Data Source and Background

The experimental dataset employed in this study is derived from a comprehensive corrosion investigation conducted by Ji and Ye [23], focusing on carbonation and chloride-induced steel corrosion in cementitious mortars. The dataset comprises laboratory-controlled measurements from 46 distinct mortar mixtures with embedded steel reinforcement, designed to capture the complex interactions between material composition, environmental conditions, and electrochemical processes governing corrosion behavior. For this investigation, the carbonation subset (Dataset-01) containing 180 samples is specifically utilized, which provides comprehensive coverage of corrosion mechanisms under controlled laboratory conditions while maintaining consistency in experimental protocols and measurement procedures.
The experimental specimens consisted of plate mortar samples (10 mm × 100 mm × 105 mm) embedded with six carbon steel bars (diameter = 2 mm, length = 110 mm, Chinese standard Q235), an Ag/AgCl reference electrode, and a stainless-steel counter electrode grid. All samples underwent accelerated carbonation testing (10% CO2 concentration, 70% RH, 30 °C) for periods ranging from 30 to 60 days depending on mixture composition, followed by exposure to six different relative humidity levels (56%, 68%, 75%, 84%, 92%, and 97%) using saturated salt solutions following ASTM E104 protocols. This controlled experimental design ensures comprehensive coverage of environmental conditions relevant to real-world concrete structures while maintaining the precision necessary for ML model development. However, it should be acknowledged that the controlled laboratory environment may not fully capture the complexity of field conditions including fluctuating environmental parameters, variable cement sources, diverse curing histories, and mixed exposure mechanisms. The generalizability of the developed models to real-world applications requires field validation studies, which represents an important limitation and future research direction addressed in Section 5.1.
The environmental parameter ranges in this study strategically encompass critical thresholds identified across multiple independent investigations. The relative humidity range (56–97%) captures the critical transition zone where dramatic corrosion rate increases occur (91–94% RH threshold identified by Cheng and Maruyama [8]), while the temperature-controlled conditions (30 °C) align with optimal corrosion activity ranges consistently reported across diverse experimental setups [9,15].

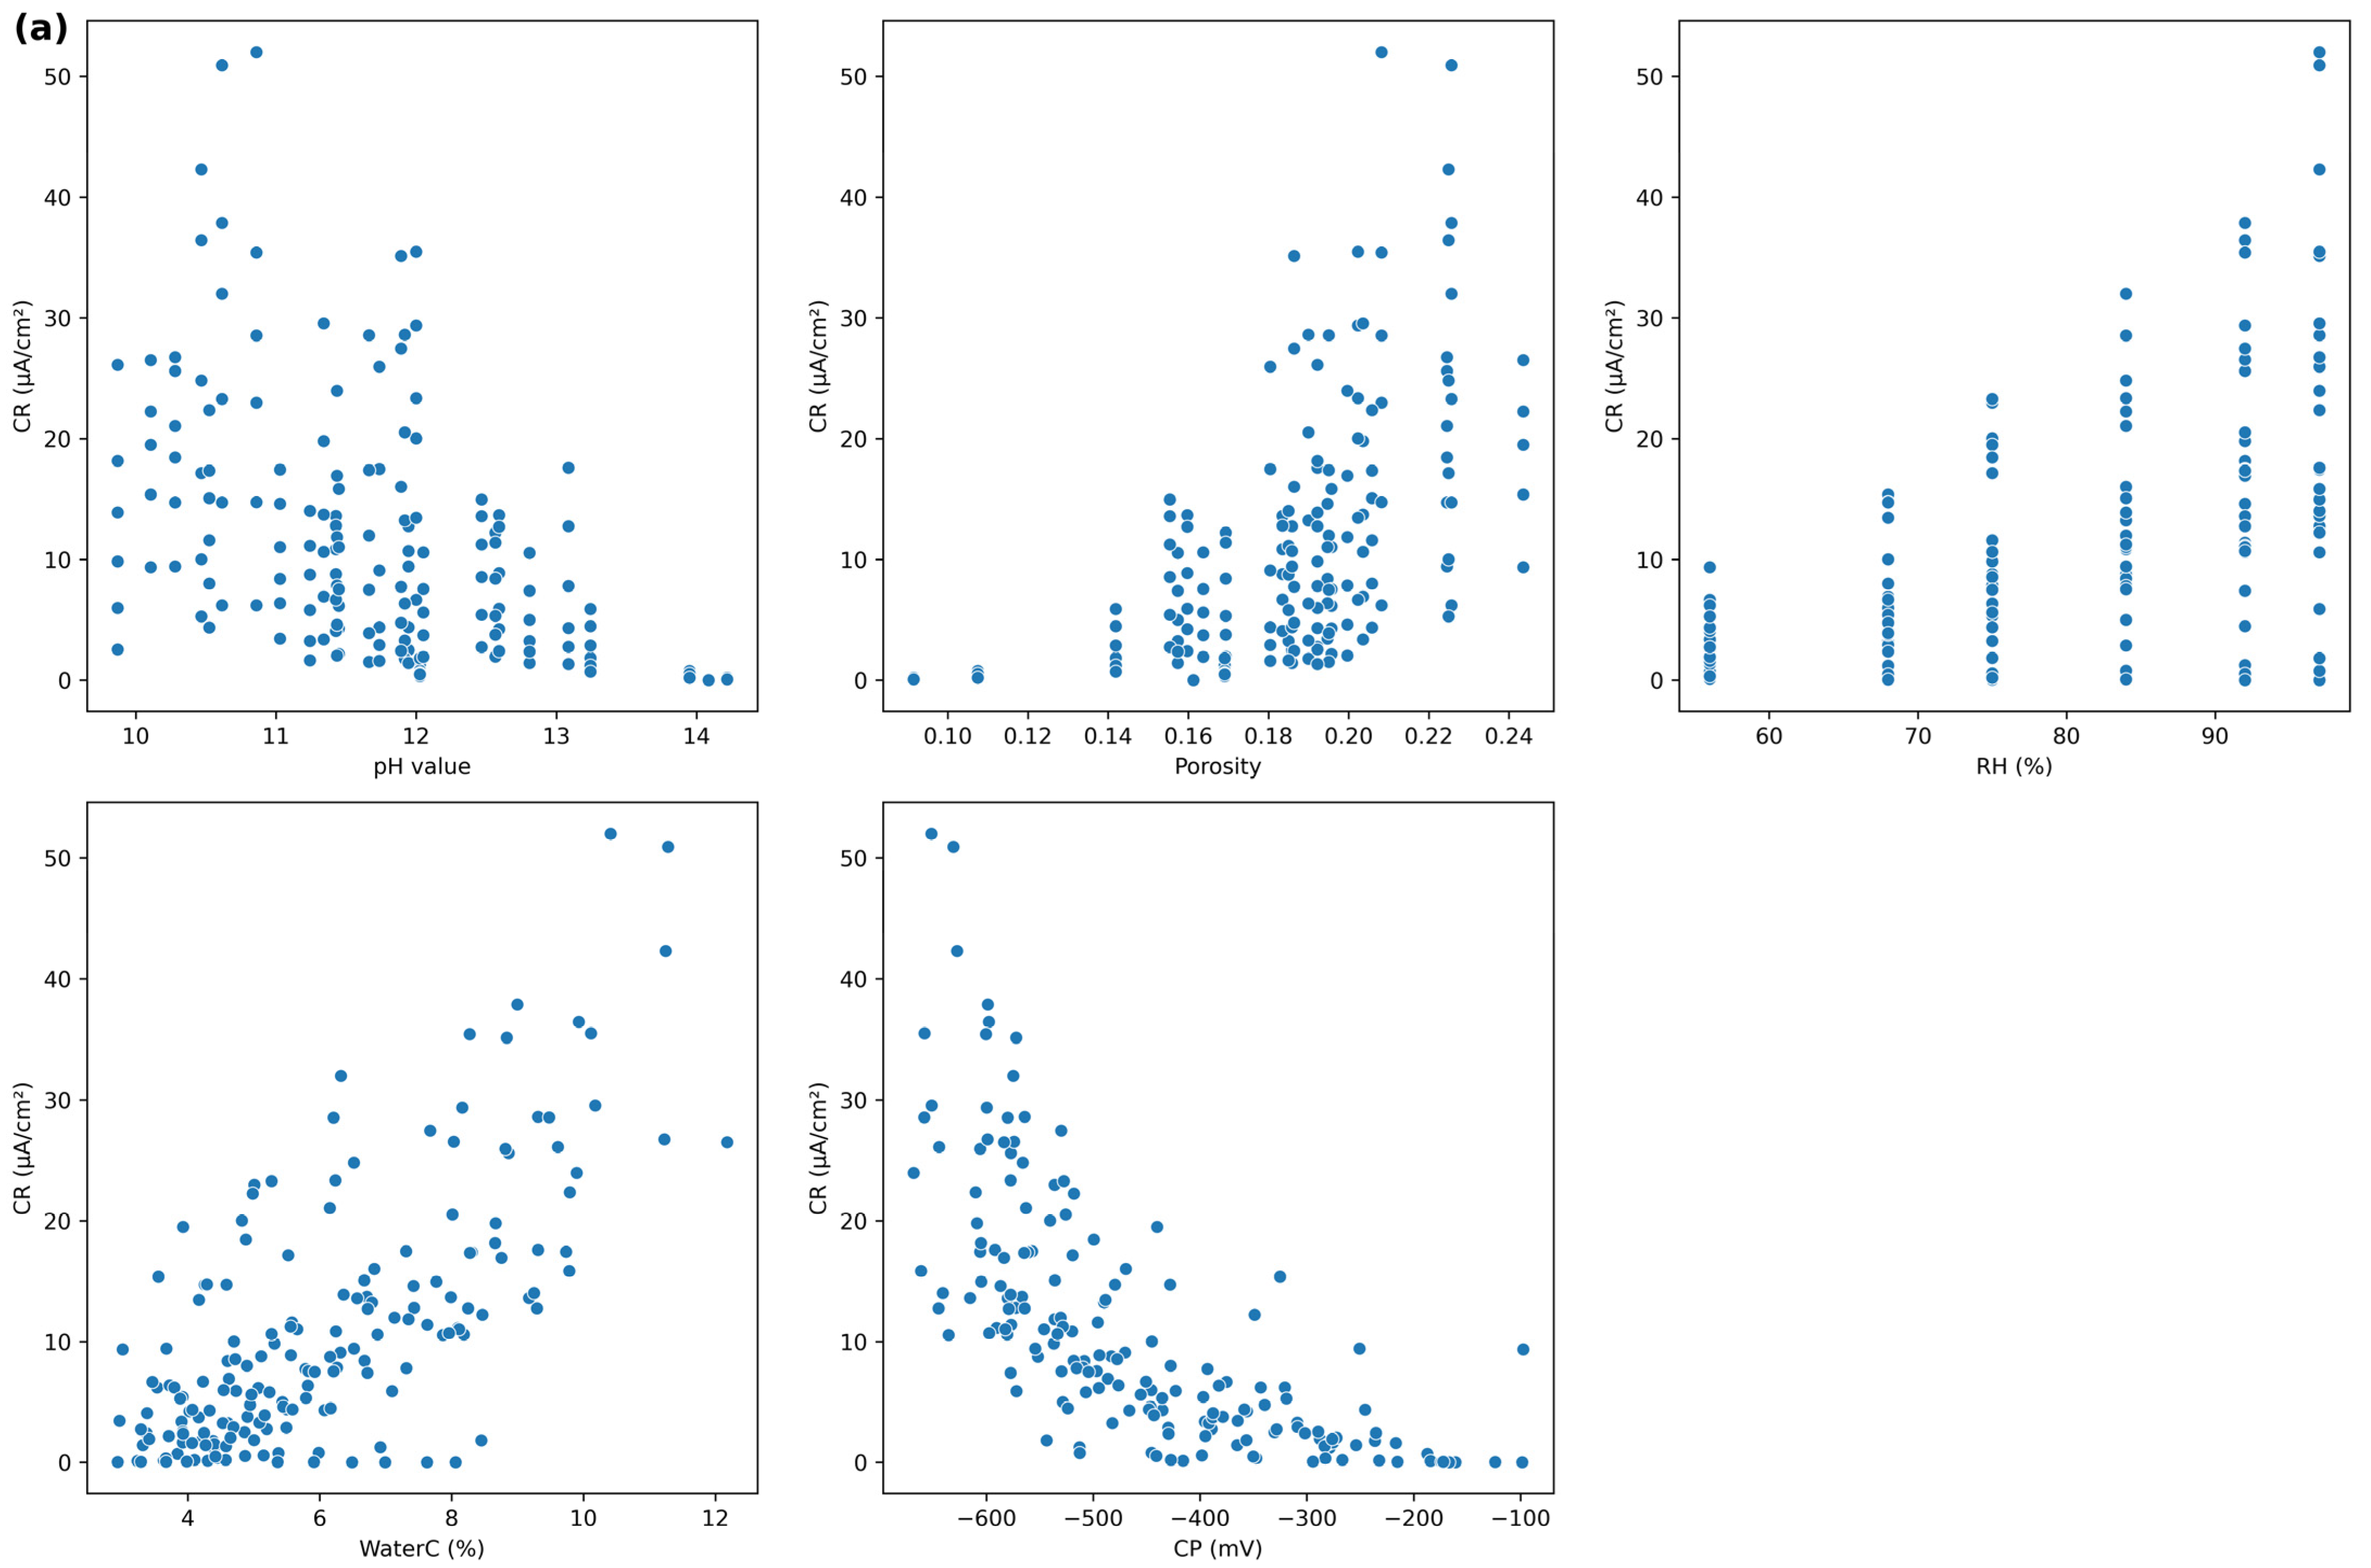
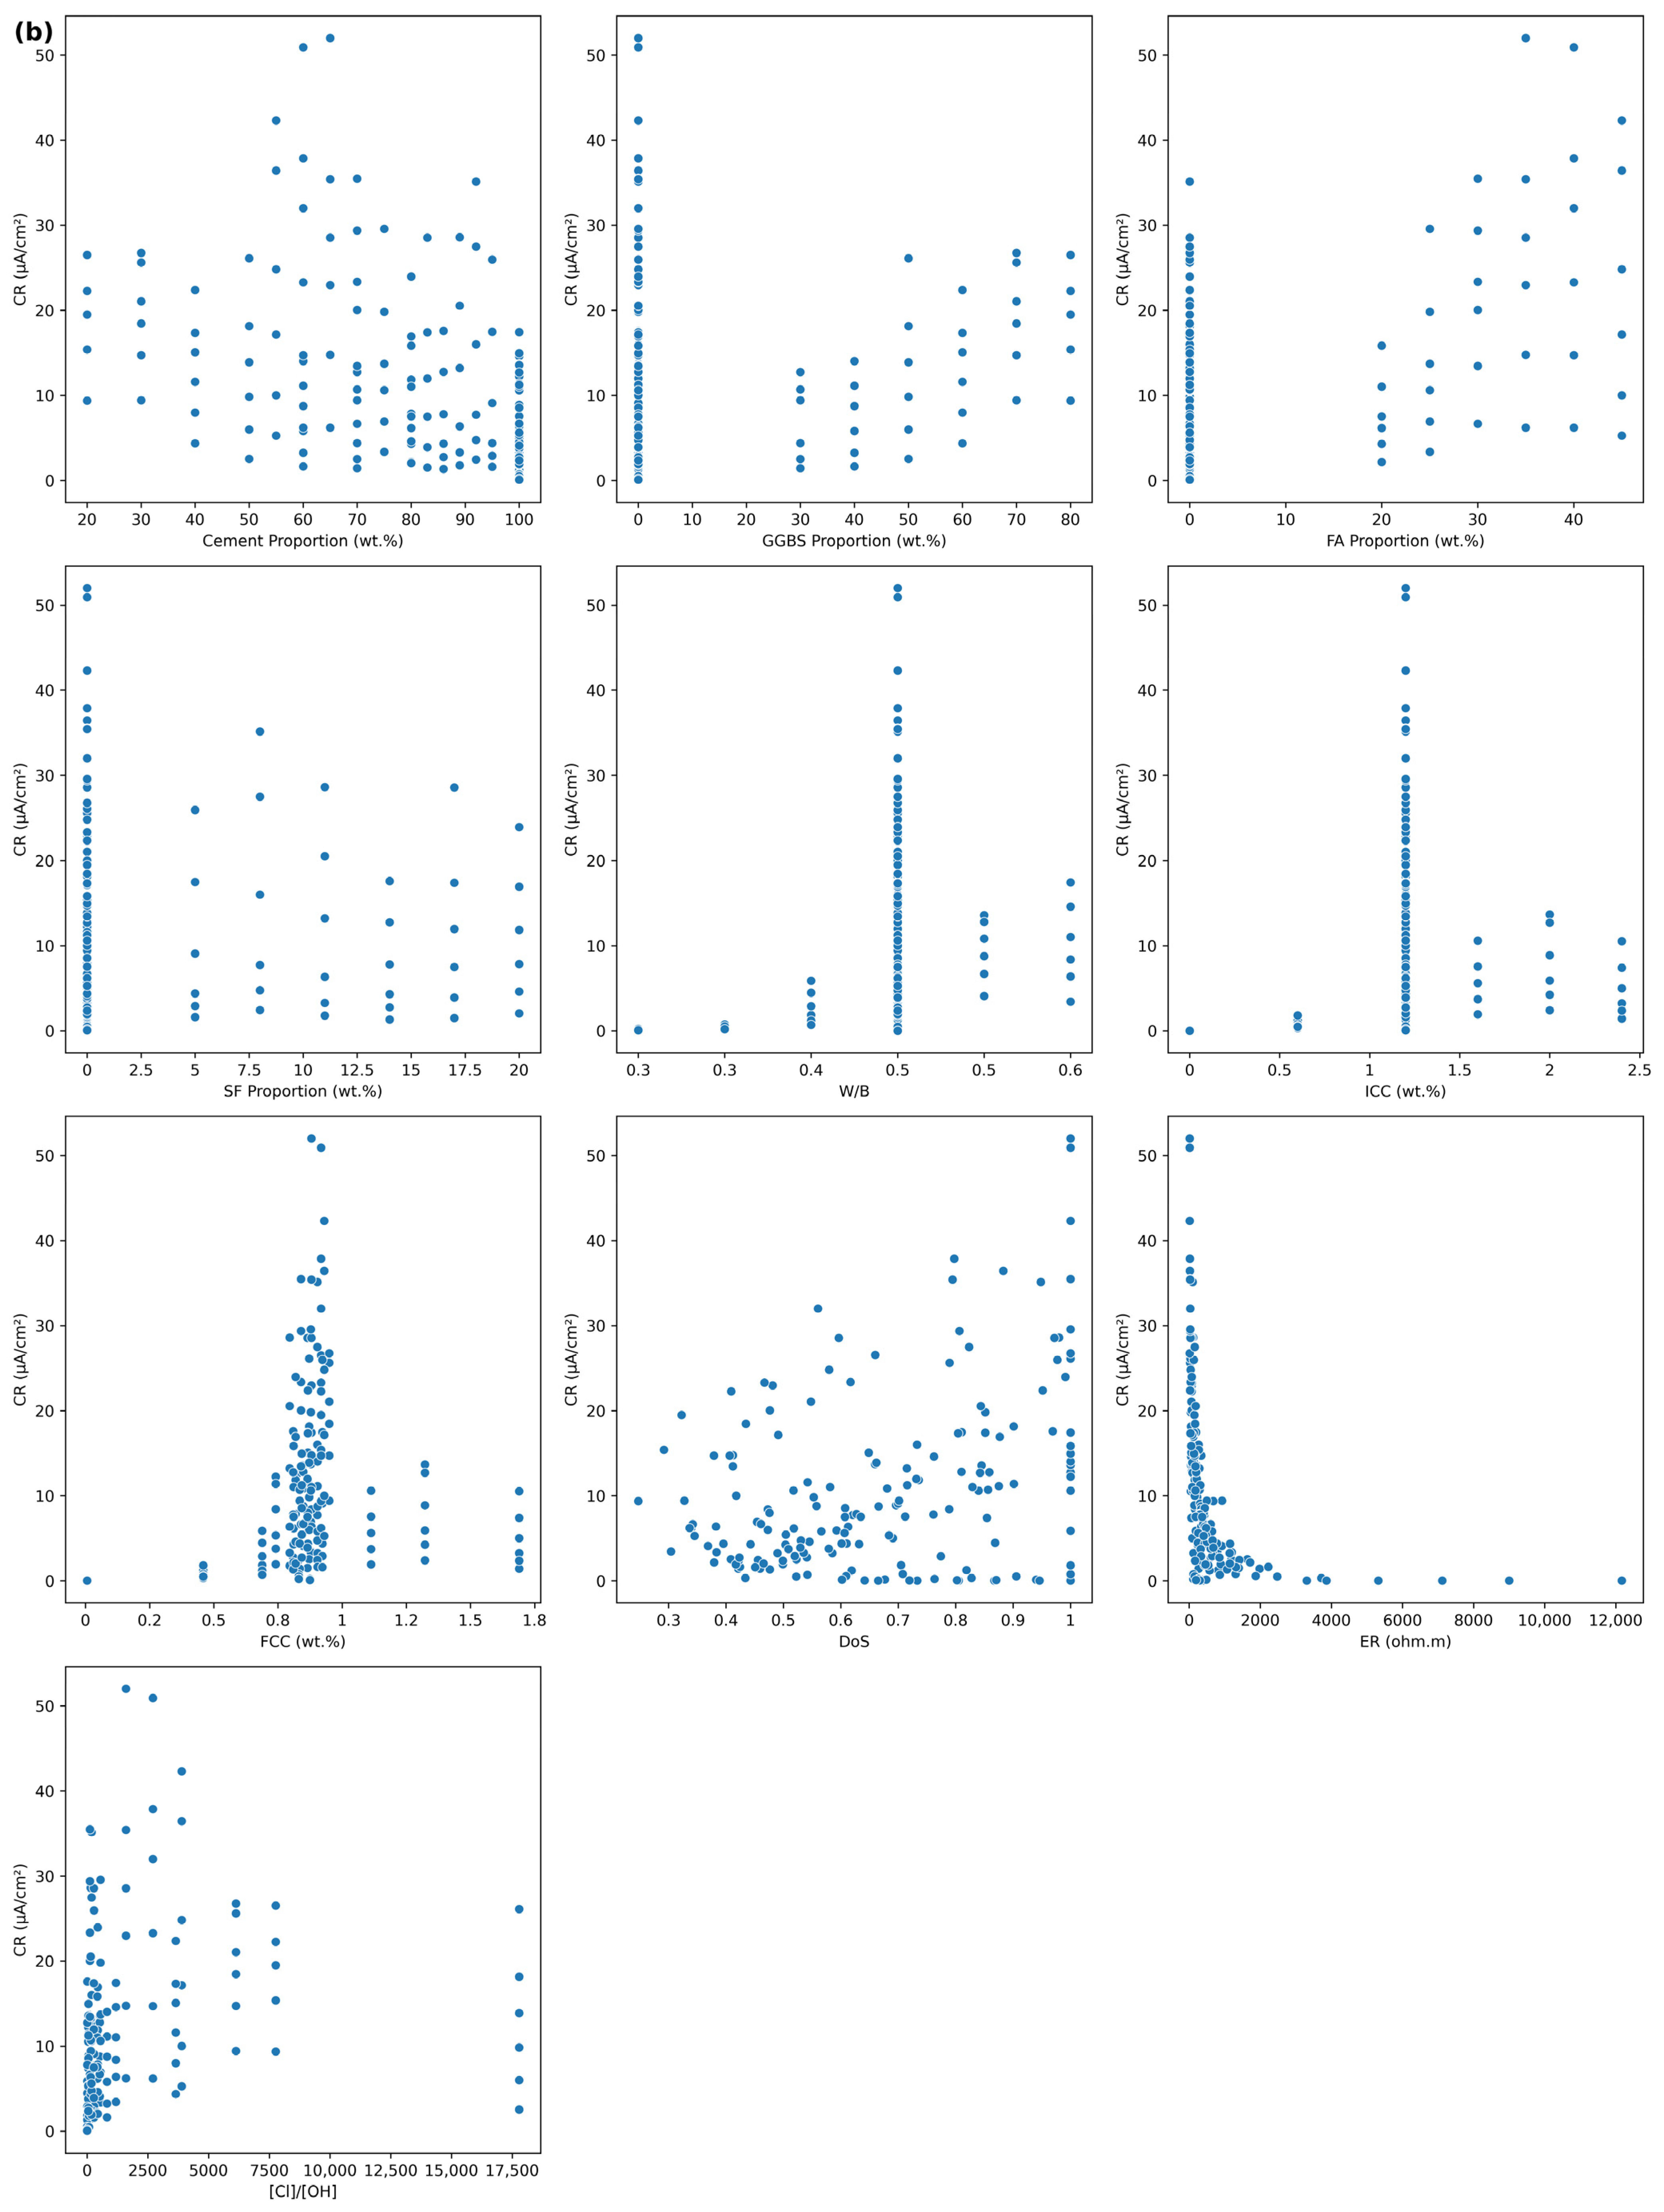
2.1.2. Feature Categorization

The dataset encompasses 15 input features systematically categorized into four mechanistically distinct groups based on their roles in corrosion processes. Mixture parameters (6 variables) include cement content, ground granulated blast-furnace slag (GGBS), fly ash (FA), silica fume (SF), water-to-binder ratio (W/B), and incorporated chloride concentration (ICC), representing the fundamental compositional factors that determine long-term material properties and chemical stability. Material parameters (3 variables) comprise final chloride concentration (FCC), pH value, and porosity, characterizing the pore structure and chemical environment that directly influence corrosion initiation and propagation mechanisms.
Environmental parameters (3 variables) consist of relative humidity (RH), degree of saturation (DoS), and water content (WaterC), representing the moisture conditions that control electrolyte availability and ionic transport processes essential for electrochemical corrosion. Electrochemical parameters (3 variables) include corrosion potential (CP), electrical resistance (ER), and chloride-to-hydroxide ratio ([Cl]/[OH]), providing direct measurements of the electrochemical state and aggressive ion concentrations that govern corrosion kinetics. The target variable, corrosion rate, was measured using linear polarization resistance methodology with the Stern-Geary equation, providing quantitative assessment of steel degradation under controlled conditions.

2.1.3. Statistical Characteristics

Statistical analysis reveals significant distributional diversity across parameter categories, as illustrated in Figure 2A,B. Figure 2A demonstrates the compositional diversity in mixture design parameters, with cement content demonstrating broad compositional ranges (mean: 80.0%, standard deviation: 22.9%) while supplementary cementitious materials show right-skewed patterns reflecting typical concrete practice ranges. Material parameters reveal critical pore structure characteristics, with porosity showing moderate variability (standard deviation: 3.2%) indicating diverse microstructural conditions across the experimental dataset.
Figure 2B illustrates the environmental parameter distributions that directly control moisture availability for electrochemical processes, with WaterC demonstrating the strongest correlation potential (range: 2.9–12.2%).
Electrochemical parameters exhibit the most extreme distributional characteristics, with ER demonstrating exceptional variability (mean: 614.20 ohm·m, standard deviation: 1376.95 ohm·m) and high positive skewness (5.58) indicating the presence of outliers spanning nearly three orders of magnitude, reflecting the wide range of corrosive environments captured in the experimental design.
Extreme values were investigated and retained given their physical plausibility within the experimental parameter ranges. The complete dataset of 180 samples across all 15 input features and target variables contained no missing values, ensuring robust statistical analysis and model training procedures. The [Cl]/[OH] ratio similarly displays extreme distributional behavior (skewness: 3.38; kurtosis: 11.89), reflecting the wide range of aggressive environments represented in the experimental design. Despite this statistical variability, subsequent feature importance analysis reveals that this ratio exhibits limited predictive power for corrosion rate within the studied parameter ranges, suggesting that other factors dominate the corrosion mechanisms under these specific experimental conditions.
Feature correlation analysis (Figure 3) reveals complex interdependencies between variables, with both environmental and electrochemical parameters demonstrating the strongest correlations with corrosion rate. WaterC exhibits the highest positive correlation (0.71), followed by porosity and RH (both 0.57), while CP shows the strongest negative correlation (−0.69) with corrosion rate [23]. Other significant correlations include pH (−0.53) and cement content (−0.47). Mixture parameters such as FA content show moderate positive correlations (0.49), while material and electrochemical parameters exhibit both positive and negative relationships of varying strengths, requiring sophisticated modeling approaches to capture their complex contributions to corrosion behavior.
The pairwise relationship analysis (Figure 4a,b) demonstrates pronounced non-linear relationships and heteroscedastic patterns across parameter categories with varying correlation strengths. Figure 4a reveals strong non-linear relationships between high-correlation variables (|r| ≥ 0.5), particularly the pronounced heteroscedastic patterns in WaterC, porosity, pH, RH, and CP relationships with corrosion rate. Figure 4b demonstrates the complex interaction patterns among moderate-correlation parameters (|r| < 0.5), where mixture composition variables show clustered relationships reflecting typical concrete mix design constraints, with SCMs exhibiting vertical banding patterns due to discrete dosage levels in experimental design. These diverse relationship patterns justify the application of advanced GPR techniques capable of modeling complex, non-uniform variance structures across different parameter correlation regimes.

2.2. Data Preprocessing

2.2.1. Dataset Partitioning

The dataset employs a predetermined 80/20 train-test split that maintains representativeness across the diverse range of material compositions and environmental conditions present in the experimental design. This fixed partitioning strategy, derived from the original experimental protocol of Ji and Ye [23], ensures consistent evaluation conditions across all model variants while providing sufficient training data (144 samples) for robust parameter estimation in high-dimensional kernel spaces. The test subset (36 samples) provides independent validation for assessing model generalization capability across unseen corrosion scenarios, with the split preserving the distributional characteristics of all feature categories to prevent systematic bias.

2.2.2. Feature Standardization

Feature standardization employs Z-score normalization to address the substantial scale disparities evident across parameter categories, where mixture parameters are expressed as weight percentages, electrochemical parameters span multiple orders of magnitude, and environmental parameters utilize various measurement scales. The StandardScaler transformation ensures that high-variance features such as ER do not dominate the covariance calculations inherent in GPR kernel functions, while preserving the relative importance of features with smaller but mechanistically significant variations such as pH and W/B. The standardization procedure is fitted exclusively on training data to maintain test set independence, with learned scaling parameters applied consistently across all experimental phases.

2.2.3. Target Transformation

The square root transformation is applied to the corrosion rate target variable to address the moderate positive skewness (1.38) and reduce the influence of extreme values in the upper tail of the distribution. This transformation provides effective variance stabilization while maintaining interpretability, as the square root of corrosion rate retains physical meaning related to diffusion-controlled electrochemical processes. The transformation reduces the dynamic range by approximately two orders of magnitude, improving the numerical conditioning of the optimization problem while preserving the essential characteristics of the corrosion rate distribution. The transformation compresses the dynamic range of the data, making the distribution more amenable to Gaussian process modeling assumptions. The bidirectional transformation approach ensures that model predictions and performance metrics are evaluated in original corrosion rate units (μA/cm2), maintaining practical relevance for engineering applications.

2.3. Gaussian Process Regression Framework

2.3.1. Theoretical Foundation

Gaussian Process Regression (GPR) provides a probabilistic non-parametric framework particularly well-suited for corrosion prediction applications due to its ability to capture complex non-linear relationships while quantifying prediction uncertainty. The GPR framework models the unknown function f(x) mapping input features to corrosion rate as a realization from a Gaussian process GP(μ(x), k(x,x’)), where μ(x) represents the mean function (typically zero) and k(x,x’) denotes the covariance function encoding assumptions about correlation structure and smoothness. The probabilistic foundation enables uncertainty quantification, which is essential for structural integrity assessment and maintenance planning.

2.3.2. GPR Model Development Strategy

The comprehensive modeling strategy encompasses four distinct GPR architectures, each designed to address specific aspects of corrosion prediction challenges. The progressive complexity from baseline to advanced variants enables systematic evaluation of different modeling approaches.
The baseline GPR implements a composite kernel structure with manual optimization (Appendix A.1). The Expert Knowledge GPR introduces domain-driven feature classification through dual-kernel architecture (Appendix A.2). The GPR-ARD Model enables automatic feature relevance through individual length scale optimization (Appendix A.3). The GPR-OptCorrosion implements specialized multi-component composite kernels for multi-scale phenomena (Appendix A.4).
The architectural progression demonstrates increasing sophistication in kernel design and optimization strategies, with comprehensive comparison provided in Table A1 (Appendix B).

2.4. Performance Evaluation Framework

2.4.1. Performance Assessment Evaluation Metrics

The performance evaluation employs a comprehensive statistical framework capturing different aspects of prediction accuracy and model reliability. The coefficient of determination (R2) serves as the primary metric for explained variance, with values approaching 1.0 representing superior predictive capability. Root Mean Square Error (RMSE) provides practical accuracy assessment for engineering applications, while Mean Absolute Error (MAE) offers robustness against outliers and Mean Absolute Percentage Error (MAPE) enables scale-independent evaluation for the literature comparison [24]. Additionally, the generalization gap (Train R2–Test R2) provides insight into overfitting tendencies, with values approaching zero indicating good generalization capability. These complementary metrics ensure comprehensive characterization of model reliability and practical utility for corrosion prediction applications.
Cross-Validation Strategy
Stratified K-fold cross-validation with K = 5 ensures robust performance assessment and reliable model comparison across different GPR variants. The stratification strategy maintains proportional representation of corrosion rate quartiles within each fold, ensuring that both low and high corrosion rate samples are present in training and validation sets. This approach prevents potential bias that could arise from random splitting, particularly important given the wide range of corrosion rate values and complex feature relationships observed in the dataset.

2.4.2. Statistical Testing

Rigorous statistical significance testing ensures that observed performance differences between GPR variants represent meaningful improvements rather than random variation. Pairwise t-tests compare prediction errors between different models, while the Friedman test provides non-parametric assessment of multiple model performance simultaneously. Statistical significance is evaluated at conventional alpha levels (α = 0.05), with effect size calculations quantifying practical significance of observed performance differences.

2.4.3. Computational Environment

The computational analysis was conducted on an Intel Core i7-4770 processor (3.40 GHz) with 15.9 GB RAM running Ubuntu 20.04 LTS, utilizing Python 3.10.13 within a dedicated Anaconda environment. The core scientific computing stack included NumPy 1.26.4, Pandas 2.2.3, Scikit-learn 1.6.1, and SciPy 1.15.1, with hyperparameter optimization performed using Scikit-optimize 0.10.2. Parallel processing capabilities leveraged all available CPU cores (n_jobs = −1) during optimization procedures. Comprehensive reproducibility measures included fixed random seeds (random_state = 42) and environment specification files, ensuring exact replication across different computational environments.

2.5. Baseline Model Comparison

To establish the effectiveness of the proposed GPR methodologies, comprehensive baseline comparisons were conducted against widely used ML algorithms representing current state-of-practice in corrosion prediction. Seven baseline models were evaluated: SVR (RBF and Linear), Random Forest, ANN, Gradient Boosting, XGBoost, and the basic GPR formulation.
The baseline comparison employed identical experimental protocols with the advanced GPR models to ensure objective performance assessment. Detailed model configurations, parameter settings, and preprocessing requirements are provided in Appendix C (Table A2).

3. Results and Discussion

3.1. Model Performance Comparison

3.1.1. Overall Performance Assessment

Table 1 presents a comprehensive performance comparison encompassing both the proposed GPR variants and widely used baseline ML models, providing systematic evaluation across different algorithmic families. To establish the effectiveness of advanced GPR methodologies, comparisons were conducted against SVR, Random Forest, ANN, Gradient Boosting, and XGBoost representing current state-of-practice approaches in regression modeling.
The baseline GPR model exhibits limited predictive capability with a test R2 of 0.6788 and RMSE of 5.6181 μA/cm2, performing below several conventional ML approaches including XGBoost (R2 = 0.8938), Gradient Boosting (R2 = 0.8735), and SVR with RBF kernel (R2 = 0.8191). These results establish the necessity for more sophisticated modeling strategies to achieve competitive performance in corrosion prediction applications.
The three advanced GPR variants demonstrate substantial performance enhancements, achieving the target threshold of R2 > 0.95, with test R2 values of 0.9636 (Expert Knowledge GPR), 0.9810 (GPR-ARD), and 0.9820 (GPR-OptCorrosion) and RMSE values below 2.0 μA/cm2. All advanced GPR approaches significantly outperform both the baseline ML models and the basic GPR formulation, representing practical accuracy suitable for engineering applications while providing superior predictive capability compared to conventional algorithmic approaches.
The comparative analysis demonstrates the substantial advancement achieved through the proposed GPR methodologies. All three advanced GPR variants significantly outperform conventional ML approaches, with GPR-OptCorrosion achieving superior performance compared to the best baseline model (XGBoost). The advanced GPR models exhibit excellent generalization characteristics, with generalization gaps below 0.04 compared to 0.10–0.29 for baseline approaches, indicating enhanced robustness and reduced overfitting tendencies.
Particularly noteworthy is the performance advantage over SVR, a kernel-based method conceptually similar to Gaussian processes. The GPR-OptCorrosion model achieves substantially higher R2 than SVR (RBF), demonstrating the effectiveness of the specialized kernel design and probabilistic framework. Similarly, the comparison with ensemble methods (Random Forest, Gradient Boosting, XGBoost) validates that sophisticated single-model approaches can outperform ensemble techniques when appropriately designed for domain-specific applications.
The modest performance of basic GPR (R2 = 0.6788) relative to advanced ML models emphasizes the critical importance of the methodological innovations introduced in this study. The substantial performance improvements achieved through domain expertise integration, automatic relevance determination, and multi-kernel architectures justify the increased model complexity and demonstrate the potential for advancing predictive modeling in materials science applications.
The comprehensive model evaluation (Figure 5) illustrates the superior prediction accuracy achieved by advanced GPR variants compared to the baseline approach. The Expert Knowledge GPR achieves substantial improvement with a test R2 of 0.9636 and RMSE of 1.8916 μA/cm2, validating the effectiveness of domain expertise integration. The GPR-ARD model demonstrates exceptional performance with a test R2 of 0.9810 and RMSE of 1.3662 μA/cm2, while maintaining excellent uncertainty quantification capabilities with 91.7% coverage probability for the GPR-ARD model. The GPR-OptCorrosion model achieved superior performance (R2 = 0.9820, RMSE = 1.3311 μA/cm2), substantially exceeding both baseline performance and benchmarks reported in the recent literature where R2 values typically range from 0.61 to 0.90 [1,11]. The achieved accuracy demonstrates substantial improvement over baseline approaches within the controlled experimental conditions examined, contributing to ML applications for corrosion engineering.
The residual analysis reveals well-distributed prediction errors across all advanced models, with mean residuals approaching zero and standard deviations indicating consistent performance across the full range of corrosion rates. The uncertainty analysis demonstrates that all advanced GPR variants provide reliable confidence intervals, with coverage probabilities exceeding 89%, essential for risk-informed decision making in corrosion management applications.

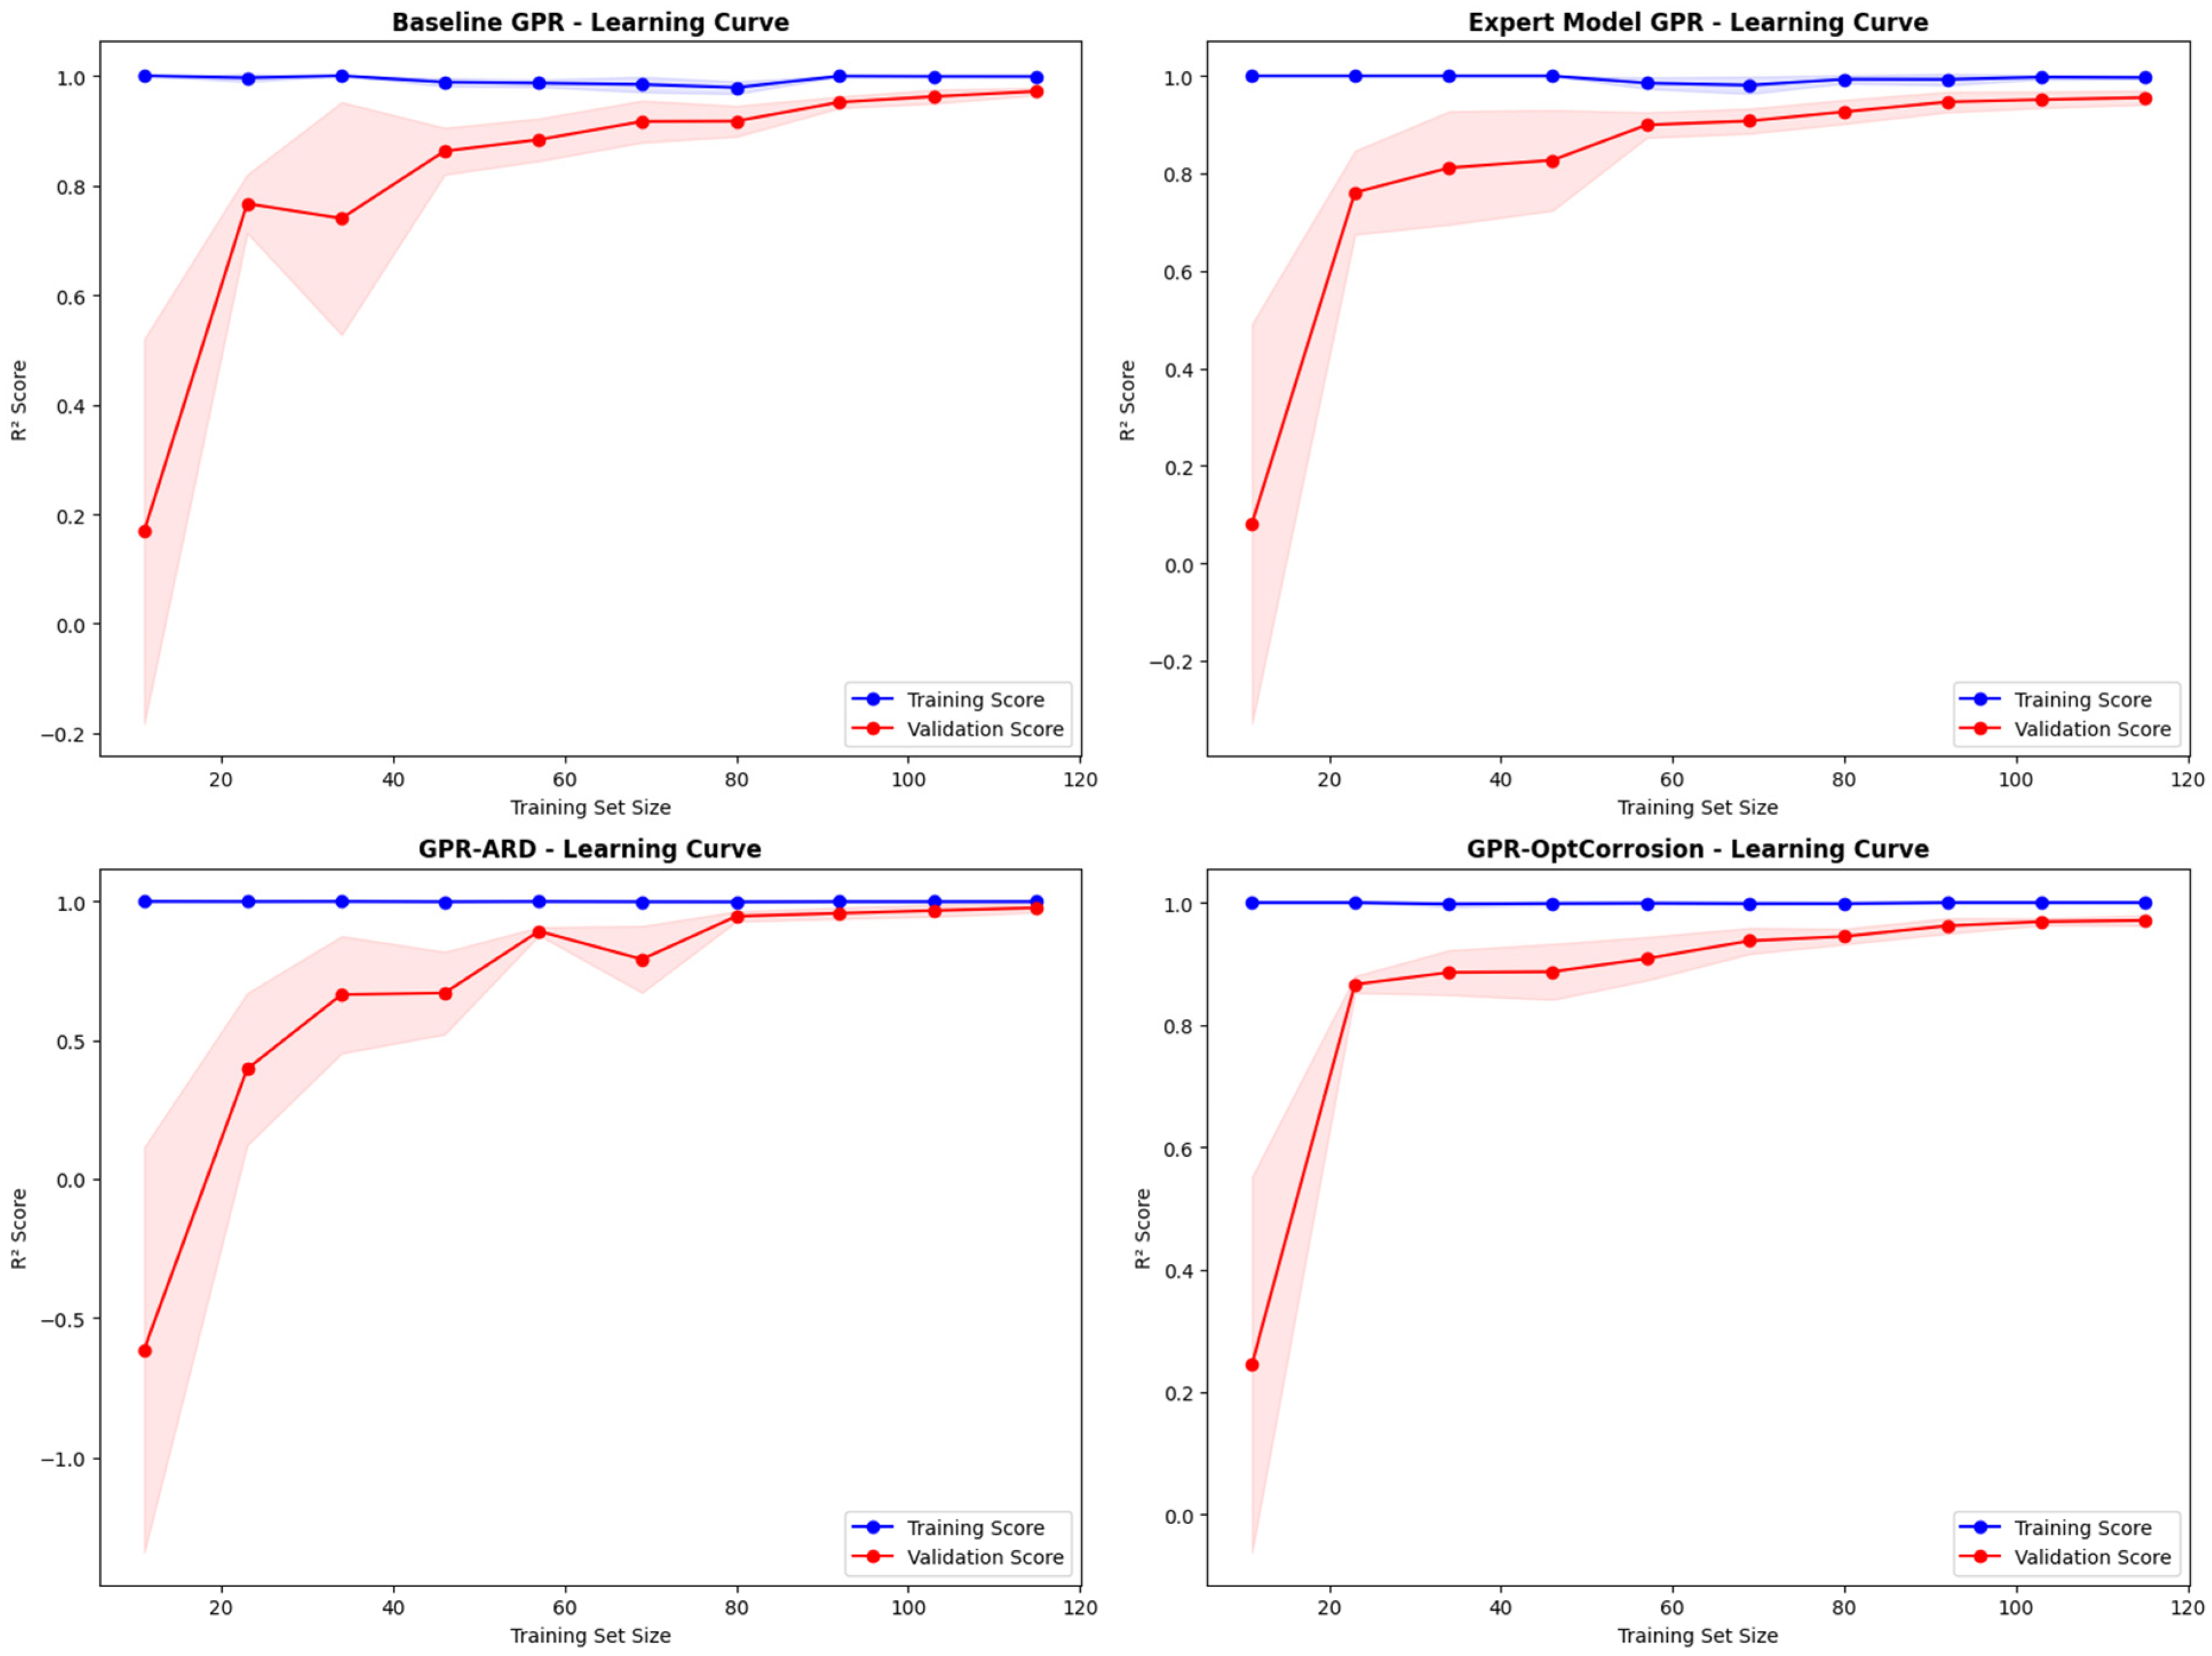
3.1.2. Generalization Performance

The learning curve analysis (Figure 6) provides critical insights into model generalization capabilities and optimal training set requirements. The baseline GPR exhibits severe limitations in learning efficiency, requiring substantial training data to achieve moderate validation performance while maintaining a persistent gap between training and validation scores. This behavior indicates fundamental model inadequacy for capturing the underlying corrosion mechanisms present in the dataset.
The Expert Knowledge GPR demonstrates superior learning efficiency, achieving high validation performance with relatively small training sets due to its domain-informed feature engineering approach. The learning curves show rapid convergence to excellent performance levels with minimal overfitting, validating the effectiveness of expert knowledge integration in reducing model complexity while maintaining predictive accuracy.
The GPR-ARD and GPR-OptCorrosion models exhibit exceptional learning behavior, achieving near-optimal performance with small training sets and maintaining excellent generalization throughout the learning process. The generalization gap analysis confirms these observations, with gaps of 0.0176 and 0.0179, respectively, both well within the excellent performance range (<0.02) and substantially superior to the baseline model’s problematic gap of 0.2641.
The learning curve analysis reveals that GPR-OptCorrosion and GPR-ARD achieve 95% of their final performance with only 60–70% of the available training data, demonstrating superior data efficiency compared to the baseline model which requires the full dataset for convergence. This efficiency characteristic is particularly valuable for corrosion applications where comprehensive datasets are often limited or expensive to obtain.

3.1.3. Computational Efficiency Analysis

The computational efficiency evaluation reveals important performance trade-offs between model sophistication and execution requirements across the GPR variants. The baseline GPR establishes computational benchmarks with 0.0029 s for training and 0.0020 s for prediction, totaling 0.0049 s per complete evaluation cycle.
The Expert Knowledge GPR achieves improved computational efficiency with 0.0023 s for training and 0.0011 s for prediction (total: 0.0034 s), representing a 31% reduction in total execution time compared to the baseline. This efficiency gain results from the feature space partitioning strategy, where the dual-kernel architecture enables parallel processing of primary (5-dimensional) and secondary (10-dimensional) feature subsets. The reduced dimensionality of each individual model leads to more efficient matrix operations while maintaining superior predictive accuracy.
The GPR-ARD model demonstrates exceptional computational performance despite its sophisticated ARD mechanism, requiring only 0.0010 s for training and 0.0004 s for prediction (total: 0.0014 s). This remarkable efficiency represents a 71% reduction compared to baseline performance, likely resulting from the effective feature selection capabilities of ARD that identify and de-emphasize irrelevant parameters. The length scale optimization process automatically reduces model complexity by focusing computational resources on the most predictive features.
The GPR-OptCorrosion model exhibits the highest computational requirements with 0.0043 s for training and 0.0016 s for prediction (total: 0.0059 s), reflecting the additional overhead associated with the multi-kernel architecture and configuration selection process. However, this 20% increase over baseline computational cost delivers substantial performance improvements (R2 increase from 0.6788 to 0.9820), representing exceptional return on computational investment. The configuration-based optimization strategy, while requiring systematic evaluation of multiple parameter combinations, enables parallel processing that maintains practical execution times.
The achieved computational performance resolves a persistent trade-off between accuracy and efficiency that characterizes existing corrosion prediction approaches. While high-accuracy models often sacrifice real-time capability, and efficient methods typically compromise prediction quality, the GPR framework demonstrates that advanced kernel architectures can simultaneously optimize both objectives, achieving superior accuracy within practical deployment constraints. All advanced GPR variants demonstrate computational efficiency suitable for real-time corrosion monitoring applications, with total execution times well below practical deployment thresholds, supporting the adoption of sophisticated modeling approaches in production environments where both accuracy and efficiency are critical requirements.

3.2. Advanced Model Analysis

3.2.1. Model Performance and Feature Analysis

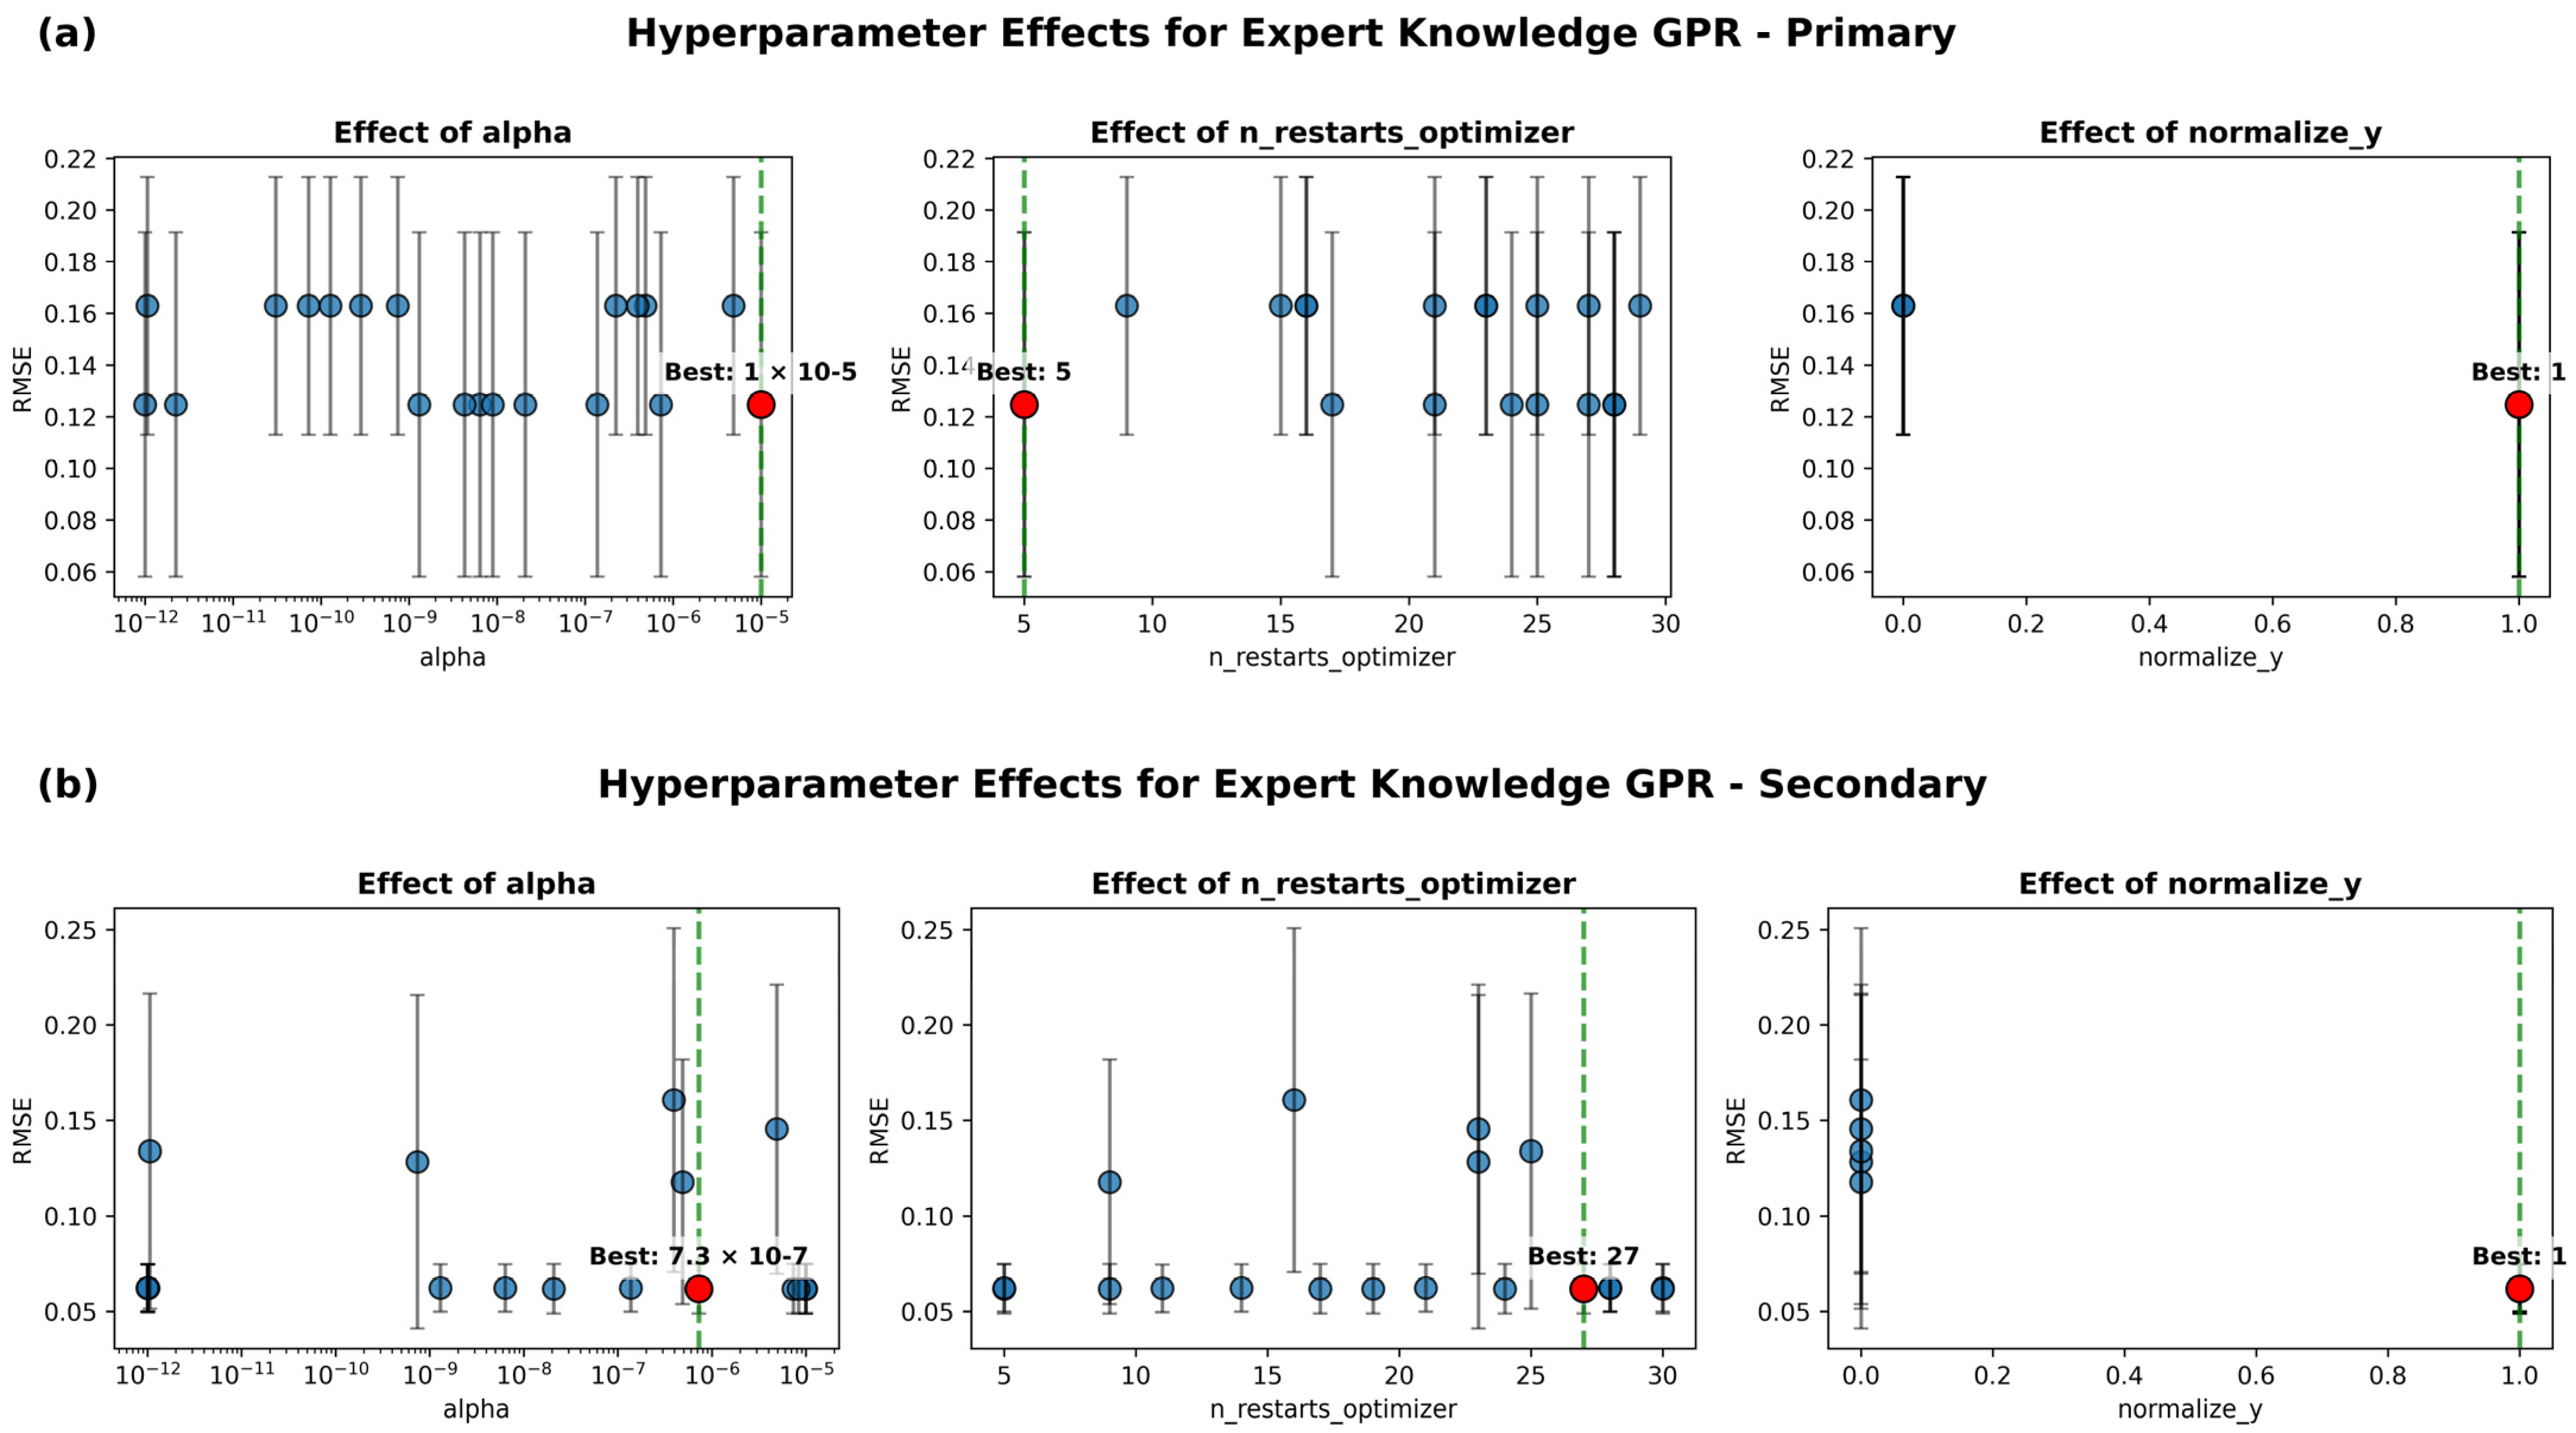
Expert Knowledge GPR Insights
The hyperparameter optimization analysis (Figure 7) reveals distinct parameter preferences between primary and secondary feature models, validating the dual-kernel architecture design philosophy. The primary feature model demonstrates stable optimization behavior, converging to alpha = 1 × 10⁻⁵ with minimal restart requirements (n_restarts = 5), indicating well-conditioned relationships between electrochemically relevant parameters and corrosion rate. The optimization landscape shows consistent performance across a wide range of alpha values, suggesting robust model behavior for primary electrochemical features.
The secondary feature model exhibits more complex optimization requirements, necessitating extensive exploration (n_restarts = 27) and converging to a lower alpha value (7.3 × 10⁻⁷). This behavior reflects the increased complexity in modeling indirect relationships between mixture parameters and corrosion rate, where effects are mediated through long-term microstructural evolution processes. Both models benefit from target normalization, confirming the importance of proper scaling for the wide dynamic range of corrosion rate observed in the experimental dataset.
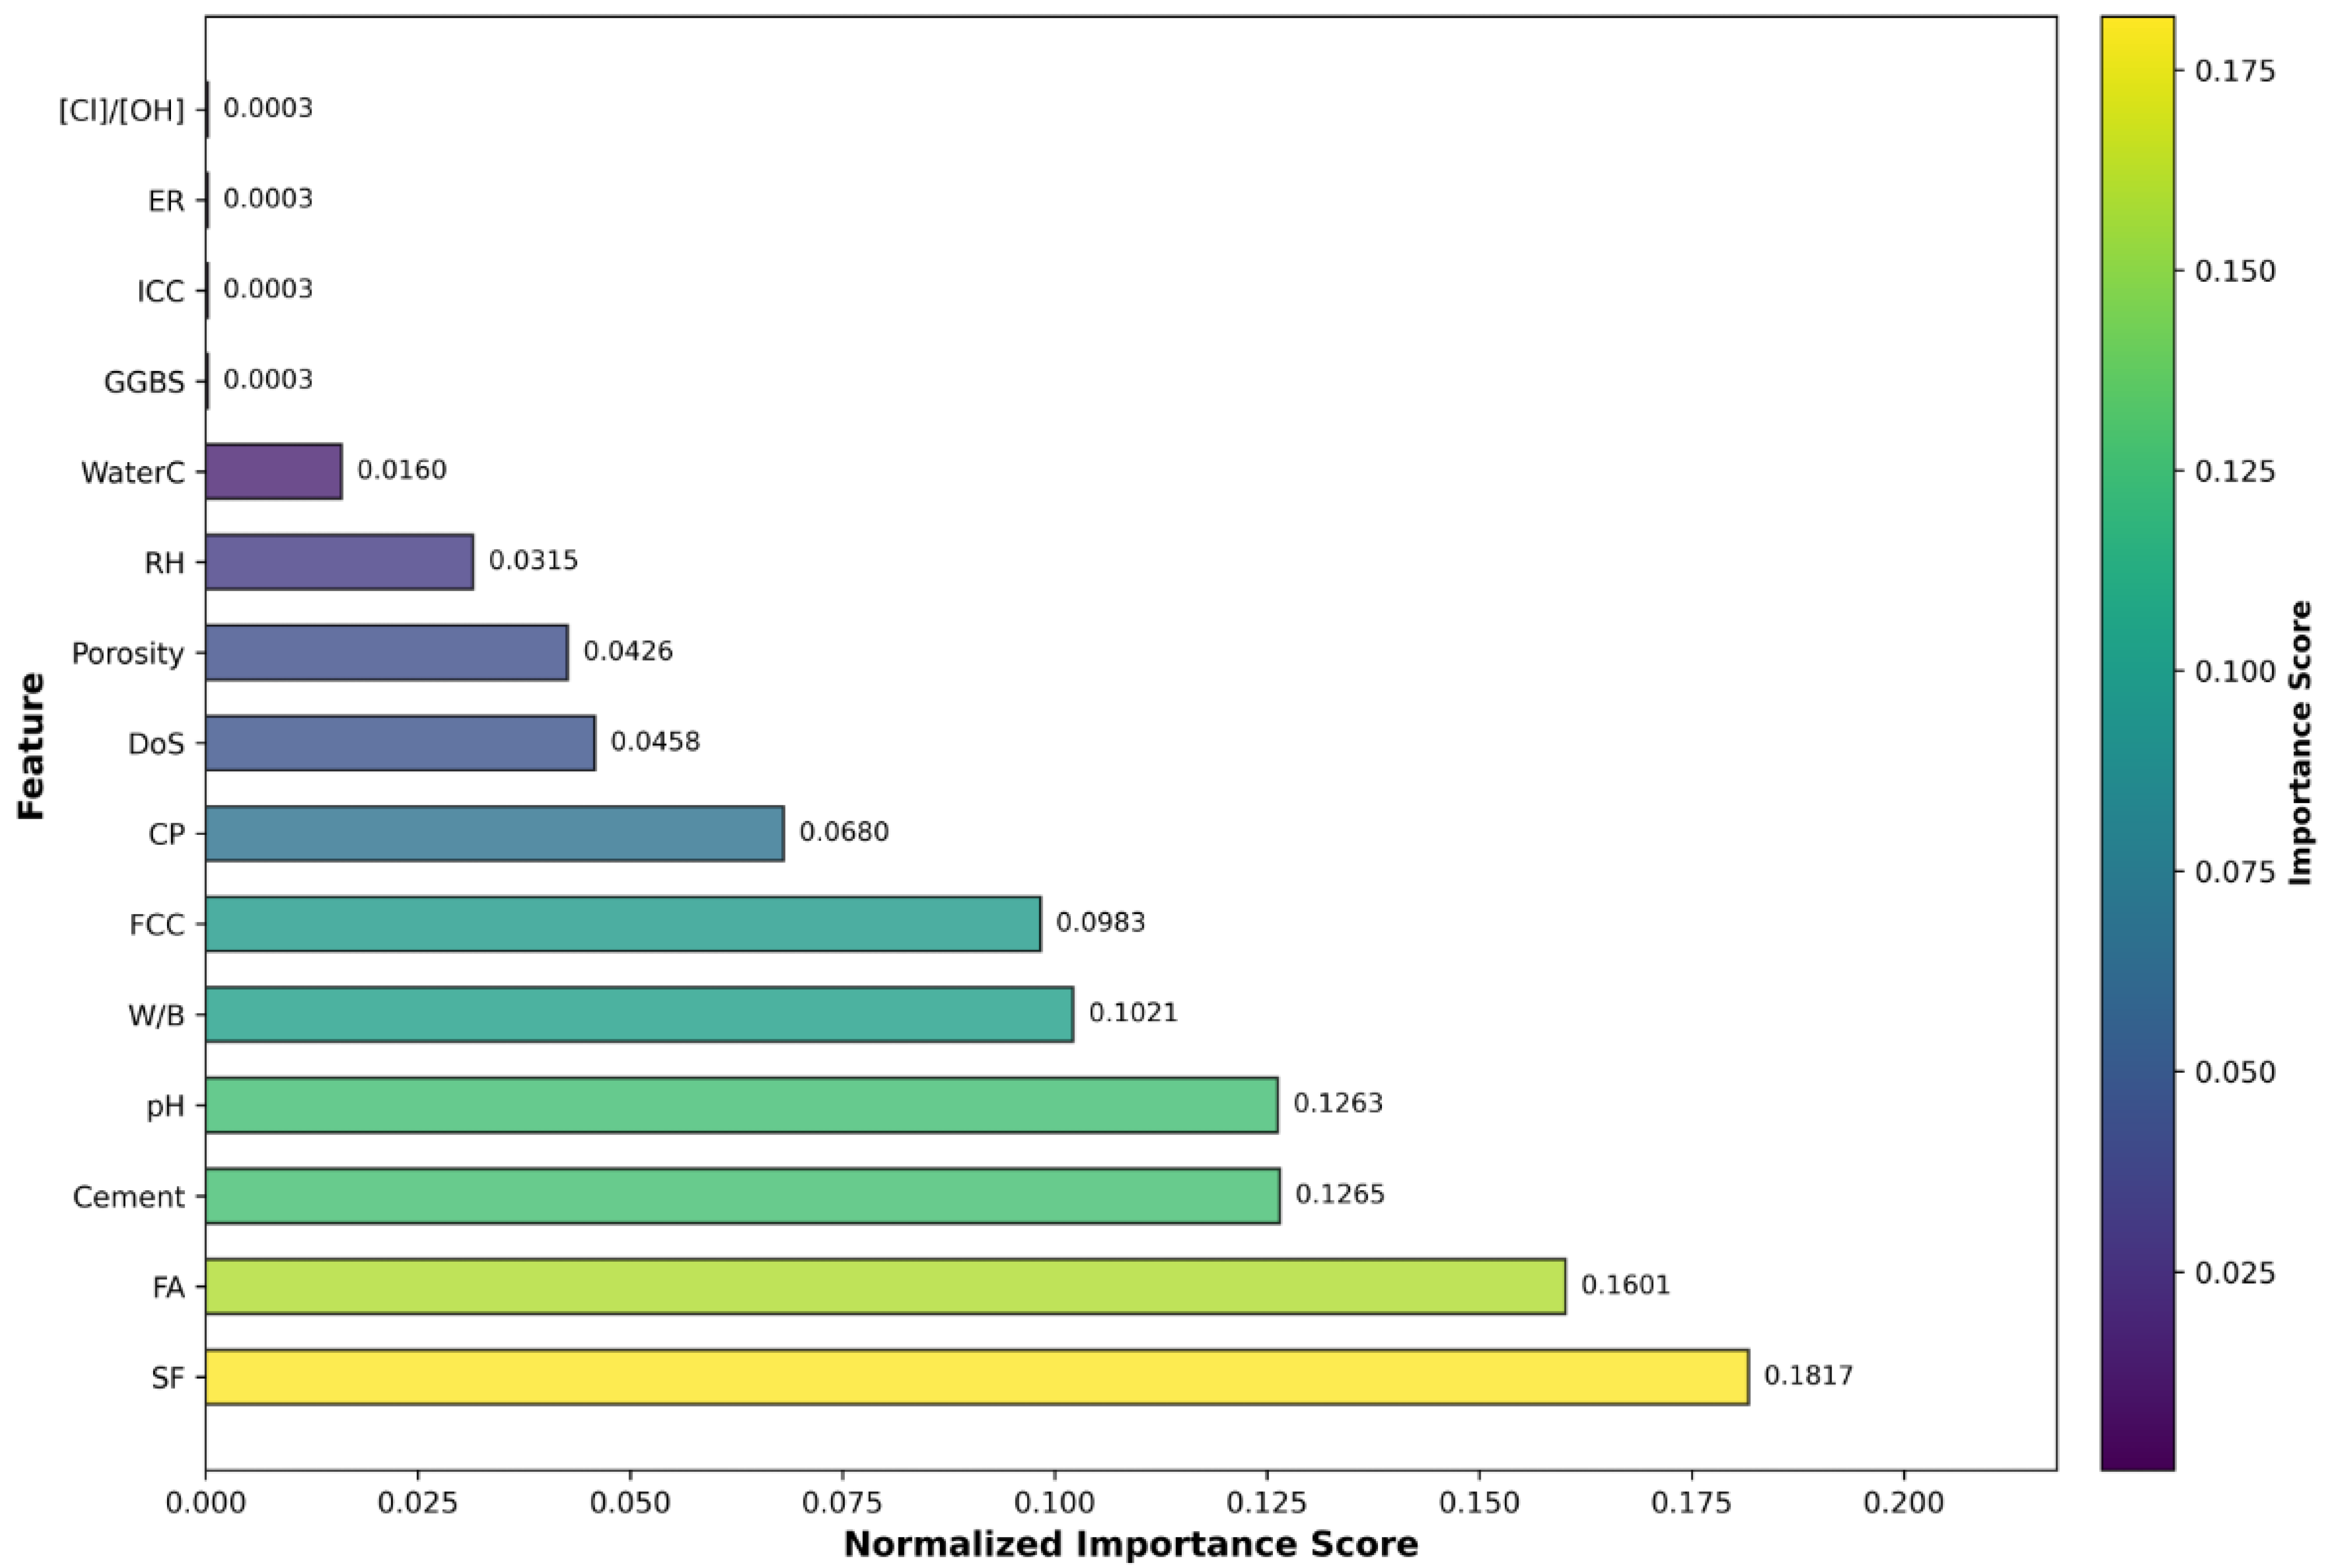
Feature Importance Revelations
The GPR-ARD feature importance analysis (Figure 8) provides insights into parameter relevance for corrosion prediction within the specific experimental conditions of this study. SF emerges as the parameter with the highest importance score of 0.1817, followed by FA at 0.1601, suggesting that SCMs exhibit strong correlations with corrosion rate within the specific controlled laboratory conditions examined. However, this prominence of SCMs may reflect dataset-specific correlations under the particular carbonation conditions studied (10% CO2, 70% RH, 30 °C) rather than universal importance. The inverse length scale methodology, while providing quantitative feature ranking, may capture patterns specific to this experimental design. These findings should be interpreted as correlation-based importance within the studied parameter space rather than causal relationships, requiring validation across diverse exposure scenarios before generalizing to broader corrosion management practices.
This finding reflects the significant impact of these materials on pore structure refinement, chloride binding capacity, and long-term chemical stability of the cementitious matrix within the studied parameter ranges [25,26]. The feature importance hierarchy demonstrates both alignment and novel insights compared to established research, where ER consistently ranks as highly influential [1], while the prominence of SCMs challenges conventional emphasis on electrochemical indicators alone. The feature hierarchy reveals that mixture parameters dominate the top five most important features, with cement content (0.1265), pH (0.1263), and W/B (0.1021) completing the critical parameter set.
Traditional electrochemical indicators including ER, [Cl]/[OH], and ICC receive minimal importance scores (0.0003 each) within this specific experimental context. This limited importance may reflect dataset-specific variability, experimental conditions, or correlations with more influential parameters rather than fundamental irrelevance to corrosion processes.
A particularly noteworthy finding is the minimal importance score assigned to GGBS (0.0003), which contrasts significantly with the prominence of other SCMs such as SF (0.1817) and FA (0.1601). This disparity appears inconsistent with established literature demonstrating GGBS’s beneficial effects on carbonation resistance through pore structure refinement and chemical binding mechanisms. The low ranking of GGBS in the current dataset may reflect several factors: (1) the specific carbonation conditions studied (10% CO2, 70% RH, 30 °C) may not optimally activate GGBS’s protective mechanisms compared to natural carbonation environments; (2) the GGBS content ranges in the experimental design may not span the critical thresholds where significant protective effects manifest; or (3) potential correlation effects with other mixture parameters may mask GGBS’s individual contributions within the ARD framework. Recent studies continue to demonstrate GGBS’s significant influence on carbonation resistance through microstructural modifications and chemical interactions [27], suggesting that the low importance ranking observed in this study warrants further investigation across different experimental conditions and mixture designs. This finding emphasizes the dataset-specific nature of feature importance rankings and highlights the necessity for validation across diverse experimental conditions and GGBS proportions before concluding about its limited relevance to carbonation resistance.
This correlation-based importance hierarchy provides insights into experimental design within similar controlled laboratory environments, suggesting that SCM proportions exhibit stronger correlations with corrosion rate than conventional electrochemical indicators under the specific carbonation conditions studied. However, these findings reflect experimental correlations rather than causal relationships and require extensive field validation across diverse exposure conditions before informing monitoring strategies or design practices.
The prominence of SCMs in feature importance rankings reconciles apparently contradictory findings in the recent literature. While some studies report beneficial effects of SCMs on corrosion resistance [25], others demonstrate increased vulnerability under carbonation exposure [5]. The nuanced importance hierarchy revealed through GPR-ARD suggests that SCM effects are context-dependent, with beneficial impacts under certain exposure conditions but potentially detrimental effects under others, explaining the apparent contradictions in previous research. However, these findings should be validated across diverse exposure environments and material systems before generalizing to broader corrosion management practices.
The ARD capability demonstrates the value of data-driven parameter assessment, providing quantitative validation of parameter significance without requiring subjective feature selection procedures. The inverse relationship between length scales and importance scores offers a principled approach to understanding complex parameter interactions that may not be apparent through traditional correlation analysis or expert judgment alone. However, these importance rankings are specific to carbonation-induced corrosion under controlled laboratory conditions (10% CO2, 70% RH, 30 °C) and may not directly apply to field conditions or other corrosion mechanisms such as chloride-induced corrosion or combined exposure scenarios.

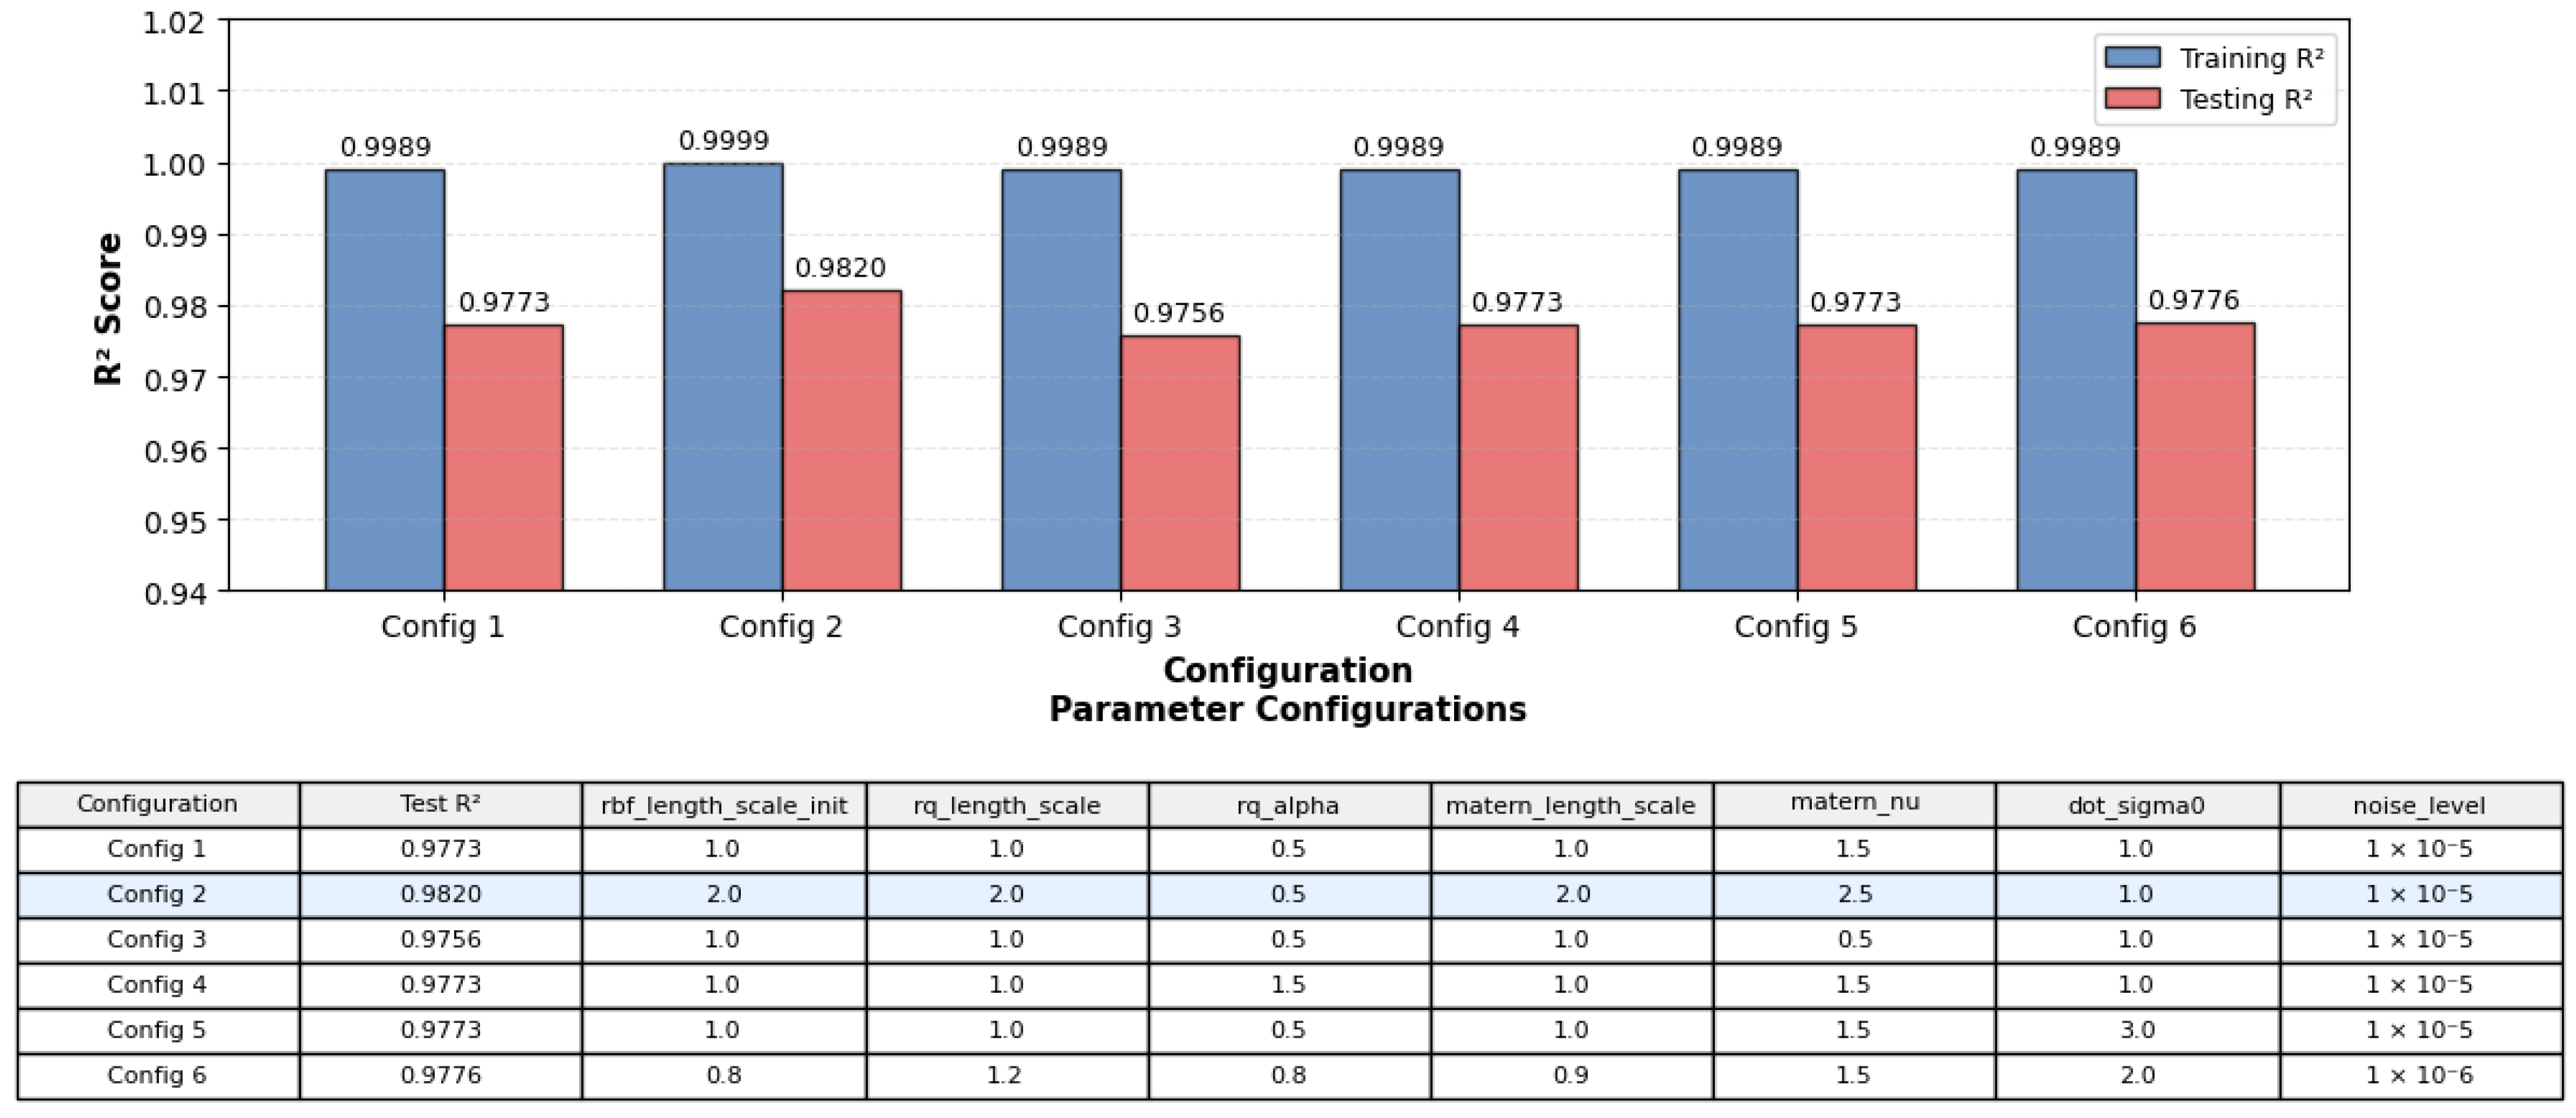
3.2.2. GPR-OptCorrosion Configuration Analysis

The systematic configuration exploration (Figure 9) reveals optimal kernel parameter combinations for the multi-component architecture, with Configuration 2 achieving superior generalization capability (R2 = 0.9820) through increased length scales across all kernel components. The optimal configuration features rbf_length_scale_init = 2.0, rq_length_scale = 2.0, and matern_length_scale = 2.0 with enhanced smoothness (matern_nu = 2.5), indicating that corrosion processes in the studied dataset exhibit relatively smooth variations benefiting from longer correlation lengths.
The configuration analysis demonstrates several key insights: increased length scales improve generalization without sacrificing training performance, higher Matérn smoothness parameters (ν = 2.5) outperform lower values (ν = 0.5), and reduced noise levels provide marginal improvements over default settings. The systematic configuration exploration reveals that length scale parameters of 2.0 across kernel components (Configuration 2) provide optimal balance between model flexibility and generalization capability. Configurations with lower length scales (1.0) show marginally reduced test performance due to overfitting to training patterns, while higher values may underfit complex corrosion relationships. All configurations achieve excellent training performance (R2 ≥ 0.9989) while exhibiting varying degrees of generalization capability, emphasizing the critical importance of proper hyperparameter selection in multi-kernel architectures.
The kernel component analysis (Figure 10) illustrates the distinct functional roles of each kernel element in the composite architecture. The RBF kernel captures global smooth trends in corrosion behavior, the Rational Quadratic component models multi-scale variations across different temporal and spatial scales, the Matérn kernel handles local irregularities and threshold effects, while the Dot Product kernel ensures accurate representation of linear electrochemical relationships.

3.2.3. Uncertainty Quantification Analysis

The uncertainty quantification capabilities of the advanced GPR variants, with coverage probabilities exceeding 89%, provide practical confidence levels for engineering decision making applications. The probabilistic nature of Gaussian process predictions enables comprehensive risk assessment that extends beyond point estimates to include prediction intervals essential for structural integrity evaluation. This probabilistic framework enables more sophisticated risk assessment compared to deterministic approaches that provide point estimates without quantifying prediction reliability.
This probabilistic approach represents a significant advancement over deterministic corrosion prediction methods that provide point estimates without quantifying prediction reliability, enabling more sophisticated maintenance optimization and structural health monitoring strategies [28,29].

3.3. Statistical Validation and Comparative Analysis

3.3.1. Statistical Significance Assessment

The statistical significance analysis (Table 2) confirms that observed performance differences represent genuine improvements rather than random variation. Pairwise t-tests reveal highly significant differences (p < 0.001) between the baseline GPR and all advanced variants, providing strong statistical evidence for the effectiveness of sophisticated modeling approaches. The comparisons between advanced models show more modest but statistically significant differences, with Expert Knowledge GPR versus GPR-ARD (p = 0.026) and Expert Knowledge GPR versus GPR-OptCorrosion (p = 0.041) achieving significance at the α = 0.05 level.
Notably, the GPR-ARD versus GPR-OptCorrosion comparison yields a non-significant result (p = 0.838), indicating statistically equivalent performance despite fundamentally different architectural approaches. This finding suggests that both ARD and multi-kernel composite architectures represent equally valid approaches to advanced corrosion prediction, with selection criteria potentially depending on specific application requirements such as interpretability versus architectural sophistication.
The Friedman test confirms significant overall differences among all models (χ2 = 35.77, p < 0.001), supporting the conclusion that model architecture substantially impacts corrosion prediction accuracy and validating the comprehensive comparison methodology employed in this investigation. While statistical significance is achieved, the practical significance should be evaluated in the context of engineering tolerances and real-world measurement uncertainties, where RMSE improvements from 5.6181 to 1.3311 μA/cm2 translate to meaningful reductions in prediction error for infrastructure management applications.

3.3.2. Model Selection and Recommendations

Based on the comprehensive performance analysis, statistical validation, and practical considerations, the GPR-OptCorrosion model emerges as the recommended approach for general corrosion rate prediction applications. This model achieves the highest test accuracy (R2 = 0.9820) while maintaining excellent generalization characteristics and providing sophisticated uncertainty quantification through its multi-kernel architecture. The composite kernel successfully captures the complex, multi-scale nature of corrosion processes, enabling superior predictive performance across diverse material compositions and environmental conditions.
The GPR-ARD model represents an excellent alternative for applications prioritizing interpretability alongside predictive accuracy. With comparable performance (R2 = 0.9810) and superior computational efficiency, this approach provides valuable feature importance insights that can guide experimental design, monitoring strategies, and material optimization efforts [20]. The ARD capability offers significant value for scientific understanding and practical decision making in corrosion engineering applications.
The Expert Knowledge GPR provides a valuable middle ground, achieving substantial performance improvements while maintaining interpretability through domain-driven feature classification. This approach may be preferred in applications where the integration of established scientific knowledge with ML capabilities is prioritized over pure predictive performance optimization [30,31].

4. Implications for Engineering Practice

4.1. Predictive Maintenance Applications

The developed GPR models offer significant implications for predictive maintenance strategies in concrete infrastructure. Probabilistic uncertainty quantification enables risk-informed decisions by providing explicit confidence bounds that can be integrated with existing reliability-based design methodologies [32,33,34]. The real-time computational efficiency (execution times < 0.006 s) makes these models suitable for deployment in structural health monitoring systems requiring rapid response capabilities.
The achieved RMSE improvement from 5.6181 to 1.3311 μA/cm2 translates to significant practical benefits for infrastructure management as demonstrated across multiple studies in the corrosion literature. Ji and Ye [1] established that corrosion rate prediction accuracy directly impacts service life calculations, with their SVR achieving R2 = 0.90 for steel corrosion in carbonated cementitious mortars using similar electrochemical measurement approaches. The prediction improvement achieved in this study aligns with findings from Cheng and Maruyama [8], who demonstrated that corrosion rate prediction models with R2 > 0.85 enable reliable field validation for reinforced concrete buildings aged 47–65 years, with predicted values falling within ±100% of measured values.
Wang et al. [15] quantified the practical significance of corrosion prediction accuracy in their marine corrosion study, showing that improved prediction models (R2 = 0.69–0.87) enable more precise maintenance scheduling for bulk carrier structures over 25-year service periods. Their data fusion approach demonstrated that enhanced prediction accuracy prevents both premature maintenance interventions and delayed responses to critical corrosion states.
The probabilistic uncertainty quantification achieved in this study (coverage probabilities exceeding 89%) addresses a critical need in corrosion management. This capability enables sophisticated maintenance optimization strategies and supports risk-informed decision making for infrastructure management, as demonstrated by Keo et al. [29] in bridge inspection scenarios that distinguish between structures requiring immediate intervention versus continued monitoring.
The composite kernel architecture represents a methodological advancement over single-kernel approaches commonly employed in corrosion prediction, addressing limitations noted in physics-based studies regarding the multi-scale nature of corrosion processes operating across different temporal and spatial scales [4]. The multi-mechanism integration capability enables more accurate representation of complex corrosion phenomena compared to traditional approaches that assume uniform degradation mechanisms.
The correlation-based feature importance insights reveal that SCM proportions exhibit stronger correlations with corrosion rate than conventional electrochemical indicators specifically within the controlled carbonation environment studied (10% CO2, 70% RH, 30 °C). However, these findings reflect laboratory correlations under controlled carbonation conditions and should not be directly applied to field monitoring strategies without extensive validation across diverse real-world exposure scenarios [15]. The potential for dataset-specific overfitting in ARD rankings emphasizes the need for cross-validation with independent datasets and field studies to establish the robustness of these importance hierarchies across different environmental conditions and material systems. Field validation is required before implementing these findings in real-world infrastructure management systems.

4.2. Design and Construction Considerations

The superior performance of GPR models incorporating SCMs provides valuable guidance for sustainable concrete design. The prominence of SF and FA in feature importance rankings suggests that strategic use of these materials can significantly influence long-term durability performance [35,36].
However, these findings must be interpreted within the context of the specific experimental conditions studied. The dominance of mixture parameters in importance rankings may vary under different exposure environments and material systems, emphasizing the need for validation across broader experimental conditions before generalizing to practice [37,38]. Additionally, while the computational efficiency of the developed models (<0.006 s) enables real-time applications, practical implementation in field monitoring systems requires consideration of sensor integration costs, data transmission infrastructure, and maintenance personnel training. The superior accuracy achieved through advanced GPR models must be balanced against these implementation complexities and associated costs in real-world deployment scenarios.

4.3. Research and Development Directions

The methodology framework established in this research extends beyond corrosion prediction to benefit other materials engineering applications requiring multi-scale, multi-mechanism modeling approaches, including structural failure mode classification [39] and enhanced predictive accuracy while maintaining scientific interpretability [40,41].
Future research should focus on expanding the dataset scope to include diverse exposure mechanisms, validating model performance across different experimental environments and research groups, and developing real-time monitoring systems integrating these advanced prediction capabilities. The integration of physics-informed constraints, temporal modeling capabilities, and multi-mechanism corrosion processes represents promising directions for further enhancing predictive accuracy and practical applicability.
The methodological framework demonstrates transferability across diverse corrosion applications, as evidenced by successful implementations spanning pipeline systems [42], atmospheric exposure [16], marine environments [15], and concrete structures within the recent literature. This broad applicability demonstrates potential for the developed GPR architecture to be adapted for diverse corrosion applications, suggesting opportunities for wider implementation across different material systems and environmental conditions within the corrosion engineering discipline.

5. Limitations and Future Work

5.1. Study Limitations

This investigation is based on a single experimental dataset with specific material compositions and controlled laboratory testing conditions. The generalizability of model performance and feature importance rankings requires validation across diverse experimental protocols, material systems, and research groups to establish broader applicability beyond the current study scope [43].
The controlled laboratory environment (10% CO2, 70% RH, 30 °C) may not fully represent the complex, variable conditions encountered in real-world concrete structures. Field validation under natural carbonation conditions with fluctuating environmental parameters is necessary to establish practical applicability and assess model robustness under realistic exposure scenarios [6,9].
The current approach provides snapshot predictions without explicitly modeling time-dependent corrosion evolution and aging effects. The feature importance rankings derived from GPR-ARD, particularly the prominence of SCMs, reflect correlations within the specific laboratory dataset and may not represent universal parameter importance across diverse field conditions. The inverse length scale methodology may capture dataset-specific patterns that require validation through independent experimental studies and field monitoring programs. Future developments should incorporate temporal dynamics, corrosion rate evolution over extended exposure periods, and long-term degradation mechanisms for comprehensive structural assessment applications [22,44].

5.2. Future Research Directions

The models require validation across different experimental setups, research groups, and geographical regions to establish universal applicability and identify potential systematic biases or dataset-specific optimizations that may limit broader generalization. Extension to chloride-induced corrosion, combined exposure scenarios involving multiple aggressive agents, and other concrete degradation mechanisms represent important future research directions for comprehensive durability assessment [42,45].
Future research should focus on expanding the dataset scope to include diverse exposure mechanisms, validating model performance across different experimental environments and research groups, and developing real-time monitoring systems integrating these advanced prediction capabilities. The integration of physics-informed constraints, temporal modeling capabilities, and multi-mechanism corrosion processes represents promising directions for further enhancing predictive accuracy and practical applicability in structural health monitoring and maintenance optimization applications.

6. Conclusions

This study presents a comprehensive investigation of hybrid GPR models for predicting the carbonation-induced steel corrosion rate in cementitious mortars. Through the systematic development and evaluation of four GPR variants, several significant conclusions emerge that contribute to both corrosion science and ML applications in materials engineering.
The comparative analysis demonstrates that advanced GPR architectures substantially outperform conventional approaches, with the proposed models achieving test R2 values exceeding 0.96 compared to 0.68 for baseline GPR. The GPR-OptCorrosion model demonstrates superior predictive performance (R2 = 0.9820, RMSE = 1.33 μA/cm2) within the scope of this investigation, representing a substantial improvement over baseline GPR approaches. The computational efficiency results (execution times < 0.006 s) suggest practical scalability for real-time monitoring applications.
The integration of domain expertise through the Expert Knowledge GPR approach validates the importance of incorporating materials science principles into ML frameworks. The dual-kernel architecture successfully differentiates between primary electrochemical parameters and secondary mixture variables, achieving substantial performance improvements (R2 = 0.9636) while maintaining interpretability.
The GPR-ARD analysis provides insights into parameter importance within the specific experimental conditions studied, identifying SCMs (SF and FA) as highly influential factors. The ARD capability provides the quantitative validation of parameter significance without requiring manual feature selection, though interpretation must consider the dataset-specific nature of these findings.
From a practical standpoint, all advanced GPR variants demonstrate computational efficiency suitable for real-time applications while providing comprehensive uncertainty quantification essential for risk-informed decision making. The excellent generalization capabilities (generalization gaps < 0.02) indicate robust performance across the range of material compositions and environmental conditions represented in the experimental dataset.
The feature importance rankings align with established electrochemical principles while revealing novel insights specific to the studied carbonation conditions. The parameter hierarchies identified show consistency with fundamental corrosion mechanisms within the controlled conditions studied, though the prominence of SCMs reflects the specific experimental environment examined of the developed GPR framework’s ability to capture fundamental corrosion physics.
The statistical validation confirms the significance of observed improvements, with highly significant differences (p < 0.001) between baseline and advanced approaches. The comparable performance of the GPR-ARD and GPR-OptCorrosion models (p = 0.838) suggests that both ARD and composite kernel architectures represent equally valid approaches to advanced corrosion prediction.
This research contributes to advancing ML applications in corrosion engineering and provides a foundation for future developments in predictive maintenance and structural health monitoring.
Furthermore, this research demonstrates three additional significant contributions: (1) The methodology framework established extends beyond corrosion prediction to benefit other materials engineering applications requiring multi-scale, multi-mechanism modeling approaches. (2) The computational efficiency achieved (<0.006 s) enables practical deployment in real-time structural health monitoring systems, addressing a critical gap between research models and industrial applications. (3) The probabilistic uncertainty quantification framework provides a foundation for developing risk-informed decision-support systems that can optimize maintenance strategies while minimizing both premature interventions and delayed responses to critical corrosion states.
Future work should prioritize field validation under natural exposure conditions to establish the real-world applicability of these laboratory-derived insights, particularly the feature importance hierarchies and performance benchmarks established under controlled carbonation conditions.

Funding

This research was funded by King Mongkut’s University of Technology North Bangkok, Contract no. KMUTNB-68-KNOW-11.

Data Availability Statement

The original contributions presented in the study are included in the article, further inquiries can be directed to the corresponding author.

Conflicts of Interest

The author declares no conflict of interest.

Appendix A

Appendix A.1. Baseline GPR Implementation

The baseline GPR model implements a composite kernel structure that combines three fundamental kernel components to capture different aspects of the corrosion rate prediction problem. As illustrated in Algorithm A1, the kernel configuration consists of a Constant kernel multiplied by a Radial Basis Function (RBF) kernel, with an additive White noise kernel to account for observation noise.
The Constant kernel, parameterized with an initial value of 1.0 and bounds ranging from 1 × 10⁻³ to 1 × 10³, provides a global scaling factor that determines the overall output variance of the Gaussian process while enabling adaptation to different scales of corrosion rate measurements.
The RBF kernel, configured with a length scale of 1.0 and bounds between 1 × 10⁻² and 1 × 10², captures smooth, non-linear relationships between input features and corrosion rate through its characteristic exponential decay function. This kernel choice is particularly appropriate for corrosion modeling because it assumes that similar material and environmental conditions should produce similar corrosion rates, with the influence decreasing exponentially with distance in the feature space.
The White noise kernel component, initialized with a noise level of 1 × 10⁻³ and bounded between 1 × 10⁻⁵ and 1 × 101, serves a dual purpose: accounting for measurement uncertainties and inherent variability in experimental corrosion data, and providing numerical stability during matrix inversion operations required for Gaussian process inference.
Algorithm A1: Gaussian Process Regression
Input = Training features X_train, targets y_train, test features X_test, targets y_test
Output = Trained model, predictions, uncertainty estimates, performance metrics
1: procedure GPR_Corrosion(X_train, y_train, X_test, y_test)
2:   K_const ← ConstantKernel(1.0, bounds=(1 × 10⁻³, 1 × 10³))
3:   K_rbf  ← RBF(length_scale=1.0, bounds=(1 × 10⁻², 1 × 10²))
4:   K_white ← WhiteKernel(noise_level=1 × 10⁻³, bounds=(1 × 10⁻⁵, 1 × 101))
5:   K    ← K_const × K_rbf + K_white
6:   M   ← GaussianProcessRegressor(K, n_restarts_optimizer=10, α=1e-10, normalize_y=true)
7:   M.fit(X_train, y_train)
8:   ŷ_train, σ_train ← M.predict(X_train, return_std=true)
9:   ŷ_test, σ_test    ← M.predict(X_test, return_std=true)
10:    for each set s ∈ {train, test} do
11:      y_true ← y_s
12:      y_pred ← ŷ_s
13:      R2_s  ← calculate_r2(y_true, y_pred)
14:      RMSE_s  ← √(mean((y_true - y_pred)2))
15:      MAE_s    ← mean(|y_true - y_pred|)
16:      MAPE_s  ← mean(|y_true - y_pred|/|y_true|)
17:      MSE_s     ← mean((y_true - y_pred)2)
18:    end for
19:    return M, ŷ_train, ŷ_test, σ_train, σ_test, metrics
20: end procedure
The baseline model employs manual hyperparameter configuration with n_restarts_optimizer = 10 for robust optimization through multiple random initializations during marginal likelihood maximization. The alpha parameter (1 × 10⁻¹⁰) provides Tikhonov regularization for numerical stability while maintaining interpolation accuracy.
Target normalization (normalize_y = True) standardizes corrosion rate values to zero mean and unit variance before training, ensuring numerical stability across the wide range of corrosion rate values spanning several orders of magnitude. The multiplicative structure between Constant and RBF kernels enables learning both output scale and characteristic length scales, while the additive White kernel maintains parameter independence. Random seed control (random_state = 42) ensures deterministic behavior for exact result replication.

Appendix A.2. Expert Knowledge GPR Implementation

The Expert Knowledge GPR model represents a significant advancement over the baseline approach by incorporating specialized understanding of corrosion mechanisms and electrochemical processes into the ML framework, as demonstrated in Algorithm A2. This domain-driven approach addresses fundamental limitations of traditional ML methods, which treat all features as equally important and fail to capture the hierarchical nature of corrosion mechanisms.
  • Feature Classification and Domain Integration
The integration of expert knowledge begins with systematic categorization of input features based on their established roles in corrosion science. Primary features (ER, CP, WaterC, Porosity, pH) are identified as parameters directly influencing fundamental electrochemical processes governing corrosion kinetics, exhibiting strong theoretical foundations with ER providing direct measurement of charge transfer resistance, CP indicating thermodynamic favorability, and pH controlling passive film stability and aggressive species activity [46].
Algorithm A2: Expert Knowledge GPR
Input = Training features X_train, targets y_train, test features X_test, targets y_test, transform functions, scaler
Output = Model ensemble, predictions, performance metrics, model results
1: procedure ExpertKnowledgeGPR(X_train, y_train, X_test, y_test, transform, inverse_transform, scaler)
2:   important_features ← ["ER", "CP", "WaterC", "Porosity", "pH"]
3:   secondary_features ← [f ∈ X_train.columns | f ∉ important_features]
4:   X_train_scaled ← scaler.transform(X_train)
5:   X_test_scaled ← scaler.transform(X_test)
6:   y_train_transformed ← transform(y_train)
7:   primary_indices ← get_indices(important_features, X_train.columns)
8:   secondary_indices ← get_indices(secondary_features, X_train.columns)
9:   X_train_primary ← X_train_scaled[:, primary_indices]
10:    X_train_secondary ← X_train_scaled[:, secondary_indices]
11:    X_test_primary ← X_test_scaled[:, primary_indices]
12:    X_test_secondary ← X_test_scaled[:, secondary_indices]
13:    K_primary_matern ← Matern(length_scale=[1.0] × len(primary_indices), nu=1.5,
              length_scale_bounds=(1 × 10⁻³, 1 × 10²))
14:    K_primary_white ← WhiteKernel(noise_level=1 × 10⁻⁵, noise_level_bounds=(1 × 10⁻⁸, 1 × 10⁻¹))
15:    primary_kernel ← K_primary_matern + K_primary_white
16:    K_secondary_rbf ← RBF(length_scale=[1.0] × len(secondary_indices), length_scale_bounds=(1 × 10⁻³, 1 × 10²))
17:    K_secondary_white ← WhiteKernel(noise_level=1 × 10⁻⁵, noise_level_bounds=(1 × 10⁻⁸, 1 × 10⁻¹))
18:    secondary_kernel ← K_secondary_rbf + K_secondary_white
19:    primary_model ← optimize_hyperparameters(GPR(primary_kernel), X_train_primary, y_train_transformed,
             n_iter=20)
20:    secondary_model ← optimize_hyperparameters(GPR(secondary_kernel), X_train_secondary,
               y_train_transformed, n_iter=20)
21:    y_train_pred_primary ← primary_model.predict(X_train_primary)
22:    y_train_pred_secondary ← secondary_model.predict(X_train_secondary)
23:    y_train_pred_combined ← 0.8 × y_train_pred_primary + 0.2 × y_train_pred_secondary
24:    y_train_pred ← inverse_transform(y_train_pred_combined)
25:    y_test_pred_primary ← primary_model.predict(X_test_primary)
26:    y_test_pred_secondary ← secondary_model.predict(X_test_secondary)
27:    y_test_pred_combined ← 0.8 × y_test_pred_primary + 0.2 × y_test_pred_secondary
28:    y_test_pred ← inverse_transform(y_test_pred_combined)
29:    train_metrics ← evaluate_model(y_train, y_train_pred)
30:    test_metrics ← evaluate_model(y_test, y_test_pred)
31:    results ← create_results_dataframe(train_metrics, test_metrics)
32:    raw_metrics ← {train_r2: train_metrics.R2, test_r2: test_metrics.R2, train_rmse: train_metrics.RMSE, test_rmse:
             test_metrics.RMSE}
33:    return {model_name: ‘Expert Knowledge GPR’, y_train_pred: y_train_pred, y_test_pred: y_test_pred, results:
             results, raw_metrics: raw_metrics}
34:    end procedure
Secondary features encompass the remaining parameters, including cement composition variables (Cement, GGBS, FA, SF), mixture design parameters (W/B, ICC, FCC), and environmental conditions (RH, DoS, [Cl]/[OH]), which contribute to corrosion behavior through indirect mechanisms or long-term microstructural evolution processes. This hierarchical treatment enables the model to allocate computational resources more effectively, applying sophisticated kernel structures where they provide the greatest benefit while maintaining computational efficiency for less critical features.
  • Dual-Kernel Design
The architecture implements separate Gaussian process models for primary and secondary features before combining predictions through a weighted ensemble approach, representing the core innovation of the Expert Knowledge GPR. The primary feature model employs a Matérn kernel with ν = 1.5, providing flexibility to capture potentially discontinuous derivatives characteristic of electrochemical processes while maintaining sufficient smoothness for reliable interpolation. The kernel is configured with feature-specific length scales and bounds ranging from 1 × 10⁻³ to 1 × 10², enabling automatic relevance determination within the primary feature subset.
The secondary feature model utilizes an RBF kernel structure assuming smooth, infinitely differentiable relationships between inputs and outputs, reflecting the expectation that secondary features influence corrosion through gradual microstructural changes or environmental modifications. Both kernels incorporate WhiteKernel components with noise levels of 1 × 10⁻⁵ and bounds from 1 × 10⁻⁸ to 1 × 10⁻¹, providing appropriate regularization while maintaining model flexibility.
  • Optimization and Ensemble Strategy
Advanced Bayesian optimization techniques systematically explore hyperparameter spaces for both primary and secondary feature models, recognizing that optimal kernel parameters may differ significantly between mechanistically distinct feature subsets. The optimization framework implements sophisticated acquisition functions that balance exploration and exploitation, ensuring efficient convergence through intelligent search strategies. Both optimization procedures incorporate 20 iterations of Bayesian search with cross-validation scoring, providing robust parameter estimates while maintaining computational tractability.
The weighted ensemble strategy provides a principled method for combining predictions from different feature subsets while maintaining probabilistic uncertainty quantification. The ensemble assigns 80% weight to primary feature predictions and 20% weight to secondary features, based on domain expertise regarding relative parameter importance. This approach addresses feature importance imbalance commonly encountered in corrosion datasets while ensuring appropriate prioritization of mechanistically relevant features without completely dismissing secondary parameters that may contain valuable complementary information.
  • Technical Implementation and Computational Efficiency
The dual-kernel approach reduces computational burden through feature space partitioning, with the primary model operating on a 5-dimensional feature space while the secondary model handles the remaining 10 dimensions, resulting in improved scaling properties compared to a single 15-dimensional model. The algorithm complexity scales as O(n3) for each individual model, but effective computational burden is reduced through this partitioning strategy. Memory requirements are optimized through separate covariance matrix storage for each model, enabling parallel processing and reducing peak memory consumption during training and inference phases.
The implementation incorporates sophisticated numerical stability measures to handle potentially ill-conditioned covariance matrices, with carefully tuned regularization through WhiteKernel components and alpha parameters. The ensemble prediction mechanism utilizes vectorized operations for rapid evaluation during real-time prediction scenarios, while parallel processing capabilities enable simultaneous optimization of both models, reducing total training time while ensuring thorough exploration of each model’s parameter space.

Appendix A.3. GPR-ARD Implementation

The ARD implementation employs a composite kernel architecture that enables feature-specific length scale learning, as demonstrated in Algorithm A3. The ARD kernel formulation consists of a Constant kernel multiplied by an RBF kernel with individual length scale parameters for each of the 15 input features, supplemented by a White noise kernel for regularization. The Constant kernel component, parameterized with bounds ranging from 1 × 10⁻² to 1 × 10², provides global output variance scaling while maintaining numerical stability during optimization.
Algorithm A3: GPR-ARD
Input = Training features X_train, targets y_train, test features X_test, targets y_test, transform functions, scaler
Output = Trained ARD model, predictions, feature importance rankings, performance metrics
1: procedure GPR_ARD(X_train, y_train, X_test, y_test, transform, inverse_transform, scaler)
2:   X_train_scaled ← scaler.transform(X_train)
3:   X_test_scaled ← scaler.transform(X_test)
4:   y_train_transformed ← transform(y_train)
5:   n_features ← X_train_scaled.shape[1]
6:   K_const ← ConstantKernel(1.0, bounds=(1 × 10⁻², 1 × 10²))
7:   K_rbf ← RBF(length_scale = ones(n_features), bounds = (1 × 10⁻³, 1 × 10³))
8:   K_white ← WhiteKernel(noise_level = 1 × 10⁻⁵, bounds = (1 × 10⁻⁸, 1 × 10⁻¹))
9:   ard_kernel ← K_const × K_rbf + K_white
10:    gpr_ard ← GaussianProcessRegressor(kernel = ard_kernel, normalize_y = True, n_restarts_optimizer = 25,
          random_state = 42)
11:    gpr_ard.fit(X_train_scaled, y_train_transformed)
12:    length_scales ← gpr_ard.kernel_.k1.k2.length_scale
13:    importance_scores ← 1.0/length_scales
14:    normalized_importance ← importance_scores/sum(importance_scores)
15:    y_train_pred_transformed ← gpr_ard.predict(X_train_scaled)
16:    y_test_pred_transformed ← gpr_ard.predict(X_test_scaled)
17:    y_train_pred ← inverse_transform(y_train_pred_transformed)
18:    y_test_pred ← inverse_transform(y_test_pred_transformed)
19:    feature_importance ← create_dataframe(features, length_scales, normalized_importance)
20:    metrics ← evaluate_model(y_train, y_train_pred, y_test, y_test_pred)
21:    return gpr_ard, y_train_pred, y_test_pred, feature_importance, metrics
22: end procedure
The core innovation lies in the RBF kernel configuration, which assigns independent length scale parameters to each input feature rather than using a single shared length scale. This per-feature parameterization enables automatic learning of relative variable importance through individual length scale optimization during training. Features with smaller optimized length scales contribute more significantly to the covariance function, indicating higher relevance for corrosion rate prediction, while features with larger length scales exhibit diminished predictive influence. Length scale bounds from 1 × 10⁻³ to 1 × 10³ provide sufficient optimization flexibility while preventing numerical instabilities.
Feature importance quantification is achieved through systematic analysis of optimized length scale parameters following model training. Importance scores are computed as the inverse of learned length scales, reflecting the fundamental relationship between covariance kernel parameterization and feature relevance. The raw importance scores are subsequently normalized to unity for direct comparison and interpretable analysis. In the corrosion domain, features with small length scales typically correspond to parameters directly controlling electrochemical kinetics, such as ER and CP, while larger length scales often represent background conditions or slowly varying material properties.
  • Implementation and Optimization
The implementation employs 25 random restarts during hyperparameter optimization to ensure robust exploration of the high-dimensional parameter space and reliable identification of global optima. This extensive search strategy is essential for ARD models due to increased parameter space complexity compared to traditional GPR formulations. The algorithm complexity scales as O(n3m) where n represents training samples and m denotes optimization restarts, with efficient memory management strategies accommodating multiple large covariance matrices during optimization.
The implementation employs robust matrix decomposition techniques and iterative solvers to handle potentially ill-conditioned covariance matrices arising during length scale optimization, particularly when features exhibit vastly different relevance levels. Comprehensive diagnostic capabilities monitor optimization progress and detect potential convergence failures, ensuring reliable importance ranking assessment while incorporating numerical safeguards against potential instabilities arising from extreme length scale values.
  • Advanced Feature Analysis Framework
The GPR-ARD implementation incorporates comprehensive visualization and ranking capabilities that facilitate deep understanding of feature relationships and importance hierarchies. The advanced feature ranking system categorizes input variables into distinct groups based on their mechanistic roles in corrosion processes, enabling systematic analysis of importance patterns within each group and identification of unexpected relationships that may reveal novel insights into corrosion behavior.
The visualization framework generates multiple complementary representations, including horizontal bar charts with importance scores, category-wise pie charts showing relative group contributions, and top-feature highlights emphasizing critical parameters. The integration of automatic relevance determination with corrosion domain knowledge creates a hybrid approach combining data-driven learning objectivity with scientific interpretability, eliminating manual feature selection requirements that often introduce subjective bias while providing a principled probabilistic framework for understanding parameter relevance in corrosion prediction.

Appendix A.4. GPR-OptCorrosion Implementation

The OptCorrosion model implements a novel four-component composite kernel architecture that differs fundamentally from existing multi-kernel approaches in materials science through three key innovations: (1) Mechanistic specialization—each kernel component (RBF, RationalQuadratic, Matérn, DotProduct) is specifically assigned to model distinct corrosion mechanisms (global electrochemical trends, multi-scale variations, local irregularities, and linear thermodynamic effects, respectively), whereas existing approaches typically combine kernels without mechanism-specific assignments; (2) Configuration-based optimization employs systematic evaluation of six pre-defined parameter combinations, each calibrated to represent distinct corrosion mechanisms, contrasting with conventional approaches that optimize parameters without consideration of underlying physical processes; (3) Corrosion-domain calibration—kernel parameters are bounded and initialized based on established electrochemical length scales and time constants specific to steel corrosion in concrete, as demonstrated in Algorithm A4.
Algorithm A4: GPR-OptCorrosion
Input = Training features X_train, targets y_train, test features X_test, targets y_test, transform functions, scaler
Output = Best trained model, predictions, performance metrics, optimal configuration
1: procedure GPR_OptCorrosion(X_train, y_train, X_test, y_test, transform, inverse_transform, scaler)
2:  X_train_scaled ← scaler.transform(X_train)
3:  X_test_scaled ← scaler.transform(X_test)
4:  y_train_transformed ← transform(y_train)
5:  n_features ← X_train_scaled.shape[1]
6:  function create_corrosion_kernel(params)
7:       rbf_length_scale ← ones(n_features) × params.rbf_length_scale_init
8:       K_const ← ConstantKernel(1.0)
9:       K_rbf ← RBF(length_scale=rbf_length_scale, bounds=(1 × 10⁻³, 1 × 10³))
10:     K_rq ← RationalQuadratic(length_scale=params.rq_length_scale, alpha=params.rq_alpha,
11:           length_scale_bounds=(1 × 10⁻³, 1 × 10³), alpha_bounds=(1 × 10⁻², 2.0))
12:     K_matern ← Matern(length_scale=params.matern_length_scale, nu=params.matern_nu,
13:           length_scale_bounds=(1 × 10⁻³, 1 × 10³))
14:     K_dot ← DotProduct(sigma_0=params.dot_sigma0, sigma_0_bounds=(1 × 10⁻³, 1 × 10³))
15:     K_white ← WhiteKernel(noise_level=params.noise_level, noise_level_bounds=(1 × 10⁻¹⁰, 1 × 10⁻²))
16:     return K_const × (K_rbf + K_rq + K_matern + K_dot) + K_white
17:   end function
18:   configs ← [
19:     {rbf_length_scale_init=1.0, rq_length_scale=1.0, rq_alpha=0.5, matern_length_scale=1.0, matern_nu=1.5,
           dot_sigma0=1.0, noise_level=1 × 10⁻⁵},
20:     {rbf_length_scale_init=2.0, rq_length_scale=2.0, rq_alpha=0.5, matern_length_scale=2.0, matern_nu=2.5,
           dot_sigma0=1.0, noise_level=1 × 10⁻⁵},
21:     {rbf_length_scale_init=1.0, rq_length_scale=1.0, rq_alpha=0.5, matern_length_scale=1.0, matern_nu=0.5,
           dot_sigma0=1.0, noise_level=1 × 10⁻⁵},
22:     {rbf_length_scale_init=1.0, rq_length_scale=1.0, rq_alpha=1.5, matern_length_scale=1.0, matern_nu=1.5,
           dot_sigma0=1.0, noise_level=1 × 10⁻⁵},
23:     {rbf_length_scale_init=1.0, rq_length_scale=1.0, rq_alpha=0.5, matern_length_scale=1.0, matern_nu=1.5,
           dot_sigma0=3.0, noise_level=1 × 10⁻⁵},
24:     {rbf_length_scale_init=0.8, rq_length_scale=1.2, rq_alpha=0.8, matern_length_scale=0.9, matern_nu=1.5,
           dot_sigma0=2.0, noise_level=1 × 10⁻⁶}
25:   ]
26:   best_model ← null, best_test_r2 ← –∞, best_config ← null
27:   best_train_pred ← null, best_test_pred ← null
28:   for each config in configs do
29:     try
30:       kernel ← create_corrosion_kernel(config)
31:       model ← GaussianProcessRegressor(kernel=kernel, normalize_y=False, n_restarts_optimizer=10,
            random_state=42)
32:       model.fit(X_train_scaled, y_train_transformed)
33:       y_train_pred_transformed ← model.predict(X_train_scaled)
34:       y_test_pred_transformed ← model.predict(X_test_scaled)
35:       y_train_pred ← inverse_transform(y_train_pred_transformed)
36:       y_test_pred ← inverse_transform(y_test_pred_transformed)
37:       test_r2 ← calculate_r2(y_test, y_test_pred)
38:       if test_r2 > best_test_r2 then
39:         best_model ← model, best_test_r2 ← test_r2
40:         best_config ← config
41:         best_train_pred ← y_train_pred, best_test_pred ← y_test_pred
42:       end if
43:     catch exception
44:       continue to next config
45:     end try
46:   end for
47:   metrics ← evaluate_model(y_train, best_train_pred, y_test, best_test_pred)
48:   return best_model, best_train_pred, best_test_pred, metrics, best_config
49: end procedure
This architecture addresses limitations identified across multiple corrosion prediction studies. Current multi-kernel methods suffer from three key deficiencies: (1) Lack of mechanistic grounding—as noted by Coelho et al. [14], ML methods in corrosion are often treated as “black boxes” without analyzing influencing factors on corrosion mechanisms; (2) Generic parameter optimization—studies by Chou et al. [17] and Wang et al. [15] demonstrate that existing approaches use standard optimization without domain-specific constraints; (3) Single-scale modeling limitations—research by Yu et al. [4] and Stefanoni et al. [5] emphasizes that corrosion operates across multiple spatial and temporal scales requiring specialized treatment.
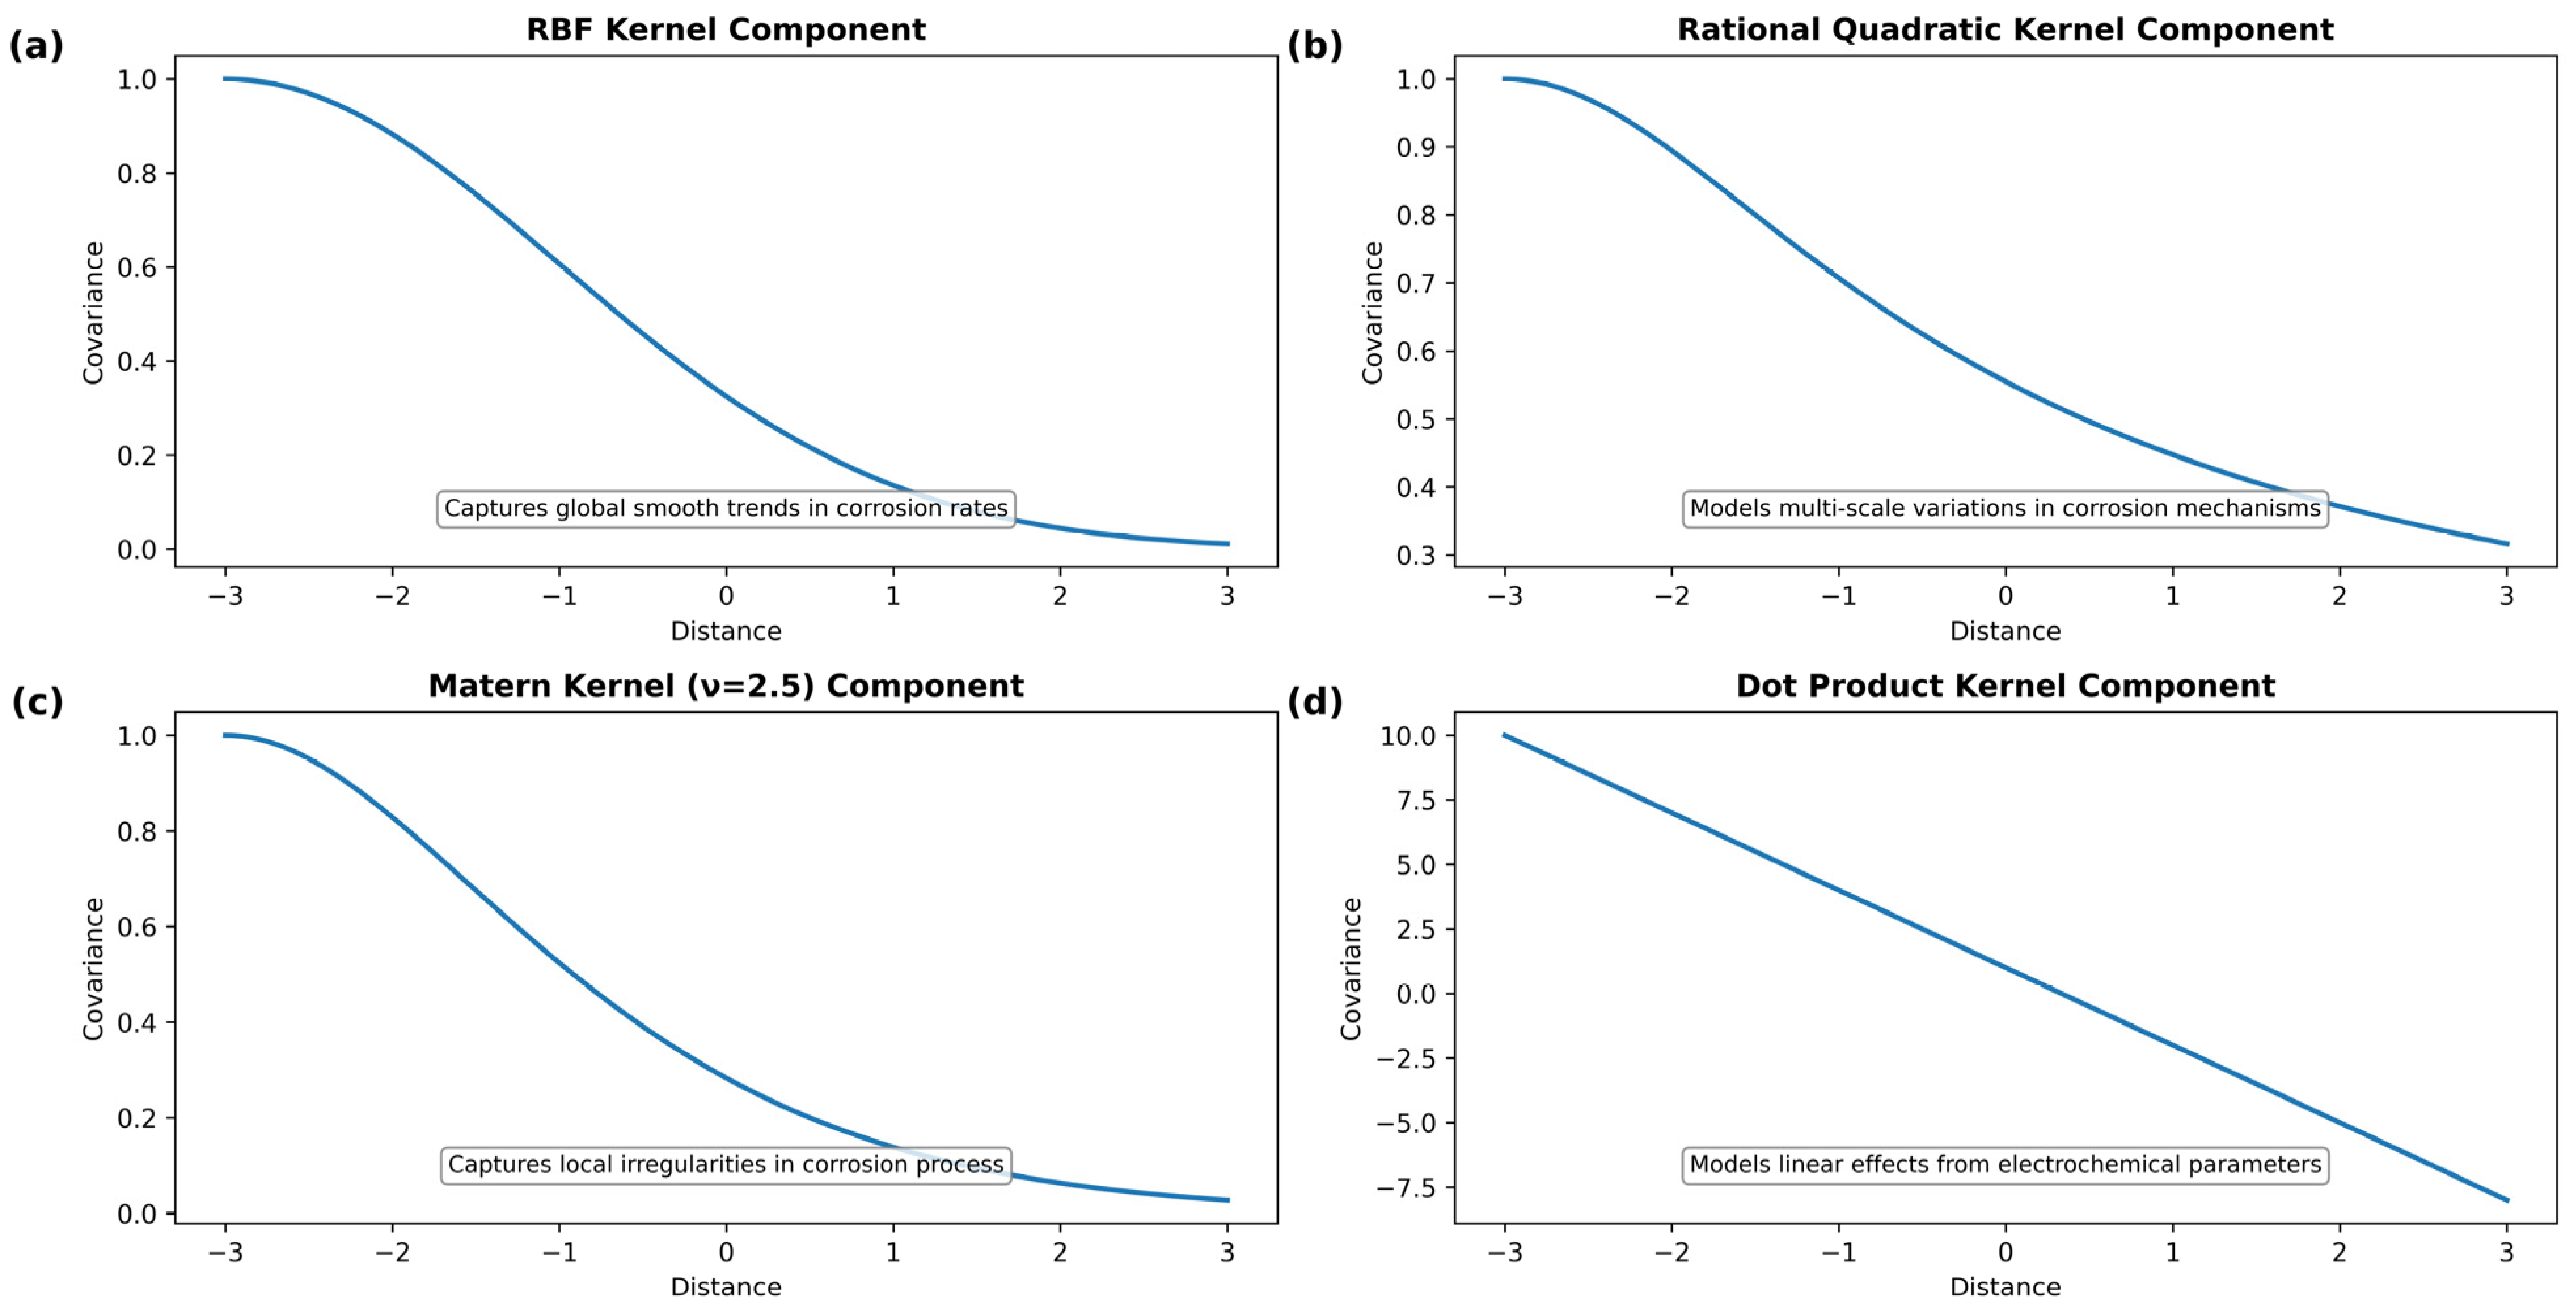
  • Composite Kernel Design
The design rationale stems from fundamental understanding that corrosion phenomena operate across multiple spatial and temporal scales, exhibiting complex interactions between global electrochemical trends, localized material heterogeneities, and linear thermodynamic relationships. Unlike conventional GPR approaches that rely on single-kernel formulations, the OptCorrosion framework recognizes that no single covariance function can adequately capture the full spectrum of corrosion mechanisms simultaneously.
The composite kernel design combines four specialized components informed by corrosion mechanisms documented in the literature:
  • RBF kernels model smooth, diffusion-controlled electrochemical processes for continuous relationships between environmental parameters and corrosion rates;
  • RationalQuadratic kernels capture multi-scale variations from atomic-level reactions to macroscopic transport phenomena inherent in concrete systems;
  • Matérn kernels provide flexibility for modeling varying degrees of smoothness, with parameters ranging from ν = 0.5 for rough processes to ν = 2.5 for smoother variations [5,8], representing localized irregularities and threshold effects in corrosion initiation;
  • DotProduct kernels encode linear thermodynamic relationships between driving forces and corrosion kinetics, capturing direct proportionality effects from fundamental thermodynamic relationships.
  • Configuration-Based Optimization Strategy
The model employs six distinct configurations spanning different hyperparameter space regions, each designed to emphasize different aspects of the composite kernel architecture. This structured exploration addresses the fundamental challenge of high-dimensional hyperparameter optimization by providing structured exploration of the parameter space while maintaining computational tractability. The configuration set includes parameter combinations ranging from conservative settings that emphasize stability and generalization to aggressive configurations that prioritize fitting complex patterns in the training data.
Each configuration is evaluated independently through complete model training and testing cycles, with the optimal configuration selected based on test set performance to ensure robust generalization capability. The optimization strategy incorporates sophisticated error handling and robustness measures, including try-catch mechanisms that gracefully handle potential numerical instabilities or convergence failures that may occur with specific parameter combinations. Unlike traditional random search or grid search methods, the configuration-based approach leverages domain expertise to define meaningful parameter combinations that correspond to different physical scenarios, ensuring that the optimization process explores scientifically relevant regions of the hyperparameter space.
  • Implementation and Computational Considerations
The implementation employs efficient matrix decomposition techniques and parallel processing capabilities to handle the computational complexity of multi-kernel optimization (O(n3m)), with sophisticated memory management and numerical stability measures ensuring robust performance. The six-configuration evaluation pipeline incorporates advanced parallel processing capabilities that enable simultaneous evaluation of multiple parameter combinations across available CPU cores.
The implementation includes sophisticated load balancing algorithms that ensure efficient resource utilization while preventing system overload during intensive optimization periods. Memory allocation strategies are carefully designed to prevent excessive memory usage during parallel configuration evaluation, with dynamic memory management that adapts to available system resources. Numerical stability considerations are paramount given the potential for ill-conditioned covariance matrices that can arise from extreme parameter combinations or challenging dataset characteristics. The implementation incorporates multiple levels of regularization, including adaptive diagonal loading, iterative refinement procedures, and fallback algorithms that ensure reliable matrix inversion operations across all kernel configurations.
  • Advanced Analysis Framework
The GPR-OptCorrosion implementation includes a comprehensive kernel analysis framework that provides deep insights into the learned kernel structure and its relationship to underlying corrosion mechanisms. This framework automatically generates detailed visualizations and statistical analyses of kernel parameter evolution across different configurations, enabling researchers to understand how different mechanistic components contribute to overall model performance. The analysis includes parameter sensitivity studies that reveal which kernel components are most critical for accurate prediction in specific corrosion scenarios.
The framework implements sophisticated diagnostic tools that assess the relative contributions of different kernel components to the overall covariance structure, enabling identification of the dominant physical mechanisms in specific corrosion systems. Advanced visualization capabilities incorporate publication-quality graphics with carefully designed color schemes and statistical significance indicators, ensuring that the complex multi-kernel analysis results are presented in an accessible and interpretable format for both technical specialists and broader research communities. Production deployment considerations include comprehensive validation frameworks, extensive testing capabilities, and automated monitoring systems that ensure reliable operation in critical industrial applications where accurate corrosion prediction is essential for safety and economic performance.

Appendix B

The systematic comparison presented in Table A1 demonstrates the methodological evolution required to achieve state-of-the-art performance in corrosion rate prediction. Each variant addresses specific modeling challenges identified through iterative development, with architectural choices motivated by both computational efficiency considerations and the multi-scale physics governing corrosion processes in cementitious materials. The framework establishes clear relationships between modeling complexity, predictive accuracy, and practical implementation requirements essential for real-world corrosion monitoring applications.
Table A1. Comparative Overview of GPR Model Architectures and Key Characteristics. The progression from baseline to advanced variants demonstrates increasing sophistication in kernel design and optimization strategies.
ModelKernelParameter TuningTransformationFeature EngineeringUncertainty Quantification
Baseline GPRRBF + WhiteKernelManualNoneBasicBasic
Expert Knowledge GPRMatern + RBFBayesian Optimization *Square RootExpert-guidedIntermediate
GPR-ARDARDBuilt-in optimizer †Square RootAutomaticAdvanced
GPR-OptCorrosionMulti-kernelConfig-based selection ‡Square RootComprehensiveComprehensive
Note: * = Bayesian Optimization refers to model-based probabilistic search using BayesSearchCV from scikit-optimize; † = Built-in optimizer uses the internal maximum likelihood estimation (MLE) of Gaussian Process Regressor without external search; ‡ = Config-based selection denotes evaluation over manually predefined kernel configurations without algorithmic tuning.

Appendix C

Table A2 summarizes the parameter configurations and preprocessing requirements for all baseline models employed in the comparative evaluation.
Baseline models were selected to represent diverse algorithmic families commonly employed in materials science regression tasks. SVR variants enable evaluation of both linear and non-linear kernel performance under consistent regularization frameworks. Ensemble methods (Random Forest, Gradient Boosting, XGBoost) provide comparison against different aggregation strategies, with Random Forest employing bootstrap sampling, Gradient Boosting utilizing sequential learning, and XGBoost implementing advanced regularization mechanisms.
The multi-layer perceptron architecture employs hierarchical feature learning through progressively narrowing layers, while early stopping prevents overfitting through validation-based convergence monitoring. Distance-based algorithms (SVR variants and ANN) require feature standardization to handle multi-scale corrosion parameters, while tree-based methods operate effectively on original feature scales.
All models employed identical train-test partitioning and evaluation protocols to ensure fair comparison, with hyperparameter configurations representing balanced performance across diverse scenarios rather than dataset-specific optimization.
Table A2. Baseline Model Parameters and Configurations.
ModelKey ParametersPreprocessing
SVR (RBF)C = 1.0, gamma = ‘scale’StandardScaler (X,y)
SVR (Linear)C = 1.0, kernel = ‘linear’StandardScaler (X,y)
Random Forestn_estimators = 100, random_state = 42None
ANN (MLP)hidden_layers = (100,50), max_iter = 1000, early_stopping = TrueStandardScaler (X,y)
Gradient Boostingn_estimators = 100, learning_rate = 0.1, max_depth = 3None
XGBoostn_estimators = 100, learning_rate = 0.3, max_depth = 6None
Baseline GPRComposite kernel, n_restarts = 10, alpha = 1 × 10⁻¹⁰None

References

  1. Ji, H.; Ye, H. Machine learning prediction of corrosion rate of steel in carbonated cementitious mortars. Cem. Concr. Compos. 2023, 143, 105256. [Google Scholar] [CrossRef]
  2. Taffese, W.Z.; Sistonen, E. Machine learning for durability and service-life assessment of reinforced concrete structures: Recent advances and future directions. Autom. Constr. 2017, 77, 1–14. [Google Scholar] [CrossRef]
  3. Elsener, B.; Angst, U. Corrosion of steel in concrete: New challenges. In Encyclopedia of Interfacial Chemistry; Wandelt, K., Ed.; Elsevier: Amsterdam, The Netherlands, 2018; pp. 183–191. [Google Scholar] [CrossRef]
  4. Yu, Y.; Dong, B.; Gao, W.; Sofi, A. Physics-based stochastic aging corrosion analysis assisted by machine learning. Probab. Eng. Mech. 2022, 69, 103270. [Google Scholar] [CrossRef]
  5. Stefanoni, M.; Angst, U.; Elsener, B. Corrosion rate of carbon steel in carbonated concrete—A critical review. Cem. Concr. Res. 2018, 103, 35–48. [Google Scholar] [CrossRef]
  6. Ramirez, D.E.A.; Meira, G.R.; Quattrone, M.; John, V.M. A review on reinforcement corrosion propagation in carbonated concrete–Influence of material and environmental characteristics. Cem. Concr. Compos. 2023, 140, 105085. [Google Scholar] [CrossRef]
  7. Šavija, B.; Luković, M. Carbonation of cement paste: Understanding, challenges, and opportunities. Constr. Build. Mater. 2016, 117, 285–301. [Google Scholar] [CrossRef]
  8. Cheng, L.; Maruyama, I. A prediction method for the corrosion rate of steel rebar in carbonated mortar under variable environmental conditions. J. Adv. Concr. Technol. 2023, 21, 611–630. [Google Scholar] [CrossRef]
  9. Wan, L.S.; Hirata, M.; Oyamoto, T.; Kanda, T.; Tan, K.H. Synergistic Impact of Temperature and Pore Saturation on Corrosion in Carbonated Reinforced Concrete. Case Stud. Constr. Mater. 2025, 22, e04364. [Google Scholar] [CrossRef]
  10. Yu, B.; Yang, L.; Wu, M.; Li, B. Practical model for predicting corrosion rate of steel reinforcement in concrete structures. Constr. Build. Mater. 2014, 54, 385–401. [Google Scholar] [CrossRef]
  11. Rodrigues, R.; Gaboreau, S.; Gance, J.; Ignatiadis, I.; Betelu, S. Reinforced concrete structures: A review of corrosion mechanisms and advances in electrical methods for corrosion monitoring. Constr. Build. Mater. 2021, 269, 121240. [Google Scholar] [CrossRef]
  12. Otieno, M.; Beushausen, H.; Alexander, M. Prediction of corrosion rate in reinforced concrete structures–a critical review and preliminary results. Mater. Corros. 2012, 63, 777–790. [Google Scholar] [CrossRef]
  13. Jiang, Z.; Li, S.; Fu, C.; Dong, Z.; Zhang, X.; Jin, N.; Xia, T. Macrocell corrosion of steel in concrete under carbonation, internal chloride admixing and accelerated chloride penetration conditions. Materials 2021, 14, 7691. [Google Scholar] [CrossRef]
  14. Coelho, L.B.; Zhang, D.; Van Ingelgem, Y.; Steckelmacher, D.; Nowé, A.; Terryn, H. Reviewing machine learning of corrosion prediction in a data-oriented perspective. Npj Mater. Degrad. 2022, 6, 8. [Google Scholar] [CrossRef]
  15. Wang, Z.; Sobey, A.J.; Wang, Y. Corrosion prediction for bulk carrier via data fusion of survey and experimental measurements. Mater. Des. 2021, 208, 109910. [Google Scholar] [CrossRef]
  16. Yan, L.; Diao, Y.; Gao, K. Analysis of environmental factors affecting the atmospheric corrosion rate of low-alloy steel using random forest-based models. Materials 2020, 13, 3266. [Google Scholar] [CrossRef]
  17. Chou, J.S.; Ngo, N.T.; Chong, W.K. The use of artificial intelligence combiners for modeling steel pitting risk and corrosion rate. Eng. Appl. Artif. Intell. 2017, 65, 471–483. [Google Scholar] [CrossRef]
  18. Ji, H.; Tian, Y.; Fu, C.; Ye, H. Transfer learning enables prediction of steel corrosion in concrete under natural environments. Cem. Concr. Compos. 2024, 148, 105488. [Google Scholar] [CrossRef]
  19. Tian, Z.; Kang, X.; Ji, H.; Ye, H. Quantitative relationship between microstructure of steel-concrete interface and chloride-induced corrosion rate of steel in unsaturated cementitious materials. Cem. Concr. Res. 2025, 188, 107736. [Google Scholar] [CrossRef]
  20. Hosseinnia, A.; Sichani, M.N.; Alamdari, B.E.; Aghelizadeh, P.; Teimortashlu, A. Machine learning formulation for predicting concrete carbonation depth: A sustainability analysis and optimal mixture design. Structures 2025, 76, 109036. [Google Scholar] [CrossRef]
  21. Mei, K.; He, Z.; Yi, B.; Lin, X.; Wang, J.; Wang, H.; Liu, J. Study on electrochemical characteristics of reinforced concrete corrosion under the action of carbonation and chloride. Case Stud. Constr. Mater. 2022, 17, e01351. [Google Scholar] [CrossRef]
  22. Sagar, C.; Chauhan, A.; Sharma, U.K. Synergistic effect of carbonation and cast-in-chlorides on corrosion initiation in reinforced concrete. Structures 2025, 72, 108264. [Google Scholar] [CrossRef]
  23. Ji, H.; Ye, H. Dataset on carbonation and chloride-induced steel corrosion in cementitious mortars. Data Brief. 2024, 55, 110595. [Google Scholar] [CrossRef] [PubMed]
  24. Khalaf, A.A.; Kopecskó, K. Modelling of Modulus of Elasticity of Low-Calcium-Based Geopolymer Concrete Using Regression Analysis. Adv. Mater. Sci. Eng. 2022, 2022, 4528264. [Google Scholar] [CrossRef]
  25. Biswal, U.S.; Dinakar, P. Evaluating corrosion resistance of recycled aggregate concrete integrating ground granulated blast furnace slag. Constr. Build. Mater. 2023, 370, 130676. [Google Scholar] [CrossRef]
  26. Köliö, A.; Honkanen, M.; Lahdensivu, J.; Vippola, M.; Pentti, M. Corrosion products of carbonation induced corrosion in existing reinforced concrete facades. Cem. Concr. Res. 2015, 78, 200–207. [Google Scholar] [CrossRef]
  27. De Belie, N.; Bernal, S. Closing Letter of RILEM TC 281-CCC: Carbonation of Concrete with Supplementary Cementitious Materials. RILEM Tech. Lett. 2025, 10, 22–32. [Google Scholar] [CrossRef]
  28. Guo, R.; Guo, Z.; Yao, G.; Jin, Y.; Liu, Z. Hybrid prediction model for reinforcements’ corrosion stage by multiple nondestructive electrochemical indices. J. Build. Eng. 2024, 82, 108327. [Google Scholar] [CrossRef]
  29. Keo, S.A.; De Larrard, T.; Duprat, F.; Geoffroy, S. Enhancement of predictive bayesian network model for corrosion alarm of steel reinforcement with uncertainty of NDT measurements. J. Nondestruct. Eval. 2023, 42, 51. [Google Scholar] [CrossRef]
  30. Du, Z.; Wang, P.; Chen, Z.; Cui, D.; Jin, Z.; Zhang, H. All-solid-state, long term stable, and embedded pH sensor for corrosion monitoring of concrete. J. Build. Eng. 2022, 57, 104978. [Google Scholar] [CrossRef]
  31. Cheng, L.; Maruyama, I.; Ren, Y. Novel accelerated test method for RH dependency of steel corrosion in carbonated mortar. J. Adv. Concr. Technol. 2021, 19, 207–215. [Google Scholar] [CrossRef]
  32. Tiwari, A.; Goyal, S.; Luxami, V.; Chakraborty, M.K.; Gundlapalli, P. Evaluation of inhibition efficiency of generic compounds with additional heteroatom in simulated concrete pore solution and migration potential in concrete. J. Build. Eng. 2021, 43, 102490. [Google Scholar] [CrossRef]
  33. Tiwari, A.K.; Goyal, S.; Luxami, V. Influence of corrosion inhibitors on two different concrete systems under combined chloride and carbonated environment. Structures 2023, 48, 717–735. [Google Scholar] [CrossRef]
  34. Ji, H.; Lyu, Y.; Tian, Z.; Ye, H. Assessment of corrosion probability of steel in mortars using machine learning. Reliab. Eng. Syst. Saf. 2025, 253, 110535. [Google Scholar] [CrossRef]
  35. Chang, H. Chloride binding capacity of pastes influenced by carbonation under three conditions. Cem. Concr. Compos. 2017, 84, 1–9. [Google Scholar] [CrossRef]
  36. Gopinath, R.; Alexander, M.; Beushausen, H. Single-parameter concrete carbonation model for varying environmental exposure conditions. Mater. Struct. 2025, 58, 21. [Google Scholar] [CrossRef]
  37. Tassos, C.; Sideris, K.K.; Chatzopoulos, A.; Tzanis, E.; Katsiotis, M.S. Influence of the type of cement on the durability of concrete structures exposed to various carbonation environments in Greece: A contribution to the sustainability of structures. Constr. Mater. 2023, 3, 14–35. [Google Scholar] [CrossRef]
  38. Yoon, I.S.; Chang, C.H. Effect of chloride on electrical resistivity in carbonated and non-carbonated concrete. Appl. Sci. 2020, 10, 6272. [Google Scholar] [CrossRef]
  39. Zeng, Z.; Ying, G.; Zhang, Y.; Gong, Y.; Mei, Y.; Li, X.; Li, S. Classification of failure modes, bearing capacity, and effective stiffness prediction for corroded RC columns using machine learning algorithm. J. Build. Eng. 2025, 102, 111982. [Google Scholar] [CrossRef]
  40. Jedidi, M. Carbonation of Concrete: Measurement and Repair. Civ. Eng. Archit. 2024, 12, 3664–3674. [Google Scholar] [CrossRef]
  41. Dong, W.; Huang, Y.; Lehane, B.; Ma, G. XGBoost algorithm-based prediction of concrete electrical resistivity for structural health monitoring. Autom. Constr. 2020, 114, 103155. [Google Scholar] [CrossRef]
  42. Cao, L.; Zhang, D.; Li, X.; Fan, Z.; Cao, Y. Prediction of Corrosion Rate in Carbon Dioxide Pipeline Based on KPCA–BP. J. Pipeline Syst. Eng. Pract. 2025, 16, 04025001. [Google Scholar] [CrossRef]
  43. Jabed, A.; Tusher, M.M.H.; Shuvo, M.S.I.; Imam, A. Corrosion of Steel Rebar in concrete: A review. Corros. Sci. Technol. 2023, 22, 273–286. [Google Scholar] [CrossRef]
  44. Chen, L.; Su, R.K.L. Effect of high rebar temperature during casting on corrosion in carbonated concrete. Constr. Build. Mater. 2020, 249, 118718. [Google Scholar] [CrossRef]
  45. Li, G.; Evitts, R.; Boulfiza, M. Interactive effects of moisture, chloride, and carbonation on rebar corrosion in mortar. Constr. Build. Mater. 2024, 440, 137440. [Google Scholar] [CrossRef]
  46. Poursaee, A.; Angst, U.M. Principles of corrosion of steel in concrete structures. In Corrosion of Steel in Concrete Structures, 2nd ed.; Poursaee, A., Ed.; Woodhead Publishing: Cambridge, UK, 2023; pp. 17–34. [Google Scholar] [CrossRef]
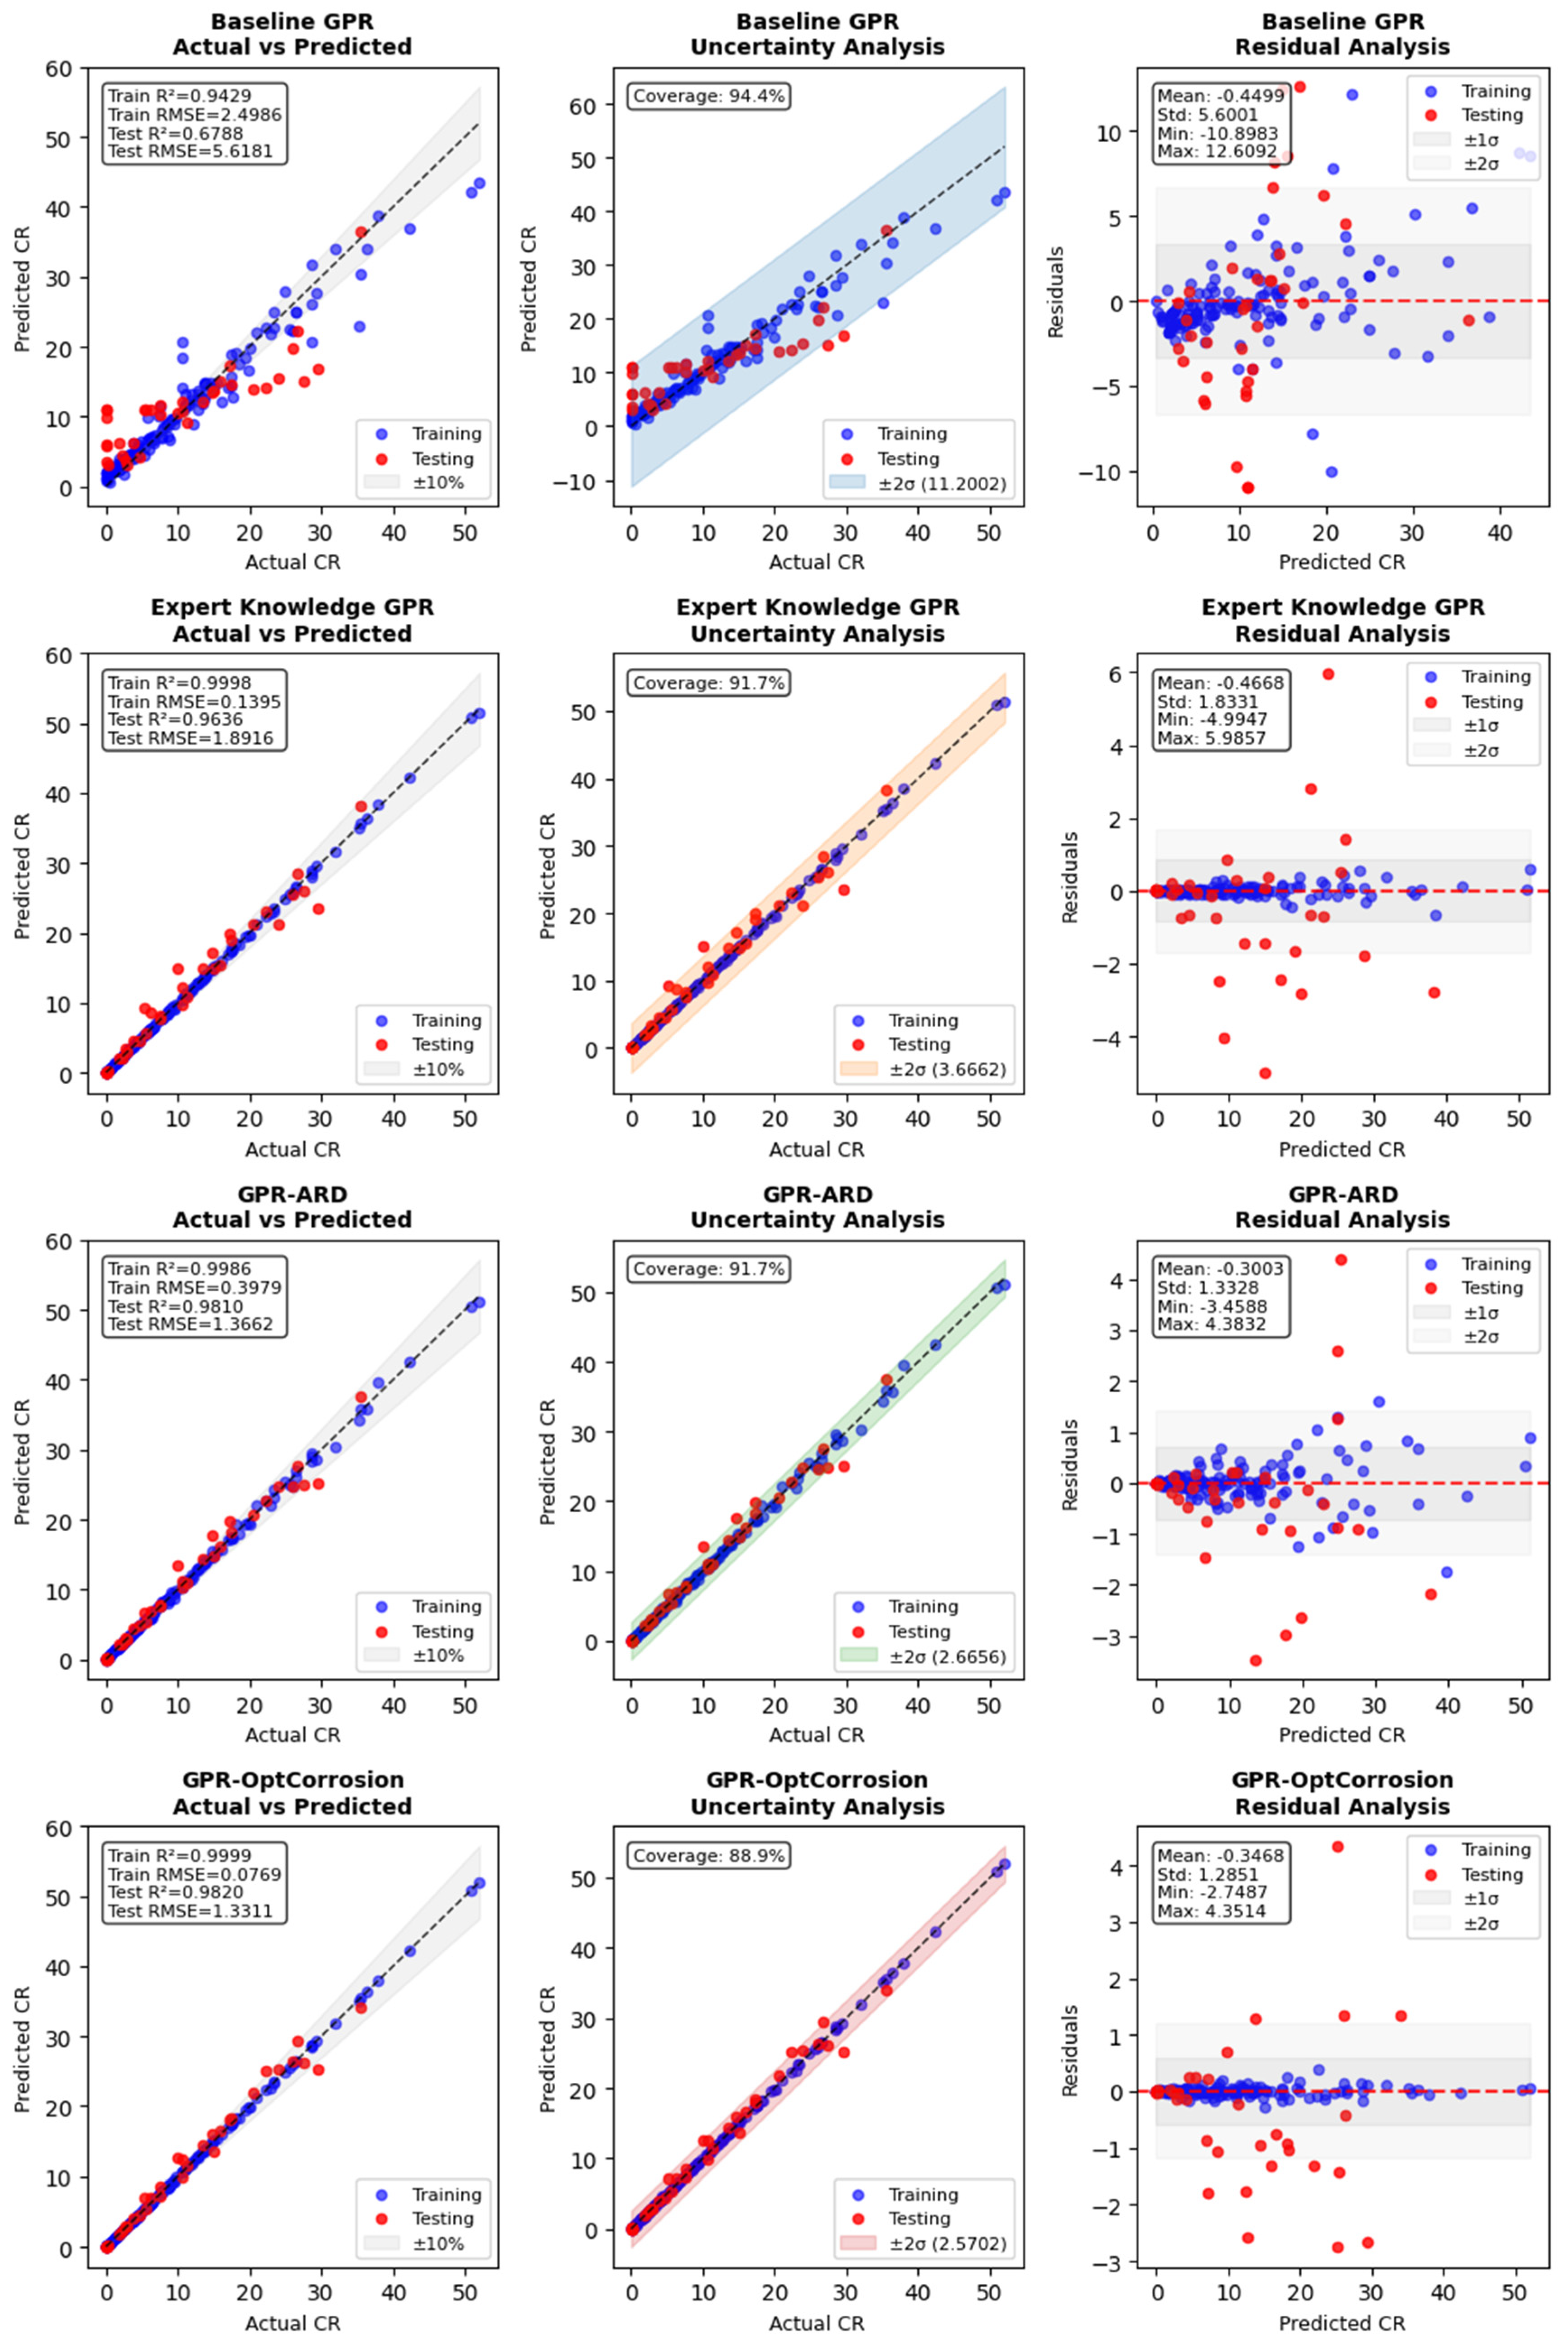
Figure 1. Schematic framework of the hybrid GPR models for corrosion rate prediction.
Buildings 15 02464 g001
Figure 2. (A) Mixture and material parameter distributions: (a) mixture parameters and (b) material parameters. Red dashed lines indicate mean values. (B). Environmental, electrochemical, and target parameter distributions: (a) environmental parameters, (b) electrochemical parameters, and (c) target variable (corrosion rate). Red solid vertical lines denote mean values, green dashed vertical lines denote median values, and blue curves represent kernel density estimation.
Buildings 15 02464 g002
Figure 3. Feature correlation matrix showing Pearson correlation coefficients between all input variables and target corrosion rate, with color intensity indicating correlation strength.
Buildings 15 02464 g003
Figure 4. (a) High-correlation variable relationships with corrosion rate: (a) scatter plots showing strong correlations (|r| ≥ 0.5) between selected parameters and target variable, revealing pronounced non-linear and heteroscedastic patterns. (b) Moderate-correlation variable relationships with corrosion rate: (b) scatter plots showing moderate to low correlations (|r| < 0.5) between mixture composition and other parameters with the target variable, demonstrating complex interaction patterns.
Buildings 15 02464 g004aBuildings 15 02464 g004b
Figure 5. Comprehensive model evaluation showing (left) prediction accuracy, (center) uncertainty quantification with coverage probability, and (right) residual analysis for all GPR variants.
Buildings 15 02464 g005
Figure 6. Learning curves for all GPR variants showing training and validation performance versus training set size. Shaded areas represent standard deviation across cross-validation folds.
Buildings 15 02464 g006
Figure 7. Hyperparameter optimization effects for Expert Knowledge GPR: (a) Primary feature model and (b) Secondary feature model. Error bars indicate standard deviation across optimization runs. Green dashed lines and red markers indicate optimal parameter values.
Buildings 15 02464 g007
Figure 8. Feature importance rankings derived from GPR-ARD automatic relevance determination. Importance scores are calculated as normalized inverse length scales, with higher values indicating greater predictive relevance.
Buildings 15 02464 g008
Figure 9. Performance comparison of GPR-OptCorrosion configurations showing training and testing R2 scores. Configuration 2 achieves optimal generalization with highest test performance (R2 = 0.9820).
Buildings 15 02464 g009
Figure 10. Kernel component functions in the GPR-OptCorrosion composite architecture: (a) RBF kernel for global trends, (b) Rational Quadratic for multi-scale variations, (c) Matérn kernel for local irregularities, and (d) Dot Product for linear effects.
Buildings 15 02464 g010
Table 1. Performance Comparison of Advanced GPR Variants and Baseline ML Models for Corrosion Rate Prediction.
ModelModel TypeDatasetR2RMSEMSEMAEMAPETime (s)Generalization Gap †
Baseline GPRBasic GPRTrain0.94292.49866.24301.59553.44030.00290.2641
Test0.67885.618131.56304.287267.86560.0020
Expert Knowledge GPRAdvancedTrain0.99980.13950.01950.08100.01100.00230.0362
GPRTest0.96361.89163.57821.18440.17870.0011
GPR-ARDAdvancedTrain0.99860.39790.15830.23760.03000.00100.0176
GPRTest0.98101.36621.86650.80630.09740.0004
GPR-OptCorrosionAdvancedTrain0.99990.07690.00590.04940.00830.00430.0179
GPRTest0.98201.33111.77180.89260.16300.0016
XGBoostEnsembleTrain0.99990.00100.00010.00070.00180.24490.1061
Test0.89383.229710.43112.01620.71850.0120
GradientEnsembleTrain0.99770.50430.25430.39510.30980.16390.1242
Boosting Test0.87353.525612.43012.35361.01370.0020
Random ForestEnsembleTrain0.98091.44532.08880.91470.81010.28990.1899
Test0.79104.531520.53493.09973.23210.0170
ANN (MLP)Neural Train0.94412.47106.10611.52441.87050.20490.1567
NetworkTest0.78754.569820.88283.07889.7160
SVR (RBF)Kernel Train0.91493.04919.29711.69202.11250.00200.0959
MethodTest0.81914.216317.77692.87784.07090.0010
SVR (Linear)LinearTrain0.80354.635121.48393.197812.30600.00800.2868
MethodTest0.51666.891947.49835.400034.84120.0010
Note: All performance metrics represent mean values across 5-fold cross-validation with standard deviations < 0.02. † Generalization Gap = R2 (Train) − R2 (Test); shown only on train rows for comparison purposes. Computational Time = Training + Prediction time.
Table 2. Statistical significance analysis of pairwise model performance differences using paired t-tests on prediction errors.
Model 1Model 2p-ValueSignificanceInterpretation
Baseline GPRExpert Knowledge GPR0.0004***Highly Significant
Baseline GPRGPR-ARD0.0002***Highly Significant
Baseline GPRGPR-OptCorrosion0.0002***Highly Significant
Expert Knowledge GPRGPR-ARD0.0256*Marginally Significant
Expert Knowledge GPRGPR-OptCorrosion0.0412*Marginally Significant
GPR-ARDGPR-OptCorrosion0.8376nsNot Significant
Note: Significance levels: *** = p < 0.001 (Highly Significant), * = p < 0.05 (Marginally Significant), ns = Not Significant (p ≥ 0.05). Statistical tests performed using paired t-tests on prediction errors.
Disclaimer/Publisher’s Note: The statements, opinions and data contained in all publications are solely those of the individual author(s) and contributor(s) and not of MDPI and/or the editor(s). MDPI and/or the editor(s) disclaim responsibility for any injury to people or property resulting from any ideas, methods, instructions or products referred to in the content.

