Article

Critical Factors Affecting Construction Labor Productivity: A Systematic Review and Meta-Analysis

1
Hubei Key Laboratory of Construction and Management in Hydropower Engineering, China Three Gorges University, Yichang 443002, China
2
The Guangdong No. 3 Water Conservancy and Hydro-Electric Engineering Board Co., Ltd., Dongguan 523710, China
3
Shanghai Investigation, Design & Research Institute Co., Ltd., Shanghai 200050, China
*
Author to whom correspondence should be addressed.
Buildings 2025, 15(14), 2463; https://doi.org/10.3390/buildings15142463
Submission received: 14 April 2025 / Revised: 18 June 2025 / Accepted: 4 July 2025 / Published: 14 July 2025
(This article belongs to the Section Construction Management, and Computers & Digitization)

Abstract

This study aims to identify and quantify the critical factors influencing construction labor productivity. A systematic review and meta-analysis of 27 empirical studies published between 2000 and 2024 were conducted in accordance with PRISMA guidelines. This study synthesizes findings from a variety of global studies and calculates the relative importance index of various factors affecting construction labor productivity. The findings indicate that 66 CFs, categorized into 12 groups, influence construction labor productivity. The results findings underscore the pivotal role of labor-related factors, particularly “worker experience and skills”, and site management factors, such as “competent supervisors” and “effective communication”. Additionally, environmental factors, such as “weather conditions”, have been demonstrated to play a significant role. The meta-analysis identified substantial regional variations and an increasing importance of factors like worker motivation and technological advancements. Moreover, in light of the evident disparities among regional influential factors, including but not limited to climate, economics, and culture, the findings of this study underscore the imperative for customized, localized management methodologies to enhance construction labor productivity, which will provide practical suggestions for project managers in the region and globally.

1. Introduction

The construction industry, as a fundamental component of the national economy, exerts a pivotal function in promoting economic growth and social development on a global scale [1]. According to a report by the United Nations Economic Commission for Europe in 2018, the construction sector accounted for an average of 6.1% of the Gross Domestic Product (GDP) of member countries [2]. With the ongoing processes of globalization and urbanization, the construction industry not only provides robust support for infrastructure development but also generates a considerable number of direct and indirect employment opportunities, thereby promoting economic diversification [3]. However, the efficient development of the construction industry is not solely dependent on capital, technology, and materials. The enhancement of construction labor productivity (CLP) has become a critical factor (CF) in the sector’s development. Improving CLP has been shown to reduce project costs, shorten construction cycles, and enhance construction quality, thereby strengthening the industry’s market competitiveness [4,5]. Thus, a comprehensive understanding of the factors influencing CLP is imperative for the optimization of project management and the enhancement of industry-wide performance.
The CLP is influenced by various factors, including materials and equipment, management practices, workforce quality, and external environmental factors [6,7]. Existing studies have primarily focused on qualitative analyses of individual factors, with limited research exploring the interactions among these factors. As construction projects increase in scale and complexity, changes in CLP result from the interplay of multiple factors, making single-factor analyses insufficient to reveal the underlying complexities. Empirical studies examine the combined effects of various factors. For instance, Durdyev and Mbachu [8] found that management control, workforce quality, financial conditions, external environment, project characteristics, and materials and equipment were significant factors affecting CLP in Malaysia. Concurrently, Vigneshwar and Shanmugapriya [9] identified labor constraints, safety and quality control, materials, equipment, site management, project work conditions, delay control, construction methods, technology, and the external environment as key factors influencing labor productivity at construction sites in India.
Although a few review papers have explored the factors influencing CLP and proposed relatively comprehensive theoretical frameworks, most of them rely on citation frequency to determine factor importance [10,11]. However, frequency-based approaches reflect how often a factor is mentioned rather than its actual impact, which may lead to misjudgments in identifying key determinants. Moreover, most existing studies remain at the qualitative level, lacking systematic quantitative analysis and empirical support. Meta-analysis, as a statistical method that synthesizes findings from multiple empirical studies, offers a robust solution to these limitations [12]. Unlike qualitative approaches, it allows for the analysis of large datasets and the calculation of standardized effect sizes, enabling researchers to compare and rank the relative influence of various factors. It also facilitates the exploration of interaction effects and underlying mechanisms, providing a more objective, rigorous, and comprehensive assessment of the factors affecting CLP.
However, most existing studies are confined to specific countries or time periods, and few have attempted to systematically compare findings across regions or temporal contexts. For example, research from Europe [13], the Middle East [14], and Southeast Asia [15] has also highlighted a range of productivity-related factors under varying regional conditions. Meta-analysis enables such comparisons through subgroup analysis, allowing researchers to examine whether the key factors influencing CLP differ systematically across different geographical regions and timeframes. This methodological extension offers a valuable opportunity to uncover how regional characteristics, institutional settings, and management cultures shape the mechanisms through which various factors affect labor productivity. As such, it holds significant theoretical and practical implications for developing more context-specific and adaptive productivity improvement strategies.
In order to address these gaps, this study follows the PRISMA (Preferred Reporting Items for Systematic Reviews and Meta-Analysis) guidelines to systematically analyze the empirical data from the existing literature. This is the first meta-analysis of the impact of CFs on CLP. The primary objective is to identify and quantify the impact of the CFs on CLP and to rank these factors based on their relative importance. In addition to deepening the understanding of the factors affecting CLP, this study reveals the commonalities and differences among various studies, particularly in terms of regional and national differences. Ultimately, this study supports practical decision-making for construction industry managers.

2. Methodology

The PRISMA Statement, developed by Page et al. [16], provides a standardized framework to improve the methodological quality of systematic reviews. The framework is composed of two sections: the systematic review and the meta-analysis. Systematic reviews offer comprehensive and replicable methods for selecting the literature and collecting and analyzing secondary data. However, many of these reviews present their results solely in the form of narrative commentary, eschewing quantitative analysis. Meta-analysis is a quantitative technique that synthesizes the results of individual empirical studies, thereby providing a more precise effect size of the results. The PRISMA statement is a set of guidelines that standardize protocols for the selection of research topics, the design of studies, the extraction of data, and the reporting of results. By establishing these guidelines, PRISMA aims to enhance the scientific rigor of studies and facilitate the comparability of research findings across different studies. This, in turn, enables readers to critically assess the findings and the validity of the methodology employed [17].

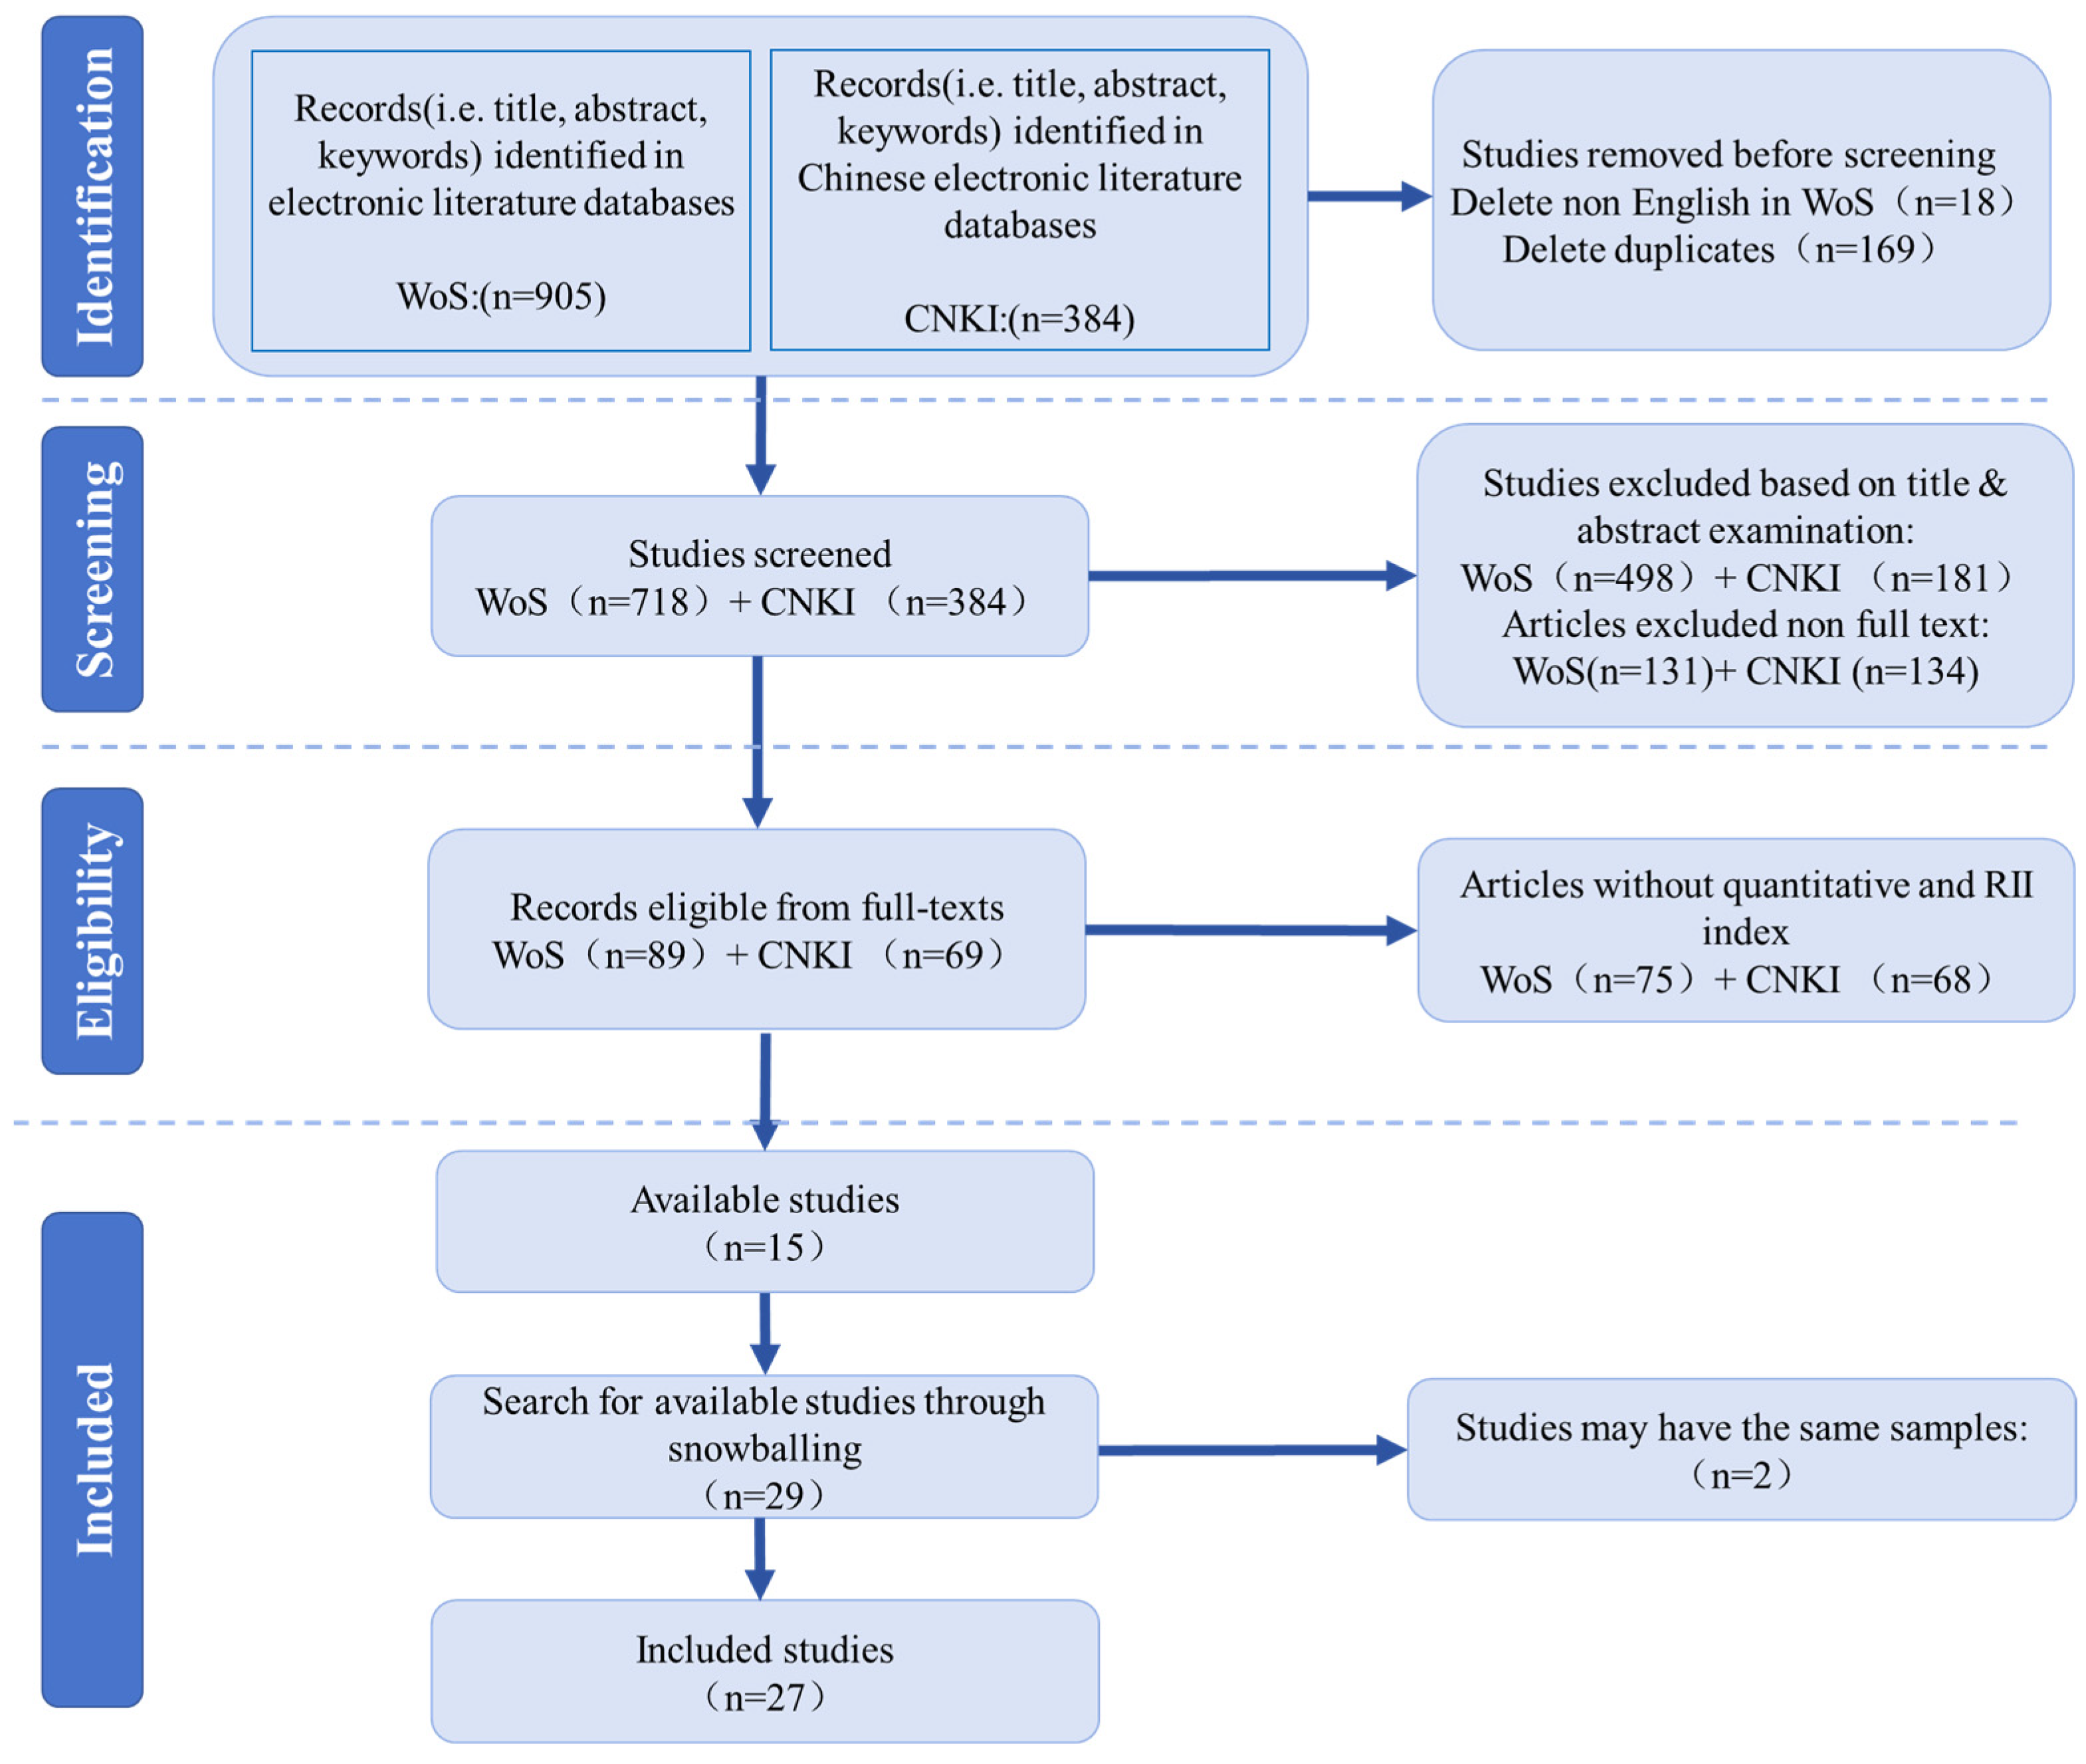
2.1. Search Strategies

The Web of Science (WoS) is a globally significant academic database that covers research outcomes across various fields, including natural sciences, social sciences, arts and humanities, engineering technologies, and others. It indexes highly influential and authoritative academic journals worldwide, which has led to its widespread recognition and utilization among scholars globally [18,19,20]. For this study, the English-language search database was designated as WoS, while CNKI was selected as the Chinese-language database for the retrieval of related research. Two search strategies were employed to comprehensively gather the literature. The initial strategy involved conducting a search using keywords. The representative keywords employed included “labor productivity” and “critical factor.” In this strategy, the searching strings were combined with Boolean operators: (critical factors OR factors affecting) AND (labor productivity OR work efficiency OR personal productivity OR worker productivity OR working efficiency) AND (construction projects OR construction industry). The focus was on papers published between 2000 and 2024. However, it is important to note that reliance on keyword searches within databases alone may be inadequate, as some studies, such as those predicting CLP, explore factors influencing it before prediction. The second search strategy employed snowballing techniques following the initial keyword search to ensure comprehensive coverage of related research. A combined approach of backward and forward snowballing was implemented based on the outcomes of the initial search. The backward snowballing phase entailed the scanning of the reference lists of identified studies to identify additional relevant research. Concurrently, forward snowballing entailed a meticulous examination of articles that cited the identified studies to uncover the further pertinent literature.

2.2. Inclusion and Exclusion Criteria

A set of specific criteria was established for the selection of studies, based on the results of a search of the English and Chinese literature. The inclusion criteria are as follows:
(1)
The primary focus of this study must pertain to labor productivity in the construction industry, with a concomitant examination of the factors that influence this productivity;
(2)
This study should involve empirical quantitative research analyzing factors impacting CLP.
This study must calculate relative importance indices (RII) for each influencing factor and report them accurately, based on a specified sample size. The calculation method for RII should adhere to Equation (1):
R I I % = W A × N × 100 %
In this equation, W represents the weight assigned by respondents to each factor; A represents the maximum weight allocated, and N represents the total number of respondents.
The exclusion criteria include three key points:
(1)
Studies that exclusively focus on the impact of a singular type of influencing factor on CLP;
(2)
Case studies that are qualitative, review-based, or retrospective in nature;
(3)
Studies for which the full-text content is unavailable;
(4)
Duplicate studies or studies with identical sample data.
To ensure the inclusion of all relevant research, no restrictions were imposed on the selection of the literature in terms of article type, country of publication, journal rank, or other criteria.

2.3. A Literature Selection

The literature search for this study was conducted in June 2024 and followed the updated PRISMA process (Figure 1). The selection of the literature was finalized through a systematic screening procedure, which was completed by September 2024. The flowchart illustrates each step from the initial search to the final selection. A total of 903 studies were retrieved from WoS and 384 from CNKI through keyword searches. Initially, 183 non-English publications from WoS were excluded, resulting in a pool of 1102 studies (718 from WoS and 384 from CNKI). Titles and abstracts were then subjected to a rigorous screening process based on a set of stringent criteria, with full-text articles accessed exclusively if they addressed factors influencing CLP or construction efficiency. Following this screening, 89 English and 69 Chinese articles were selected for full-text review. A thorough examination led to the exclusion of studies lacking quantitative research or RII. The final selection comprised 15 studies (14 from WoS and 1 from CNKI) that met the predetermined criteria. A supplementary search was conducted using the snowballing strategy, which led to the inclusion of an additional 14 studies, resulting in a total of 29 studies included in the database for this research.
All studies analyzed in this research employed questionnaire surveys for quantitative investigation of factors influencing CLP, presenting their findings through RII in percentage format, ensuring comparability of data across studies. However, a thorough examination uncovered that two distinct research groups had conducted analogous studies with identical samples, albeit exploring different research themes. In the context of meta-analysis, upholding the validity and reliability of results necessitates the utilization of samples from a single empirical study. Consequently, following extensive deliberation within the research team, a resolution was reached to amalgamate these two studies, despite their disparate focuses, due to sample overlap. A total of 27 studies were selected for meta-analysis, including 25 journal articles, 1 conference proceeding, and 1 master’s thesis, published between 2000 and 2024.

2.4. Procedures of Meta-Analysis

2.4.1. Data Collection and Coding

Following a thorough review of the pertinent literature, the subsequent phase involves the extraction and coding of data to ascertain the effect size for the references. The RII is employed as a statistical measure to assess the relative significance of drivers or factors within a given system, process, or research context. In this study, the RII is derived from the extant literature as the effect size. The data extracted from prior studies consist of the RII for each factor, all of which are coded based on independent samples within the same framework. To ensure the quality and consistency of the data extraction process, this procedure is conducted by two independent researchers, achieving an inter-rater reliability of 90%. If coding discrepancies are identified, the original text is reviewed and corrected. Furthermore, it is imperative to note that each study undergoes the coding process only once. In instances where a study encompasses multiple independent research samples, the coding procedure may be reiterated for each sample. Furthermore, factors present in a minimum of three studies are incorporated in the final selection roster. To facilitate enhanced subgroup analysis, fundamental details regarding each study, such as the author, publication year, and country, are also compiled.

2.4.2. Statistical Model

Meta-analysis statistical models are typically classified into two categories: fixed-effects models and random-effects models. The two models under consideration are founded on disparate assumptions. The fixed-effects models posit a uniform true underlying effect size across all studies, with any observed differences attributed solely to random errors. This model is contingent upon the absence of substantial heterogeneity among the studies. In contrast, the random-effects models assume variability in true effect sizes among studies, potentially stemming from diverse factors such as study designs, sample characteristics, or experimental conditions. It is widely acknowledged that multiple uncertain drivers, such as subject age, education level, and years of work experience, contribute to varying effect sizes across studies, indicating the absence of a singular true effect size [21]. The random-effects model’s enhanced compatibility with diverse research contexts justifies its broader utility in comparison to the fixed-effects model.
The random-effects model was selected for this study because it better accommodates the heterogeneous nature of the included studies. The random-effects model assigns a lower weight to each study than the fixed-effects model because it accounts for both within- and between-study variances. Study weight in the random-effects model was estimated using Equation (2):
W i * = 1 V Y i + T 2
where W i * represents the weight assigned to study i ; V Y i represents the within-study variance for study i ; T represents the between-studies variance.
The mean effect size and the variance in the random-effects model were estimated using Equations (3) and (4). All the CFs identified were required to undergo the process independently; thereby, the process was repeated multiple times for each factor.
M * = i = 1 k W i * Y i i = 1 k W i *
where M * represents the weighted mean; Y i represents the observed effect for study i .
V m * = 1 i = 1 k W i *
where V m * represents the variance of the summary effect.

2.4.3. Heterogeneity

Heterogeneity testing is essential in meta-analysis to assess whether significant variability exists among the results of the studies and to determine the extent to which these results can be meaningfully aggregated. For instance, if an influencing factor yields consistent findings across multiple studies, it suggests low heterogeneity. Conversely, substantial variation in findings implies high heterogeneity. In this study, heterogeneity was quantified using the I2 test, which represents the proportion of total observed variance that is attributable to true heterogeneity rather than random error, as shown in Equation (5) [22].
I 2 = S n 1 S × 100 %
A higher I2 value indicates that differences between studies are more likely due to true variations in study characteristics (e.g., geographical setting, methodology, or sample demographics) rather than random error. For example, if the included studies are conducted in different climatic regions, a factor such as weather conditions may exert different levels of influence on labor productivity, thereby contributing to heterogeneity. In other words, heterogeneity testing helps determine whether the differences among research findings reflect consistent results or are influenced by variations in study contexts.
When high heterogeneity is detected, further investigation is needed to identify its sources. In this study, subgroup analysis and sensitivity analysis were employed to explore potential moderators contributing to the heterogeneity. Heterogeneity is typically assessed using the following criteria [23]:
If I2 is less than 25%, there is a low degree of heterogeneity, and a fixed-effects model can be employed.
If I2 statistic falls between 25% and 75%, the presence of moderate heterogeneity is indicated. In such cases, the utilization of a random-effects model is strongly advised.
If I2 is more than 75%, there is a high degree of heterogeneity, thus necessitating the implementation of a random-effects model.

2.4.4. Subgroup Analysis

Subgroup analysis involves dividing the research sample into smaller subgroups for further analysis. It is a method of dividing studies into smaller units based on specific characteristics and assessing the impact of these subgroups on outcomes [21]. Identifying significant variances among subgroups helps clarify heterogeneity. This study proposes the classification of the research into three subgroups.
The primary criterion is the publication year, with all included studies spanning from 2003 to 2022. From 2003 to 2013, a total of seven papers were published; however, only three of the publications appeared from 2003 to 2010. A notable increase in publications occurred from 2014 to 2018, particularly evident with five papers released in 2014. Subsequently, from 2019 to 2022, the publication rate stabilized, with an annual output ranging from one to two papers. As illustrated in Figure 2, this publication trend is further delineated through the categorization of the “publication year of papers” subgroup into three distinct periods: 2003~2013, 2014~2018, and 2019~2022.
The second criterion is the type of publication. Studies published in journal articles are combined into one group, while studies published in other types of publications (such as conferences and master’s theses) are placed in another group.
The third criterion involves the categorization of studies according to global regions. The dataset includes 13 samples from Asia, 4 from Africa, 7 from the Middle East, and 2 from Western nations. Notably, Iran is classified under Asia due to its geographical proximity, as opposed to its categorization as part of the Middle East. One study did not specify its research region and was, therefore, excluded from the regional grouping.

2.4.5. Sensitivity Analysis

Sensitivity analysis is a methodological approach used to evaluate how changes in critical factors affect quantitative outcomes. In meta-analysis, it assesses the robustness and reliability of the combined effect size under varying conditions, such as differences in study characteristics, analytical methods, or data quality. By altering key conditions, researchers can examine how the combined effect size responds and compare it with the original estimate to determine the extent of influence. Common approaches include the exclusion of low-quality studies and the comparison of results across different statistical models. In this study, the former strategy is primarily adopted to explore the influence of individual studies on the overall findings.

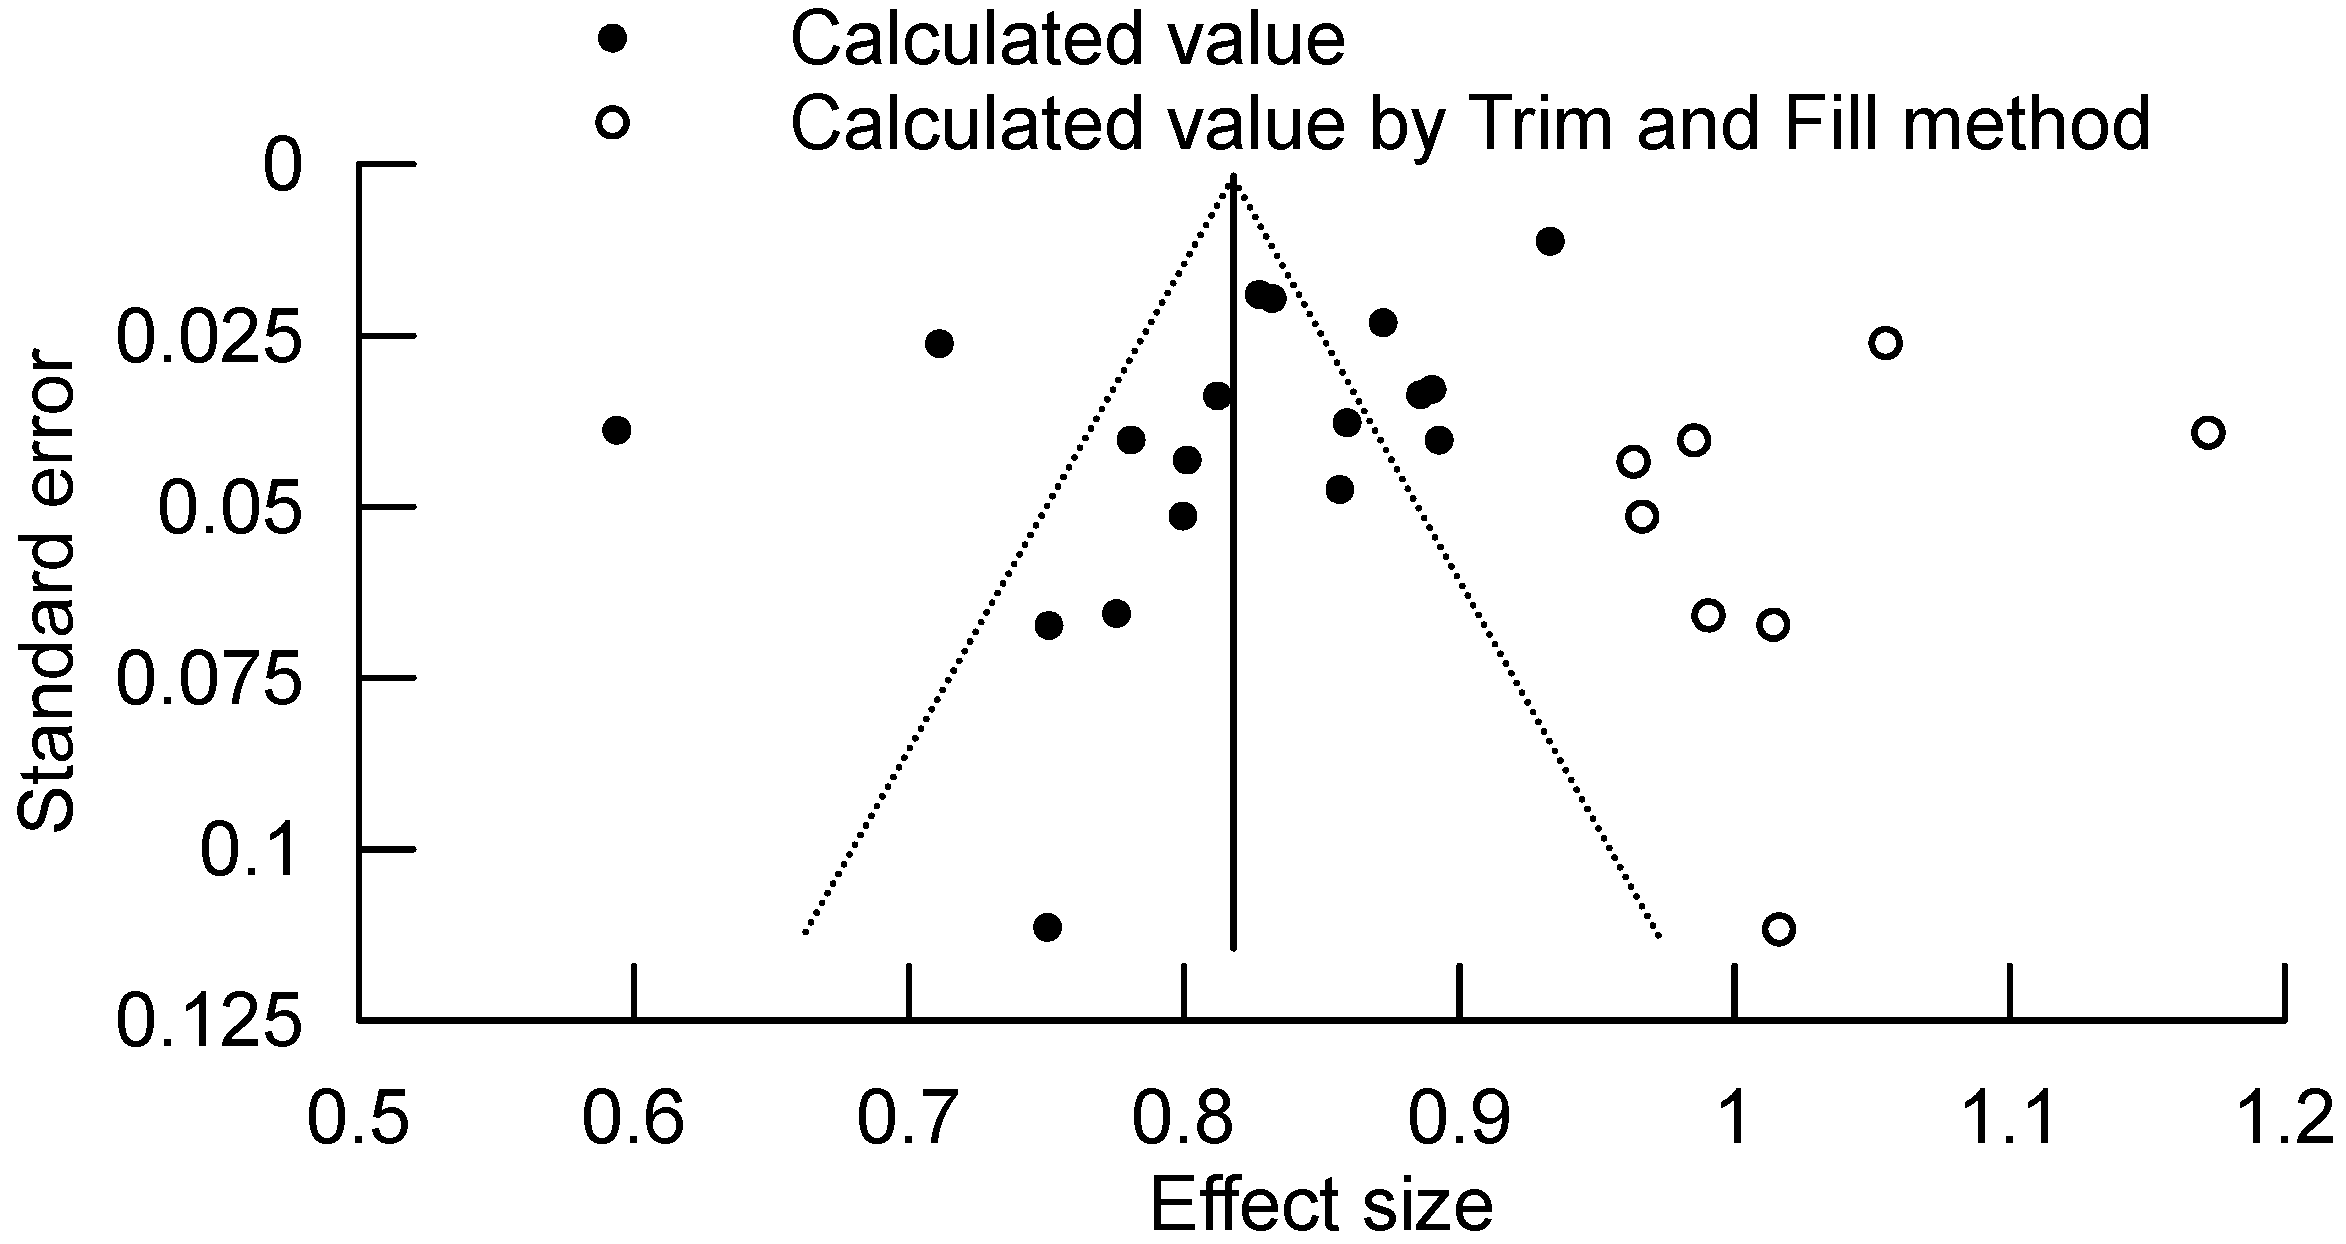
2.4.6. Publication Bias

Borenstein [24] highlighted that studies demonstrating larger effect sizes are more likely to be published in academic journals and subsequently included in meta-analyses. Conversely, studies with smaller or less favorable results encounter greater publication barriers, which limit their accessibility and citation. This phenomenon, called “publication bias”, is commonly observed in academia. Funnel plots are often used to visually assess publication bias. They depict the relationship between effect sizes and study characteristics, such as sample size, to evaluate bias. In the absence of publication bias, a symmetrical distribution should appear in the funnel plot. Various statistical methods have been developed to confirm publication bias, including the “Trim and Fill” method by Duval and Tweedie, Rosenthal’s “Fail-safe N”, and methods by Orwin [15]. In this study, the “Trim and Fill” method was used to adjust effect size estimates, improving the accuracy of the meta-analysis results. The trimming and filling procedure was performed using SPSS 25.

3. Results

3.1. CF Identification

After the rigorous screening and data extraction process for meta-analysis, 27 studies were selected for inclusion in the database. All data were collected via questionnaires. To facilitate a comprehensive analysis of the research findings, key details of the 27 studies were compiled, including country of origin, publication year, and sample size (Table 1).
A total of 66 CFs have been grouped into 12 categories (Table 2). Frequency analysis of the references revealed that CF1 (Availability of Materials), CF2 (Availability of Tools and Equipment), CF12 (Worker Experience and Skills), CF25 (Incompetent Supervisors), CF26 (Lack of Leadership among Construction Managers), CF33 (Inspection Practices), CF38 (Communication Deficiencies), and CF56 (Rework) were cited in over 15 references, indicating their widespread recognition as key determinants of CLP. CF1, CF2, and CF12 are fundamental input resources for construction operations. Factors such as CF25, CF26, CF33, CF38, CF56, and CF58 are related to site management and progress control, directly affecting output efficiency. The high frequency of these factors highlights their central role in both input and operational aspects of labor productivity.
In contrast, project type factors, such as CF3 (Constructability) and CF4 (Project Scale), were cited in fewer than four references. These competencies are typically established during project planning. Similarly, macro factors like CF42 (Politics), CF43 (Economy), and CF44 (Cultural) were cited in fewer than six references. While these broader contextual factors can influence CLP, they are often excluded from productivity models due to the difficulty in quantifying their direct impact on the input–output relationship in construction.

3.2. Numerical Example

This study illustrates the calculation process for CF12 (Worker Experience and Skills), cited in 18 of the 27 reviewed studies (Table S1), highlighting its relevance to labor productivity in construction. To examine the correlation between CF12 and CLP, statistical data (study IDs, sample IDs, sample sizes, and RII values) were extracted for meta-analysis to clarify the relationship. Subgroup analysis, sensitivity analysis, and publication bias assessment were conducted to evaluate CF12’s influence.
The heterogeneity analysis revealed a p-value of 0.000 and an I2 of 87.95%, indicating substantial heterogeneity for CF12. A random-effects model was applied to account for this heterogeneity. Figure 3 presents the forest plot of meta-analysis results for CF12. The black square at the bottom of the plot represents the pooled effect size across all studies, which is 0.818, providing an overall assessment of CF12’s contribution to CLP. Most studies cluster around the pooled effect size, suggesting general consistency in the results. However, some deviations exist. For example, Aghayeva and Ślusarczyk [25], and Jarkas Abdulaziz and Bitar Camille [26] report lower effect sizes, with Aghayeva and Ślusarczyk showing a more pronounced deviation. In contrast, El-Gohary Khaled and Aziz Remon [27] report a considerably higher effect size. These discrepancies may reflect underestimation or overestimation of CF12’s influence or result from study-specific factors.
All the literature sources are from journal articles, focusing on subgroup analyses of CF12 in specific years and regions (Figure 4). The results show statistical significance in all yearly subgroup analyses. A noticeable increase in CF12’s importance has been observed since 2014, with a significant rise between 2014 and 2018. Regionally, differences between subgroups are minimal, possibly due to the predominance of studies in Central Asia and North Africa, with varying sample sizes across subgroups. South Asia and Southeast Asia are underrepresented, with only one study each, suggesting inadequate sample sizes.
The sensitivity analysis forest plot shows the contribution of each study to the overall result (Figure 5). Excluding most studies has a negligible effect, but removing three specific studies increases the pooled effect size. These studies are by Aghayeva and Ślusarczyk [25], Jarkas Abdulaziz and Bitar Camille [26], and Mahamid et al. [42]. Excluding Jarkas Abdulaziz Bitar Camille [26] results in a more substantial increase in the pooled effect size.
A funnel plot assessed publication bias (Figure 6). The plot showed an asymmetrical distribution, with more points on the right, indicating potential bias in studies on CF12. Tweedie’s trim-and-fill method was applied to address this. The adjusted plot was more symmetrical, indicating reduced bias. As a result, the pooled effect size increased to 0.833, highlighting publication bias’s impact on the original results.

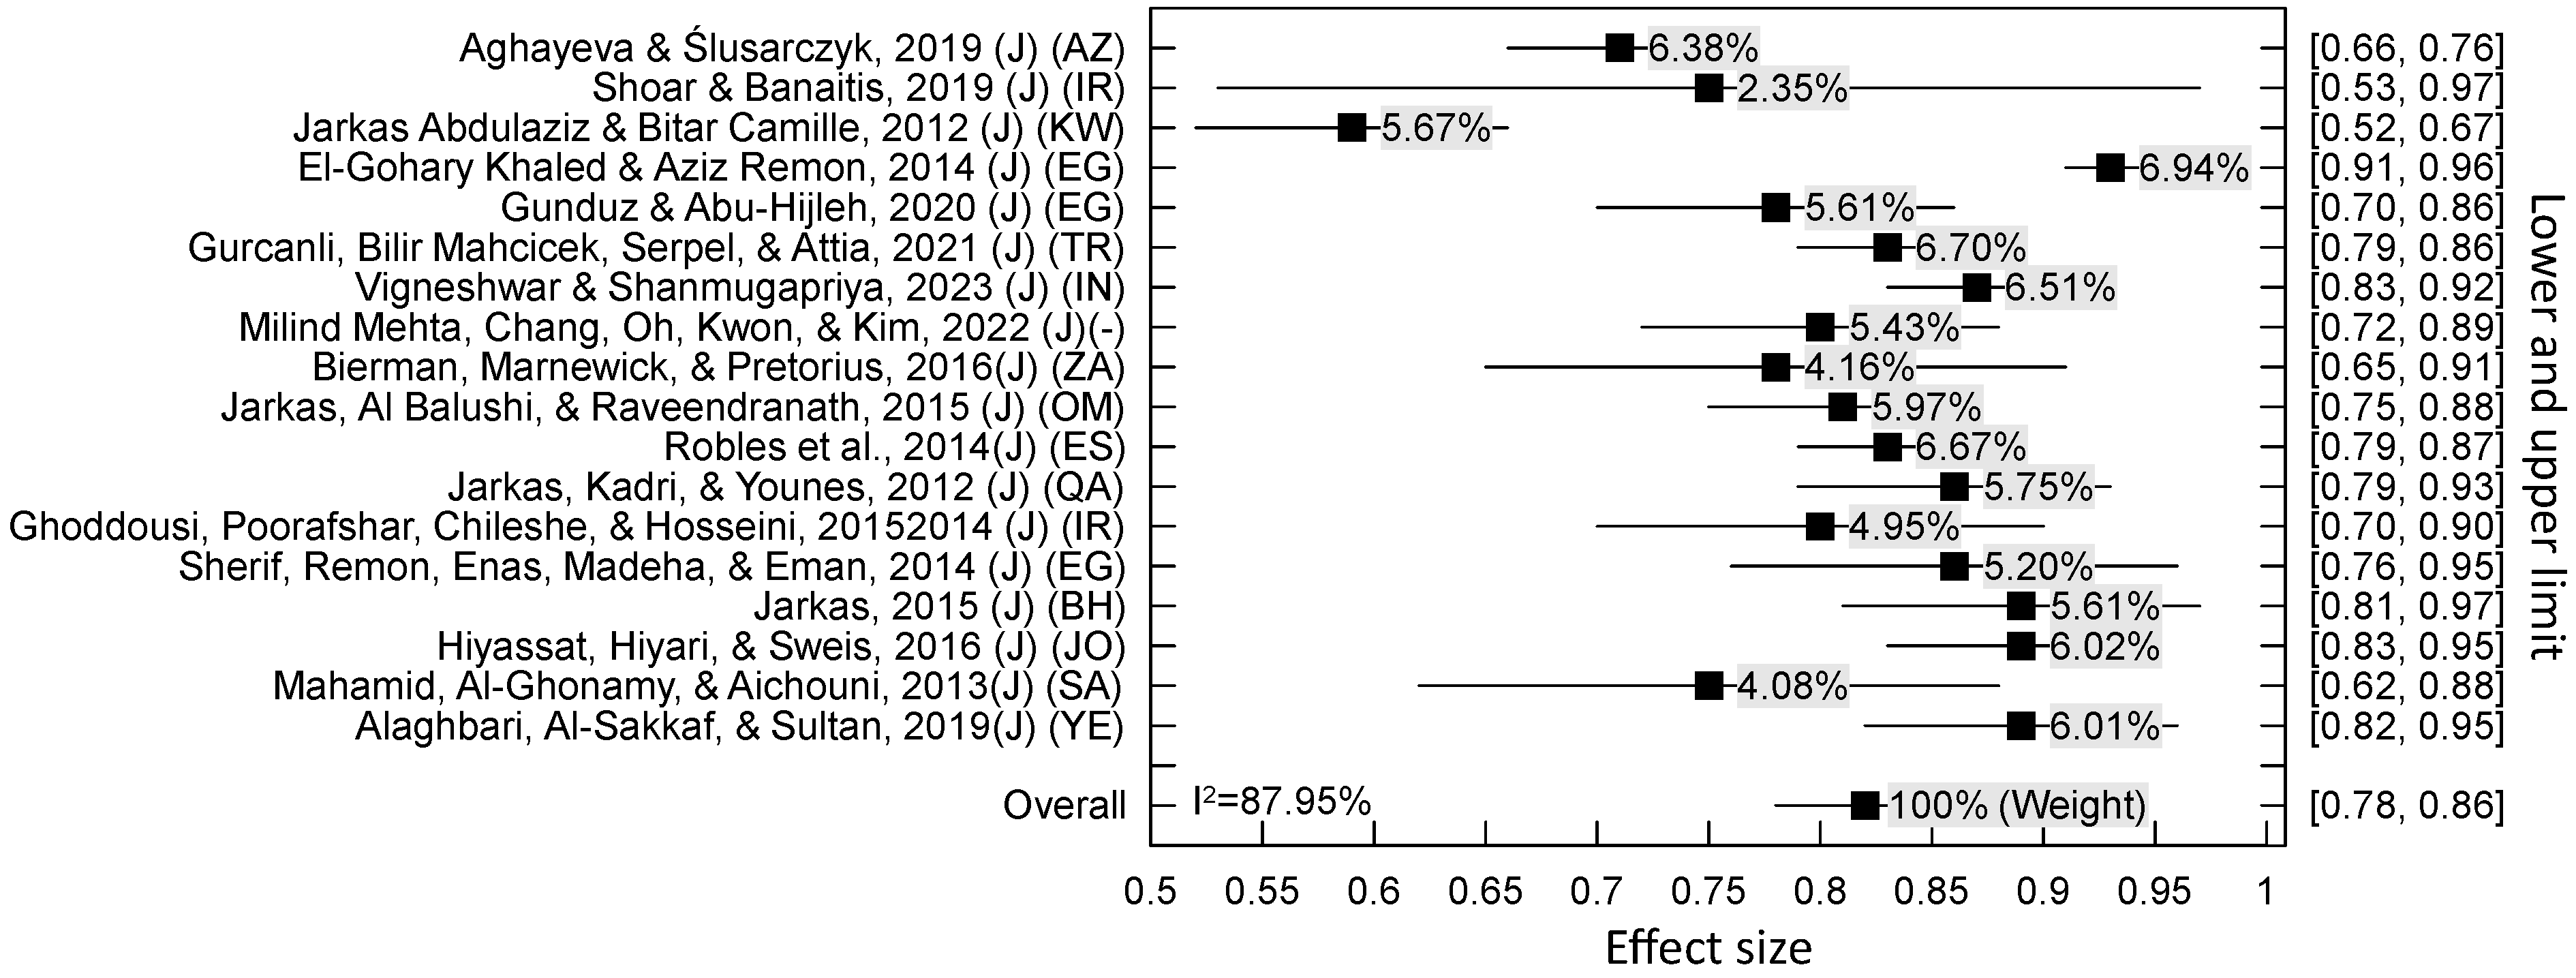
3.3. Meta-Analysis Results

3.3.1. CFs Analysis

Table S2 shows that heterogeneity levels varied across factors. Specifically, CF3 (Constructability), CF5 (Worker Satisfaction), CF24 (Clarity of Instructions and Communication), CF40 (Workers’ Participation in Decision Making), and CF61 (Unforeseen Ground Conditions) had I2 values below 25%, indicating low heterogeneity and supporting the use of a fixed-effects model for effect size estimation. Factors with I2 values above 25%, indicating moderate to high heterogeneity, were analyzed using a random-effects model.
Figure 7 shows publication bias in 13 critical factors. To address this, the Trim and Fill method was applied to derive adjusted effect sizes [21]. The adjusted values consistently exceeded the original estimates, suggesting that studies with smaller or nonsignificant effects may have been excluded due to publication bias. This suggests that missing studies likely reported lower effect sizes. A composite ratio, calculated by integrating actual and adjusted values, was used to indicate the relative importance or overall effect size of each factor. All composite ratios exceeded 0.5, highlighting the significant influence of these factors on construction productivity.
Thirteen factors had adjusted effect sizes exceeding 0.8. CF12 (Worker Experience and Skills) exhibited the highest adjusted rate and citation frequency, consistently emphasized across the academic literature, and was identified as the most influential factor affecting CLP. CF1 (Availability of Materials), CF25 (Incompetent Supervisors), and CF26 (Lack of Leadership in Construction Management) also exhibited high adjusted rates and citation frequencies. In contrast, CF3 and CF24 were infrequently cited in the literature but exhibited relatively high overall effect sizes. This suggests that despite their potential importance, these factors have received limited research attention, highlighting the need for further empirical investigation.
Factors such as CF2 (Availability of Tools and Equipment) and CF56 (Rework) were frequently mentioned but had relatively low adjusted effect sizes. The adjusted effect sizes of CF21 (Delay in Payments) and CF24 were both 0.809, while CF5, CF36 (Delay in Responding to Requests for Information), and CF57 (Lack of Planning) were all 0.810, suggesting comparable influence on construction labor productivity. CF20 (Wage Level) also demonstrated a high adjusted rate, highlighting its role in enhancing worker motivation and attracting skilled labor, thus improving operational efficiency.

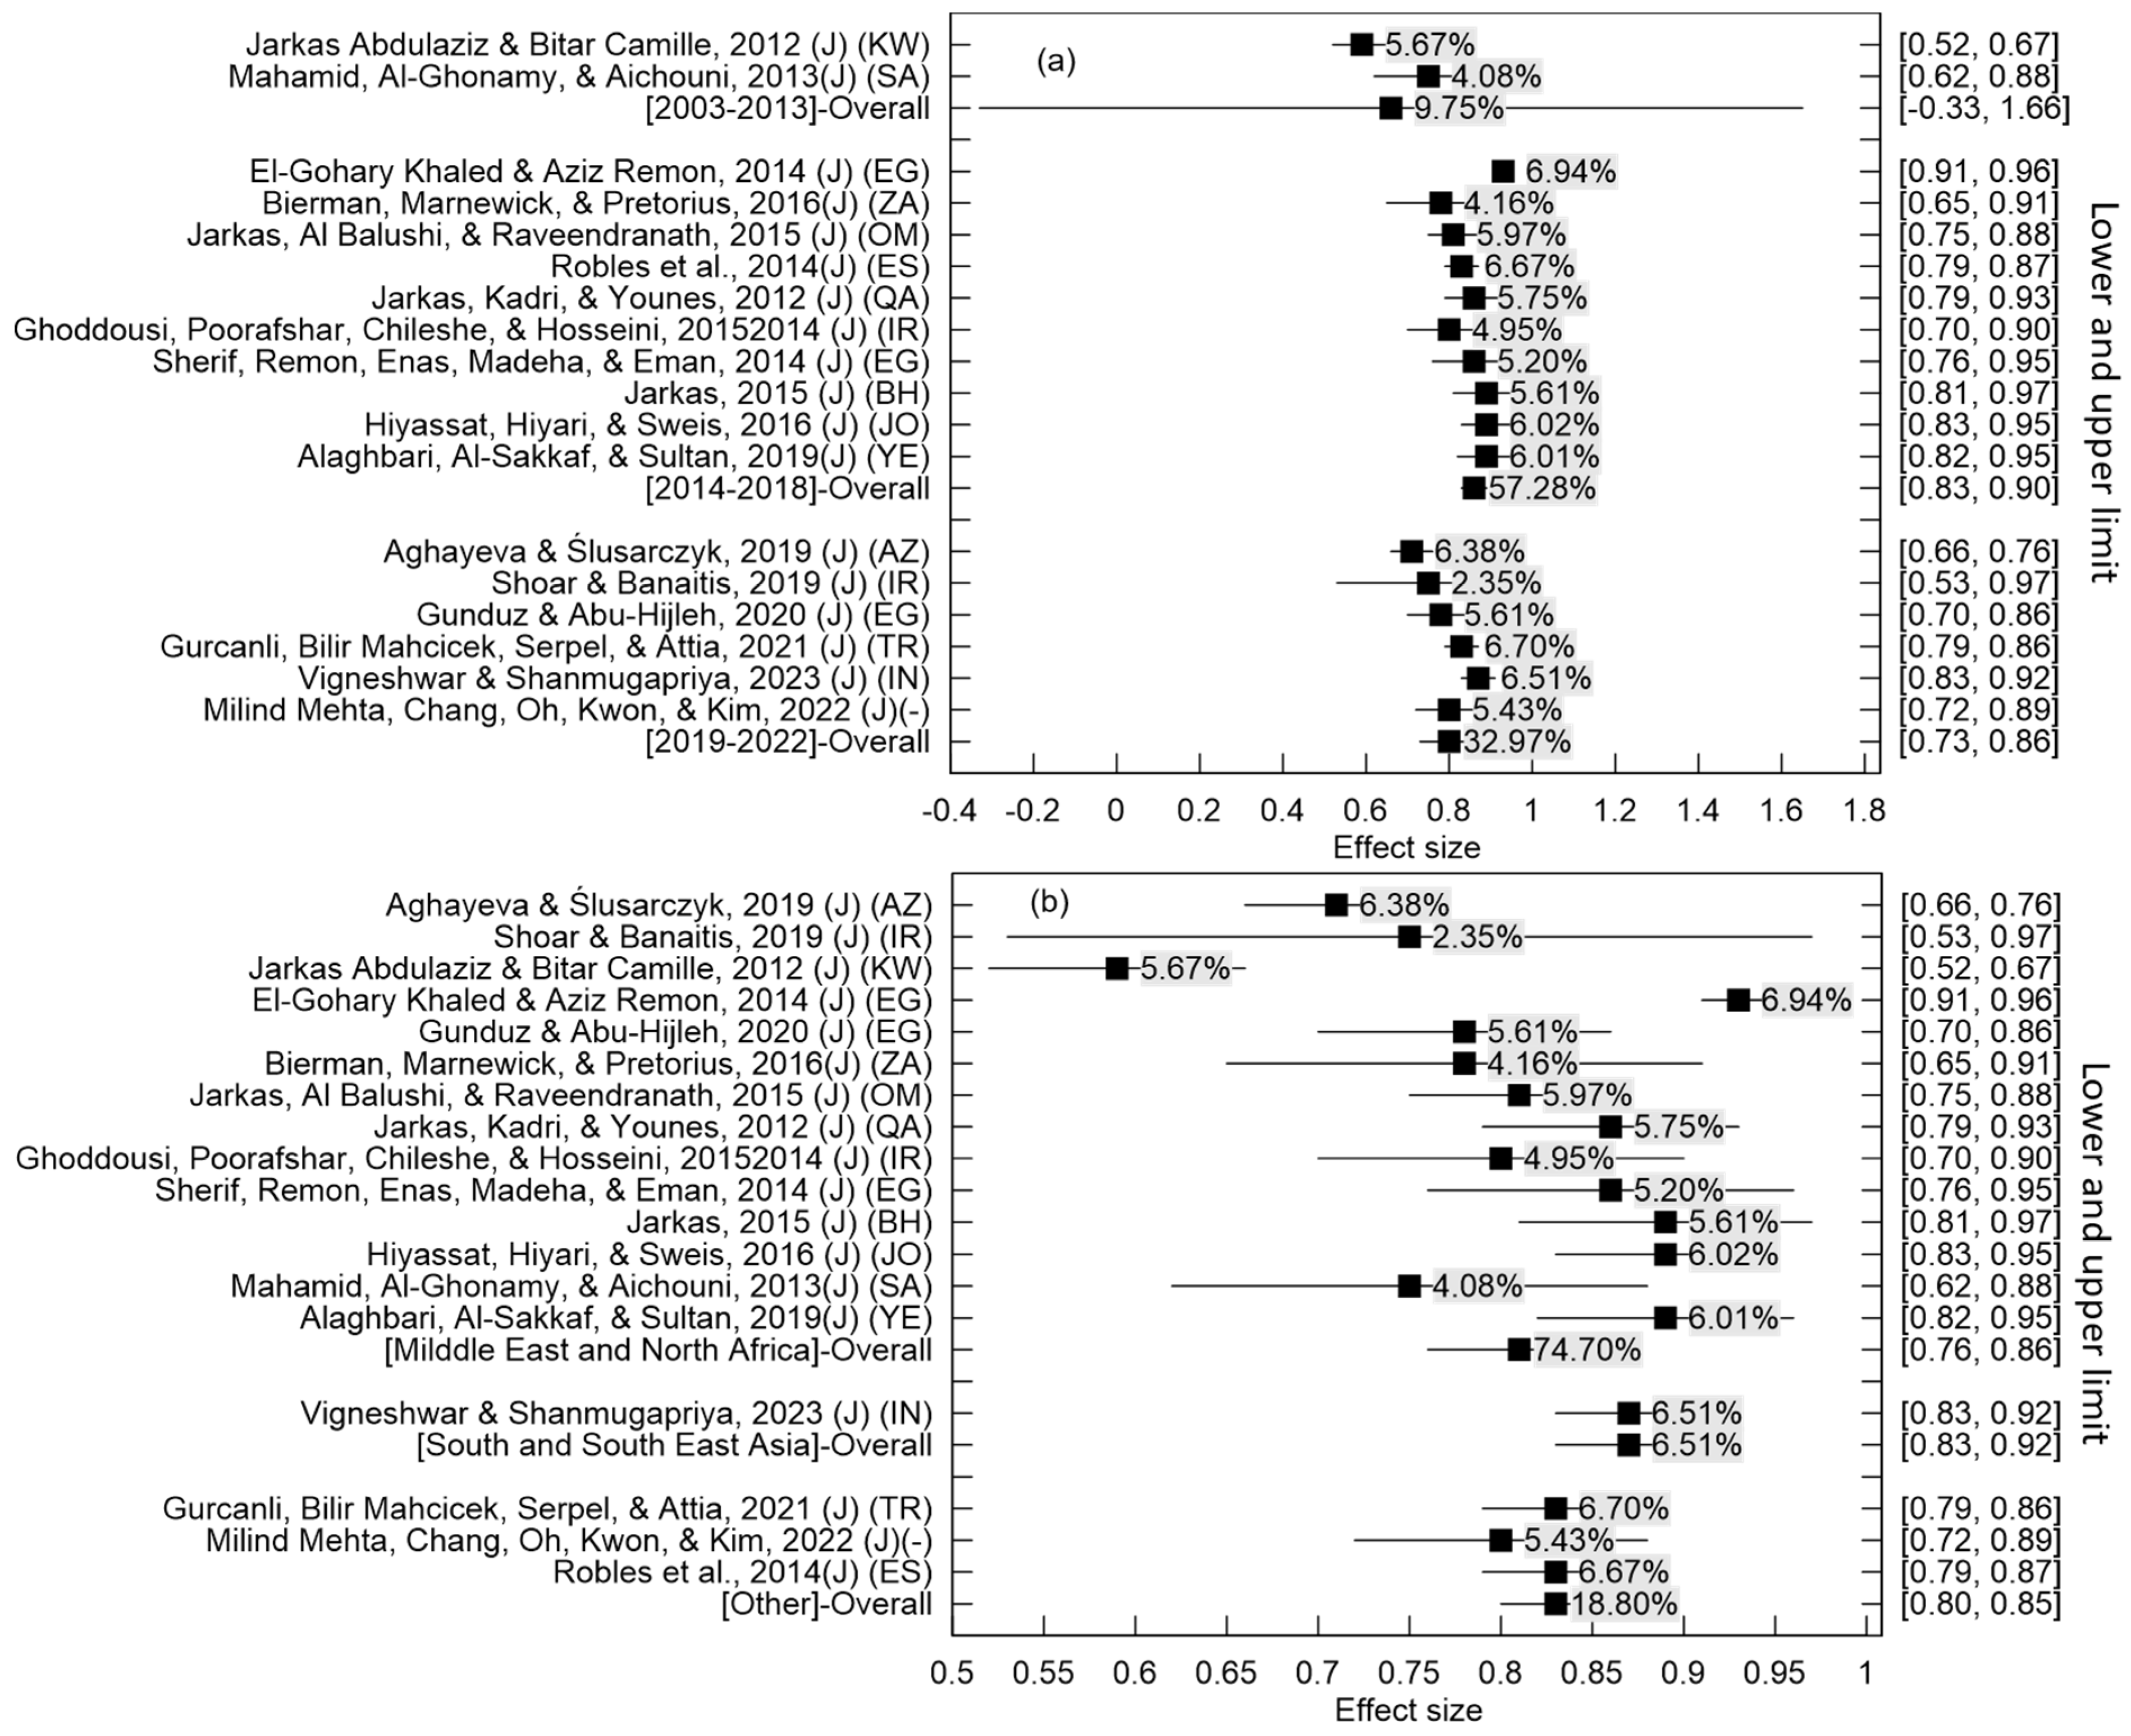
3.3.2. Subgroup Analysis

The meta-analysis categorized the studies into three types, with subgroup results for each CF shown in Table S2. For publication type, there was no statistically significant difference between journal papers and other sources for all CFs except CF19 (Crew Size and Composition), CF20 (Wage Level), CF27 (Unsuitability of Storage Location), and CF41 (Proportion of Work Subcontracted). Most CFs showed higher effect sizes in journal publications, indicating a stronger reported impact compared to non-journal sources. Notably, CF39 (Periodical Report and Share Problem) and CF63 (Confinement of Working Space) showed lower effect sizes in journal articles, while CF45 (Weather Condition) (Δ = 0.335) exhibited the largest difference between publication types.
Temporal analysis (2003~2013, 2014~2018, 2019~2022) identified phase-specific drivers of CLP. Most factors increased or peaked during 2014~2018. For example, CF10’s effect size rose from 0.437 (2003~2013) to 0.762 (2014~2018), and CF45 increased from 0.396 to 0.800, highlighting the growing influence of human resource management and climate-related challenges on CLP. In contrast, CF66 (Social Health and Insurance) and CF52 (Design Complexity) declined, reported in only two time periods. The effect sizes of CF5 (Worker Satisfaction), CF19 (Crew Size and Composition), and CF41 showed a non-linear trend, initially decreasing and then increasing.
Regional differences were prominent for most CFs. South and Southeast Asia excelled in CF21 and CF50 (RII = 0.904), with a 0.1~0.2 difference compared to other regions. The Middle East and North Africa excelled in CF36 (0.854) and CF38 (0.830), but showed weaknesses in CF22 (0.301) and CF28 (0.362), indicating imbalances in factor importance. Other regions excelled in CF10 (0.850) and CF29 (0.836). CF23 (0.383/0.750/0.765) and CF44 (0.823/0.390) showed significant regional variations (standard deviation > 0.3), highlighting geographical and cultural disparities in factor impact.

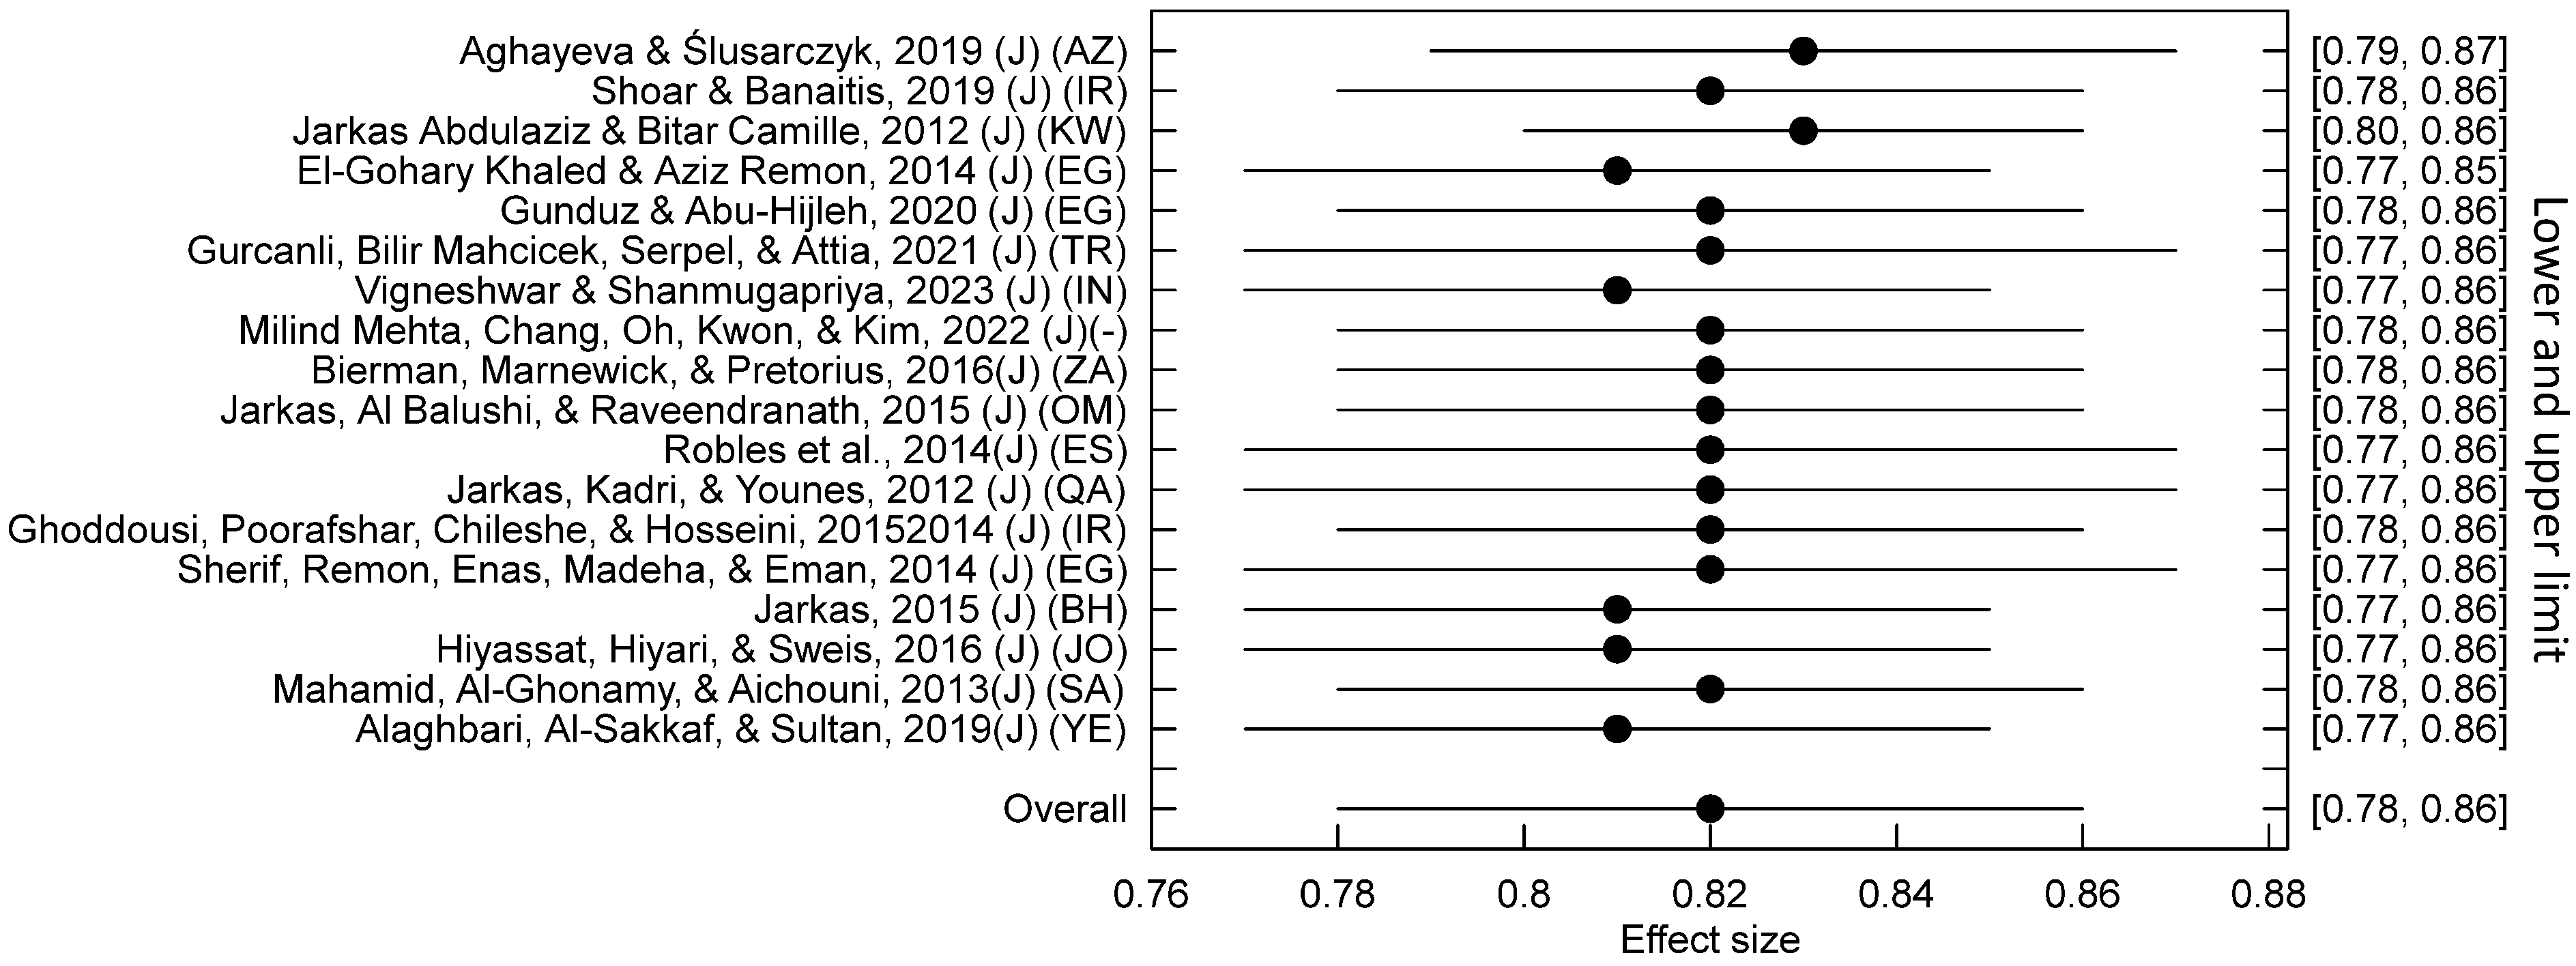
3.3.3. Sensitivity Analysis

To assess the robustness of our results, sensitivity analyses were conducted by excluding individual studies. Detailed outcomes are provided in Table S3. A 5% threshold determined the significance of variations in effect size estimates. For most CFs, changes in effect sizes stayed within ±0.05 after removing a single study, indicating limited influence on the overall results. However, several CFs, including CF23 (Workload), CF31 (Interference), CF34 (Quality of Site Management), CF43 (Economy), CF44 (Cultural), CF49 (Rain), and CF54 (Clarity of Technical Specification), showed effect size variations exceeding 5%, suggesting sensitivity to specific studies. Notably, CF49 showed deviations above 5% in all five single-study exclusions, implying a substantial influence of each study on the overall estimate. CF44 also showed pronounced fluctuations, with effect size changes of 19.32% and 17.37% upon excluding the first and eighth studies, respectively (Table S3). These substantial variations may stem from cross-country differences, particularly cultural disparities, which can significantly influence CLP outcomes and amplify the observed effect of certain factors.

4. Discussion

4.1. Discussion on Top CFs

The data extraction revealed 66 CFs across 12 categories from 27 studies, involving 3519 participants from 17 countries engaged in various construction projects. The RII was used to evaluate the relative impact of each factor, with values ranging from 0 to 1, representing the comparative strength of each factor’s influence on construction labor productivity. Although the RII allows for effective comparison of factor importance, it does not reflect the exact percentage increase in productivity. The findings indicate that CF12 is the most influential factor affecting CLP, with the highest adjusted effect size (0.833) and the highest frequency of mention across 18 studies. This aligns with previous research by Alaghbari et al. [45] and Jarkas [40], who emphasized the pivotal role of skilled labor in ensuring efficient task execution, reducing errors, and mitigating rework. Our findings reaffirm that workers lacking technical competence often contribute to lower productivity and increased cost due to time overruns and task repetition [48]. Conversely, experienced workers can leverage accumulated knowledge and problem-solving abilities to enhance efficiency.
In addition to labor skills, site management quality is another high-impact dimension. CF25 (Incompetent Supervisors) and CF26 (Lack of Leadership in Construction Management) were found to have large effect sizes, underscoring their essential role in CLP outcomes. Incompetent supervisors may worsen these issues by failing to coordinate processes, resolve problems on time, or motivate workers adequately [8]. These findings are consistent with field evidence from projects in Bahrain [40], reinforcing the idea that leadership effectiveness directly shapes productivity.
CF20 (Wages) also demonstrated a strong influence on CLP, supporting the efficiency wage theory, which posits that higher-than-average compensation can boost motivation and reduce shirking behavior. According to U.S. labor statistics, productivity can increase by up to 28% when hourly wages exceed USD 24.5 [49]. This suggests that fair and competitive compensation structures not only attract skilled labor but also sustain worker engagement and loyalty [50].
Based on these findings, it is clear that strengthening the workforce is a priority for improving CLP. Strategies should include upskilling programs, mentorship systems that promote knowledge sharing, and performance-based incentives [51,52]. Moreover, ensuring equitable and transparent compensation helps foster a work environment where employees feel valued, increasing their psychological commitment to performance outcomes [53,54].
Beyond human resource factors, our study also highlights the critical role of leadership and communication mechanisms, particularly in large-scale or complex projects. Strong on-site leadership enables proactive problem identification and flexible resource reallocation [55,56]. Conversely, leadership gaps contribute to ambiguity, delays, and workforce disengagement. Clear and timely communication across project stakeholders ensures that decisions are well-informed and tasks are executed with precision. As echoed in prior studies, improved communication reduces coordination errors and accelerates decision-making, thereby boosting overall work efficiency [57].
Finally, technological innovation—while less frequently cited—emerged as a high-impact factor in certain subgroup analyses. Tools such as Building Information Modeling (BIM), 3D printing, drones, and robotics have shown potential to significantly reduce construction time, improve accuracy, and enhance labor efficiency [58,59]. However, our findings suggest that their effect varies across time, region, and publication type, likely reflecting differences in local adoption maturity and implementation context. Construction firms should thus adopt context-sensitive technology strategies, ensuring that innovations are integrated effectively into existing workflows and aligned with local operational readiness.

4.2. Theoretical Implications

In previous studies, the conventional approach of ranking critical factors (CFs) based solely on citation frequency has been shown to lead to biased or misleading conclusions [60]. In contrast, this study offers a more balanced evaluation by integrating effect size analysis with frequency data, providing a comprehensive assessment of influential factors and reflecting on their theoretical implications.
Several factors demonstrated both high citation frequency and high effect sizes, indicating that they are not only widely recognized as influential drivers of CLP but also empirically validated as having substantial impact. These include CF12 (Worker Experience and Skills), CF25 (Incompetent Supervisors), CF26 (Construction Managers’ Lack of Leadership), and CF1 (Availability of Materials). Therefore, enhancing labor productivity should be regarded primarily as a human resource management challenge, with particular emphasis on workforce training and leadership development [25]. In parallel, the optimization of material supply chains should also be prioritized to ensure timely and efficient resource availability on construction sites.
Secondly, some factors exhibited relatively high effect sizes despite being infrequently cited. A notable example is CF3 (Constructability), which has received limited attention in traditional evaluations. However, several studies [27,61,62] have demonstrated the significant value of applying constructability principles in improving construction labor productivity. This suggests that influential drivers may have been overlooked in previous research on productivity factors. Reassessing these potentially underexplored factors is, therefore, essential for future research agendas and policy frameworks. Moreover, this finding reinforces the importance of conducting a meta-analysis to uncover such discrepancies.
Moreover, factors such as CF38 (Lack of Communication) and CF56 (Rework) were frequently cited in the literature but ranked relatively low in terms of effect size. This discrepancy suggests that although these factors have received substantial attention, their actual statistical impact on CLP may be limited compared to other drivers. One possible explanation is that such issues have been partially addressed in modern construction practices, thereby reducing their present-day influence. Alternatively, the growing body of research on construction labor productivity may have shifted focus toward other, more impactful factors.
Accordingly, future research should pay closer attention to those factors that exhibit significant discrepancies between citation frequency and effect size, as they may represent overlooked or emerging drivers of construction labor productivity.

4.3. Practical Implications

Temporal differences in the effect sizes of CLP factors were observed across the studies. Since 2014, several factors have shown a clear upward trend in their influence, including CF45 (Weather Condition), CF28 (Lack of Transportation), CF31 (Interference), and CF33 (Inspection). For CF45, the influence has increased significantly, particularly in the context of global warming and the rising frequency of extreme weather events. As a result, researchers have increasingly focused on improving construction efficiency in extremely high-temperature environments [63]. The rising impact of site-related factors suggests a shift in industry focus toward more effective on-site management and climate-adaptive planning.
Regional variation was also notable. In South and Southeast Asia, CF50 (Utilizing Advanced Techniques and Technology) and CF21 (Delay in Payments) had significantly higher effect sizes compared to other regions, highlighting the critical role of digital tools and financial reliability in labor-intensive construction environments. Conversely, in the Middle East and North Africa, CF20 (Wage Level), CF5 (Worker Satisfaction), and CF6 (Occupational Security) showed large disparities. These differences are likely linked to the unique labor structures, wage systems, and regulatory environments in these regions, particularly the extensive use of migrant labor.
Publication type also influenced the reported effect sizes. Peer-reviewed journal articles generally reported higher effect sizes than conference papers or technical reports, especially for factors related to labor skills and management quality. This indicates that study design and data quality affect outcome strength. Therefore, greater attention should be given to evidence from high-quality, peer-reviewed sources when synthesizing research findings or formulating policy recommendations.
Overall, these findings emphasize that policymakers and practitioners should adopt differentiated strategies that are tailored to specific time periods, regional conditions, and supported by reliable empirical evidence.

5. Limitation

Despite the meaningful contributions of this study to the understanding of CLP, several limitations must be acknowledged.
First, this study relied exclusively on published empirical research reporting RII values, which may introduce selection bias and result in the omission of the relevant grey literature or qualitative insights. Although random-effects models and subgroup analyses were employed to address heterogeneity, differences in sample sizes, survey designs, and regional contexts may still affect the robustness of effect size estimates. Moreover, the meta-analytic approach assumes that Likert-scale ratings can be treated as interval data and that respondents interpret and apply rating scales consistently. These assumptions may oversimplify individual perceptual differences and introduce bias into the aggregated results.
Second, although the classification of critical factors was carefully developed, some CFs may exhibit conceptual overlap, with certain factors representing similar or closely related constructs. To preserve the comprehensiveness and fidelity of the original dataset, these factors were retained in the analysis. Moreover, although this study incorporated a relatively wide range of the empirical literature, many of the selected studies did not explicitly report contextual details such as the type of construction project (e.g., residential, commercial, or industrial), which limited the feasibility of conducting subgroup analyses based on project type. Additionally, in the regional subgroup analysis, some areas—such as Southeast Asia and Latin America—were underrepresented, which may constrain the generalizability of the findings across all global contexts.

6. Conclusions

This study follows the PRISMA guidelines and uses meta-analysis to systematically analyze empirical data from the existing literature. The objective is to identify, quantify, and rank the critical factors affecting construction labor productivity. The findings indicate that the factors affecting construction labor productivity are complex, with 66 CFs categorized into 12 groups. The results reveal that labor-related factors—particularly worker experience and skills (CF12)—site management aspects such as incompetent supervisors (CF25) and construction managers lack of leadership (CF26), as well as resource-related factors like availability of materials (CF1), exhibit the highest effect sizes and citation frequencies, underscoring their central role in shaping CLP outcomes.
Furthermore, this study reveals notable regional disparities and temporal shifts in the influence of CFs. In recent years, factors such as utilizing advanced techniques and technology (CF50) and weather conditions (CF45) have gained increasing importance, while wage-related and incentive-driven factors have shown greater relevance in regions characterized by a high proportion of immigrant labor. These findings emphasize the necessity for context-specific strategies that account for regional and temporal variations in productivity drivers.
Importantly, the observed discrepancies between citation frequency and actual effect sizes for several CFs underscore the theoretical value of meta-analysis. Beyond ranking CFs by their degree of importance in the literature, this method enables a more nuanced understanding of their empirical impact. As such, this study provides both theoretical advancement and practical guidance, offering actionable insights for construction practitioners and policymakers aiming to enhance labor productivity in diverse project environments.

Supplementary Materials

The following supporting information can be downloaded at https://www.mdpi.com/article/10.3390/buildings15142463/s1. Table S1: Statistical data of CF12 for the Meta-analysis. Table S2: Summary of heterogeneity and subgroup analysis results for all CFs. Table S3: The primary mean and adjusted mean were obtained by removing one study in the sensitivity analysis.

Author Contributions

Conceptualization, F.J. and Q.G.; methodology, F.J.; formal analysis, Q.G.; resources, F.J.; data curation, Q.L.; writing—original draft preparation, F.J. and Q.G.; writing—review and editing, F.J. and Q.G.; visualization, Q.G. and Q.L.; supervision, C.F., Q.H. and. Q.Y. All authors have read and agreed to the published version of the manuscript.

Funding

This research received no external funding.

Data Availability Statement

The original contributions presented in this study are included in the article/Supplementary Material. Further inquiries can be directed to the corresponding author.

Acknowledgments

This work was supported by the Research Fund for Excellent Dissertation of the China Three Gorges University.

Conflicts of Interest

Author Qiaoyi Hu was employed by the company The Guangdong No. 3 Water Conservancy and Hydro-Electric Engineering Board Co., Ltd. Author Qishu Yu was employed by the company Shanghai Investigation, Design & Research Institute Co., Ltd. The remaining authors declare that the research was conducted in the absence of any commercial or financial relationships that could be construed as a potential conflict of interest.

References

  1. Ertuğrul, H.M.; Pirgaip, B. The nexus between construction investment and economic development: Evidence from MENA countries. Construct. Manag. Econ. 2021, 39, 932–947. [Google Scholar] [CrossRef]
  2. Liu, B.; Gao, Q.; Liang, L.; Sun, J.; Liu, C.; Xu, Y. Ecological relationships of global construction industries in sustainable economic and energy development. Energy 2021, 234, 121249. [Google Scholar] [CrossRef]
  3. Xu, X.; Wang, Y.; Tao, L. Comprehensive evaluation of sustainable development of regional construction industry in China. J. Clean. Prod. 2019, 211, 1078–1087. [Google Scholar] [CrossRef]
  4. Van Tam, N. Unveiling global research trends in construction productivity: A scientometric analysis of twenty-first century research. Smart Constr. Sustain. Cities 2024, 2, 2. [Google Scholar] [CrossRef]
  5. Qi, K.; Owusu, E.K.; Francis Siu, M.-F.; Albert Chan, P.-C. A systematic review of construction labor productivity studies: Clustering and analysis through hierarchical latent dirichlet allocation. Ain Shams Eng. J. 2024, 15, 102896. [Google Scholar] [CrossRef]
  6. Hwang, B.-G.; Ng, W.J. Project management knowledge and skills for green construction: Overcoming challenges. Int. J. Proj. Manag. 2013, 31, 272–284. [Google Scholar] [CrossRef]
  7. Golchin Rad, K.; Kim, S.-Y. Factors Affecting Construction Labor Productivity: Iran Case Study. Iran. J. Sci. Technol. Trans. Civ. Eng. 2018, 42, 165–180. [Google Scholar] [CrossRef]
  8. Durdyev, S.; Mbachu, J. Key constraints to labour productivity in residential building projects: Evidence from Cambodia. Int. J. Construct. Manag. 2018, 18, 385–393. [Google Scholar] [CrossRef]
  9. Vigneshwar, R.V.K.; Shanmugapriya, S. Investigating the factors affecting construction site productivity—A case of India. Eng. Constr. Archit. Manag. 2023, 30, 963–985. [Google Scholar] [CrossRef]
  10. Yi, W.; Chan Albert, P.C. Critical Review of Labor Productivity Research in Construction Journals. J. Manag. Eng. 2014, 30, 214–225. [Google Scholar] [CrossRef]
  11. Naoum, S.G. Factors influencing labor productivity on construction sites. Int. J. Product. Perform. Manag. 2016, 65, 401–421. [Google Scholar] [CrossRef]
  12. Chen, L.; Chan, A.P.C.; Owusu, E.K.; Darko, A.; Gao, X. Critical success factors for green building promotion: A systematic review and meta-analysis. Build. Environ. 2022, 207, 108452. [Google Scholar] [CrossRef]
  13. Robles, G.; Stifi, A.; Ponz-Tienda, J.; Gentes, S. Labor Productivity in the Construction Industry—Factors Influencing the Spanish Construction Labor Productivity. Int. J. Civ. Archit. Struct. Constr. Eng. 2014, 8, 999–1008. [Google Scholar]
  14. Shoar, S.; Banaitis, A. Application of Fuzzy Fault Tree Analysis to Identify Factors Influencing Construction Labor Productivity: A High-Rise Building Case Study. J. Civ. Eng. Manag. 2019, 25, 41–52. [Google Scholar] [CrossRef]
  15. Gupta, M.; Hasan, A.; Jain Arvind, K.; Jha Kumar, N. Site Amenities and Workers’ Welfare Factors Affecting Workforce Productivity in Indian Construction Projects. J. Constr. Eng. Manag. 2018, 144, 04018101. [Google Scholar] [CrossRef]
  16. Page, M.J.; McKenzie, J.E.; Bossuyt, P.M.; Boutron, I.; Hoffmann, T.C.; Mulrow, C.D.; Shamseer, L.; Tetzlaff, J.M.; Akl, E.A.; Brennan, S.E.; et al. The PRISMA 2020 statement: An updated guideline for reporting systematic reviews. BMJ 2021, 372, n71. [Google Scholar] [CrossRef]
  17. Grant, M.J.; Booth, A. A typology of reviews: An analysis of 14 review types and associated methodologies. Health Inf. Libr. J. 2009, 26, 91–108. [Google Scholar] [CrossRef]
  18. Peters, J.L.; Remmers, T.; Wheeler, A.J.; Murphy, J.; Cummins, V. A systematic review and meta-analysis of GIS use to reveal trends in offshore wind energy research and offer insights on best practices. Renew. Sustain. Energy Rev. 2020, 128, 109916. [Google Scholar] [CrossRef]
  19. Zhu, J.; Liu, W. A tale of two databases: The use of Web of Science and Scopus in academic papers. Scientometrics 2020, 123, 321–335. [Google Scholar] [CrossRef]
  20. Levine-Clark, M.; Gil, E. A comparative analysis of social sciences citation tools. Online Inf. Rev. 2009, 33, 986–996. [Google Scholar] [CrossRef]
  21. Lehrer, E.J.; Wang, M.; Sun, Y.; Zaorsky, N.G. An Introduction to Meta-Analysis. Int. J. Radiat. Oncol. Biol. Phys. 2023, 115, 564–571. [Google Scholar] [CrossRef] [PubMed]
  22. Hussein, M.; Zayed, T. Critical factors for successful implementation of just-in-time concept in modular integrated construction: A systematic review and meta-analysis. J. Clean. Prod. 2021, 284, 124716. [Google Scholar] [CrossRef] [PubMed]
  23. Higgins, J.P.T.; Green, S.; Ben Van Den, A. Cochrane Handbook for Systematic Reviews of Interventions. Int. Coach. Psychol. Rev. 2020, 15, 123–125. [Google Scholar] [CrossRef]
  24. Borenstein, M.; Hedges, L.V.; Higgins, J.P.T.; Rothstein, H.R.; Ben Van Den, A. Introduction to Meta-Analysis. Int. Coach. Psychol. Rev. 2020, 15, 121–122. [Google Scholar] [CrossRef]
  25. Aghayeva, K.; Ślusarczyk, B. Analytic Hierarchy of Motivating and Demotivating Factors Affecting Labor Productivity in the Construction Industry: The Case of Azerbaijan. Sustainability 2019, 11, 5975. [Google Scholar] [CrossRef]
  26. Jarkas Abdulaziz, M.; Bitar Camille, G. Factors Affecting Construction Labor Productivity in Kuwait. J. Constr. Eng. Manag. 2012, 138, 811–820. [Google Scholar] [CrossRef]
  27. El-Gohary Khaled, M.; Aziz Remon, F. Factors Influencing Construction Labor Productivity in Egypt. J. Manag. Eng. 2014, 30, 1–9. [Google Scholar] [CrossRef]
  28. Gunduz, M.; Abu-Hijleh, A. Assessment of Human Productivity Drivers for Construction Labor through Importance Rating and Risk Mapping. Sustainability 2020, 12, 8614. [Google Scholar] [CrossRef]
  29. Gurcanli, G.E.; Bilir Mahcicek, S.; Serpel, E.; Attia, S. Factors Affecting Productivity of Technical Personnel in Turkish Construction Industry: A Field Study. Arab. J. Sci. Eng. 2021, 46, 11339–11353. [Google Scholar] [CrossRef]
  30. Milind Mehta, S.; Chang, S.; Oh, H.J.; Kwon, J.-H.; Kim, S. An Investigation of Construction Project Efficiency: Perception Gaps and the Interrelationships of Critical Factors. Buildings 2022, 12, 1559. [Google Scholar] [CrossRef]
  31. Bierman, M.; Marnewick, A.; Pretorius, J.H.C. Productivity management in the South African civil construction industry—Factors affecting construction productivity. J. S. Afr. Inst. Civ. Eng. 2016, 58, 37–44. [Google Scholar] [CrossRef]
  32. Doloi, H. Twinning Motivation, Productivity and Management Strategy in Construction Projects. Eng. Manag. J. 2007, 19, 30–40. [Google Scholar] [CrossRef]
  33. Kazaz, A.; Ulubeyli, S. Drivers of productivity among construction workers: A study in a developing country. Build. Environ. 2007, 42, 2132–2140. [Google Scholar] [CrossRef]
  34. Jarkas, A.M.; Al Balushi, R.A.; Raveendranath, P.K. Determinants of construction labour productivity in Oman. Int. J. Construct. Manag. 2015, 15, 332–344. [Google Scholar] [CrossRef]
  35. Jarkas, A.M.; Kadri, C.Y.; Younes, J.H. A Survey of Factors Influencing the Productivity of Construction Operatives in the State of Qatar. Int. J. Construct. Manag. 2012, 12, 1–23. [Google Scholar] [CrossRef]
  36. Ohueri, C.C.; Enegbuma, W.I.; Wong, N.H.; Kuok, K.K.; Kenley, R. Labour productivity motivation framework for Iskandar Malaysia. Built Environ. Proj. Asset Manag. 2018, 8, 293–304. [Google Scholar] [CrossRef]
  37. Ghoddousi, P.; Poorafshar, O.; Chileshe, N.; Hosseini, M.R. Labour productivity in Iranian construction projects. Int. J. Product. Perform. Manag. 2015, 64, 811–830. [Google Scholar] [CrossRef]
  38. Dixit, S.; Mandal, S.; Thanikal, J.; Saurabh, K. Critical Analysis of Factors Affecting the on-site Productivity in Indian Construction Industry. In Proceedings of the Creative Construction Conference, Ljubljana, Slovenia, 30 June–3 July 2018. [Google Scholar] [CrossRef]
  39. Sherif, M.H.; Remon, F.A.; Enas, S.M.; Madeha, M.A.; Eman, K.A. Critical Factors Affecting Construction Labor Productivity in Egypt. Am. J. Civ. Eng. 2014, 2, 35–40. [Google Scholar] [CrossRef]
  40. Jarkas, A.M. Factors influencing labour productivity in Bahrain’s construction industry. Int. J. Construct. Manag. 2015, 15, 94–108. [Google Scholar] [CrossRef]
  41. Hiyassat, M.A.; Hiyari, M.A.; Sweis, G.J. Factors affecting construction labour productivity: A case study of Jordan. Int. J. Construct. Manag. 2016, 16, 138–149. [Google Scholar] [CrossRef]
  42. Mahamid, I.; Al-Ghonamy, A.; Aichouni, M. Major Factors Influencing Employee Productivity in the KSA Public Construction Projects. Int. J. Civ. Environ. Eng. 2013, 14, 16–20. [Google Scholar]
  43. Makulsawatudom, A.; Emsley, M. Critical factors influencing construction productivity in Thailand. In Proceedings of the 10th International CIB Symposium of the W65 Commission on Organisation and Management of Construction: Construction Innovation and Global Competitiveness, Cincinnati, OH, USA, 9–13 September 2002; pp. 1446–1456. [Google Scholar]
  44. Makulsawatudom, A.; Emsley, M. Factors Affecting the Productivity of the Construction Industry in Thailand: The Foremen’s Perception. In Proceedings of the Construction Research Congress: Wind of Change: Integration and Innovation, Honolulu, HI, USA, 19–21 March 2003; pp. 1–10. [Google Scholar] [CrossRef]
  45. Alaghbari, W.; Al-Sakkaf, A.A.; Sultan, B. Factors affecting construction labour productivity in Yemen. Int. J. Construct. Manag. 2019, 19, 79–91. [Google Scholar] [CrossRef]
  46. Soekiman, A.; Pribadi, K.S.; Soemardi, B.W.; Wirahadikusumah, R.D. Factors Relating to Labor Productivity Affecting the Project Schedule Performance in Indonesia. Procedia Eng. 2011, 14, 865–873. [Google Scholar] [CrossRef]
  47. Qiu, Z. The Research on China’s Current Labor Productivity in Construction Industry and the Influencing Factors. Master’s Thesis, Chongqing University, Chongqing, China, 2012. Available online: http://61.181.120.82:8080/kcms/detail/detail.aspx?filename=1013007884.nh&dbcode=CMFD&dbname=CMFD2013 (accessed on 6 July 2025).
  48. Han Seung, H.; Park Sang, H.; Jin Eui, J.; Kim, H.; Seong Yeon, K. Critical Issues and Possible Solutions for Motivating Foreign Construction Workers. J. Manag. Eng. 2008, 24, 217–226. [Google Scholar] [CrossRef]
  49. Kahneman, D.; Deaton, A. High income improves evaluation of life but not emotional well-being. Proc. Natl. Acad. Sci. USA 2010, 107, 16489–16493. [Google Scholar] [CrossRef]
  50. Krueger, A.B.; Summers, L.H. Efficiency Wages and the Inter-Industry Wage Structure. Econometrica 1988, 56, 259–293. [Google Scholar] [CrossRef]
  51. Yimam, M.H. Impact of training on employees performance: A case study of Bahir Dar university, Ethiopia. Cogent Educ. 2022, 9, 2107301. [Google Scholar] [CrossRef]
  52. Atatsi, E.A.; Stoffers, J.; Kil, A. Factors affecting employee performance: A systematic literature review. J. Adv. Manag. Res. 2019, 16, 329–351. [Google Scholar] [CrossRef]
  53. Johari, S.; Jha Kumar, N. Impact of Work Motivation on Construction Labor Productivity. J. Manag. Eng. 2020, 36, 04020052. [Google Scholar] [CrossRef]
  54. Ichdan, D. The effect of training, work environment, motivation, job satisfaction, and career satisfaction on employee productivity. Ann. Manag. Organ. Res. 2024, 6, 57–69. [Google Scholar] [CrossRef]
  55. Nguyen, L.H. The impact modeling of project management function behaviors on construction labor productivity. Int. J. Product. Perform. Manag. 2022, 71, 2991–3008. [Google Scholar] [CrossRef]
  56. Ghoddousi, P.; Hosseini, M.R.; Pourafshar, O. An Investigation into the Effect of Managers’ Leadership Strategies on the Productivity of Road Construction Workers in Iran. In Proceedings of the 6th International Conference and Workshop on the Built Environment in Developing Countries, Adelaide, Australia, 4 December 2012. [Google Scholar] [CrossRef]
  57. Johari, S.; Jha Kumar, N. Exploring the Relationship between Construction Workers’ Communication Skills and Their Productivity. J. Manag. Eng. 2021, 37, 04021009. [Google Scholar] [CrossRef]
  58. Lee, T.Y.; Ahmad, F.; Sarijari, M.A. Current Status and Future Research Trends of Construction Labor Productivity Monitoring: A Bibliometric Review. Buildings 2023, 13, 1479. [Google Scholar] [CrossRef]
  59. Wong, J.H.; Rashidi, A.; Arashpour, M. Evaluating the Impact of Building Information Modeling on the Labor Productivity of Construction Projects in Malaysia. Buildings 2020, 10, 66. [Google Scholar] [CrossRef]
  60. Rathnayake, A.; Middleton, C. Systematic Review of the Literature on Construction Productivity. J. Constr. Eng. Manag. 2023, 149, 03123005. [Google Scholar] [CrossRef]
  61. Abdul Kadir, M.R.; Lee, W.P.; Jaafar, M.S.; Sapuan, S.M.; Ali, A.A.A. Factors Affecting Construction Labour Productivity for Malaysian Residential Projects. Struct. Surv. 2005, 23, 42–54. [Google Scholar] [CrossRef]
  62. Alinaitwe, H.M.; Mwakali, J.A.; Hansson, B. Factors Affecting the Productivity of Building Craftsmen—Studies of Uganda. J. Civ. Eng. Manag. 2007, 13, 169–176. [Google Scholar] [CrossRef]
  63. Li, X.; Chow, K.H.; Zhu, Y.; Lin, Y. Evaluating the impacts of high-temperature outdoor working environments on construction labor productivity in China: A case study of rebar workers. Build. Environ. 2016, 95, 42–52. [Google Scholar] [CrossRef]
Figure 1. PRISMA flowchart flow diagram of the systematic review.
Buildings 15 02463 g001
Figure 2. Publication trend.
Buildings 15 02463 g002
Figure 3. Forest plot of CF12. The black squares represent the effect size of each sample for CF12, calculated through meta-analysis. The percentage value indicates the weight of each study, and the solid line represents the confidence interval of the effect size. Heterogeneity for CF12 is displayed in the lower left corner of the figure [9,13,14,25,26,27,28,29,30,31,34,35,37,39,40,41,42,45].
Buildings 15 02463 g003
Figure 4. Subgroup analysis for CF12: (a) publication year and (b) research area. Black squares represent the effect size of different journals in the subgroup analysis. The percentage value indicates the weight of each study, and the solid line represents the confidence interval of the effect size [9,13,14,25,26,27,28,29,30,31,34,35,37,39,40,41,42,45].
Buildings 15 02463 g004
Figure 5. Sensitivity analysis of CF12. Black solid circles represent the effect size in the subgroup analysis for different journals, and the solid line represents the confidence interval of the effect size [9,13,14,25,26,27,28,29,30,31,34,35,37,39,40,41,42,45].
Buildings 15 02463 g005
Figure 6. Funnel plot (Trim and Fill) for CF12. The black solid circle represents the standard deviation of different effect sizes, while the hollow circle represents the standard deviation of the data obtained through Trim and Fill.
Buildings 15 02463 g006
Figure 7. The actual ratio of each CF and adjusted ratio through publication bias analysis. (a) Top-ranking CFs with the highest actual and adjusted ratios, (b) Continued CFs ranked by actual and adjusted ratios (middle group), and (c) Remaining CFs with the lowest ratios.
Buildings 15 02463 g007
Table 1. Basic information about the selected literature.
A Literature NumberReferenceSample SizePublication TypePublication YearCountry
1Aghayeva and Ślusarczyk, 2019 [25]300Journal2019Azerbaijan
2Shoar and Banaitis, 2019 [14]15Journal2019Iran
3Jarkas Abdulaziz and Bitar Camille, 2012 [26]157Journal2012Kuwait
4El-Gohary Khaled and Aziz Remon, 2014 [27]489Journal2014Egypt
5Gupta et al., 2018 [15]151Journal2018India
6Gunduz and Abu-Hijleh, 2020 [28]105Journal2020Egypt
7Gurcanli et al., 2021 [29]400Journal2021Turkish
8Vigneshwar and Shanmugapriya, 2023 [9]204Journal2022India
9Milind Mehta et al., 2022 [30]84Journal2022-
10Bierman et al., 2016 [31]40Journal2016South Africa
11Doloi, 2007 [32]100Journal2015Australia
12Kazaz and Ulubeyli, 2007 [33]82Journal2007Turkey
13Jarkas et al., 2015 [34]132Journal2015Oman
14Robles et al., 2014 [13]367Journal2014Spain
15Jarkas et al., 2012 [35]84Journal2014Qatar
16Ohueri et al., 2018 [36]90Journal2018Malaysia
17Ghoddousi et al., 2015 [37]60Journal2014Iran
18Dixit et al., 2018 [38]112Non-periodical2018India
19Sherif et al., 2014 [39]55Journal2014Egypt
20Jarkas, 2015 [40]59Journal2015Bahrain
21Hiyassat et al., 2016 [41]90Journal2016Jordan
22Mahamid et al., 2013 [42]41Journal2013Saudi Arabia
23Arun Makulsawatudom and Emsley, 2002 [43]34Non-periodical2004Thailand
24Arun Makulsawatudom and Emsley, 2012 [44]57Non-periodical2003Thailand
25Alaghbari et al., 2019 [45]91Journal2017Yemen
26Soekiman et al., 2011 [46]63Journal2011Indonesia
27Qiu, 2012 [47]57Non-periodical2012China
Table 2. Category, factor ID, frequency, and a literature number for each CF.
CategoryFactor IDCFFrequencyA Literature Number
C1 Materials and EquipmentCF1Availability of Materials181, 3, 4, 7, 8, 10, 12, 13, 14, 15, 18, 19, 20, 22, 23, 24, 25, 27
CF2Availability of Tools and Equipment171, 2, 3, 6, 7, 8, 10, 14, 15, 16, 20, 21, 22, 23, 24, 25, 27
C2 Project TypeCF3Constructability34, 8, 16
CF4Project Scale44, 14, 22, 25
C3 Work MotivationCF5Worker Satisfaction61, 6, 7, 12, 16, 17
CF6Occupational Security81, 5, 6, 11, 12, 16, 17, 18
CF7Incentive143, 4, 5, 10, 11, 12, 14, 15, 16, 17, 20, 21, 22, 25
CF8Workers’ Work Enthusiasm102, 3, 7, 9, 10, 13, 14, 15, 19, 20
CF9Promotion Opportunities51, 5, 11, 16, 17
CF10Worker Recognition63, 5, 6, 7, 11, 16
C4 Labor-Related FactorsCF11Lack of Labor53, 4, 6, 21, 22
CF12Worker Experience and Skills181, 2, 3, 4, 6, 7, 8, 9, 10, 13, 14, 15, 17, 19, 20, 21, 22, 25
CF13Fatigue92, 3, 6, 7, 10, 13, 15, 19, 20
CF14Worker Age44, 11, 21, 25
CF15Education Level54, 10, 11, 21, 25
CF16Worker Education and Training131, 2, 3, 5, 6, 7, 10, 12, 15, 16, 17, 18, 21
CF17Workers’ Sense of Responsibility41, 12, 16, 17
CF18Worker Absenteeism96, 7, 10, 18, 22, 23, 24, 25, 26
CF19Crew Size and Composition101, 3, 6, 7, 10, 12, 13, 18, 19, 20
CF20Wage Level81, 5, 7, 12, 17, 22, 25.27
CF21Delay in Payments131, 2, 3, 6, 7, 8, 12, 13, 14, 15, 17, 19, 20
CF22Overtime131, 2, 3, 4, 6, 12, 13, 14, 15, 19, 20, 23, 25
CF23Workload44, 7, 24, 25
C5 Site ManagementCF24Clarity of Instructions and Communication on the Site34, 25, 26
CF25Incompetent Supervisors181, 2, 3, 4, 6, 7, 8, 12, 13, 14, 15, 16, 20, 22, 23, 24, 25, 26
CF26Construction Managers’ Lack of Leadership151, 2, 3, 4, 6, 10, 12, 15, 16, 17, 18, 19, 22, 24, 27
CF27Unsuitability of Storage Location83, 6, 14, 15, 18, 19, 22, 26
CF28Lack of Transportation63, 5, 7, 11, 15, 20
CF29Site Layout102, 3, 8, 10, 12, 13, 19, 20, 23, 24
CF30Distance to Construction Site41, 4, 12, 14
CF31Interference63, 6, 7, 20, 23, 24
CF32Interrupt54, 7, 8, 12, 25
CF33Inspection153, 6, 8, 9, 10, 13, 15, 17, 18, 19, 20, 22, 23, 24, 26
CF34Quality of Site Management37, 8, 21
CF35Competition412, 17, 21, 25
C6 StakeholdersCF36Delay in Responding to “Requests for Information”63, 6, 10, 13, 15, 20
CF37Cooperation of Participants91, 3, 7, 9, 13, 14, 15, 19, 20
CF38Lack of Communication181, 2, 3, 6, 7, 9, 10, 13, 14, 15, 17, 18, 20, 21, 22, 23, 24, 27
CF39Periodical Report and Share Problem43, 6, 17, 18
CF40Workers’ Participation in Decision Making31, 12, 17
CF41Proportion of Work Subcontracted73, 6, 10, 15, 19, 20, 27
C7 Macro FactorsCF42Politics36, 25, 27
CF43Economy62, 4, 8, 9, 10, 25
CF44Cultural31, 8, 12
C8 Climatic ConditionsCF45Weather Condition112, 4, 6, 8, 12, 13, 17, 20, 21, 23, 24
CF46Temperature63, 10, 14, 15, 19, 25
CF47Humidity43, 14, 15, 19
CF48Wind53, 10, 14, 15, 19
CF49Rain53, 10, 14, 15, 19
C9 Techniques and MethodsCF50Utilizing Advanced Techniques and Technology58, 17, 21, 25, 27
CF51Method of Construction122, 3, 4, 6, 7, 8, 13, 14, 15, 18, 19, 20
CF52Design Complexity73, 12, 13, 14, 15, 19, 20
CF53Sequencing Problems63, 7, 13, 15, 20, 21
CF54Clarity of Technical Specification92, 3, 6, 13, 15, 19, 20, 23, 24
C10 Schedule Planning and ReworkCF55Unrealistic Schedule102, 3, 7, 9, 13, 14, 19, 20, 22, 26
CF56Rework162, 3, 6, 7, 10, 13, 14, 15, 17, 18, 19, 20, 22, 23, 24, 27
CF57Lack of Planning67, 8, 10, 14, 18, 25
CF58Change Orders162, 3, 6, 7, 8, 10, 13, 15, 18, 19, 20, 22, 23, 24, 26, 27
C11 Site Working ConditionsCF59Safe Working Conditions57, 9, 12, 16, 17
CF60Interpersonal Relationship61, 12, 16, 17, 22, 25
CF61Unforeseen Ground Conditions36, 13, 20
CF62Site Congestion143, 4, 5, 7, 9, 10, 12, 13, 14, 15, 17, 20, 23, 24
CF63Confinement of Working Space73, 13, 14, 15, 18, 20, 22
CF64Site Restricted Access33, 15, 19
CF65Safety Accidents93, 7, 10, 13, 19, 20, 23, 24, 27
C12 Social WelfareCF66Social Health and Insurance44, 5, 12, 25
C1: Factors related to the availability of materials and equipment during the construction process; C2: Productivity variations arising from the inherent characteristics of construction projects.; C3: Psychological factors that can affect workers’ subjective initiative and task engagement levels; C4: Workers’ inherent characteristics that directly influence productivity outcomes; C5: Decisive factors determining the organizational effectiveness of construction site management.; C6: Factors associated with multi-party coordination impacting project progression; C7: External socioeconomic conditions indirectly affecting construction system productivity; C8: Physical constraints imposed by natural environmental conditions on productivity; C9: Efficiency drivers brought about by engineering technology solutions and process selection; C10: Productivity losses caused by deficiencies in schedule planning and execution; C11: The physical environmental factors that directly affect on-site operations, including congestion and safety conditions; C12: Factors related to the completeness of workers’ social security provisions.
Disclaimer/Publisher’s Note: The statements, opinions and data contained in all publications are solely those of the individual author(s) and contributor(s) and not of MDPI and/or the editor(s). MDPI and/or the editor(s) disclaim responsibility for any injury to people or property resulting from any ideas, methods, instructions or products referred to in the content.

