Article

Comparative Study on Outdoor Heatwave Indicators for Indoor Overheating Evaluation

1
School of Environment and Energy Engineering, Beijing University of Civil Engineering and Architecture, Beijing 100044, China
2
School of Architecture, Tsinghua University, Beijing 100084, China
*
Author to whom correspondence should be addressed.
Buildings 2025, 15(14), 2461; https://doi.org/10.3390/buildings15142461
Submission received: 15 May 2025 / Revised: 7 July 2025 / Accepted: 11 July 2025 / Published: 14 July 2025
(This article belongs to the Section Building Energy, Physics, Environment, and Systems)

Abstract

With increasing global climate change, extreme weather threats to indoor environments are growing. Heatwave events provide essential data for building thermal resilience analysis. However, existing heatwave definition indicators vary widely and lack standardized criteria. To more accurately evaluate indoor overheating risks, this study compared indoor overheating responses under different heatwave definition indicators, considering the temporal disconnect between indoor and outdoor heat conditions. Focusing on Beijing, this study established an indoor–outdoor coupled heatwave evaluation framework using 1951–2021 meteorological data and the heat index as an overheating metric. By analyzing indoor overheating degree and overlap degree to characterize indoor–outdoor correlations, we concluded that different definitions of heatwaves lead to variations in identifications, while multidimensional indicators better capture extreme events. Heatwaves with prolonged duration and high intensity pose greater health risks. Although Beijing’s indoor thermal conditions are generally safe, peak heat indices during summer heatwaves exceed danger thresholds in some buildings, highlighting thermal safety concerns. The metrics for heatwave 6 and heatwave 7 optimally integrate indoor–outdoor characteristics with higher thresholds identifying more extreme events. These findings support the design of building thermal resilience, overheating early warnings, and climate-adaptive electrification strategies.

1. Introduction

The continuous intensification of global climate change is increasingly manifesting and expanding its impacts on ecosystems and human society. Research by the Intergovernmental Panel on Climate Change (IPCC) of the United Nations shows that compared with the period of the Industrial Revolution, the global surface temperature from 2011 to 2020 has increased by 1.1 °C, and it is projected to rise by 1.5 °C to 2 °C or more by the end of this century [1]. Global warming has led to a significant increase in the frequency, intensity, and duration of extreme meteorological events. Data from the World Meteorological Organization indicate that from 1970 to 2021, nearly 12,000 extreme weather, climate, and water disaster events occurred globally, resulting in the death of over 2 million people and economic losses of USD 4.3 trillion [2]. The frequent occurrence of extreme events such as heatwaves, cold waves, rainstorms, and floods poses a serious threat to the safety of infrastructure and public health.
China has a complex and diverse range of climate types. Driven by the rapid processes of urbanization and industrialization, the impacts of climate change have become increasingly prominent. Between 1961 and 2023, the annual average surface temperature in China increased by 0.30 °C per decade, which is higher than the global average temperature rise during the same period [3]. At the same time, extreme weather events have become more frequent and intense, with an increase in the frequency of extreme high-temperature and extreme heavy precipitation events. The China Climate Change Blue Book [3] shows that since 1961, the frequency of extreme high-temperature events in China has significantly increased, and there are obvious characteristics of periodic changes, with a marked increase since the beginning of the 21st century. In the future, against the backdrop of climate change, the frequency and intensity of extreme meteorological events such as extreme high temperatures in China are likely to be further exacerbated.
Against the backdrop of global warming, extreme weather events such as heatwaves and cold waves pose an increasingly prominent threat to the building environment, which is manifested in two aspects. First, there is a threat to health and safety. Extreme climate events pose a direct threat to the health and safety of occupants, especially vulnerable groups such as the elderly, children, and patients with chronic diseases. An extremely hot environment can lead to heat stress, cardiovascular diseases, and even death. According to the findings of the “The Lancet Countdown on Health and Climate Change 2023 Report” [4], the number of deaths of the elderly aged 65 and above due to heatwaves globally in 2022 increased by 85% compared to the 1990s, and it is projected to increase to 43% by the middle of this century. Secondly, there is an increase in the load on the energy system. Extreme temperature events such as high-temperature heatwaves and low-temperature cold waves will significantly increase the load on building energy systems such as air conditioners, leading to a surge in energy demand and a tight electricity supply, and increasing the risk of power outages [5]. For example, during the heatwave in North America in 2021, the power grids in many places collapsed due to overload operation, and millions of residents lost their power supply in the extreme heat. In the summer of 2022, many places in China were hit by continuous high-temperature weather, resulting in a surge in electricity demand, and power rationing measures were implemented in some areas. Among them, due to the peak electricity consumption caused by high temperatures and the decrease in hydropower generation in Sichuan Province, it was decided to extend the industrial power rationing measures originally scheduled to be lifted on August 20th for another 5 days until August 25th, and a Level I emergency response for energy supply security during emergencies was activated. Chongqing also implemented power rationing measures, reducing public lighting and suspending the use of landscape lighting to alleviate the tight electricity situation. Extreme temperature events may lead to power grid outages or a spike in energy prices, making it difficult to maintain a comfortable indoor environment. Therefore, considering the huge impacts of extreme climate events on human health, lives, and the economy, as well as the continuous increase in the intensity and severity of extreme temperature events [6], there is an urgent need to enhance the ability of buildings to respond to and adapt to extreme climate events.
To tackle climate change, building thermal resilience has become a crucial focus. It aims to strengthen buildings’ capacity to maintain indoor thermal stability and functionality during extreme weather through comprehensive strategies. Evaluating strategies and technologies for enhancing thermal resilience via dynamic building performance simulation [7] offers policymakers and industry practitioners scientific guidance, technical evaluation systems, and policy recommendation frameworks [8], which are vital for ensuring building safety, occupant health, and industry decarbonization. However, accurate analysis of building thermal resilience under extreme temperature events relies on precise meteorological data. Currently, there is no unified standard definition for extreme temperature events like heatwaves and cold waves [9]. For example, the China Meteorological Administration defines a high-temperature day as one with a maximum temperature of ≥35 °C and three or more consecutive such days as a high-temperature heatwave event [10]. Ouzeau et al. [11] proposed criteria based on outdoor temperature and three heatwave indicators: duration, maximum temperature, and overall intensity. Heo et al. [12] defined heatwaves using globe temperature from a thermal comfort perspective. In general, definitions of extreme temperature events vary widely, from single-parameter metrics to multi-factor indices, with significant threshold differences that complicate the accurate identification of hazardous conditions. Thus, clear definitions and reliable data on extreme weather events are fundamental to building thermal resilience research.
Many researchers have conducted comparative studies on heatwave evaluation methods, threshold determination, and duration across different cities. Chang et al. [13] integrated urban heatwave risk evaluation methods from 2007 to 2024, constructing a “hazard–exposure–vulnerability–adaptability” framework using bibliometric analysis and multi-criteria evaluation to achieve high-resolution risk assessment. Cheng et al. [14] conducted a case study in southwestern China, employing 30-m resolution data combined with absolute and relative thresholds to analyze the spatiotemporal characteristics of compound daytime–nighttime heatwaves, while also assessing regional disparities in urbanization impacts. Xu et al. [15] demonstrated through correlation analysis that the 97th percentile temperature serves as a robust threshold for most health-related heatwave events, based on temperature observations, heatwave duration, and morbidity data. Sun et al. [16] calculated localized heatwave indicators for Ningbo in accordance with national standards, using the city’s climatic data, and validated their correlation with mortality using intercity comparisons. Zhang et al. [17] employed multiple thresholds and comprehensive indicators derived from national meteorological data to analyze the spatiotemporal characteristics of extreme high temperatures, providing a scientific foundation for large-scale climate adaptation planning.
It is worth noting that although numerous heatwave indicators have been developed and evaluated in existing studies, most studies focus on assessing single indicators based on varying thresholds and durations, lacking a comprehensive analysis for different indicators. Moreover, these studies primarily examine outdoor heatwaves, with limited exploration of how these indictors perform in assessing indoor overheating risks. In the evaluation system of building thermal resilience, indoor overheating is undoubtedly a key focus. In fact, indoor temperature fluctuations are the result of the combined influence of various factors, including building performance, ventilation conditions, and air-conditioning usage [18]. The occurrence of indoor overheating is not synchronized with outdoor heatwaves, and significant differences exist in both timing and intensity [19]. In light of this, it is essential to prioritize indoor overheating assessment as the core concern and conduct in-depth comparative analyses of different outdoor heatwave indices. Specifically, by comparing the indoor overheating responses under different heatwave indices, we can accurately determine which indices are more effective in predicting indoor overheating risks in buildings. The optimal heatwave index ultimately selected should be capable of accurately identifying heatwave events that reflect indoor overheating risks. This will provide a robust basis for the climate-adaptive design of buildings, enhance their thermal resilience and environmental adaptability in variable climate conditions, and ensure that buildings can better withstand various climate challenges.
Based on the above analysis, this study will construct a comprehensive evaluation system of heatwaves that couples the indoor and outdoor environments. Different from traditional studies that mostly focus on the outdoor environment, this study takes the indoor overheating phenomenon as the research core, aiming to accurately screen out the heatwave definition indicators applicable to the indoor thermal environment and to provide new perspectives and methods for research on the building thermal environment.

2. Methodology

2.1. Overview

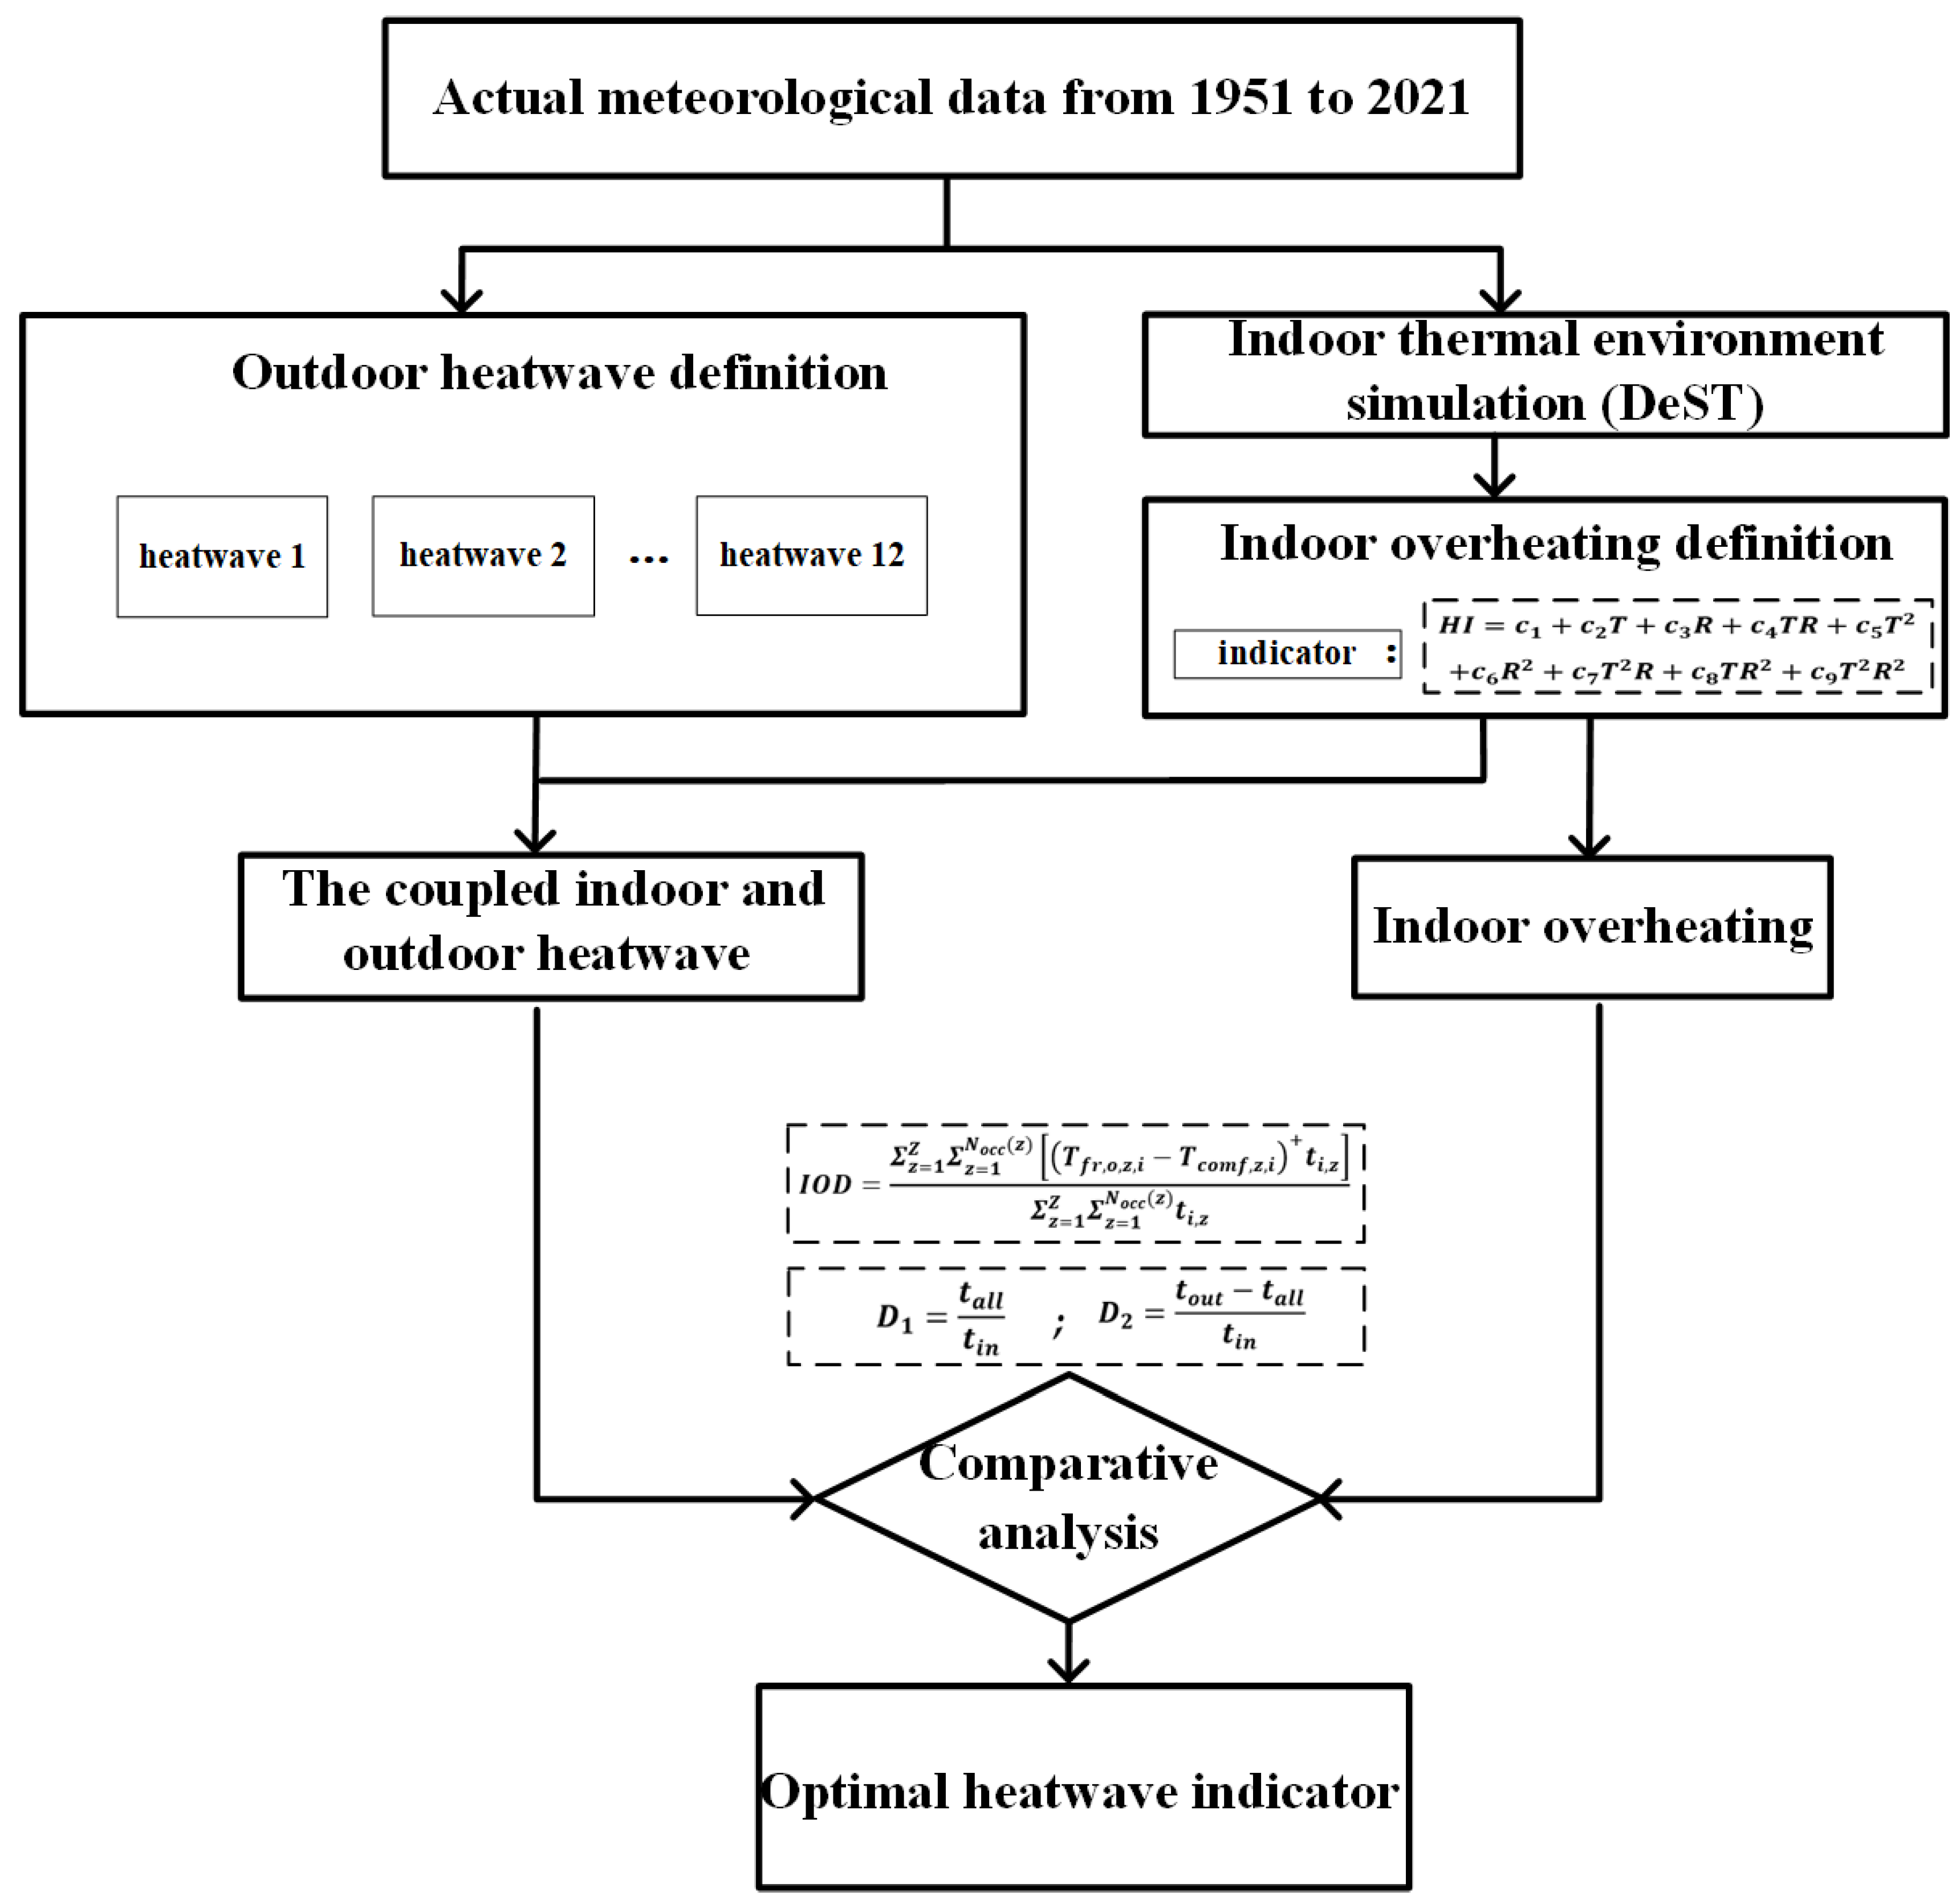
Figure 1 shows the technical framework of this study. To define heatwave events more precisely, it is necessary to adjust or construct suitable heatwave definition indicators based on local climate characteristics, long-term historical meteorological data, and residents’ thermal comfort preferences. Taking the Beijing area as the research object, this study aims to provide a scientific basis and methodological reference for regional heatwave assessment by conducting a comparative analysis of the effectiveness of multiple indices in detecting heatwaves. It should be noted that the method adopted in this study is correlation analysis rather than causal analysis, so the conclusions drawn can only indicate the correlation between variables. In this research, multiple outdoor heatwave definition indicators are first selected. According to these indicators, outdoor heatwave events are screened, and heatwaves are classified. At the same time, the HI is selected as the evaluation indicator for indoor overheating to further determine the indoor overheating periods. Subsequently, in order to determine the outdoor indicators that can highlight indoor overheating, starting from the coupling situation of indoor and outdoor heatwaves, the degree to which each indicator reflects the indoor overheating situation is considered, and an indoor–outdoor coupled heatwave evaluation system is constructed. The outdoor heatwave definition indicators that can best reflect indoor overheating are screened out from this system, aiming to provide support for early warnings of indoor overheating based on the outdoor heatwave situation.
As shown in Figure 2, this study establishes a comprehensive workflow with Beijing as the research object. Based on the 71 years of long-term meteorological data for Beijing, this study employs DeST 3.0 software to conduct dynamic simulation of the indoor environment and conducts quantitative analysis with visual representation of outdoor heatwaves detected under different definition standards. These analyses incorporate multi-dimensional indicators including heatwave intensity, duration, and occurrence frequency. At the same time, taking the heat index (HI) as the evaluation indicator, it analyzes the distribution characteristics of the indoor thermal environment over 71 years. Finally, through the analysis of indoor overheating degree (IOD) and the coincidence degree between indoor and outdoor heatwave events, the study develops a coupled evaluation model for composite heatwaves. This model enables comprehensive evaluation of building thermal environment risks.

2.2. Definition and Metrics

2.2.1. Definition and Classification of Outdoor Heatwaves

  • Definition of outdoor heatwaves
To systematically evaluate the applicability and differences of various heatwave representation methods, this study conducts a comprehensive review of the heatwave index systems discussed in the existing literature. From the dimensions of single temperature thresholds and comprehensive indices, 12 outdoor heatwave indices are integrated (Table 1 and Table 2). The study conducted specific calculations and screening of heatwave events by referring to the definitions and calculation formulas of heatwaves in the table.
Here, Tw1 is the wet-bulb temperature (°C); Ta is the air temperature (°C); RH is the relative humidity (%); Tw2 is the wet-bulb globe temperature (°C); P is the standard atmospheric pressure (101.3 kPa); es is saturated vapor pressure (Pa); Er is the thermal stress index; Tz is outdoor comprehensive air temperature (°C); a is the absorptivity of the outer surface of the building envelope to solar radiation (take 0.48); I is the solar irradiance (W/m2); αout is the convective heat transfer coefficient of the outer surface of the building envelope (W/(m2·°C)), which takes the value of 19; HI is heat index (°C); Tw3 is approximate globe temperature (°C); SR is the solar radiation intensity (kW/m2); and WS is the wind speed (m/s).
  • Classification of outdoor heatwaves
To conduct an in-depth analysis of the characteristics of heatwave events defined by different heatwave indicators, we have classified heatwave events. In this study, the characteristics of heatwaves are reflected by their duration and intensity [28]. Specifically, the duration refers to the number of days during which the heatwave persists. The intensity of a heatwave event is calculated in a specific way, that is, the ratio of the sum of degree-hours when the hourly air temperature is higher than the threshold value to the duration, as shown in Equation (1) [29]. By comprehensively considering these two key indicators, namely duration and intensity, the risks posed by heatwave events can be evaluated more scientifically. This, in turn, provides a solid and crucial basis for formulating effective and targeted response strategies.
i n t e n i s t y = i = 1 N T o u t , i T t h r e s h o l d + N
Here, T o u t , i is the outdoor air temperature (°C); T t h r e s h o l d is the upper limit of the temperature (°C), and the outdoor temperature threshold is adjusted according to the definition of the heatwave; and N   is the number of hours during which the outdoor air temperature exceeds the threshold (h).
Heatwaves are classified based on two key characteristics: duration and intensity. Although severity is also an important characteristic for characterizing heatwave events, since it is actually the combined result of duration and intensity, it has not been included in the scope of independent consideration in this heatwave classification. The thresholds for duration and intensity are determined to divide them into normal and extreme levels. Each characteristic has two possible levels. According to the principle of permutation and combination, a total of four types of heatwaves can be generated. This section refers to the classification method of Liu et al. [30] and selects the median of the duration and intensity data as the threshold to classify the types of heatwaves. Based on the above classification method, heatwaves can be divided into four categories according to duration and intensity, namely short-moderate (HM_S_M), short-intense (HM_S_I), long-moderate (HM_L_M), and long-intense heatwaves (HM_L_I).

2.2.2. Definition of Indoor Overheating

In high-temp and high-humidity environments, the human body often feels discomfort related to both temperature and humidity increases. The HI, an indicator for heat stress risk evaluation, has been used by the National Weather Service for heat safety assessment since 1979 and is an important reference for the Occupational Safety and Health Administration (OSHA) [31]. The HI is easy to calculate and can accurately reflect the impact of such environments on human health. It is commonly used for outdoor human heat stress assessment and has been adopted by institutions like the National Oceanic and Atmospheric Administration (NOAA), the World Health Organization, and OSHA [32,33]. Also, because the conditions it targets, namely, shade and gentle breeze, are similar to indoor environments, it has been used to evaluate indoor environments in previous studies [34,35]. Therefore, this study selects the HI as the resilience performance indicator for evaluating human health risks under indoor high-temperature and high-humidity conditions and the indicator for defining indoor overheating situations.
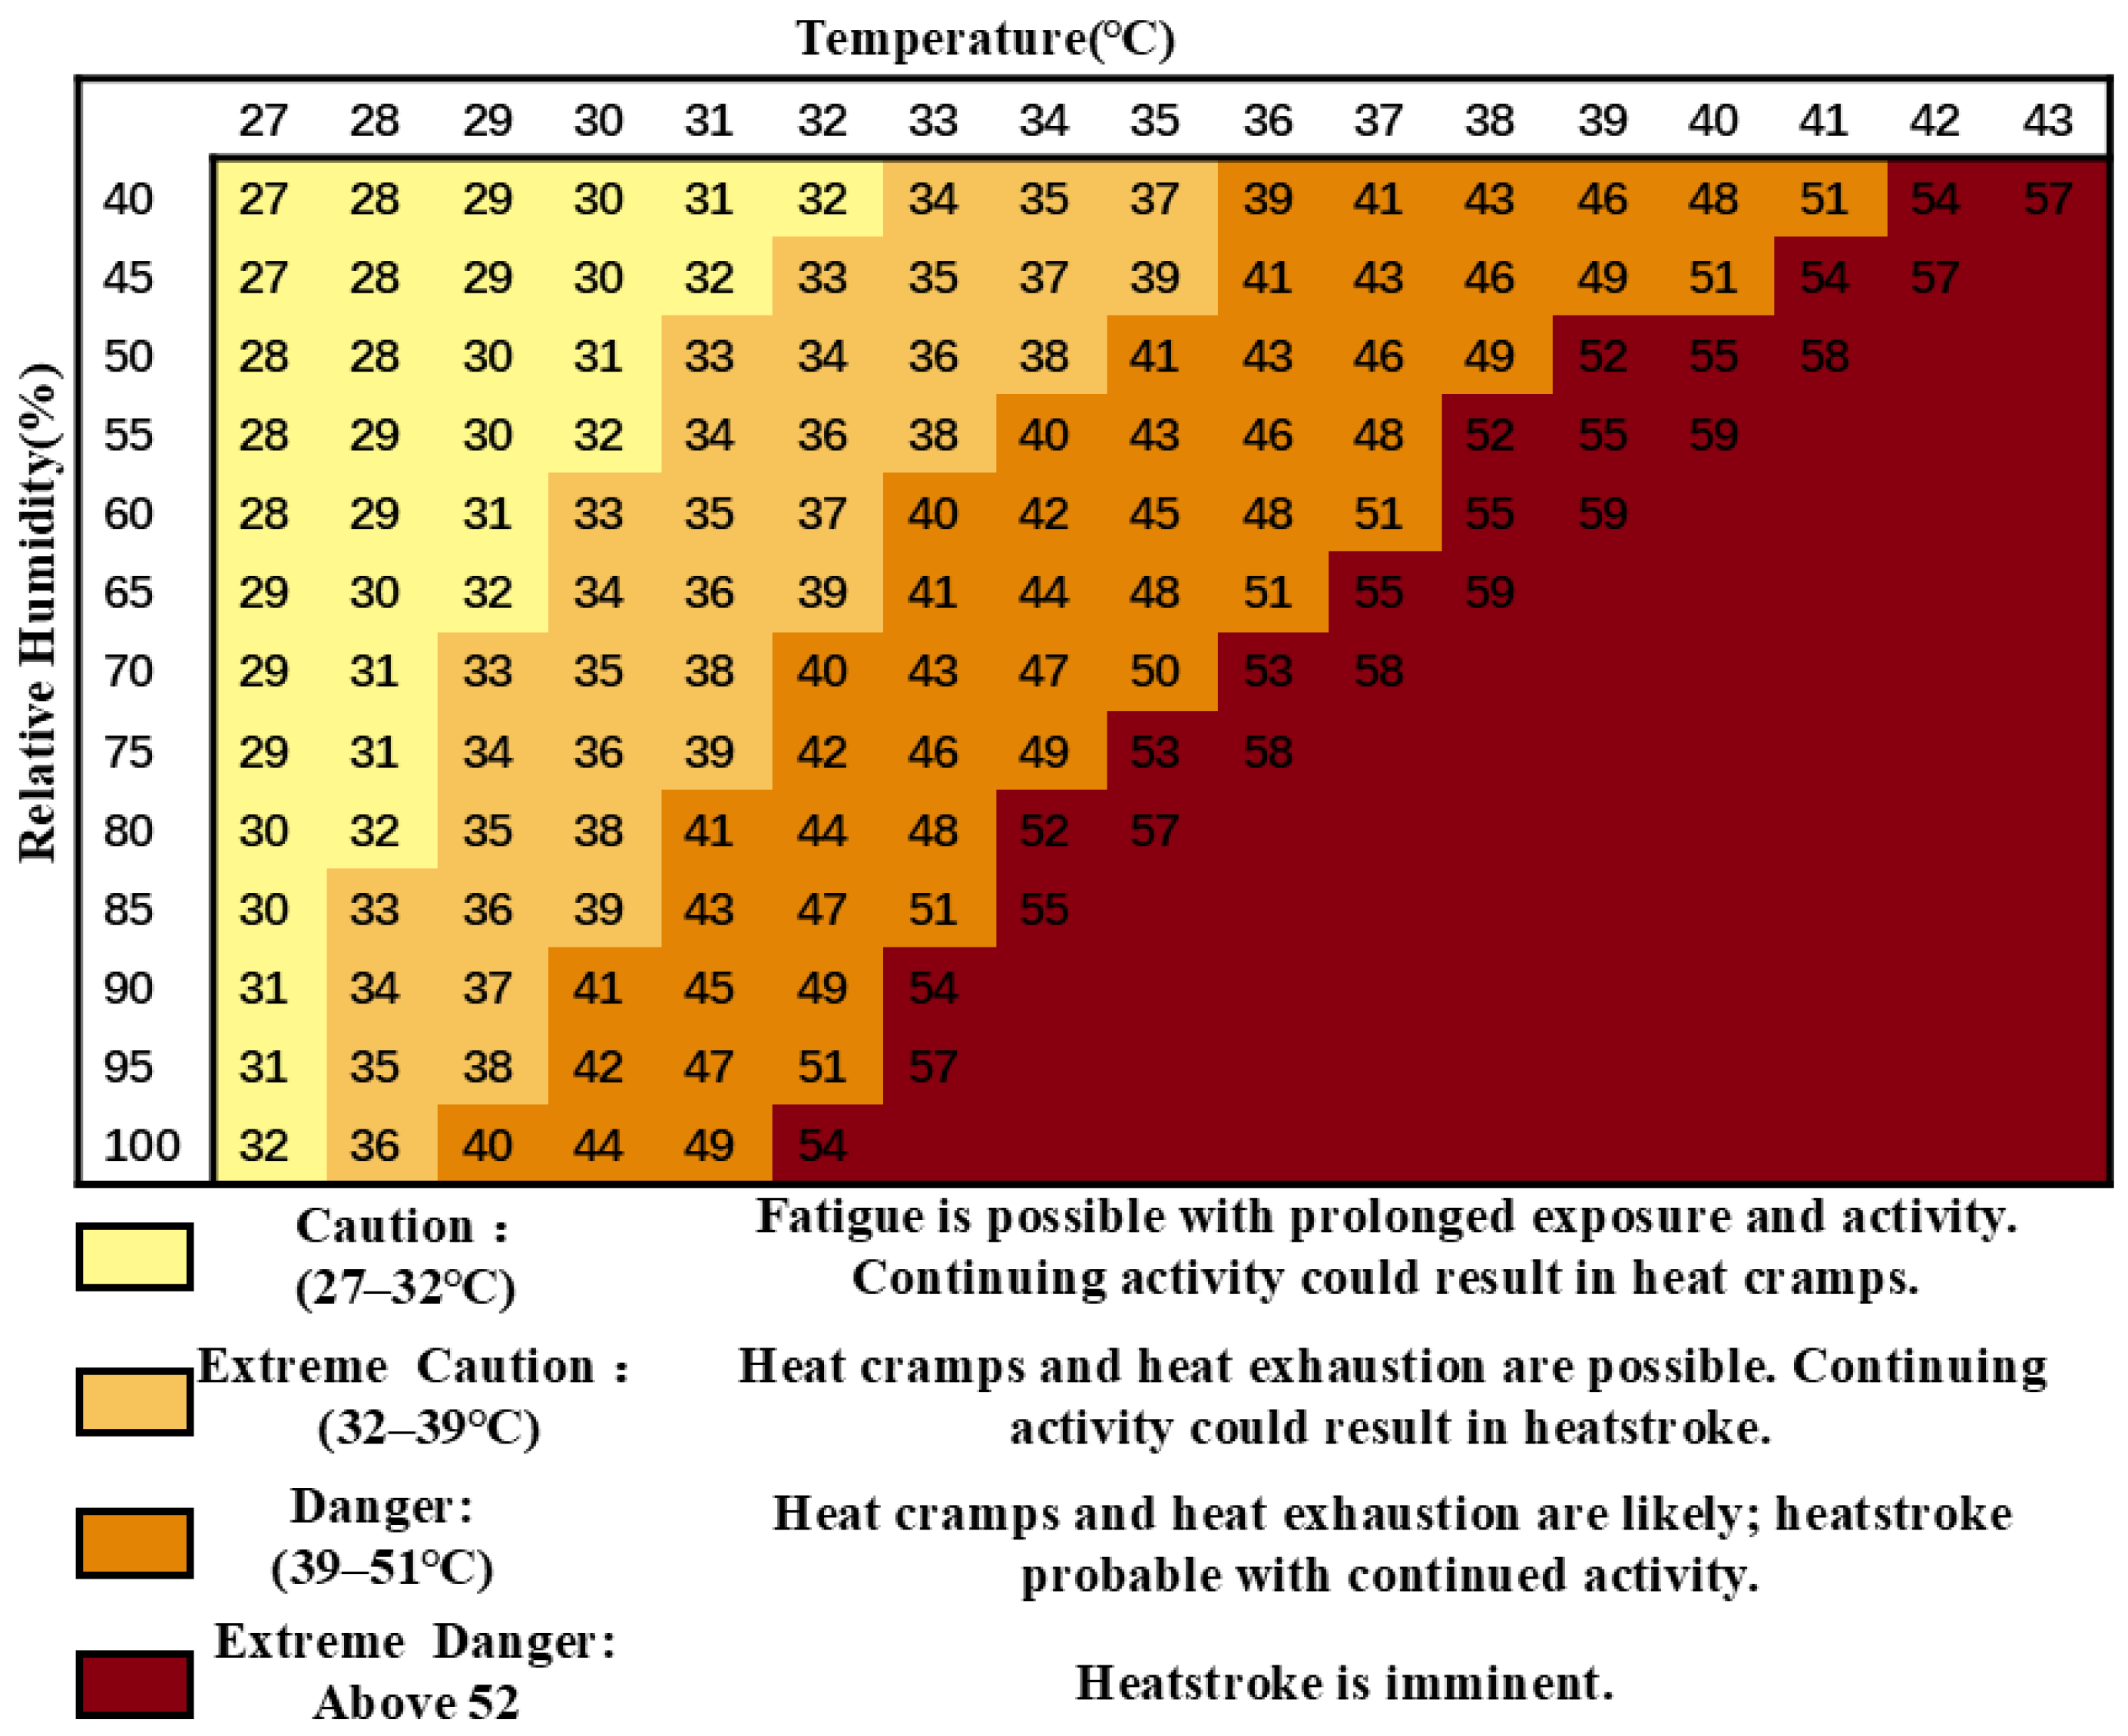
As detailed in Figure 3, the four levels of heat hazards and their corresponding HI ranges are listed. The HI, also known as the apparent temperature, reflects the equivalent temperature perceived by the human body in a shaded environment by comprehensively considering the air temperature and relative humidity [36]. The human body’s thermoregulation mainly relies on the sweating mechanism, and the HI can intuitively reflect the comprehensive impact of high-temperature and high-humidity environments on human thermal comfort. In China, especially in southern regions, the combination of high temperatures and high humidity in summer significantly increases the risk of heat stress. Therefore, the HI has important application value in assessing the impact of such weather on human health. Through the scientific calculation of the HI, high-temperature early warnings and protective measures can be developed more effectively, thereby reducing the potential threat of extreme weather to public health.
The following Equation (2) approximates the HI in °C to within 0.7 °C. The coefficient values for the HI calculation formula in the formula are presented in Table 3 [26]. It is the result of a multi-parameter fit of the human body model (temperature equal to or greater than 26.7 °C and relative humidity equal to or greater than 40%).
H I = c 1 + c 2 T + c 3 R + c 4 T R + c 5 T 2 + c 6 R 2 + c 7 T 2 R + c 8 T R 2 + c 9 T 2 R 2
where, T is the indoor temperature (°C); R is the relative humidity (%).

2.2.3. Evaluation of Outdoor Heatwaves Based on Indoor Overheating

For households without air conditioning or during heatwave-induced power outages, accurately predicting indoor overheating is critical for resident health. With increasing heatwave frequency, using outdoor conditions to forecast indoor thermal risks has become essential. However, the multitude of outdoor heatwave indicators makes it challenging to identify which reliably predicts concurrent indoor overheating. This study therefore develops an indoor–outdoor coupled evaluation system, employing overlap degree and IOD to identify effective outdoor indicators, providing a scientific basis for heatwave-based indoor overheating warnings.
  • Overlap degree
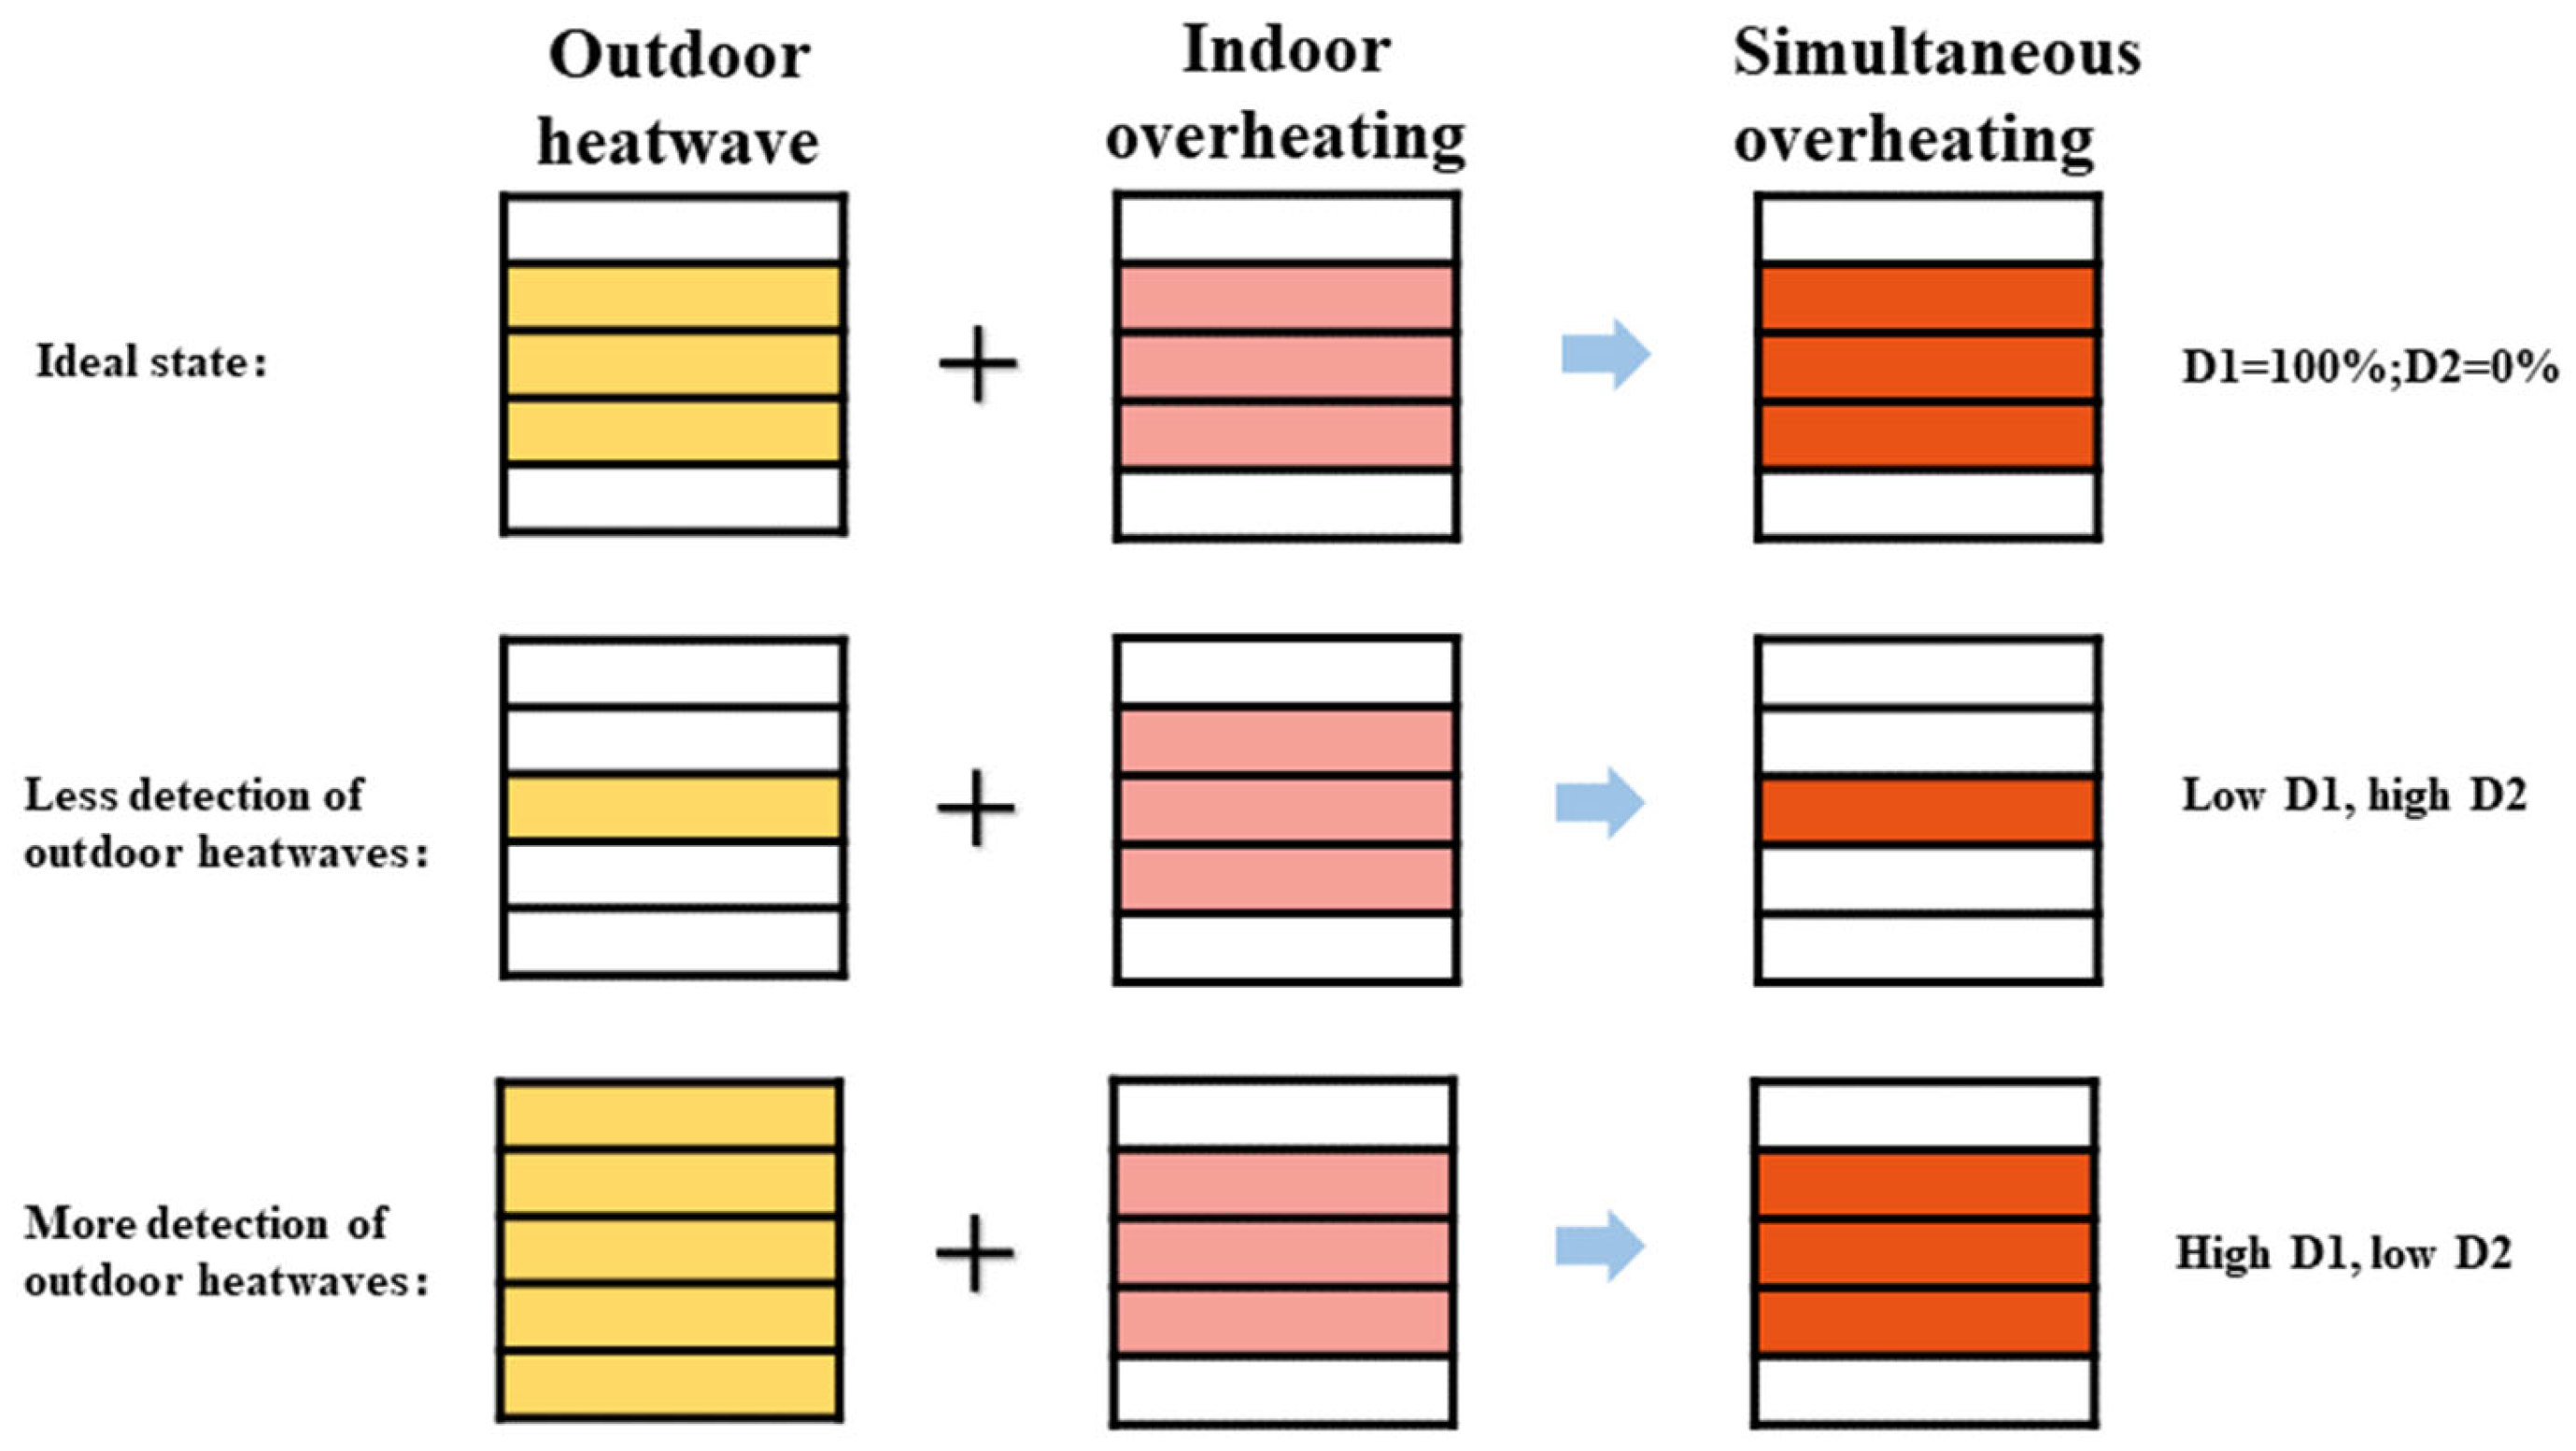
As shown in Figure 4, the screening of outdoor heatwave definition indicators in this study follows the following logic: if the selected outdoor overheating periods are too few, they will fail to cover all indoor overheating periods; if the selected outdoor overheating periods are too many, although they can completely cover indoor overheating situations, it is obviously contrary to the actual scenario to determine all periods as heatwave periods. An ideal indicator should strike a balance between the two, ensuring a high degree of consistency between outdoor heatwave periods and indoor overheating periods, while avoiding judgment deviations caused by excessive detection.
To deeply explore the correlation characteristics between indoor and outdoor overheating situations, this section proposes an overlap degree analysis method. The study aims to accurately quantify the overlap degree of indoor and outdoor overheating. Two key indicators are introduced: Overlap Degree 1 (D1) and Overlap Degree 2 (D2). Overlap Degree 1 (D1) is obtained by calculating the ratio of the simultaneous overheating period to the indoor overheating period. This indicator can intuitively show the proportion of the situation where indoor and outdoor overheating occur simultaneously within the scope of indoor overheating. The higher the ratio is, the higher the overlap degree of indoor and outdoor overheating during the indoor overheating period. The Overlap Degree 2 (D2) focuses on the ratio of the period of independent outdoor overheating to the period of simultaneous overheating. This indicator is used to measure the proportion of the period of independent outdoor overheating. The lower the value is, it indirectly reflects that the degree of overlap between indoor and outdoor overheating is relatively higher. The specific calculation process is shown in Equations (3) and (4).
D 1 = t a l l t i n
D 2 = t o u t t a l l t i n
Here, t a l l is the simultaneous overheating period (h); t o u t is the outdoor overheating period (h); and t i n is the indoor overheating period (h).
  • Indoor overheating degree
To accurately assess the indoor overheating risk, the study adopts the IOD, a comprehensive evaluation index proposed by Hamdy et al. [38]. This index not only takes into account the absolute level of indoor temperature but also comprehensively evaluates the duration characteristics of overheating phenomena, thus enabling a comprehensive quantification of the overheating risk. At the methodological level, the IOD index innovatively introduces a multi-zone evaluation system. This system can flexibly adapt to different thermal comfort evaluation models, including the traditional Predicted Mean Vote (PMV)/Predicted Percentage of Dissatisfied (PPD) model and more adaptable thermal comfort models. At the same time, this method fully considers the functional zoning characteristics of building spaces. By introducing comfort category parameters, it can accurately evaluate the differential thermal comfort requirements of different functional areas. It is particularly noteworthy that this evaluation system fully considers the actual usage of building spaces during the calculation process. By introducing the zone occupancy rate parameter, it effectively differentiates the impact differences of occupied and unoccupied areas on the overall overheating assessment results. In the specific calculation process, as shown in Equation (5), this method adopts a calculation strategy of positive temperature difference accumulation, where only the positive temperature differences exceeding the comfort temperature threshold are accumulated. This treatment effectively avoids the interference of negative temperature differences on the assessment results, ensuring the scientific validity and accuracy of the assessment results.
I O D = Σ z = 1 Z Σ z = 1 N o c c ( z ) T f r , o , z , i T c o m f , z , i + t i , z Σ z = 1 Z Σ z = 1 N o c c ( z ) t i , z
Here, Z represents the building zone; z is the total number of building zones; t is the time step (h); i is the occupancy time count; N o c c z is the total occupied hours within a given calculation period (h); T f r , o , z , i is the free-running indoor operative temperature at time step i in zone z (°C); and T c o m f , z , i is the comfort temperature threshold at time step i in zone z (°C).
In this study, all master bedrooms, children’s rooms, living rooms, and studies were selected for the simulation of the indoor environment. According to the adaptive comfort model of the ISO 17772 standard [39], the indoor operative temperature of a free-running building without a mechanical cooling system is related to the average outdoor operative temperature. For a naturally ventilated building in the free-running mode, the adaptive comfort temperature threshold determined by ISO 17772-1 Class II can be calculated using the following equation:
T c o m f = 0.33 × T r + 21.8
T r = 1 α × α T e d 2 + α 2 T e d 3 +
where T e d i is the daily average outdoor air temperature on the i -th day of the previous day (°C), and α is set to 0.8.

3. Case Study

3.1. Meteorological Data

3.1.1. Acquisition of Meteorological Data

This study employed the Actual Meteorological Year (AMY) dataset from Beijing for analysis. Beijing, China’s capital city, is located in the country’s cold climate zone and features distinct seasonal variations with frigid winters and hot summers. The meteorological data for Beijing in this study were obtained from the Beijing Station (Station ID: 54511), a National Baseline Meteorological Station of the China Meteorological Administration. It is located in Beijing’s southern suburbs, with a geographic coordinate of 116°28′ E, 39°48′ N and an altitude of 31.3 m. The station is surrounded by low-density development, so its observation data are slightly affected by the urban heat island effect. As the longest continuously operating surface meteorological observatory in China since 1912, it has systematically recorded surface meteorological and radiation data with high reliability. Surface observation accuracy has notably improved since 1993, with recording frequencies increasing from four daily intervals (02:00, 08:00, 14:00, 20:00) to hourly or even sub-minute intervals. Radiation measurements, previously logged daily, now follow an hourly recording schedule. In collaboration with the Beijing Meteorological Administration, we curated a 71-year (1951–2021) AMY dataset encompassing surface meteorological variables (air temperature, relative humidity, wind speed/direction, surface temperature, atmospheric pressure) and radiation metrics (horizontal plane total radiation, direct normal radiation). Adopting the data processing protocol proposed by Cui et al. [40], we generated hourly AMY data suitable for DeST 3.0 software. All meteorological records were standardized according to DeST 3.0’s weather file format requirements, ensuring seamless integration into the simulation framework.

3.1.2. Analysis of Meteorological Data

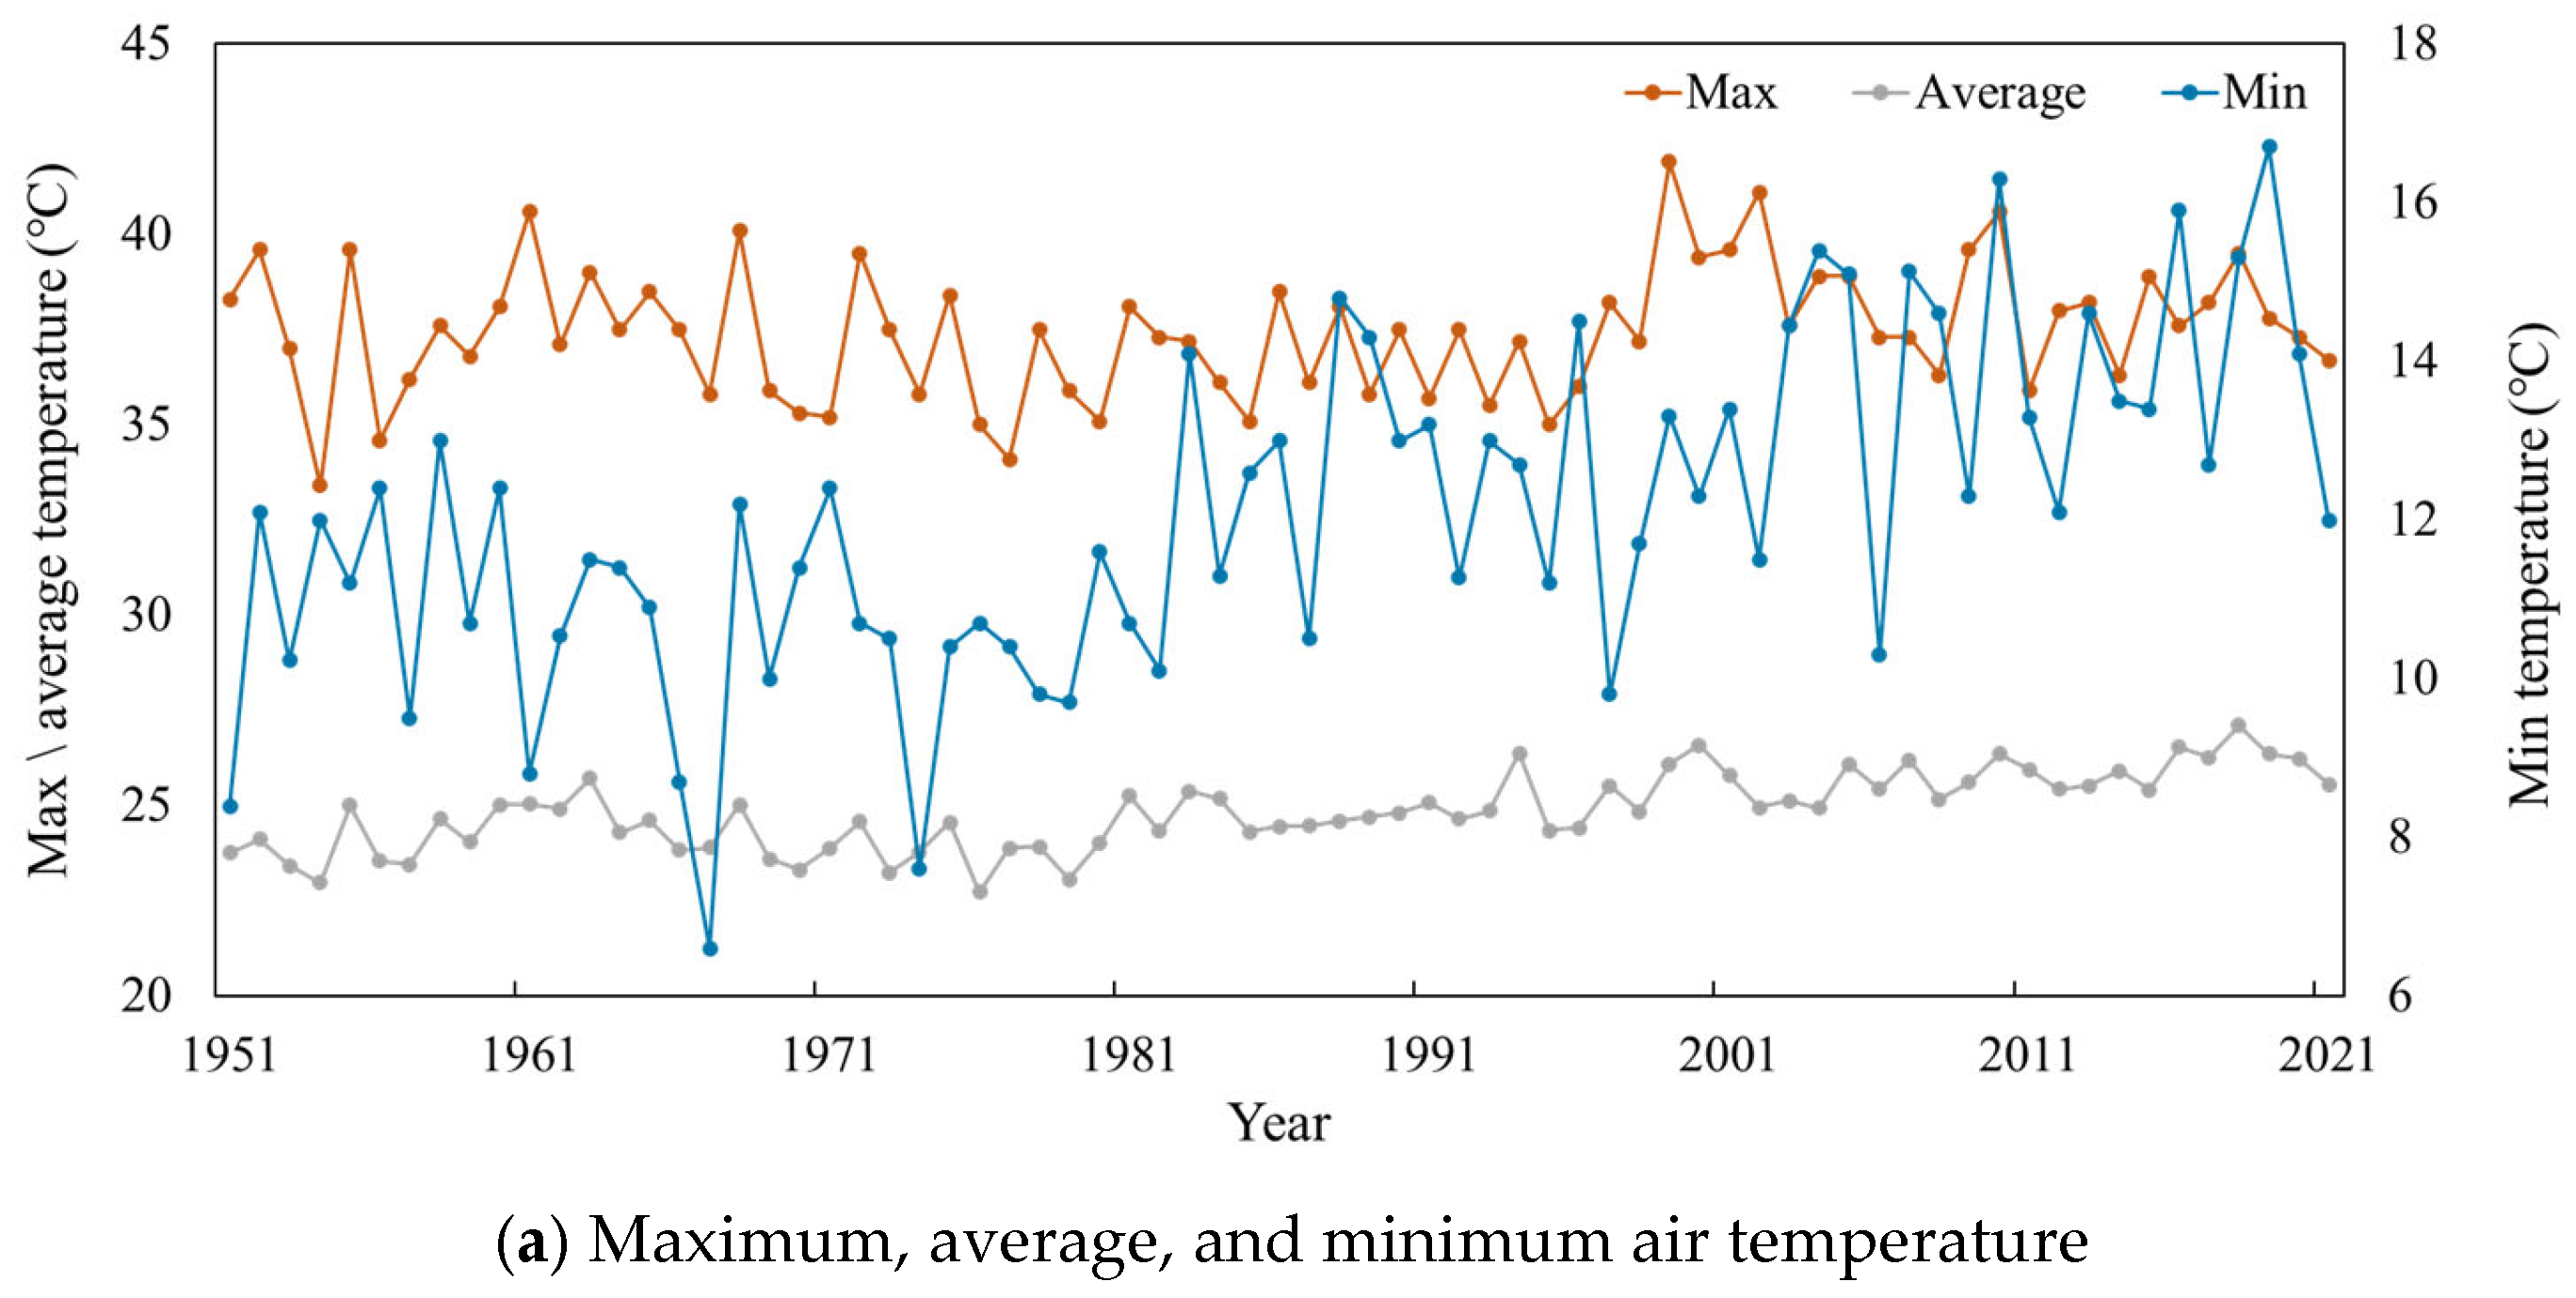
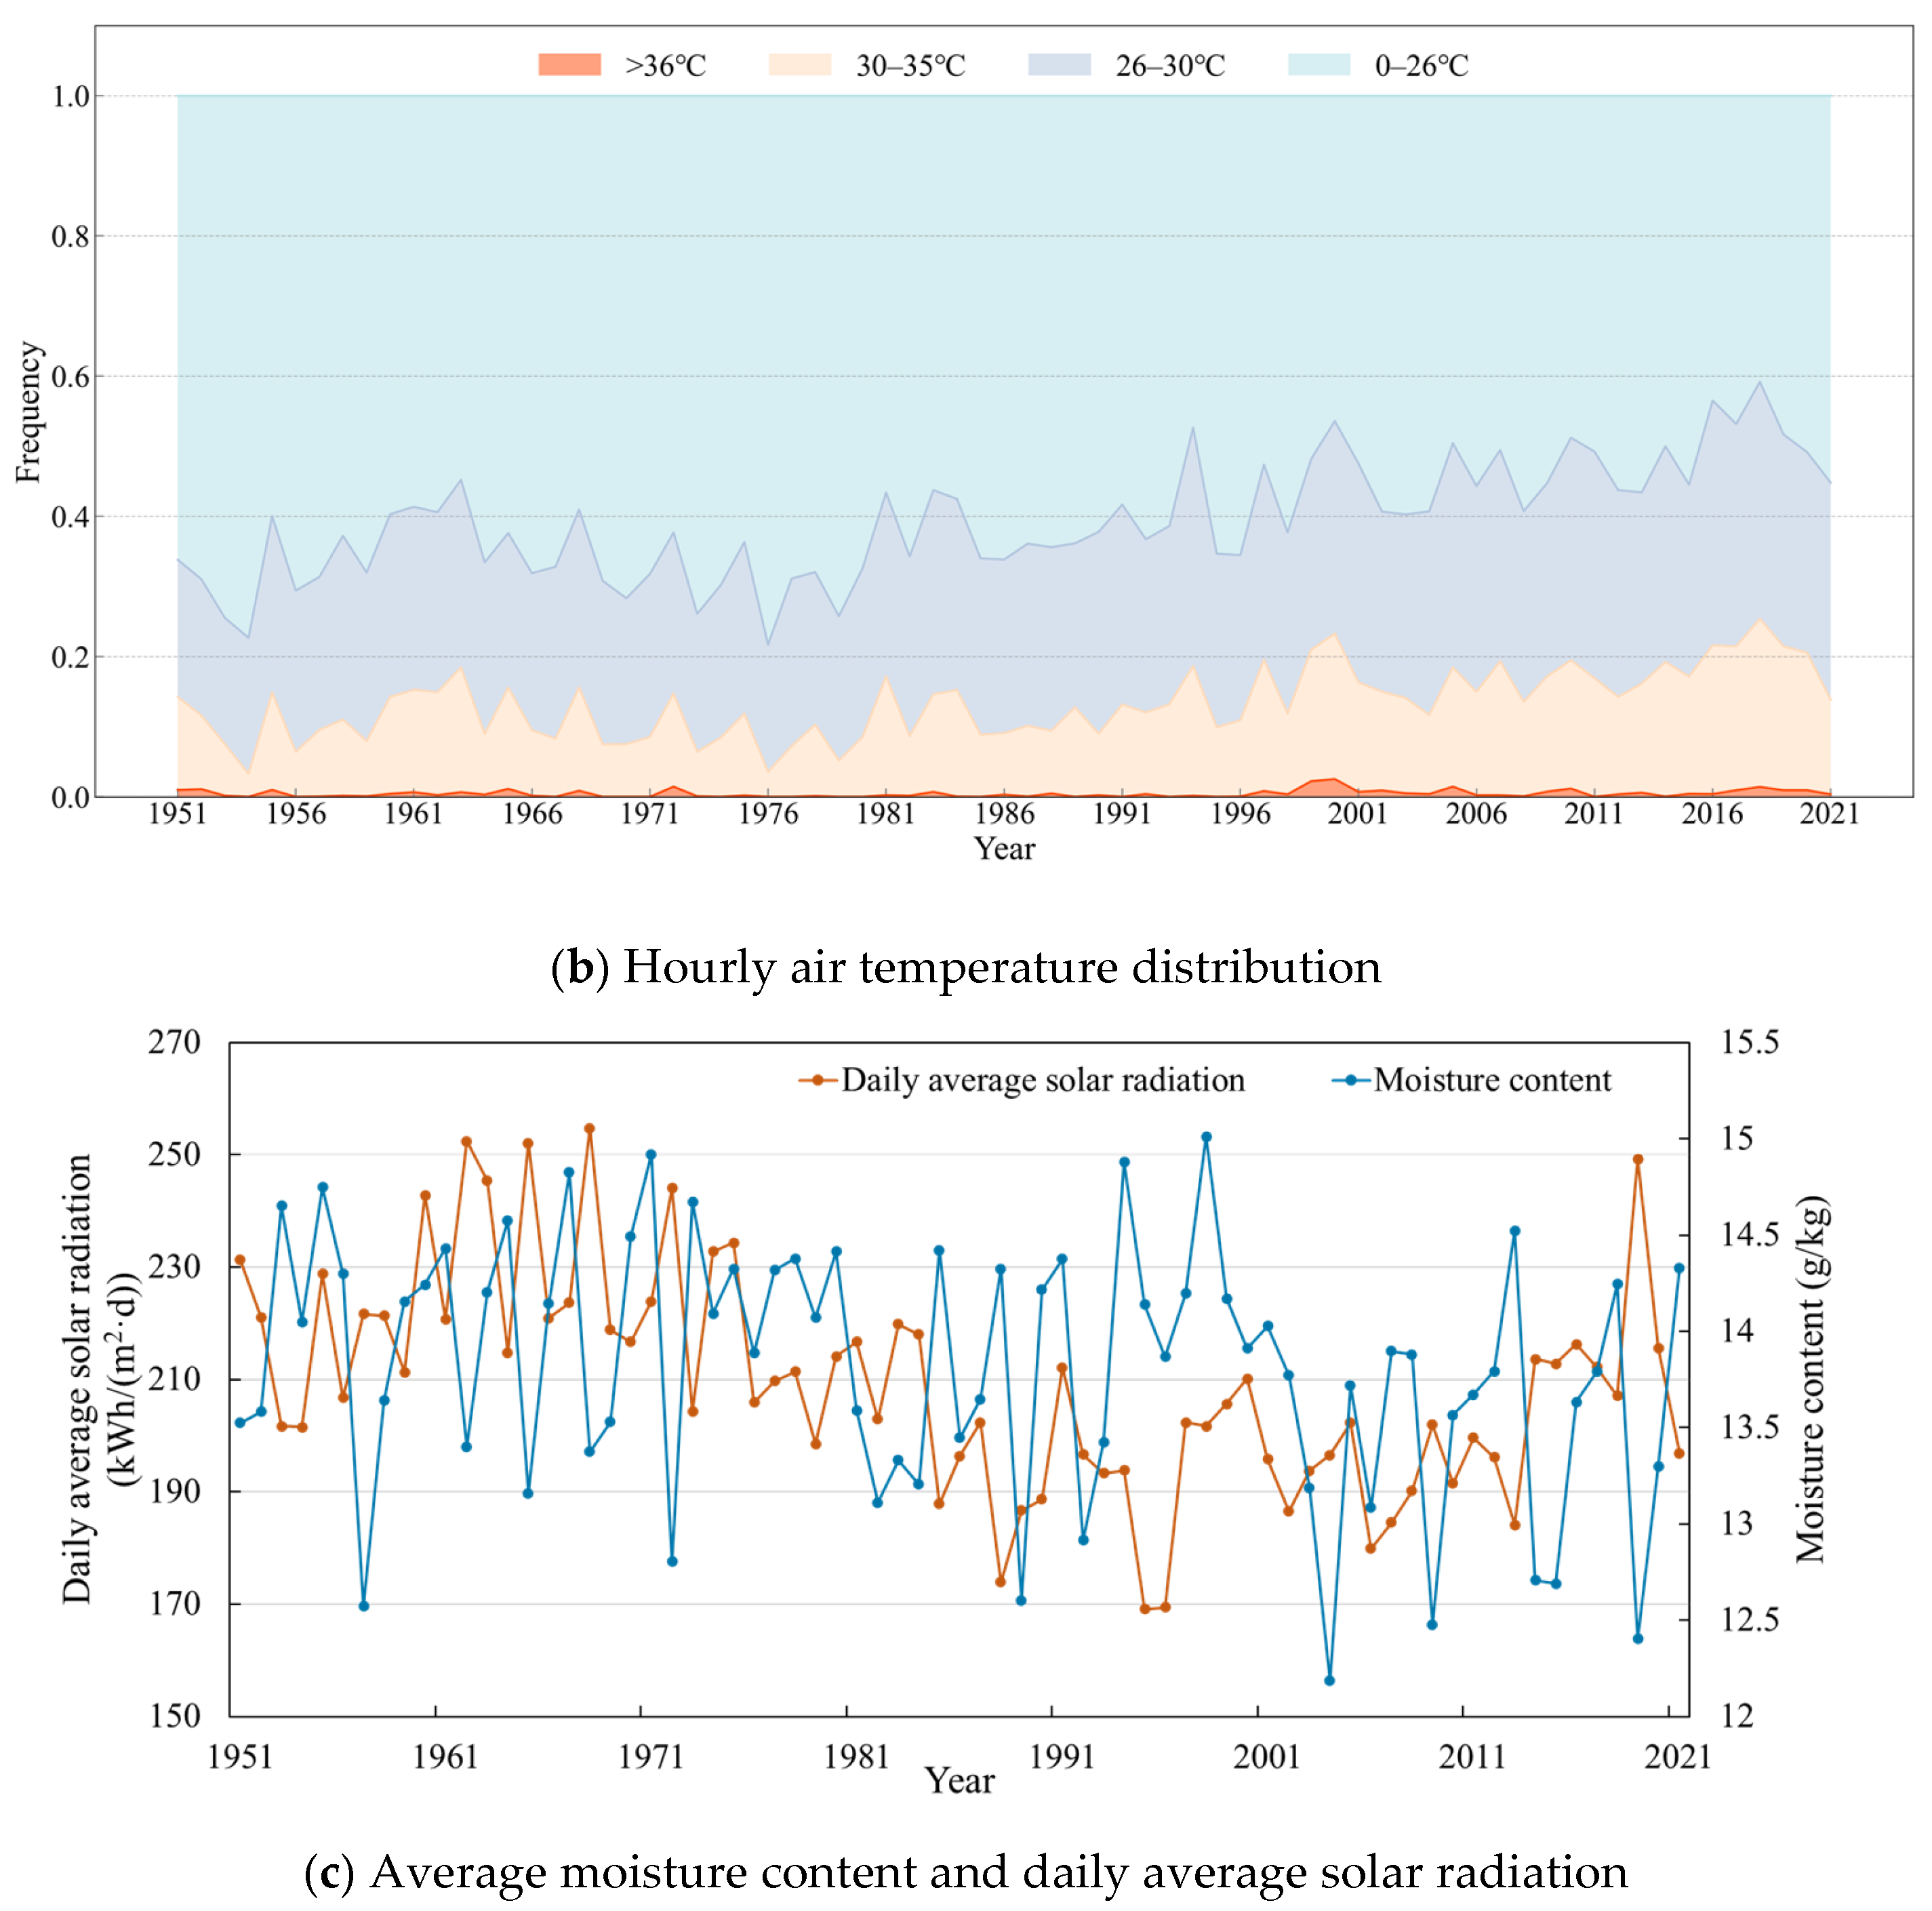
Figure 5 illustrates the variation patterns of AMY data during the cooling season (1 June–15 September) over a 71-year period. This study conducted a thorough analysis of meteorological parameters, including mean, maximum, and hourly air temperatures (°C), average moisture content (g/kg), and daily average solar radiation [kWh/(m2·d)].
Analysis of meteorological data from the China Meteorological Administration (1951–2011) reveals distinct climatic transitions in Beijing [41]. The region experienced a notable warm-to-cold shift in the late 1970s, followed by a period of sustained warming. Figure 5a illustrates the two-phase transition of Beijing’s outdoor air temperature in the cooling season. The left axis represents the average air temperature and maximum air temperature, while the right axis represents the minimum air temperature. Between 1951 and 1980, outdoor air temperature showed a decline, with the average air temperature decreasing at a rate of 0.1 °C/10a, the maximum air temperature dropping by 0.5 °C/10a, and the minimum air temperature dropping by 0.2 °C/10a. In contrast, from 1980 to 2021, the outdoor air temperature increased, with the average air temperature rising by 0.4 °C/10a, the maximum air temperature increasing at the same rate of 0.4 °C/10a, and the minimum air temperature increasing at the same rate of 0.6 °C/10a. Air temperature distribution analysis (Figure 5b) shows a decline in events below 26 °C, an increase in occurrences of 30–35 °C, and a rising frequency of extreme heat events ≥ 35 °C.
In Figure 5, the left axis shows variations in daily average solar radiation during the cooling season, showing higher levels in 1951–1980 compared to 1980–2021. The maximum (6.11 kWh/m2·d in 1968) and minimum (4.03 kWh/m2·d) values differed by 2.07 kWh/m2·d. In Figure 5, the right axis depicts trends in moisture content during the cooling season. From 1951 to 1980, moisture content increased by 0.010 g/kg, whereas a gradual decrease of 0.009 g/kg was observed from 1980 to 2021. The maximum (15.01 g/kg in 1998) and minimum (12.18 g/kg in 2004) values differed by 2.83 g/kg.

3.2. Build Simulation Model

3.2.1. Building Overview

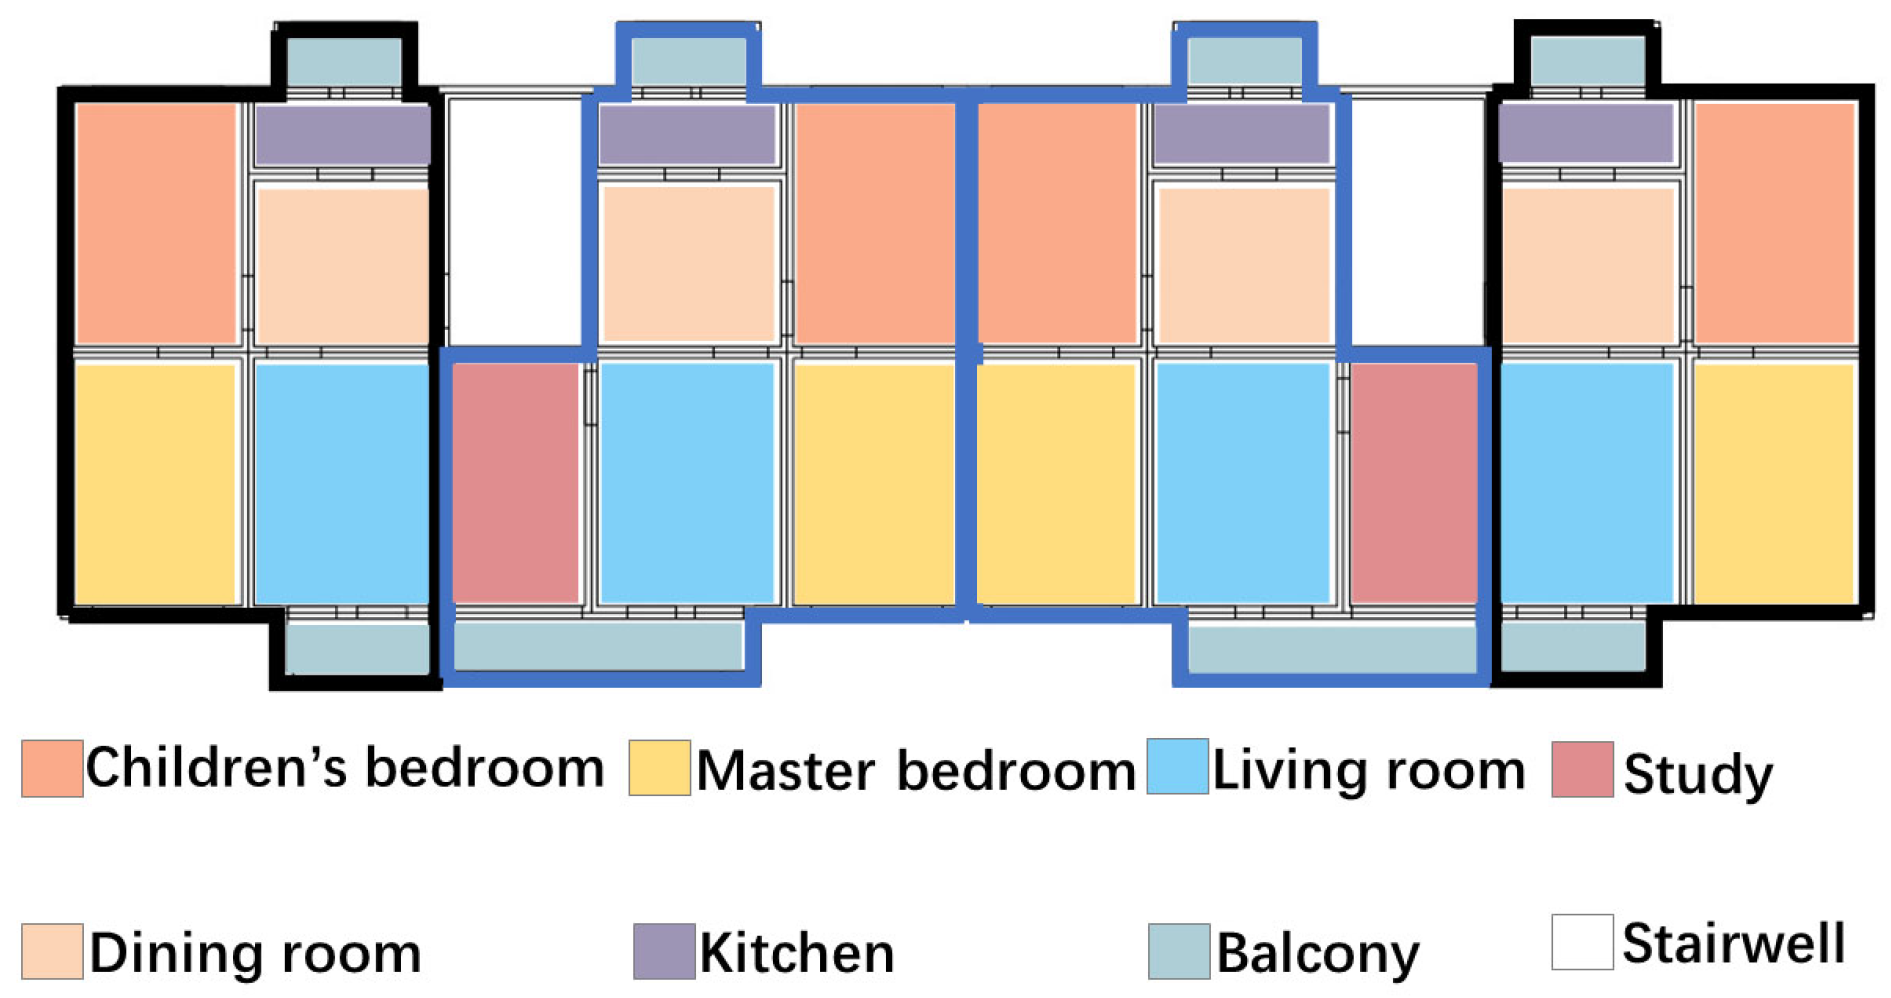
The building layout was standard (Figure 6), with details listed in Table 4. It comprised four 2.7 m-high floors, totaling 1396.8 m2 [42]. Key parameters included a 0.378 m−1 shape coefficient and 0.26 window-to-wall ratio. Each floor housed four units: Type A (72.72 m2, black outline) and Type B (88.92 m2, blue outline). Unit layouts included master and children’s bedrooms; living, study, and dining rooms; and a kitchen. Split AC systems provided cooling from June 1 to September 15.
In cold regions like Beijing, residential buildings typically use central heating for continuous winter operation and split ACs for summer cooling. According to the Beijing Municipal Bureau of Statistics, most residential buildings in the study area were constructed between 1995 and 2009. A 2015 survey by Tsinghua University’s Building Energy Efficiency Research Center further indicated that over 60% of Beijing’s urban residences were built from 1990 to 2010 [43]. Thus, this study adopts the JGJ 26-95 energy efficiency standard [44] for building envelope properties, with detailed parameters listed in Table 5.
Building energy loads are jointly determined by the thermal performance of building envelopes and occupant behavior parameters. Empirical studies have demonstrated that behavioral factors, including temperature setpoints, air-conditioning operating duration, and ventilation status, significantly influence building energy consumption [45]. According to a nationwide survey by Hu et al. [46], 35% of Chinese households consist of two adults and one child, which was adopted as the baseline family structure in this study, with adults occupying the master bedroom and children in secondary bedrooms. Table 6 illustrates the occupancy schedules of major rooms (master bedroom/children’s bedroom, living room, and study) on weekdays and weekends. Table 7 shows the internal heat gains settings for main rooms. The schedules are set by referring to the occupancy patterns of personnel, equipment, and lighting in the typical building models proposed by Gui et al. [47]. In accordance with Chinese HVAC design standards [48], summer indoor operative temperatures should be maintained at 24–28 °C to ensure thermal comfort. Hu et al. [46] conducted an online survey in 2015 to explore energy consumption and usage behaviors in urban residences, with 4964 Chinese urban households participating. The study found that 26 °C was identified as the most common air-conditioning setpoint. Field measurements revealed three distinct usage patterns: 20% of households operated AC only during extreme heat events and turned it off before sleep, 24% followed an occupancy-based on/off strategy, while 2% maintained continuous operation. This study consequently established 26 °C as the baseline cooling setpoint with an occupancy-responsive control logic (activation upon thermal discomfort and deactivation when leaving rooms). The summer ventilation scenario assumed continuous window opening, a behavioral pattern supported by regional survey data showing 65% of residents in hot summer–cold winter zones maintain permanently open windows during cooling seasons [30]. In heatwave-related studies, windows are typically set to remain continuously open. This is because during summer conditions without air conditioning, opening windows for natural ventilation facilitates indoor heat dissipation and helps maintain thermally acceptable indoor environments. Following this well-established research convention, our study has adopted the same ventilation habits [30]: 2 air changes per hour (ACH) with closed windows and 5 ACH when opened.

3.2.2. Modeling and Validation

This study employed DeST 3.0 [49], a building energy simulation tool developed by Tsinghua University, to model prototype buildings and simulate cooling/heating loads. The software was selected for its comprehensive database of Chinese building materials, internal heat gains, and HVAC system parameters. Due to the unavailability of direct measurement data for the case-study building, this study adopted an alternative validation method by comparing simulation results with actual cooling load measurements for conventional residential buildings in Beijing. The cooling load simulation utilized typical meteorological year data from Chinese standard weather data. For actual cooling load measurements, we adopted An et al. [50], which documented the cumulative cooling load range of 5–14 kWh/m2 and the cumulative heating load range of 40–70 kWh/m2. The simulated cumulative cooling (13.49 kWh/m2) and heating (53.25 kWh/m2) loads demonstrated good agreement with field measurements, confirming the model’s reliability for analyzing building energy performance in the study area.

4. Results

4.1. Results of Outdoor Heatwave Assessment

This section presents the evaluation results of outdoor heatwaves, and the definitions of relevant indicators are detailed in Section 2.2.1. Figure 7 shows a comparative analysis of heatwave events under different definitions over a 71-year period. As shown in Figure 7a, within the time span of 71 years, heatwave events screened based on different determination criteria exhibit significant differences in frequency distribution. Among them, heatwave 4 stands out with the highest number of occurrences, reaching 773 times, while heatwave 1 has the lowest number of occurrences, only 44 times. Such a significant difference in frequencies reflects the impact of different heatwave definition methods on the identification of heatwave events.
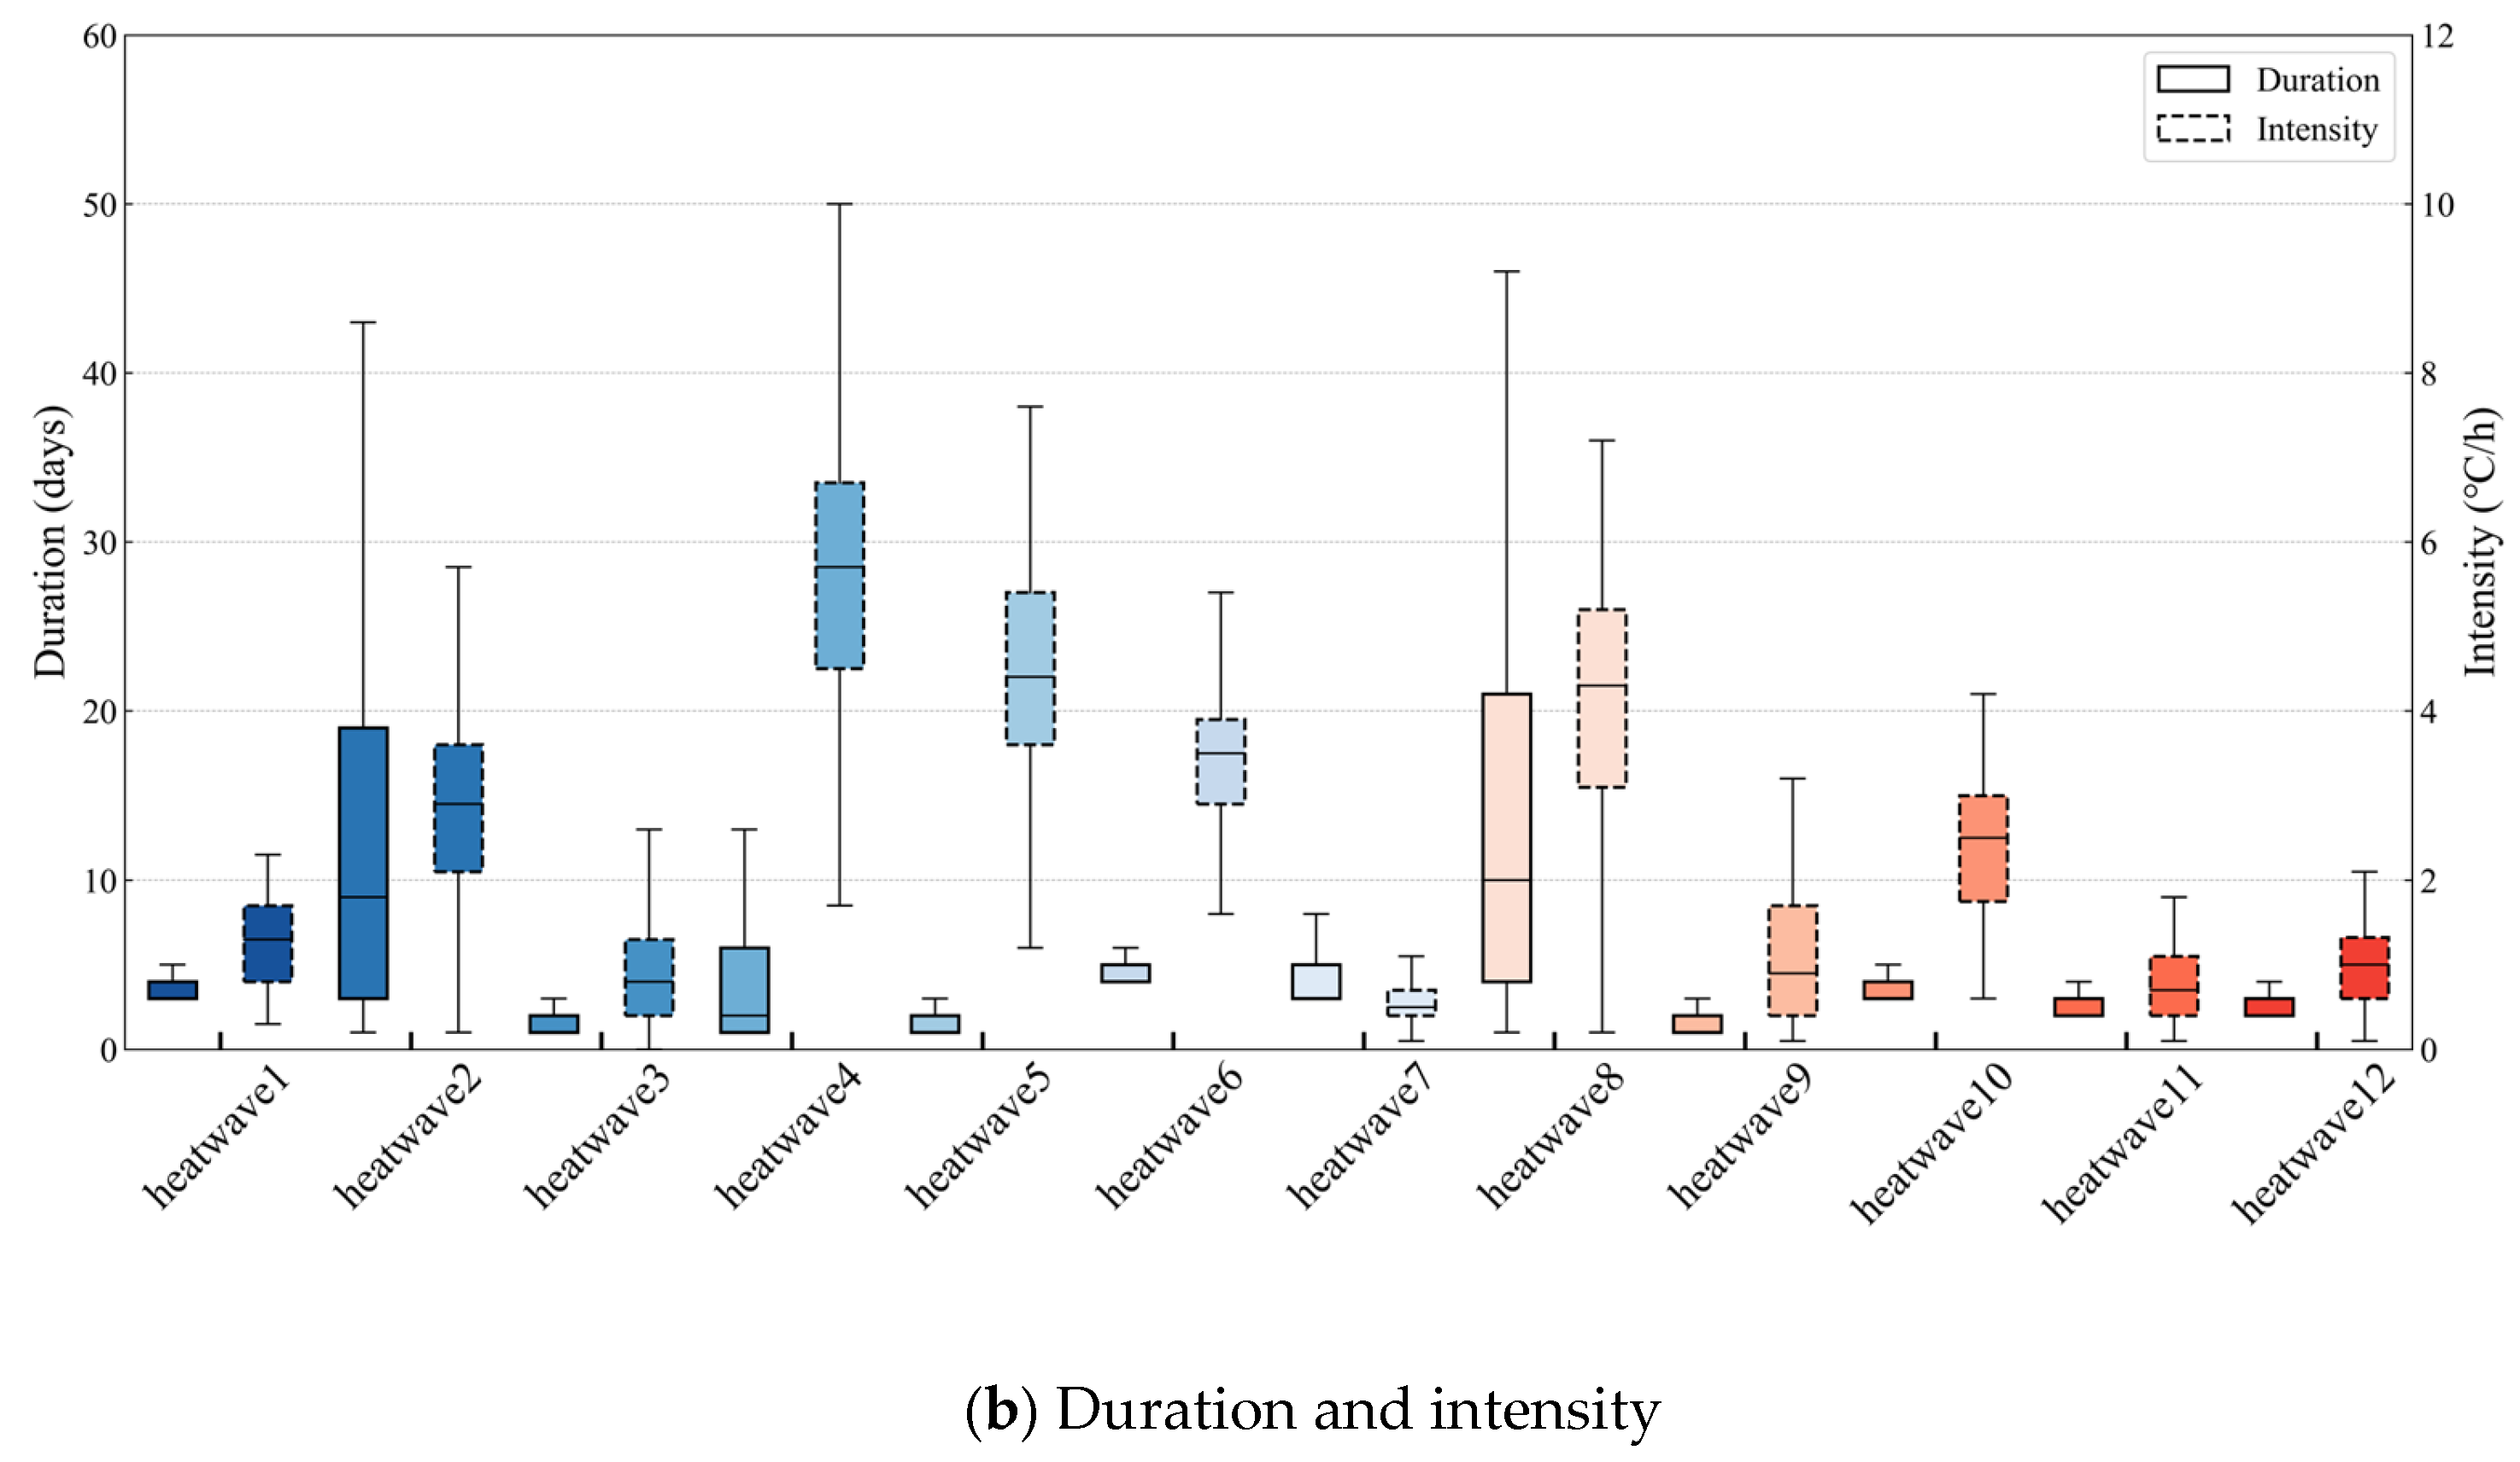
As shown in Figure 7b, heatwave 2 and heatwave 8 have relatively long durations. Some heatwaves even last for more than 40 days, and the maximum duration of heatwave 4 exceeds 10 days. In contrast, the durations of other heatwaves are shorter, less than 10 days. Heatwave 4, heatwave 5, and heatwave 8 have relatively high intensities, exceeding 6 °C/h, while heatwave 1, heatwave 7, and heatwave 11 have relatively low intensities, less than 2 °C/h. High-intensity heatwave events are usually accompanied by higher air temperatures and longer durations, and have more severe impacts on ecosystems and human society. The results of heatwaves selected using different heatwave definitions vary significantly. Therefore, choosing an appropriate heatwave definition method is crucial for accurately assessing the risks of indoor overheating.
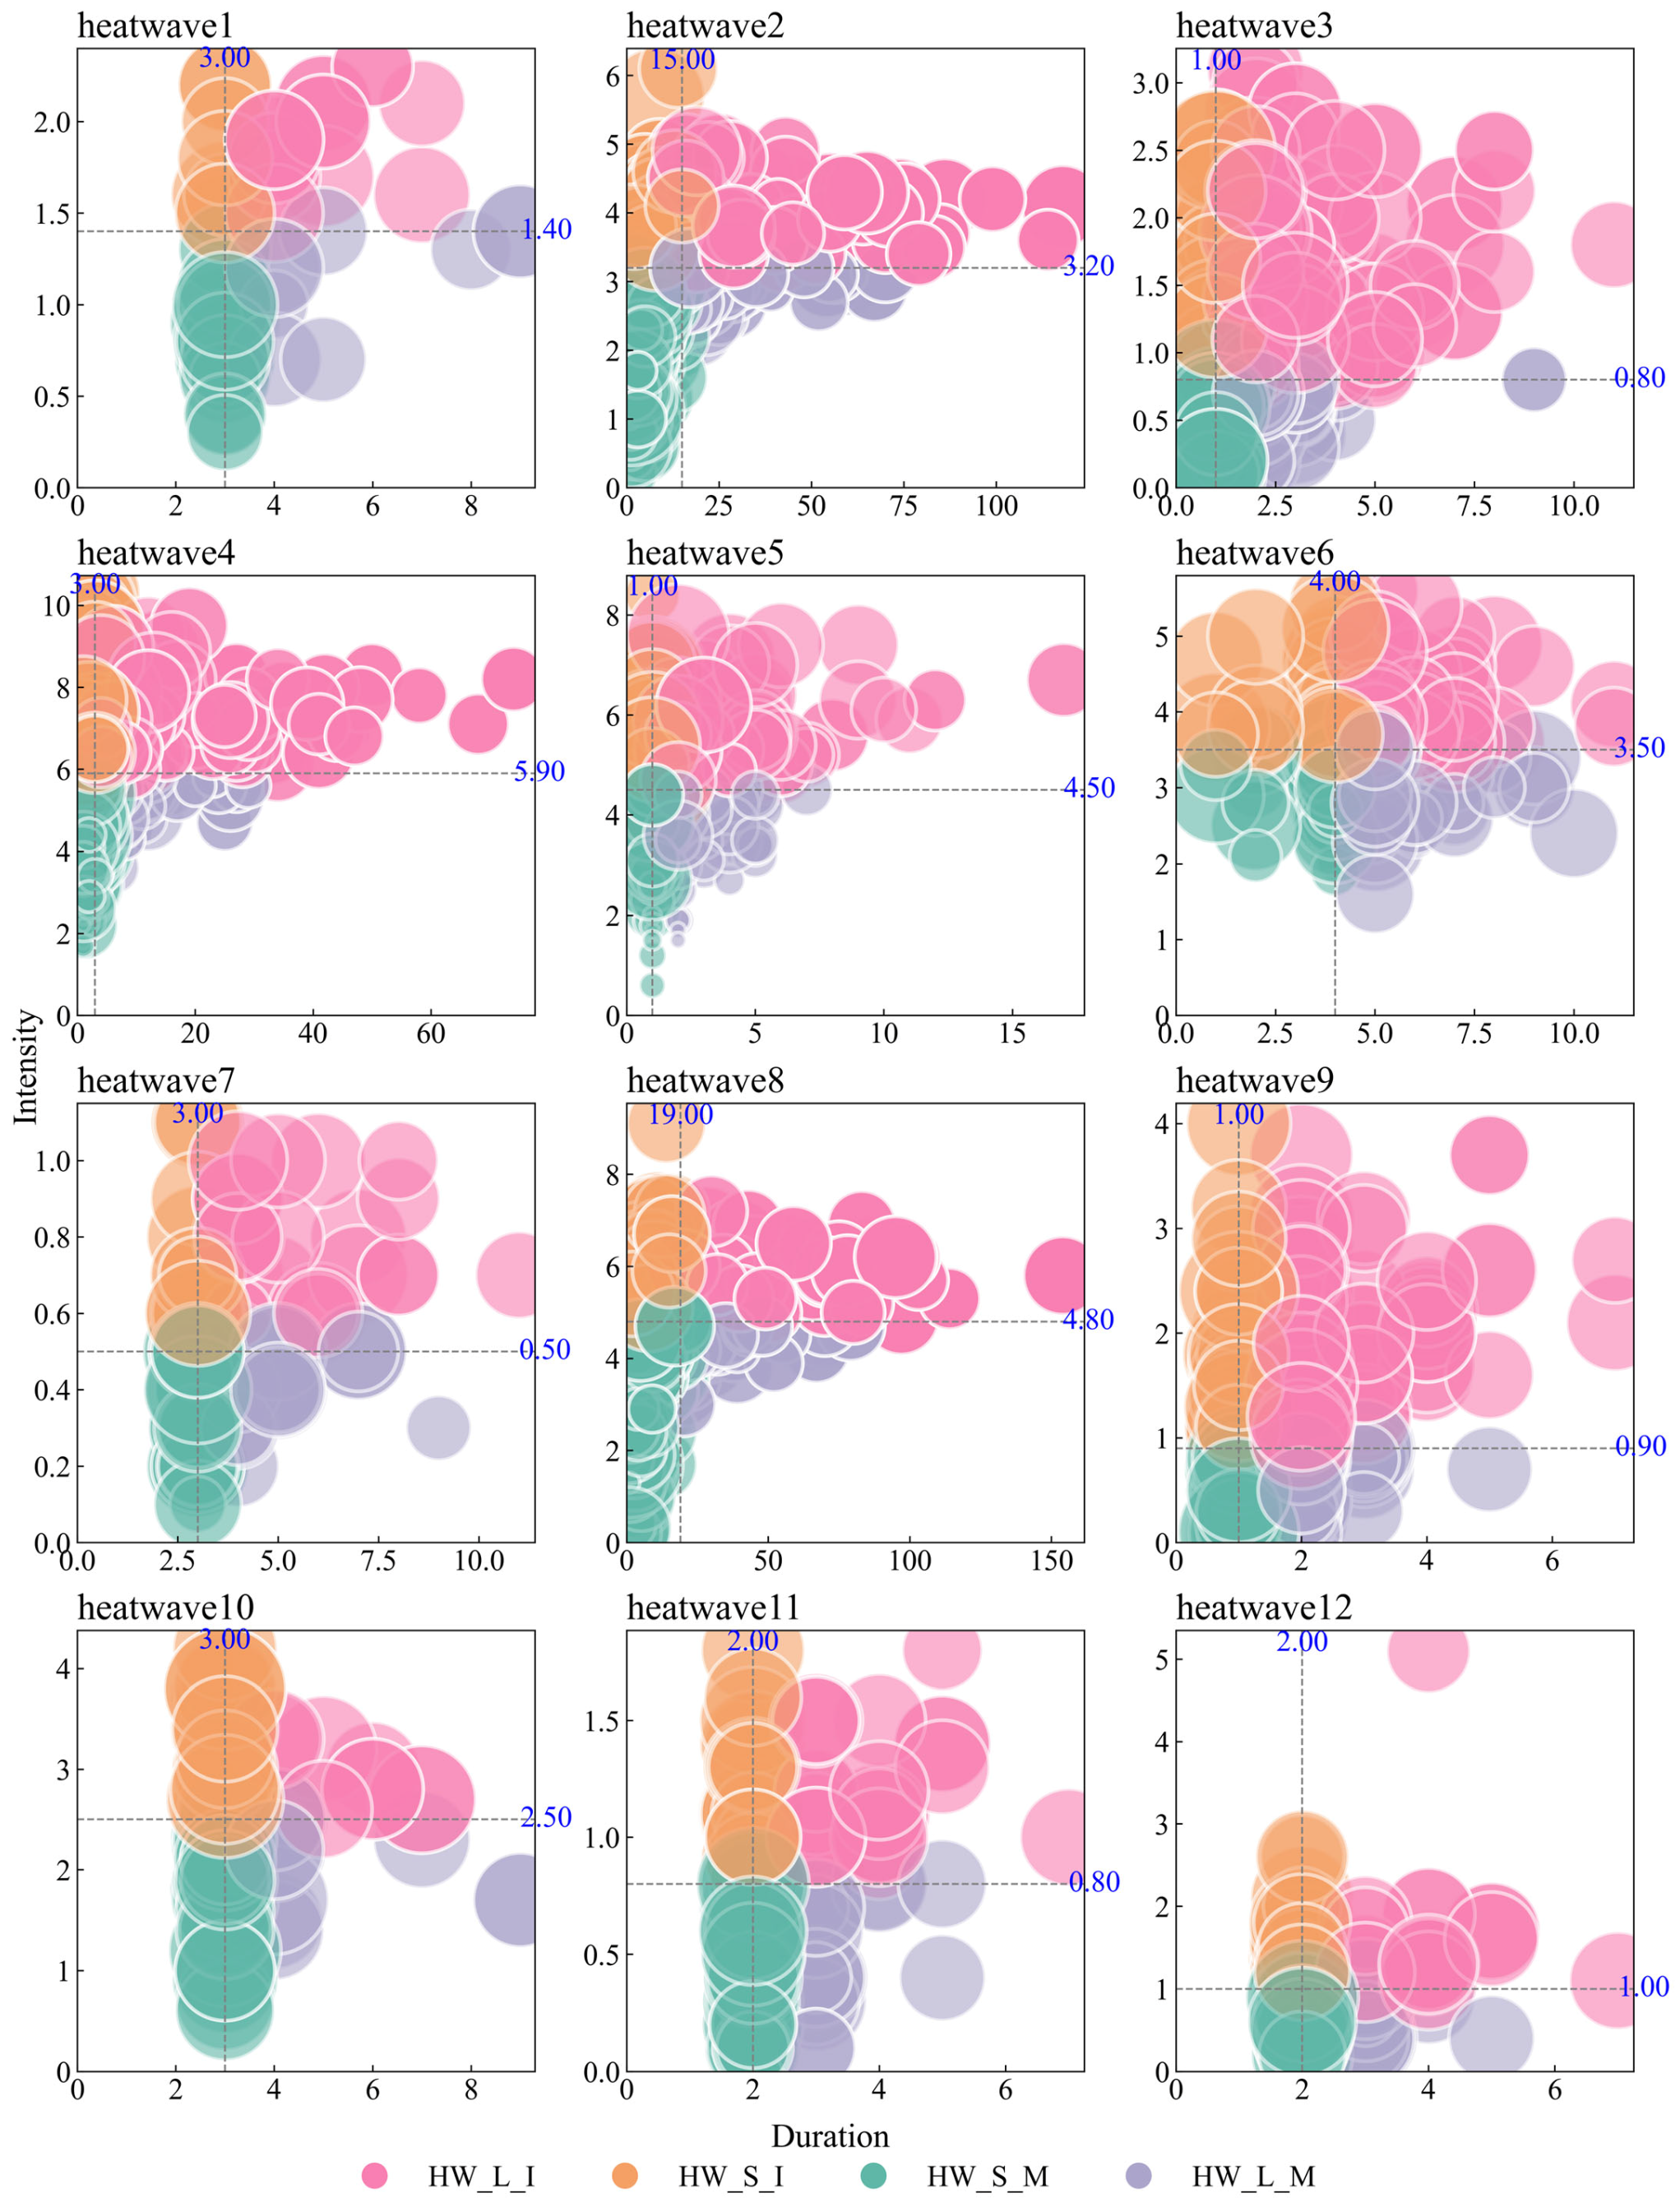
In order to systematically classify and conduct a comparative analysis of different types of heatwave events, this study first carried out a detailed statistical analysis of various heatwave indicators and screened out the key indicators of duration and intensity that can effectively distinguish the characteristics of heatwaves. Figure 8 shows a bubble chart of heatwave events screened by different definition methods. Each bubble in the chart presents three key characteristics of the events: duration, intensity, and daily total radiation. The blue numbers in the figure represent the median values of duration and intensity for different types of heatwaves, which are used to distinguish between heatwave types. Two dashed lines divide the chart into four regions, representing four types of heatwaves displayed in different colors.
HW_S_M is the main heatwave type in all heatwave definitions, accounting for more than 35% of the total heatwaves. In addition, except for heatwave 10, the percentage distribution of heatwave types is relatively similar. Among them, HW_S_M and HW_L_I are the two main types, accounting for more than 60% of the heatwaves, while the proportions of HW_S_L and HW_L_M are similar.
Except for heatwave 2, heatwave 4, and heatwave 8, most of the heatwaves detected by different definition methods are short-term events that last only 1 to 3 days. It can be observed that the duration of HW_L_I events is generally longer than that of HW_L_M. The longest heatwaves are HW_L_I. The intensity of most short-duration HM_S_I heatwaves is lower than that of HW_L_I. Most of the most intense heatwaves are HW_L_I, and they account for a high proportion. This fully indicates that HW_L_I events stand out in terms of their influence among various types of heatwaves. The combination of high intensity and long duration often has an extremely severe impact on human health.

4.2. Results of Indoor Overheating Assessment

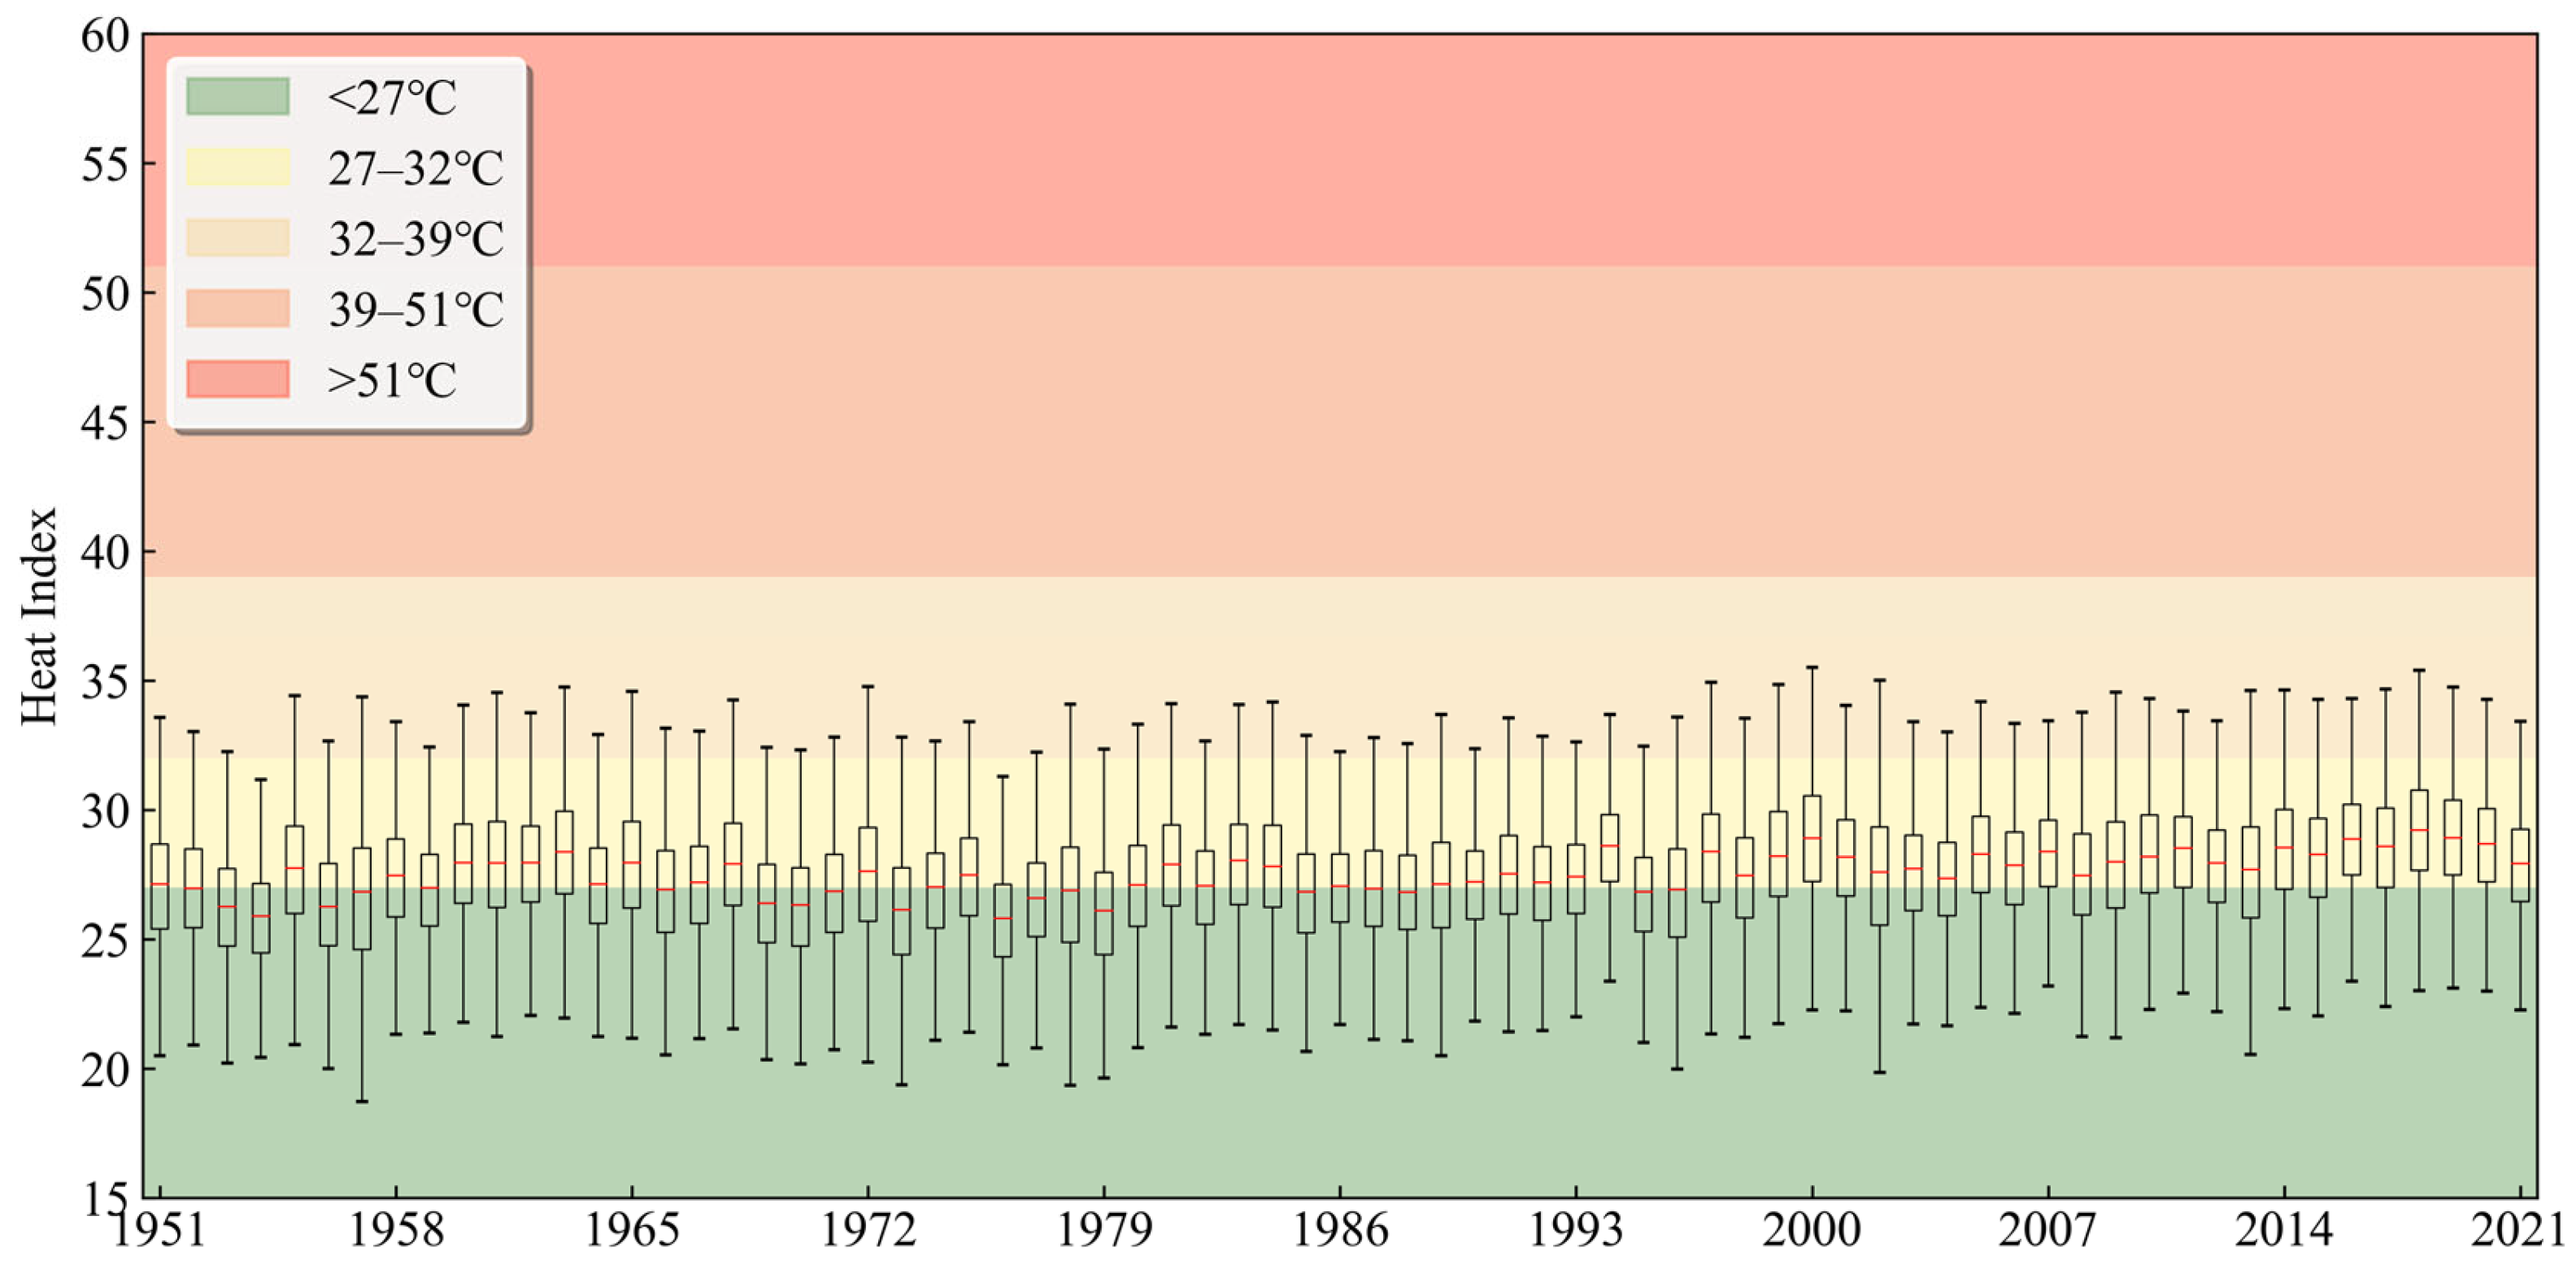
This section presents the evaluation results of indoor overheating, and the definitions of relevant indicators are detailed in Section 2.2.2. In this section, the indoor environment is simulated for buildings that comply with the 1995 building standards and are without air conditioning, and the overall HI of the building over a period of 71 years is calculated. The results are shown in Figure 9. According to the heat hazard classification criteria in Table 1, this figure is divided into five regions. When the HI is lower than 27 °C, it is determined to be in a safe state.
As can be seen from the Figure 9, over the 71-year period, for most of the time, the HI of this building is within the safe range below 27 °C, and the likelihood of people facing health risks due to high air temperatures is relatively low. However, it is quite common for the HI to be in the range of 27–32 °C. People who engage in activities in this environment for a long time need to be vigilant about the risks of fatigue and heat cramps. In contrast, situations where the HI exceeds 32–39 °C occur relatively less frequently. Although the HI is relatively safe most of the time, this building still frequently enters the air temperature range that warrants a warning. This also indicates that although the indoor air temperature environment is relatively comfortable in most cases, during certain periods, the hazards posed by high air temperatures still require high attention. It is worth noting that Beijing is located in northern China, with a dry climate, and the HI has not exceeded the dangerous threshold. However, in the humid and hot southern regions, the importance of the indoor air temperature situation is even more prominent. The distribution proportion of the HI in each interval shows certain fluctuations. Since 1980, the median value of the HI is mostly higher than 27 °C.
In the future, affected by various factors such as climate change, it is crucial to pay close attention to the indoor heatwave situation. This is not only related to the health and comfort experience of people indoors but also a key part of dealing with potential environmental risks.

4.3. Results of the Coupled Indoor and Outdoor Heatwave Assessment

4.3.1. Assessment of the Overlap Degree

This study aims to screen outdoor indicators with high accuracy. The selected indicators are required to precisely reflect the indoor overheating situation when outdoor overheating occurs and also reduce redundant outdoor overheating periods to ensure the accuracy of the results. In order to analyze the correlation characteristics of indoor and outdoor overheating, an overlap degree analysis method is adopted in this study. Considering that the overheating degree is relatively low when the indoor air temperature has a HI of 27 °C, while the overheating characteristics are more significant when it reaches 32 °C, this study uses a HI of 32 °C as the key threshold for calculating the overlap degree, aiming to more accurately capture the synchronicity pattern of indoor and outdoor overheating events.
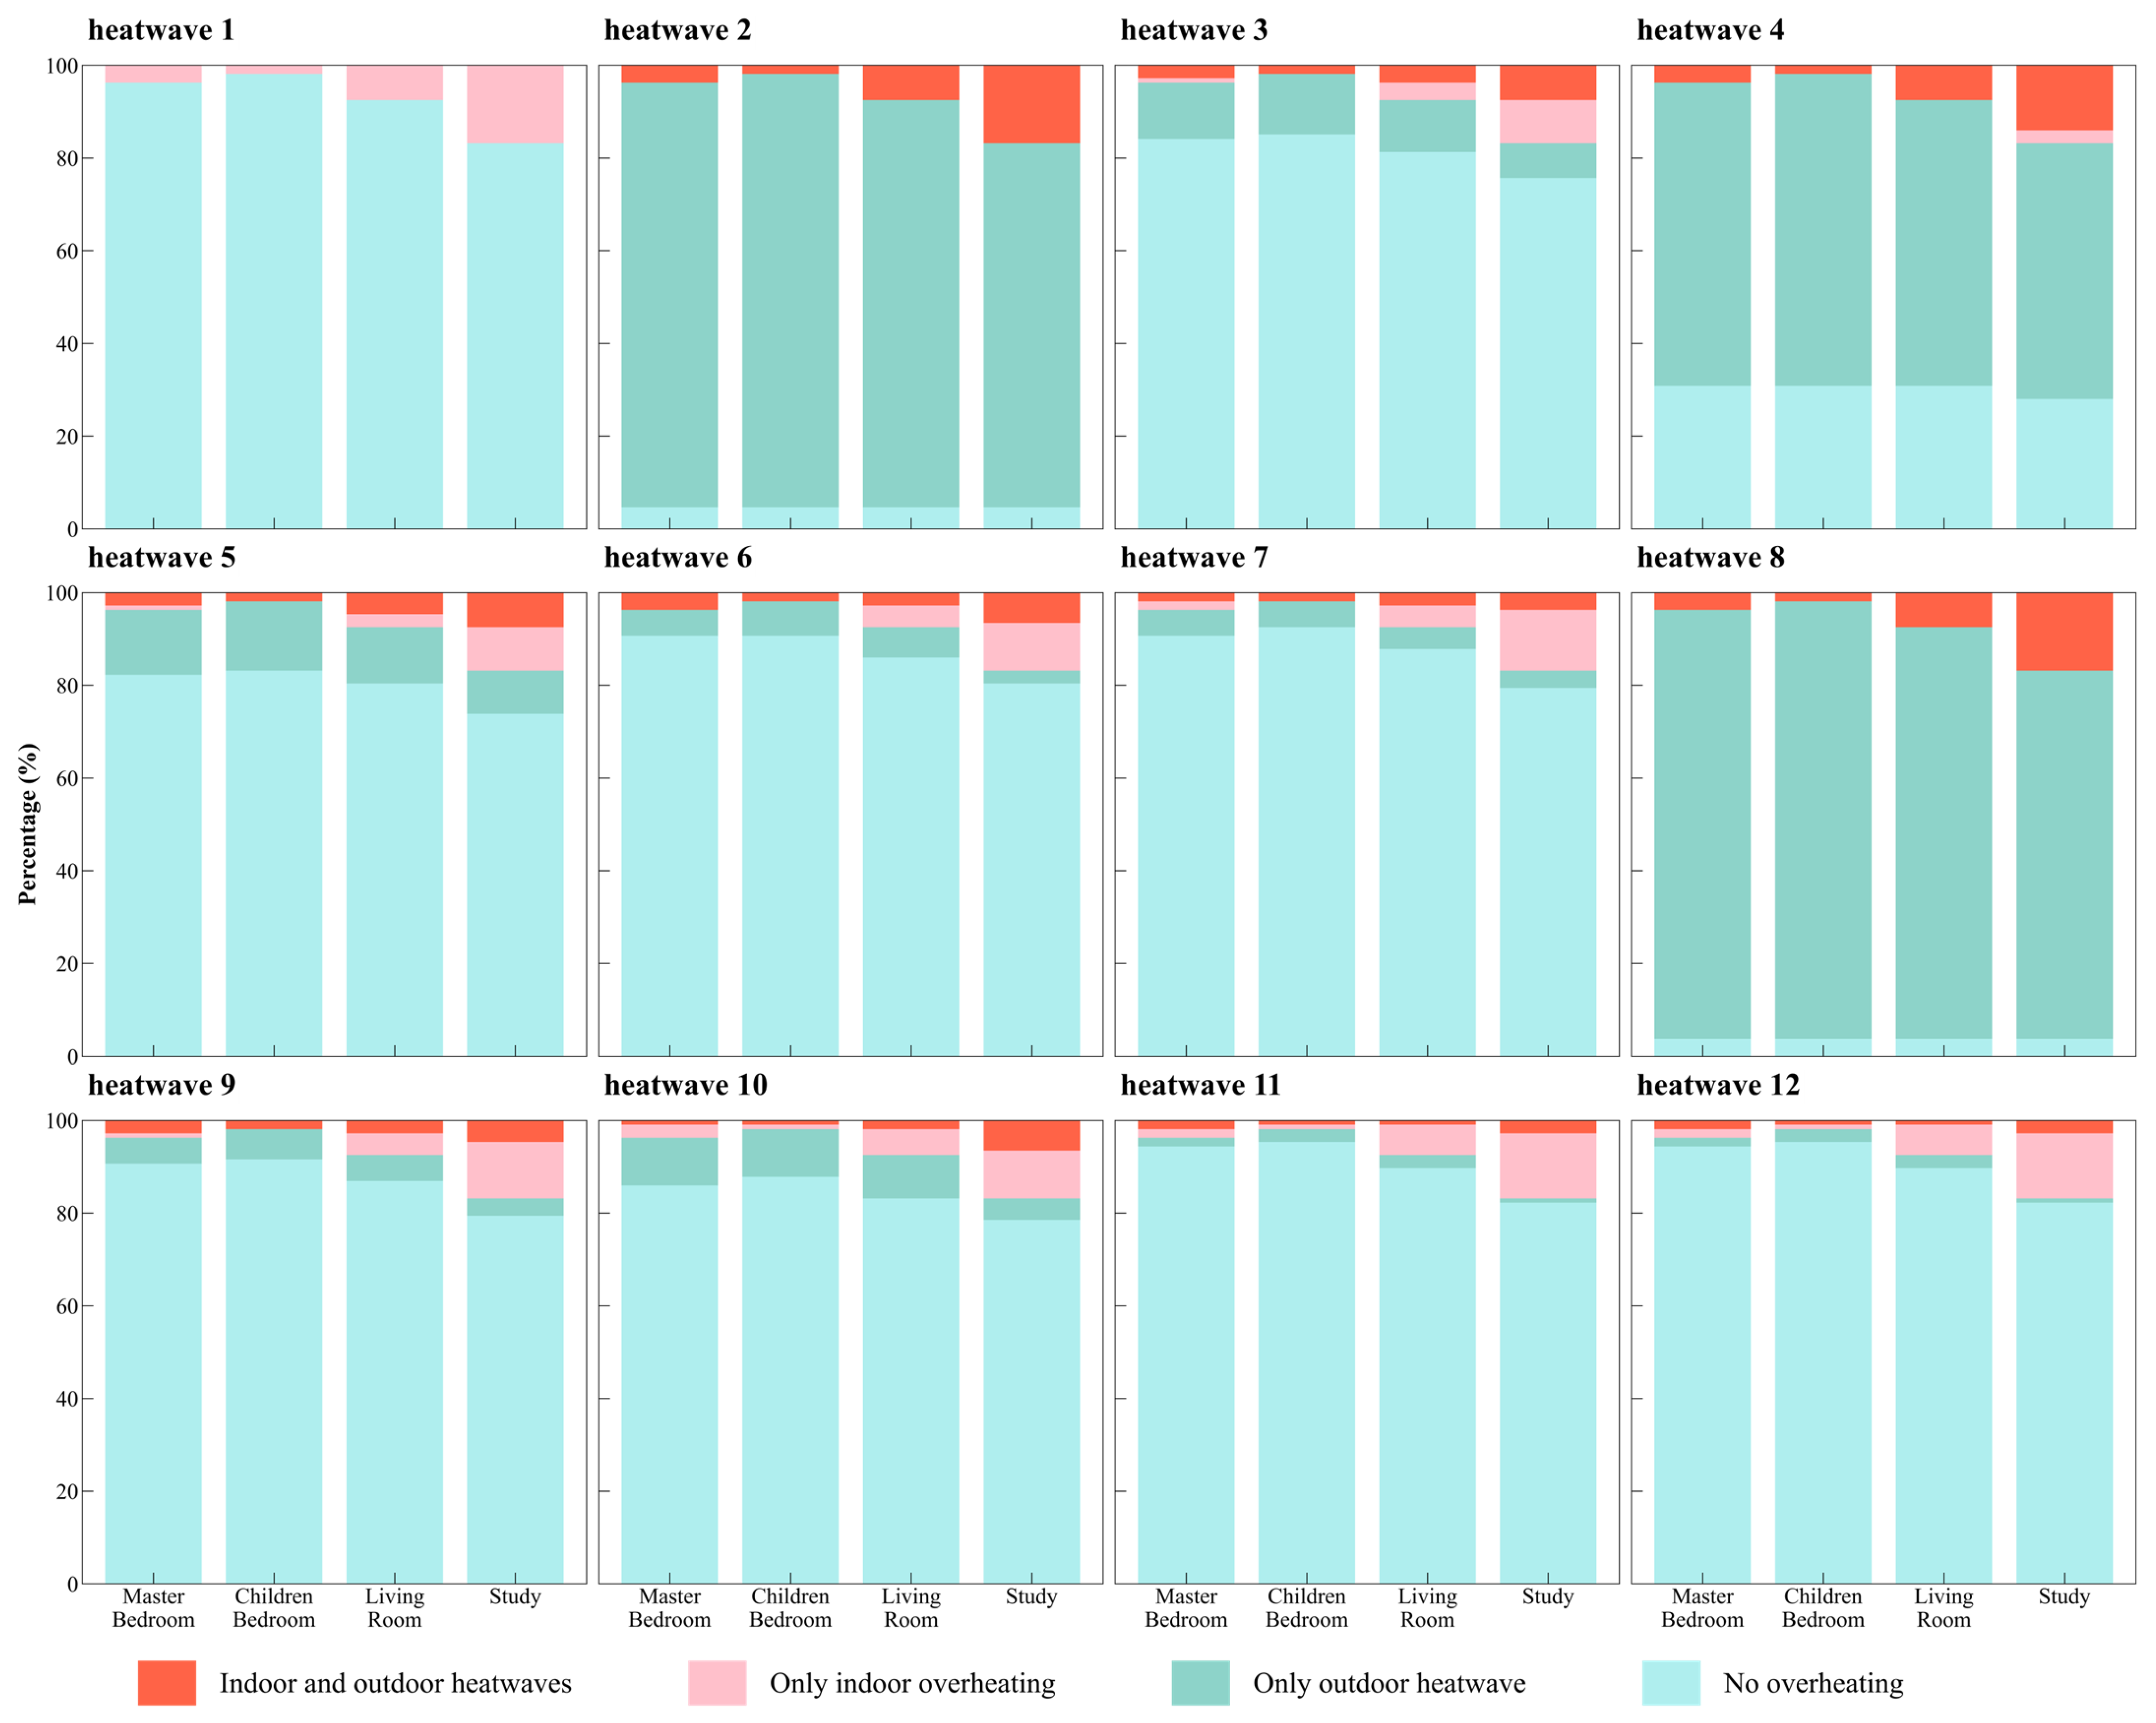
Figure 10, taking the four main rooms on the fourth floor of the building as examples, shows the degree of coincidence between outdoor heatwave events and indoor overheating under different definitions over a period of 71 years. The higher the D1 value is, the higher the degree of coincidence of the overheating phenomenon between indoors and outdoors during the period of indoor overheating (Figure 10a). It can be seen that the D1 values of heatwave 2, heatwave 4, and heatwave 8 are nearly 100%, which means that during all periods of indoor overheating, outdoor overheating occurs simultaneously, showing a high degree of coupling between the two. Following them are heatwave 3, heatwave 5, heatwave 6, and heatwave 7, with relatively lower D1 values. In terms of the D2 index, the lower the value is, the higher the degree of coincidence of indoor and outdoor overheating (Figure 10b). The D2 values of heatwave 1, heatwave 6, heatwave 7, heatwave 9, heatwave 10, heatwave 11, and heatwave 12 are relatively low, indicating that when indoor overheating occurs, a large number of outdoor overheating situations are covered. It is worth noting that although heatwave 2, heatwave 4, and heatwave 8 can comprehensively capture indoor overheating situations, the number of screened outdoor overheating events is relatively large, presenting a certain degree of redundancy. In contrast, heatwave 6 and heatwave 7 can accurately identify indoor overheating while screening out fewer outdoor heatwave events, demonstrating higher detection efficiency and accuracy.
Figure 11 shows the coincidence of indoor and outdoor overheating in the main rooms, such as the master bedroom, children’s room, living room, and study on the fourth floor (the top floor) during the cooling season in 2019. In the figure, the periods of indoor overheating are marked in red, the periods of outdoor heatwaves are marked in blue, and the moments of simultaneous indoor and outdoor overheating are indicated in gray. It can be seen from the figure that during the detection of heatwave 2, heatwave 4, and heatwave 8, the detection frequency of outdoor heatwaves is relatively high. During heatwave 1, although indoor overheating occurs, no heatwaves are detected outdoors. It is worth noting that for heatwave 3, heatwave 5, heatwave 6, heatwave 7, and heatwave 10, the degree of coincidence of indoor and outdoor overheating is quite significant.
In conclusion, the heatwave definition based solely on a single air temperature, due to relatively lenient screening conditions, results in a larger number of identified outdoor heatwaves for most heatwaves, thus covering more indoor overheating situations (higher D1 values). In view of this, we use the indicator D2 to evaluate the outdoor heatwave situation under indoor overheating conditions. Through comprehensive evaluation, the definitions of heatwave 6 and heatwave 7 are more capable of reflecting both indoor and outdoor heatwave characteristics simultaneously. Although heatwave 6 is determined solely by the daily average air temperature, its detection results are better than those of other single air temperature indicators due to its higher discrimination threshold.

4.3.2. Evaluation of the IOD

In this study, a HI of 32 °C (extreme caution) is set as the evaluation threshold for indoor overheating, and based on this, the indoor thermal environment under outdoor overheating is deeply analyzed. At the same time, in order to explore the influence mechanism of the threshold setting on the research conclusions, a HI of 27 °C (corresponding to the “caution” risk level) is selected as the comparative threshold for a comparative analysis. Figure 12 shows the comparison between the heatwave events selected by different heatwave indicators and the hourly simulation results over 71 years. Among them, “indoor overheating1” refers to the degree of overheating when the thermal index of 32 °C is used as the evaluation threshold for indoor overheating, and “indoor overheating2” represents the degree of overheating when the thermal index of 27 °C is used as the evaluation threshold for indoor overheating.
In terms of the distribution pattern of the degree of overheating, the “violin plots” corresponding to various outdoor heatwave events show significant differences, indicating that there are essential distinctions in the distribution characteristics of the degree of overheating under different heatwave definitions, and there are obvious differences from indoor overheating phenomena. Specifically, when adopting 32 °C as the threshold, the degree of overheating demonstrates relatively higher values, with a concentrated distribution primarily ranging between 6 and 8 °C. In contrast, setting the threshold at 27 °C results in a more dispersed distribution pattern spanning 0–10 °C. This distribution difference reveals the inherent connection between thresholds and risk assessment scales. The 32 °C threshold focuses on high-intensity indoor overheating events, accurately identifying extreme scenarios that may trigger acute health hazards such as heatstroke and heat exhaustion, providing a critical basis for emergency responses. In contrast, the 27 °C threshold, with its broader temperature coverage, effectively captures low-intensity overheating events. Although these events correspond to lower degrees of overheating, they may play a more sensitive role in risk identification for early warning systems. In the risk early warning system, the 27 °C threshold serves as an early risk identification indicator to achieve risk prediction by capturing temperature fluctuation trends, while the 32 °C threshold acts as an emergency response trigger to capture more intense temperature fluctuations. Meanwhile, the outdoor overheating degree exhibits an intermediate distribution pattern, mainly concentrated within the 2–8 °C range. Among them, the distribution of the degree of overheating for heatwave 1, heatwave 6, heatwave 7, heatwave 10, and heatwave 11 is particularly concentrated, demonstrating the stability of the overheating phenomenon under this definition. For the “violin plot” of indoor overheating, its overall shape is in sharp contrast with that of some outdoor heatwaves. When a HI of 32 °C is used as the evaluation threshold, the degree of overheating mainly concentrates in the range of 6–10 °C, and when a HI of 27 °C is used as the evaluation threshold, the degree of overheating is more dispersed.
The distribution of medians for different outdoor heatwave events varies significantly, intuitively reflecting the heterogeneity of the average overheating degree under different heatwave definitions. When 32 °C is used as the evaluation threshold, the median of the overheating degree of indoor overheating is generally higher than that of outdoor heatwaves. Among them, it shows a relatively high similarity to the medians of heatwave 1 and heatwave 6, with relatively small differences from the medians of heatwave 5, heatwave 11, and heatwave 12, while there are more obvious gaps compared to the medians of heatwave 2, heatwave 4, and heatwave 8, indicating that these heatwave definitions have significant deficiencies in predicting indoor overheating phenomena at higher standards. It is worth noting that when the 27 °C threshold is used for analysis, the median of the overheating degree of indoor overheating is generally low, and it is closer to the median distribution of heatwave 2, heatwave 4, and heatwave 8. This result further confirms the crucial influence of the setting of the indoor threshold on the research conclusions.
It is worth noting that most outdoor overheating events fail to effectively capture the peak overheating degree of indoor overheating. This phenomenon indicates that the existing outdoor heatwave indicators have significant limitations in predicting the risks of extreme indoor thermal environments. There is an urgent need to establish a more accurate coupling evaluation system for indoor and outdoor thermal environments to achieve effective early warning and prevention and control of potential indoor thermal safety hazards.

5. Discussion

5.1. Rationality of Heatwave Definition

The heatwave 6 index uses daily average air temperature as the screening criterion, which can better reflect the cumulative impact of outdoor thermal environment on indoor spaces compared with instantaneous maximum or minimum air temperatures. The thermal inertia of building envelopes can attenuate and delay air temperature fluctuations. The impact of instantaneous high air temperatures on the interior is significantly weakened after heat transfer through walls due to their short duration, whereas the daily average air temperature can comprehensively reflect the overall level of daily air temperature, showing a more direct correlation with indoor thermal conditions. In addition, this study is based on the 1995 building thermal engineering code. However, in some current buildings with enhanced thermal insulation measures, the thermal attenuation effect is further strengthened, making the indoor thermal environment more dependent on the daily cumulative amount of outdoor air temperature rather than instantaneous peaks. Therefore, using the daily average air temperature as the heatwave criterion is more consistent with the thermal characteristics of current building envelopes and can more accurately characterize the cumulative mechanism of indoor overheating risks. Compared with other indicators, heatwave 6 can more comprehensively reflect the continuous effect of outdoor thermal environment on indoor spaces and more accurately reflect the problem of indoor overheating.
Heatwave 7 takes into account both air temperature and humidity factors simultaneously. Its core logic lies in coupling the synergistic effects of air temperature and water vapor content on human thermal comfort through the principle of thermodynamic equilibrium. Although humidity does not directly participate in the heat transfer process of building envelopes, its impact on the indoor thermal environment profoundly acts on the human physiological level—a high-humidity environment significantly inhibits the heat dissipation efficiency of sweat evaporation, leading to the accumulation of human body heat and further exacerbating the perception of overheating. Compared with single air temperature indicators, the inclusion of humidity parameters can more accurately depict the composite thermal stress scenario of “high air temperature and high humidity”. In hot and humid environments, the air temperature remains high throughout the day and the humidity stays at a high level, and such climatic characteristics form a direct connection with the human thermoregulatory mechanism. However, for indicators that only use air temperature as the criterion, even if the daytime air temperature is extremely high, the sustainability of thermal stress is often weakened due to large diurnal air temperature differences. In hot and humid environments, however, the daily perceived air temperature remains high throughout the day. Therefore, heatwave 7 can more accurately reflect the actual characteristics of indoor overheating problems.

5.2. Impact of Different Thresholds of Heatwave Definitions

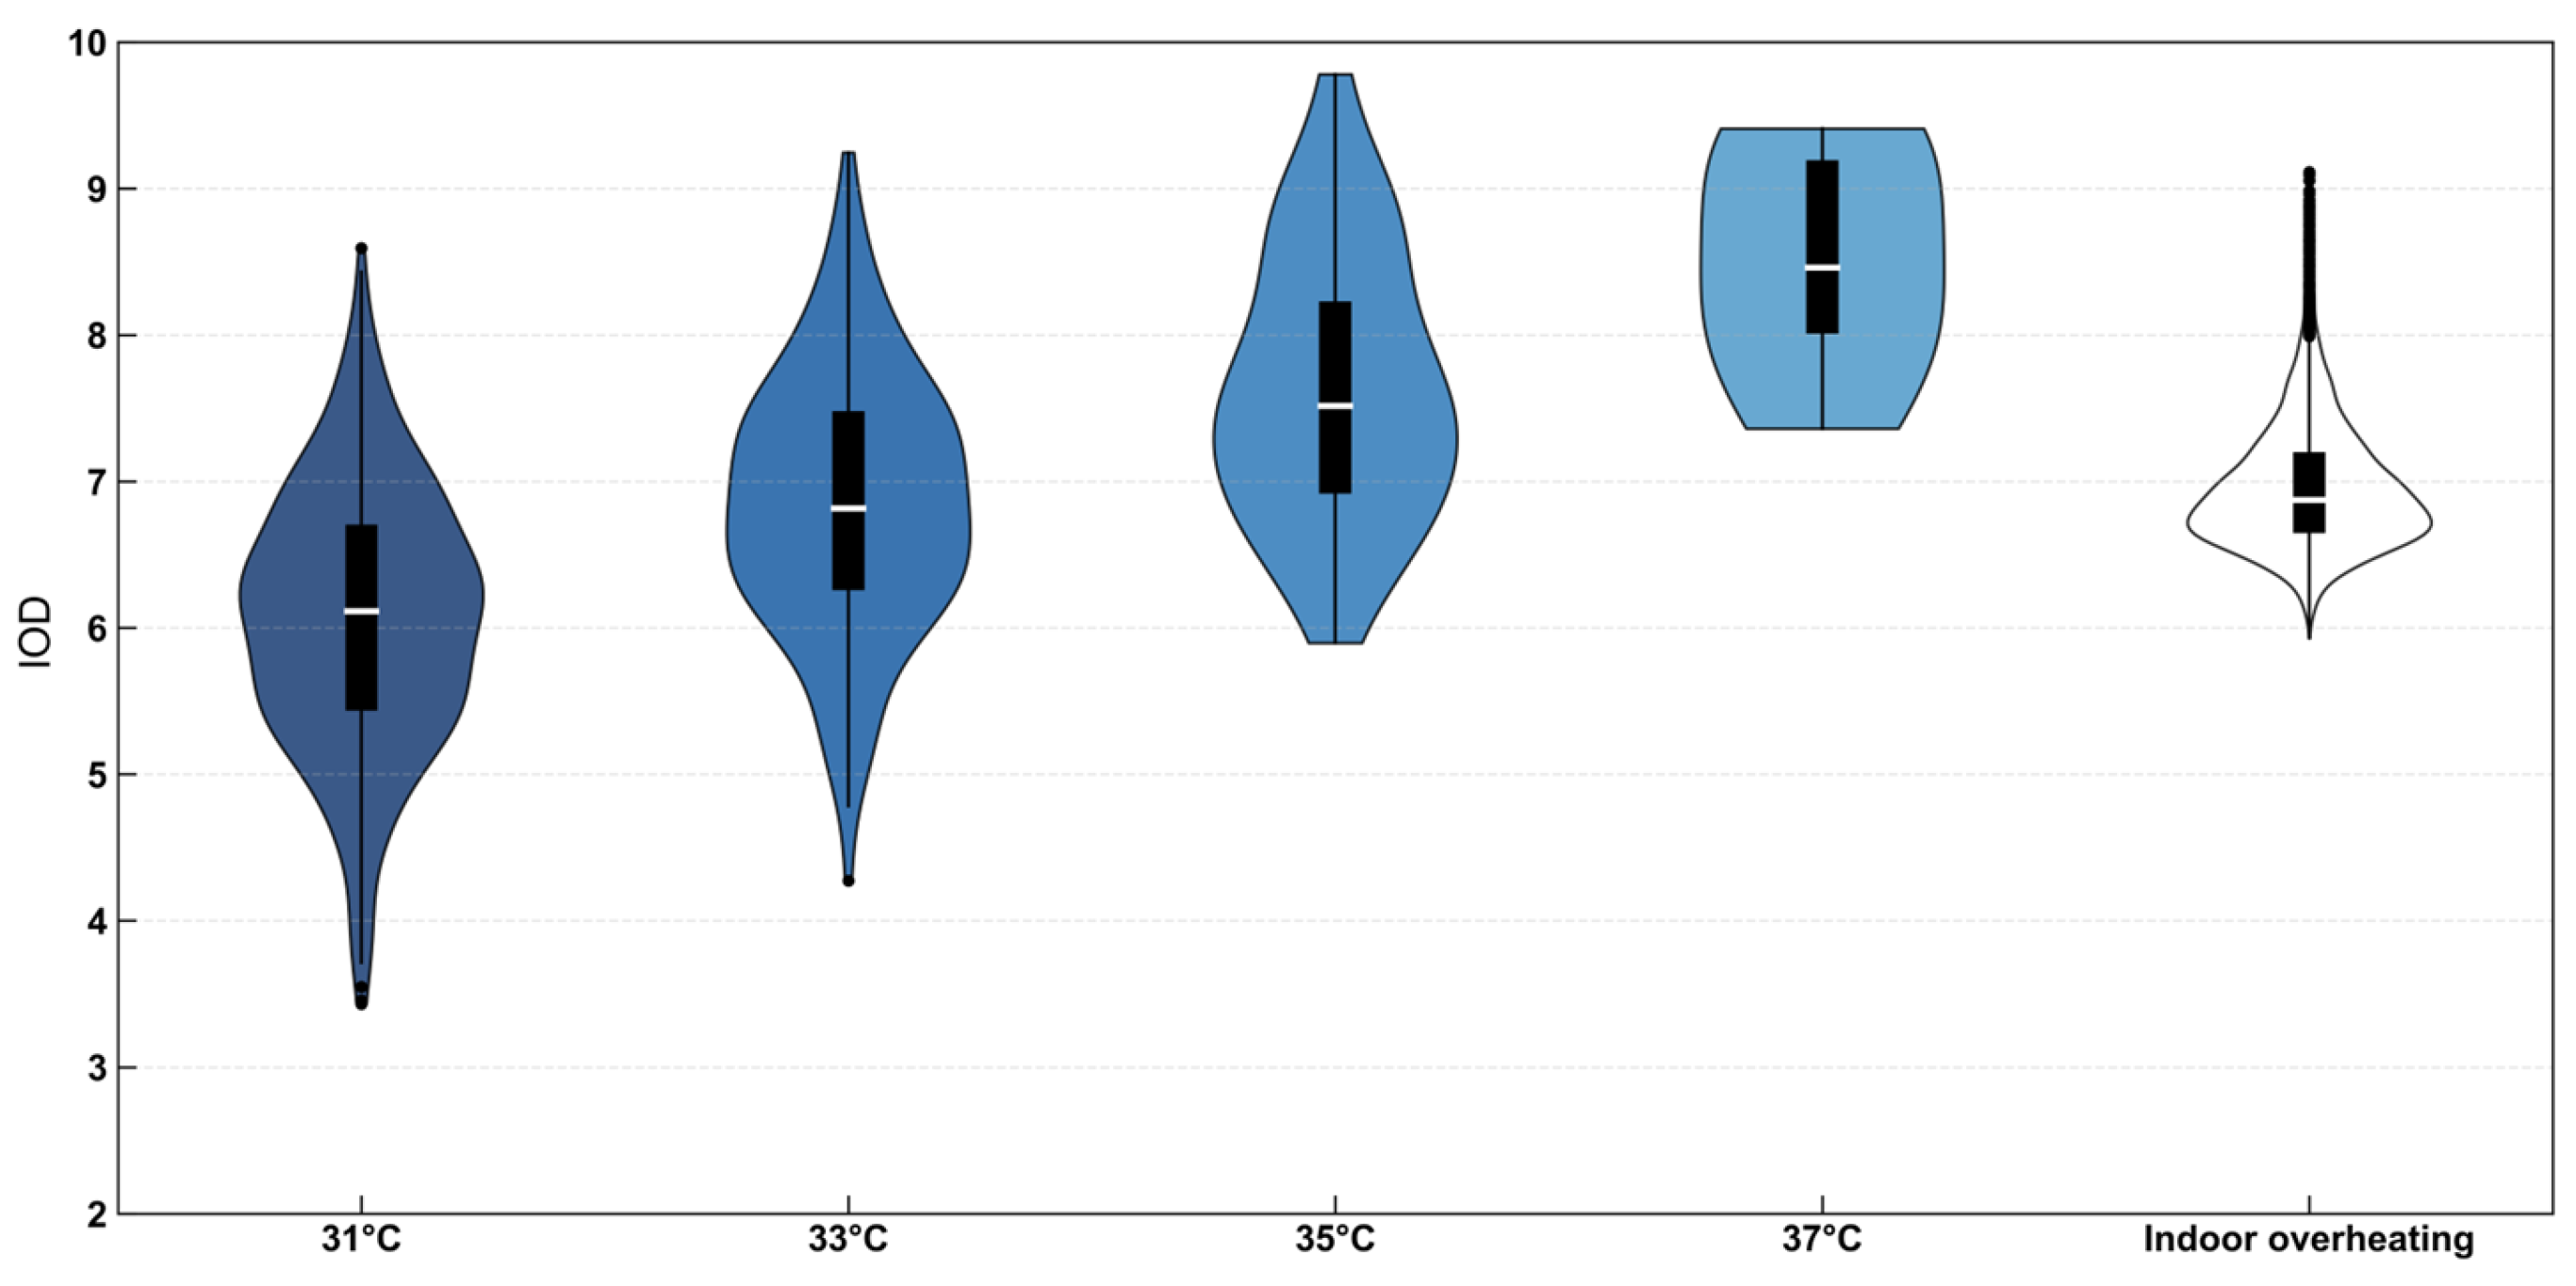
In this study, different heatwave definition methods are used to detect outdoor heatwaves. In addition to considering indicators of single air temperature, we also select other indicators related to factors such as humidity and radiation. However, the accuracy of heatwaves is not only related to these meteorological elements but also related to the thresholds for selecting heatwaves. Figure 13 shows the heatwave selection method defined by the China Meteorological Administration (heatwave 1) for detecting heatwaves, and different thresholds (31 °C, 33 °C, 35 °C, 37 °C) are set.
It is worth noting that as the threshold increases, the degree of impact on the risk of indoor overheating becomes more severe. When the threshold is low, the data are relatively concentrated with a small degree of dispersion. This indicates that under relatively mild heatwave conditions, the changes in indoor overheating are relatively stable. However, when the threshold rises, the degree of dispersion increases, presenting a more dispersed situation. This means that under more stringent heatwave threshold settings, the fluctuation range of indoor overheating expands, and the differences in indoor overheating performance in different scenarios become more prominent.
This also reflects that the setting of the heatwave threshold plays a crucial role in evaluating the risk of indoor overheating. A higher threshold implies a more stringent definition of heatwaves, enabling the capture of more extreme meteorological conditions. This, in turn, has a more intense impact on the indoor thermal environment and significantly increases the risk of indoor overheating.

5.3. Limitations

The heatwave 6 index uses daily average air temperature as the screening criterion, which can better reflect the cumulative impact of outdoor thermal conditions on indoor spaces compared to instantaneous maximum or minimum air temperatures. Due to the thermal inertia of building envelopes, indoor air temperature fluctuations are attenuated and delayed. Short-duration peaks in outdoor temperature have a significantly weakened effect on indoor spaces after heat transfer through walls. In contrast, the daily average air temperature provides a comprehensive measure of the overall daily indoor thermal conditions. In addition, in modern buildings with enhanced insulation, the thermal attenuation effect is further strengthened, making the indoor thermal environment more dependent on the daily cumulative amount of outdoor air temperature rather than instantaneous peaks. Therefore, using the daily average air temperature as the heatwave indicator is more consistent with the thermal characteristics of current building envelopes and can more accurately characterize the cumulative mechanism of indoor overheating risks. Compared with other indicators, heatwave 6 can more comprehensively reflect the continuous effect of outdoor thermal environment on indoor spaces and more accurately reflect the problem of indoor overheating.
Heatwave 7 integrates both air temperature and humidity parameters, comprehensively accounting for the synergistic effects of thermal and moisture conditions on human thermal comfort. Outdoor humidity infiltrates indoor spaces through ventilation and directly impacts human physiology—high humidity environments significantly impair evaporative cooling efficiency through sweat suppression, leading to heat accumulation in the human body and exacerbating thermal discomfort. Moreover, in hot and humid climates where elevated temperatures persist throughout the diurnal cycle, the risk of indoor overheating becomes significantly more pronounced. Consequently, heatwave 7 demonstrates superior accuracy in characterizing indoor overheating conditions by effectively capturing these sustained thermal stress patterns.

6. Conclusions

Against the backdrop of global warming, the threat of extreme climate events to the building environment is becoming more and more severe, not only seriously endangering the health and safety of residents, but also significantly increasing the operational risks of the energy system. However, the definition of current extreme air temperature events has not been unified. Existing studies mostly focus on outdoor heatwaves and neglect the uniqueness and complexity of the indoor thermal environment. Given that the indoor thermal environment is comprehensively affected by multiple factors and there are significant spatiotemporal differences between the indoor and outdoor thermal environments in relation to heatwaves, traditional evaluation indicators for outdoor heatwaves are difficult to accurately reflect the indoor thermal risks. Therefore, constructing a scientific and systematic evaluation system for coupled indoor and outdoor heatwaves and deeply analyzing the correlation mechanism of indoor and outdoor overheating phenomena are of great theoretical and practical significance for enhancing the thermal resilience of buildings and promoting the coordinated development of building electrification and climate adaptation. The main conclusions are explained below:
Significant differences exist in the identification results of heatwave events under different heatwave definitions. Analysis of 71-year meteorological data reveals significant divergences in occurrence frequency, duration, and intensity metrics across different heatwave indicators. For example, heatwave 4 occurred 773 times in total, while heatwave 1 only occurred 44 times. The durations of heatwave 2 and heatwave 8 exceed 40 days. The intensities of heatwaves 4, 5, and 8 exceeds 6 °C/h, and those of heatwaves 1, 7, and 11 are lower than 2 °C/h. Further classification analysis shows that the two types of heatwaves, HW_S_M and HW_L_I, account for more than 60%. Among them, due to both high intensity (exceeding 6 °C/h) and long duration (exceeding 10 days), the superposition effect of high temperature and long duration of HW_L_I have the most serious impact on human health and the ecosystem. These findings underscore that definition selection critically determines indoor overheating risk assessments, with HW_L_I representing a priority target for early-warning systems and adaptive strategies.
During the 71-year long-term monitoring period in Beijing, when there is no air conditioning indoors or power outages occur, the HI remains below the safe threshold of 27 °C for most periods, with a low probability of health risks caused by high temperatures. It is noteworthy, however, that the HI in the range of 27–32 °C is relatively common, and prolonged exposure to such an environment requires vigilance against the risks of fatigue and heat cramps. Although high-temperature scenarios with HI exceeding 32–39 °C occur less frequently, buildings frequently enter the temperature range requiring warnings. This phenomenon indicates that while the indoor thermal environment is generally within a comfortable range, the episodic extremes still need to be given high attention.
Through the analysis of the correlation between indoor and outdoor overheating based on the degree of overheating and the degree of coincidence, it has been found that the existing outdoor heatwave indicators have significant limitations in predicting the risks of extreme indoor thermal environments, and it is difficult to effectively capture the peak overheating degree of indoor overheating. By comparing different heatwave definitions, heatwave 6 and heatwave 7 perform the best in taking into account the characteristics of both indoor and outdoor heatwaves. Among them, although heatwave 6 is determined solely based on the daily average air temperature, its higher discrimination threshold makes its detection results superior to other single air temperature indicators. In addition, the setting of the heatwave threshold plays a crucial role in evaluating the risk of indoor overheating. A higher threshold implies a more stringent definition of heatwaves, enabling the capture of more extreme meteorological conditions.
The indoor–outdoor coupled heatwave evaluation method proposed in this study provides an important methodological foundation for assessing the effectiveness of heatwave indicators. When systematically extended through future studies across different building types, climate zones, and occupant behaviors, this method holds significant potential to inform optimal design of building thermal resilience, enable precise early warning of indoor overheating, and facilitate coordinated development of building electrification and climate adaptability in Beijing, effectively helping to enhance the ability of buildings to cope with extreme weather.

Author Contributions

Conceptualization, J.A.; methodology, W.L., J.A., C.W. and S.H.; validation, W.L. and J.A.; writing—original draft preparation, W.L.; writing—review and editing, J.A., C.W. and S.H.; visualization, W.L. and J.A. All authors have read and agreed to the published version of the manuscript.

Funding

This work was supported by the National Natural Science Foundation of China (No. 52108068, 52478095, 72261147760), R&D Program of Beijing Municipal Education Commission (Grant Number KM202410016014), and the Pyramid Talent Training Project of Beijing University of Civil Engineering and Architecture (Grant Number JDYC20220815).

Data Availability Statement

Data will be made available on request.

Conflicts of Interest

The authors declare no conflicts of interest.

References

  1. Intergovernmental Panel on Climate Change. Climate Change 2021: The Physical Science Basis. Contribution of Working Group I to the Sixth Assessment Report of the Intergovernmental Panel on Climate Change; Cambridge University Press: Cambridge, UK, 2023. [Google Scholar]
  2. World Meteorological Organization. State of the Global Climate 2023; World Meteorological Organization: Geneva, Switzerland, 2023. [Google Scholar]
  3. China Meteorological Administration Climate Change Center. China Climate Change Blue Book; Science Press: Beijing, China, 2024. [Google Scholar]
  4. Zhang, S.; Zhang, C.; Cai, W.; Bai, Y.; Callaghan, M.; Chang, N.; Chen, B.; Chen, H.; Cheng, L.; Dai, H.; et al. The 2023 China report of the lancet countdown on health and climate change: Taking stock for a thriving future. Lancet Public Health 2023, 8, e978–e995. [Google Scholar] [CrossRef]
  5. International Energy Agency. World Energy Outlook 2021; International Energy Agency: Paris, France, 2021. [Google Scholar]
  6. Seneviratne, S.I.; Zhang, X.; Adnan, M.; Badi, W.; Dereczynski, C.; Luca, A.D.; Ghosh, S.; Iskandar, I.; Kossin, J.; Lewis, S.; et al. Weather and climate extreme events in a changing climate. In Climate Change 2021: The Physical Science Basis; Cambridge University Press: Cambridge, UK, 2021. [Google Scholar]
  7. Zhang, C.; Kazanci, O. Aalborg Universitet IEA EBC Annex 80-Dynamic Simulation Guideline for the Performance Testing of Resilient Cooling Strategies: Version 2; Aalborg University: Aalborg, Denmark, 2023. [Google Scholar]
  8. Levinson, R.; Arens, E.; Bozonnet, E.; Corrado, V.; Gilbert, H.; Holzer, P.; Jaboyedoff, P.; Krelling, A.; Machard, A.; Miller, W.; et al. Policy Recommendations from IEA EBC Annex 80: Resilient Cooling of Buildings; International Energy Agency: Paris, France, 2023. [Google Scholar]
  9. Wu, X.L.; Liu, Q.S.; Liu, G.H.; Huang, C.; Li, H. A review of research on high-temperature heatwave risk assessment. J. Geo-Inf. Sci. 2019, 21, 1029–1039. [Google Scholar]
  10. Zhang, Y.; Xiao, T.G.; Zeng, J.T.; Du, Y. Study on the spatiotemporal distribution characteristics of high-temperature heatwaves in Southwest China from 1979 to 2019. Nat. Sci. 2020, 8, 207–219. [Google Scholar]
  11. Ouzeau, G.; Soubeyroux, J.M.; Schneider, M.; Vautard, R.; Planton, S. Heat waves analysis over France in present and future climate: Application of a new method on the EURO-CORDEX ensemble. Clim. Serv. 2016, 4, 1–12. [Google Scholar] [CrossRef]
  12. Heo, S.; Bell, L.M.; Lee, J. Comparison of health risks by heat wave definition: Applicability of wet-bulb globe temperature for heat wave criteria. Environ. Res. 2019, 168, 158–170. [Google Scholar] [CrossRef]
  13. Xu, C.; Wei, R.H.; Tong, H. A Systematic Review of Methodological Advances in Urban Heatwave Risk Assessment: Integrating Multi-Source Data and Hybrid Weighting Methods. Sustainability 2025, 17, 3747. [Google Scholar] [CrossRef]
  14. Cheng, Q.P.; Jin, H.Y.; Ren, Y.T. Compound daytime and nighttime heatwaves for air and surface temperature based on relative and absolute threshold dynamic classified in Southwest China, 1980–2019. Sustain. Cities Soc. 2023, 91, 104433. [Google Scholar] [CrossRef]
  15. Xu, Z.W.; Cheng, J.; Hu, W.B.; Tong, S.L. Heatwave and health events: A systematic evaluation of different temperature indicators, heatwave intensities and durations. Sci. Total Environ. 2018, 630, 679–689. [Google Scholar] [CrossRef] [PubMed]
  16. Sun, S.Q.; Yu, K.A.; Guo, J.M.; Shen, H.Y.; Wang, L. Analysis of urban high-temperature characteristics and heatwave indices: A case study of Ningbo City. Agric. Technol. 2016, 36, 215. [Google Scholar]
  17. Zhang, M. Spatiotemporal Analysis of Extreme High-Temperature Events in China Based on Multi-Indicators and Multi-Scales. Master’s Thesis, Shanghai Normal University, Shanghai, China, 2016. [Google Scholar]
  18. Yang, X.; Zhang, N. Analysis of influencing factors of indoor temperature in buildings. Energy Conserv. 2021, 40, 74–76. [Google Scholar]
  19. Azin, V.F.; Juha, J.; Natalia, K.; Kirsti, J.; Risto, K. Hot Summers in Nordic Apartments: Exploring the Correlation between Outdoor Weather Conditions and Indoor Temperature. Buildings 2024, 14, 1053. [Google Scholar] [CrossRef]
  20. Li, J.; Ren, G.Y.; Zhan, Y.J. A brief discussion on the method of determining thresholds in the study of extreme temperature events. Adv. Meteorol. Sci. Technol. 2013, 3, 36–40. [Google Scholar]
  21. Zhong, X.; Zheng, J.M.; He, F.; Zhan, Z. Study on the optimal definition of heatwaves in subtropical regions based on the mortality effect of cardiovascular diseases. J. Environ. Hyg. 2024, 14, 634–640+666. [Google Scholar]
  22. Liu, Q.Y. Research on the Temperature-Humidity Compound Heatwave Events and Population Exposure in the Middle and Lower Reaches of the Yangtze River. Doctoral Dissertation, Nanjing University of Information Science and Technology, Nanjing, China, 2023, unpublished. [Google Scholar]
  23. Yan, X.; Huang, X.J.; Zhang, Y.X.; Zhao, K.; Li, L. Evolution characteristics of high-temperature heatwaves and population exposure risk in the Yangtze River Economic Belt. Resour. Environ. Yangtze Basin 2024, 33, 1041–1054. [Google Scholar]
  24. Huang, Z.; Chen, H.; Tian, H. Study on the index of warm heatwaves. Meteorol. Mon. 2011, 37, 345–351. [Google Scholar]
  25. Zhu, Y.X. Building Environment, 4th ed.; China Architecture & Building Press: Beijing, China, 2016. [Google Scholar]
  26. Sun, K.; Specian, M.; Hong, T. Nexus of thermal resilience and energy efficiency in buildings: A case study of a nursing home. Build. Environ. 2020, 177, 106842. [Google Scholar] [CrossRef]
  27. Heo, S.; Bell, M.L. Heat waves in South Korea: Differences of heat wave characteristics by thermal indices. J. Expo. Sci. Environ. Epidemiol. 2019, 29, 790–805. [Google Scholar] [CrossRef]
  28. Guo, S.; Yan, D.; Hong, T.; Zhao, C.; Cui, Y. A novel approach for selecting typical hot-year (THY) weather data. Appl. Energy 2019, 242, 1634–1648. [Google Scholar] [CrossRef]
  29. Qian, B.; Yu, T.; Zhang, C.; Heiselberg, P.K.; Lei, B.; Yang, L. Suitability of heat wave event definitions for assessing indoor overheating in current and future climate: A case study in China. Build. Environ. 2023, 241, 110487. [Google Scholar] [CrossRef]
  30. Liu, X.; Liu, Z.; Wu, Y.; Hu, S.; Bu, F.; An, J.; Zhou, X.; Yan, D. A novel quantitative method of heatwave classification for building resilience analysis. Sustain. Cities Soc. 2024, 112, 105603. [Google Scholar] [CrossRef]
  31. Occupational Safety and Health Administration. Using the Heat Index: A Guide for Employers Introduction; Occupational Safety and Health Administration: Washington, DC, USA, 2016. [Google Scholar]
  32. National Oceanic and Atmospheric Administration. Heat Index. 2018. Available online: https://www.weather.gov/safety/heat-index (accessed on 10 July 2025).
  33. World Meteorological Organization; World Health Organization. Heatwaves and Health: Guidance on Warning-System Development; WMO & WHO: Geneva, Switzerland, 2015. [Google Scholar]
  34. Opitz-Stapleton, S.; Sabbag, L.; Hawley, K.; Tran, P.; Hoang, L.; Hoang, P. Heat index trends and climate change implications for occupational heat exposure in Da Nang, Vietnam. Clim. Serv. 2016, 2–3, 41–51. [Google Scholar] [CrossRef]
  35. Wehner, M.; Castillo, F.; Stone, D. The Impact of Moisture and Temperature on Human Health in Heat Waves. Oxford Research Encyclopedia of Natural Hazard Science. 2017. Available online: https://oxfordre.com/naturalhazardscience/view/10.1093/acrefore/9780199389407.001.0001/acrefore-9780199389407-e-58 (accessed on 10 July 2025).
  36. National Oceanic and Atmospheric Administration. What Is the Heat Index? 2018. Available online: https://www.weather.gov/ama/heatindex (accessed on 10 July 2025).
  37. National Oceanic and Atmospheric Administration. Weather Related Fatality and Injury Statistics. 2019. Available online: https://www.weather.gov/hazstat/ (accessed on 4 August 2019).
  38. Hamdy, M.; Carlucci, S.; Hoes, P.; Hensen, J.L. The impact of climate change on the overheating risk in dwellings—A Dutch case study. Build. Environ. 2017, 122, 307–323. [Google Scholar] [CrossRef]
  39. ISO 17772-1; Energy Performance of Buildings-Indoor Environmental Quality. Part 1: Indoor Environmental Input Parameters for the Design and Assessment of Energy Performance in Buildings. ISO: Geneva, Switzerland, 2017.
  40. Cui, Y.; Yan, D.; Hong, T.; Ma, J. Temporal and spatial characteristics of the urban heat island in Beijing and the impact on building design and energy performance. Energy 2017, 130, 286–297. [Google Scholar] [CrossRef]
  41. Chen, Z.; Yang, G.; Li, Y.; Wan, J.; Sang, M. Characteristics of climate change in Beijing over the past 60 years and analysis of its causes. Geol. Rev. 2015, 61, 7–8. [Google Scholar]
  42. Gao, S.; An, J.; Wang, C.; Yan, D.; Ma, J. Impact of climate change on air-conditioning power consumption of residential buildings in Beijing. Heat. Vent. Air Cond. 2023, 53, 44–52+16. [Google Scholar]
  43. Li, Z.; Jiang, Y.; Yan, D. Simulation Analysis of Residential Intermittent Heating. Heat. Vent. Air Cond. 2005, 35, 110–113+140. [Google Scholar]
  44. JGJ 26-95; Energy-Saving Design Standard for Civil Buildings. China Building Industry Press: Beijing, China, 1995.
  45. Wang, C.; Li, X.; Sun, W.; An, J.; Gao, S. Occupant behavior, thermal environment, and appliance electricity use of a single-family apartment in China. Sci. Data 2024, 11, 65. [Google Scholar] [CrossRef] [PubMed]
  46. Hu, S.; Yan, D.; Guo, S.; Cui, Y.; Dong, B. A survey on energy consumption and energy usage behavior of households and residential building in urban China. Energy Build. 2017, 148, 366–378. [Google Scholar] [CrossRef]
  47. Gui, C.; Yan, D.; Guo, S.; An, J. Study on typical building models in Beijing based on actual energy consumption characteristics. Build. Sci. 2020, 36, 14–22. [Google Scholar]
  48. GB50736-2012; Design Code for Heating, Ventilation and Air Conditioning of Civil Buildings Design Code for Heating, Ventilation and Air Conditioning for Civil Buildings. China Planning Press: Beijing, China, 2012.
  49. Yan, D.; Zhou, X.; An, J.; Kang, X.; Bu, F.; Chen, Y.; Pan, Y.; Gao, Y.; Zhang, Q.; Zhou, H.; et al. DeST 3.0: A new-generation building performance simulation platform. Build. Simul. 2022, 15, 1849–1868. [Google Scholar] [CrossRef]
  50. An, J.; Wu, Y.; Gui, C.; Yan, D. Chinese prototype building models for simulating the energy performance of the nationwide building stock. Build. Simul. 2023, 16, 1559–1582. [Google Scholar] [CrossRef]
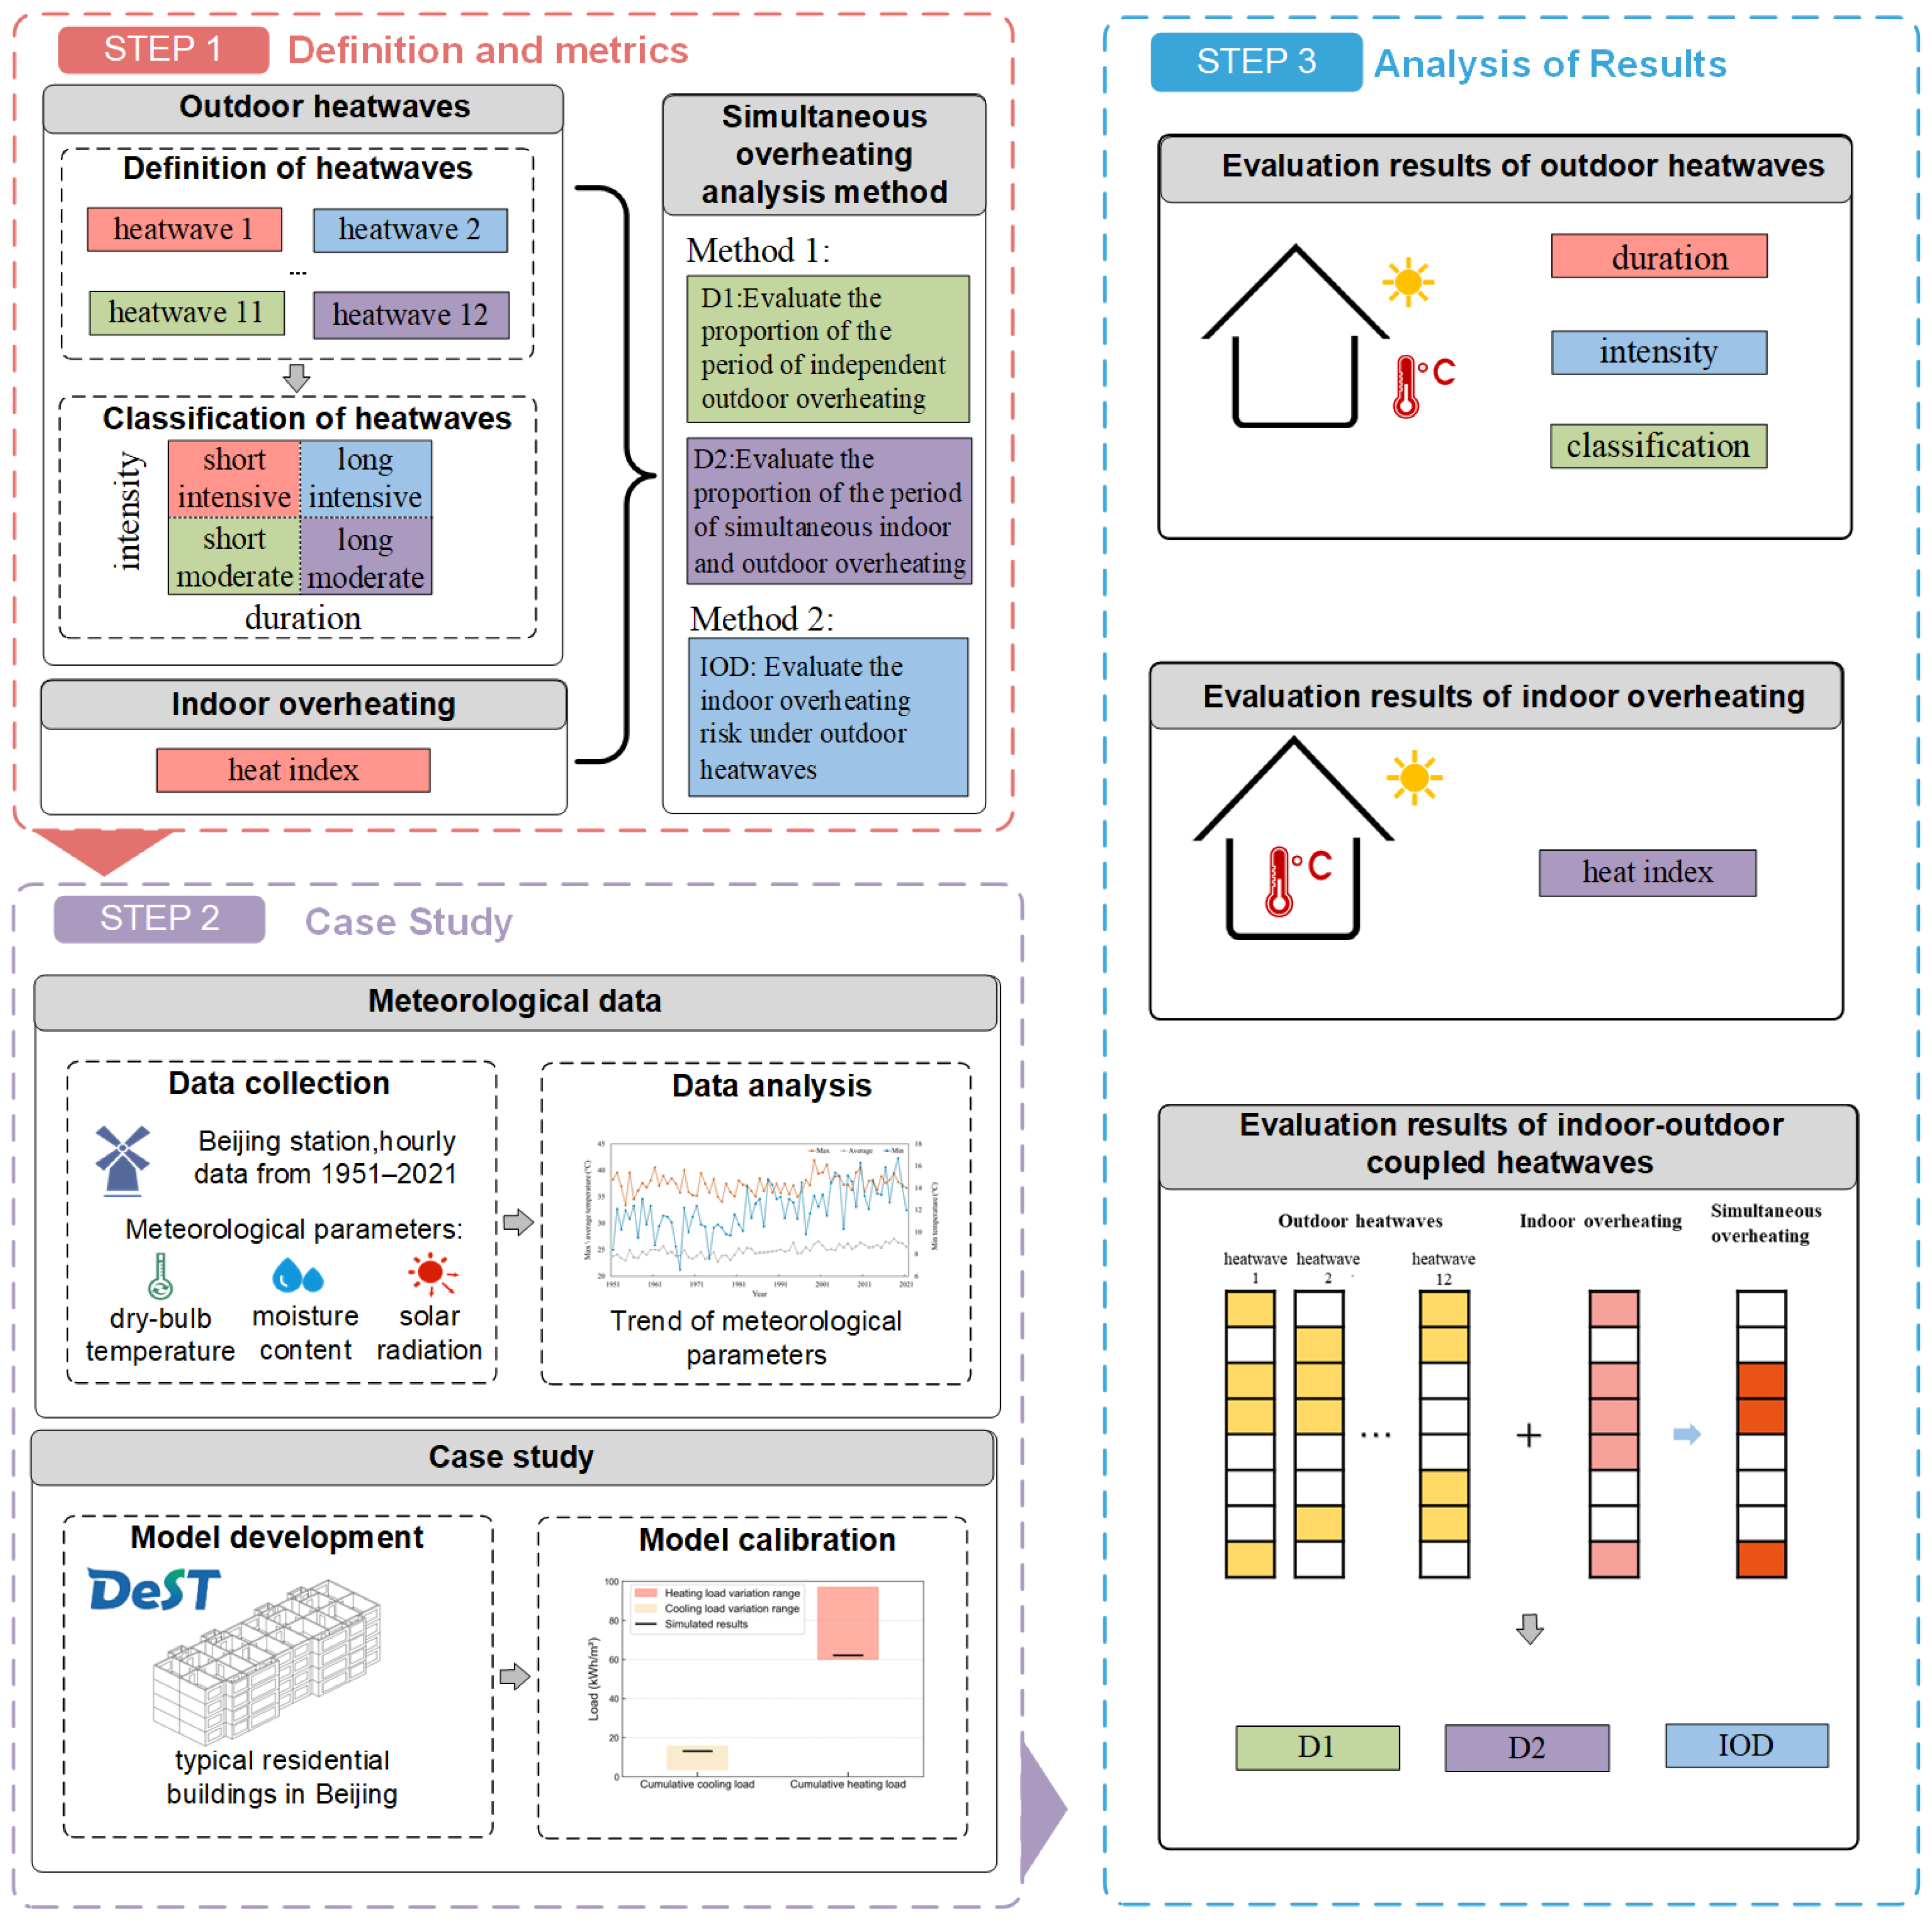
Figure 1. Overall technical framework.
Buildings 15 02461 g001
Figure 2. Overall workflow.
Buildings 15 02461 g002
Figure 3. HI map [32] and range [37].
Buildings 15 02461 g003
Figure 4. Method for discrimination of simultaneous overheating.
Buildings 15 02461 g004
Figure 5. Actual meteorological data in cooling seasons spanning 71 years of Beijing.
Buildings 15 02461 g005aBuildings 15 02461 g005b
Figure 6. A residential building model [43].
Buildings 15 02461 g006
Figure 7. Comparison of heatwave events under different definitions over 71 years.
Buildings 15 02461 g007aBuildings 15 02461 g007b
Figure 8. The classification results of heatwave events using different definitions.
Buildings 15 02461 g008
Figure 9. The indoor thermal index of buildings over 71 years.
Buildings 15 02461 g009
Figure 10. The overlap degree between outdoor heatwave events and indoor overheating over 71 years under different definitions.
Buildings 15 02461 g010
Figure 11. The overlapping situation of indoor and outdoor overheating during the cooling season in 2019 for the main rooms.
Buildings 15 02461 g011
Figure 12. Comparison of the degree of overheating between outdoor heatwave events and indoor overheating over 71 years under different definitions.
Buildings 15 02461 g012
Figure 13. The overheating degree distribution of each heatwave type under different heatwave definitions using the mean value as a threshold.
Buildings 15 02461 g013
Table 1. Indicators for defining heatwaves based on a single temperature parameter.
NameDefinitionDurationLiterature Source
Heatwave 1Number of High-temperature DaysThe number of days when the daily maximum temperature is ≥35 °C≥3 d[20]
Heatwave 2Number of Summer DaysThe number of days when the daily maximum temperature is >25 °C\
Heatwave 3Number of Warm Daytime DaysThe number of days when the daily maximum temperature is >the 90th percentile value\
Heatwave 4Number of Hot Night DaysThe number of days when the daily minimum temperature is >20 °C\
Heatwave 5Number of Warm Night DaysThe number of days when the daily minimum temperature is >the 90th percentile value\
Heatwave 6Daily Average TemperatureThe number of days when the daily average temperature is ≥the 95th percentile value≥4 d[21]
Table 2. Indicators for defining heatwaves considering multiple factors.
NameCalculation FormulaDefinitionDurationLiterature Source
Heatwave 7Wet-bulb Temperature T w = T a a t a n 0.151977 ( R H + 8.313659 ) 1 2 + atan T a + R H atan R H 1.676331 + 0.00391838 R H 1 2 atan 0.023101 R H 4.686035 The number of days when the wet-bulb temperature is >the 90th percentile value≥3 d[22]
Heatwave 8Wet-bulb Globe Temperature T w = 0.567 T a + 3.94
+ 0.393 e s
e s = 6.1121
× 1.0007 + 1.00000346 P
× 18.729 T a 227.3 × T a 237.7 + T a
The number of days when the wet-bulb globe temperature is >30 °C\[23]
Heatwave 9Thermal Stress Index E r = 1.8 T a 0.55 1.8 T a 26 × 1 0.6 + 32 ,
R H ≤ 60%
E r = 1.8 T a 0.55 1.8 T a 26 × 1 R H + 32 ,
R H   >  60%
The number of days when the heat index is >87.3 °C\[24]
Heatwave 10Outdoor Comprehensive Air Temperature T z = T a + a I α o u t The number of days when the outdoor comprehensive air temperature is >the 90th percentile value≥3 d[25]
Heatwave 11Heat Index H I = 8.78469475556
+ 1.61139411 T a
+ 2.33854883889 R H
+ 0.14611605 T a R H
+ 0.012308094 T a 2
+ ( 0.0164248277778 ) R H 2
+ 0.002211732 T a 2 R H + 0.00072546 T a R H 2
+ ( 0.000003582 ) T a 2 R H 2
The number of days when the heat index is >the 90th percentile value≥2 d[26]
Heatwave 12Approximate Globe Temperature T w = 0.735 T a
0.0374 R H + 0.00292 T a R H
+ 7.916 S R 4.557 S R 2 0.0573 W S 4.064
The number of days when the approximate globe temperature is >the 90th percentile value≥2 d[27]
Table 3. Coefficient values in the HI calculation formula.
c1 = −8.78469475556c2 = 1.61139411c3 = 2.33854882889
c4 = −0.14611605c5 = −0.0123080904c6 = −0.0164248277778
c7 = 0.002211732c8 = 0.00072546c9 = −0.000003582
Table 4. Building information.
AttributeValue
Total floor area (m2)1369.8
Height per floor (m)2.7
Number of floors4
Shape coefficient (m−1)0.378
Window-to-wall ratio0.26
Table 5. Building envelope construction details.
EnvelopeHeat Transfer Coefficient (W/m2·K)Thermal Inertia IndexMaterialsThickness (mm)
External walls0.9002.255Reinforced concrete200
Polystyrene foam39
Interior wall0.4302.690Cement mortar20
Ceramic concrete180
Cement mortar20
Roofs0.8092.825Reinforced concrete250
Expanded polystyrene sheet43
Windows4.700\Glass (double-layer)3
SC (shading coefficient) 0.83
Table 6. Occupancy for main rooms.
Room TypeOccupancy Time (h)
MidweekWeekend
Master bedroom/Children’s bedroom0–6; 22–230–6; 13–14; 22–23
Living room/Study17–196–9; 15–17; 19–21
Table 7. Internal heat gains settings for main rooms.
Parameter SettingDetails
Occupant thermal disturbancePer capita heat emission: 53 W
Per capita moisture production: 0.061 kg/hr
Lighting thermal disturbanceElectrical-to-thermal conversion efficiency: 0.9
Equipment thermal disturbanceMaximum power: 12.7 W
Disclaimer/Publisher’s Note: The statements, opinions and data contained in all publications are solely those of the individual author(s) and contributor(s) and not of MDPI and/or the editor(s). MDPI and/or the editor(s) disclaim responsibility for any injury to people or property resulting from any ideas, methods, instructions or products referred to in the content.