Comparative Study on Outdoor Heatwave Indicators for Indoor Overheating Evaluation


Abstract
1. Introduction
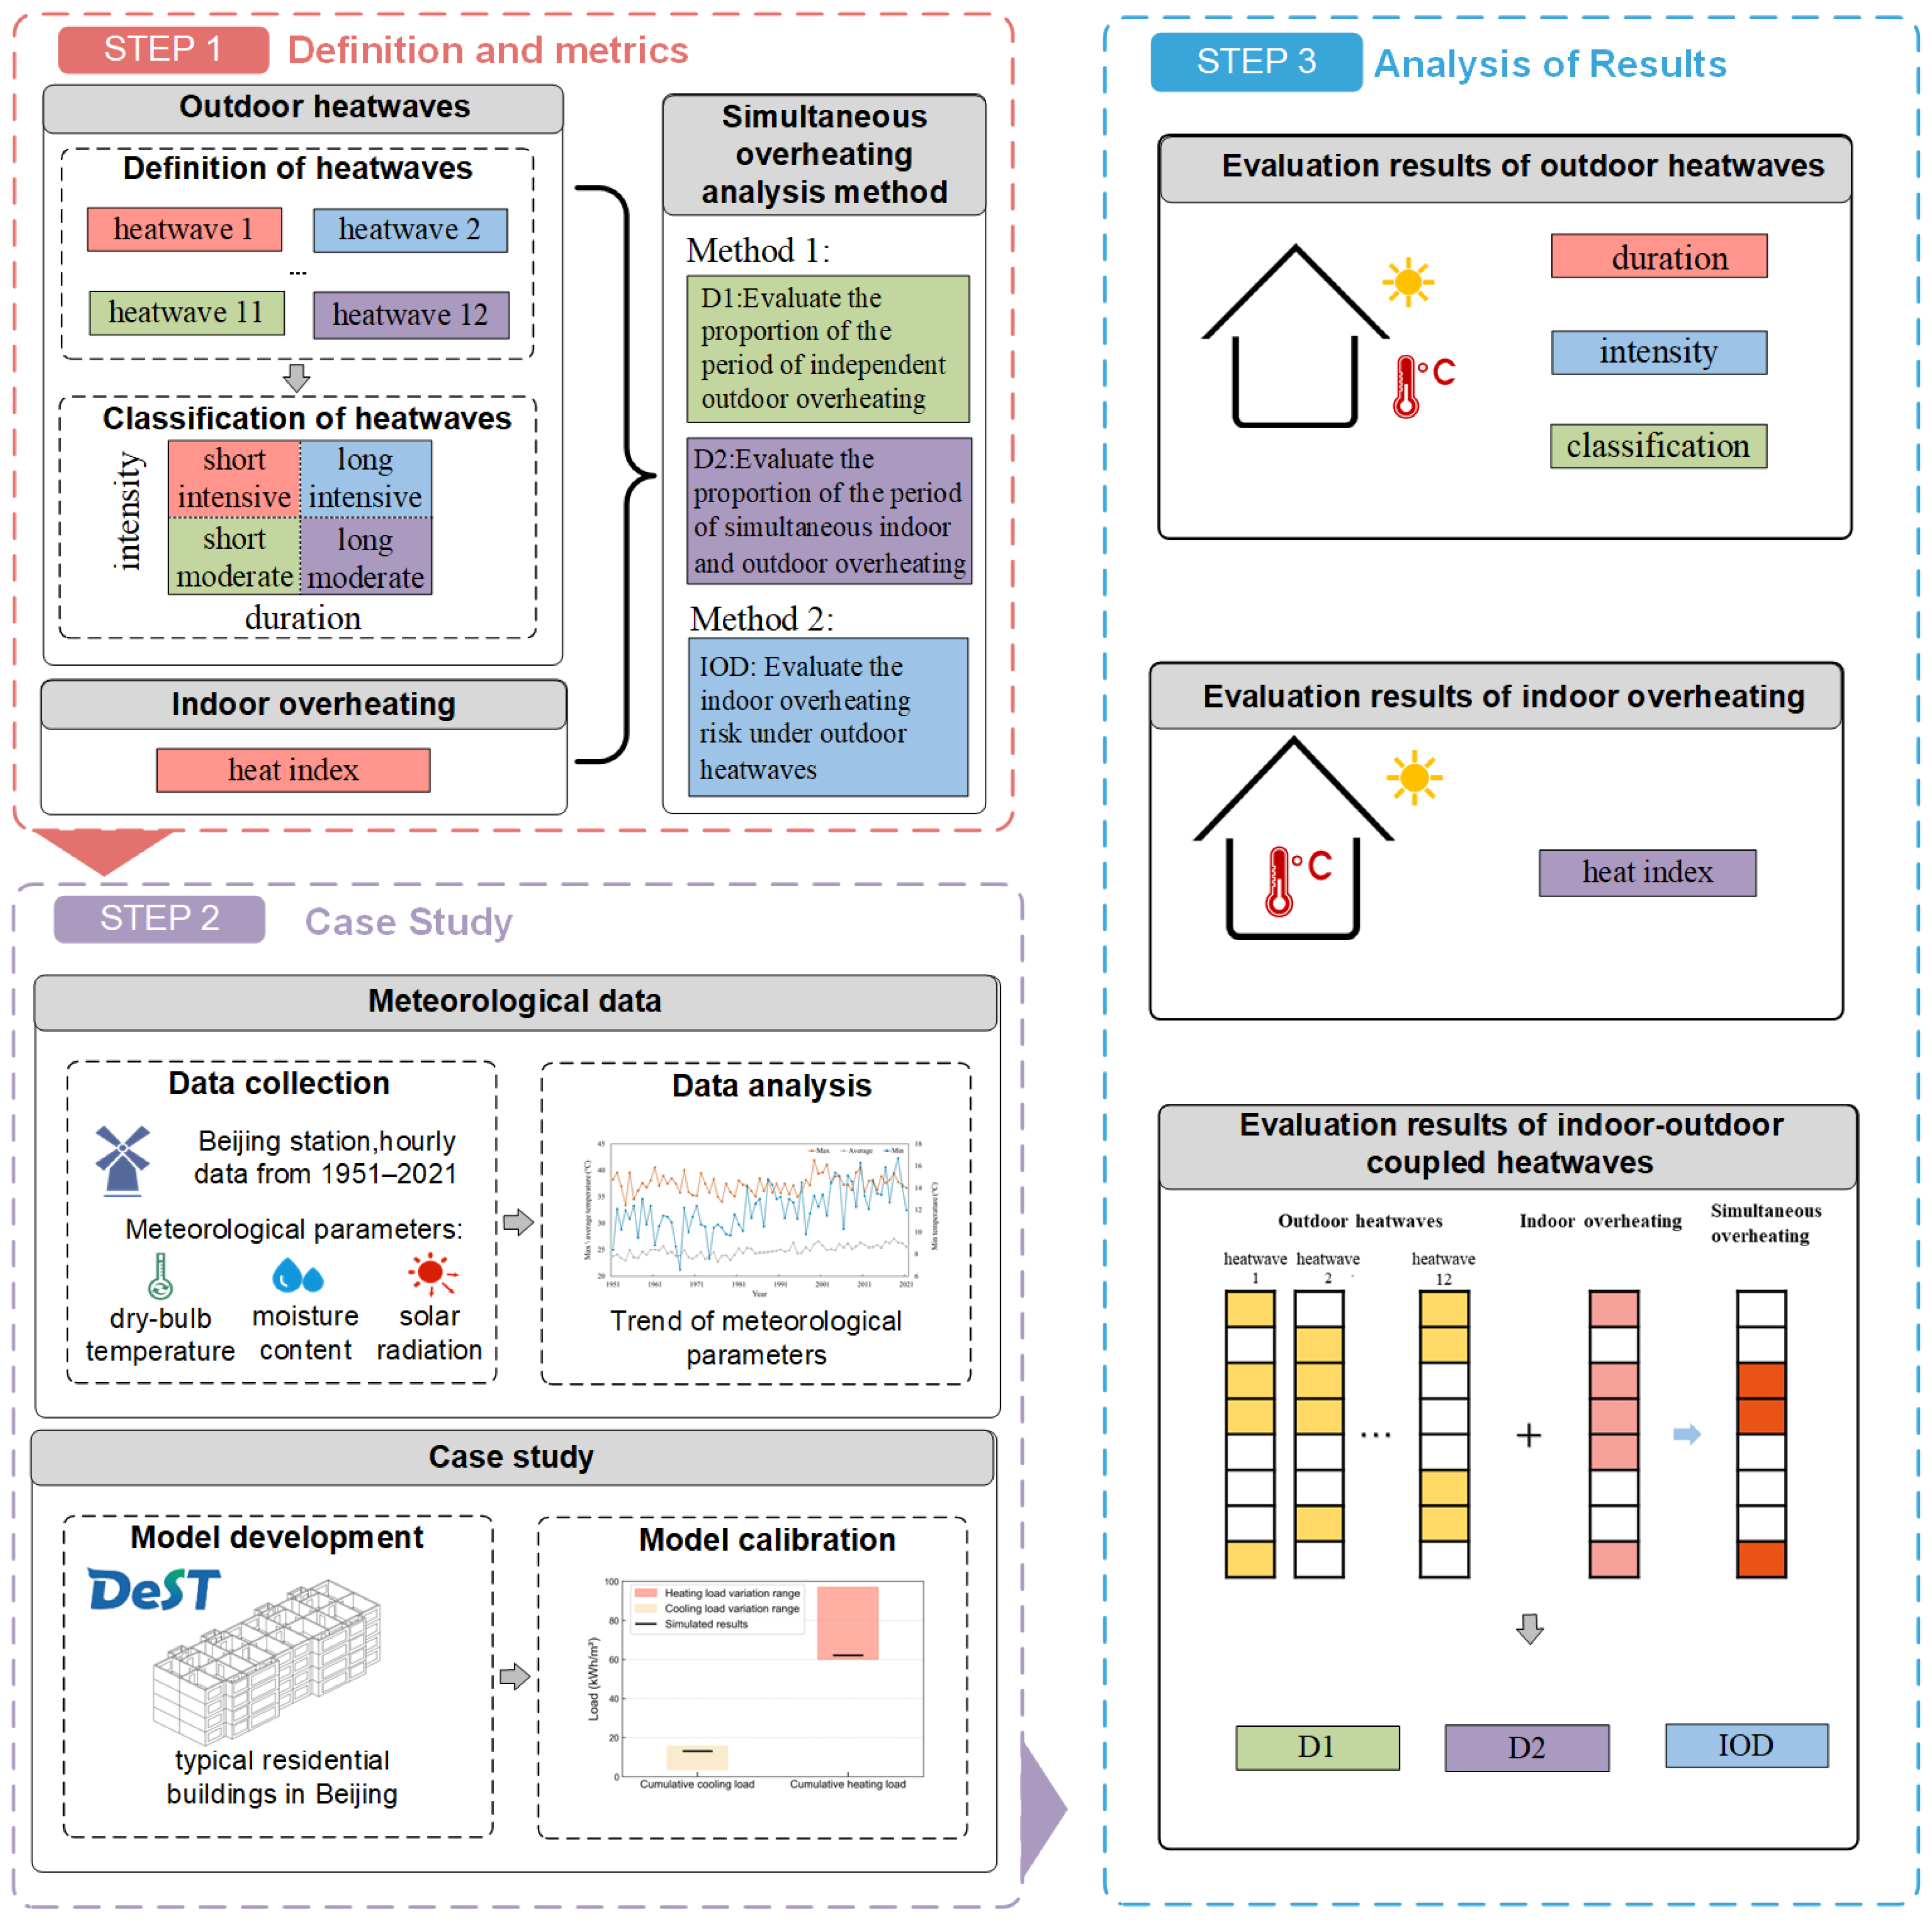
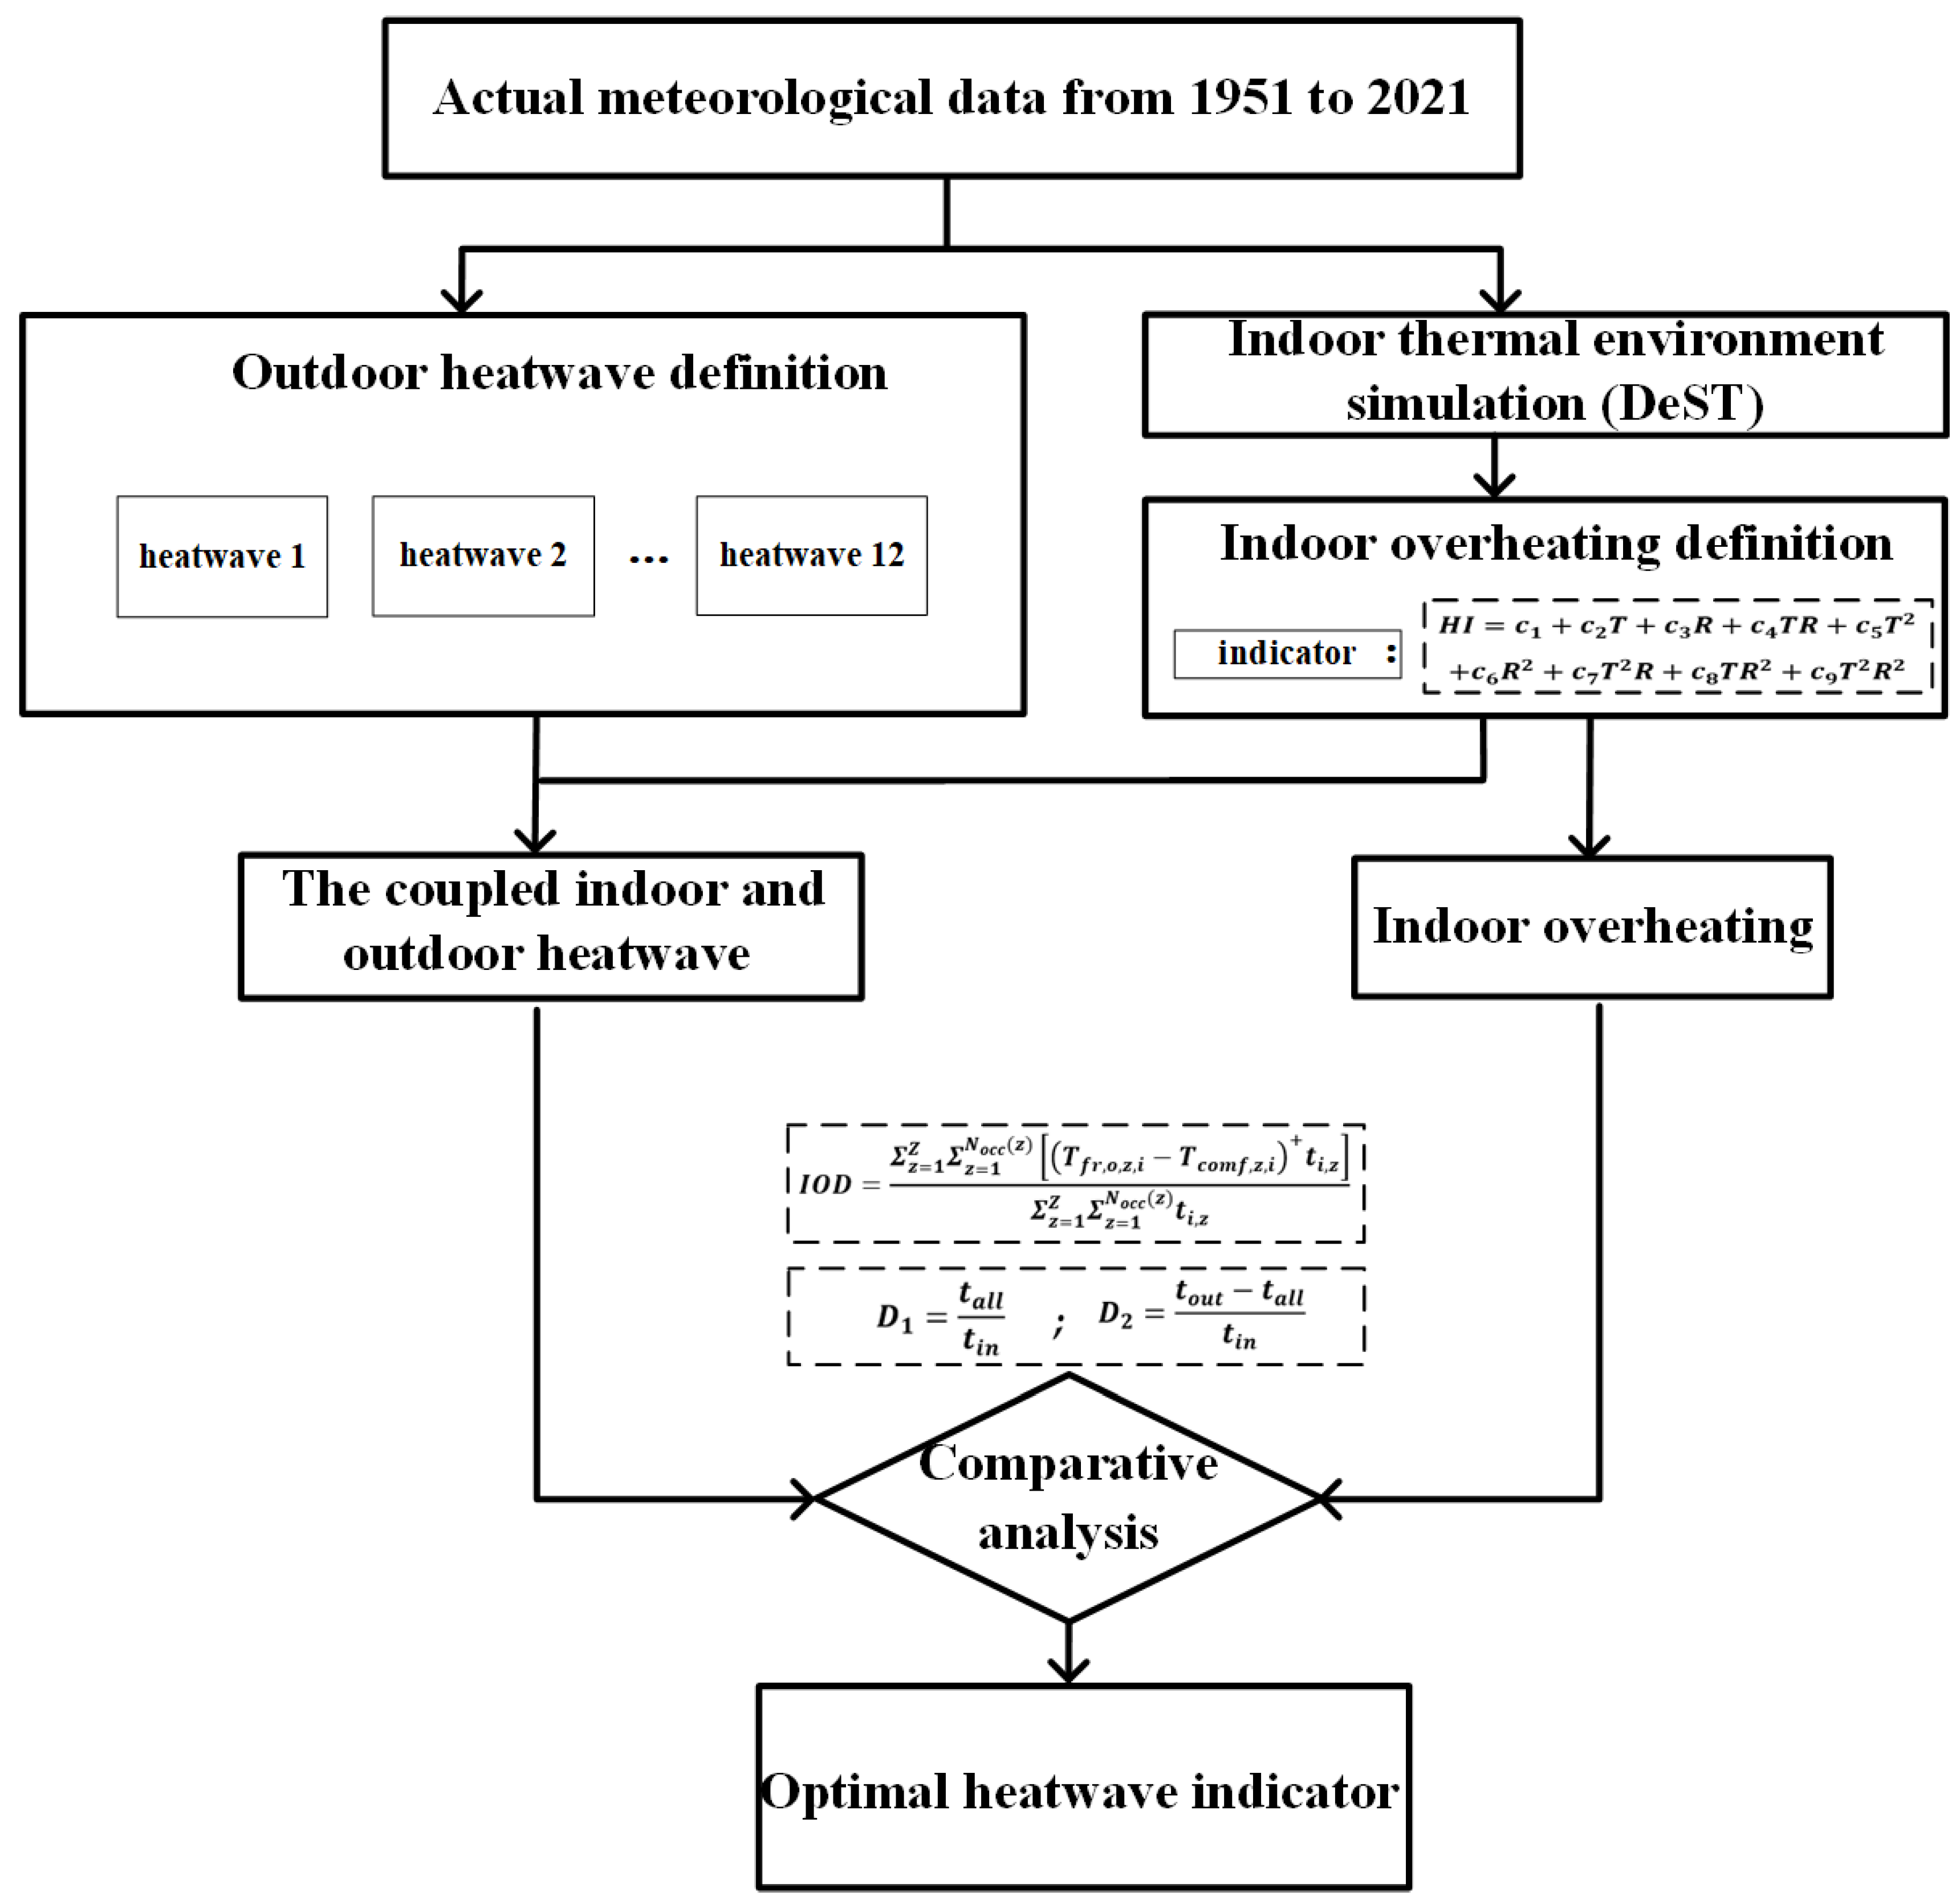
2. Methodology
2.1. Overview
2.2. Definition and Metrics
2.2.1. Definition and Classification of Outdoor Heatwaves
- Definition of outdoor heatwaves
- Classification of outdoor heatwaves
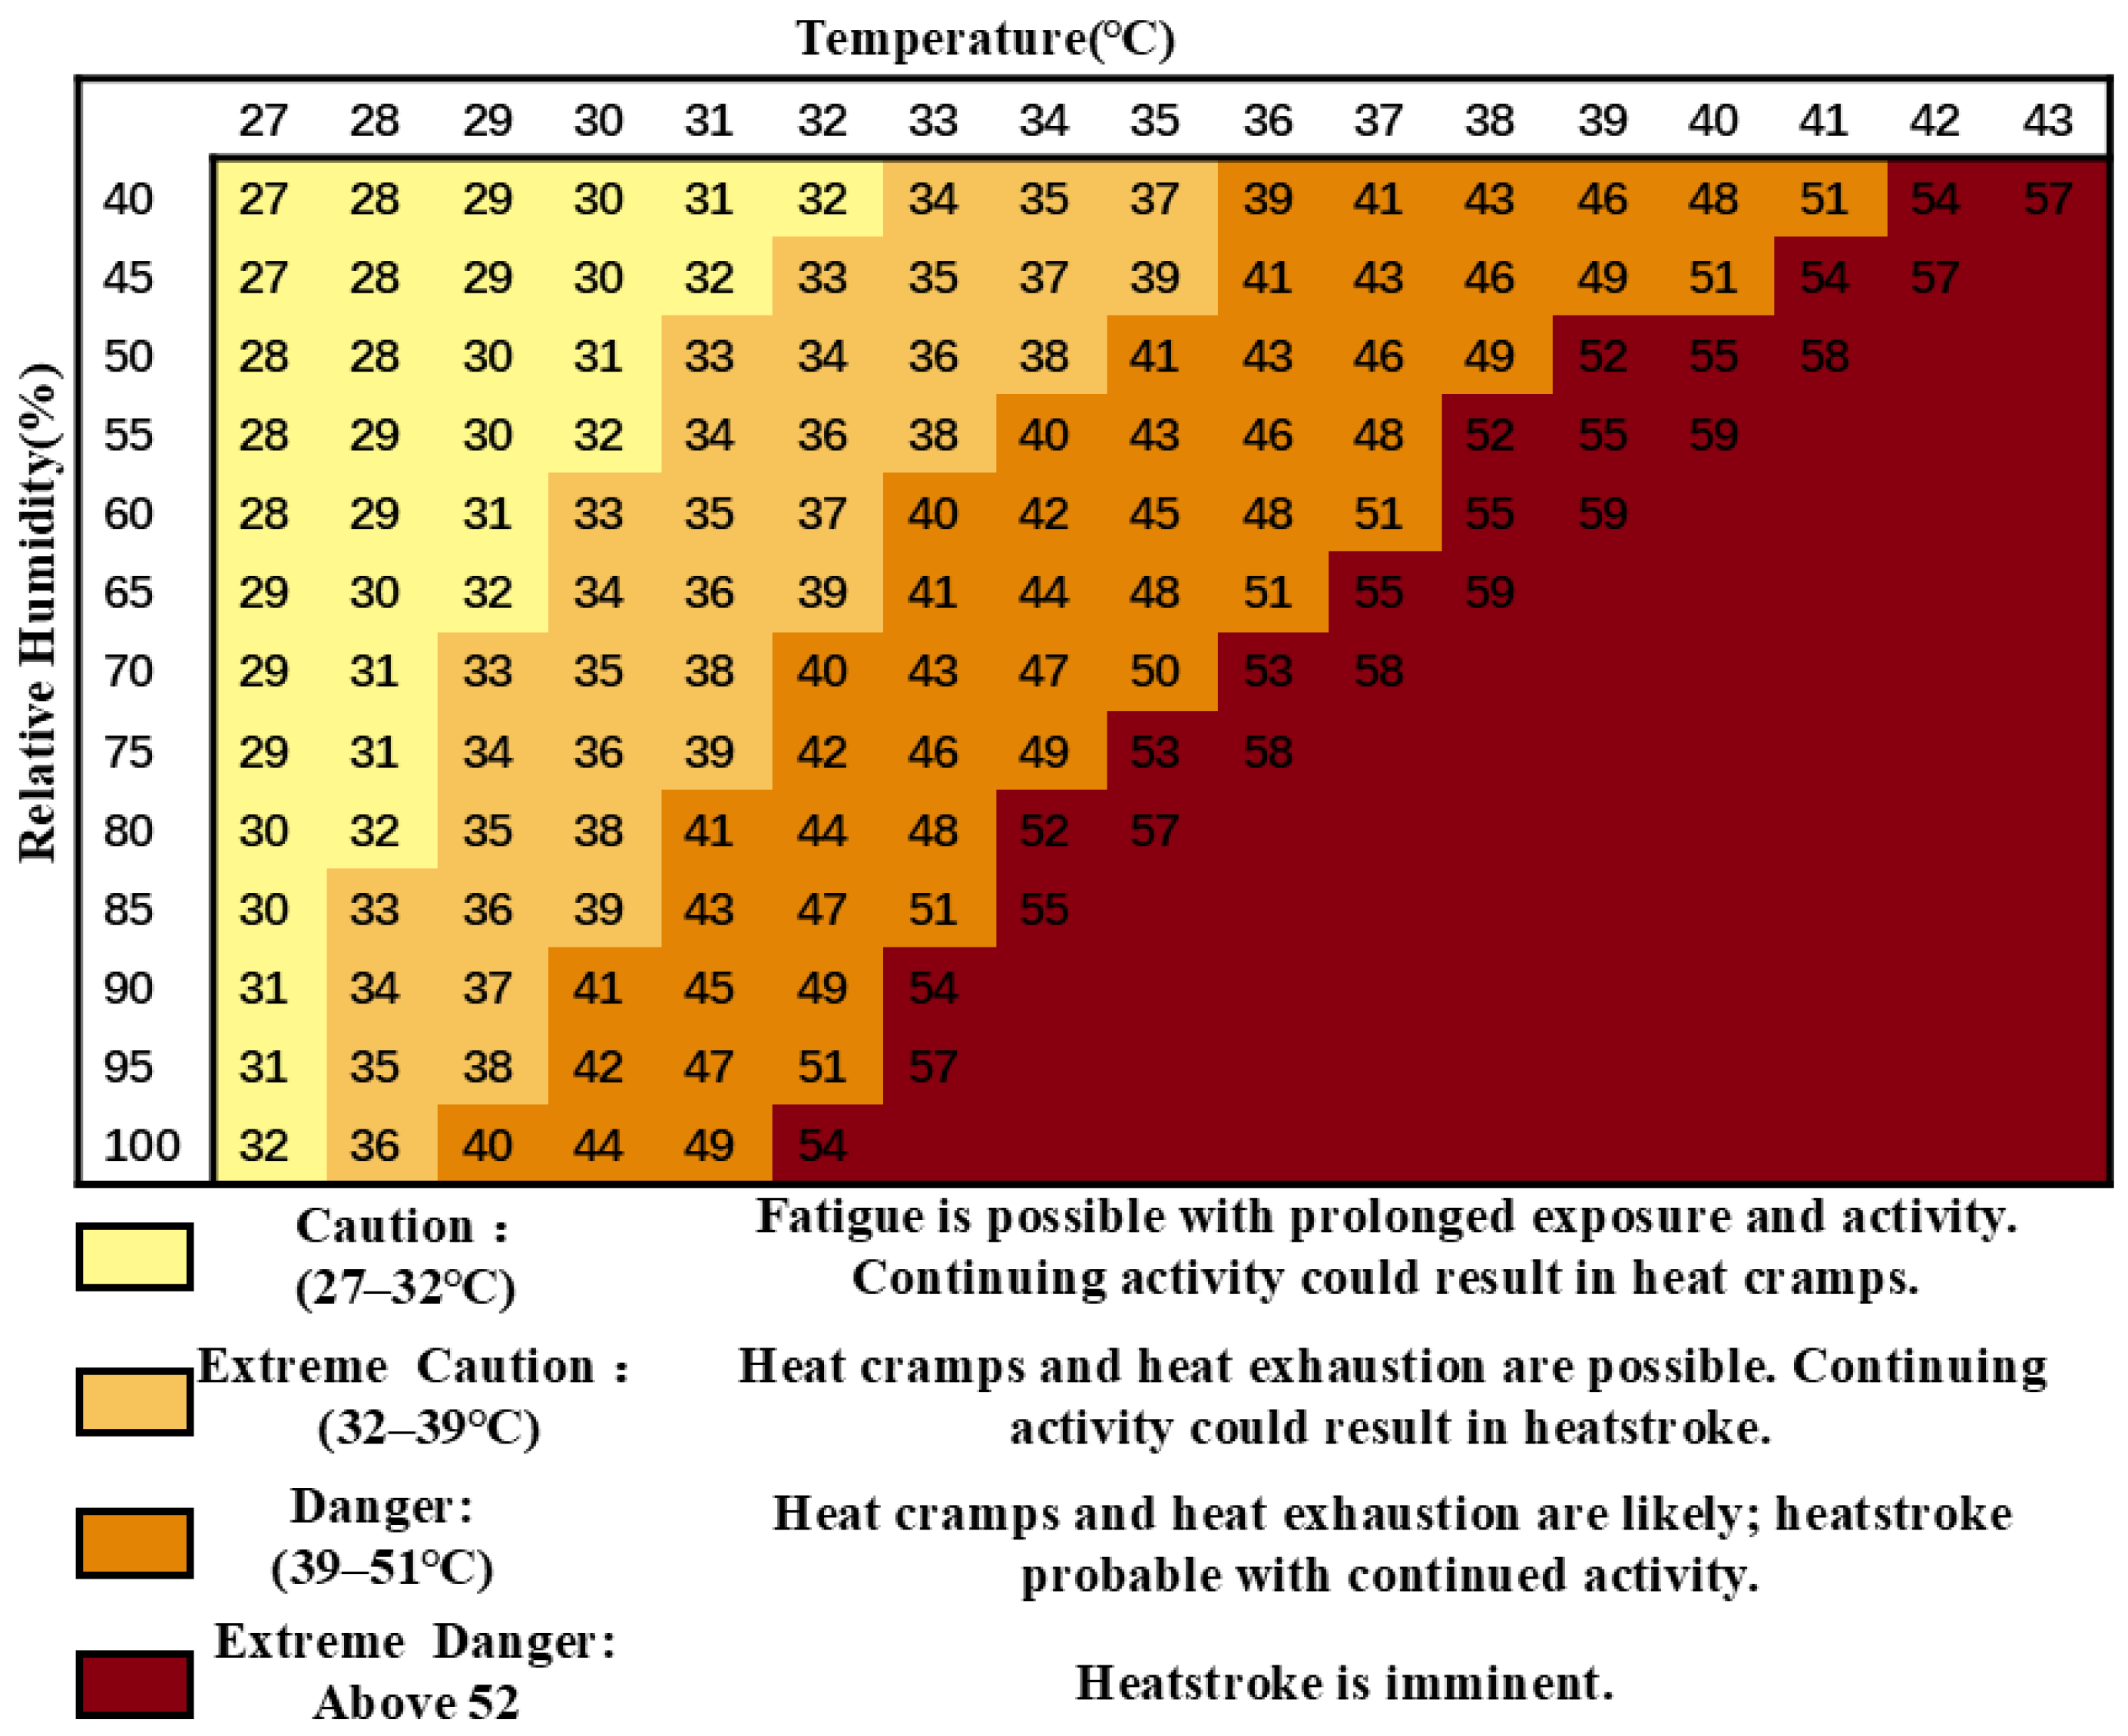
2.2.2. Definition of Indoor Overheating
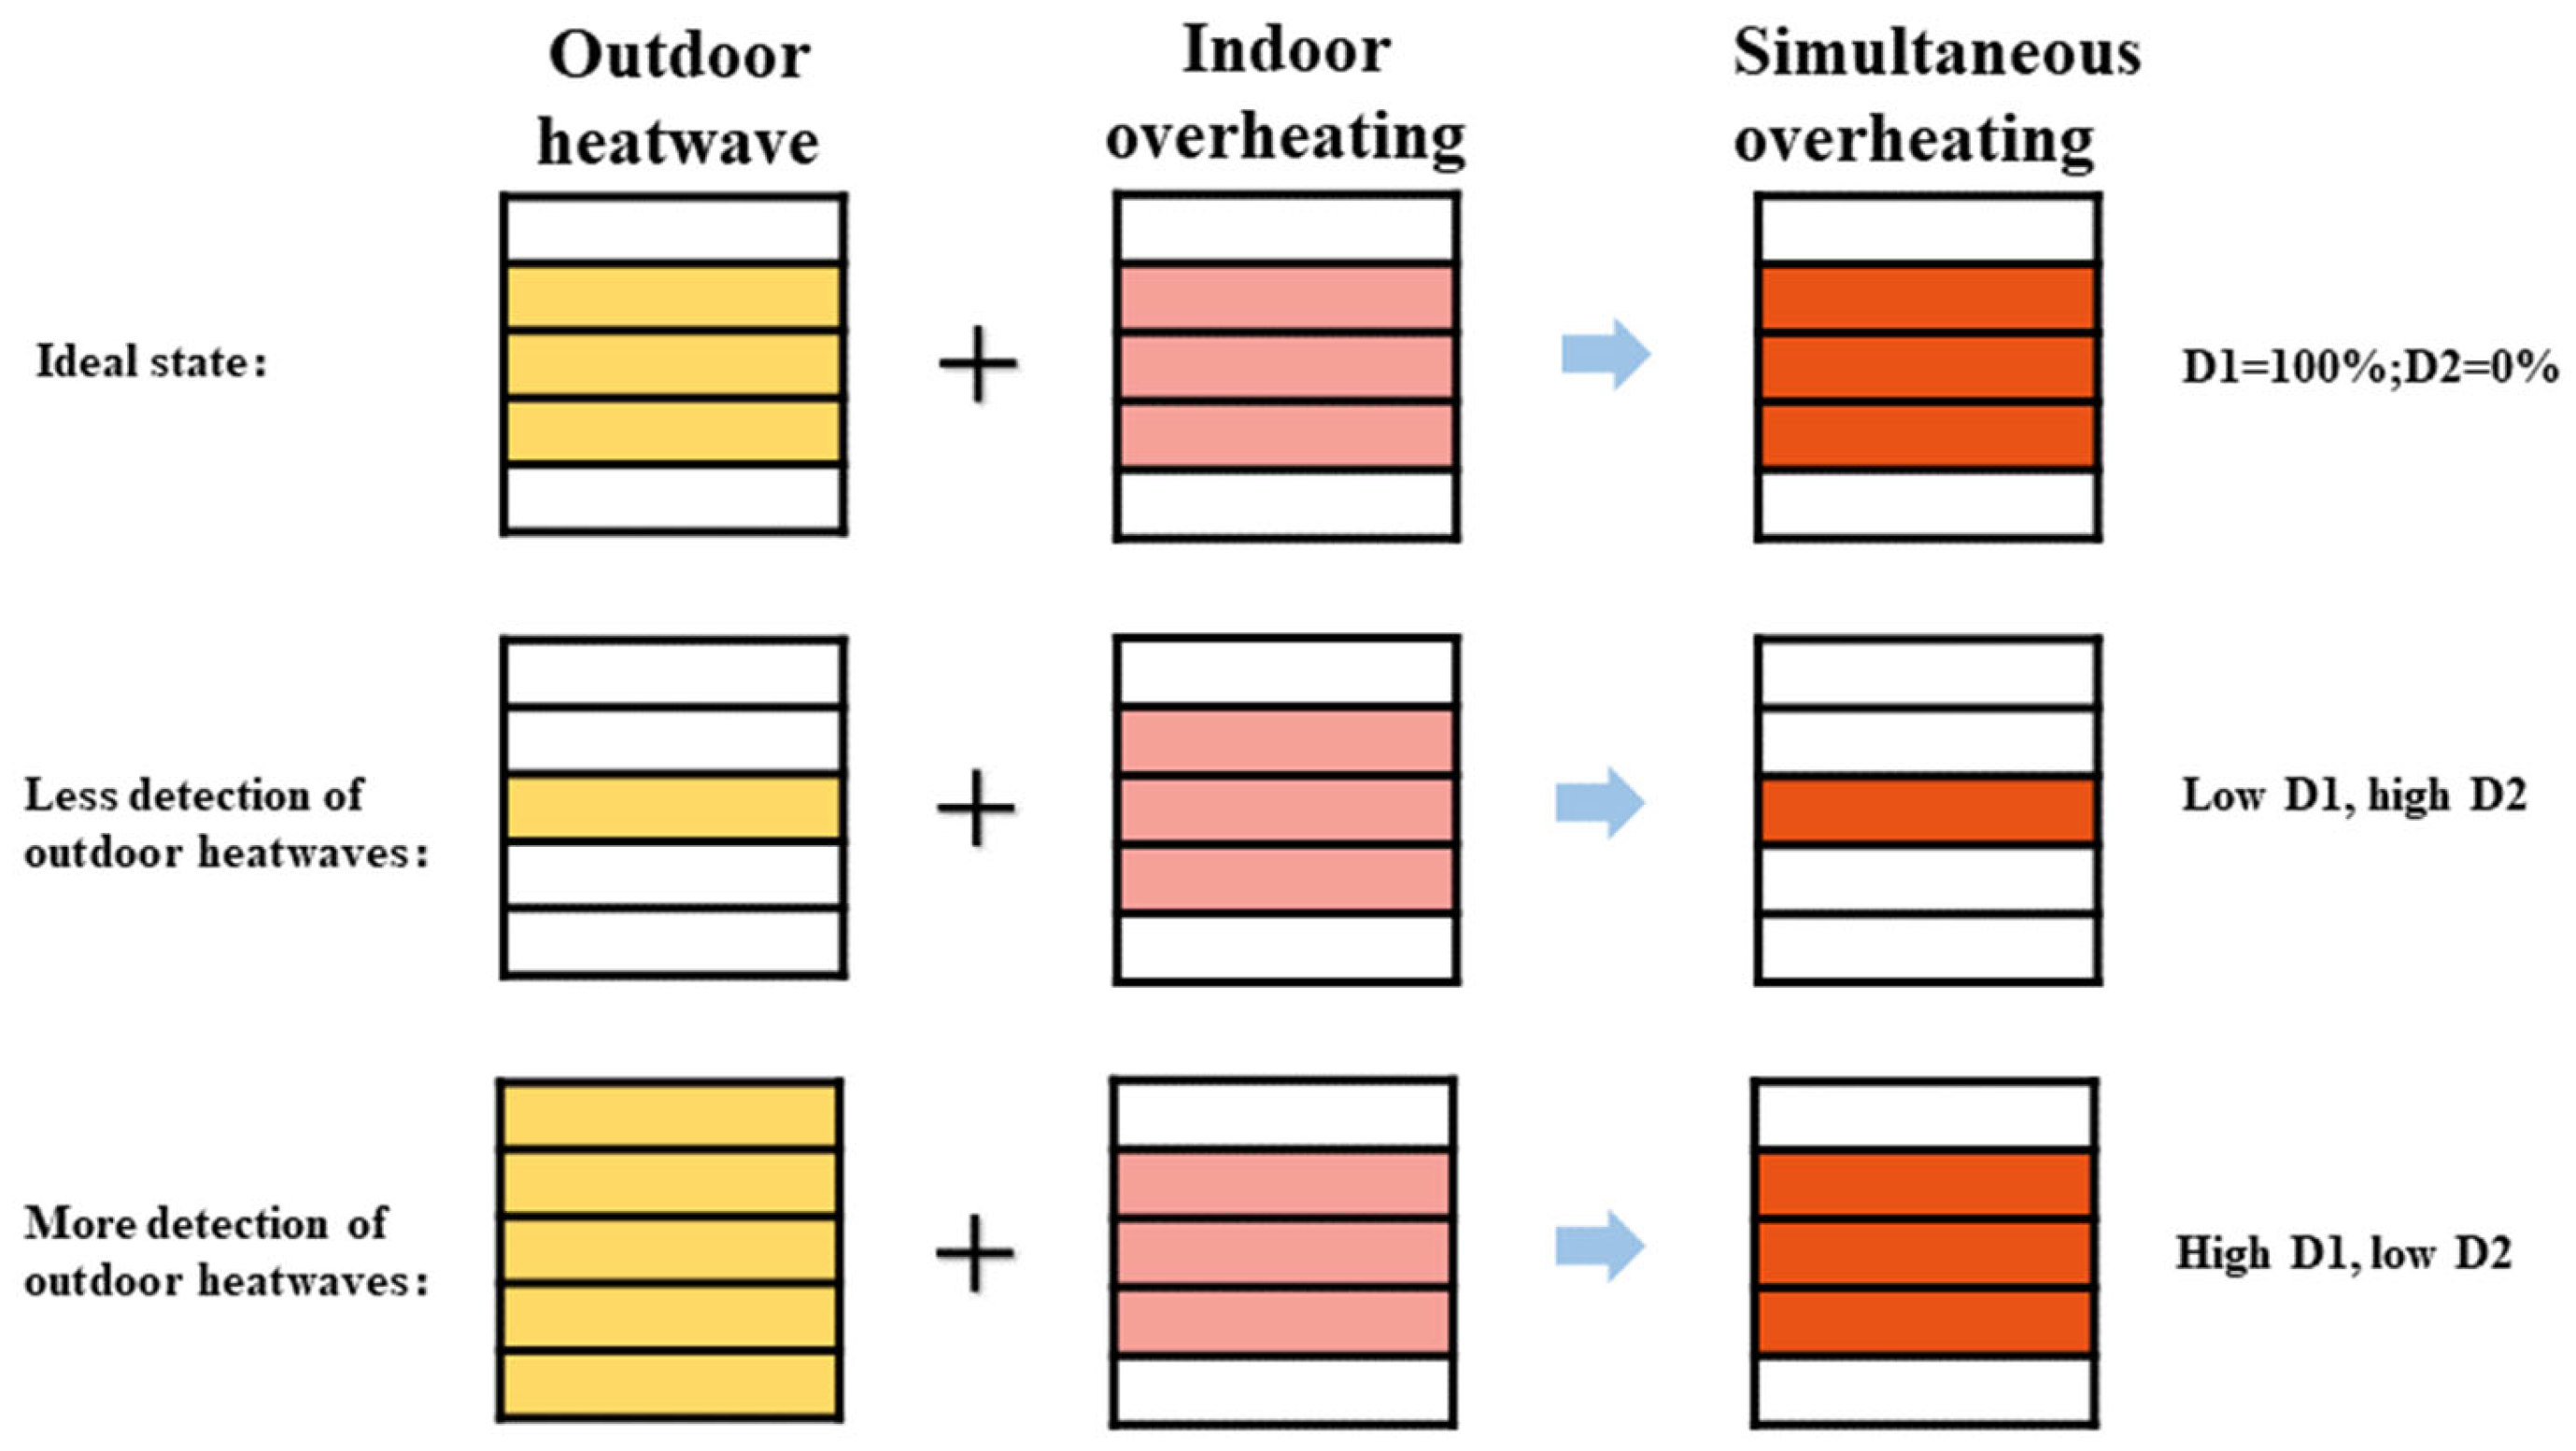
2.2.3. Evaluation of Outdoor Heatwaves Based on Indoor Overheating
- Overlap degree
- Indoor overheating degree
3. Case Study
3.1. Meteorological Data
3.1.1. Acquisition of Meteorological Data
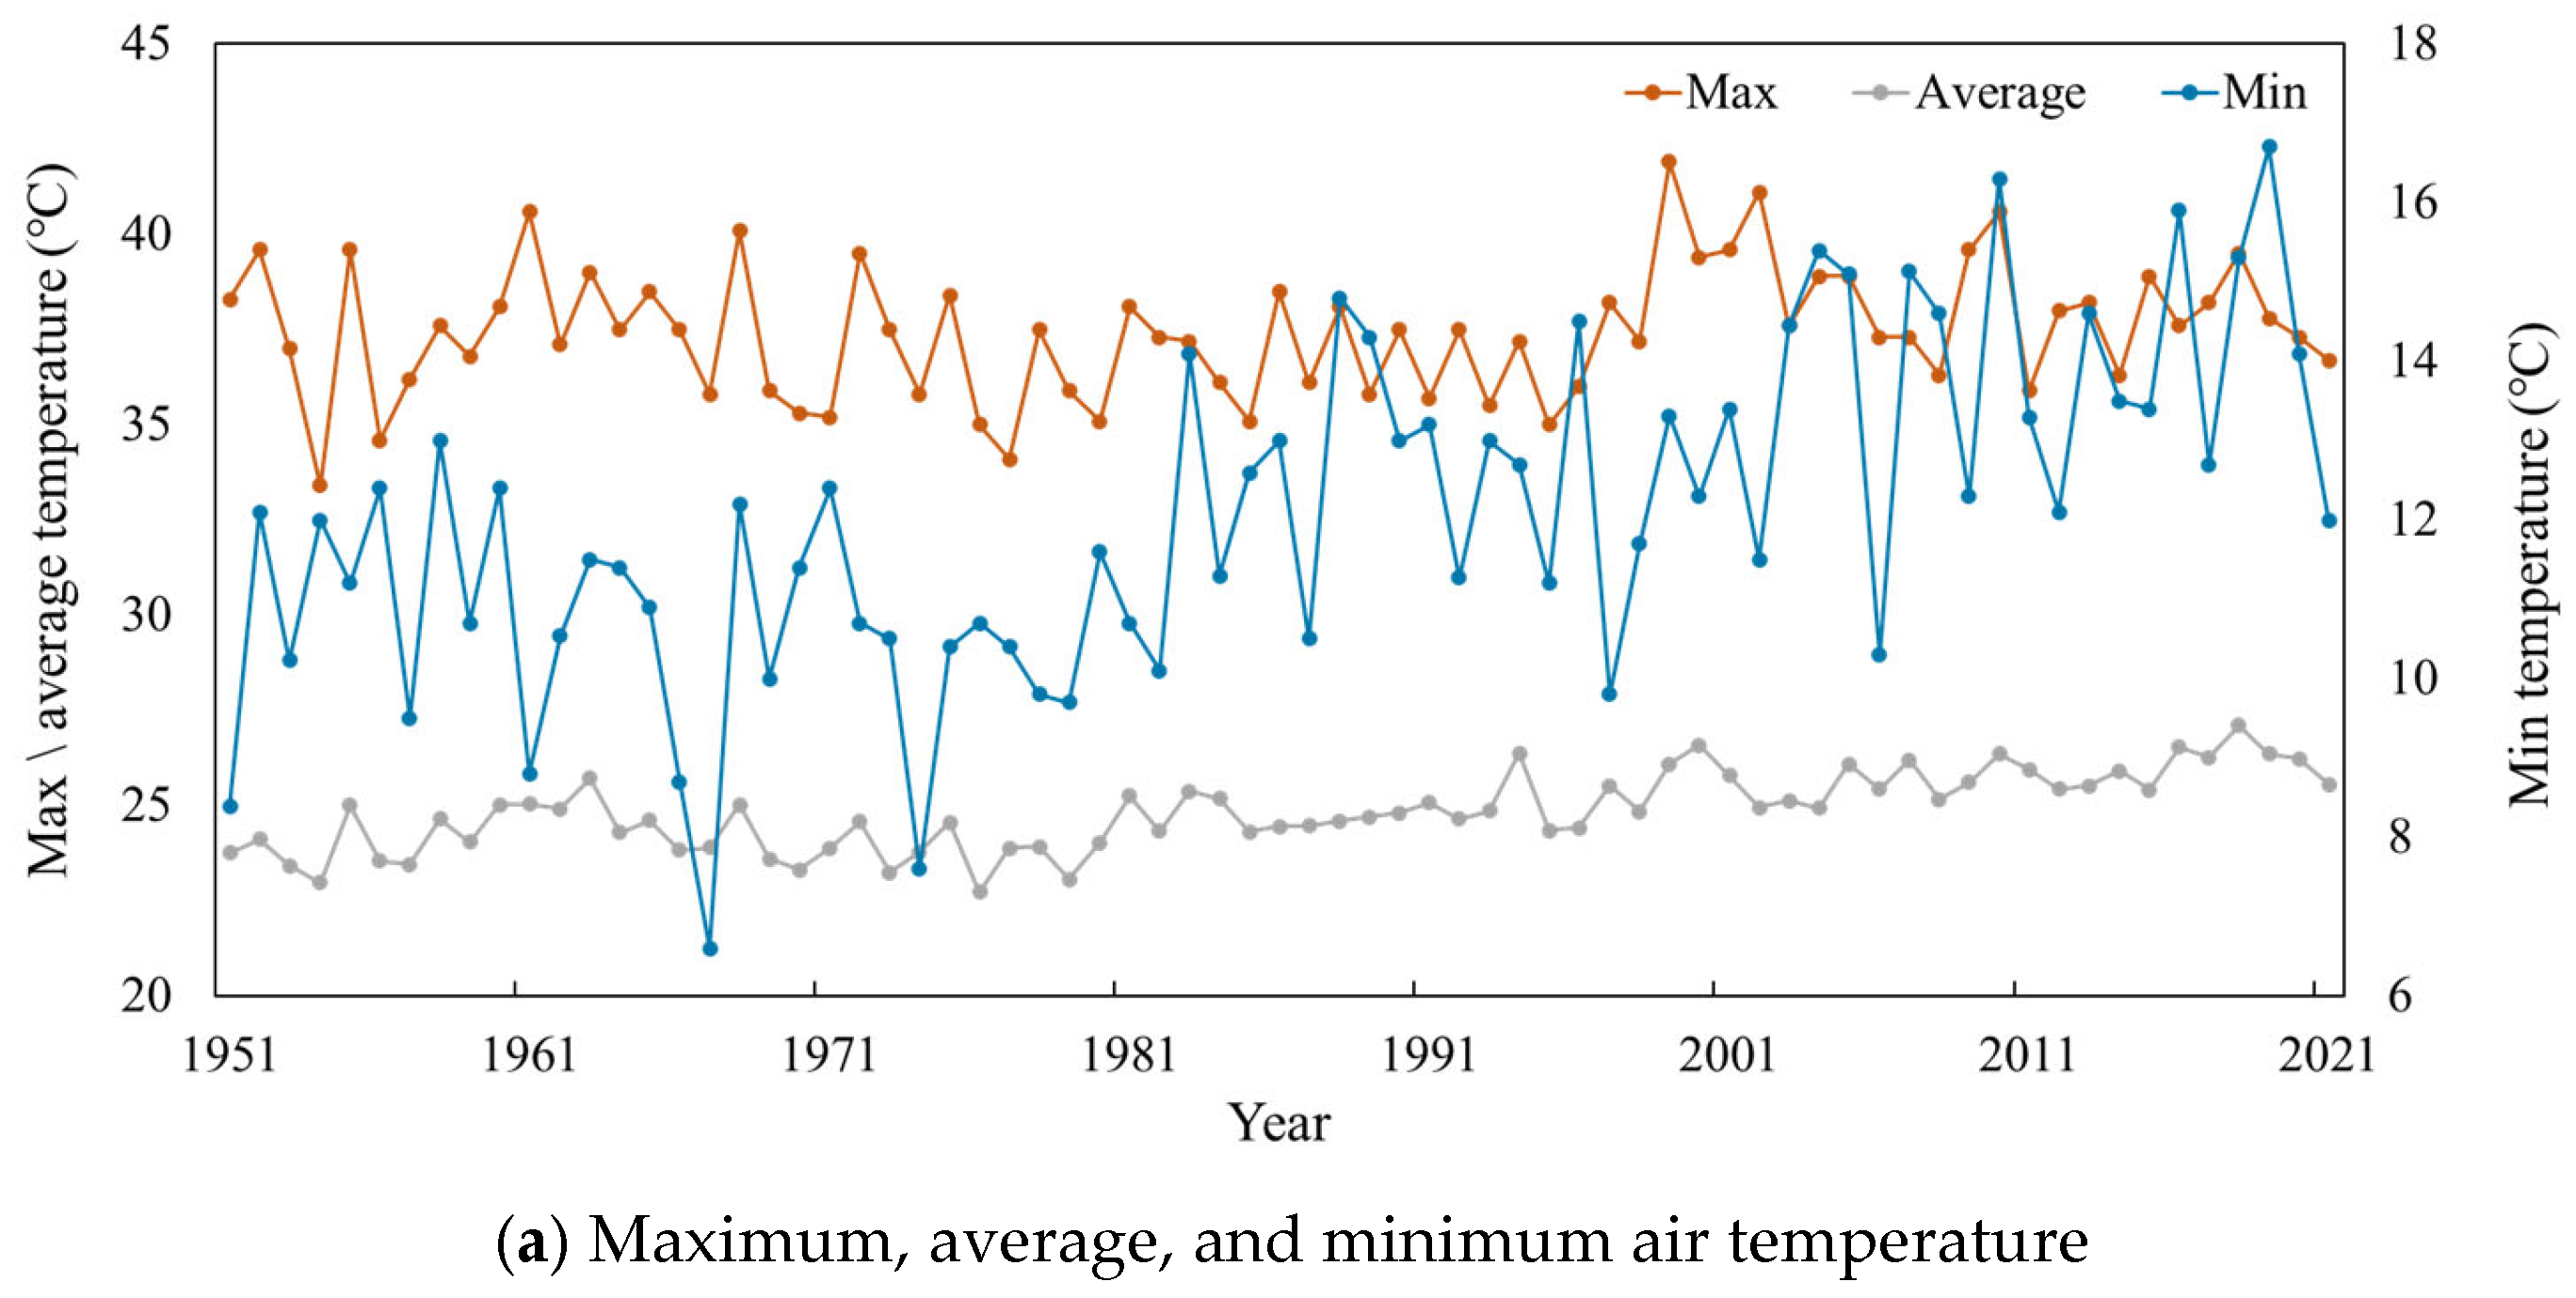
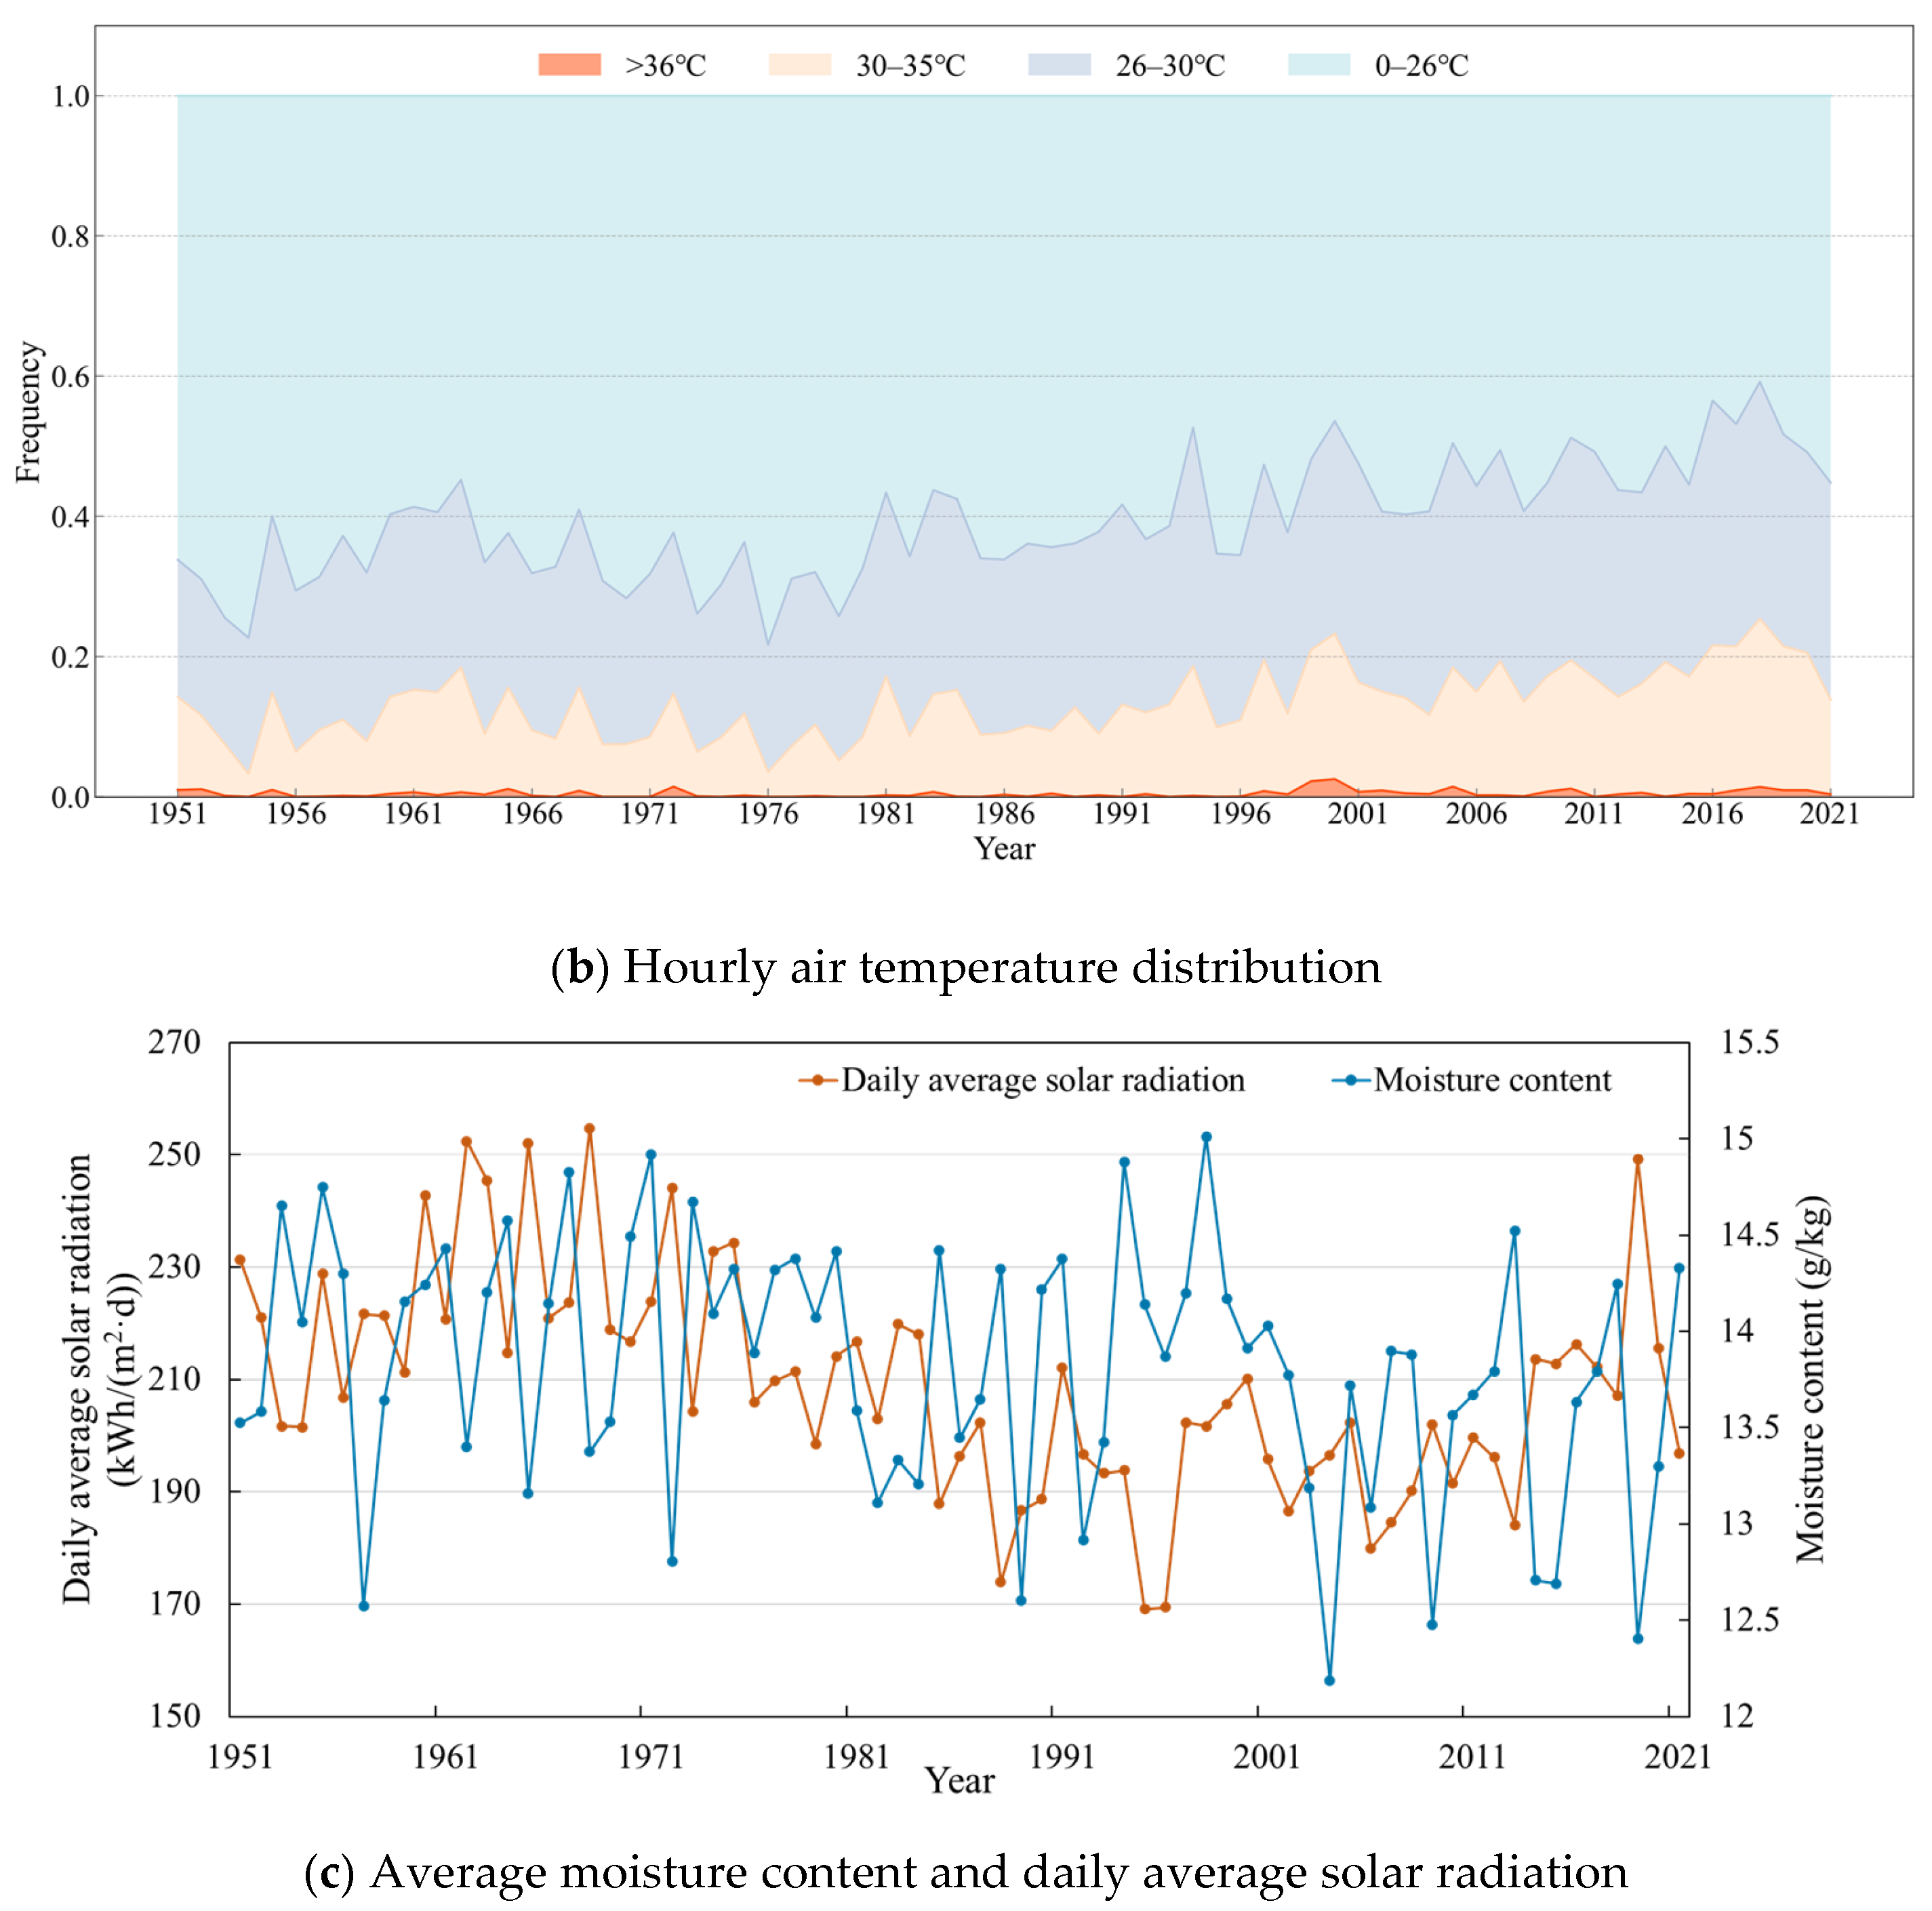
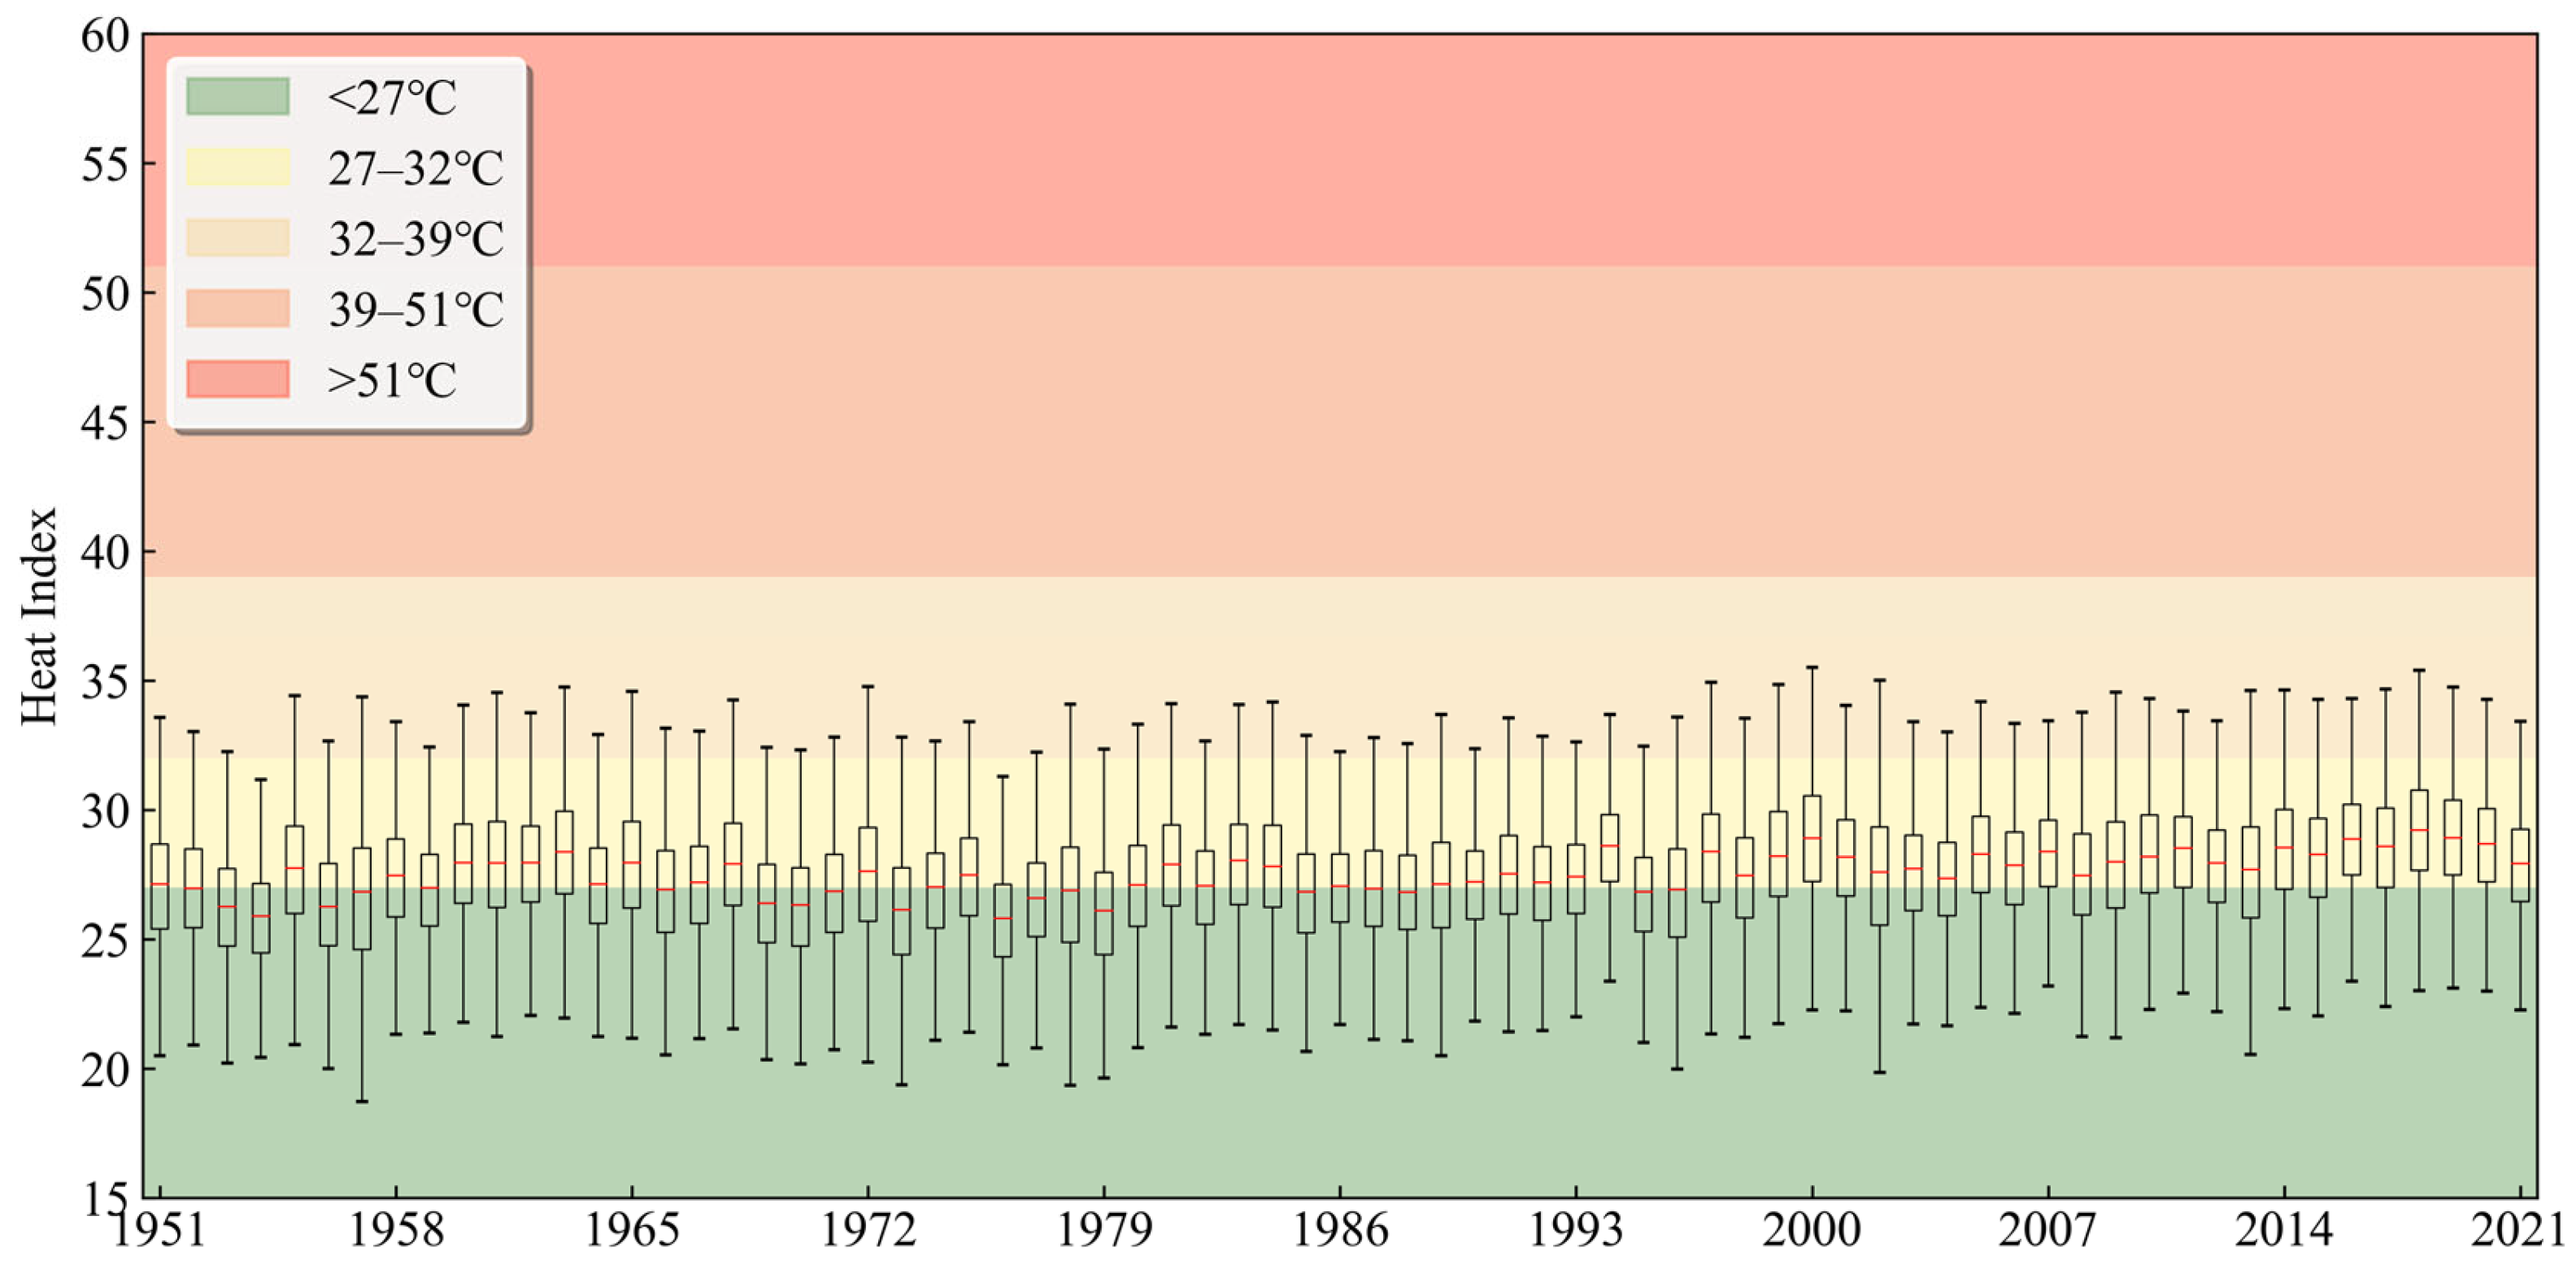
3.1.2. Analysis of Meteorological Data
3.2. Build Simulation Model
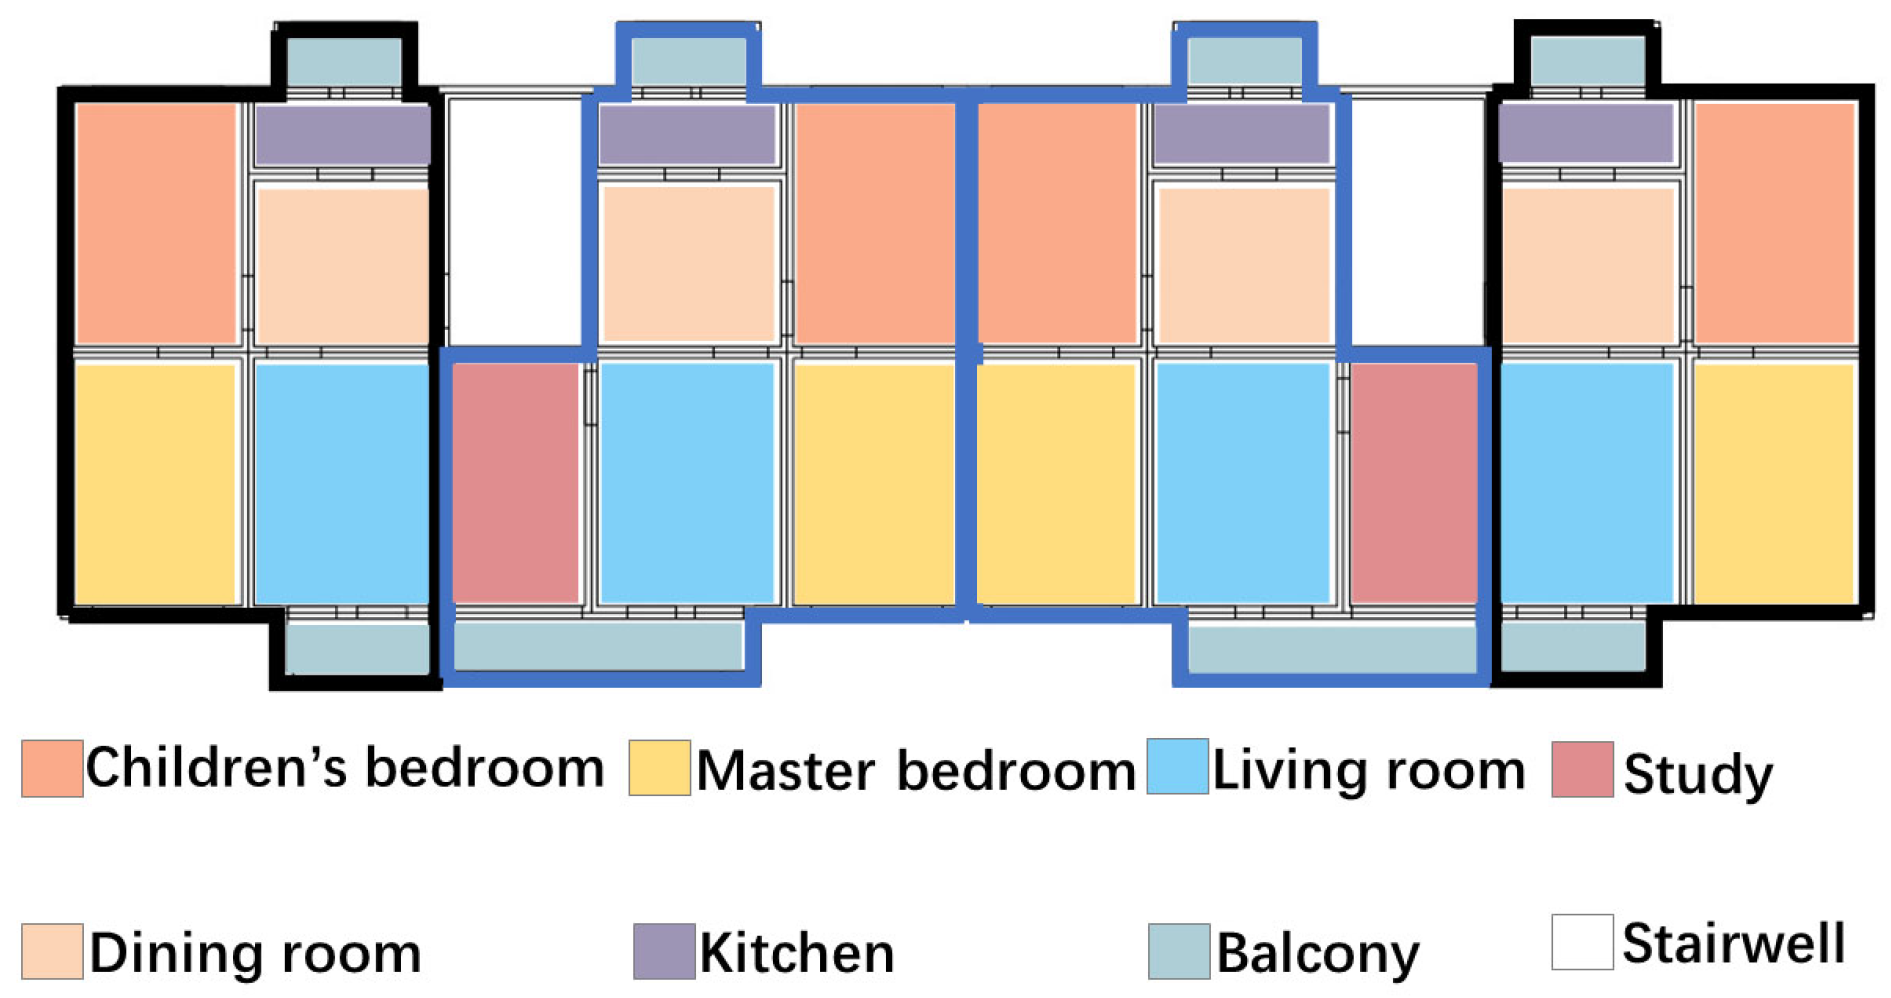
3.2.1. Building Overview
3.2.2. Modeling and Validation
4. Results
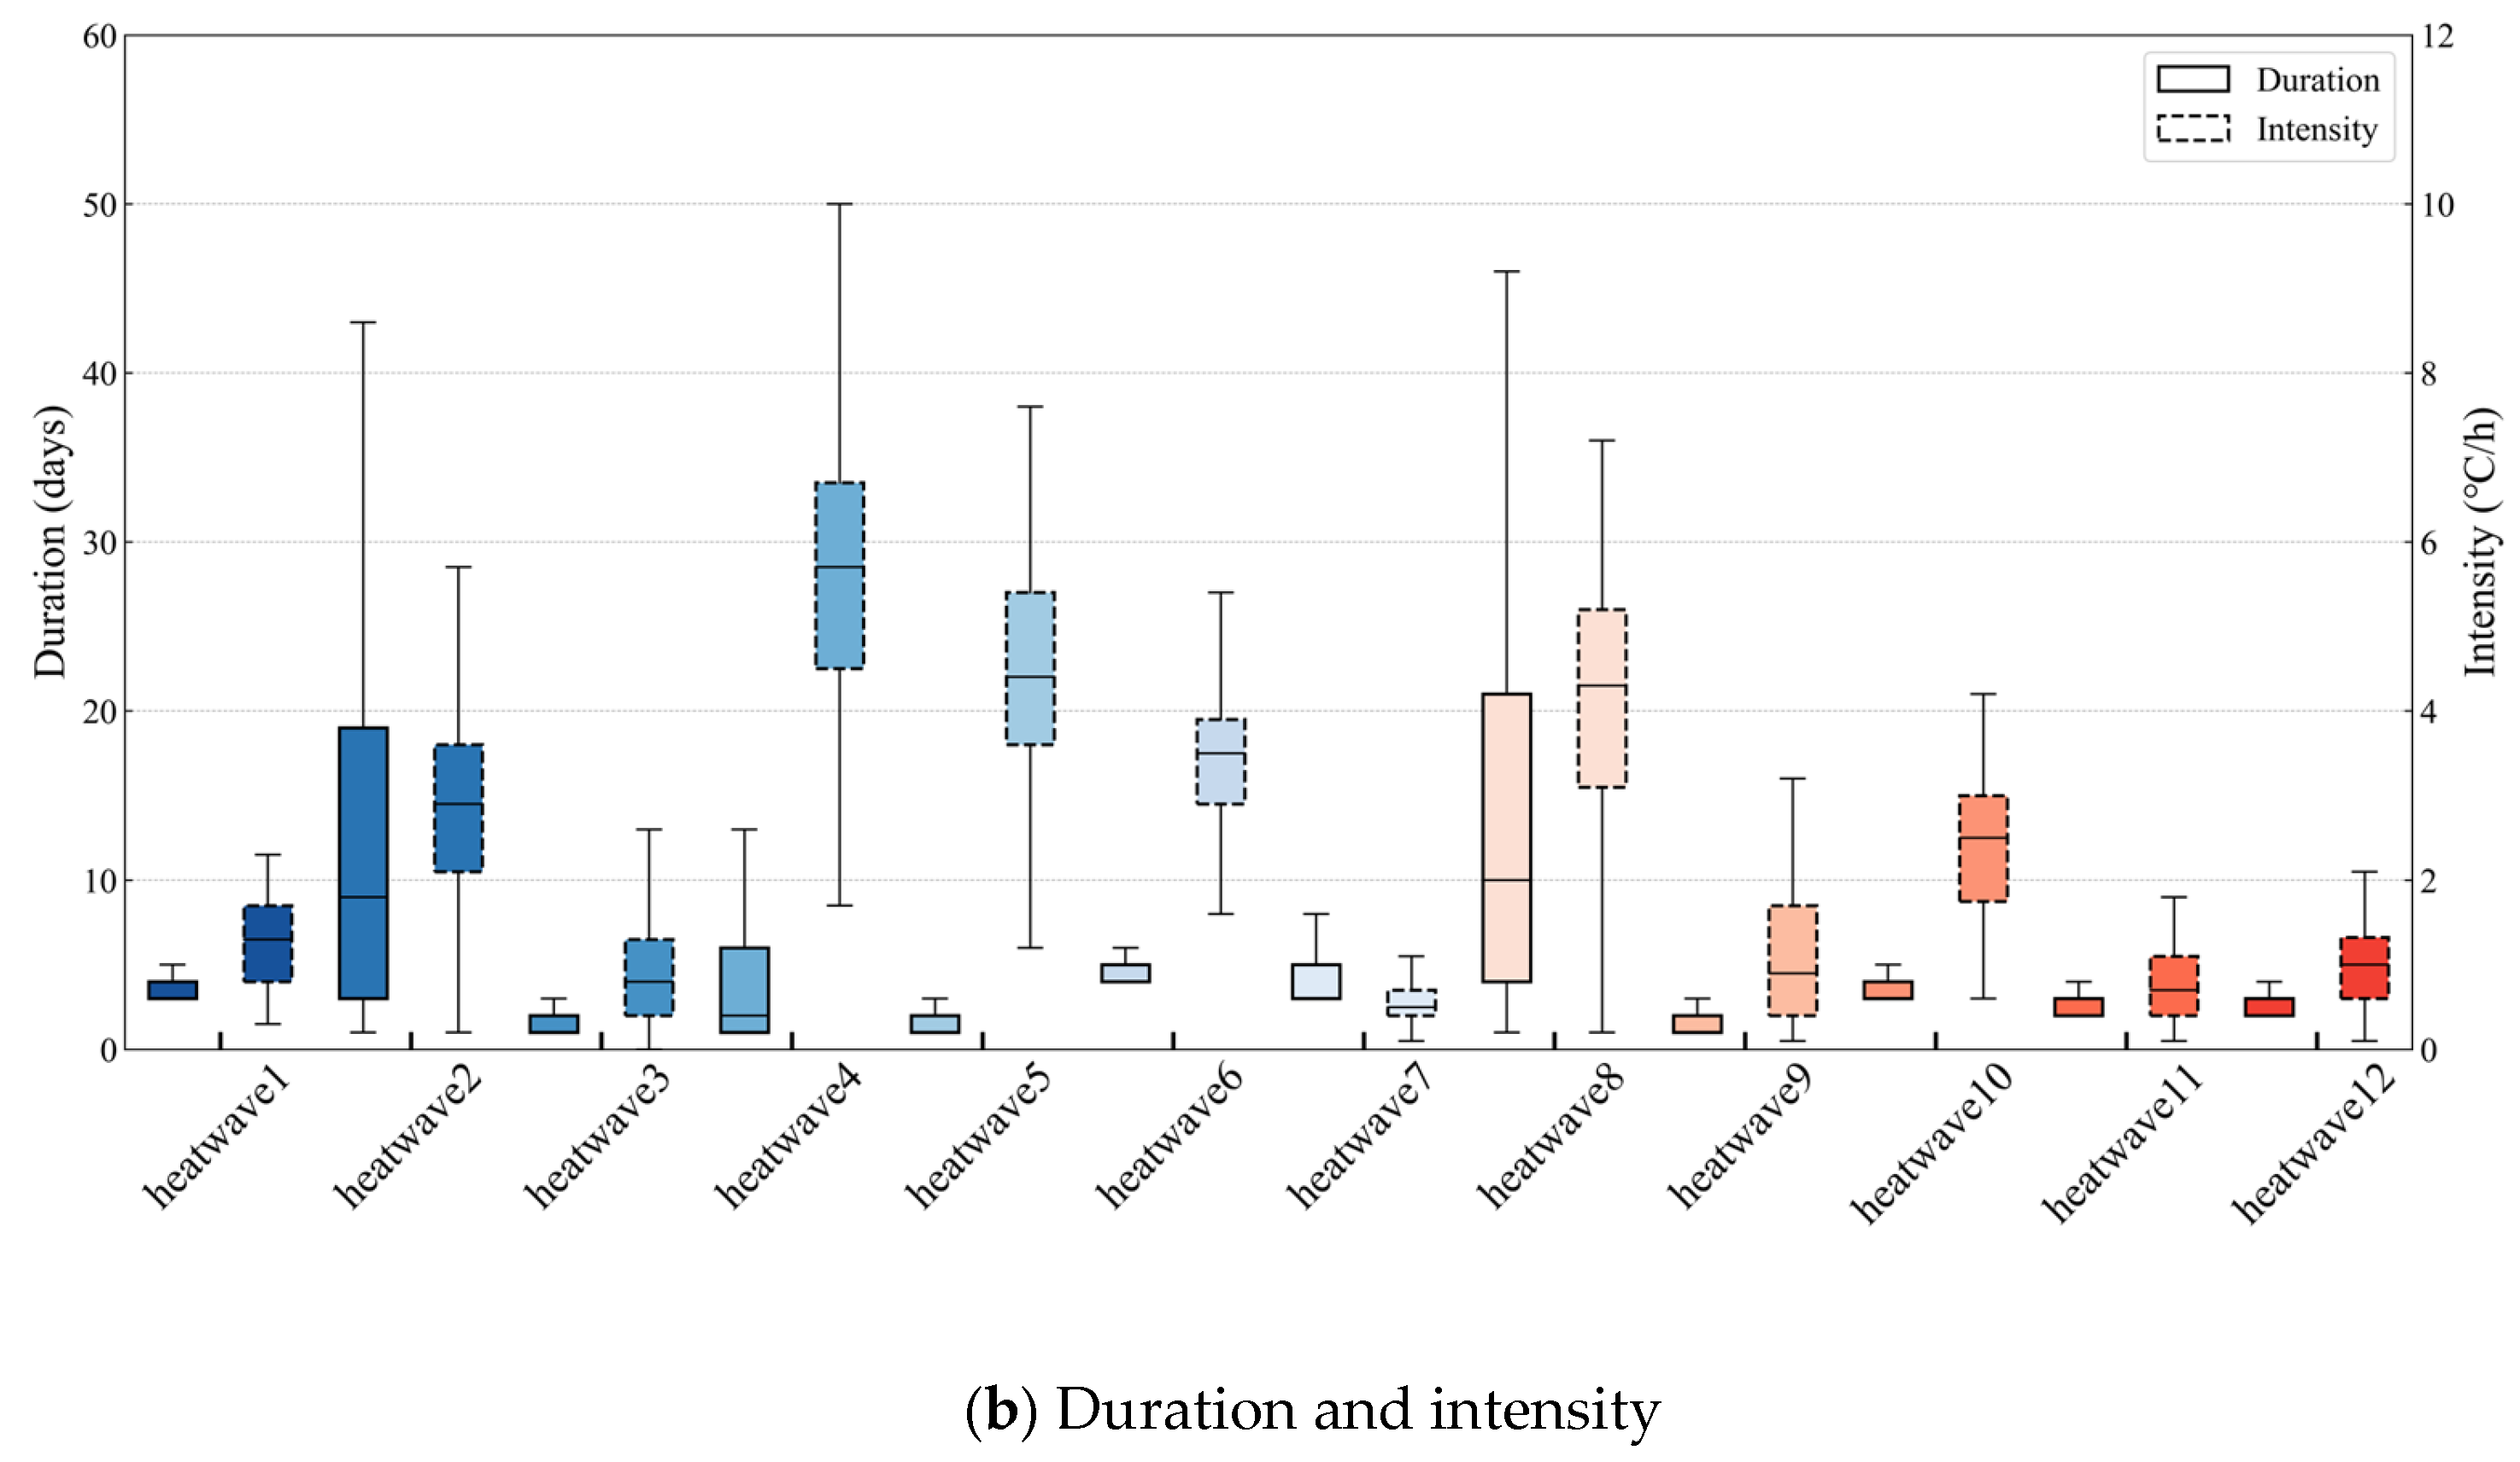
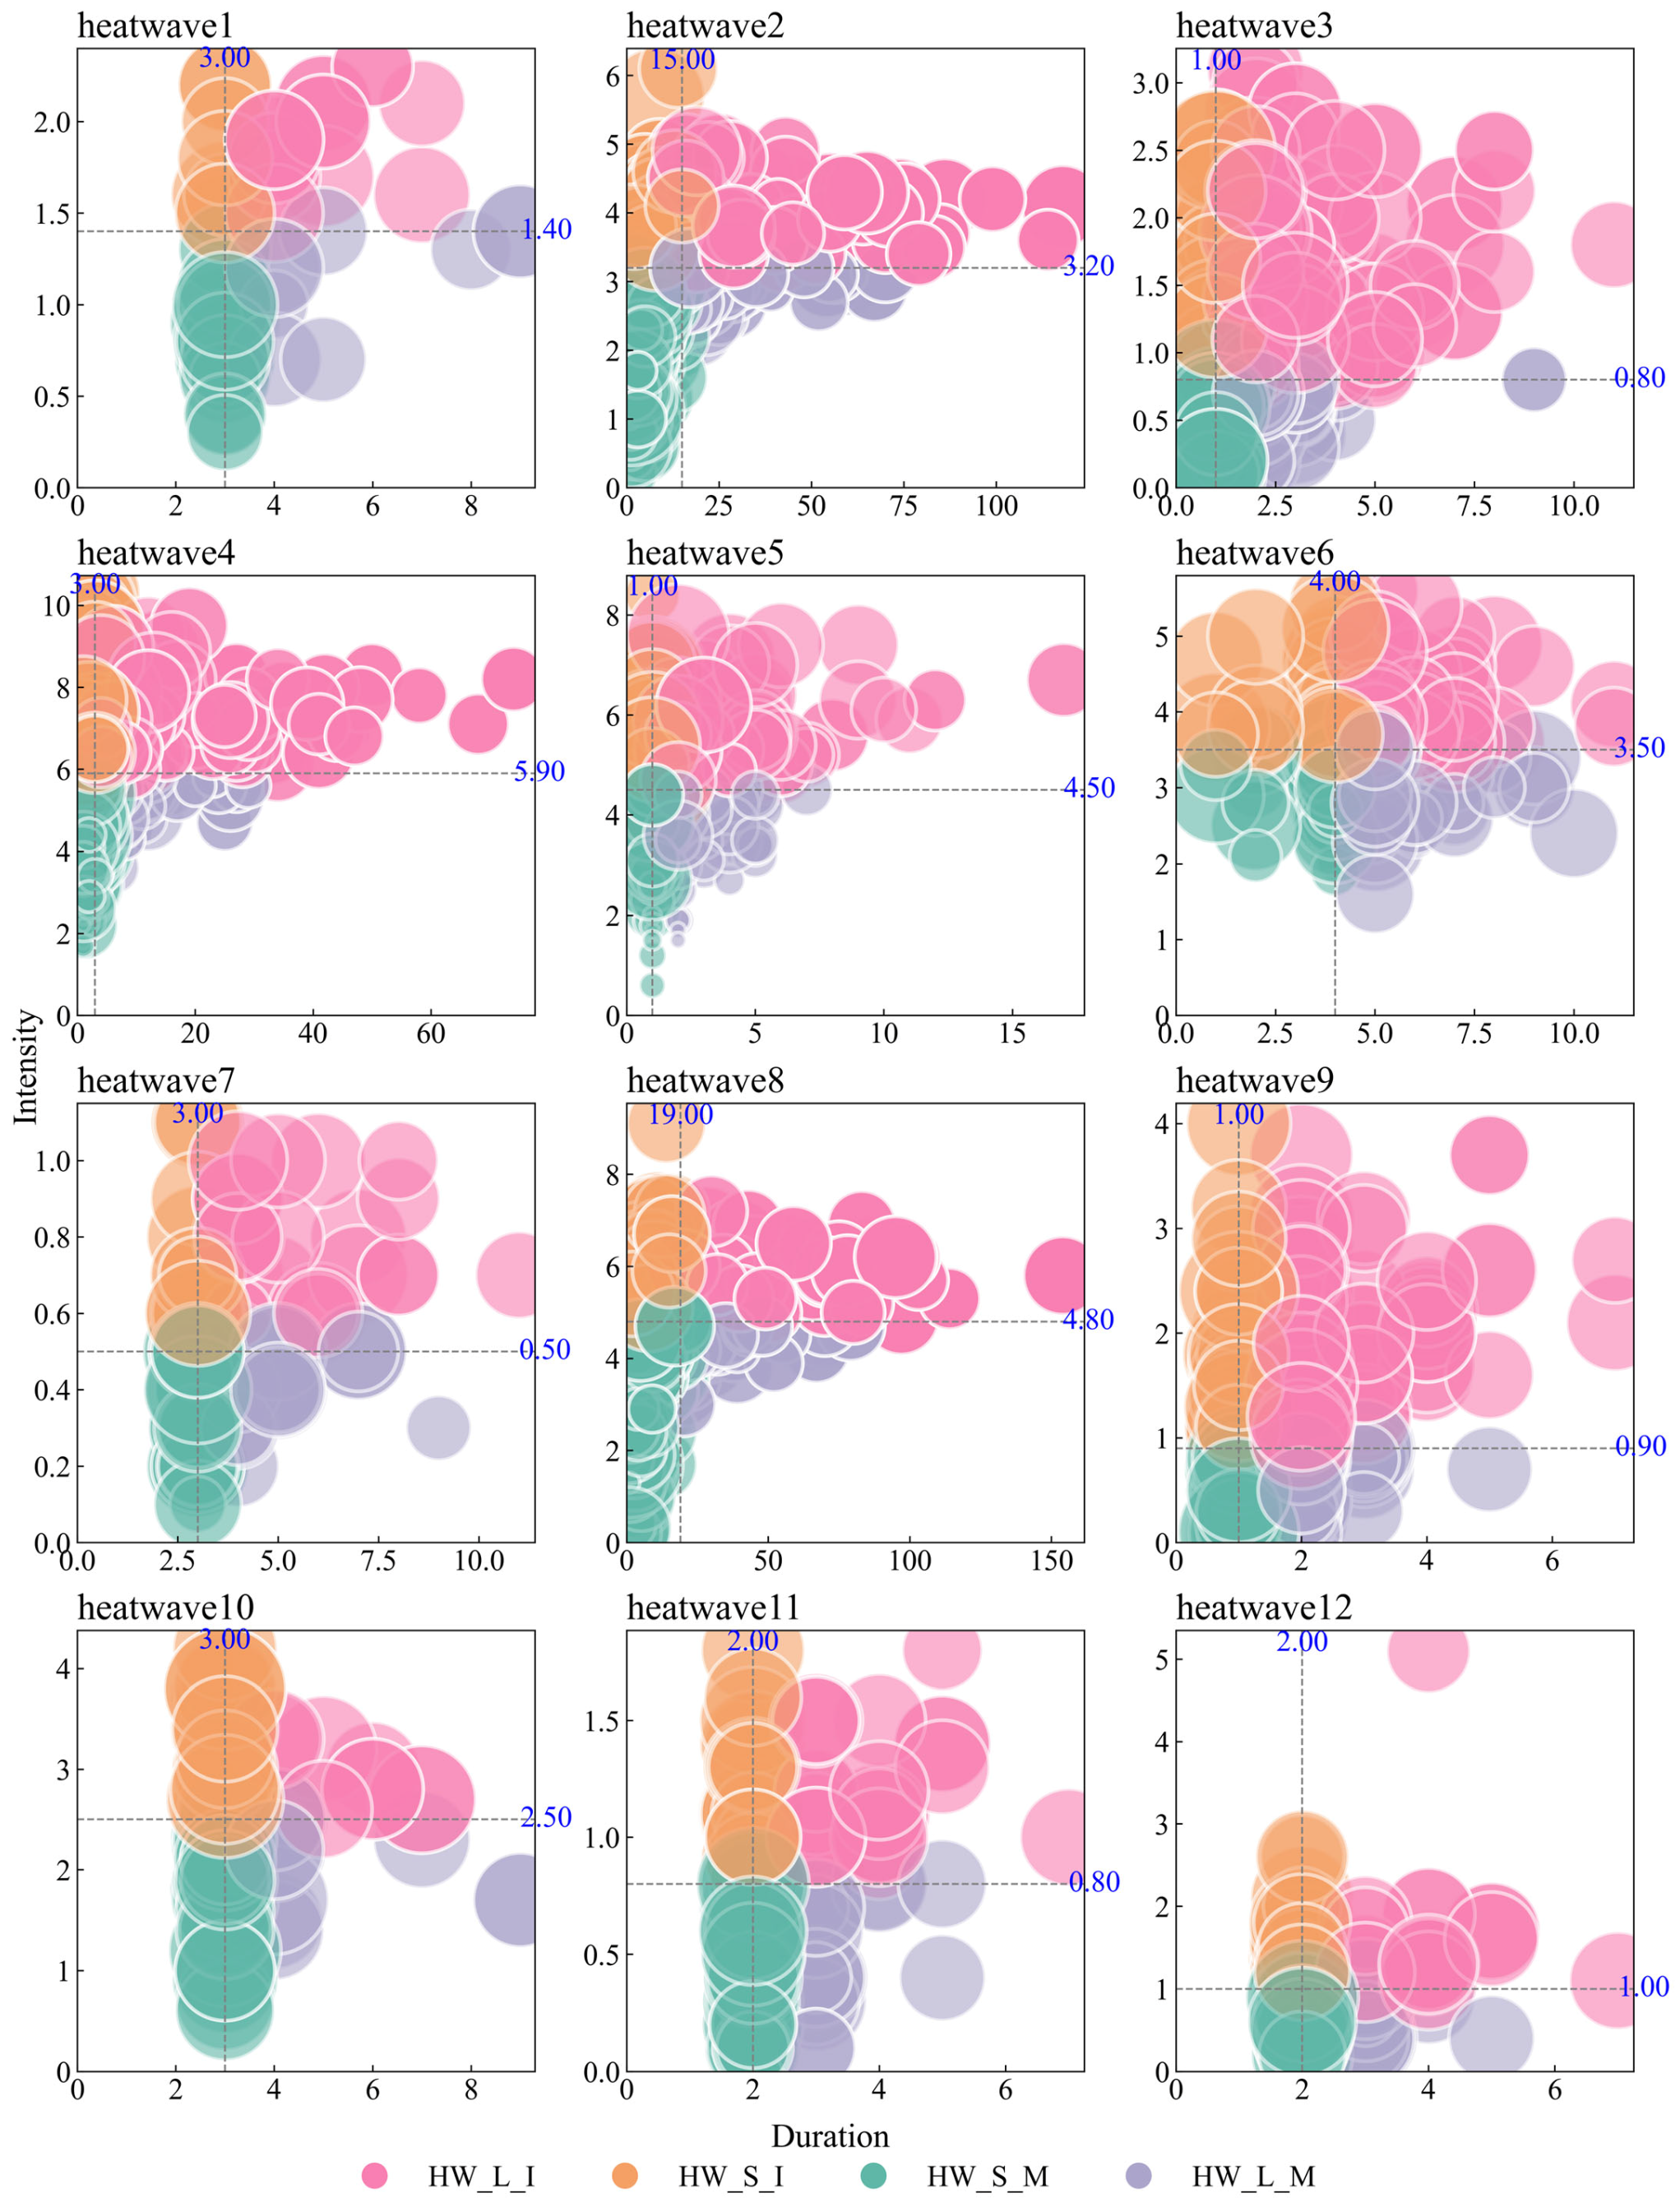
4.1. Results of Outdoor Heatwave Assessment
4.2. Results of Indoor Overheating Assessment
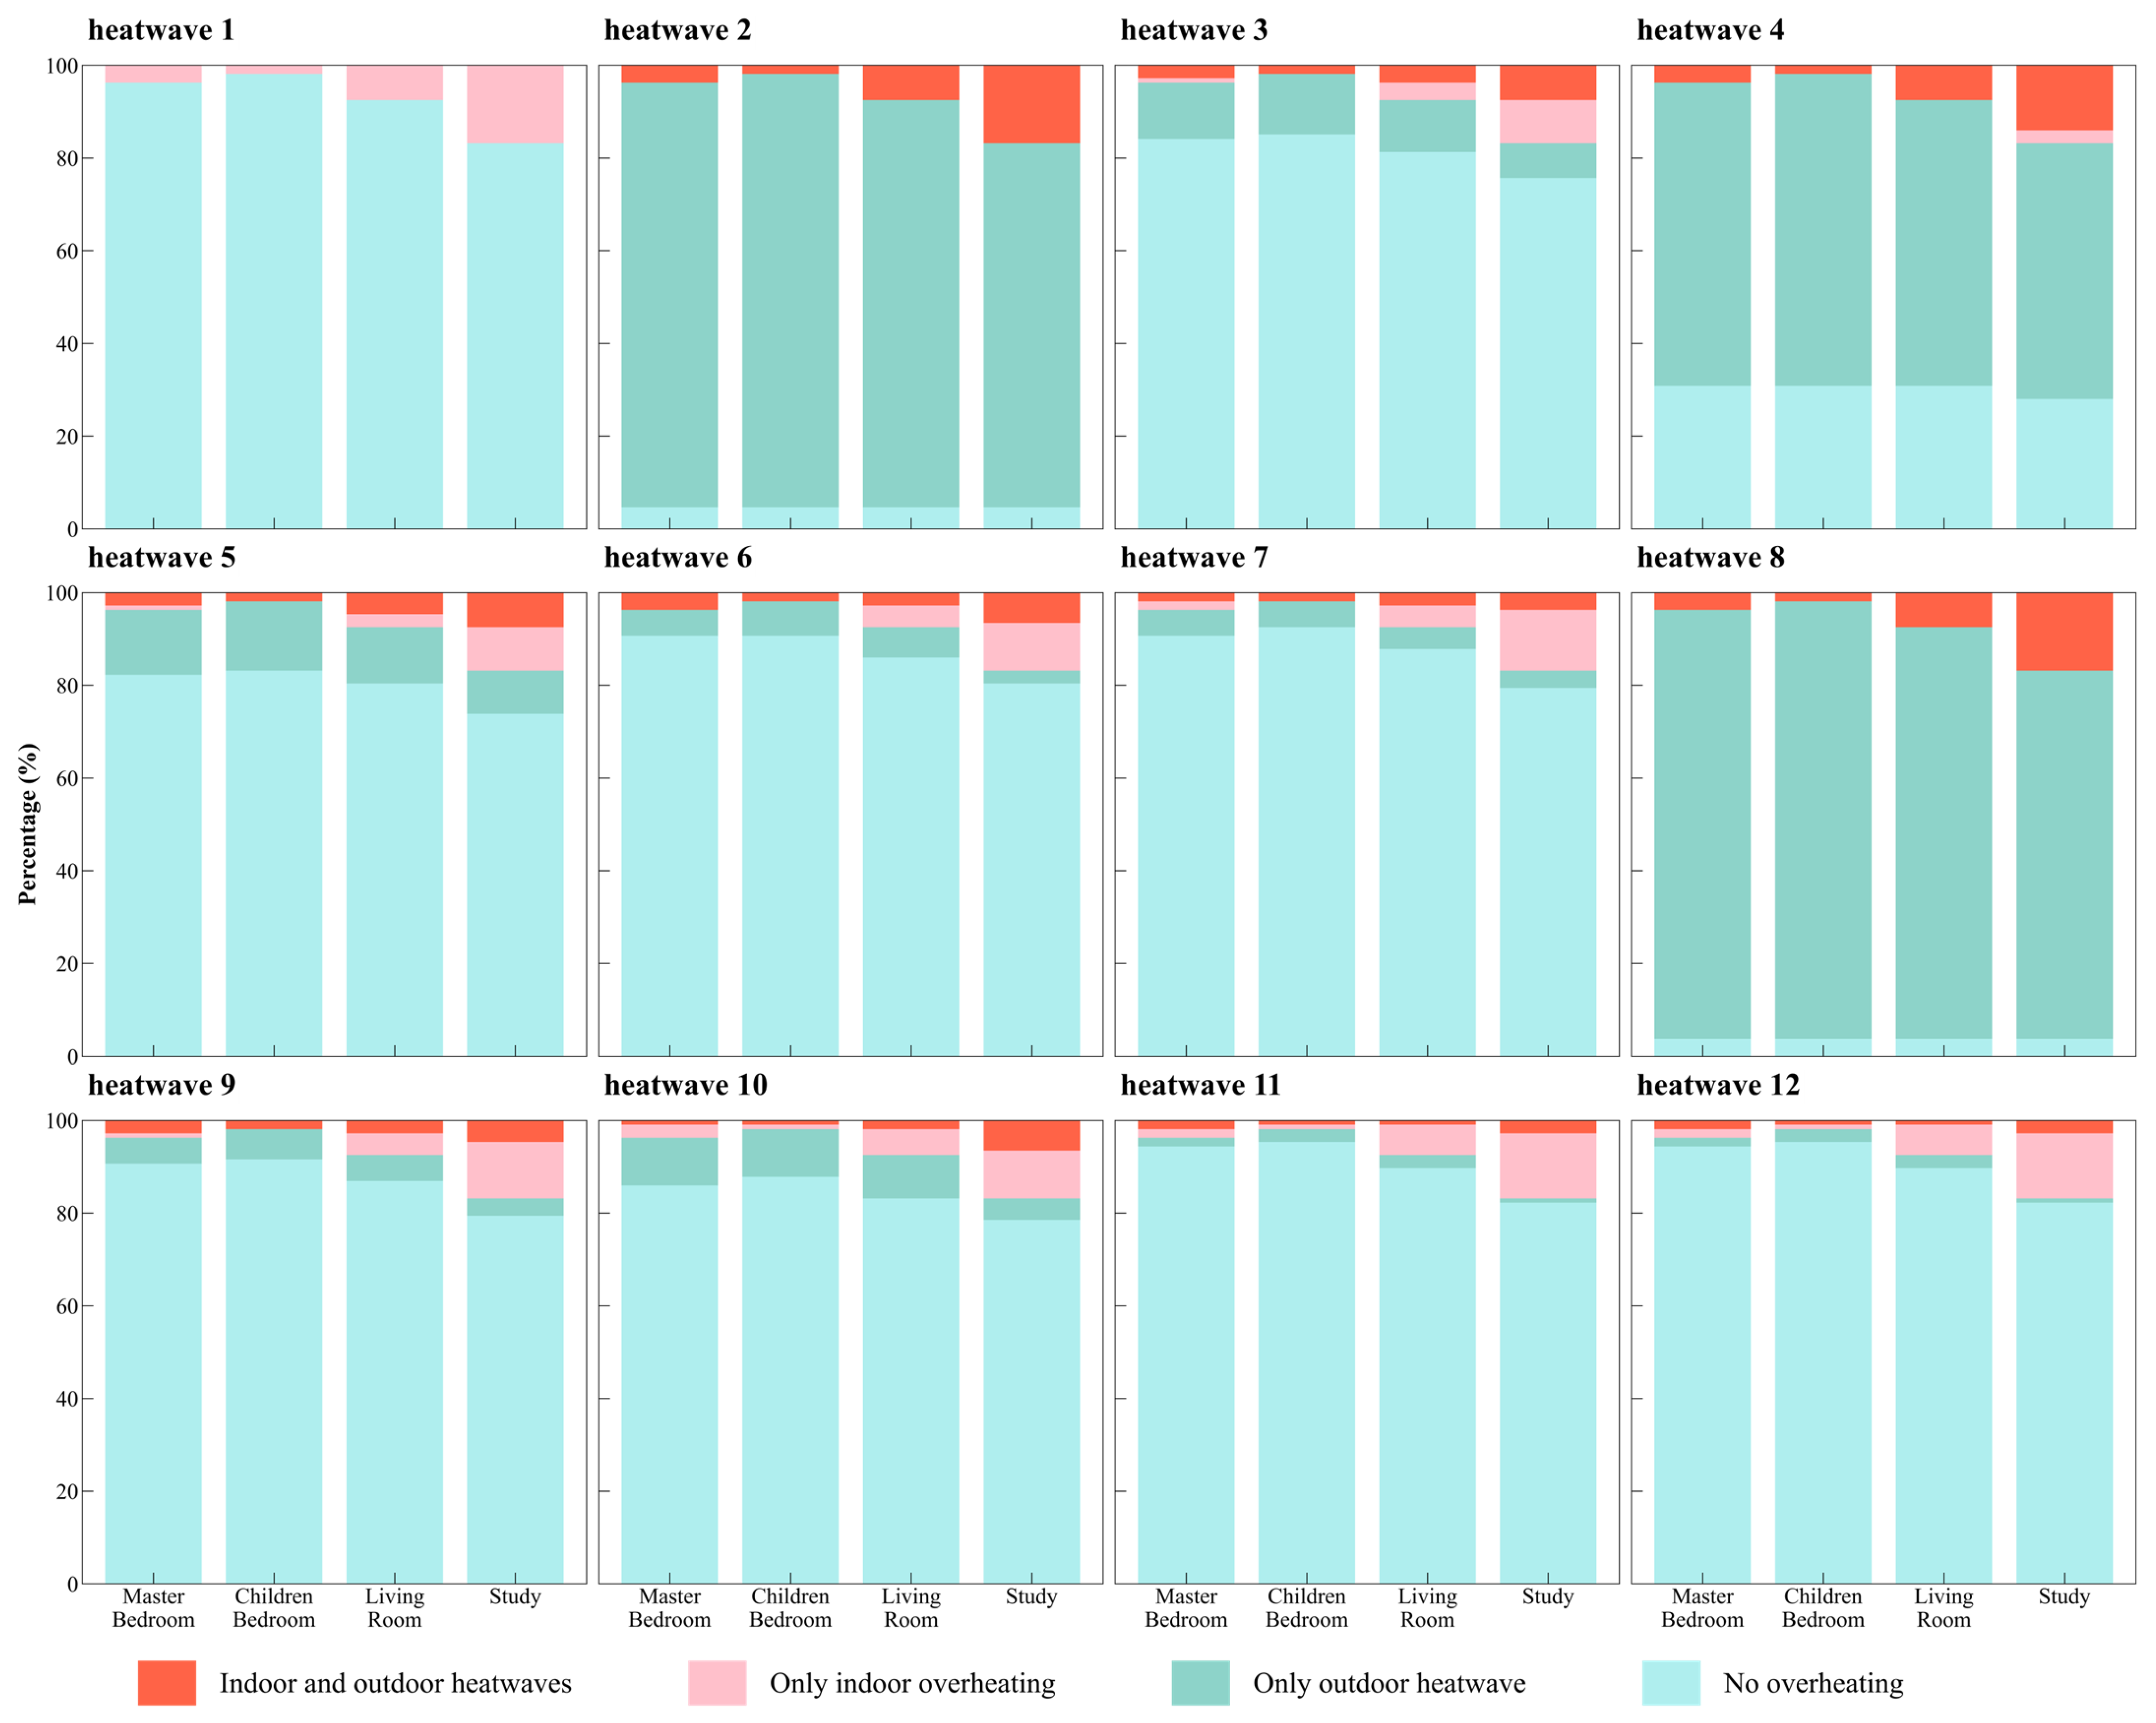
4.3. Results of the Coupled Indoor and Outdoor Heatwave Assessment
4.3.1. Assessment of the Overlap Degree
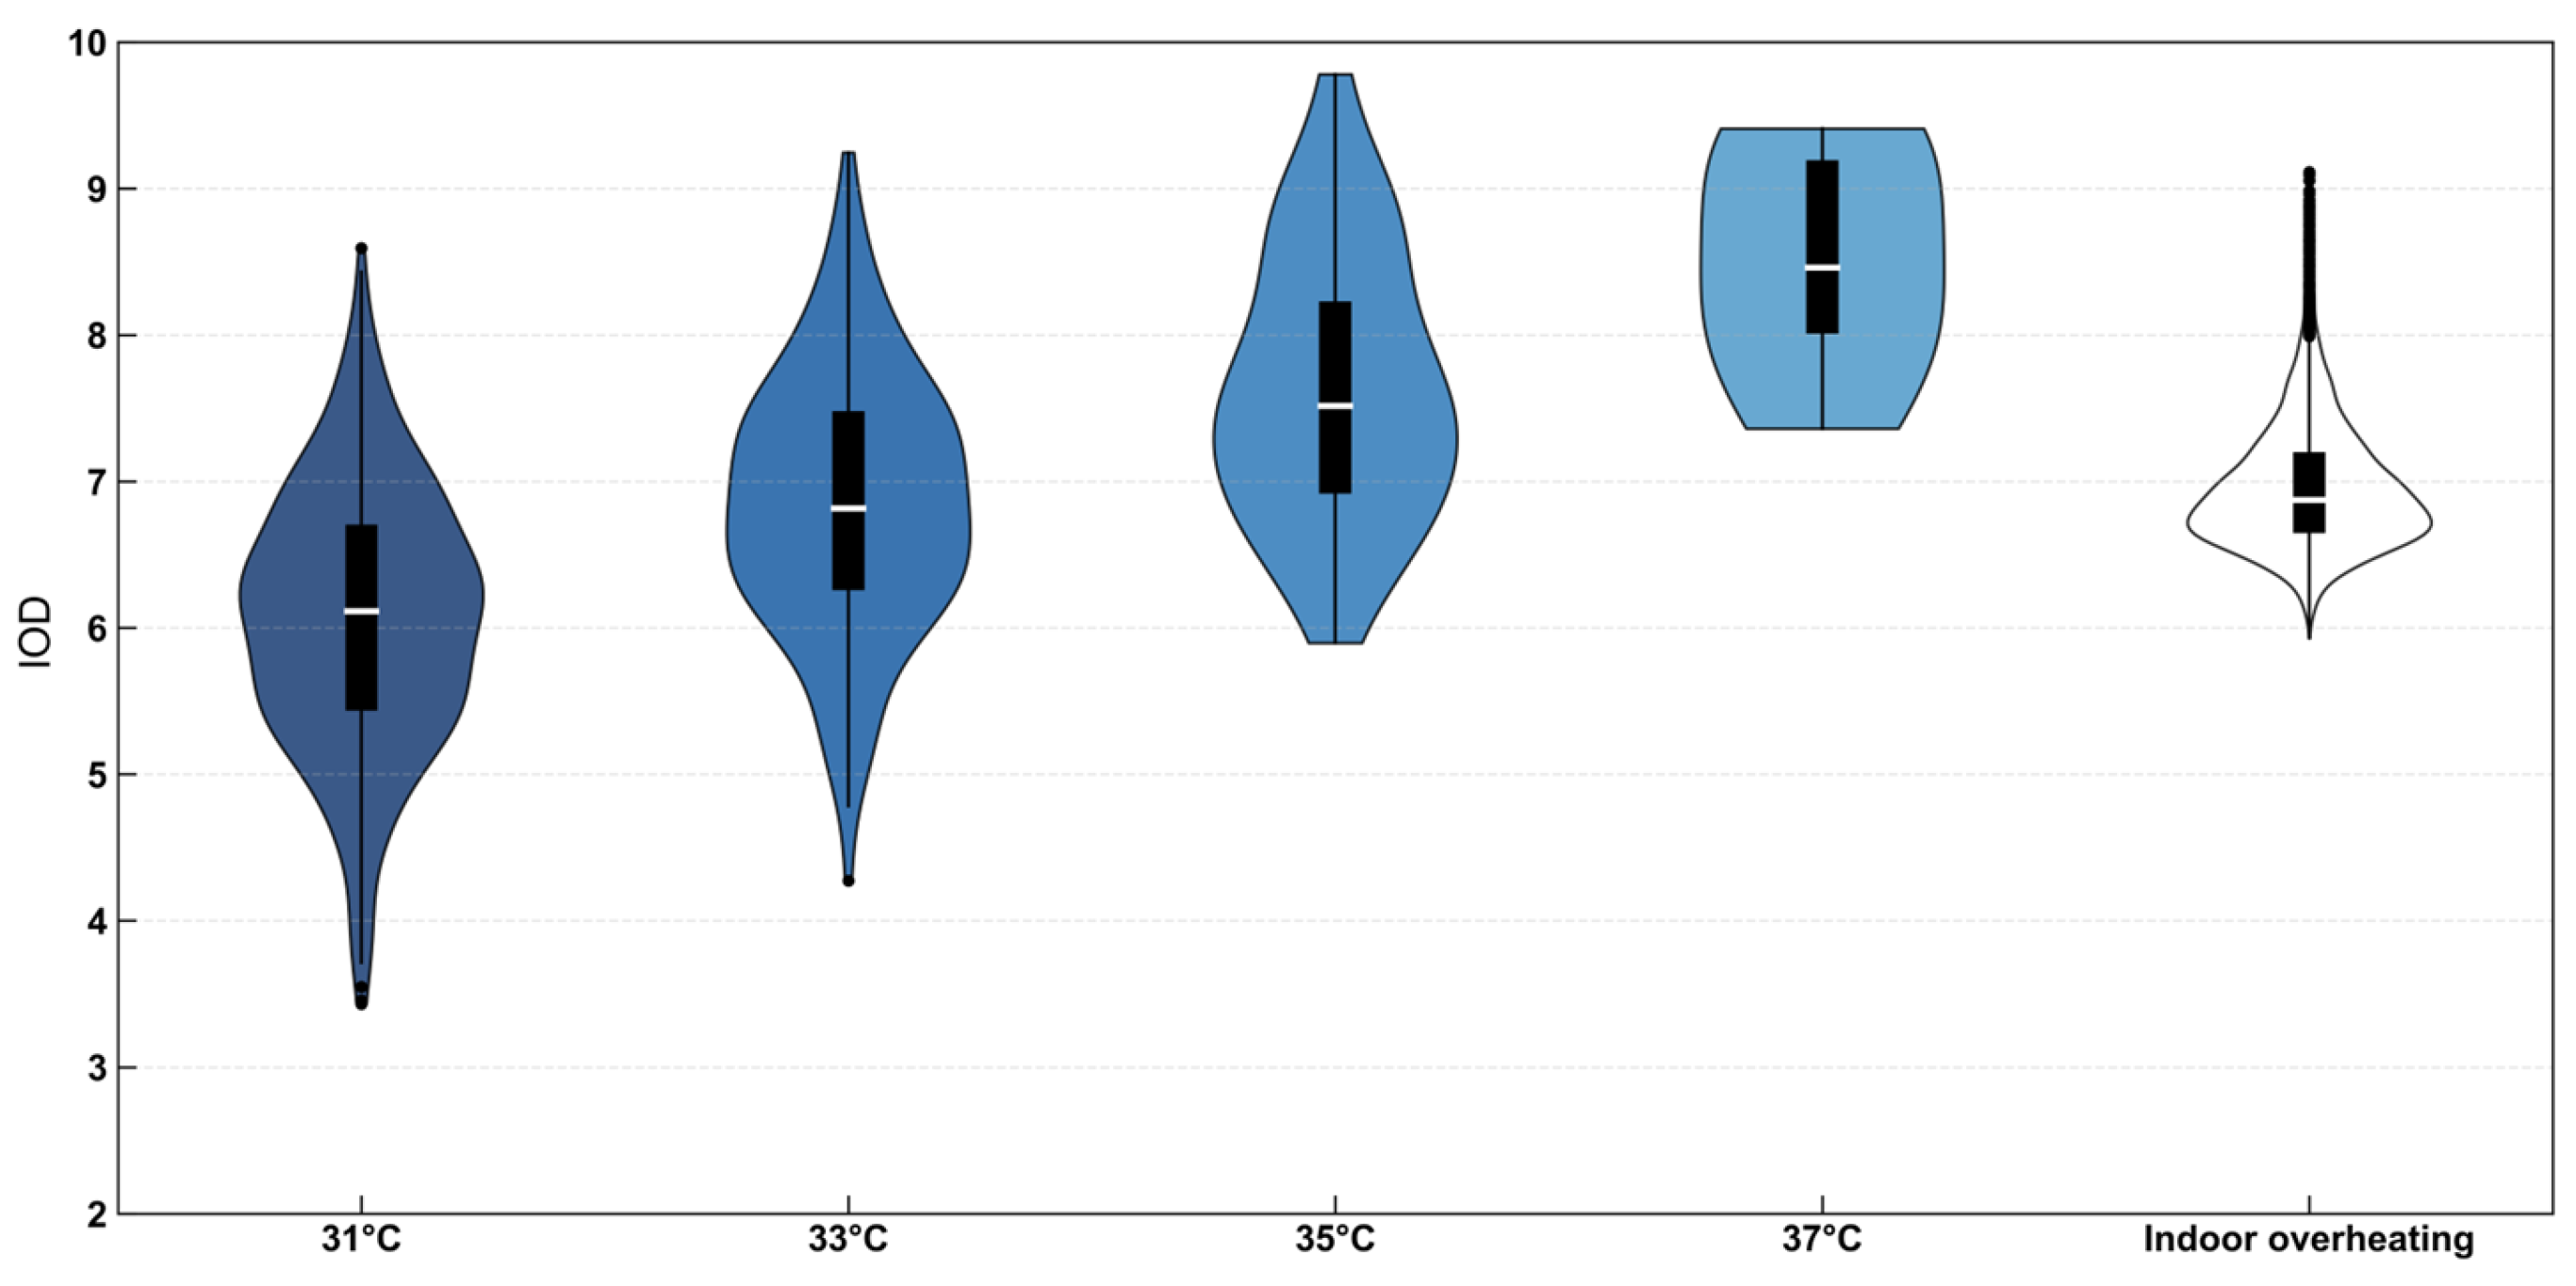
4.3.2. Evaluation of the IOD
5. Discussion
5.1. Rationality of Heatwave Definition
5.2. Impact of Different Thresholds of Heatwave Definitions
5.3. Limitations
6. Conclusions
Author Contributions
Funding
Data Availability Statement
Conflicts of Interest
References
- Intergovernmental Panel on Climate Change. Climate Change 2021: The Physical Science Basis. Contribution of Working Group I to the Sixth Assessment Report of the Intergovernmental Panel on Climate Change; Cambridge University Press: Cambridge, UK, 2023. [Google Scholar]
- World Meteorological Organization. State of the Global Climate 2023; World Meteorological Organization: Geneva, Switzerland, 2023. [Google Scholar]
- China Meteorological Administration Climate Change Center. China Climate Change Blue Book; Science Press: Beijing, China, 2024. [Google Scholar]
- Zhang, S.; Zhang, C.; Cai, W.; Bai, Y.; Callaghan, M.; Chang, N.; Chen, B.; Chen, H.; Cheng, L.; Dai, H.; et al. The 2023 China report of the lancet countdown on health and climate change: Taking stock for a thriving future. Lancet Public Health 2023, 8, e978–e995. [Google Scholar] [CrossRef]
- International Energy Agency. World Energy Outlook 2021; International Energy Agency: Paris, France, 2021. [Google Scholar]
- Seneviratne, S.I.; Zhang, X.; Adnan, M.; Badi, W.; Dereczynski, C.; Luca, A.D.; Ghosh, S.; Iskandar, I.; Kossin, J.; Lewis, S.; et al. Weather and climate extreme events in a changing climate. In Climate Change 2021: The Physical Science Basis; Cambridge University Press: Cambridge, UK, 2021. [Google Scholar]
- Zhang, C.; Kazanci, O. Aalborg Universitet IEA EBC Annex 80-Dynamic Simulation Guideline for the Performance Testing of Resilient Cooling Strategies: Version 2; Aalborg University: Aalborg, Denmark, 2023. [Google Scholar]
- Levinson, R.; Arens, E.; Bozonnet, E.; Corrado, V.; Gilbert, H.; Holzer, P.; Jaboyedoff, P.; Krelling, A.; Machard, A.; Miller, W.; et al. Policy Recommendations from IEA EBC Annex 80: Resilient Cooling of Buildings; International Energy Agency: Paris, France, 2023. [Google Scholar]
- Wu, X.L.; Liu, Q.S.; Liu, G.H.; Huang, C.; Li, H. A review of research on high-temperature heatwave risk assessment. J. Geo-Inf. Sci. 2019, 21, 1029–1039. [Google Scholar]
- Zhang, Y.; Xiao, T.G.; Zeng, J.T.; Du, Y. Study on the spatiotemporal distribution characteristics of high-temperature heatwaves in Southwest China from 1979 to 2019. Nat. Sci. 2020, 8, 207–219. [Google Scholar]
- Ouzeau, G.; Soubeyroux, J.M.; Schneider, M.; Vautard, R.; Planton, S. Heat waves analysis over France in present and future climate: Application of a new method on the EURO-CORDEX ensemble. Clim. Serv. 2016, 4, 1–12. [Google Scholar] [CrossRef]
- Heo, S.; Bell, L.M.; Lee, J. Comparison of health risks by heat wave definition: Applicability of wet-bulb globe temperature for heat wave criteria. Environ. Res. 2019, 168, 158–170. [Google Scholar] [CrossRef]
- Xu, C.; Wei, R.H.; Tong, H. A Systematic Review of Methodological Advances in Urban Heatwave Risk Assessment: Integrating Multi-Source Data and Hybrid Weighting Methods. Sustainability 2025, 17, 3747. [Google Scholar] [CrossRef]
- Cheng, Q.P.; Jin, H.Y.; Ren, Y.T. Compound daytime and nighttime heatwaves for air and surface temperature based on relative and absolute threshold dynamic classified in Southwest China, 1980–2019. Sustain. Cities Soc. 2023, 91, 104433. [Google Scholar] [CrossRef]
- Xu, Z.W.; Cheng, J.; Hu, W.B.; Tong, S.L. Heatwave and health events: A systematic evaluation of different temperature indicators, heatwave intensities and durations. Sci. Total Environ. 2018, 630, 679–689. [Google Scholar] [CrossRef] [PubMed]
- Sun, S.Q.; Yu, K.A.; Guo, J.M.; Shen, H.Y.; Wang, L. Analysis of urban high-temperature characteristics and heatwave indices: A case study of Ningbo City. Agric. Technol. 2016, 36, 215. [Google Scholar]
- Zhang, M. Spatiotemporal Analysis of Extreme High-Temperature Events in China Based on Multi-Indicators and Multi-Scales. Master’s Thesis, Shanghai Normal University, Shanghai, China, 2016. [Google Scholar]
- Yang, X.; Zhang, N. Analysis of influencing factors of indoor temperature in buildings. Energy Conserv. 2021, 40, 74–76. [Google Scholar]
- Azin, V.F.; Juha, J.; Natalia, K.; Kirsti, J.; Risto, K. Hot Summers in Nordic Apartments: Exploring the Correlation between Outdoor Weather Conditions and Indoor Temperature. Buildings 2024, 14, 1053. [Google Scholar] [CrossRef]
- Li, J.; Ren, G.Y.; Zhan, Y.J. A brief discussion on the method of determining thresholds in the study of extreme temperature events. Adv. Meteorol. Sci. Technol. 2013, 3, 36–40. [Google Scholar]
- Zhong, X.; Zheng, J.M.; He, F.; Zhan, Z. Study on the optimal definition of heatwaves in subtropical regions based on the mortality effect of cardiovascular diseases. J. Environ. Hyg. 2024, 14, 634–640+666. [Google Scholar]
- Liu, Q.Y. Research on the Temperature-Humidity Compound Heatwave Events and Population Exposure in the Middle and Lower Reaches of the Yangtze River. Doctoral Dissertation, Nanjing University of Information Science and Technology, Nanjing, China, 2023, unpublished. [Google Scholar]
- Yan, X.; Huang, X.J.; Zhang, Y.X.; Zhao, K.; Li, L. Evolution characteristics of high-temperature heatwaves and population exposure risk in the Yangtze River Economic Belt. Resour. Environ. Yangtze Basin 2024, 33, 1041–1054. [Google Scholar]
- Huang, Z.; Chen, H.; Tian, H. Study on the index of warm heatwaves. Meteorol. Mon. 2011, 37, 345–351. [Google Scholar]
- Zhu, Y.X. Building Environment, 4th ed.; China Architecture & Building Press: Beijing, China, 2016. [Google Scholar]
- Sun, K.; Specian, M.; Hong, T. Nexus of thermal resilience and energy efficiency in buildings: A case study of a nursing home. Build. Environ. 2020, 177, 106842. [Google Scholar] [CrossRef]
- Heo, S.; Bell, M.L. Heat waves in South Korea: Differences of heat wave characteristics by thermal indices. J. Expo. Sci. Environ. Epidemiol. 2019, 29, 790–805. [Google Scholar] [CrossRef]
- Guo, S.; Yan, D.; Hong, T.; Zhao, C.; Cui, Y. A novel approach for selecting typical hot-year (THY) weather data. Appl. Energy 2019, 242, 1634–1648. [Google Scholar] [CrossRef]
- Qian, B.; Yu, T.; Zhang, C.; Heiselberg, P.K.; Lei, B.; Yang, L. Suitability of heat wave event definitions for assessing indoor overheating in current and future climate: A case study in China. Build. Environ. 2023, 241, 110487. [Google Scholar] [CrossRef]
- Liu, X.; Liu, Z.; Wu, Y.; Hu, S.; Bu, F.; An, J.; Zhou, X.; Yan, D. A novel quantitative method of heatwave classification for building resilience analysis. Sustain. Cities Soc. 2024, 112, 105603. [Google Scholar] [CrossRef]
- Occupational Safety and Health Administration. Using the Heat Index: A Guide for Employers Introduction; Occupational Safety and Health Administration: Washington, DC, USA, 2016. [Google Scholar]
- National Oceanic and Atmospheric Administration. Heat Index. 2018. Available online: https://www.weather.gov/safety/heat-index (accessed on 10 July 2025).
- World Meteorological Organization; World Health Organization. Heatwaves and Health: Guidance on Warning-System Development; WMO & WHO: Geneva, Switzerland, 2015. [Google Scholar]
- Opitz-Stapleton, S.; Sabbag, L.; Hawley, K.; Tran, P.; Hoang, L.; Hoang, P. Heat index trends and climate change implications for occupational heat exposure in Da Nang, Vietnam. Clim. Serv. 2016, 2–3, 41–51. [Google Scholar] [CrossRef]
- Wehner, M.; Castillo, F.; Stone, D. The Impact of Moisture and Temperature on Human Health in Heat Waves. Oxford Research Encyclopedia of Natural Hazard Science. 2017. Available online: https://oxfordre.com/naturalhazardscience/view/10.1093/acrefore/9780199389407.001.0001/acrefore-9780199389407-e-58 (accessed on 10 July 2025).
- National Oceanic and Atmospheric Administration. What Is the Heat Index? 2018. Available online: https://www.weather.gov/ama/heatindex (accessed on 10 July 2025).
- National Oceanic and Atmospheric Administration. Weather Related Fatality and Injury Statistics. 2019. Available online: https://www.weather.gov/hazstat/ (accessed on 4 August 2019).
- Hamdy, M.; Carlucci, S.; Hoes, P.; Hensen, J.L. The impact of climate change on the overheating risk in dwellings—A Dutch case study. Build. Environ. 2017, 122, 307–323. [Google Scholar] [CrossRef]
- ISO 17772-1; Energy Performance of Buildings-Indoor Environmental Quality. Part 1: Indoor Environmental Input Parameters for the Design and Assessment of Energy Performance in Buildings. ISO: Geneva, Switzerland, 2017.
- Cui, Y.; Yan, D.; Hong, T.; Ma, J. Temporal and spatial characteristics of the urban heat island in Beijing and the impact on building design and energy performance. Energy 2017, 130, 286–297. [Google Scholar] [CrossRef]
- Chen, Z.; Yang, G.; Li, Y.; Wan, J.; Sang, M. Characteristics of climate change in Beijing over the past 60 years and analysis of its causes. Geol. Rev. 2015, 61, 7–8. [Google Scholar]
- Gao, S.; An, J.; Wang, C.; Yan, D.; Ma, J. Impact of climate change on air-conditioning power consumption of residential buildings in Beijing. Heat. Vent. Air Cond. 2023, 53, 44–52+16. [Google Scholar]
- Li, Z.; Jiang, Y.; Yan, D. Simulation Analysis of Residential Intermittent Heating. Heat. Vent. Air Cond. 2005, 35, 110–113+140. [Google Scholar]
- JGJ 26-95; Energy-Saving Design Standard for Civil Buildings. China Building Industry Press: Beijing, China, 1995.
- Wang, C.; Li, X.; Sun, W.; An, J.; Gao, S. Occupant behavior, thermal environment, and appliance electricity use of a single-family apartment in China. Sci. Data 2024, 11, 65. [Google Scholar] [CrossRef] [PubMed]
- Hu, S.; Yan, D.; Guo, S.; Cui, Y.; Dong, B. A survey on energy consumption and energy usage behavior of households and residential building in urban China. Energy Build. 2017, 148, 366–378. [Google Scholar] [CrossRef]
- Gui, C.; Yan, D.; Guo, S.; An, J. Study on typical building models in Beijing based on actual energy consumption characteristics. Build. Sci. 2020, 36, 14–22. [Google Scholar]
- GB50736-2012; Design Code for Heating, Ventilation and Air Conditioning of Civil Buildings Design Code for Heating, Ventilation and Air Conditioning for Civil Buildings. China Planning Press: Beijing, China, 2012.
- Yan, D.; Zhou, X.; An, J.; Kang, X.; Bu, F.; Chen, Y.; Pan, Y.; Gao, Y.; Zhang, Q.; Zhou, H.; et al. DeST 3.0: A new-generation building performance simulation platform. Build. Simul. 2022, 15, 1849–1868. [Google Scholar] [CrossRef]
- An, J.; Wu, Y.; Gui, C.; Yan, D. Chinese prototype building models for simulating the energy performance of the nationwide building stock. Build. Simul. 2023, 16, 1559–1582. [Google Scholar] [CrossRef]


| Name | Definition | Duration | Literature Source | |
|---|---|---|---|---|
| Heatwave 1 | Number of High-temperature Days | The number of days when the daily maximum temperature is ≥35 °C | ≥3 d | [20] |
| Heatwave 2 | Number of Summer Days | The number of days when the daily maximum temperature is >25 °C | \ | |
| Heatwave 3 | Number of Warm Daytime Days | The number of days when the daily maximum temperature is >the 90th percentile value | \ | |
| Heatwave 4 | Number of Hot Night Days | The number of days when the daily minimum temperature is >20 °C | \ | |
| Heatwave 5 | Number of Warm Night Days | The number of days when the daily minimum temperature is >the 90th percentile value | \ | |
| Heatwave 6 | Daily Average Temperature | The number of days when the daily average temperature is ≥the 95th percentile value | ≥4 d | [21] |
| Name | Calculation Formula | Definition | Duration | Literature Source | |
|---|---|---|---|---|---|
| Heatwave 7 | Wet-bulb Temperature | The number of days when the wet-bulb temperature is >the 90th percentile value | ≥3 d | [22] | |
| Heatwave 8 | Wet-bulb Globe Temperature | The number of days when the wet-bulb globe temperature is >30 °C | \ | [23] | |
| Heatwave 9 | Thermal Stress Index | , ≤ 60% , 60% | The number of days when the heat index is >87.3 °C | \ | [24] |
| Heatwave 10 | Outdoor Comprehensive Air Temperature | The number of days when the outdoor comprehensive air temperature is >the 90th percentile value | ≥3 d | [25] | |
| Heatwave 11 | Heat Index | The number of days when the heat index is >the 90th percentile value | ≥2 d | [26] | |
| Heatwave 12 | Approximate Globe Temperature | The number of days when the approximate globe temperature is >the 90th percentile value | ≥2 d | [27] |
| c1 = −8.78469475556 | c2 = 1.61139411 | c3 = 2.33854882889 |
| c4 = −0.14611605 | c5 = −0.0123080904 | c6 = −0.0164248277778 |
| c7 = 0.002211732 | c8 = 0.00072546 | c9 = −0.000003582 |
| Attribute | Value |
|---|---|
| Total floor area (m2) | 1369.8 |
| Height per floor (m) | 2.7 |
| Number of floors | 4 |
| Shape coefficient (m−1) | 0.378 |
| Window-to-wall ratio | 0.26 |
| Envelope | Heat Transfer Coefficient (W/m2·K) | Thermal Inertia Index | Materials | Thickness (mm) |
|---|---|---|---|---|
| External walls | 0.900 | 2.255 | Reinforced concrete | 200 |
| Polystyrene foam | 39 | |||
| Interior wall | 0.430 | 2.690 | Cement mortar | 20 |
| Ceramic concrete | 180 | |||
| Cement mortar | 20 | |||
| Roofs | 0.809 | 2.825 | Reinforced concrete | 250 |
| Expanded polystyrene sheet | 43 | |||
| Windows | 4.700 | \ | Glass (double-layer) | 3 |
| SC (shading coefficient) 0.83 |
| Room Type | Occupancy Time (h) | |
|---|---|---|
| Midweek | Weekend | |
| Master bedroom/Children’s bedroom | 0–6; 22–23 | 0–6; 13–14; 22–23 |
| Living room/Study | 17–19 | 6–9; 15–17; 19–21 |
| Parameter Setting | Details |
|---|---|
| Occupant thermal disturbance | Per capita heat emission: 53 W |
| Per capita moisture production: 0.061 kg/hr | |
| Lighting thermal disturbance | Electrical-to-thermal conversion efficiency: 0.9 |
| Equipment thermal disturbance | Maximum power: 12.7 W |
Disclaimer/Publisher’s Note: The statements, opinions and data contained in all publications are solely those of the individual author(s) and contributor(s) and not of MDPI and/or the editor(s). MDPI and/or the editor(s) disclaim responsibility for any injury to people or property resulting from any ideas, methods, instructions or products referred to in the content. |
© 2025 by the authors. Licensee MDPI, Basel, Switzerland. This article is an open access article distributed under the terms and conditions of the Creative Commons Attribution (CC BY) license (https://creativecommons.org/licenses/by/4.0/).
Share and Cite
Liu, W.; An, J.; Wang, C.; Hu, S. Comparative Study on Outdoor Heatwave Indicators for Indoor Overheating Evaluation. Buildings 2025, 15, 2461. https://doi.org/10.3390/buildings15142461
Liu W, An J, Wang C, Hu S. Comparative Study on Outdoor Heatwave Indicators for Indoor Overheating Evaluation. Buildings. 2025; 15(14):2461. https://doi.org/10.3390/buildings15142461
Chicago/Turabian StyleLiu, Wenyan, Jingjing An, Chuang Wang, and Shan Hu. 2025. "Comparative Study on Outdoor Heatwave Indicators for Indoor Overheating Evaluation" Buildings 15, no. 14: 2461. https://doi.org/10.3390/buildings15142461
APA StyleLiu, W., An, J., Wang, C., & Hu, S. (2025). Comparative Study on Outdoor Heatwave Indicators for Indoor Overheating Evaluation. Buildings, 15(14), 2461. https://doi.org/10.3390/buildings15142461