Article

Real-Time Progress Monitoring of Bricklaying

by
Ramez Magdy
1,*,
Khaled A. Hamdy
1 and
Yasmeen A. S. Essawy
1,2,*
1
Department of Structural Engineering, Ain Shams University (ASU), Cairo 11566, Egypt
2
Department of Construction Engineering, The American University in Cairo (AUC), Cairo 11835, Egypt
*
Authors to whom correspondence should be addressed.
Buildings 2025, 15(14), 2456; https://doi.org/10.3390/buildings15142456
Submission received: 12 May 2025 / Revised: 1 July 2025 / Accepted: 7 July 2025 / Published: 13 July 2025
(This article belongs to the Special Issue AI in Construction: Automation, Optimization, and Safety)

Abstract

The construction industry is one of the largest contributors to the world economy. However, the level of automation and digitalization in the construction industry is still at its infancy in comparison with other industries due to the complex nature and the large size of construction projects. Meanwhile, construction projects are prone to cost overruns and schedule delays due to the adoption of traditional progress monitoring techniques to retrieve progress on-site, having indoor activities participating with an accountable ratio of these works. Improvements in deep learning and Computer Vision (CV) algorithms provide promising results in detecting objects in real time. Also, researchers have investigated the probability of using CV as a tool to create a Digital Twin (DT) for construction sites. This paper proposes a model utilizing the state-of-the-art YOLOv8 algorithm to monitor the progress of bricklaying activities, automatically extracting and analyzing real-time data from construction sites. The detected data is then integrated into a 3D Building Information Model (BIM), which serves as a DT, allowing project managers to visualize, track, and compare the actual progress of bricklaying with the planned schedule. By incorporating this technology, the model aims to enhance accuracy in progress monitoring, reduce human error, and enable real-time updates to project timelines, contributing to more efficient project management and timely completion.

1. Introduction

1.1. Automated Progress Monitoring

An annual global budget of USD 10 trillion, representing roughly 13 percent of the world’s gross domestic product (GDP), is designated for the construction industry, ranking it as one of the largest industries worldwide [1] (Barbosa et al., 2017). A prevalent misperception exists that construction occurs exclusively outdoors, despite the reality that most of the work is conducted indoors [2]. Interior construction activities have been proven to be prone to schedule delays, and the average cost share of these activities falls anywhere between 25 and 40% [3]. Meanwhile, traditional techniques for monitoring construction project progress have consistently relied on manual processes, encompassing visual inspections and human assessment. This results in these methods being slow and inaccurate [4], as well as increasing the amount of time required for identifying inconsistencies between the as-built and as-planned models. Additionally, it makes it difficult to implement corrective measures within a project, which ultimately results in a significant number of schedule delays and cost overruns in the interior construction environment [5,6]. On the other hand, the majority of research efforts in the field of project control continue to concentrate on the development of cost control models, where the earned value concept has been established to be the highest reliable technique for the monitoring and management of construction projects [7]. One of the most important aspects of project control is the tracking of progress or the as-built sensing. When it comes to construction projects, progress monitoring is of the greatest importance since it allows for the identification of any inconsistencies between the as-planned state and the as-built status, as well as the fast implementation of remedies [8]. For these reasons, research considers project monitoring an essential component of successful completion of a construction project within the estimated budget [9]. However, it is not a straightforward operation and is connected with several challenges. These challenges arise due to the fact that construction projects contain extensive amounts of information related to a number of activities, encompassing project scheduling, construction methodologies, cost management, resource allocation, quality assurance, and change order administration management. Furthermore, the information is collected from a broad range of diverse sources and is presented in a wide variety of formats. While this is going on, automation is playing a big role in enhancing both efficiency and productivity across a variety of industries. In the manufacturing sector, for instance, productivity has improved by a factor of eight when automation was used, whereas in the agricultural sector, it has increased by a factor of sixteen [10]. Experts anticipate that automation will contribute an annual value of USD 1.6 trillion across various industries [1]. Construction automation can help close the productivity gap by increasing productivity by a factor of five to ten, and this increasing productivity can be accomplished by transitioning to production methods that are similar to those used in manufacturing [11], which will assist in lowering the risk of errors and reworks, as well as preventing deviations from the baseline and cost overruns [12,13].

1.2. Automated Progress Monitoring Methods

In recent years, various approaches and studies have emerged that compare as-built data with Building Information Modeling (BIM)-based as-planned data for progress monitoring management. Furthermore, modern technologies have been developed and deployed to collect data at construction sites. Major categories of approaches can be differentiated. The first category is collecting information regarding progress derived from the sensor data [14]. This strategy allows for the sensors to be placed in any required location; however, it generally requires a substantial quantity of card readers, which entails a considerable risk of loss. In the next category, the advancement of work performed on-site is assessed by producing point clouds and conducting comparisons [4]. High-precision point clouds can be acquired using laser scanners; however, data processing is time-intensive, and real-time monitoring of construction progress is prohibitive. Eventually, image-assisted point clouds utilize image detection to supplement the absent semantic information in point clouds created by Structure from Motion (SfM) for assessing advancements in the construction process [15]. The SfM method, reliant on capturing images from many perspectives, is unsuitable for generating point clouds indoors, as a single image fails to provide comprehensive information about the interior scene. As a result, image-based approaches are considered superior in effectiveness, accuracy, and cost-efficiency compared to Construction Progress Monitoring (CPM) approaches [16].

1.3. Bricklaying Operations and Progress Monitoring

Bricklaying activity is a fundamental activity in construction. It can be considered the starting milestone for indoor construction activities, as it is the predecessor for most of these activities (such as plastering, dry wall, tiling, etc.). Research has focused on automating the progress monitoring of bricklaying activities using point-based methods [5] and other construction activities using Computer Vision (CV) methods [17]. However, few have focused on the utilization of deep learning techniques for progress monitoring of bricklaying and their capabilities to build a Digital Twin (DT).

1.4. Computer Vision and Digital Twin

In 2012, ref. [18] developed a large and deep convolutional neural network (CNN), and it was trained on the ImageNet [19] dataset for image classification. Since then, there have been advancements achieved in the field of object detection, which has led to the increased utilization of deep learning and CV algorithms in construction sites [20,21,22], which provides prospects for automating CPM. These algorithms can detect and monitor objects in images and videos, delivering real-time data on their position, dimensions, and orientation. They can be utilized to generate a DT of a construction project [16]. The integration of CV with a DT may enhance closed-loop project control in automated Construction Project Management by delivering real-time visual data and insights. CV can assess construction site images and videos in real time to monitor the advancement of various operations and components, as well as the movement and use of construction resources, including supplies, labor, and equipment. This data is subsequently input into the DT, facilitating project managers’ comparison of actual progress against the anticipated timetable and rapidly identifying any discrepancies, accordingly enabling construction managers to make informed, data-driven decisions.

1.5. Research Gap, Novelty, and Objectives

The construction industry continues to struggle with delays and cost overruns, particularly in indoor activities such as bricklaying, due to inefficient progress monitoring practices. While previous studies have applied deep learning methods like Mask R-CNN for general construction activity monitoring [17], there is a clear gap in the research specifically addressing real-time monitoring of bricklaying activities. Moreover, existing studies have not fully explored the potential of deep learning techniques to enable real-time synchronization with BIM and facilitate the creation of a functional DT on active job sites.
The primary objective of this paper is to develop a model that automatically detects and monitors bricklaying activities’ progress in indoor construction sites, integrating the results into BIM to enable dynamic, real-time progress tracking.
In order to achieve the aforementioned objective, the following sub-objectives shall be addressed:
  • Development of a Data Acquisition System;
  • Implementation of CV Algorithms for Brick Detection;
  • Integration of Data into the BIM Environment;
  • Progress Visualization.
This integrated approach aims to overcome the complexities of real-time data capture and automation in construction environments, thereby enhancing the applicability and adoption of DT technologies.

2. Literature Review

2.1. Computer Vision

CV focuses on modeling and emulating human vision through computer software and hardware. It is a rapidly growing field that examines the reconstruction, interpretation, and comprehension of a three-dimensional scene from its two-dimensional images [23,24]. The typical tasks for CV are as follows:
Classification: A technique that involves assigning one or more category labels to the scenes that have been captured, based on previous data. This procedure often entails supervised machine learning. The algorithm derives a mapping function that correlates input data with output category labels based on a collection of training examples. Recent advancements in deep learning enable transfer learning to adapt generic pre-trained models to specific construction site scenarios. Numerous pre-trained models exist for image classification tasks, including the Visual Geometry Group’s VGG-16 and VGG-19 models [25], GoogleNet [26], and Residual Neural Network (ResNet) [27].
Object Detection: It involves locating one or more items belonging to a particular category within the data. The procedure of detecting the object requires either sketching a bounding box on the outside boundary of an object or constructing a mask that represents the boundaries of the object. Recent advancements in the field of object detection in images involve the implementation of region proposal techniques. These techniques include the Faster Region-based Convolutional Neural Networks (Faster R-CNNs) [28], Single-Shot Detector (SSD) [29], and You Only Look Once (YOLO) [30].
Segmentation: This is the process of separating the data into segments that represent objects. An example of this process is semantic segmentation, which occurs when each segment is given a label that identifies the type of item. According to [31], semantic segmentation does not differentiate between instances and merely makes use of pixels, but it does provide a more comprehensive comprehension of an image. In the context of image classification, semantic segmentation can be thought of as pixel-level classification [31]. Instance segmentation can be thought of as a hybrid of object detection and traditional segmentation. One of the primary goals of instance segmentation is to provide a separate representation of each individual instance of objects belonging to the same class. These methods of segmentation are considered to be state-of-the-art since they make use of supervised machine learning, which involves training a deep neural network with manually segmented pictures or point clouds. An encoder–decoder design is often utilized by segmentation networks. In this architecture, the encoder is responsible for feature extraction, and the decoder is responsible for generating a segmentation mask. Essential developments in image segmentation include Fully Convolutional Network (FCN) [32] and Mask R-CNN [27].

2.2. Image-Based Method for Indoor Construction Activities

The image-based method is progressively being implemented in construction sites, and it is well acknowledged that image-based methods have their own set of benefits when it comes to locating and categorizing objects displayed in images taken from construction sites. The authors of ref. [33] developed an open-source image dataset, the ROI-1555 dataset, for rebar object detection and instance segmentation that systematically considers bent rebars and different camera views for the purpose of facilitating the efficient training and detection of rebar identification and instance segmentation algorithms. The authors of [17] proposed an automated framework for monitoring indoor construction progress utilizing Mask R-CNN and BIM for identifying the construction stage of interior walls and to compute the progress percentage of plastering, leveraging Mask R-CNN for segmentation due to its efficiency in accurately detecting overlapping objects. The progress data was represented in Autodesk Revit© through the Revit API [34]. The authors of ref. [35] proposed a framework for automatically detecting and monitoring construction progress through the analysis of surveillance video, focusing on two primary points: determining the installation time of precast walls and identifying their location within a BIM model. The framework comprised six steps: detection and segmentation utilizing Mask R-CNN for the identification and segmentation of precast walls, generating bounding boxes and masks [36]; tracking with DeepSORT, which provides pixel positions for displacement assessment [37]; status evaluation through the calculation of wall displacement and documentation of the installation time when displacement remains below a specified threshold; localization employing masks and a localization algorithm to ascertain the wall’s position within the construction floor plan; data preservation in a JSON file; and BIM timestamping via a Autodesk Revit© plug-in that interprets the JSON file and timestamps the relevant wall components in the BIM model. These studies demonstrate that image-based approaches may efficiently acquire spatial and temporal information about items in construction, which is crucial for progress monitoring. Nonetheless, current vision-based research on progress monitoring mostly emphasizes the assessment of significant project milestones, often leading to a static representation. Consequently, vision-based techniques that enable real-time monitoring at the elemental level merit additional investigation, as they can illustrate a more dynamic progression of the project.

2.3. Object Detection Importance

Image Classification, as was mentioned before, offers information on whether or not the object of interest is there in an image, as well as the probability that it is present. Object detection, on the other hand, is a process that incorporates both classification and localization tasks. These tasks require identifying and locating objects in images or videos. When compared to other methods, it is frequently more useful because it enables the identification and localization of several objects inside the same image. Through the provision of a bounding box that encompasses various regions of interest inside an image, the object detection technique is able to identify object categories, as well as the location of each individual object [31]. As part of the object detection process, one of the most significant tasks is to determine what is present in the image and with what degree of certainty (the classification task). The subsequent stage, which follows the identification of the object, is to locate it inside the image by making use of the detection algorithms. A Bounding Box (BB) is a rectangle that is typically formed by the regression approach and appears around the detected object. Detection algorithms typically produce this rectangle [38,39]. Object detection is the foundation of vision-based monitoring systems, which are able to identify and localize many components in the construction industry. These components include structural elements (beams and columns), building materials, personal protective equipment (PPE), construction machines, and personnel, among other things. Since the introduction of deep learning in the field of CV, CNNs have emerged as the premiere standard for the majority of applications that include CV. Instead, instance segmentation is a technique that detects the objects that are present in each pixel, which results in a detailed map of the item that is present in an image. This technique is more useful for jobs that require the object shape to be taken into consideration [40].

2.4. YOLO Object Detection Algorithm

According to ref. [41], the YOLO series has attracted much attention because it is equipped with real-time processing capabilities and possesses exceptional accuracy. Due to the fact that they are designed using a single pass, YOLO models are able to produce rapid inference times without compromising detection performance. Over the course of time, numerous iterations of the YOLO architecture have been developed, each of which has introduced improvements to enhance the detection accuracy and for better optimization of the process. The original YOLO model, which was proposed by Redmon et al. [30], revolutionized object detection by recasting it as a single-regression issue, which dramatically increased the speed at which it could be performed. Batch normalization, anchor boxes, and multiscale training were all introduced in YOLO v2 and YOLO v3, both of which were developed by Redmon and Farhadi [42,43]. These innovations were designed to improve the accuracy and versatility of the model. Redmon and Farhadi made additional improvements to YOLO v3, which included the use of Darknet 53 for feature extraction. The using of Darknet 53 made the software more reliable and accurate when it came to recognizing tiny objects. In the YOLO series, these foundational investigations laid the groundwork for additional breakthroughs that were forthcoming. Further enhancements in network design, feature extraction, and optimization approaches are incorporated into the YOLO series. For instance, YOLOv5 included a Focus layer for improved feature extraction and an Auto Anchor for optimization that is specific to the dataset [44]. [45] YOLOv7 was the first version to implement innovative architectural changes that yielded considerable improvements in both accuracy and efficiency [46]. YOLOv8 further enhanced these techniques, enhancing both the speed at which they were performed and the accuracy with which they detected.

2.5. Digital Twin

According to [47]. The DT is a groundbreaking concept that integrates the digital and physical worlds. It makes it possible to interact with and optimize physical objects or systems in real time through their virtual equivalents. Inspired by NASA’s work on simulating and predicting spacecraft states to mitigate failures [48], it was initially introduced by Michael Grieves in 2003 during his course on Product Lifecycle Management (PLM) [49]. Since then, it has become a significant trend in the field of technology [50]. A DT, at its core, is a digital representation of physical processes that mimics and digitally reflects those processes by merging virtual and physical components with the appropriate connection data. DT has developed across a variety of domains, and certain industries have given their viewpoints on what DT symbolizes, despite the fact that there is no single definition that encompasses all of these fields. In general, DT is defined as the digital replication of physical assets, which is connected and synchronized. This digital replica represents both the components and the dynamics of how systems work within their environment over the entirety of their existence [51]. In the context of the construction industry, the term “digital twinning” refers to the process of creating and linking a digital model of a construction project (whether it is already underway, in progress, or in the future) throughout its entire lifecycle. With the help of cutting-edge technologies such as artificial intelligence (AI), cyber–physical systems (CPS), the Internet of Things (IoT), and sensors, this digital model establishes a two-way connection with the physical project. Throughout the entirety of the project’s lifecycle, the model is continuously updated with semantic data that is up to date. This data includes geometric data, specifications, timetables, and financial reports. For projects that are already underway or that are currently in progress, the digital model is a real-time reflection of the physical project. On the other hand, for projects that shall be completed in the future, the model is informed by historical data and becomes bi-directional once the project enters the construction phase. According to [52], the dynamic interaction that exists between the physical and digital models is beneficial for decision-making, providing updated information in real time and ensuring that the project is continuously improved.
There are a number of major categories that can be used to characterize the structure and functionality of DT components. Real-world items or systems that are being represented are referred to as Physical Entities. Examples of Physical Entities are vehicles, products, farms, and supply networks. The term “physical twin” is used to describe the relationship between a physical and a virtual equivalent [53]. The digital representation of the physical entity is referred to as the Virtual Entity [54] This digital representation may include models, simulations, or virtual objects. There is the potential for several virtual entities to exist for reasons such as scheduling or monitoring of quality. When we talk about the physical environment, we are referring to the context of the physical entity in the real world. This context includes aspects such as the weather and holidays that have an impact on operations, whereas the Virtual Environment recreates this environment digitally by using data from sensors, databases, or application programming interfaces (APIs) [55]. Information that is operational, quality related, or behavioral in nature is referred to as a parameter. Parameters are the data that is transferred between physical and virtual twins. The precision, level of detail, and quantity of parameters of a DT are some of the characteristics that are referred to as its fidelity. A high level of fidelity guarantees an accurate replication of the physical twin. The state is a representation of the current status or parameters of both the physical and virtual twins, which enables real-time monitoring and prediction. The Physical-to-Virtual Connection is characterized by the utilization of sensors, the Internet of Things (IoT), or online services for the purpose of synchronization. On the other hand, the Virtual-to-Physical Connection is characterized by the implementation of changes in the virtual twin in the physical world for the purpose of closed-loop interaction [53]. Twinning is a notion that refers to the synchronization that occurs between the physical and virtual states. The Twinning Rate is a measurement that determines the frequency of synchronization in order to attain real-time performance. The processes that are included in a DT are both physical and virtual. Some examples of the former include manufacturing and quality monitoring, while the latter includes simulations, diagnostics, and optimizations. The Twinning Process is a dynamic cycle that involves data acquisition, synchronization, and state realization. This cycle enables continuous optimization and learning to take place. The architecture of a DT is comprised of several components, which, when combined, make it possible for the physical and virtual domains to interact effectively with one another [56].
Several studies have envisioned the potential applications of DTs over the entirety of the lifecycle of a construction project. When it comes to twinning a facility that is still under development, however, there is a lack of information [57]. The creation of DT solutions can be accomplished through the use of commercial platforms such as Autodesk Tandem [58] and Bentley iTwin [59]. However, the technological elements that are currently available in these platforms are still in the preliminary phases and are mostly focused on the phase of the built asset that is concerned with operations and maintenance. For under-construction projects, the geometry of the facility is constantly expanding, which means that the associated sensor positioning is also dynamic, making sensor positioning one of the most significant challenges that arises when developing a DT for the purpose of monitoring the progress of construction. In this particular setting, CV-based sensing would be the most suitable input to capture geometrical characteristics in a direct and speedy manner. For the purpose of progress monitoring, Digital Twinning shall be supported by pipelines that are able to stream and analyze the progress data in an accurate and timely manner in order to mirror the progress found in the virtual model. Real-time updates are required to be optimized for the process that occurs within and across the phases of the CV-CPM framework in order to accomplish this. Besides reflecting on the progress that has been made, a DT may also forecast the progress that shall be made in the construction process, as well as simulate and assess control methods that shall be used to put the project back on track. The control measures can be sent from the digital world to the physical world so that they can be executed by the equipment when the utilization of autonomous construction equipment increases.

3. Proposed Model Methodology

The proposed integrated methodology for CV-based bricklaying progress monitoring aims to automate the tracking of bricklaying activities by linking real-time site data with BIM. As illustrated in Figure 1, the methodology combines image-based object detection with BIM. This approach enables accurate retrieval, analysis, and visualization of as-built progress data, enhancing the reliability and timeliness of construction monitoring.
The proposed methodology is structured into four (4) main components: the Physical Twin, Data Acquisition, the DT, and Real-time Progress Monitoring. The Physical Twin serves as the project under research, where UAVs equipped with RGB cameras are used to capture images of brick walls. The Data Acquisition component facilitates the collection of visual and spatial data using RGB cameras and positioning sensors like IMUs. After data collection, CV algorithms are used to analyze the captured images along with their data to detect and analyze the bricklaying progress. The DT integrates this information into a BIM environment, where wall mapping and brick quantification are performed and as-planned quantity take-offs are extracted. The Real-time Progress Monitoring component compares the as-built data from the Physical Twin with the as-planned data from the DT, enabling accurate and timely visualization of bricklaying progress.

4. Proposed Model Development

This section outlines the development of the proposed model methodology for real-time bricklaying progress monitoring, integrating CV techniques with BIM.
As illustrated in Figure 2, the model’s five (5) interconnected components are demonstrated hereinafter.

4.1. Data Acquisition

The construction industry is characterized by its dynamic nature, and the size of a construction site continues to grow during the course of development. In order to monitor the development in real time, it is necessary to combine a number of different sensors. Platforms for sensors can be stationary (such as surveillance cameras), handheld, or mounted on Unmanned Aerial Vehicles (UAVs) or Unmanned Ground Vehicles (UGVs). In addition, for the purpose of positioning and monitoring the Global Navigation Satellite System (GNSS), Inertial Measurement Units (IMUs) and tracking devices are used [60]. This proposed model is image-based, which means that the mapping sensor is an RGB camera, the sensor platform can be either stationary or mounted on a vehicle, and an IMU can be used as a positioning sensor because GNSS does not function properly indoors. An IMU is comprised of a group of sensors, including an accelerometer that measures acceleration in three dimensions, a gyroscope that measures orientation, and a magnetometer that measures the strength of the magnetic field. In order to estimate the position and orientation of the device based on a previously known position, such as surveying control points, these readings can be combined and fused together before being used.

4.2. Wall Mapping and Brick Quantification

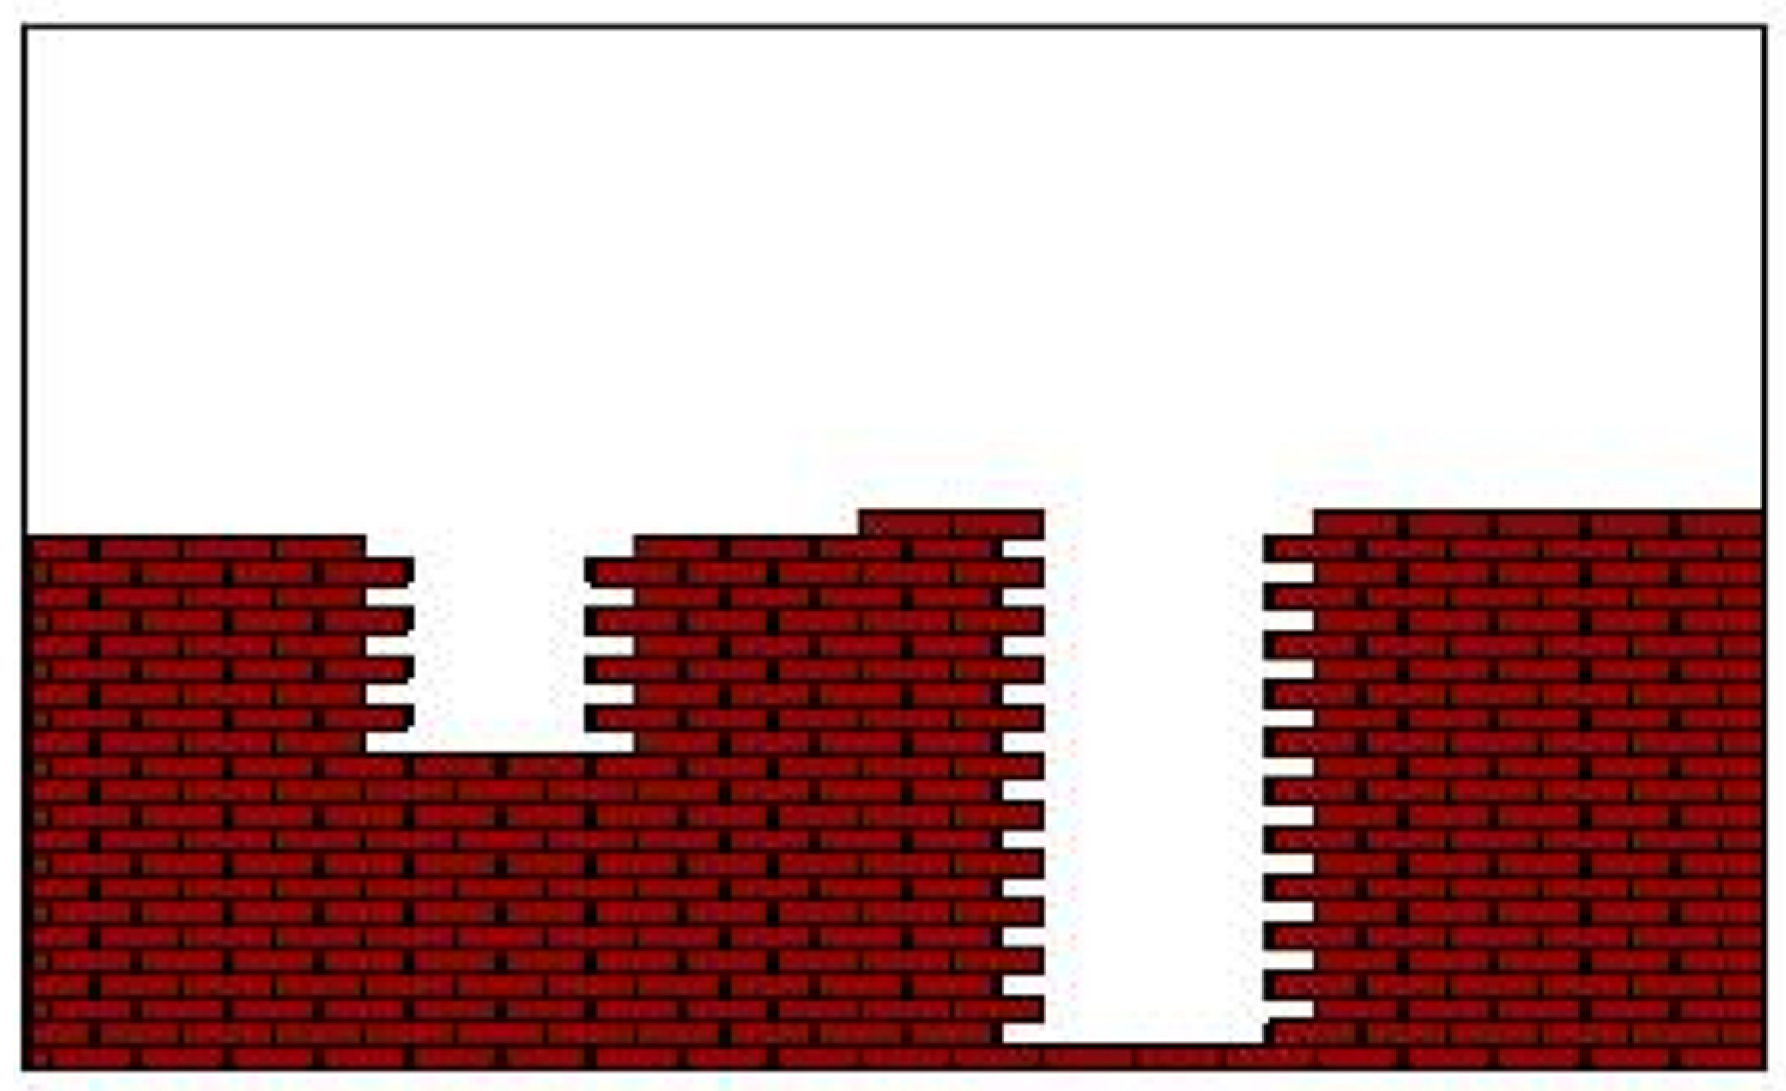
4.2.1. Digital Twin Wall Mapping

DT is a technological trend and is considered as the key for digital transformation due to its functionalities and services in integrating real systems with their virtual counterparts.
Wall Mapping is a critical step in aligning real-world conditions with the DT. In this model development, wall mapping is performed by combining visual data from RGB cameras with spatial positioning data captured by Inertial Measurement Units (IMUs). The RGB cameras mounted on UAVs or handheld devices capture high-resolution images of brick walls, while the IMUs provide precise orientation and movement data. Accordingly, this combination enables accurate localization and reconstruction of the wall’s geometry.

4.2.2. Brick Quantification

During the project design phase, the preparation of the as-planned models is carried out, typically using BIM or 2D/3D CAD, along with their schedules. The method of progress monitoring is determined by the availability of the as-planned model, as well as the type of model that is being used. Since the desired Level of Detail (LOD) for brick walls is not typically broken down in a BIM model to the level of a brick, accordingly, a plug-in has been developed in order to facilitate the process and to obtain an accurate as-planned material take-off of bricks in the wall under study in order to monitor the progress. The plug-in was built using the Revit API, with C# as the programming language and Visual Studio as the platform for development.
Buildings 15 02456 i001

4.2.3. Implementation

The plug-in, implemented as an external command application in Autodesk Revit©, enables automated quantification of bricks by programmatically inserting individual brick family instances row by row along a user-selected wall. The placement logic accounts for brick dimensions, mortar gaps, and the wall’s geometry to ensure realistic representation. Specifically, the plug-in identifies a predefined brick family (Brick_25 × 12 × 6) that has been created with standard brick dimensions and loaded into the Autodesk Revit© project.
Upon execution, the tool prompts the user to select a target wall and then extracts key geometric properties, including the wall’s baseline curve, height, and length. It also identifies the appropriate reference geometry by analyzing the wall’s solid geometry and locating the lowest downward-facing planar face. This step establishes the base origin and orientation of the wall, ensuring that bricks are aligned accurately along its direction.
Once the initial setup is complete, the plug-in begins the iterative placement of brick instances. To simulate realistic bricklaying, it alternates brick rows in a staggered pattern—achieved by placing half-bricks at the start of every odd-numbered row. Placement positions are adjusted based on calculated offsets, and each brick is oriented to align with the wall’s direction. This process continues until the entire wall area is filled with virtual bricks.
In addition, the plug-in detects hosted elements such as doors and windows by identifying their bounding boxes. In a subsequent transaction, any bricks that fall entirely within these openings are automatically removed to reflect actual construction voids.
Finally, the plug-in generates a report detailing the total number of bricks required for the selected wall. This end-to-end implementation demonstrates an advanced application of the Revit API, enabling the brick-level breakdown of wall models for highly accurate material estimation and progress tracking.

4.3. Computer Vision Algorithm for Brick Detection

CV is a powerful field of artificial intelligence focused on extracting meaningful insights from visual data. Among its many branches, object detection stands out as a critical technique, enabling machines to not only recognize but also pinpoint the location of various objects within an image. This capability has become especially valuable in the construction industry, where identifying materials, equipment, and structural elements accurately and efficiently is essential for safety, progress monitoring, and automation. Models like YOLO have revolutionized this space by offering real-time object detection with high precision, making them indispensable tools for enhancing productivity and reducing human error on construction sites.

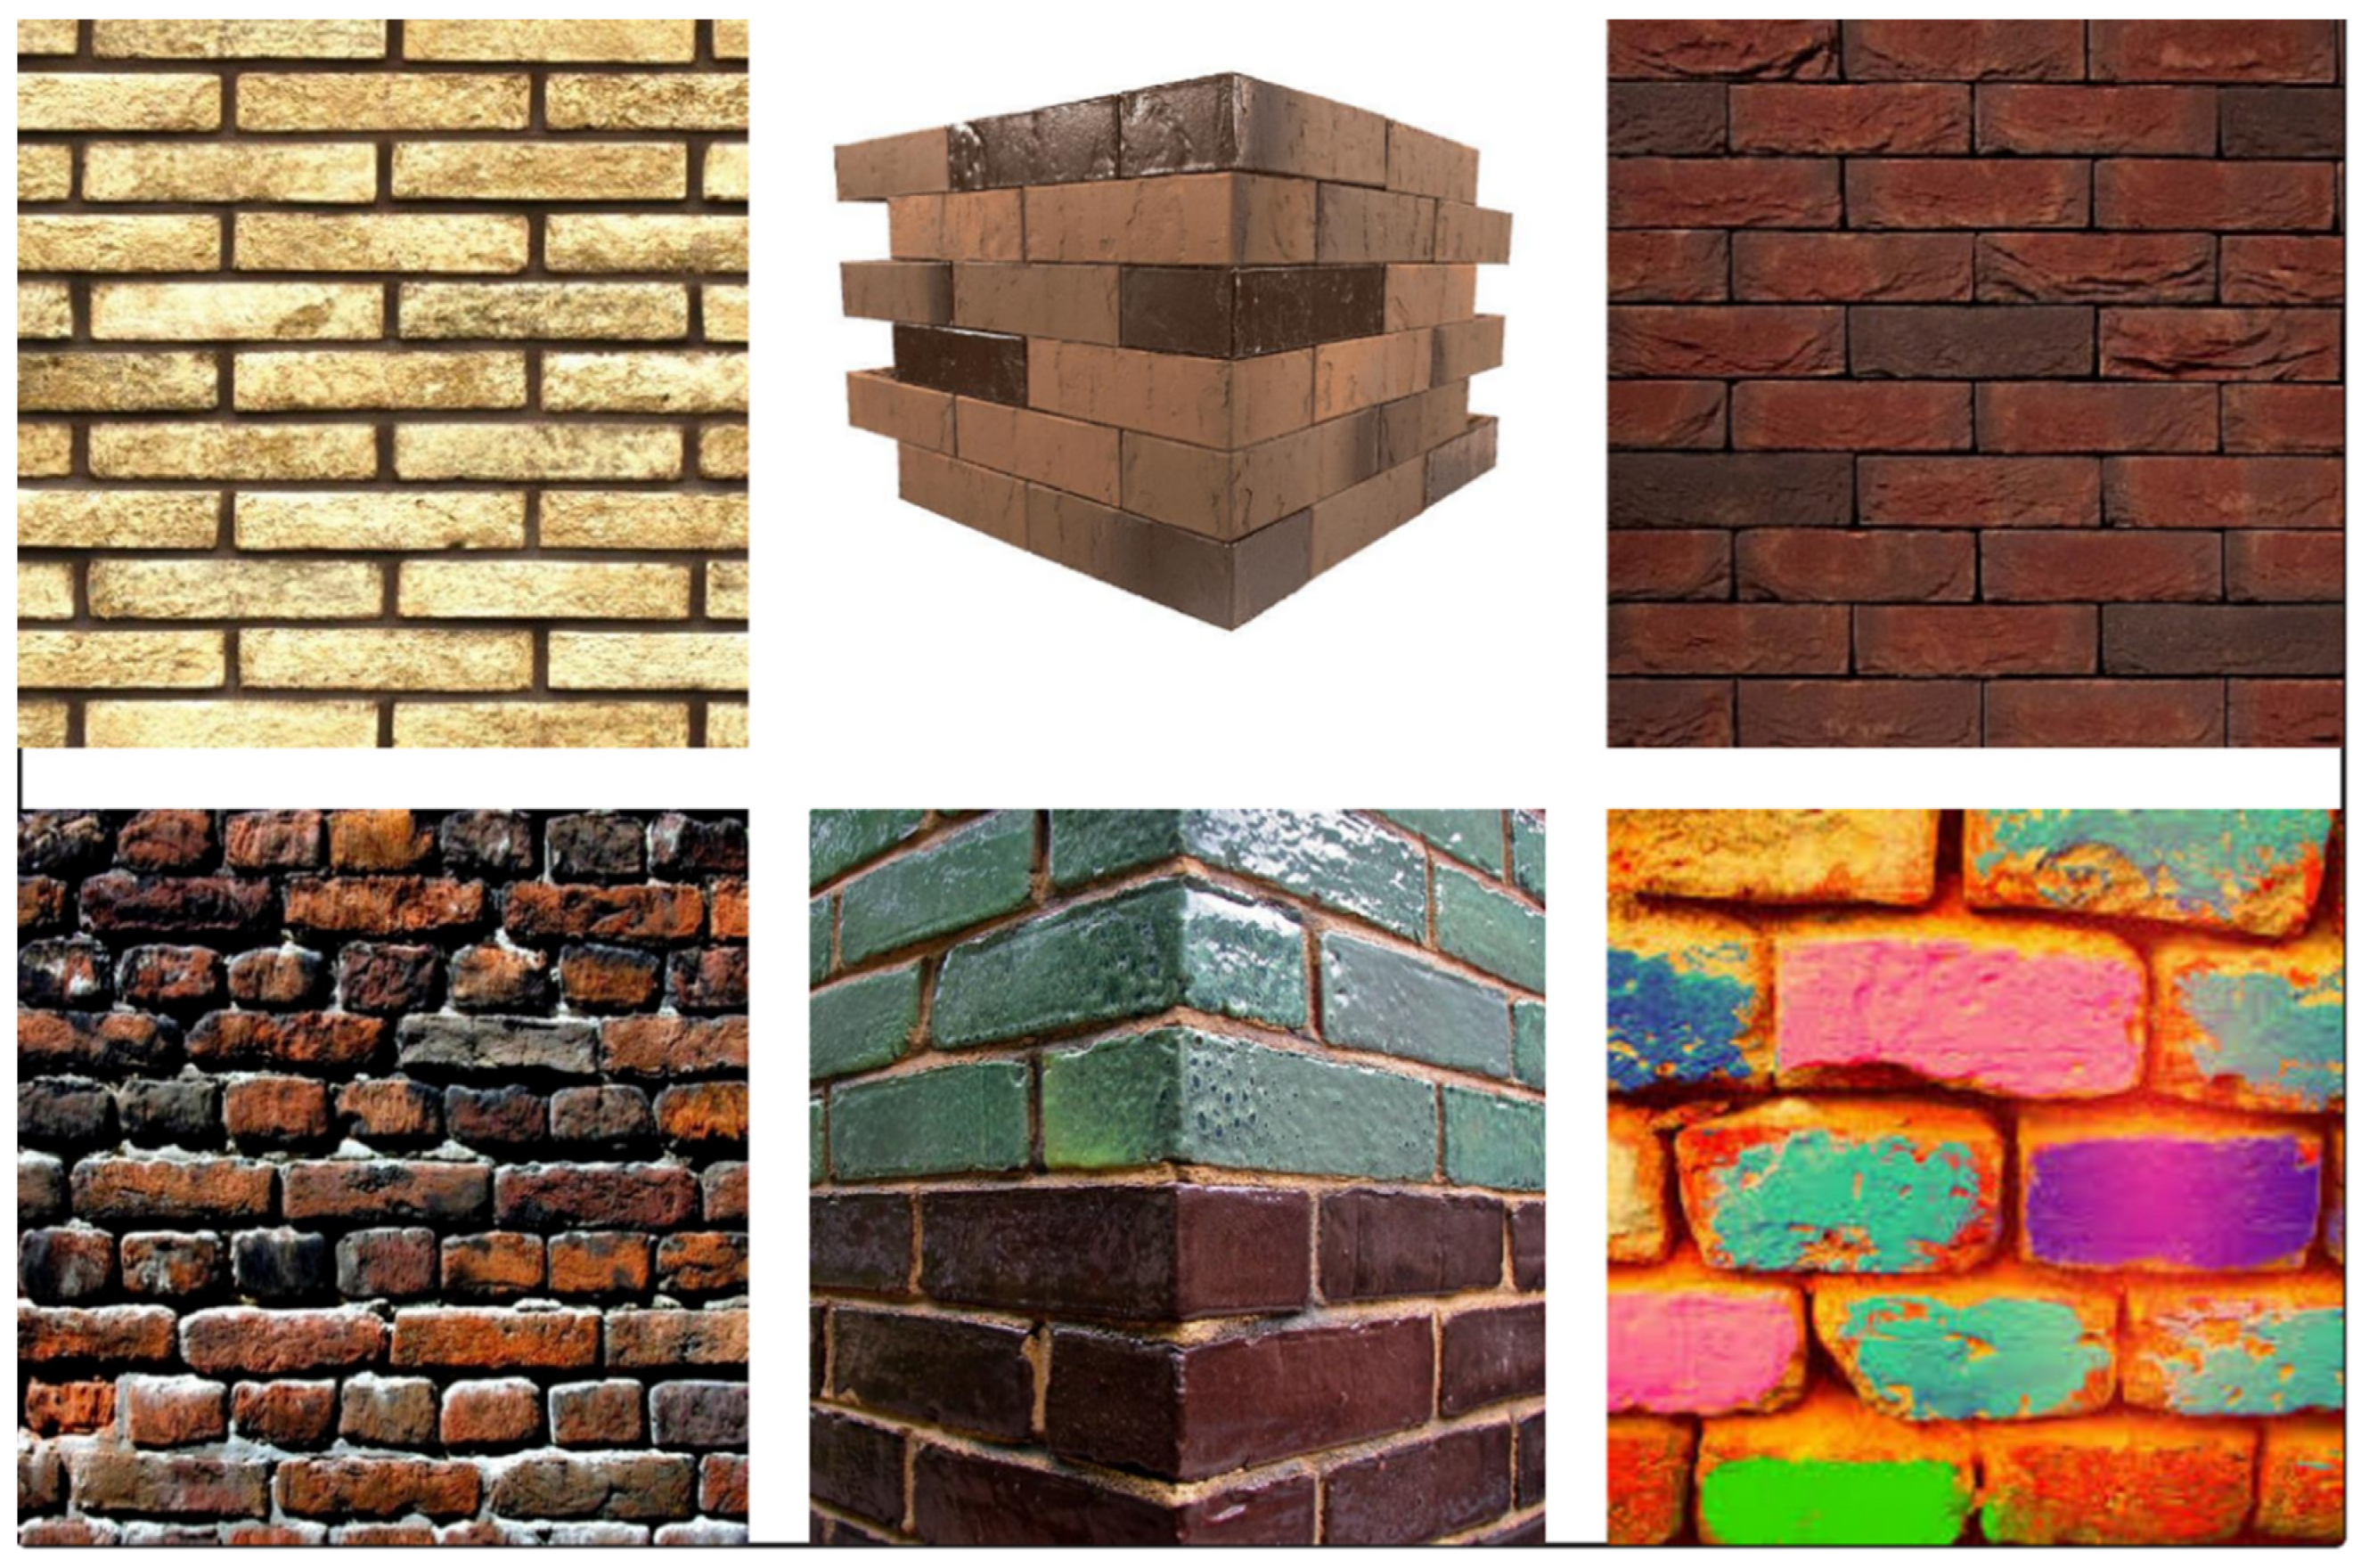
4.3.1. Dataset Creation

Data collection is an essential element of the project since it establishes the basis for future model training and prediction. A comprehensive dataset is crucial for attaining precise and dependable outcomes in object detection. Current CV datasets can be categorized into general image datasets and domain-specific image datasets. General datasets encompass categories pertinent to daily living. Conversely, the domain datasets encompass categories pertaining to certain fields. General datasets mostly consist of natural categories, including individuals, fauna, and transportation means. The MNIST dataset [61] comprises 70,000 handwritten digit pictures and serves as a foundational resource for deep learning. The PASCAL VOC dataset [62], extensively utilized for evaluating deep learning methods, has 11,000 images over 20 categories. Microsoft COCO [63] is a dataset including 160,000 images over 91 categories, each accompanied by textual descriptions of the category and location. Developed by Professor Li Feifei’s team, ImageNet [19] comprises approximately 14 million images over more than 20,000 categories. This dataset has significantly contributed to research in picture categorization, localization, and object detection. The capacity and variety of general datasets are always expanding and enhancing, resulting in the emergence of numerous exceptional CV models, particularly those associated with deep learning, which accelerate the swift advancement of CV technology. Nonetheless, the aforementioned broad picture collections frequently lack categories pertinent to the building sector.
In recent years, several image databases have been created for the construction sector. The authors of ref. [64] amassed hundreds of images of construction machinery encompassing five categories of equipment: excavators, loaders, bulldozers, rollers, and backhoe diggers. The authors of ref. [65] introduced a construction object detection methodology that integrates deep convolutional networks with transfer learning to precisely identify construction equipment. The authors of ref. [66] concentrated on the detection of guardrails at building sites. The authors extended the collection by incorporating backdrop images into the three-dimensional model of the guardrail, resulting in a total of 6000 images. The authors of ref. [67] developed and published a dataset of 3261 images of safety helmets and employed SSD-MobileNet to identify risky practices on construction sites. The authors of ref. [68] developed the Moving Objects in Construction Site (MOCS) dataset by gathering over 40,000 pictures from 174 construction sites and annotating 13 categories of moving objects. They employed pixel segmentation to accurately identify items and evaluated them on 15 distinct deep neural networks. The authors of ref. [69] developed a specialized image dataset comprising 1330 pictures for Personal Protective Equipment (PPE) titled Color Helmet and Vest (CHV). The authors of ref. [70] created the Alberta Construction Image Dataset (ACID), an image dataset specifically designed for the identification of construction machinery, comprising 10,000 manually gathered and annotated images of 10 types of construction machines. Four object detection algorithms—YOLO v3, Inception SSD, RFCN-ResNet, and Faster-RCNN-ResNet—were employed to train the dataset, yielding satisfactory mean Average Precision (mAP) and average detection times. Nevertheless, there exists a limited number of pertinent statistics, the majority of which focus only on workers, personal protective equipment, or machinery. This review indicates a scarcity of studies concerning the identification and detection of construction materials and layouts at construction sites.
For the proposed model development, a dataset of images representing the variety of bricks typically used in construction was created. The dataset, ref. [71], consists of five hundred and thirty-one (531) images sourced from real-world construction sites and internet-based datasets and saved in the JPG format, with a resolution of 640 × 640 pixels. During the image collection process, several factors were considered, including the diverse shapes of bricks, camera positions and angles, lighting conditions, color variations (red, brown, and light-colored bricks) to represent different regional practices, and the variety of foreground and backdrop elements, as illustrated in Figure 3 and Table 1. The success of the developed model shall rely heavily on the quality and relevance of this dataset.

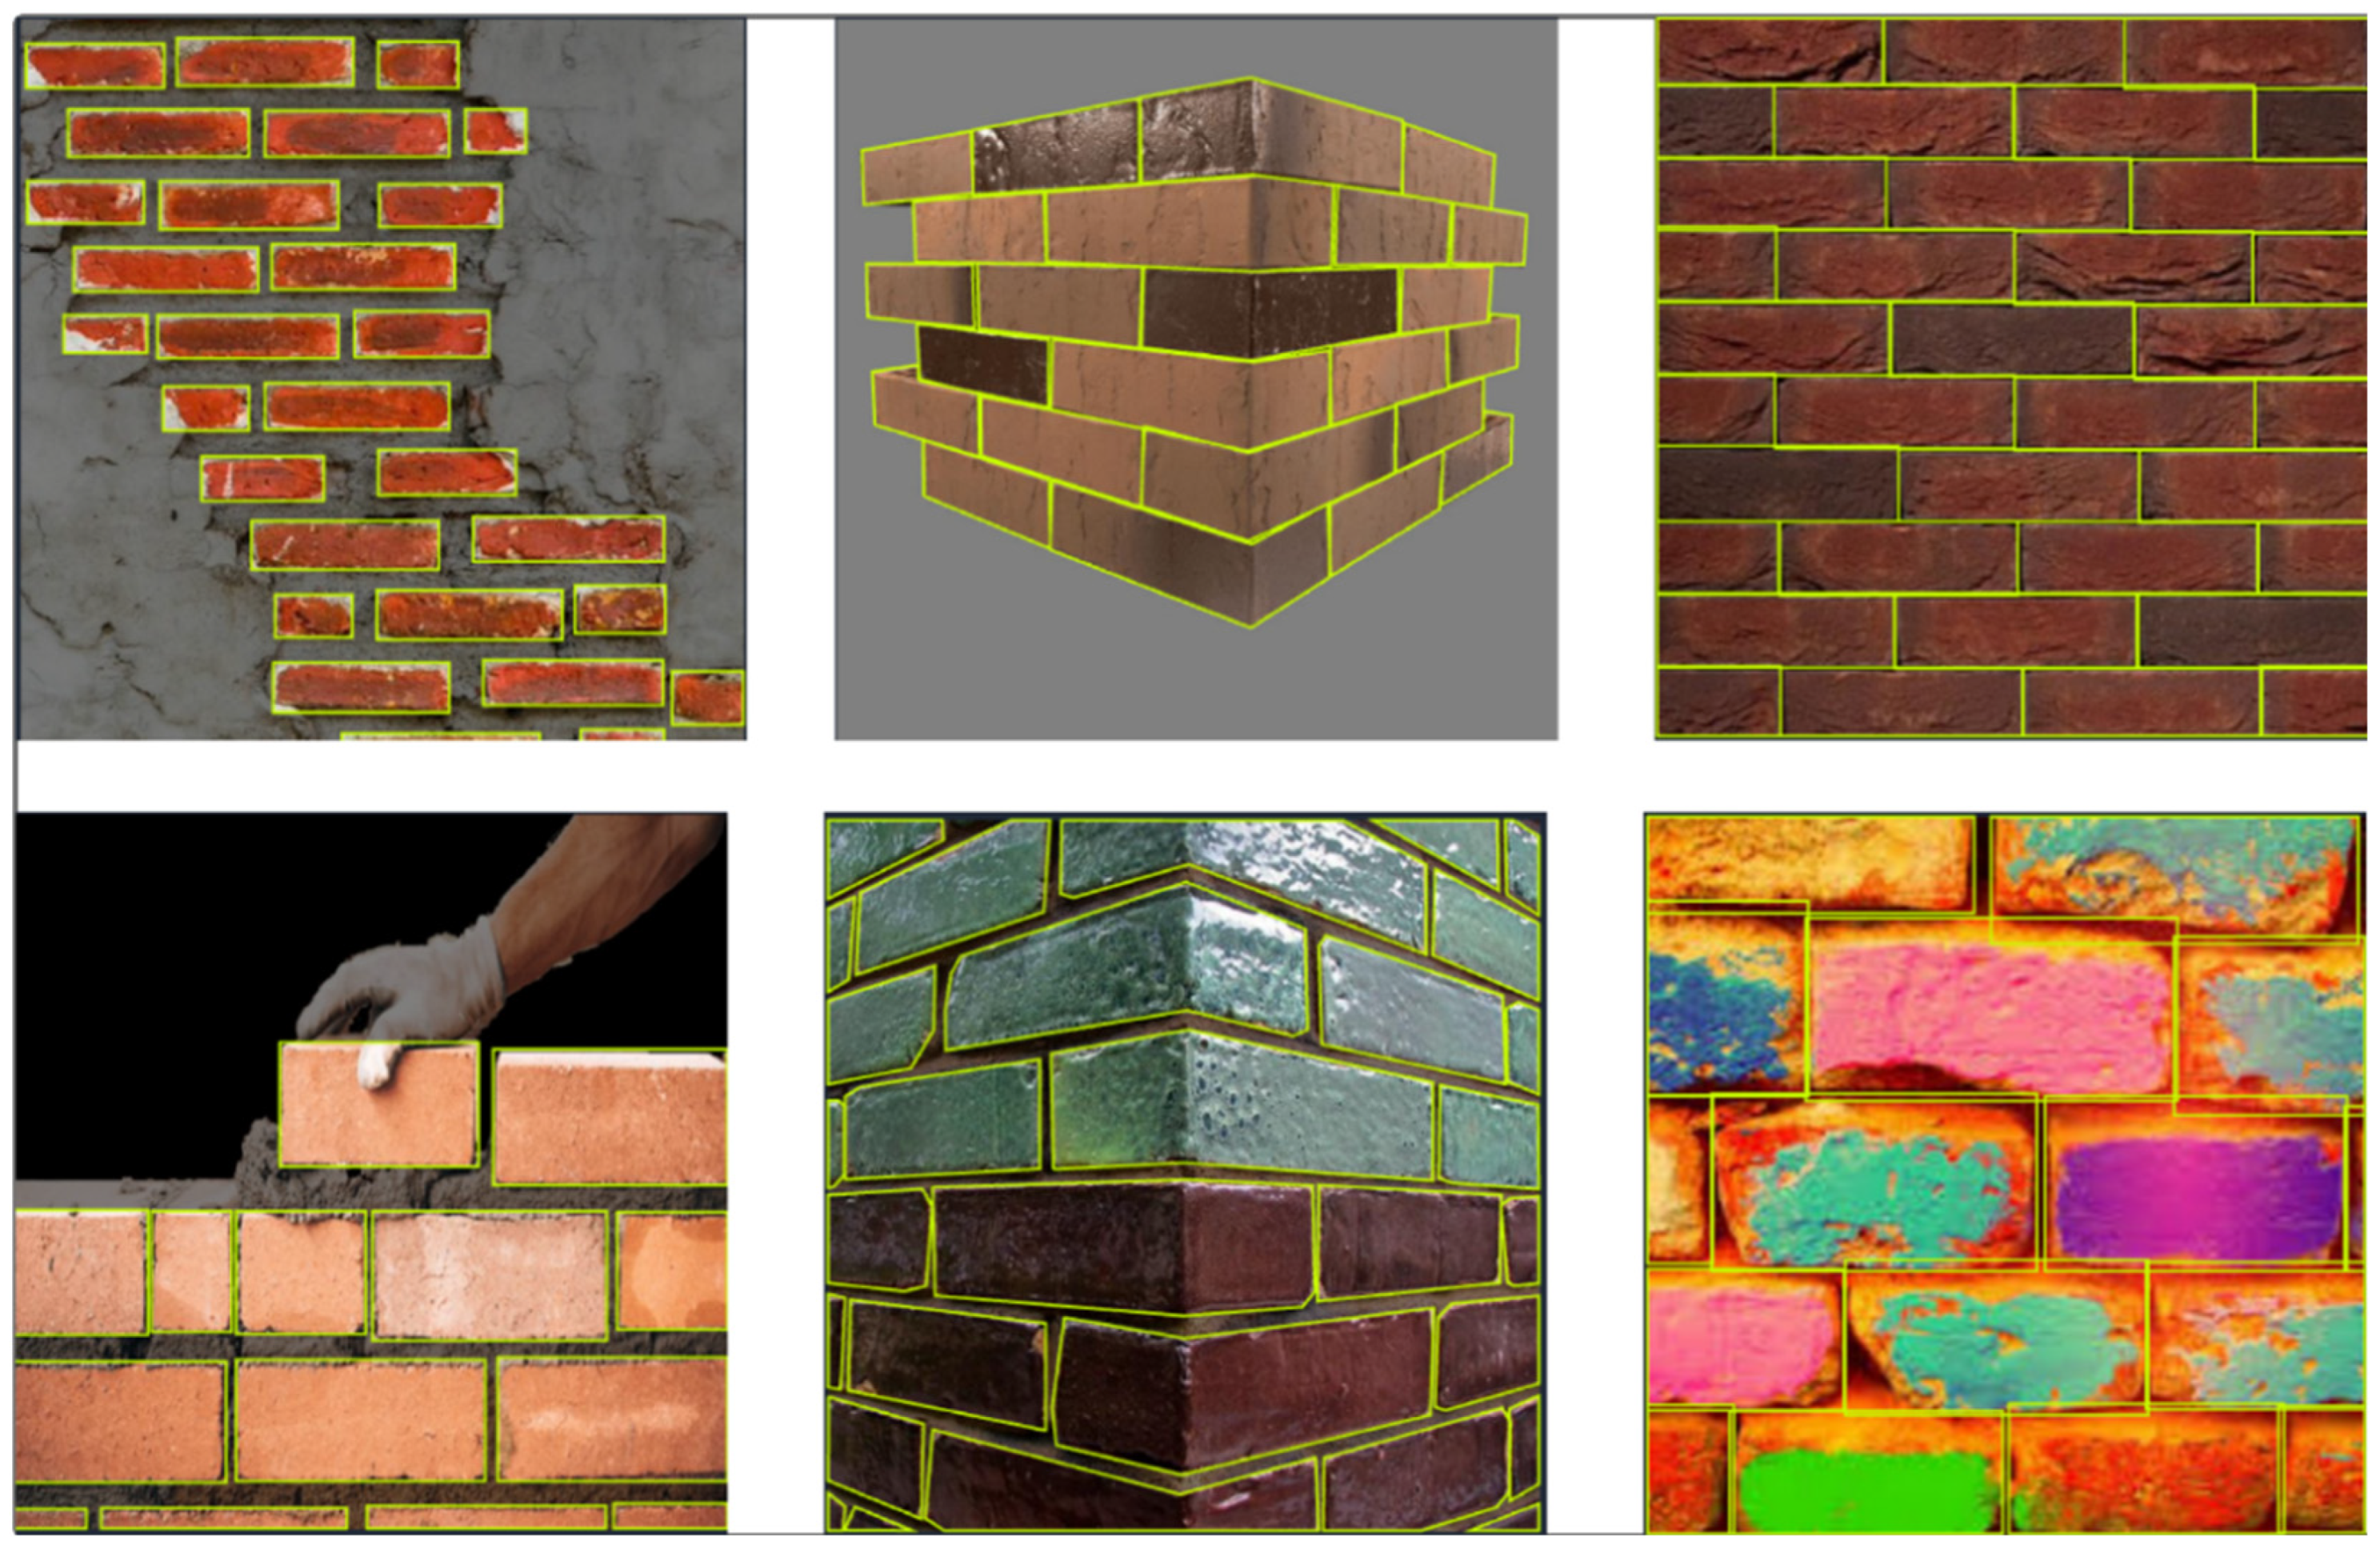
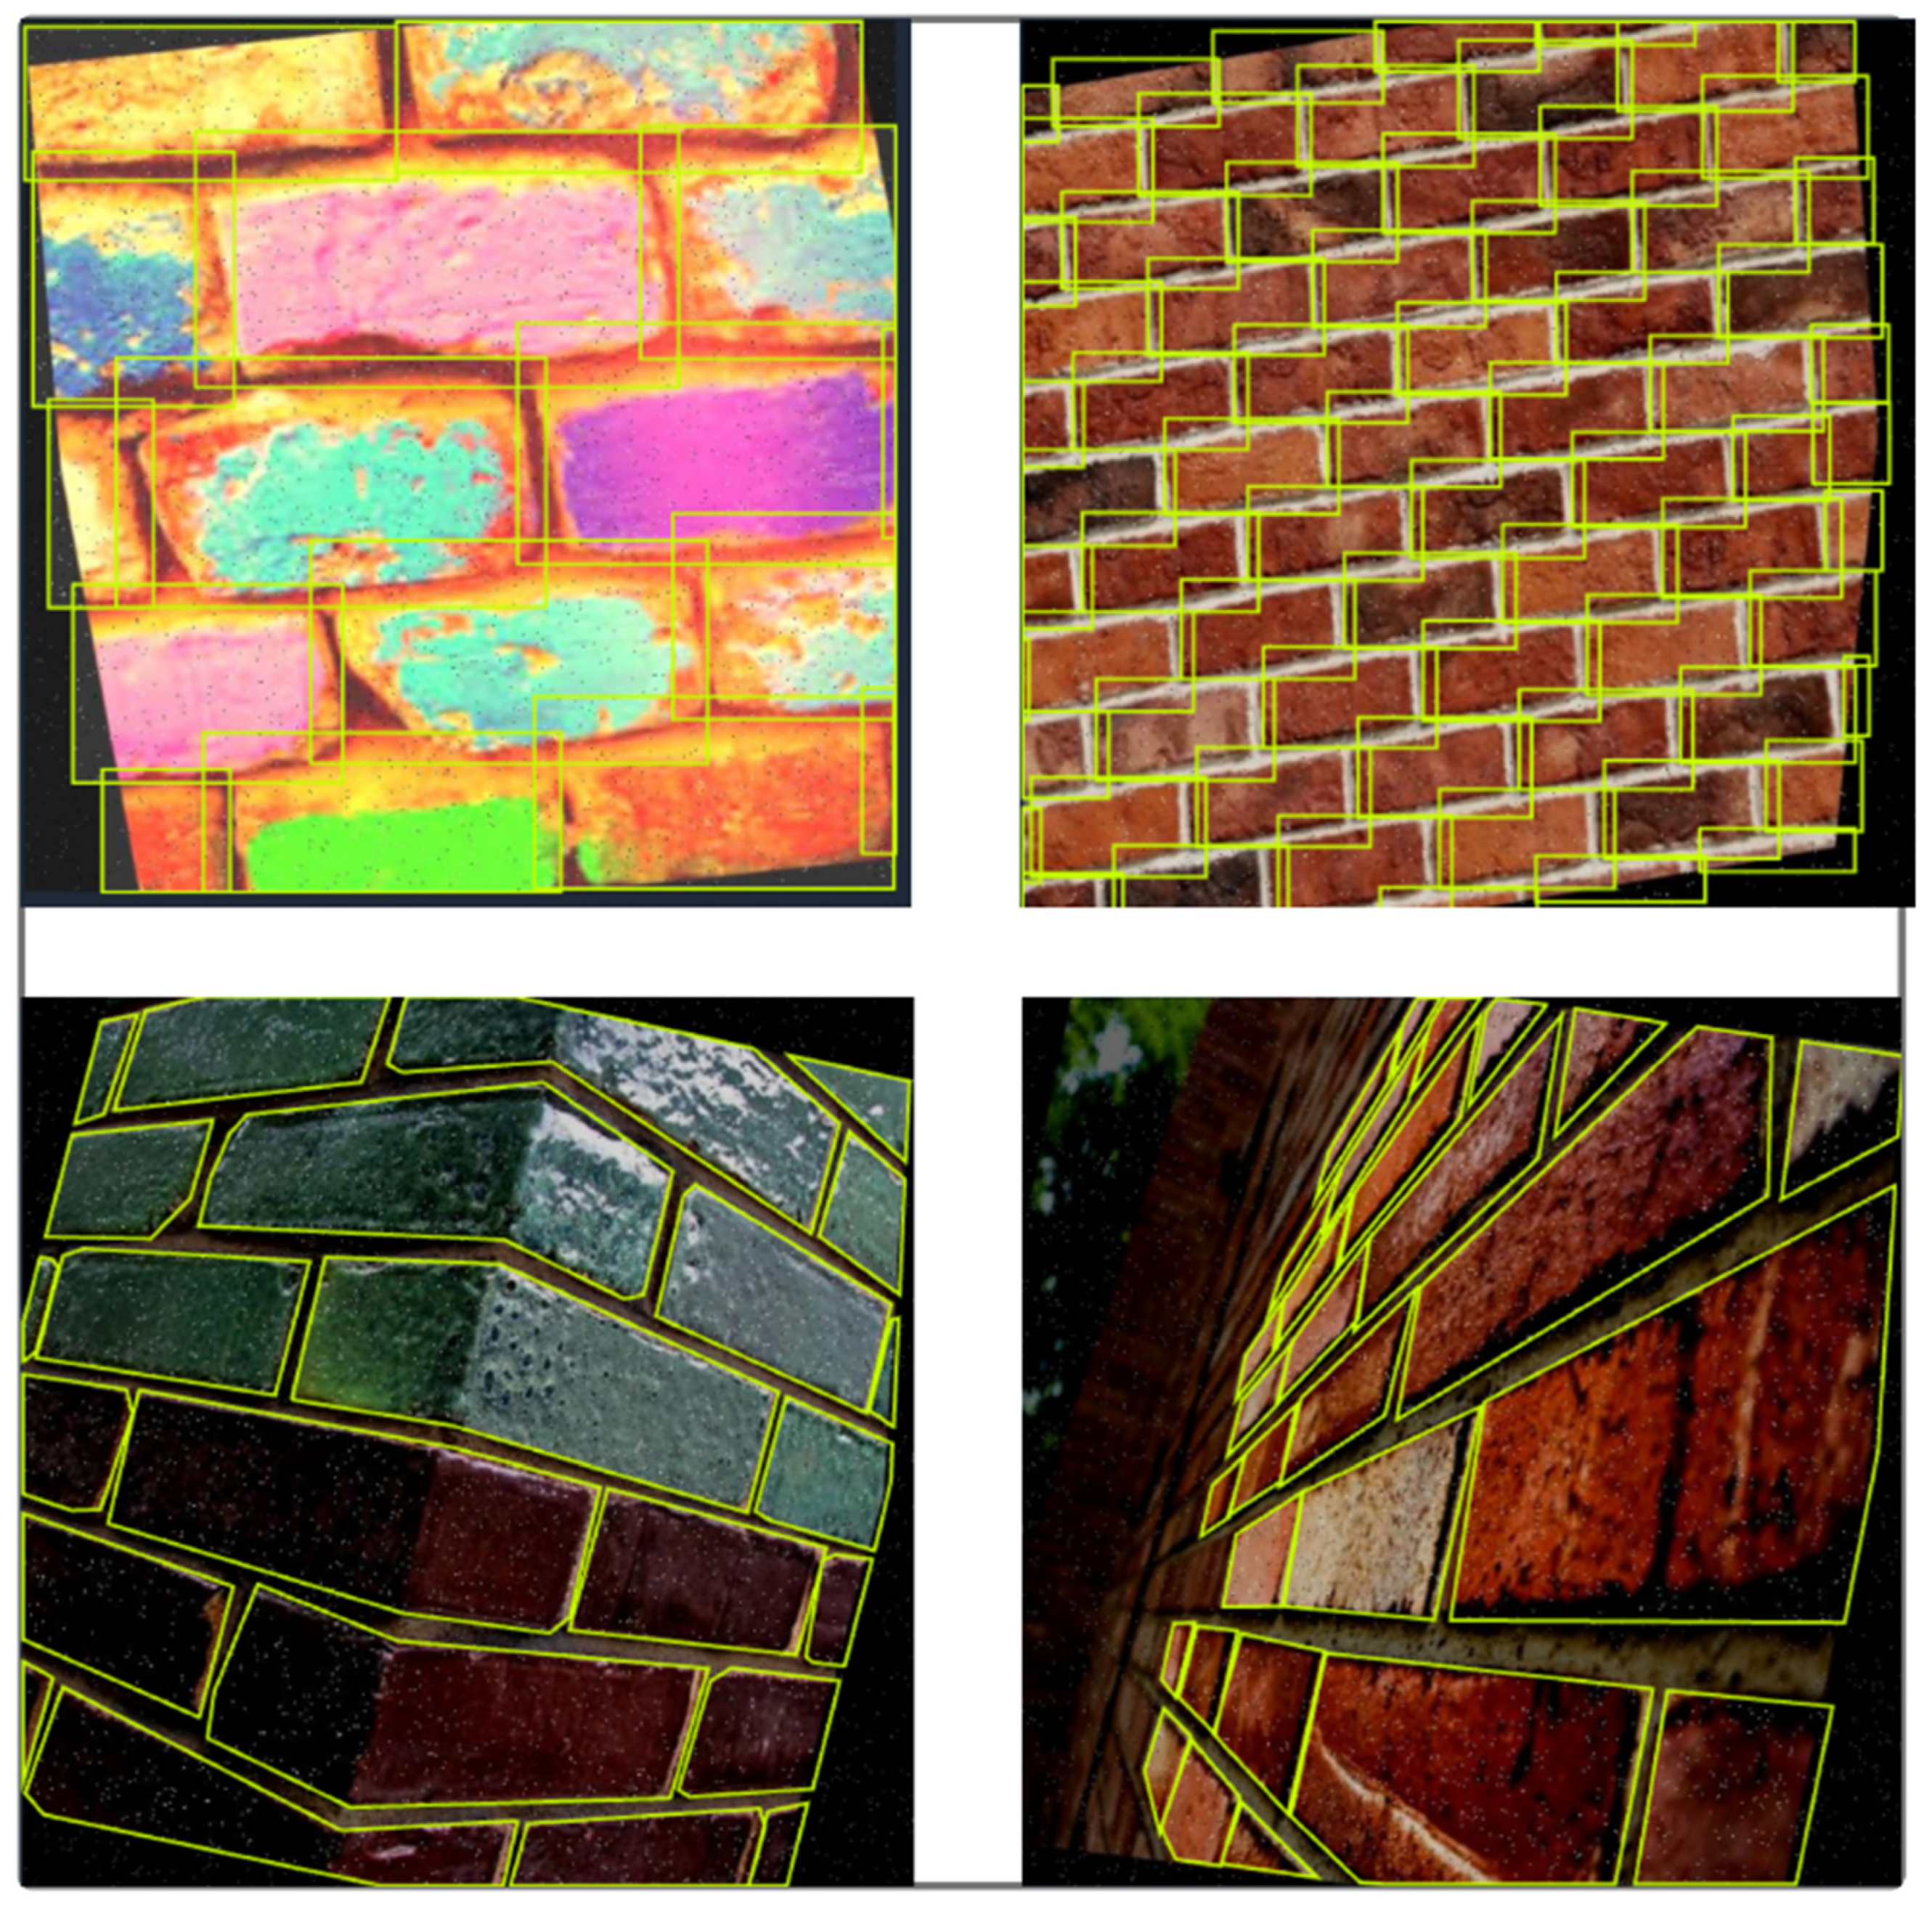
4.3.2. Dataset Annotation and Labeling

Annotating the dataset manually was accomplished with the help of Roboflow [72], as shown in Figure 4, which is a web-based platform for the creation of labeled datasets. A sophisticated collection of tools for managing tagged datasets and working together on large-scale projects are provided by the platform, in addition to an online tool for annotating images. The decision to use Roboflow was based on its adaptability, user-friendliness, and enhanced options for sharing.
Once the labels were exported to YOLO format, a single text file was created for each image that corresponded to the label. These files include the class of the bounding box, the xy coordinates of the topmost left corner (the origin), and the coordinates of the lower right corner of the bounding box measured in normalized xyxy format. Additionally, a zero-indexed system is used for class numbers, and the box coordinates are presented in a normalized style with values ranging from 0 to 1.

4.3.3. Data Augmentation and Dataset Partitioning

In order to boost the diversity of the dataset, a number of image-level augmentations were implemented. These augmentations included horizontal flipping, rotation (clockwise and counterclockwise ±15°), shearing (±15°), brightness modification (±25%), blurring (3 px), and noise (up to 1.96% of pixels). Consequently, there were 1275 images included in the final collection. Figure 5 shows a sample of the transformations that occurred on data to make it more robust. We partitioned the dataset into three sets in order to construct appropriate subsets for training, validation, and testing. These sets were as follows: training (1116 images, 88%), validation (106 images, 6%), and testing (53 images, 6%).
As an output of this step, the method of creating a dataset and annotating it in order to monitor the progress of the bricklaying activity using YOLO was detailed. A robust dataset was successfully constructed to train and test an object detection model that is concerned with bricks by carefully selecting images. Additionally, the dataset was ensured to be of high quality and diverse in its composition through the use of appropriate annotation and data augmentation. This all-encompassing strategy provides a solid foundation for the efficient implementation of the YOLO object detection algorithm in monitoring the progress of the bricklaying activity, which ultimately results in accurate and dependable outcomes in real-time performance.

4.3.4. Computer Vision Algorithm Implementation

The YOLOv8 technique was chosen to develop an effective object detection model for indoor bricklaying activity monitoring.
Dataset Preparation and Preprocessing
A comprehensive training dataset was developed by collecting 1275 high-resolution images, each containing labeled bricks with annotated bounding boxes marking the location of each object. These images captured a wide range of brick forms, camera angles, lighting conditions, and foreground and background variations.
Then, the dataset was preprocessed and annotated to ensure the model could learn from diverse visual contexts. Images were resized to a consistent size of 640 × 640 pixels for input into the YOLOv8 model, and data augmentation techniques such as rotation, flipping, scaling, and noise reduction were applied to enhance the dataset’s robustness.
Model Architecture
YOLOv8 uses a CNN architecture designed for real-time brick detection. The architecture typically consists of three main components:
  • Backbone: Extracts features from the input image using convolution layers;
  • Neck: Aggregates extracted features to focus on different scales of bricks;
  • Head: Outputs predictions for each brick, including the bounding box coordinates, label, and confidence score for each detected brick.
Hyperparameter Tuning
To optimize model performance, a number of hyperparameters were meticulously selected based on empirical best practices [22] and Ultralytics Recommendations [46], and to determine the optimal object detection model configuration, a series of ablation experiments were conducted to evaluate the impact of model size, training duration, and batch size on performance. The analysis focuses on three main decision points: model architecture, training epochs, and batch size. The results are summarized in Table 2.
  • Model Architecture: Prioritizing Inference Speed
The first experiment compared the YOLOv8n (Nano) and YOLOv8s (Small) models, both trained for 20 epochs with a batch size of 32. While YOLOv8s showed a slight improvement in mAP50-95 (73.8 vs. 71.8), the YOLOv8n model achieved higher mAP50 (94.6 vs. 94.3) and precision (94.0 vs. 93.7), indicating comparable performance for most practical applications.
However, the key consideration in choosing YOLOv8n was its faster inference speed due to its lower number of parameters and lower computational requirements. The nano model’s lightweight architecture offers substantial benefits in responsiveness and efficiency with only a marginal drop in detection quality. Thus, YOLOv8n was selected as the base model.
2.
Epochs: Improving Generalization
To assess the impact of training duration, the YOLOv8n model was retrained using 100 epochs while keeping the batch size constant. The results showed a substantial improvement in both mAP50 (from 94.6 to 95.4) and mAP50-95 (from 71.8 to 80.7), indicating that longer training significantly enhanced the model’s ability to generalize across varied IoU thresholds.
This confirmed that while the nano model architecture is efficient, it benefits from extended training, allowing it to capture more complex patterns in the data without overfitting. The increase in recall (from 92.4 to 93.0) also reflects improved object localization.
3.
Batch Size: Choosing the Most Balanced Model
Finally, to evaluate the effect of batch size, the model was trained for 100 epochs using a smaller batch size of 16. This configuration slightly improved mAP50 (from 95.4 to 95.6) and precision (from 94.6 to 95.0), but mAP50-95 decreased slightly (80.7 to 80.5). More importantly, the smaller batch size increased training time and required more frequent weight updates, which could lead to training instability in larger datasets.
Given the negligible performance gain and higher computational cost, the following configuration was selected as the optimal trade-off between accuracy, efficiency, and training stability.
  • Epochs: The model is trained over one hundred (100) epochs to ensure adequate learning while avoiding overfitting;
  • Batch Size: A batch size of thirty-two (32) is used to process multiple images at once, balancing computational efficiency with model performance;
  • Learning Rate: The learning rate is set to 0.01;
  • Image Size: Images are resized to 640 × 640 pixels, optimizing detection accuracy while maintaining training efficiency;
  • Early stopping was employed to prevent overfitting, halting training after 10 consecutive epochs without improvement.
Training the Model
The model was trained in Google Colab [73] using the Python 3.10 programming language, with an Nvidia GPU T4 processor to ensure efficient processing. The training process involves feeding the annotated brick images into the model and adjusting weights using backpropagation, based on the error between predicted and actual bounding boxes. This is achieved using a loss function that combines:
  • Localization Loss: Measures the error in bounding box coordinates;
  • Classification Loss: Measures the error in classifying the detected brick;
  • Confidence Loss: Measures the confidence level of the model’s predictions.
The comprehensive training set allowed the model to understand and accurately detect a variety of brick shapes, providing the foundation for effective real-time monitoring.
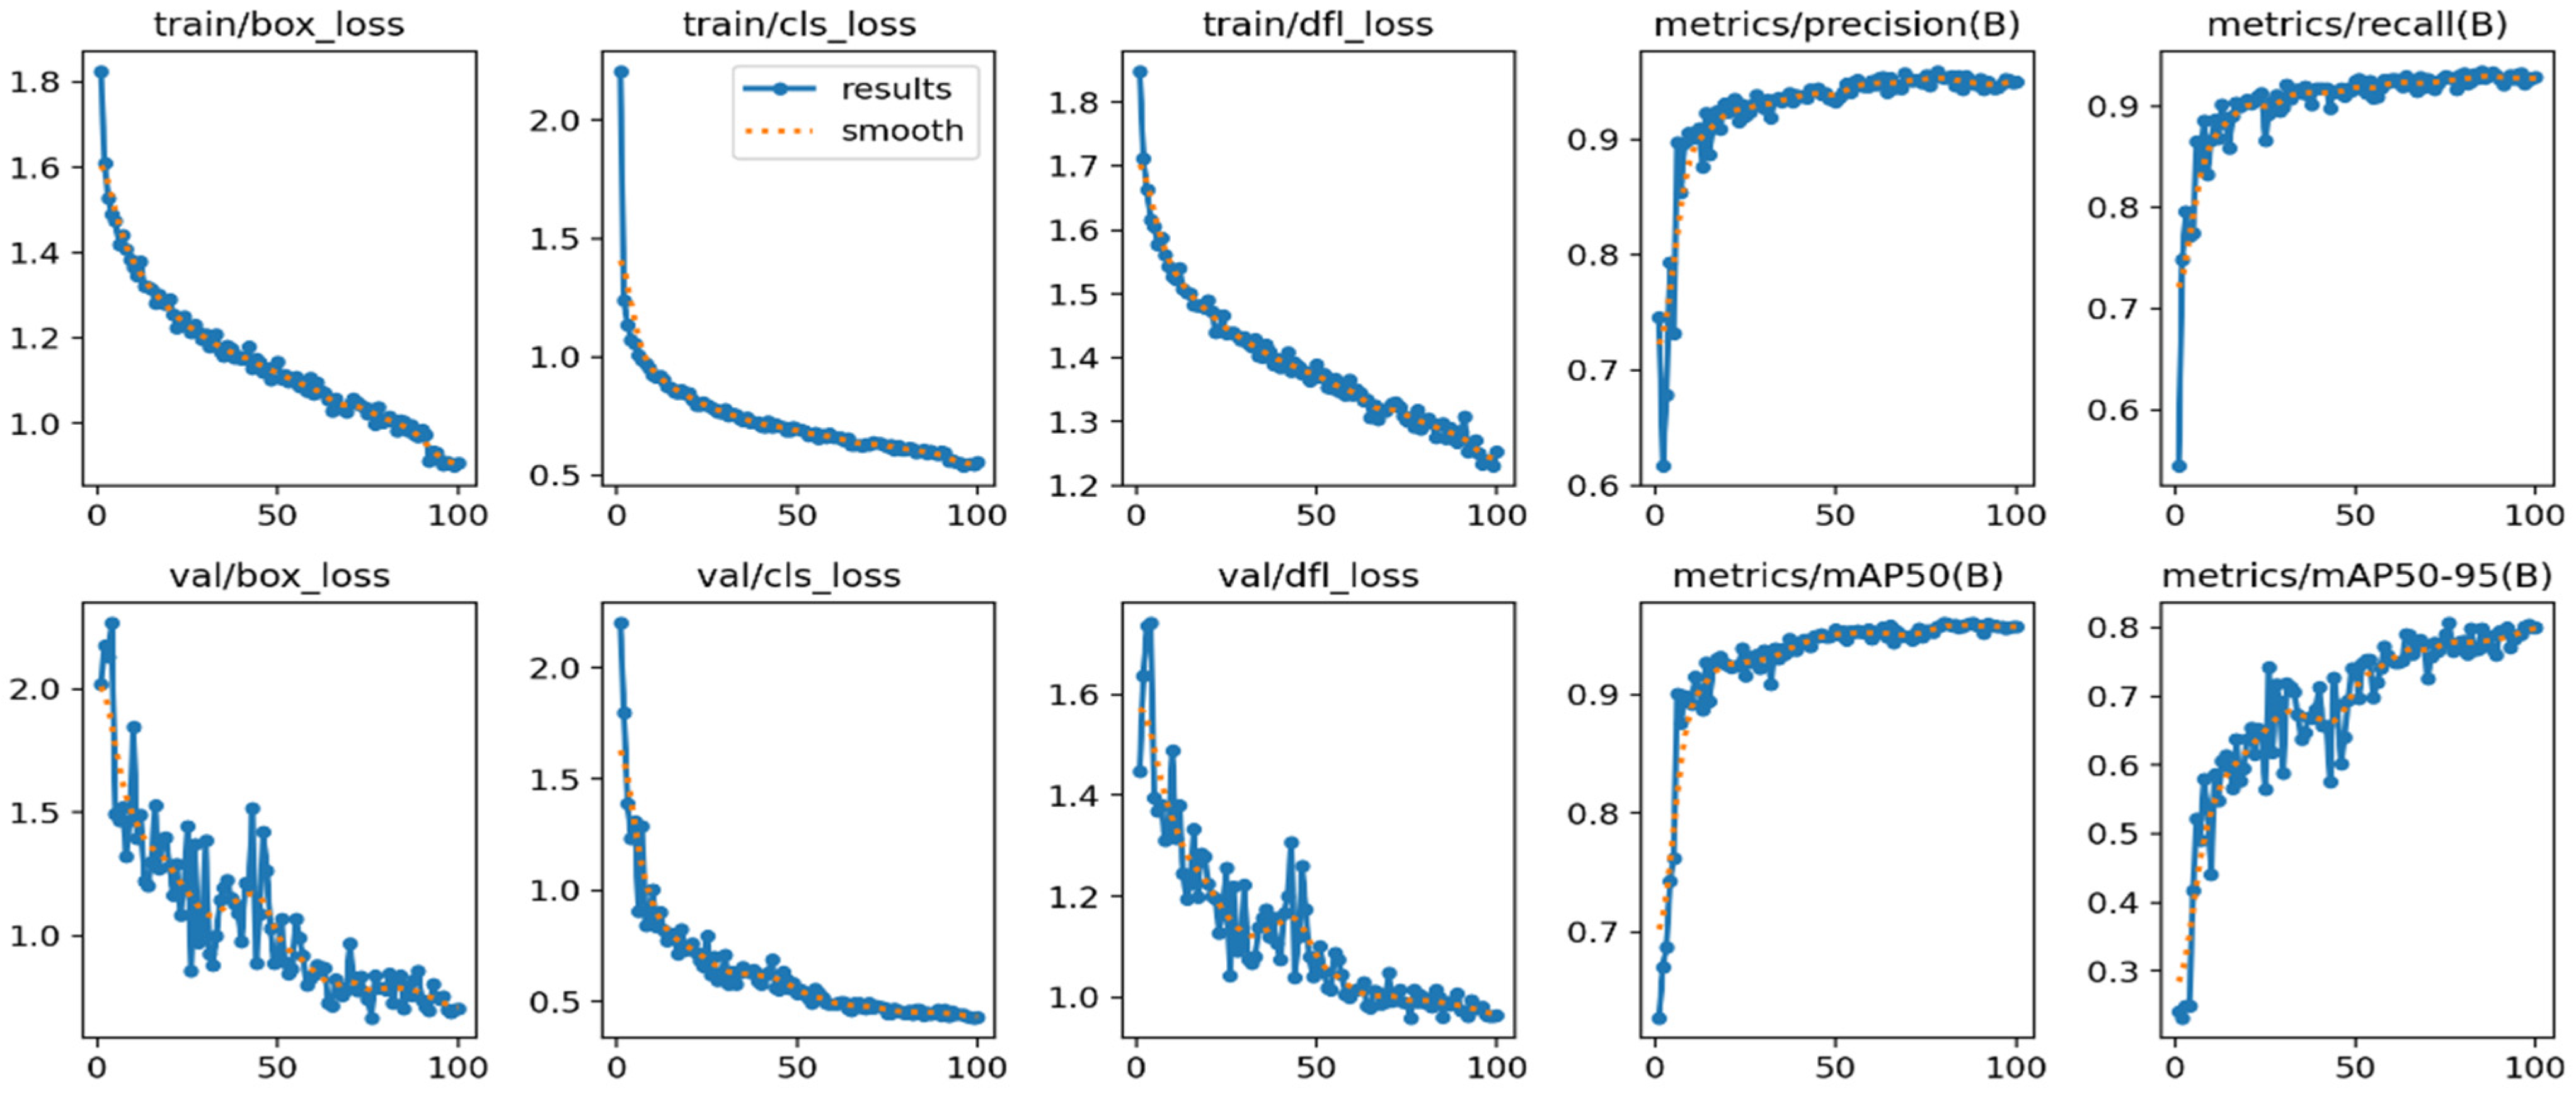
Training Performance and Early Stopping
Once the training procedure was completed, the model reached its peak performance at epoch 92. The best-performing model was saved as the best.pt due to its superior results. Early stopping was implemented after the last 10 epochs showed no improvement, effectively conserving computational resources. The training process was completed in 0.997 h over 100 epochs.
Evaluation Metrics: The trained model was evaluated using a separate validation dataset under distinct conditions. The results showed promising accuracy, with an overall mAP50 (mean Average Precision at 50% IoU) of 0.954 and mAP50-95 (mean Average Precision from 50% to 95% IoU) of 0.807, as shown in Figure 6. These metrics demonstrate a high level of accuracy in brick detection across various construction scenarios, indicating the model’s robustness and ability to generalize effectively to new data.
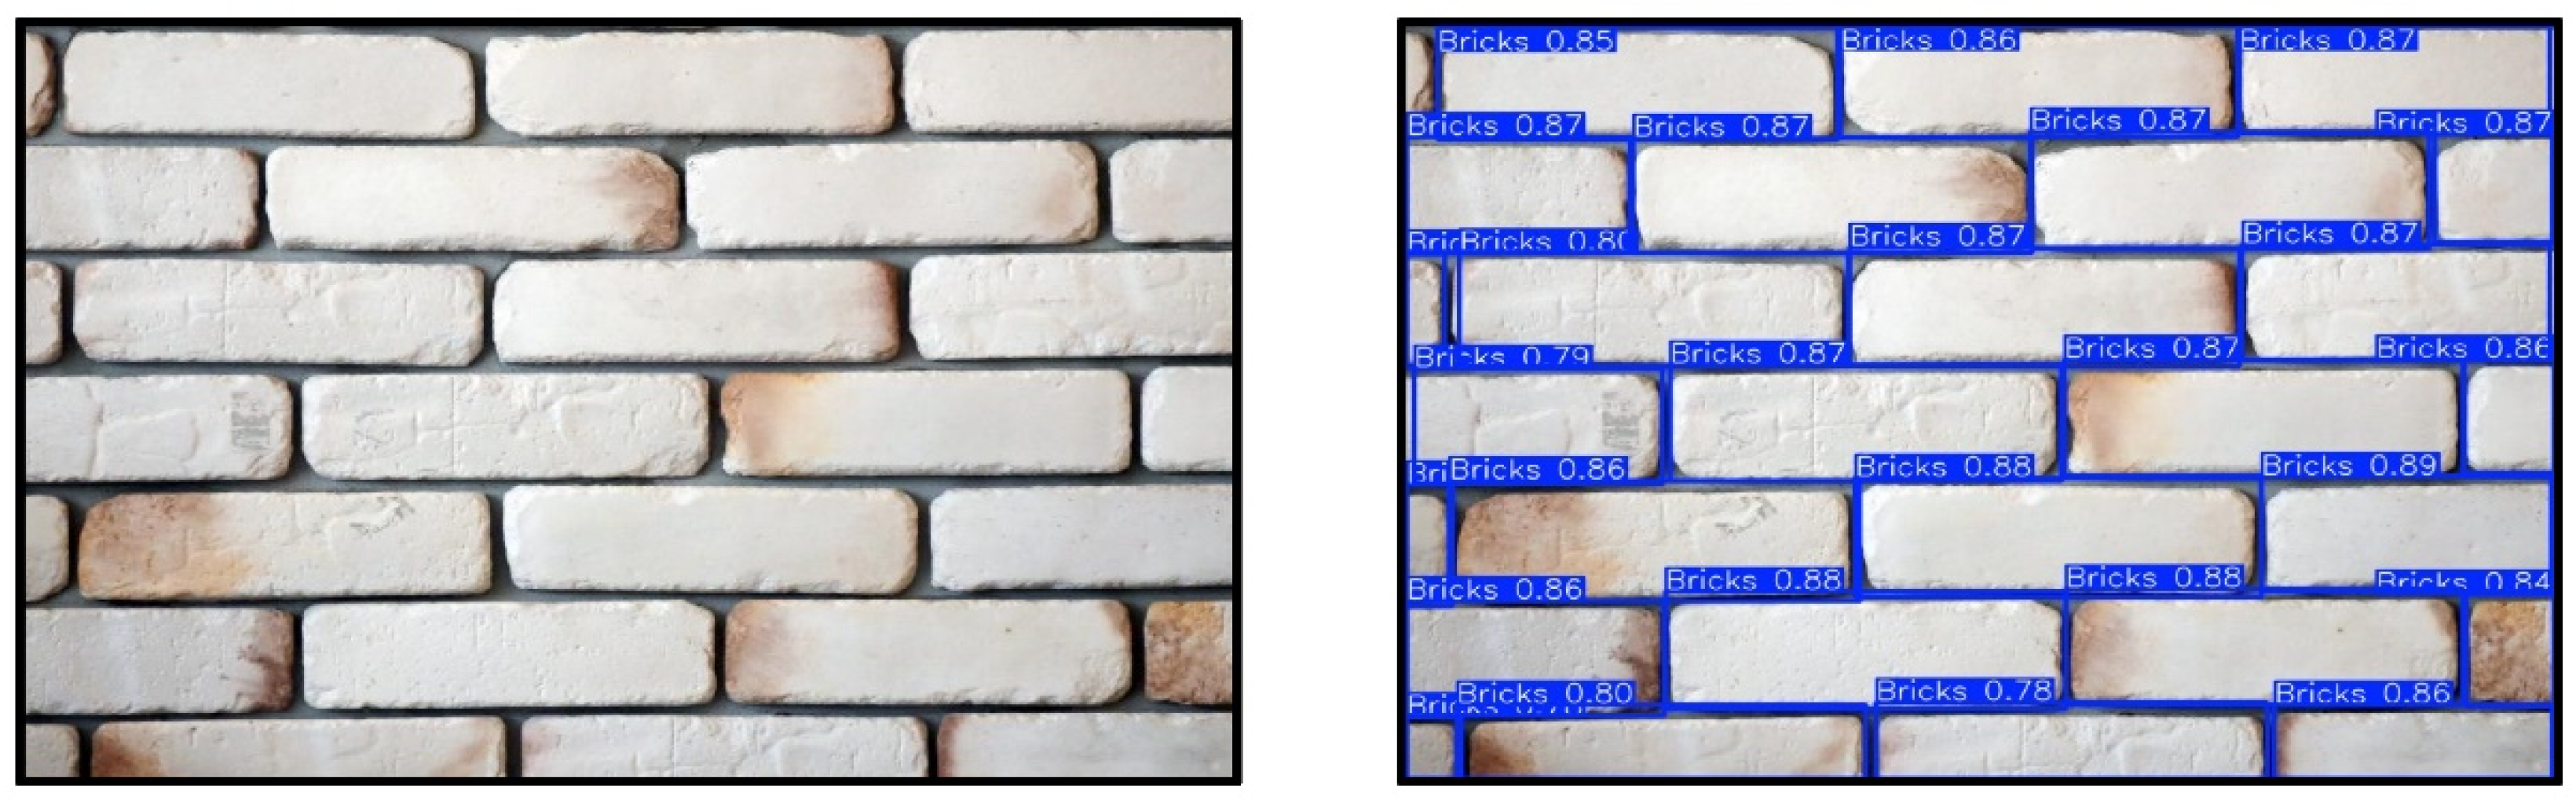
Inference and Prediction
Once trained, the YOLOv8 model was able to accurately detect and locate bricks in unseen images, as shown in Figure 7. The model’s output includes bounding boxes, class labels, and confidence scores for each detected brick, enabling real-time monitoring of bricklaying progress on construction sites.
The model’s predictions are integrated with a 3D BIM model to twin the physical part, using a modified Autodesk Revit© plug-in. The BIM model is updated to reflect the real-world construction progress by halting brick placement when the detected number of bricks matches the actual count.
Lastly, this training process demonstrates the model’s capability to not only detect bricks accurately in real-time but also facilitate the seamless integration of this data with BIM for effective progress monitoring on construction sites.
Real-Time BIM Integration Logic and Error Handling
The YOLOv8 detection results are integrated into the BIM environment via a custom-developed Autodesk Revit© plug-in. To maintain the accuracy and reliability of BIM updates, a confidence threshold of 0.6 is applied to brick detections. Only detections with confidence scores equal to or above this threshold are automatically mapped to the BIM coordinate system and used to update the BIM model. Detections below this threshold are flagged for manual review, ensuring that uncertain predictions do not directly affect the model and allowing human verification to prevent false-positives.
To further prevent cascading errors within the Autodesk Revit© environment, the system continuously monitors the total count of detected bricks against the as-planned BIM data. If the discrepancy exceeds ±5%, the automatic update process is paused, and an alert is sent to the user to investigate and resolve the inconsistency. This approach is detailed in Exhibit 2 and Exhibit 3 of Nassar’s framework presented at the PMI® Global Congress 2009—North America [74], which evaluates project control metrics based on similar thresholds. This mechanism acts as a safeguard, ensuring the integrity and reliability of DT representation throughout the construction progress.
The following pseudocode summarizes the BIM integration process:
Buildings 15 02456 i002

4.4. Progress Monitoring

By integrating the as-planned estimates with the as-built brick take-off generated by the YOLO algorithm, as illustrated in Figure 7 and Figure 8, the unit-based percentage of completion can be calculated with high precision. This integration allows for real-time updates to the project schedule using scheduling software like Primavera P6. Furthermore, 4D simulations provide a detailed view of bricklaying activities, enabling accurate tracking of the progress. Project managers can monitor construction progress directly within the BIM environment, identify potential delays or deviations early, and make data-driven decisions to ensure alignment between the as-planned and actual work.

4.5. Validation and Performance Metrics

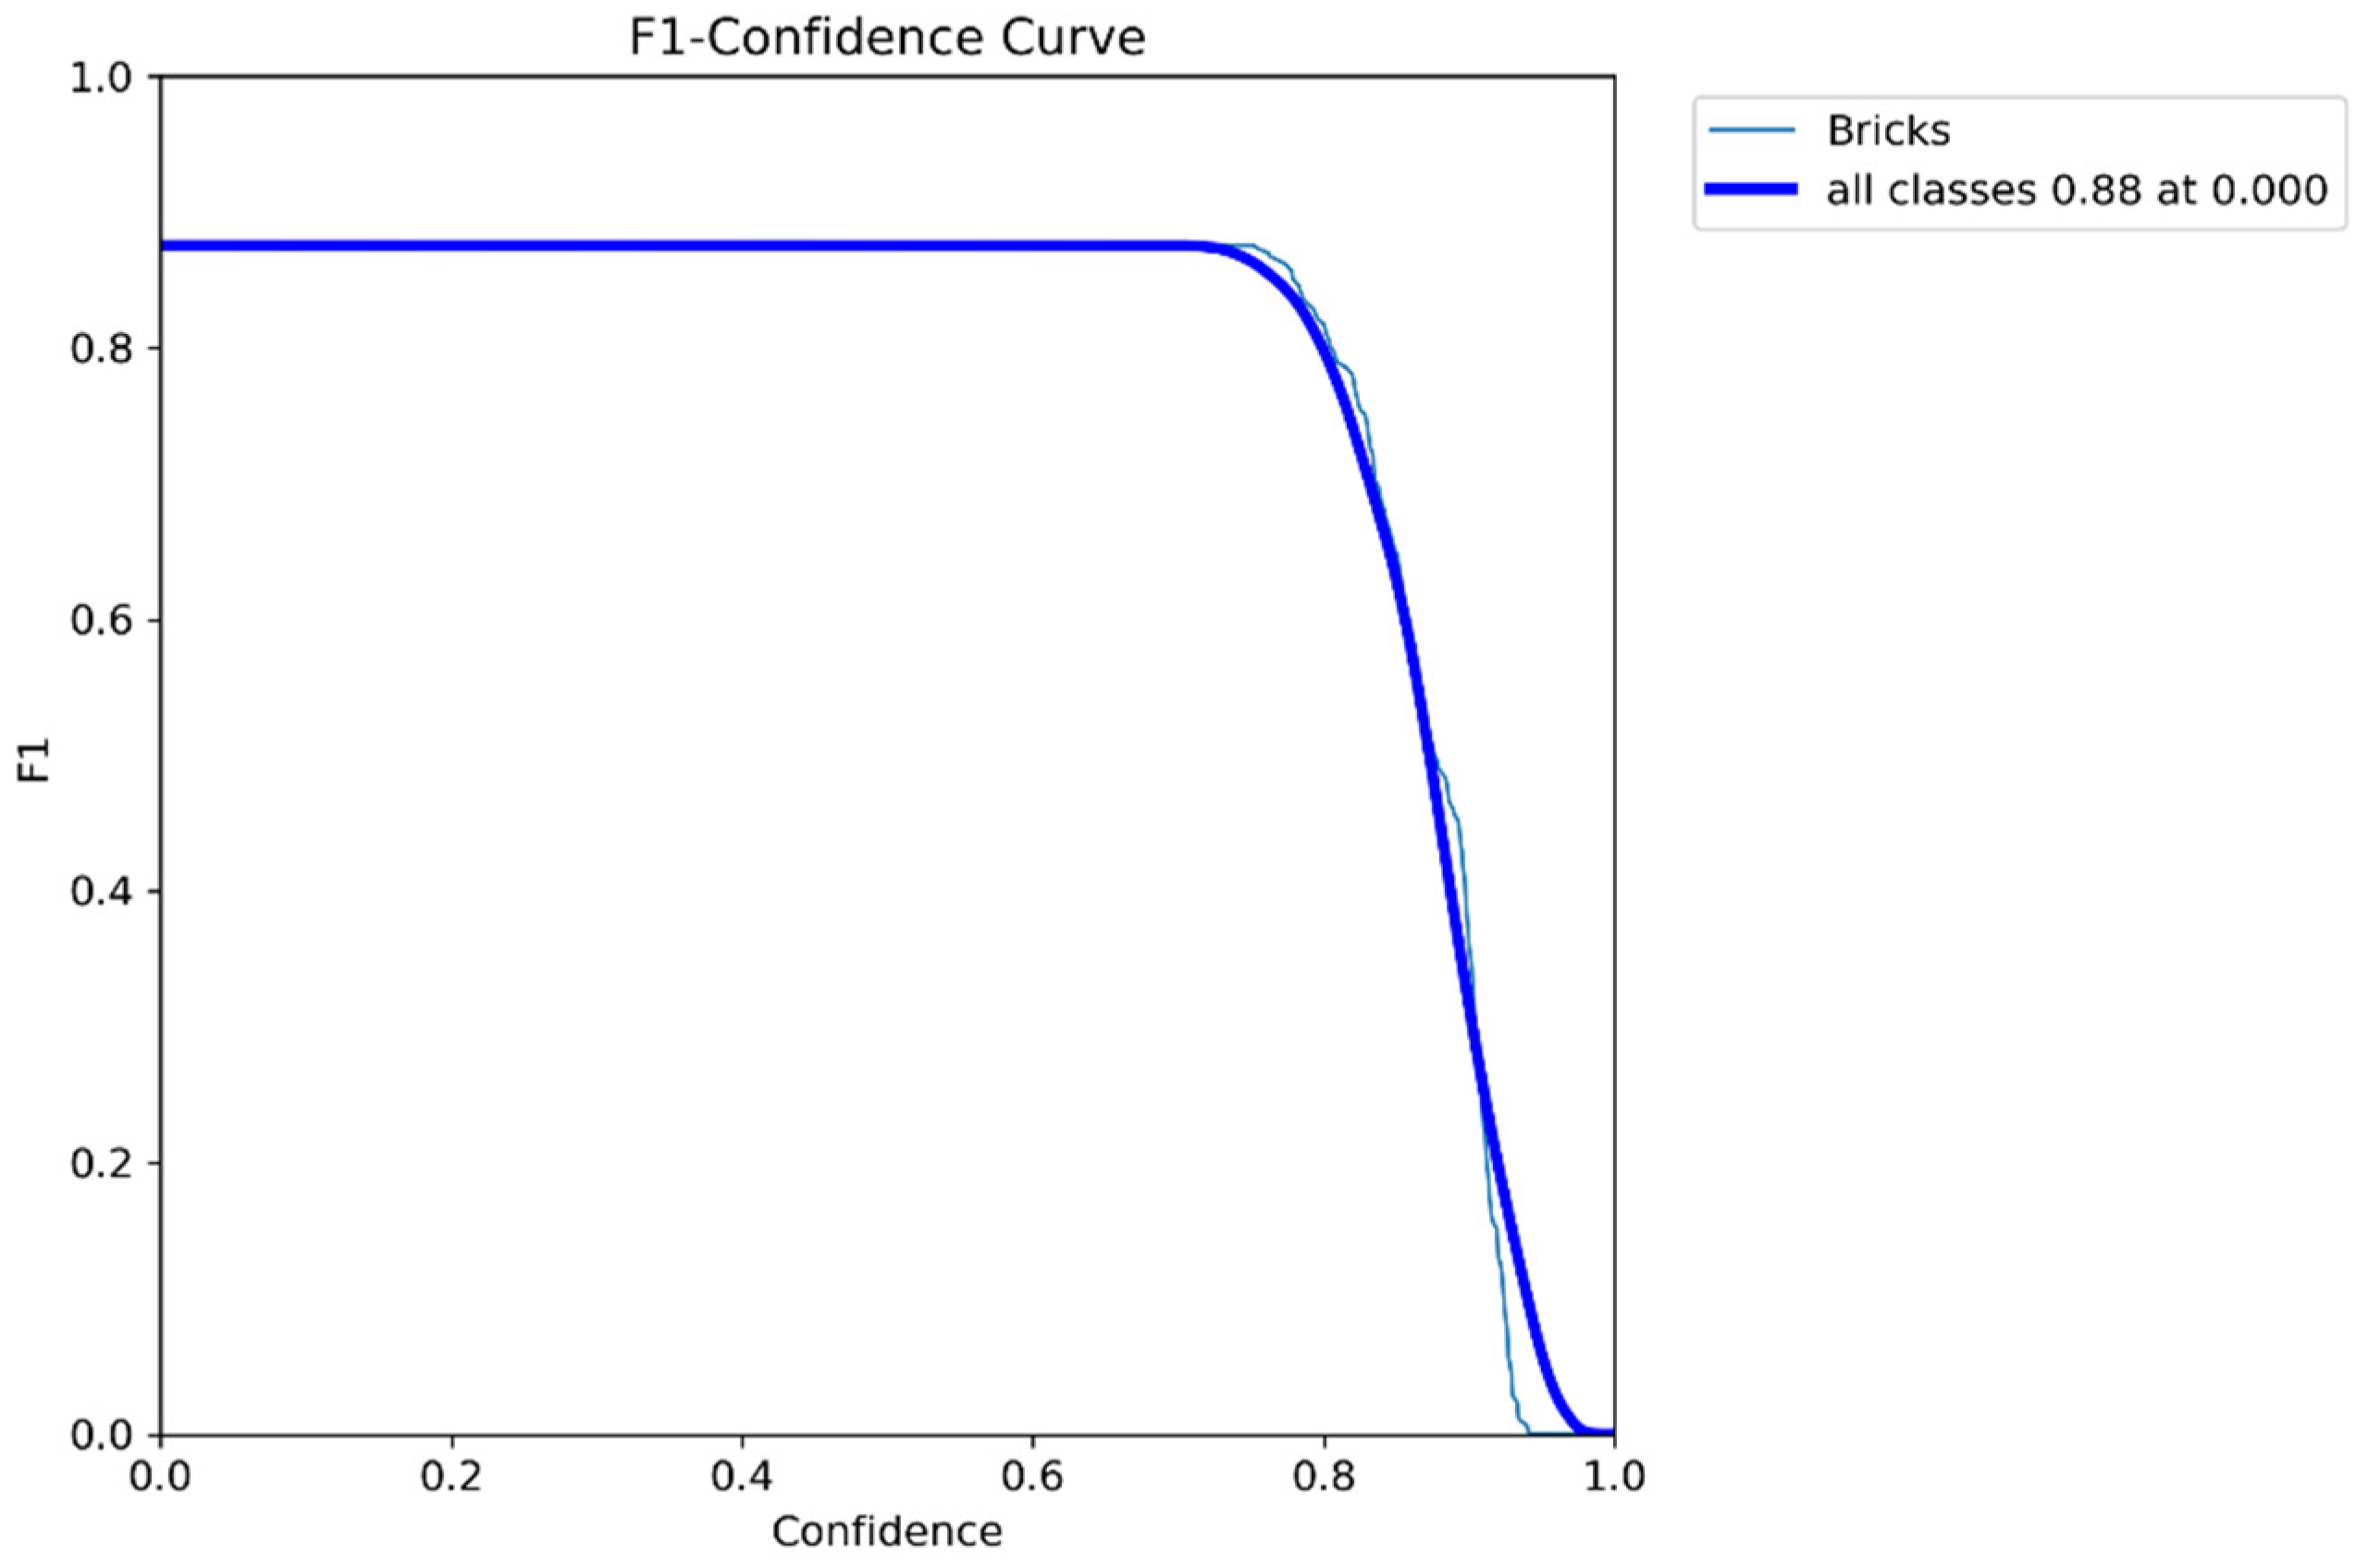
4.5.1. YOLOv8 Testing and Validation

The validation of the YOLO model was conducted on real-world construction site images, which were not used during model training. This dataset included images with varying brick shapes, lighting conditions, and occlusion scenarios to ensure a representative assessment of model performance. Qualitative inspections of bounding box predictions were performed to visually verify the model’s ability to correctly identify bricks and exclude false-positives. While these tests provide a robust initial validation of the proposed model in controlled conditions, real-world validation on dynamic construction projects is identified as a crucial next step in future work.
To evaluate the robustness of the YOLOv8 model in varying visual conditions, the model was tested on images of brick walls under different brightness levels: +100, +50, 0 (normal), −50, and −100, as shown in Figure 9. The corresponding brick counts detected by the model were 38, 40, 40, 38, and 36, respectively, and the metrics are illustrated in Table 3. Detection precision ranged from 0.852 to 0.906 across brightness variations, with a notable mAP drop under extreme low light (−100 brightness). These findings quantify the performance variation and confirm the model robustness under moderate lighting deviation. Additionally, the model exhibited limitations in detecting bricks that were partially occluded by electrical conduits or obscured by irregular mortar patterns. Another observed limitation was the model’s difficulty in identifying multiple brick sizes within the same image; in such cases, the model tended to detect only one size category. This can be improved by setting different classes for different sizes of bricks in annotation and labeling. These findings highlight the importance of incorporating diverse training data that includes variations in lighting, occlusion, and brick dimensions to enhance the model generalization and detection accuracy in real-world scenarios.

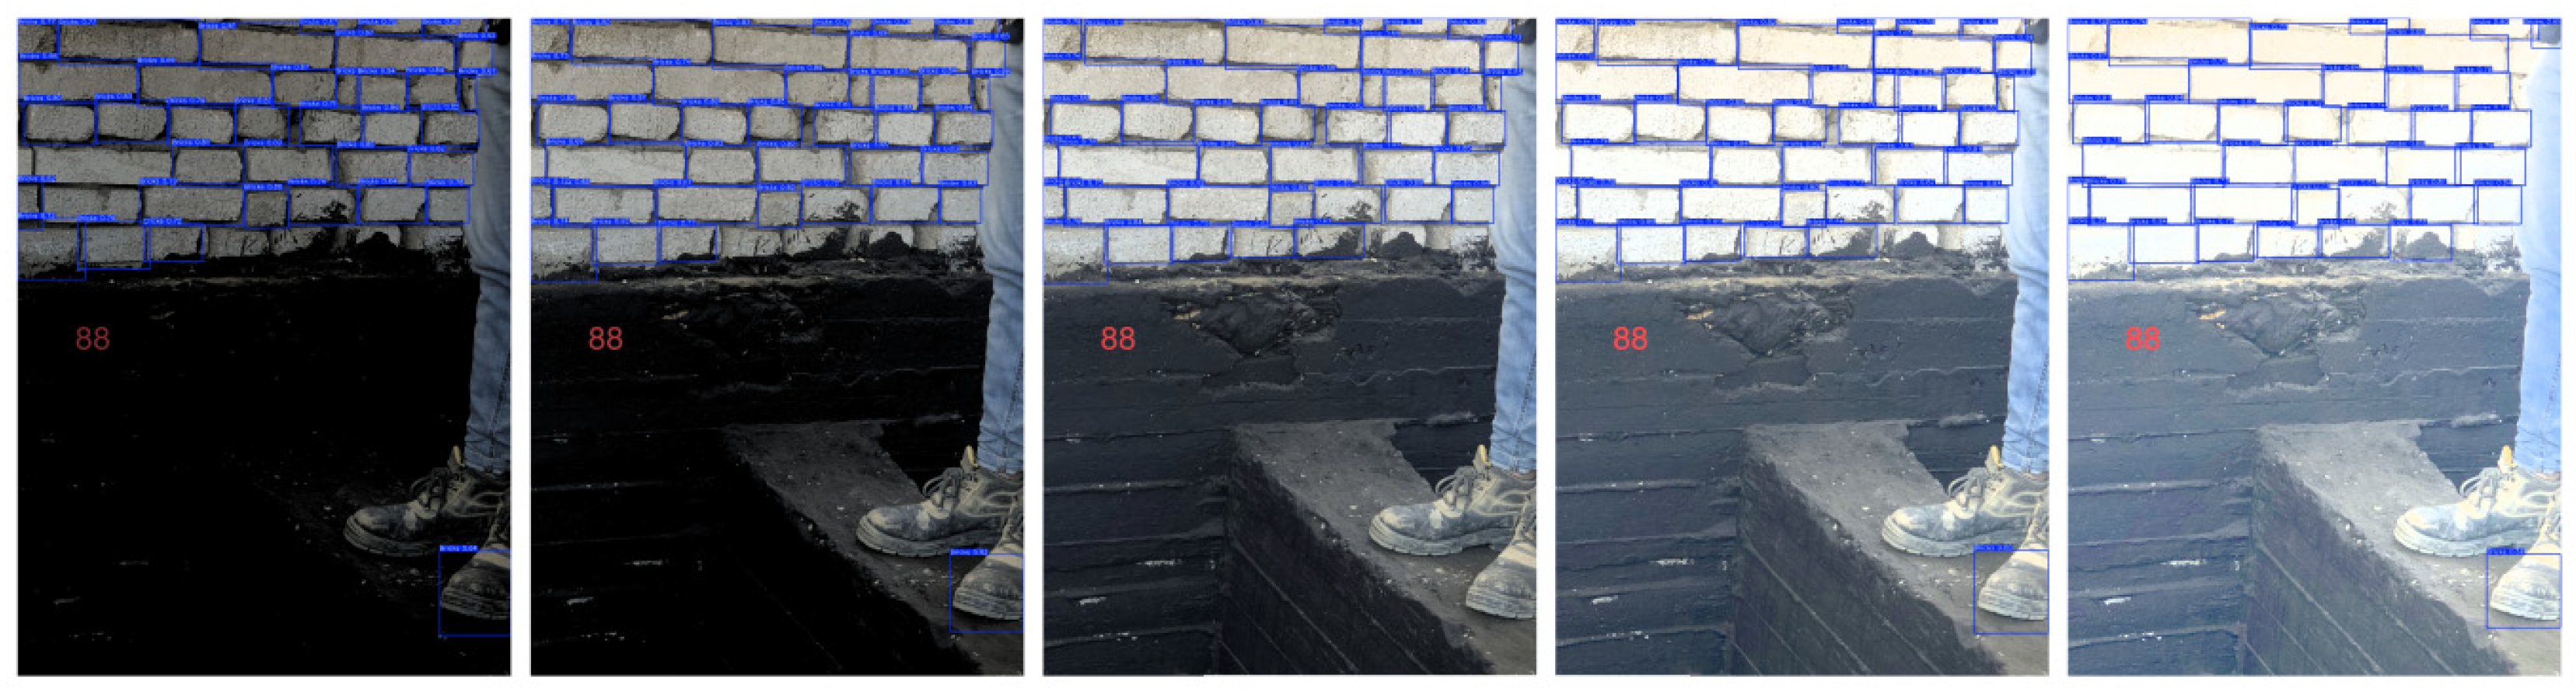
4.5.2. Generalization Evaluation

To evaluate the generalization capability of the proposed brick detection model beyond the training dataset, a performance test was conducted on a newly labeled dataset collected representing bricks patterns in Europe [75]. This test dataset consisted of fourteen (14) images with a total of three hundred and forty-two (342) manually annotated brick instances.
The evaluation yielded the following results:
  • Precision: 0.996,
  • Recall: 0.781,
  • mAP50: 0.889,
  • mAP50-95: 0.767.
These results indicate that the model performs with high precision (0.996), ensuring a very low false-positive rate and solid recall (0.781), as shown in Figure 10, successfully detecting the majority of true brick instances. The mAP50 score of 0.889 demonstrates strong detection accuracy at the standard IoU threshold, while the mAP50-95 score of 0.767 reflects robust localization performance across stricter thresholds.
This confirms the model’s ability to generalize well to previously unseen environments without retraining, demonstrating its suitability for practical deployment in diverse construction monitoring tasks.

4.5.3. Autodesk Revit© Plug-in Validation

To validate the Autodesk Revit© plug-in’s functionality, tests were conducted on several wall models within Autodesk Revit© 2021. The plug-in successfully quantified bricks for walls of varying sizes and geometries, demonstrating accurate brick placement and automated handling of openings (doors/windows).
  • Performance Metrics
On a standard desktop computer (Intel(R) Core(TM) i7-5500U CPU, 12 GB RAM, Autodesk Revit© 2021 (Intel, Santa Clara, CA, USA)), the processing time for a typical brick wall of dimensions 5 m × 3 m was approximately 32 s. This time includes the loading of the brick family, the placement of bricks, and the deletion of bricks within openings. Figure 11 shows a section view in Autodesk Revit©, where the plug-in has inserted individual brick family instances along the selected wall, accurately reflecting the intended brick arrangement.
This screenshot demonstrates the plug-in’s practical feasibility and its contribution to achieving detailed as-planned brick quantity take-offs.

5. Discussion

The proposed real-time bricklaying progress monitoring model, which integrates YOLOv8-based CV detection with BIM, represents an advancement in automating traditionally manual and error-prone processes in construction. Compared to previous approaches (e.g., Mask R-CNN used for general construction activity detection), the proposed model is architected to support real-time, instance-level detection of bricklaying activities progress—a previously underexplored area. Unlike earlier methods that lacked seamless BIM integration and digital twinning capabilities, this approach enables synchronized updates between on-site progress and BIM, closing a major research and practical gap.
This research presents several impactful benefits for construction management:
  • Reduction of human error through real-time, automated detection and quantification of bricklaying progress;
  • Accelerated updates to project schedules, enabling more responsive decision-making based on live site data;
  • Improved resource allocation and cost control through accurate progress tracking and integration into the BIM environment.
These improvements contribute directly to mitigating common issues in construction projects, such as scheduling delays, rework, and budget overruns—particularly in indoor environments, where traditional monitoring is difficult to maintain consistently.

5.1. Proposed Model

The proposed model started with Data Acquisition, in which the dataset utilized was carefully curated to reflect indoor construction conditions, capturing regional variations in brick sizes, diverse lighting conditions, and common occlusions such as scaffolding and personnel movement.
The proposed model combines image-based object detection with BIM. Several assumptions were made during the development of the proposed model: the availability of clear images with stable camera positioning and indoor environments with controlled lighting. The model enables accurate retrieval, analysis, and visualization of as-built progress data, enhancing the reliability and timeliness of construction monitoring. Finally, validation was conducted on two levels:
  • Model-level validation: The YOLOv8 model was evaluated using a dedicated test set to confirm detection accuracy;
  • System-level validation: The complete framework—including the Autodesk Revit© plug-in—was assessed in a simulated BIM environment.
  • Despite the promising results, this research has several limitations:
  • Dataset source limitations: Images were sourced online and from local construction sites, which may not comprehensively reflect the variability of actual bricklaying tasks across different projects;
  • Indoor environment focus: The proposed model has not been tested in outdoor settings, where dynamic lighting and weather could affect performance;
  • Task specificity: While optimized for bricklaying, extending this approach to other construction tasks shall require further customization.

5.2. Comparative Analysis

Previous approaches to construction activity monitoring have employed deep learning models such as Mask R-CNN or photogrammetric methods; however, these solutions often lack real-time performance, are not optimized for task-specific applications like bricklaying, and typically require post-processing for integration with BIM platforms. The proposed model addresses these limitations by utilizing YOLOv8 for fast and efficient detection, implementing object recognition tailored to indoor bricklaying and enabling automated real-time BIM updates.
A comparative overview of system performance is provided in Table 4, which serves as an illustrative overview of related efforts in automated construction monitoring. These efforts may be considered foundational rather than directly comparable due to differences in task scope, methodologies, and datasets. Unlike the photogrammetric method used to monitor bricklaying progress by ref. [5], which achieved 73% precision and 77% recall but relied on post-processed point clouds, this research supports direct, real-time BIM integration. While ref. [17] reported higher detection metrics (mAP50 of 97%, mAP50–95 of 93%) using a larger dataset (738 images), their work focused on general construction monitoring, such as plastering, and did not address bricklaying-specific challenges. In such applications, precise geometric modeling is less critical due to the repetitive nature of brick units. In contrast, this study, which is composed of 531 images, achieved a mAP50 of 95.4%, mAP50–95 of 80.7%, 95% precision, and 93% recall, offering a domain-specific, real-time solution for bricklaying progress tracking.

6. Conclusions and Recommendations

6.1. Conclusions

This research sets out to develop a real-time progress monitoring model for indoor bricklaying activities by leveraging the YOLOv8 deep learning algorithm integrated with BIM. The research successfully met all four stated objectives: data acquisition, CV-based brick detection, BIM integration, and progress visualization. Key findings are summarized as follows:
  • High Detection Accuracy: The YOLOv8 model achieved a mean Average Precision of 95.4% (mAP50) and 80.7% (mAP50-95) on the test dataset, ensuring reliable, brick-level detection suitable for real-time tracking in complex indoor construction environments.
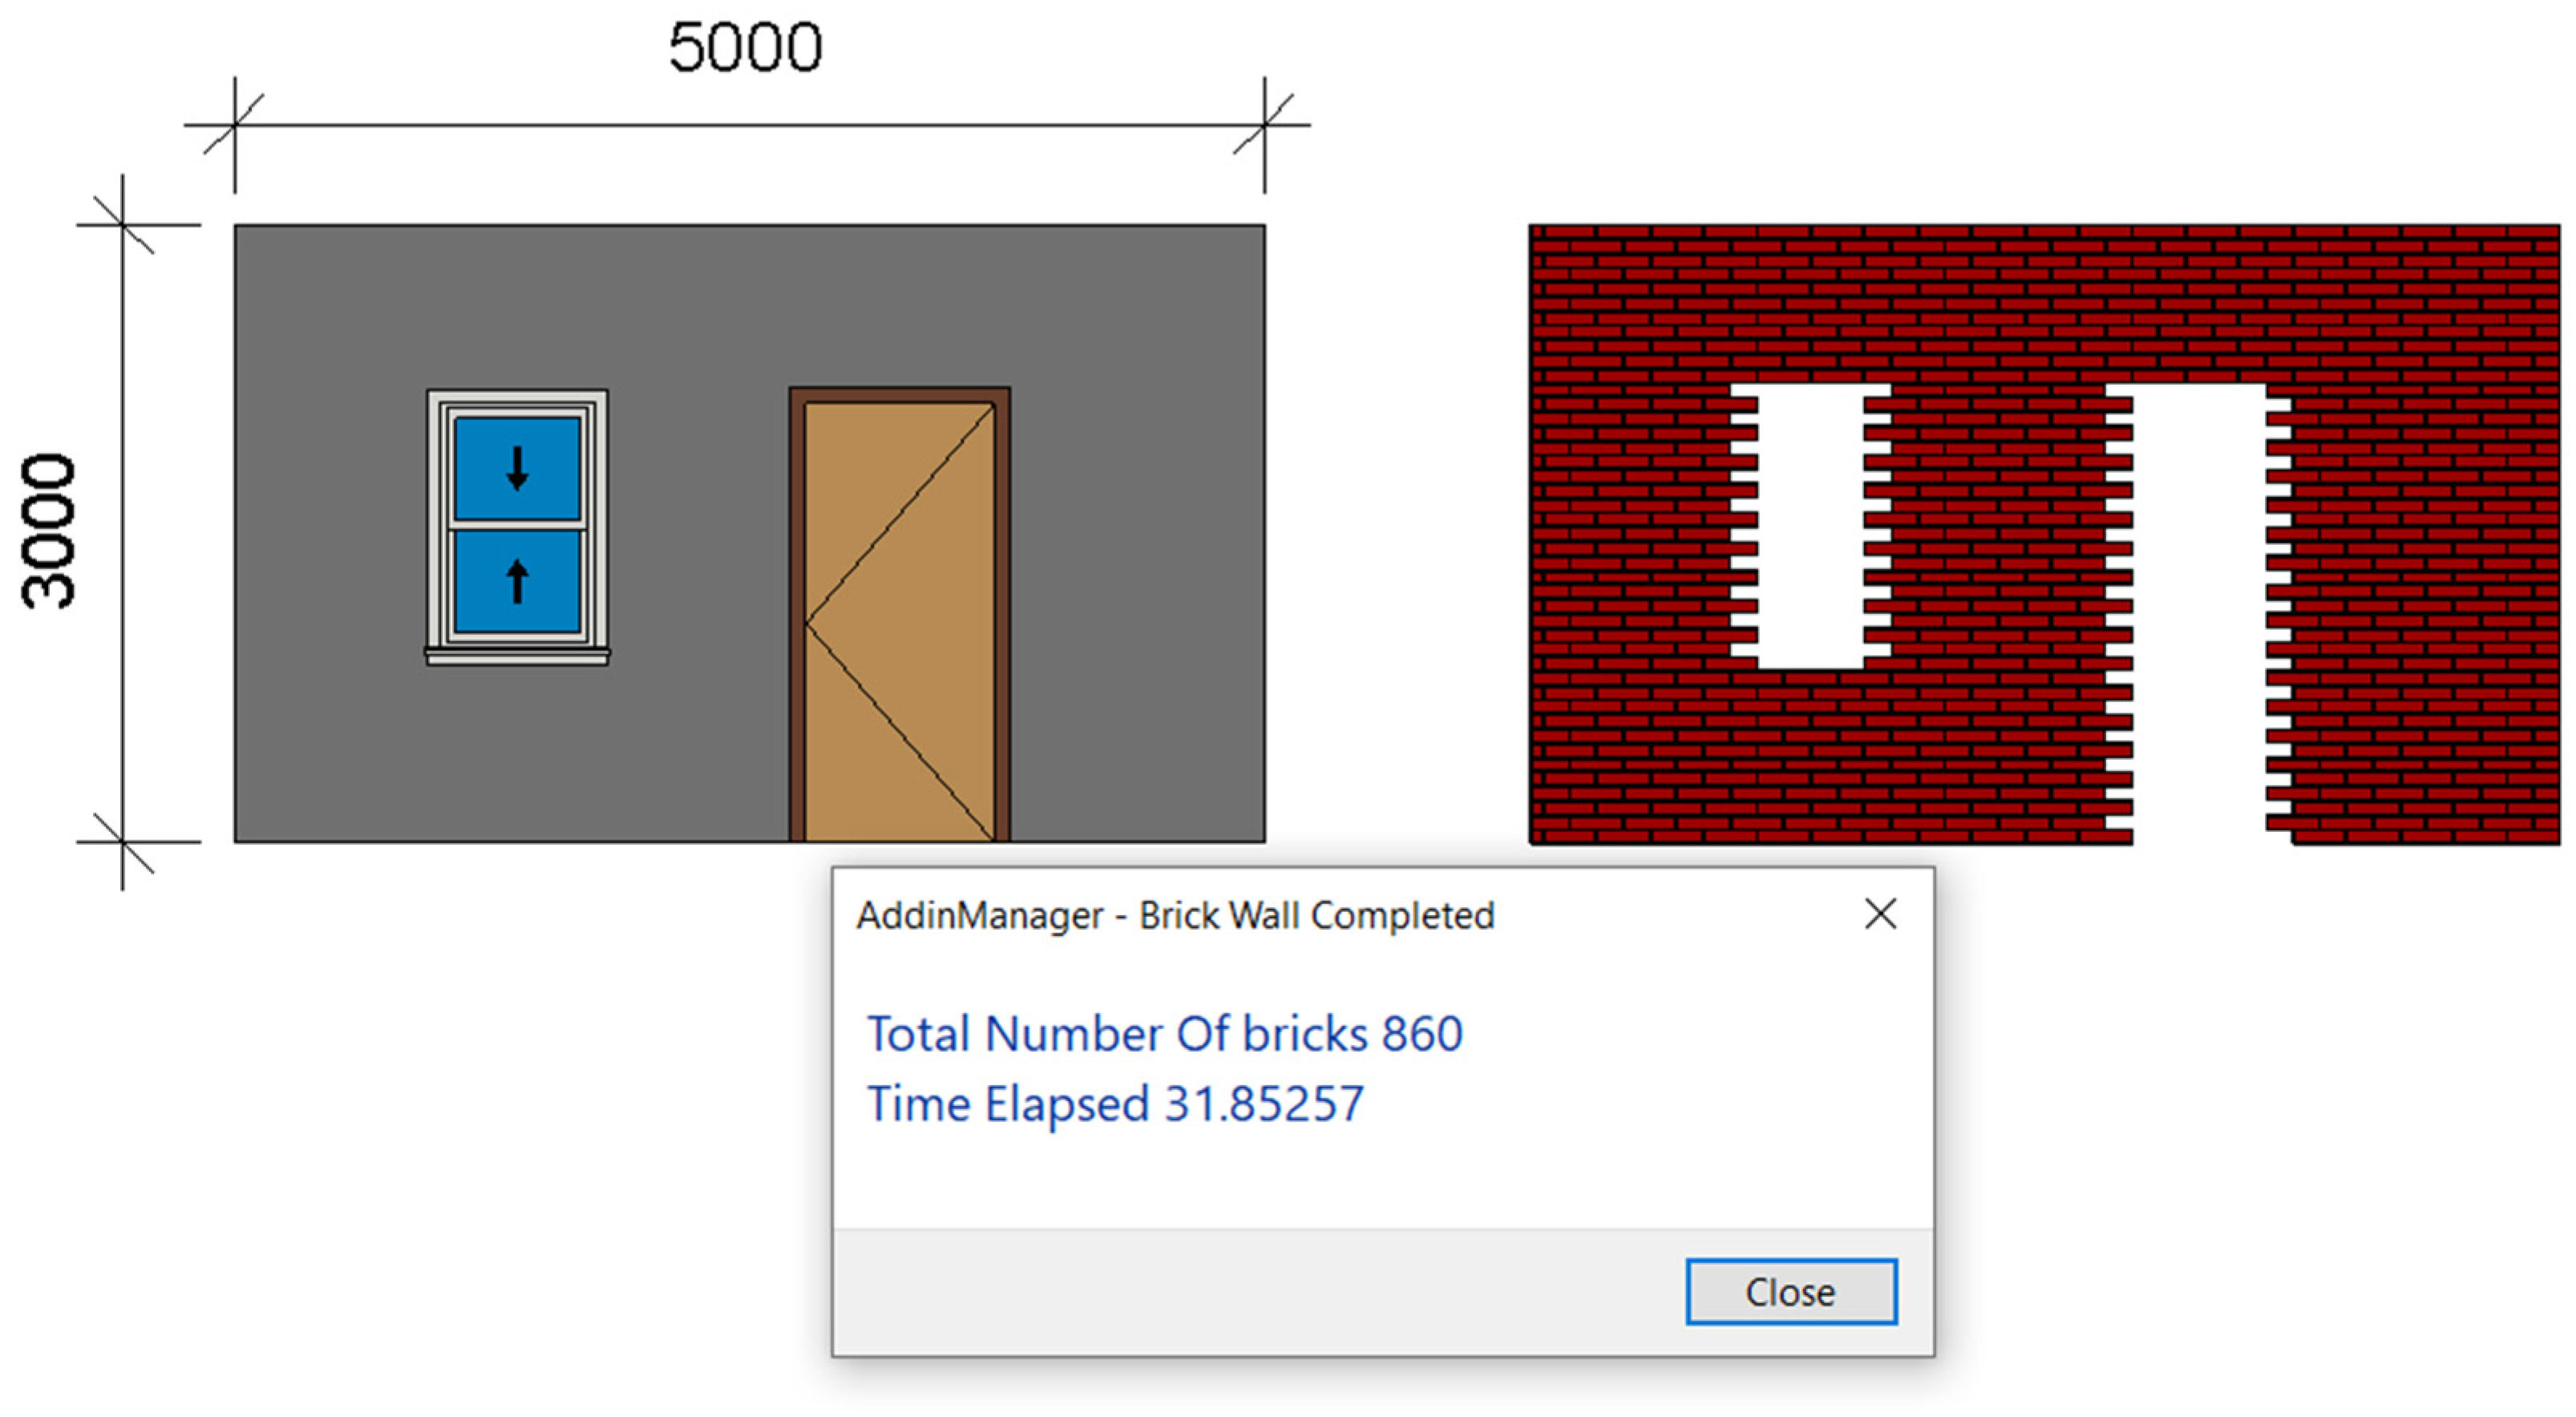
  • Automation and Speed: The Autodesk Revit© plug-in demonstrated rapid performance by quantifying bricks in a 5 m × 3 m wall model in approximately 32 s, compared to traditional manual quantification methods that typically require much more effort and time.
  • Productivity Gains: The automated monitoring process increases productivity by a factor of 5 to 10, reducing reliance on manual inspections and reporting. These gains directly translate into cost savings and faster project cycle times, especially in labor-intensive indoor activities such as bricklaying.
  • Enhanced BIM Integration: By linking detected brick counts to BIM’s as-planned models, the system enables real-time updates to 4D schedules. This facilitates accurate comparisons between planned and actual progress, leading to more informed forecasting and better resource planning.

6.2. Recommendations for Future Work

To further improve the system’s applicability and robustness, the following directions are recommended:
  • Dataset Expansion: Augmenting the training data with more diverse site conditions to improve model adaptability and generalization.
  • On-site Validation: Conducting field experiments on active construction sites to evaluate real-world performance under varying environmental conditions.
  • Broader Applicability: Adapting the YOLO-based detection framework for other indoor tasks (e.g., drywall, tiling) to expand its utility across multiple trades.
  • Integration with Broader Monitoring Systems: Combining this system with additional sensors or IoT devices to create a more holistic, multi-source progress monitoring platform.
Through these enhancements, the proposed approach has the potential to become a core component of intelligent construction site management, driving the industry toward fully automated, real-time digital twinning and progress control.

Author Contributions

Conceptualization, R.M. and Y.A.S.E.; methodology, R.M., K.A.H. and Y.A.S.E.; software, R.M. and Y.A.S.E.; validation, R.M. and Y.A.S.E.; formal analysis, R.M., K.A.H. and Y.A.S.E.; investigation, R.M. and Y.A.S.E.; resources, R.M.; data curation, R.M. and Y.A.S.E.; writing—original draft preparation, R.M.; writing—review and editing, K.A.H. and Y.A.S.E.; visualization, R.M. and Y.A.S.E.; supervision, K.A.H. and Y.A.S.E.; project administration, R.M., K.A.H. and Y.A.S.E.; funding acquisition, R.M., K.A.H. and Y.A.S.E. All authors have read and agreed to the published version of the manuscript.

Funding

This research received no external funding.

Data Availability Statement

The raw data supporting the conclusions of this article will be made available by the authors upon request.

Conflicts of Interest

The authors declare no conflict of interest.

References

  1. Barbosa, F.; Woetzel, J.; Mischke, J. Reinventing Construction: A Route of Higher Productivity; McKinsey Global Institute: Gurugram, India, 2017. [Google Scholar]
  2. McCabe, B.; Hamledari, H.; Shahi, A.; Zangeneh, P.; Azar, E.R. Roles, Benefits, and Challenges of Using UAVs for Indoor Smart Construction Applications. In Proceedings of the ASCE International Workshop on Computing in Civil Engineering 2017, Seattle, WT, USA, 25–27 June 2017. [Google Scholar] [CrossRef]
  3. Kropp, C.; Koch, C.; König, M.; Brilakis, I. A framework for automated delay prediction of finishing works using video data and BIM-based construction simulation. In Proceedings of the 14th International Conference on Computing in Civil and Building Engineering, Moscow, Russia, 27–29 June 2012. [Google Scholar]
  4. Bosché, F.; Ahmed, M.; Turkan, Y.; Haas, C.T.; Haas, R. The value of integrating Scan-to-BIM and Scan-vs-BIM techniques for construction monitoring using laser scanning and BIM: The case of cylindrical MEP components. Autom. Constr. 2015, 49, 201–213. [Google Scholar] [CrossRef]
  5. Pushkar, A.; Senthilvel, M.; Varghese, K. Automated progress monitoring of masonry activity using photogrammetric point cloud. In Proceedings of the 35th International Symposium on Automation and Robotics in Construction (ISARC), Berlin, Germany, 20–25 July 2018; pp. 897–903. [Google Scholar] [CrossRef]
  6. Ghasemi Poor Sabet, P.; Chong, H.-Y. Pathways for the improvement of construction productivity: A perspective on the adoption of advanced techniques. Adv. Civ. Eng. 2020, 2020, 5170759. [Google Scholar] [CrossRef]
  7. Omar, T.; Nehdi, M.L. Automation in Construction Data Acquisition Technologies for Construction Progress Tracking. Autom. Constr. 2016, 70, 143–155. [Google Scholar] [CrossRef]
  8. Golparvar-Fard, M.; Bohn, J.; Teizer, J.; Savarese, S.; Peña-Mora, F. Automation in Construction Evaluation of Image-based Modeling and Laser Scanning Accuracy for Emerging Automated Performance Monitoring Techniques. Autom. Constr. 2011, 20, 1143–1155. [Google Scholar] [CrossRef]
  9. Chan, A.P.; Scott, D.; Chan, A.P. Factors affecting the success of a construction project. J. Constr. Eng. Manag. 2004, 130, 153–155. [Google Scholar] [CrossRef]
  10. Chui, M.; Mischke, J. The impact and Opportunities of Automation in Construction. Glob. Infrastruct. Initiat. 2019, 5, 4–7. [Google Scholar]
  11. Alzubi, K.; Alaloul, W.; Malkawi, A.; Qureshi, A.; Musarat, M.A. Automated monitoring technologies and construction productivity enhancement: Building projects case. Ain Shams Eng. J. 2022, 14, 102042. [Google Scholar] [CrossRef]
  12. Ekanayake, B.; Wong, J.K.W.; Fini, A.A.F.; Smith, P.; Thengane, V. Deep learning-based computer vision in project management: Automating indoor construction progress monitoring. Proj. Leadersh. Soc. 2024, 5, 100149. [Google Scholar] [CrossRef]
  13. Kopsida, M.; Brilakis, I.; Vela, P. A Review of Automated Construction Progress and Inspection Methods. In Proceedings of the 32nd CIB W78 Conference on Construction IT, Eindhoven, Netherlands, 27–29 October 2015; pp. 421–431. [Google Scholar]
  14. Li, C.Z.; Xue, F.; Li, X.; Hong, J.; Shen, G.Q. An Internet of Things-enabled BIM platform for on-site assembly services in prefabricated construction. Autom. Constr. 2018, 89, 146–161. [Google Scholar] [CrossRef]
  15. Deng, Y.; Hong, H.; Luo, H.; Deng, H. Automatic Indoor Progress Monitoring Using BIM and Computer Vision. 2017. Available online: https://www.researchgate.net/publication/319128104_Automatic_indoor_progress_monitoring_using_BIM_and_computer_vision (accessed on 11 May 2025).
  16. Paneru, S.; Jeelani, I. Computer Vision Applications in Construction: Current state, opportunities & challenges. Autom. Constr. 2021, 132, 103940. [Google Scholar] [CrossRef]
  17. Wei, W.; Lu, Y.; Zhong, T.; Li, P.; Liu, B. Integrated Vision-based Automated Progress Monitoring of Indoor Construction Using Mask Region-based Convolutional Neural Networks and BIM. Autom. Constr. 2022, 140, 104327. [Google Scholar] [CrossRef]
  18. Krizhevsky, A.; Hinton, G.E. ImageNet Classification with Deep Convolutional Neural Networks. 2018, pp. 1–9. Available online: https://proceedings.neurips.cc/paper_files/paper/2012/file/c399862d3b9d6b76c8436e924a68c45b-Paper.pdf (accessed on 11 May 2025).
  19. Deng, J.; Dong, W.; Socher, R.; Li, L.; Li, K.; Li, F.-F. ImageNet: A Large-Scale Hierarchical Image Database. In Proceedings of the 2009 IEEE Conference on Computer Vision and Pattern Recognition, Miami, FL, USA, 20–25 June 2009; pp. 2–9. [Google Scholar]
  20. Akinosho, T.D.; Oyedele, L.O.; Bilal, M.; Ajayi, A.O.; Davila Delgado, M.; Akinade, O.O.; Ahmed, A.A. Deep learning in the construction industry: A review of present status and future innovations. J. Build. Eng. 2020, 32, 101827. [Google Scholar] [CrossRef]
  21. Fang, Q.; Li, H.; Luo, X.; Ding, L.; Luo, H.; Rose, T.M.; An, W. Automation in Construction Detecting Non-hardhat-use by a Deep Learning Method from Far-field Surveillance Videos. Autom. Constr. 2018, 85, 1–9. [Google Scholar] [CrossRef]
  22. Li, Y.; Lu, Y.; Chen, J. Automation in Construction a Deep Learning Approach for Real-time Rebar Counting on the Construction Site Based on YOLOv3 Detector. Autom. Constr. 2021, 124, 103602. [Google Scholar] [CrossRef]
  23. Fisher, R.B.; Breckon, T.P.; Dawson-howe, K. Dictionary of Computer Vision and Image Processing; Wiley: Hoboken, NJ, USA, 2005. [Google Scholar]
  24. Shapiro, L.G.; Stockman, G.C. Computer Vision; Prentice Hall: Upper Saddle River, NJ, USA, 2001. [Google Scholar]
  25. Arge, F.O.R.L.; Mage, C.I. Very Deep Convolutional Networks for Large-Scale Image Recognition. In Proceedings of the 3rd International Conference on Learning Representations ICLR 2015, San Diego, CA, USA, 7–9 May 2015; pp. 1–14. [Google Scholar]
  26. Szegedy, C.; Liu, W.; Jia, Y.; Sermanet, P.; Reed, S.; Anguelov, D.; Erhan, D.; Vanhoucke, V.; Rabinovich, A.; Liu, W.; et al. Going Deeper with Convolutions. In Proceedings of the 2015 IEEE Conference on Computer Vision and Pattern Recognition (CVPR), Boston, MA, USA, 7–12 June 2015; pp. 1–9. [Google Scholar] [CrossRef]
  27. He, K.; Zhang, X.; Ren, S.; Sun, J. Deep Residual Learning for Image Recognition. In Proceedings of the 2016 IEEE Conference on Computer Vision and Pattern Recognition (CVPR), Las Vegas, NV, USA, 27–30 June 2016; pp. 770–778. [Google Scholar] [CrossRef]
  28. Ren, S.; He, K.; Girshick, R.; Sun, J. Faster R-CNN: Towards Real-Time Object Detection with Region Proposal Networks. IEEE Trans. Pattern Anal. Mach. Intell. 2017, 39, 1137–1149. [Google Scholar] [CrossRef] [PubMed]
  29. Liu, W.; Anguelov, D.; Erhan, D.; Szegedy, C.; Reed, S.; Fu, C.-Y.; Berg, A.C. SSD: Single Shot MultiBox Detector. In Proceedings of the Computer Vision–ECCV 2016: 14th European Conference, Amsterdam, The Netherlands, 11–14 October 2016. [Google Scholar]
  30. Redmon, J.; Redmon, J.; Divvala, S.; Girshick, R.; Farhadi, A. You Only Look Once: Unified, Real-Time Object Detection. 2025. Available online: http://pjreddie.com/yolo/ (accessed on 11 May 2025).
  31. Wu, X.; Sahoo, D.; Hoi, S.C.H. Neurocomputing Recent Advances in Deep Learning for Object Detection. Neurocomputing 2020, 396, 39–64. [Google Scholar] [CrossRef]
  32. Long, J.; Shelhamer, E.; Darrell, T. Fully Convolutional Networks for Semantic Segmentation. In Proceedings of the IEEE Conference on Computer Vision and Pattern Recognition, Columbus, OH, USA, 23–28 June 2014. [Google Scholar]
  33. Sun, T.; Fan, Q.; Shao, Y. Advanced Engineering Informatics Deep learning-based rebar detection and instance segmentation in images. Adv. Eng. Inform. 2025, 65, 103224. [Google Scholar] [CrossRef]
  34. Autodesk. Getting Started Using the Autodesk Revit API. 2019. Available online: https://help.autodesk.com/view/RVT/2025/ENU/?guid=Revit_API_Revit_API_Developers_Guide_Introduction_Getting_Started_Using_the_Autodesk_Revit_API_html (accessed on 11 May 2025).
  35. Wang, Z.; Zhang, Q.; Yang, B.; Wu, T.; Lei, K.; Zhang, B.; Fang, T. Vision-Based Framework for Automatic Progress Monitoring of Precast Walls by Using Surveillance Videos during the Construction Phase. J. Comput. Civ. Eng. 2021, 35, 04020056. [Google Scholar] [CrossRef]
  36. He, K.; Gkioxari, G.; Dollár, P.; Girshick, R. Mask R-CNN. In Proceedings of the 2017 IEEE International Conference on Computer Vision (ICCV), Venice, Italy, 22–29 October 2017; pp. 2980–2988. [Google Scholar] [CrossRef]
  37. Wojke, N.; Bewley, A.; Paulus, D. Simple Online and Realtime Tracking with a Deep Association Metric Nicolai Wojke, Alex Bewley, Dietrich Paulus; University of Koblenz-Landau: Mainz, Germany; Queensland University of Technology: Brisbane, Australia, 2017. [Google Scholar]
  38. Zou, Z.; Chen, K.; Shi, Z.; Guo, Y.; Ye, J. Object Detection in 20 Years: A Survey. Proc. IEEE 2023, 111, 257–276. [Google Scholar] [CrossRef]
  39. Cao, J.; Peng, B.; Gao, M.; Hao, H.; Li, X.; Mou, H. Object detection based on CNN and vision-transformer: A survey. IET Comput. Vis. 2025, 19, e70028. [Google Scholar] [CrossRef]
  40. Zhao, X.; Jin, Y.; Selvaraj, N.M.; Ilyas, M.; Cheah, C.C. Automation in Construction Platform-independent visual installation progress monitoring for construction automation. Autom. Constr. 2023, 154, 104996. [Google Scholar] [CrossRef]
  41. Jiang, P.; Ergu, D.; Liu, F.; Cai, Y.; Ma, B. ScienceDirect A Review of Yolo Algorithm Developments A Review of Yolo Algorithm Developments. Procedia Comput. Sci. 2022, 199, 1066–1073. [Google Scholar] [CrossRef]
  42. Redmon, J. YOLOv3: An Incremental Improvement. arXiv 2018, arXiv:1804.02767. [Google Scholar]
  43. Redmon, J.; Farhadi, A. YOLO9000: Better, Faster, Stronger. arXiv 2016, arXiv:1612.08242. [Google Scholar]
  44. Ultralytics YOLOv5. 2023. Available online: https://docs.ultralytics.com/yolov5/ (accessed on 11 May 2025).
  45. Ultralytics YOLOv7. 2023. Available online: https://docs.ultralytics.com/models/yolov7/ (accessed on 11 May 2025).
  46. Ultralytics YOLOv8. 2023. Available online: https://docs.ultralytics.com/models/yolov8/ (accessed on 11 May 2025).
  47. Tao, F.; Xiao, B.; Qi, Q.; Cheng, J.; Ji, P. Digital Twin Modeling. J. Manuf. Syst. 2022, 64, 372–389. [Google Scholar] [CrossRef]
  48. Glaessgen, E.H.; Stargel, D.S. The Digital Twin Paradigm for Future NASA and U.S. Air Force Vehicles. In Proceedings of the Collection of Technical Papers-AIAA/ASME/ASCE/AHS/ASC Structures, Structural Dynamics and Materials Conference, Honolulu, Hl, USA, 23–26 April 2012; p. 76921. [Google Scholar] [CrossRef]
  49. Grieves, M. Digital Twin: Manufacturing Excellence through Virtual Factory Replication A Whitepaper by Dr. Michael Grieves. White Pap. 2014, 1, 1–7. [Google Scholar]
  50. Tao, F.; Zhang, M. Digital Twin Shop-Floor: A New Shop-Floor Paradigm Towards Smart Manufacturing. IEEE Access 2017, 5, 20418–20427. [Google Scholar] [CrossRef]
  51. Opoku, D.G.J.; Perera, S.; Osei-Kyei, R.; Rashidi, M. Digital Twin Application in the Construction Industry: A Literature Review. J. Build. Eng. 2021, 40, 102726. [Google Scholar] [CrossRef]
  52. Ammar, A.; Nassereddine, H.; AbdulBaky, N.; AbouKansour, A.; Tannoury, J.; Urban, H.; Schranz, C. Digital Twins in the Construction Industry: A Perspective of Practitioners and Building Authority. Front. Built Environ. 2022, 8, 834671. [Google Scholar] [CrossRef]
  53. Zhuang, C.; Liu, J.; Xiong, H. Digital twin-based smart production management and control framework for the complex product assembly shop-floor. Int. J. Adv. Manuf. Technol. 2018, 96, 1149–1163. [Google Scholar] [CrossRef]
  54. Wagner, C.; Grothoff, J.; Epple, U.; Drath, R.; Malakuti, S.; Grüner, S.; Hoffmeister, M.; Zimermann, P. The roleof the Industry 4.0 asset administration shell and the digital twin during the life cycle of a plant. In Proceedings of the 2017 22nd IEEE International Conference on Emerging Technologies and Factory Automation (ETFA), Limassol, Cyprus, 12–15 September 2017; pp. 1–8. [Google Scholar]
  55. Kovacevic, M. Digital Twin. In Proceedings of the 17th International Conference on Information and Knowledge Engineering, Cadiz, Spain, 11–15 June 2018. [Google Scholar]
  56. Jones, D.; Snider, C.; Nassehi, A.; Yon, J.; Hicks, B. Characterising the Digital Twin: A Systematic Literature Review. CIRP J. Manuf. Sci. Technol. 2020, 29, 36–52. [Google Scholar] [CrossRef]
  57. Boje, C.; Guerriero, A.; Kubicki, S.; Rezgui, Y. Towards a semantic Construction Digital Twin: Directions for Future Research. Autom. Constr. 2020, 114, 103179. [Google Scholar] [CrossRef]
  58. Autodesk Tandem. 2021. Available online: https://intandem.autodesk.com/ (accessed on 11 May 2025).
  59. Bentley, H. An Open Platform for Infrastructure Digital Twins. 2021. Available online: https://hub.frost.com/digital-twins/ (accessed on 11 May 2025).
  60. Rao, A.S.; Radanovic, M.; Liu, Y.; Hu, S.; Fang, Y.; Khoshelham, K.; Palaniswami, M.; Ngo, T. Automation in Construction Real-time Monitoring of Construction Sites: Sensors, methods, and applications. Autom. Constr. 2022, 136, 104099. [Google Scholar] [CrossRef]
  61. Deng, L. The Mnist Database of Handwritten Digit Images for Machine Learning Research. IEEE Signal Process. Mag. 2012, 29, 141–142. [Google Scholar] [CrossRef]
  62. Everingham, M.; Gool, L.V.; Williams, C.K.I.; Winn, J.; Zisserman, A. The P ASCAL Visual Object Classes (VOC) Challenge. Int. J. Comput. Vis. 2010, 88, 303–338. [Google Scholar] [CrossRef]
  63. Lin, T.; Zitnick, C.L.; Doll, P. Microsoft COCO: Common Objects in Context. In Proceedings of the Computer Vision–ECCV 2014: 13th European Conference, Zurich, Switzerland, 6–12 September 2014; pp. 1–15. [Google Scholar]
  64. Tajeen, H.; Zhu, Z. Automation in Construction Image Dataset Development for Measuring Construction Equipment Recognition Performance. Autom. Constr. 2014, 48, 1–10. [Google Scholar] [CrossRef]
  65. Kim, H.; Kim, H.; Hong, Y.W.; Byun, H. Detecting Construction Equipment Using a Region-based Fully Convolutional Network and Transfer Learning. J. Comput. Civ. Eng. 2017, 7, 517–524. [Google Scholar] [CrossRef]
  66. Kolar, Z.; Chen, H.; Luo, X. Automation in Construction Transfer learning and Deep Convolutional Neural Networks for Safety Guardrail Detection in 2D Images. Autom. Constr. 2018, 89, 58–70. [Google Scholar] [CrossRef]
  67. Li, Y.; Wei, H.; Han, Z.; Huang, J.; Wang, W.; Formisano, A. Deep Learning-Based Safety Helmet Detection in Engineering Management Based on Convolutional Neural Networks. Adv. Civ. Eng. 2020, 2020, 9703560. [Google Scholar] [CrossRef]
  68. An, X.; Zhou, L.; Liu, Z.; Wang, C.; Li, P.; Li, Z. Automation in Construction Dataset and benchmark for Detecting Moving Objects in Construction Sites. Autom. Constr. 2021, 122, 103482. [Google Scholar] [CrossRef]
  69. Wang, Z.; Wu, Y.; Yang, L.; Thirunavukarasu, A.; Evison, C.; Zhao, Y. Fast Personal Protective Equipment Detection for Real Construction Sites Using Deep Learning Approaches. Sensors 2021, 21, 3478. [Google Scholar] [CrossRef] [PubMed]
  70. Xiao, B.; Kang, S.-C. Development of an Image Data Set of Construction Machines for Deep Learning Object Detection. J. Comput. Civ. Eng. 2021, 35, 5020005. [Google Scholar] [CrossRef]
  71. Ramez, M. Bricks in Walls Dataset. Roboflow Universe. Roboflow. 2024. Available online: https://universe.roboflow.com/ramezmagdy/bricks-in-walls (accessed on 11 May 2025).
  72. Roboflow. 2025. Available online: https://roboflow.com/ (accessed on 11 May 2025).
  73. Google Colab. 2025. Available online: https://colab.google/ (accessed on 11 May 2025).
  74. Nassar, N.K. An integrated framework for evaluation of performance of construction projects. In Proceedings of the PMI® Global Congress 2009—North America, Orlando, FL, USA, 10–13 October 2009; Project Management Institute: Newtown Square, PA, USA, 2009. [Google Scholar]
  75. Bricki. Brick-Detector Dataset. Roboflow Universe. Roboflow. 2025. Available online: https://universe.roboflow.com/bricki/brick-detector (accessed on 26 June 2025).
Figure 1. Proposed model methodology.
Buildings 15 02456 g001
Figure 2. Proposed model development flowchart.
Buildings 15 02456 g002
Figure 3. Variety of images in the dataset.
Buildings 15 02456 g003
Figure 4. Dataset annotation.
Buildings 15 02456 g004
Figure 5. Image augmentation.
Buildings 15 02456 g005
Figure 6. YOLOv8 metrics.
Buildings 15 02456 g006
Figure 7. YOLOv8 brick detection.
Buildings 15 02456 g007
Figure 8. Integrating results into 3D BIM model.
Buildings 15 02456 g008
Figure 9. Effect of changes in brightness on YOLOv8 performance.
Buildings 15 02456 g009
Figure 10. Confidence curve.
Buildings 15 02456 g010
Figure 11. Result of brick quantification in Autodesk Revit©.
Buildings 15 02456 g011
Table 1. Dataset distribution.
OcclusionsBricks without Occlusions89%
Bricks with Occlusions11%
MaterialConcrete Bricks26%
Clay Bricks27%
Rocks9%
Sand Lime Bricks38%
ShapeSquare4%
Rectangular87%
Combined9%
Table 2. Ablation study results.
(YOLOv8n)
Epochs = 20
Batch Size = 32
(YOLOv8s)
Epochs = 20
Batch Size = 32
(YOLOv8n)
Epochs = 100
Batch Size = 32
(YOLOv8n)
Epochs = 100
Batch Size = 16
mAP5094.694.395.495.6
mAP50-9571.873.880.780.5
Precision9493.794.695
Recall92.492.79393.1
Table 3. Metrics under different brightness conditions.
BrightnessPrecisionRecallmAP(50)mAP(50–95)
−1000.9020.8810.9150.751
−500.9050.9030.9270.825
500.9060.8810.930.844
1000.8520.8810.9270.788
Table 4. Illustrative overview of the proposed bricklaying monitoring model and related methods.
Dataset SizemAP50mAP50-95PrecisionRecall
Proposed Model53195.4%80.7%95%93%
Mask R-CNN
[17]
73897%93%--
Photogrammetric Method
[5]
---73%77%
N.B.: ‘-’ indicates data not reported in the original publication.
Disclaimer/Publisher’s Note: The statements, opinions and data contained in all publications are solely those of the individual author(s) and contributor(s) and not of MDPI and/or the editor(s). MDPI and/or the editor(s) disclaim responsibility for any injury to people or property resulting from any ideas, methods, instructions or products referred to in the content.

