Article

Laboratory Investigation and Mechanical Evaluation on Xanthan Gum-Reinforced Clay: Unconfined Compression Test, Triaxial Shear Test, and Microstructure Characterization

1
School of Civil Engineering, Shaoxing University, Shaoxing 312000, China
2
Yuecheng Campus, Zhejiang Agricultural Business Colloge, Shaoxing 312000, China
*
Author to whom correspondence should be addressed.
Buildings 2025, 15(14), 2438; https://doi.org/10.3390/buildings15142438
Submission received: 26 May 2025 / Revised: 7 July 2025 / Accepted: 9 July 2025 / Published: 11 July 2025
(This article belongs to the Section Building Structures)

Abstract

Xanthan gum (XG) has potential application prospects as a biopolymer in soil reinforcement engineering. However, there remains a lack of relevant research on its influence on the mechanical properties, microscopic mechanism, and pH value changes in clay. In this study, the effects of different XG dosages (0%, 5%, 10%, 15%, and 20%) on the microscopic mechanism, pH value, and mechanical strength of clay at the 7-day curing age were investigated through tests including Zeta potential, infrared spectroscopy, scanning electron microscopy (SEM), pH value, unconfined compressive strength, and triaxial shear strength. The results show that the addition of XG can not only promote charge exchange to generate hydrogen bonds and increase the bonding force between clays but can also form flocculent aggregates between the matrices, cementing the clay, filling the pores, and reducing the porosity of the samples. It can significantly increase the mechanical strength of the sample. When the content of XG is 20%, the unconfined compressive strength (UCS) and cohesion of the sample reach their maximum, increasing by 296% and 806%, respectively, compared with the reference group without XG. The conclusions drawn from this research can not only provide a theoretical reference for improving soft clay foundations but also expand the application research of XG in clay.

1. Introduction

In cases where the soil at a construction site does not meet the necessary requirements, cement, lime, and other materials are usually mixed with the soil to improve its engineering properties and satisfy construction conditions [1,2]. However, cement as a soil curing agent has shortcomings that cannot be ignored. First, every ton of cement produced generates nearly one ton of carbon dioxide [3], with cement production accounting for 8% of global CO2 emissions each year [4,5]. Secondly, the alkalinity of cement will penetrate the surrounding soil, resulting in elevated soil pH values, which are not conducive to vegetation growth, and this can also cause groundwater pollution [6]. Furthermore, although the cementitious nature of cement can effectively enhance the rigidity modulus of the matrix, this reinforcing effect often leads to potential problems such as decreased fatigue performance and shrinkage cracking [7,8,9]. Increasingly, researchers are exploring environmentally friendly curing agents as stable alternatives to mitigate this situation.
Biopolymers are eco-friendly materials obtained via microbial fermentation [10], and most biopolymers are formed through the dehydration of polysaccharides. Biopolymers can be used as reinforcing agents to solidify soil and have a particular research basis [11]. Biopolymers impact soil in terms of permeability and strength [12] and improve the compressive strength and shear strength of soil [13,14,15,16], improving the attraction between soil particles through Coulomb force and the network formed through biopolymers interweaving with soil [12,15].
Xanthan gum (XG) is a biopolymer and microbial extracellular polysaccharide with broad functions and is produced by Xanthomonas brassica [17,18] through fermentation engineering, with carbohydrate as the primary raw material [19]. The secondary structure of XG is that the side chains are inversely wound around the backbone of the main chain and are maintained by hydrogen bonds to form a stable helical structure [20]. This secondary structure determines that XG has strong resistance to heat, acid, and alkali [21,22]. With these characteristics, XG is widely used in more than 20 industries, such as food, petroleum, and medicine [23,24,25].
At the same time, XG has excellent potential for soil stabilization. The modification effect of XG on different soils is different. Soldo [26] discussed the effect of XG on the properties of sand, powdery sand, and clay. The test results showed that XG has the best strengthening effect on powdery sand. Ni [27] explored the modification effect of XG on a sand–clay mixture through unconfined experiments. The results showed that the modification effect of XG on sand–kaolin was better than that of sand–bentonite. XG usually improves the soil’s unconfined compressive strength (UCS) by improving soil cohesion. Lee [28] explored the effect of XG on sand shear strength through direct shear tests. The test results showed that XG improved the shear strength by increasing the cohesion of sand particles. Dehghan [29] studied the modification effect of XG on loess through penetration and unconsolidated undrained triaxial tests. The test results showed that XG could reduce the permeability and improve the cohesion of loess. However, varying moisture content will affect the shape of XG and then affect its curing effect on soil. Chen [30] changed the drying conditions to test the effect of moisture content on the ability of XG to bind sand. Different moisture contents appeared in liquid and gel states, and only the gel state could provide high viscosity and elasticity. Elsewhere, scholars have studied the microscopic mechanism of XG to stabilize soil. Niteesh [31] conducted scanning electron microscopy tests on XG-modified bauxite samples. The test results found that XG formed a gel-like shell layer, which was ionically bonded to bauxite particles, thereby increasing the bauxite residue strength. Chang [17] believed that the strength enhancement of sand and clay by XG was achieved due to the XG fiber matrix existing in the pores in the form of threads.
Above all, previous studies on XG in soil have not explored the XG formation of gelling material. This study explores XG-solidified clay (XGC) via Zeta potential, infrared spectroscopy, scanning electron microscope (SEM), pH value, unconfined compression strength, and triaxial shear strength testing and analyzes the causes of the formation of XG gelling material. In addition, the effects of different XG dosages (and under different confining pressure conditions) on the curing effect of clay are explored. The above results provide a theoretical basis for the application of XG-solidified clay in actual subgrade engineering.

2. Experiment Method

2.1. Test Material

The test soil was obtained from a construction site in Shaoxing, China. Before the test, the clay was crushed and then passed through a 2 mm sieve. Particles measuring less than 2 mm were taken as the soil for the test and dried in an oven at 105 °C. The typical physical property indicators are shown in Table 1. According to the classification of engineering soil in the Chinese standard GB/T 50145-2007 [32], the liquid limit is 39.52% < 50%, and the plasticity index is 24.37 > 10 for the soil used in this study, which belongs to a low-liquid-limit clay.
The XG used in the test was produced by Shandong Fufeng Fermentation Co., Ltd. (Linyi, China). The product is pale yellow, with a viscosity of 800 mPa·s, which is significantly lower than the approximately 1600 mPa·s studied by relevant scholars [33,34]. Relatively speaking, it belongs to the low-viscosity type. This difference may be due to process optimization or changes in molecular structure. The structural formula of XG is shown in Figure 1. XG is an anionic natural exopolysaccharide formed by the repeated polymerization of units containing D-glucose, D-mannose, D-glucuronic acid groups, and pyruvate groups [35]. Tap water was used for testing.

2.2. Test Scheme

In order to meet the quality control requirements of actual engineering, the optimal moisture content was adopted as the test water consumption in this study. According to the standard GB/T 50123-2019 [36], the optimal moisture content is the moisture content corresponding to the maximum dry density of the soil sample. The compaction test results show that the moisture content corresponding to the maximum dry density of the soil samples in this study is 16%. The dosages of XG were set at 0%, 5%, 10%, 15%, and 20%, respectively, and the sample numbers were recorded as XGC0, XGC5, XGC10, XGC15, and XGC20, respectively. Among them, the moisture content of the sample was calculated based on the total mass of XG and dry clay, and the content of XG was calculated based on the mass of dry clay. To obtain the mechanical strength of the specimens under different XG contents, according to the standard GB/T 50123-2019 [36], unconfined compressive and triaxial shear tests were conducted on the specimens of each group, respectively. The dimensions of the specimens for both tests were cylindrical with a diameter of Φ39.1 mm and a height of 80 mm. The test schemes are shown in Table 2, and the specific test methods are as follows:
(1) Zeta potential test. After curing for seven days, sample XGC0 and sample XGC20 were freeze-dried for 24 h, then crushed and passed through a 2 mm sieve, and the filtered powder was collected for later use. XGC0 powder, XGC20 powder, and XG were prepared in a 1 g/L solution, and 10 mL of each solution was tested using a ZS90 Zeta potentiometer by Malvern Corporation. (Malvern, UK).
(2) Infrared spectroscopy test. The sample was prepared according to the KBr tablet method. The wavenumber of the sample was measured in the range of 500~4000 cm−1. The XGC0 powder, XGC20 powder, and XG were tested using a IRPrestige-21 Fourier infrared spectrometer by Nicol Instruments of Shimadzu Corporation (Tokyo, Japan).
(3) SEM test. The SEM test used a Nissan high–low vacuum SEM model JSM-6360LV by JEOL Ltd. (Tokyo, Japan). Before the test, a conductive adhesive should be smeared on the aluminum tray for the SEM test; stick the powder sample to be tested to the conductive adhesive, and spray a platinum film on the sample’s surface. SEM testing is performed after completion.
(4) pH test. Take 10 g (each) of XGC0 powder, XGC20 powder, and XG, and put them into beakers, respectively. Pour 50 mL of distilled water into each beaker, stir for 3 min, and let it stand for 30 min. Measure the pH level with a FE20 pH meter by Mettler Toledo (Shanghai, China) when finished.
(5) Unconfined compression test. The unconfined compression test was conducted using a 01-LH0501 automatic multi-functional unconfined compressive machine produced by Nanjing Teco Technology Co., Ltd. (Nanjing, China). The axial pressure was applied to the sample at a 1 mm/min loading rate, and the test was finished when the axial strain reached 15%.
(6) Triaxial shear test. The triaxial shear test adopted the unconsolidated and undrained shear test method, performed using a TKA-TTS-3S automatic stress path tester produced by Nanjing Teco Technology Co., Ltd. (Nanjing, China). The confining pressures were set to 100 kPa, 200 kPa, 300 kPa, and 400 kPa, and the loading rate was set to 1 mm/min. The test ended when the axial strain reached 15%.

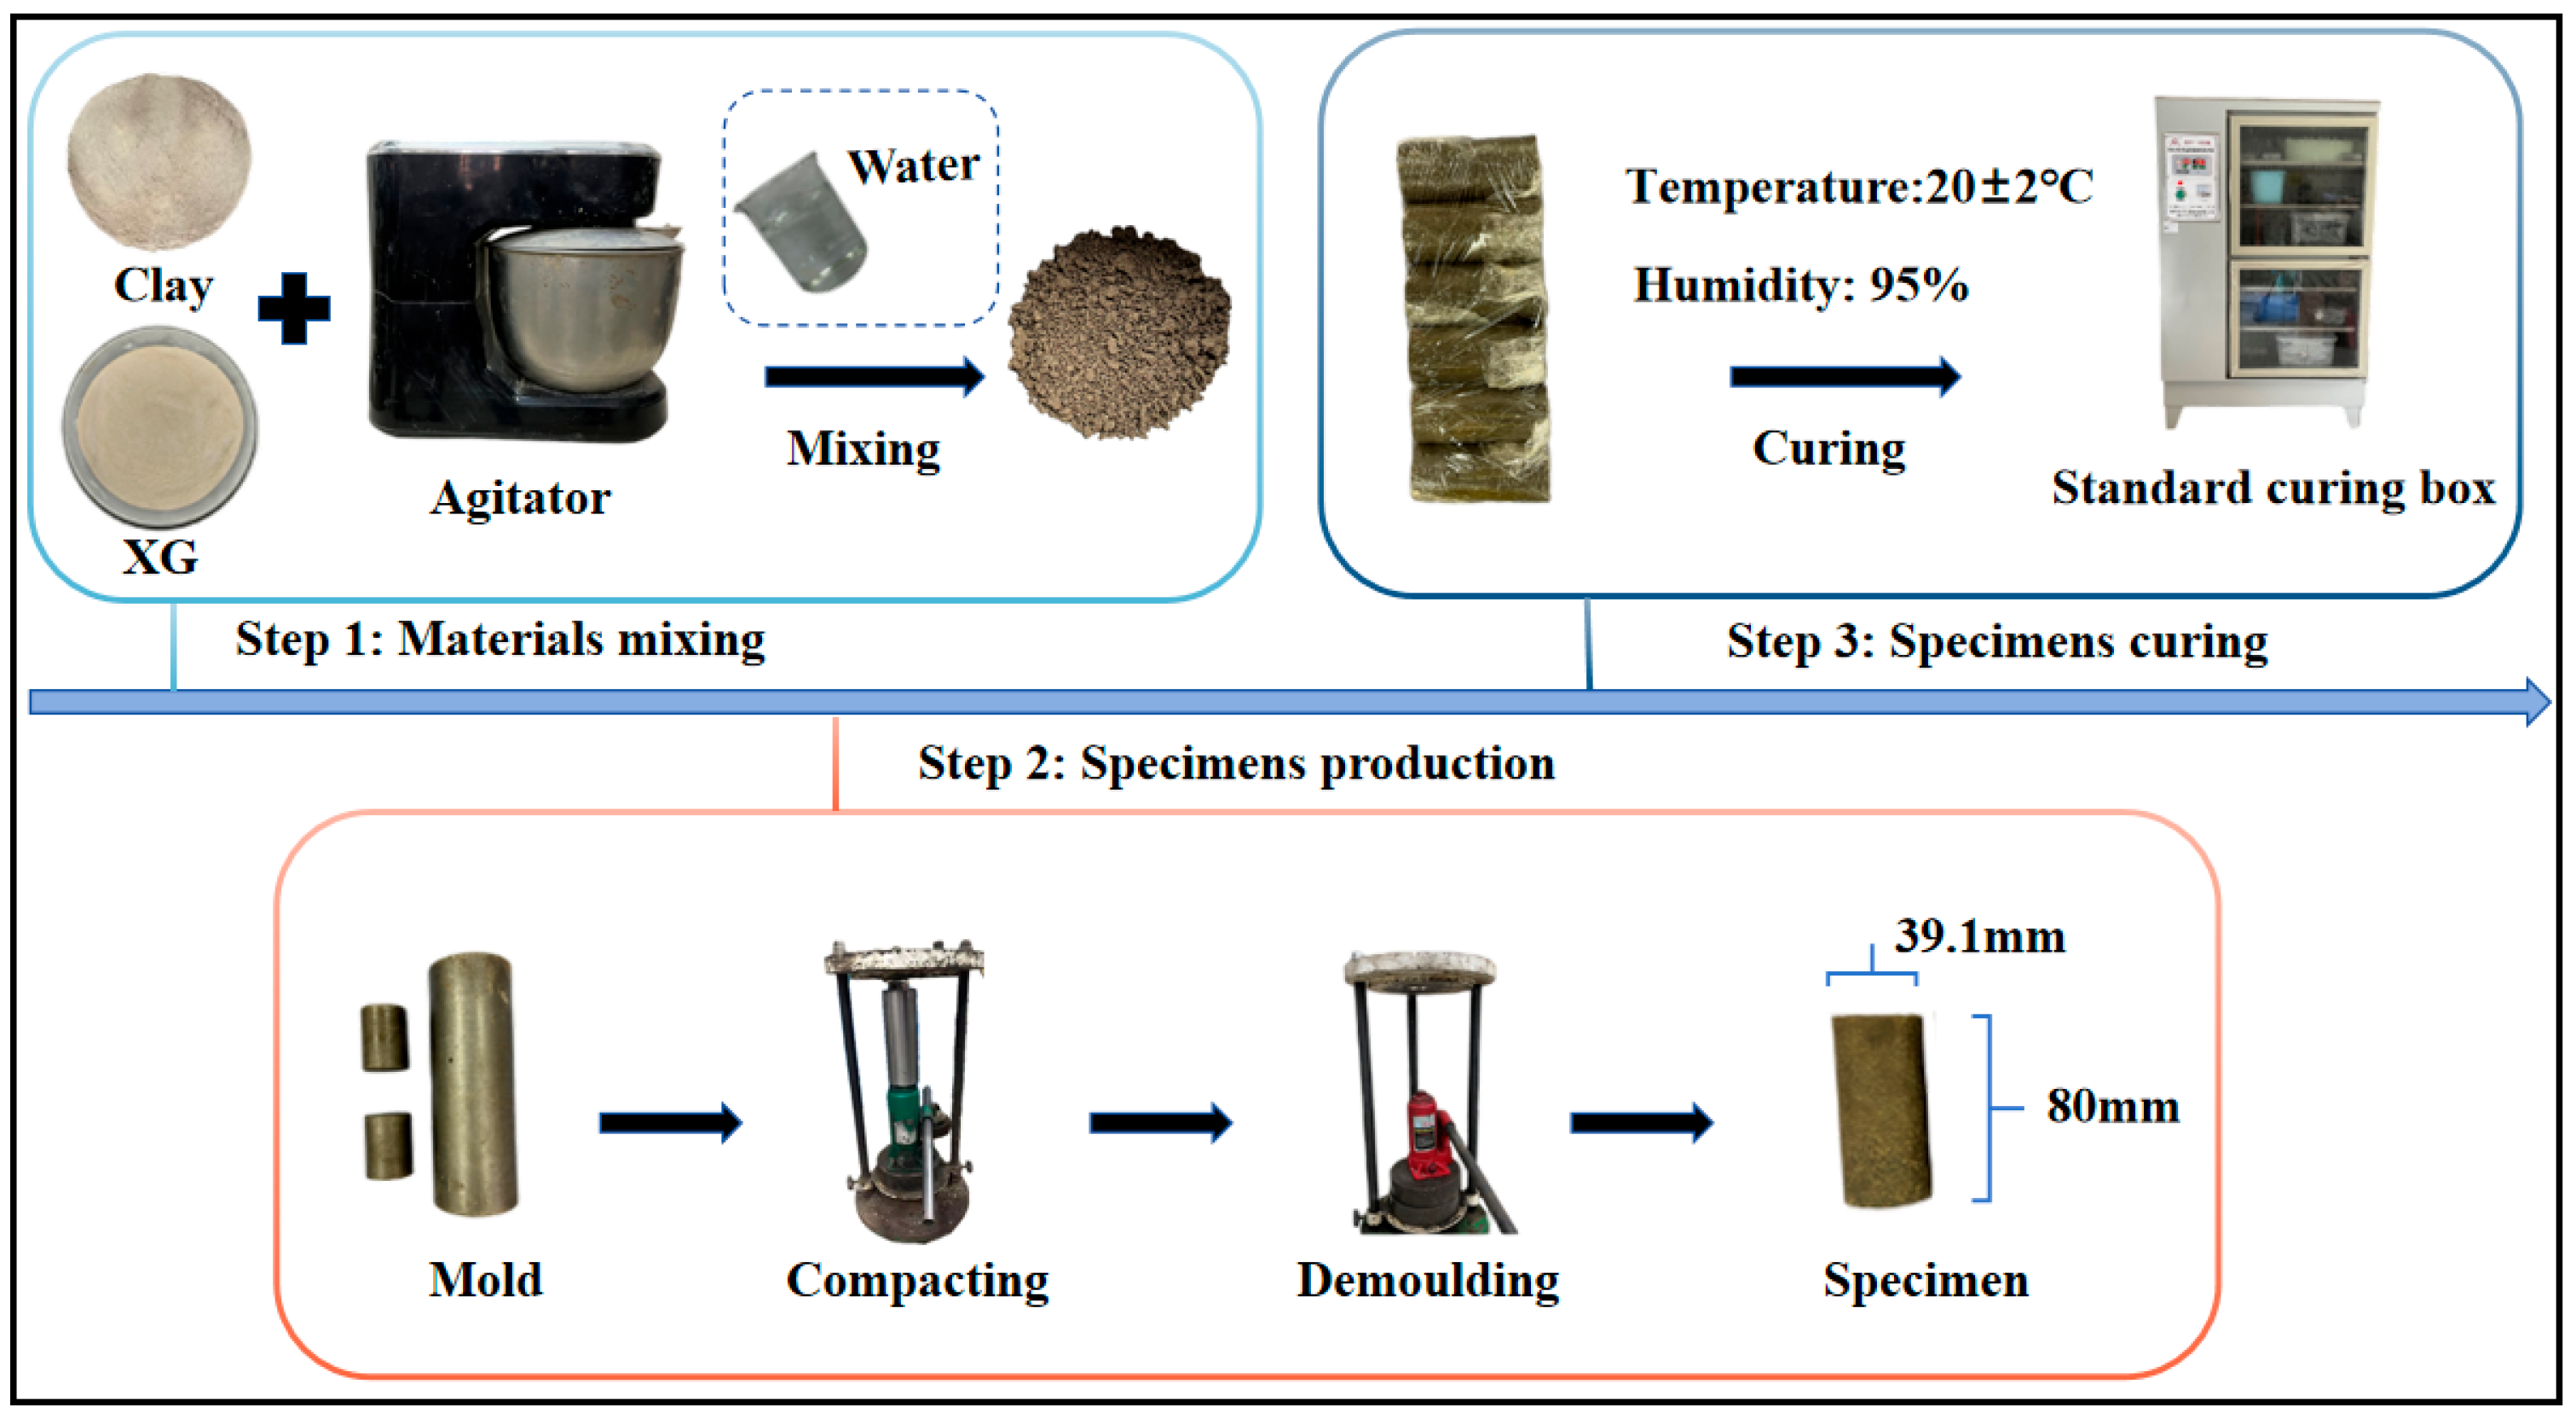
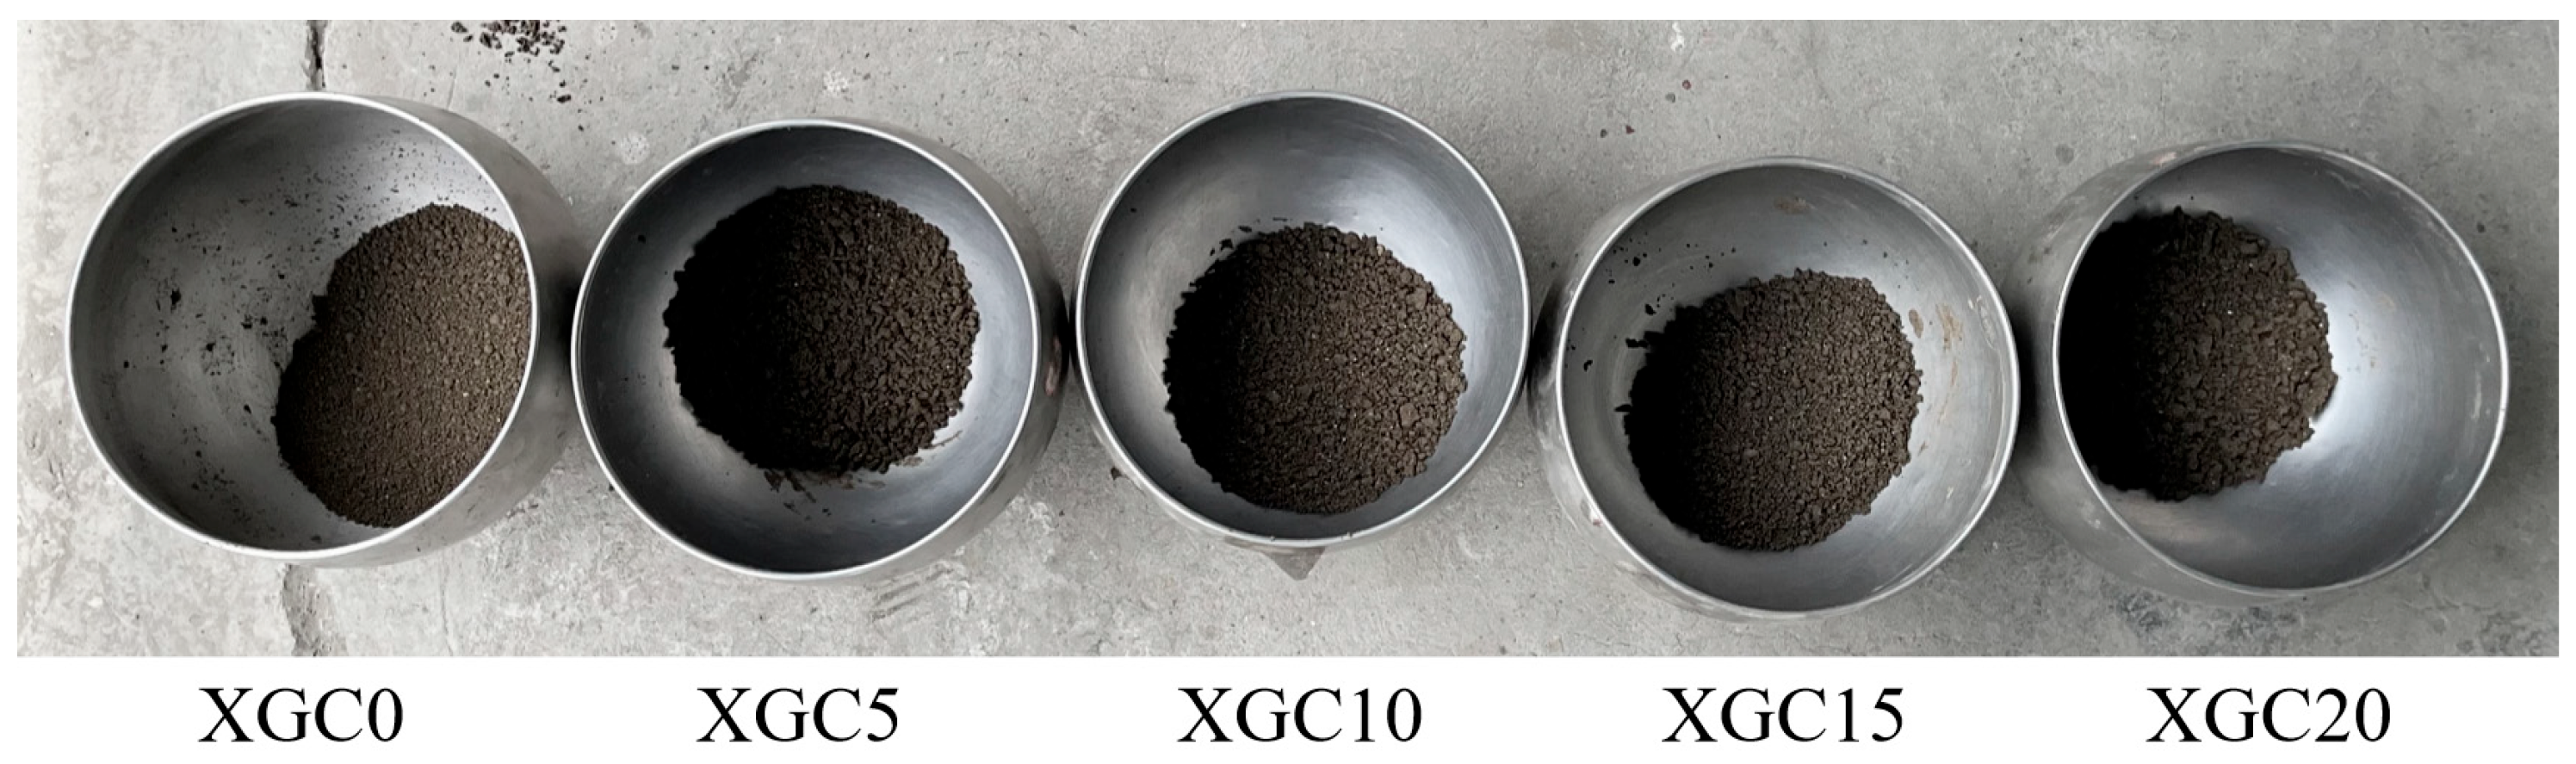
2.3. Sample Preparation

To ensure the comparability between different samples, the density of the samples was controlled at 1.76 g/cm3, the degree of compaction was 95.1%, and five parallel samples were prepared for each group of samples. According to the GB/T 50123-2019 standard [36], sample preparation was performed via the pressure sample method. The sample preparation process is shown in Figure 2, and the morphology of the mixture under different XG dosages is shown in Figure 3. The sample preparation steps are as follows:
(1) Material preparation: To ensure the full utilization of XG and achieve its uniform mixing with clay particles, this study (based on existing research results [17]) adopts the dry mixing method as the main mixing process. According to the test plan, first weigh the corresponding mass of XG dry powder and clay, then use a mixer to mix and stir the two for 5 min. Then, pour in the corresponding mass of water and continue stirring for 10 min to ensure the uniformity of the mixture among various materials.
(2) Sample preparation: An iron mold with a diameter of 39.1 mm and a height of 80 mm was used, smearing oil inside the mold for lubrication. Weigh the mixture into the mold evenly three times, and after the mixture is poured into the mold, compact it manually; scrape the clay surface after each compaction. After the last filling, the sample was compacted using a hydraulic press. After compaction, the hydraulic press is used to remove the sample.
(3) Sample curing: After demolding, wrap the samples with plastic film and place them in a standard curing box for curing until the corresponding age. Set the temperature of the standard curing box to 20 ± 2 °C and the humidity to 95%.

3. Test Results and Analysis

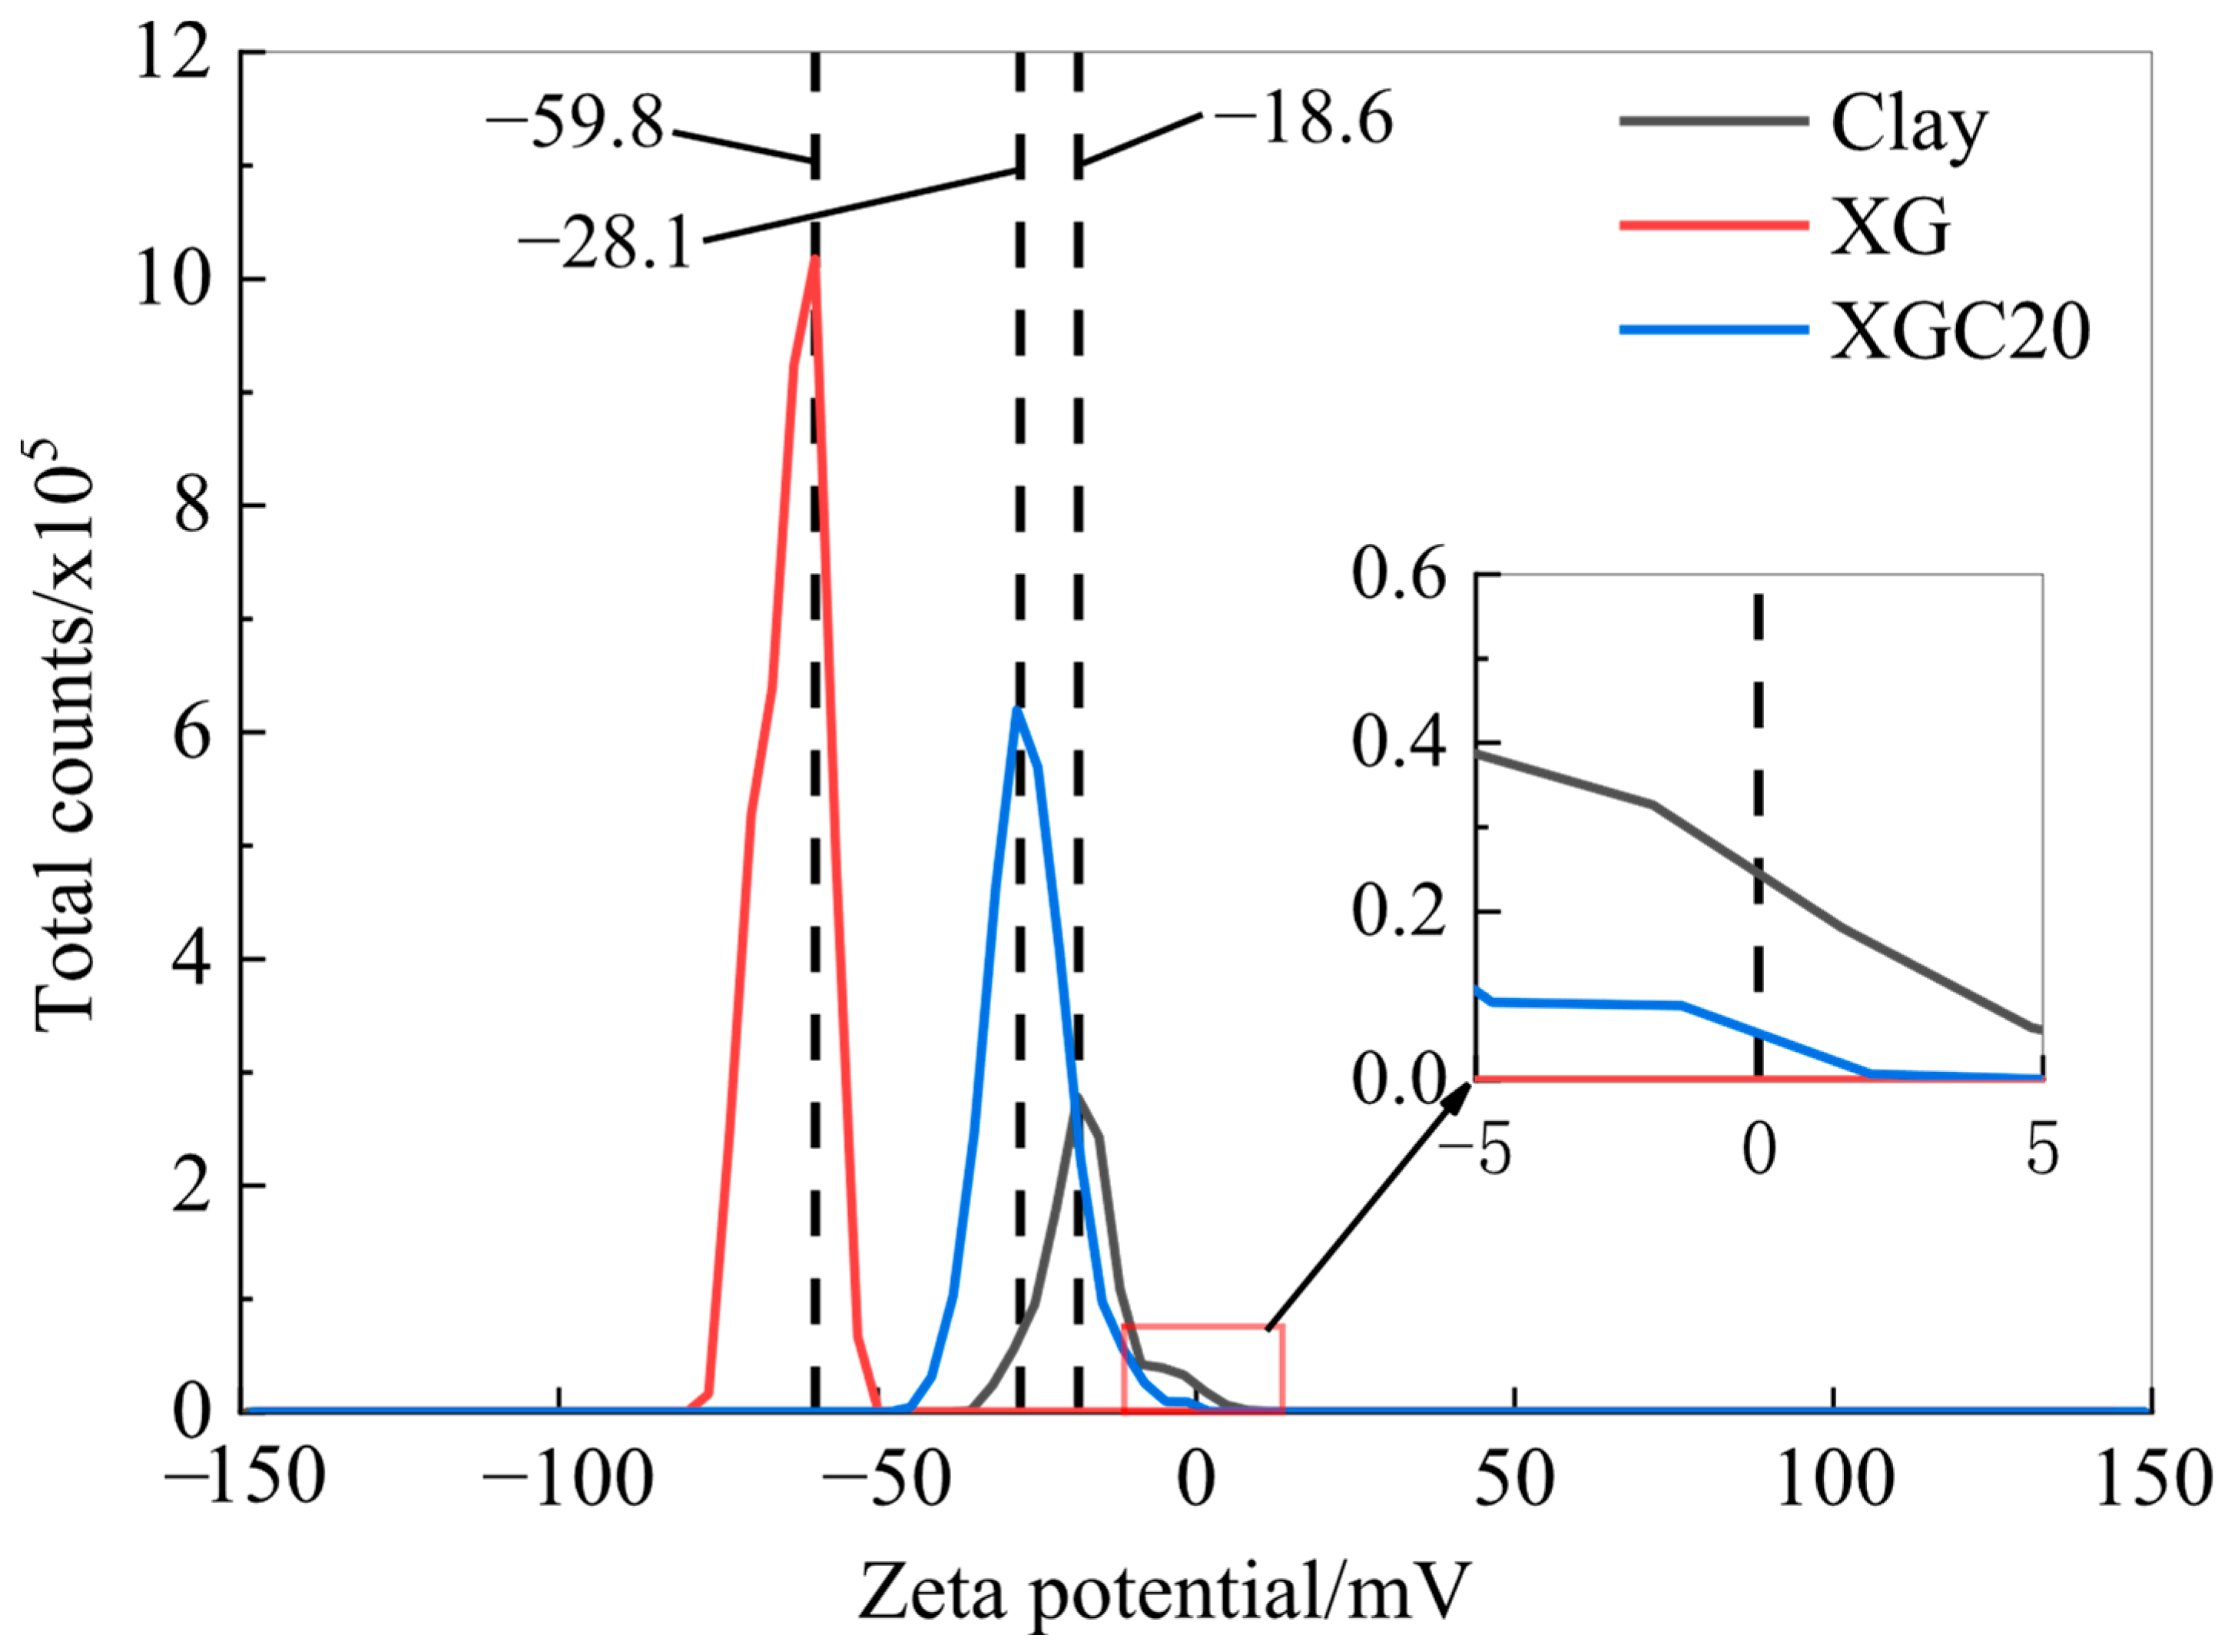
3.1. Zeta Potential Test Results and Analysis

Zeta potential analysis is an important characterization method for studying the interface interaction between pore fluids and soil particles. By measuring the potential changes in the double electric layer shear surface on the particle surface, it can effectively evaluate the electrostatic interaction between particles [37]. Figure 4 shows the Zeta potential plot of clay, XG, and XGC20; as shown, the Zeta potential values of clay, XG, and XGC20 are −18.6 mV, −59.8 mV, and −28.1 mV, respectively. The above results indicate that clay, XG, and XGC20 all carry negative charges. Among them, XG has a strong negative charge, the negative potential value of clay is relatively low, and XGC20 is between the two. This might be partly because when XG is combined with clay, part of the negative charge of XG is electrostatically neutralized by the cations in the clay, forming strong ionic bonds and hydrogen bonds, which is conducive to the aggregation of clay particles [38,39]. On the other hand, this might be attributed to the encapsulation effect of the anionic groups of XG on clay particles [40]. However, notably, due to the strong poly-anion properties of XG, the composite material still maintains a stable net negative charge [41].

3.2. Infrared Spectroscopy Test Results and Analysis

To reveal the interface interaction mechanism of composite materials, infrared spectroscopy tests were conducted in this study. Figure 5 shows the infrared spectra of clay, XG, and XGC20. Combined with the infrared spectra, the -OH stretching vibration peak appears at 3436 cm−1 [42]. The -C=O stretching vibration peak appears at 1641 cm−1 [43], and the Si-O stretching vibration peak appears at 1012 cm−1 [44]. The infrared spectroscopy analysis indicated that XG is rich in hydroxyl and carboxyl groups, which promotes the intermolecular interaction between XG and clay. The specific manifestations are as follows: The hydroxyl stretching vibration peak at 3436 cm−1 has significantly broadened and is accompanied by a slight displacement in XGC20, which is attributed to the fact that the -OH groups in the XG molecule have formed a wide hydrogen bond network with the clay surface [45]. At 1641 cm−1, the characteristic peaks of the adsorbed water of the clay itself were significantly enhanced in XG and XGC20 and shifted towards a higher wavenumber, which confirmed that the negatively charged groups in the XG molecules had electrostatic interactions with the cations at the edge of the clay [46]. At 1012 cm−1, the characteristic peak of XG was significantly weakened after being combined with clay, which directly reflected the effective coating effect of XG molecules on clay particles [47].

3.3. pH Test Results and Analysis

Table 3 shows the pH values of the XG-cured clay samples. As shown in Table 3, the pH value of the clay sample is 7.95, indicating that the clay was weakly alkaline. When XG was added to the clay sample, the pH value of the sample did not change significantly and was basically stable between 7.90 and 8.00. That is, the addition of XG did not have a significant effect on the clay’s pH value and did not cause changes in clay acidity and alkalinity. Note that after Wang et al. [48] added 7% cement to the soil with a pH value of 6.05, the pH value of the sample significantly increased, changing from weakly acidic (6.05) to strongly alkaline (10.45). That is, the addition of cement would significantly affect the acidity and alkalinity of the soil and cause adverse effects on the surrounding ecological environment. As a soil stabilizer, XG has a relatively small impact on the soil pH value and is an environmentally friendly engineering material.

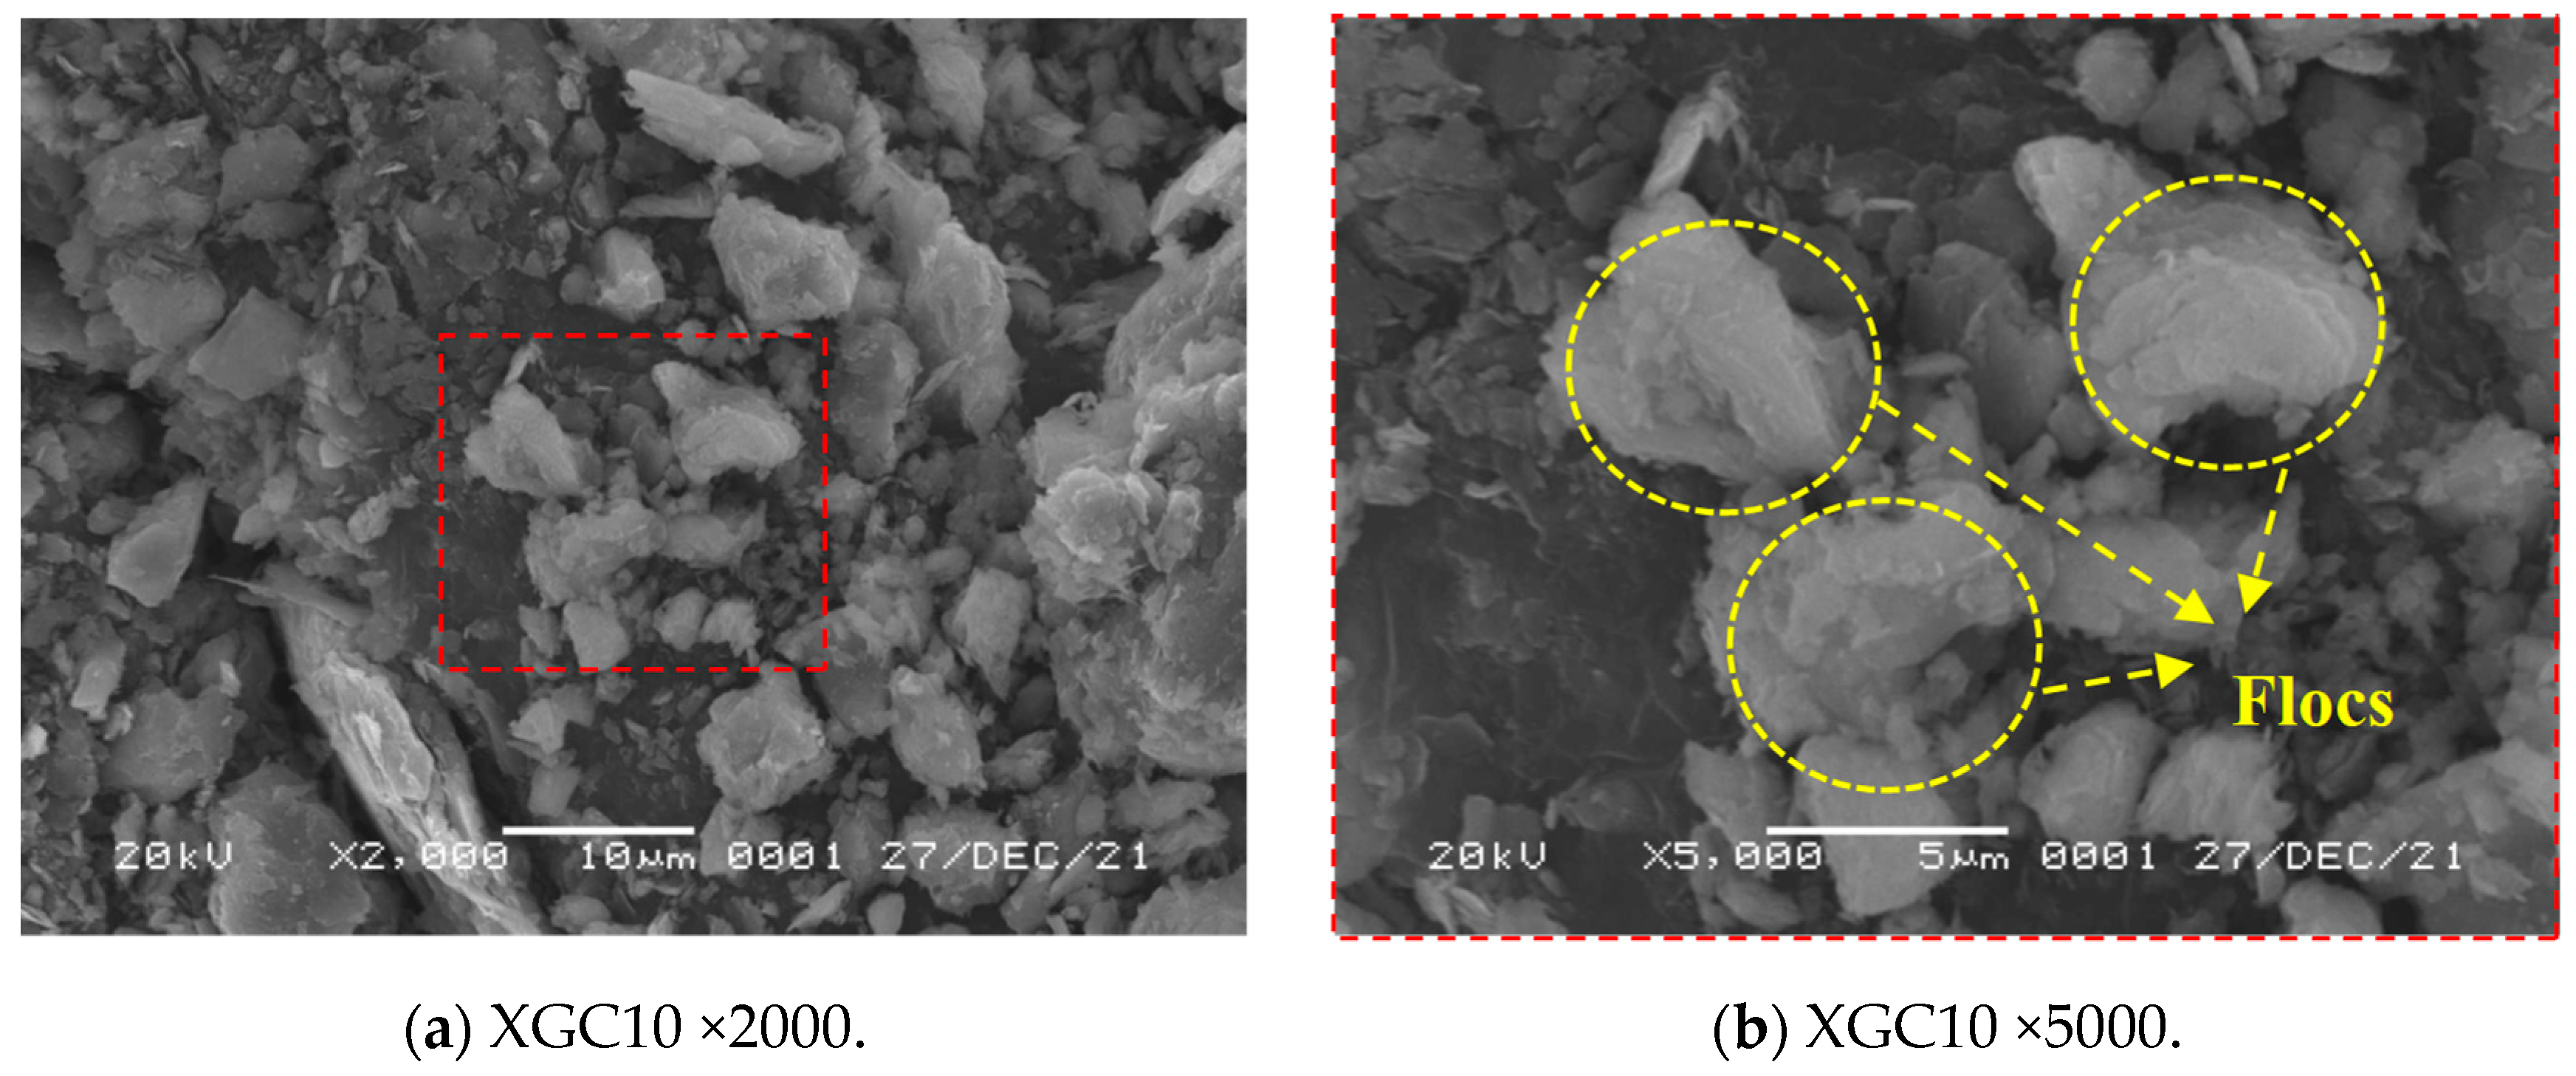
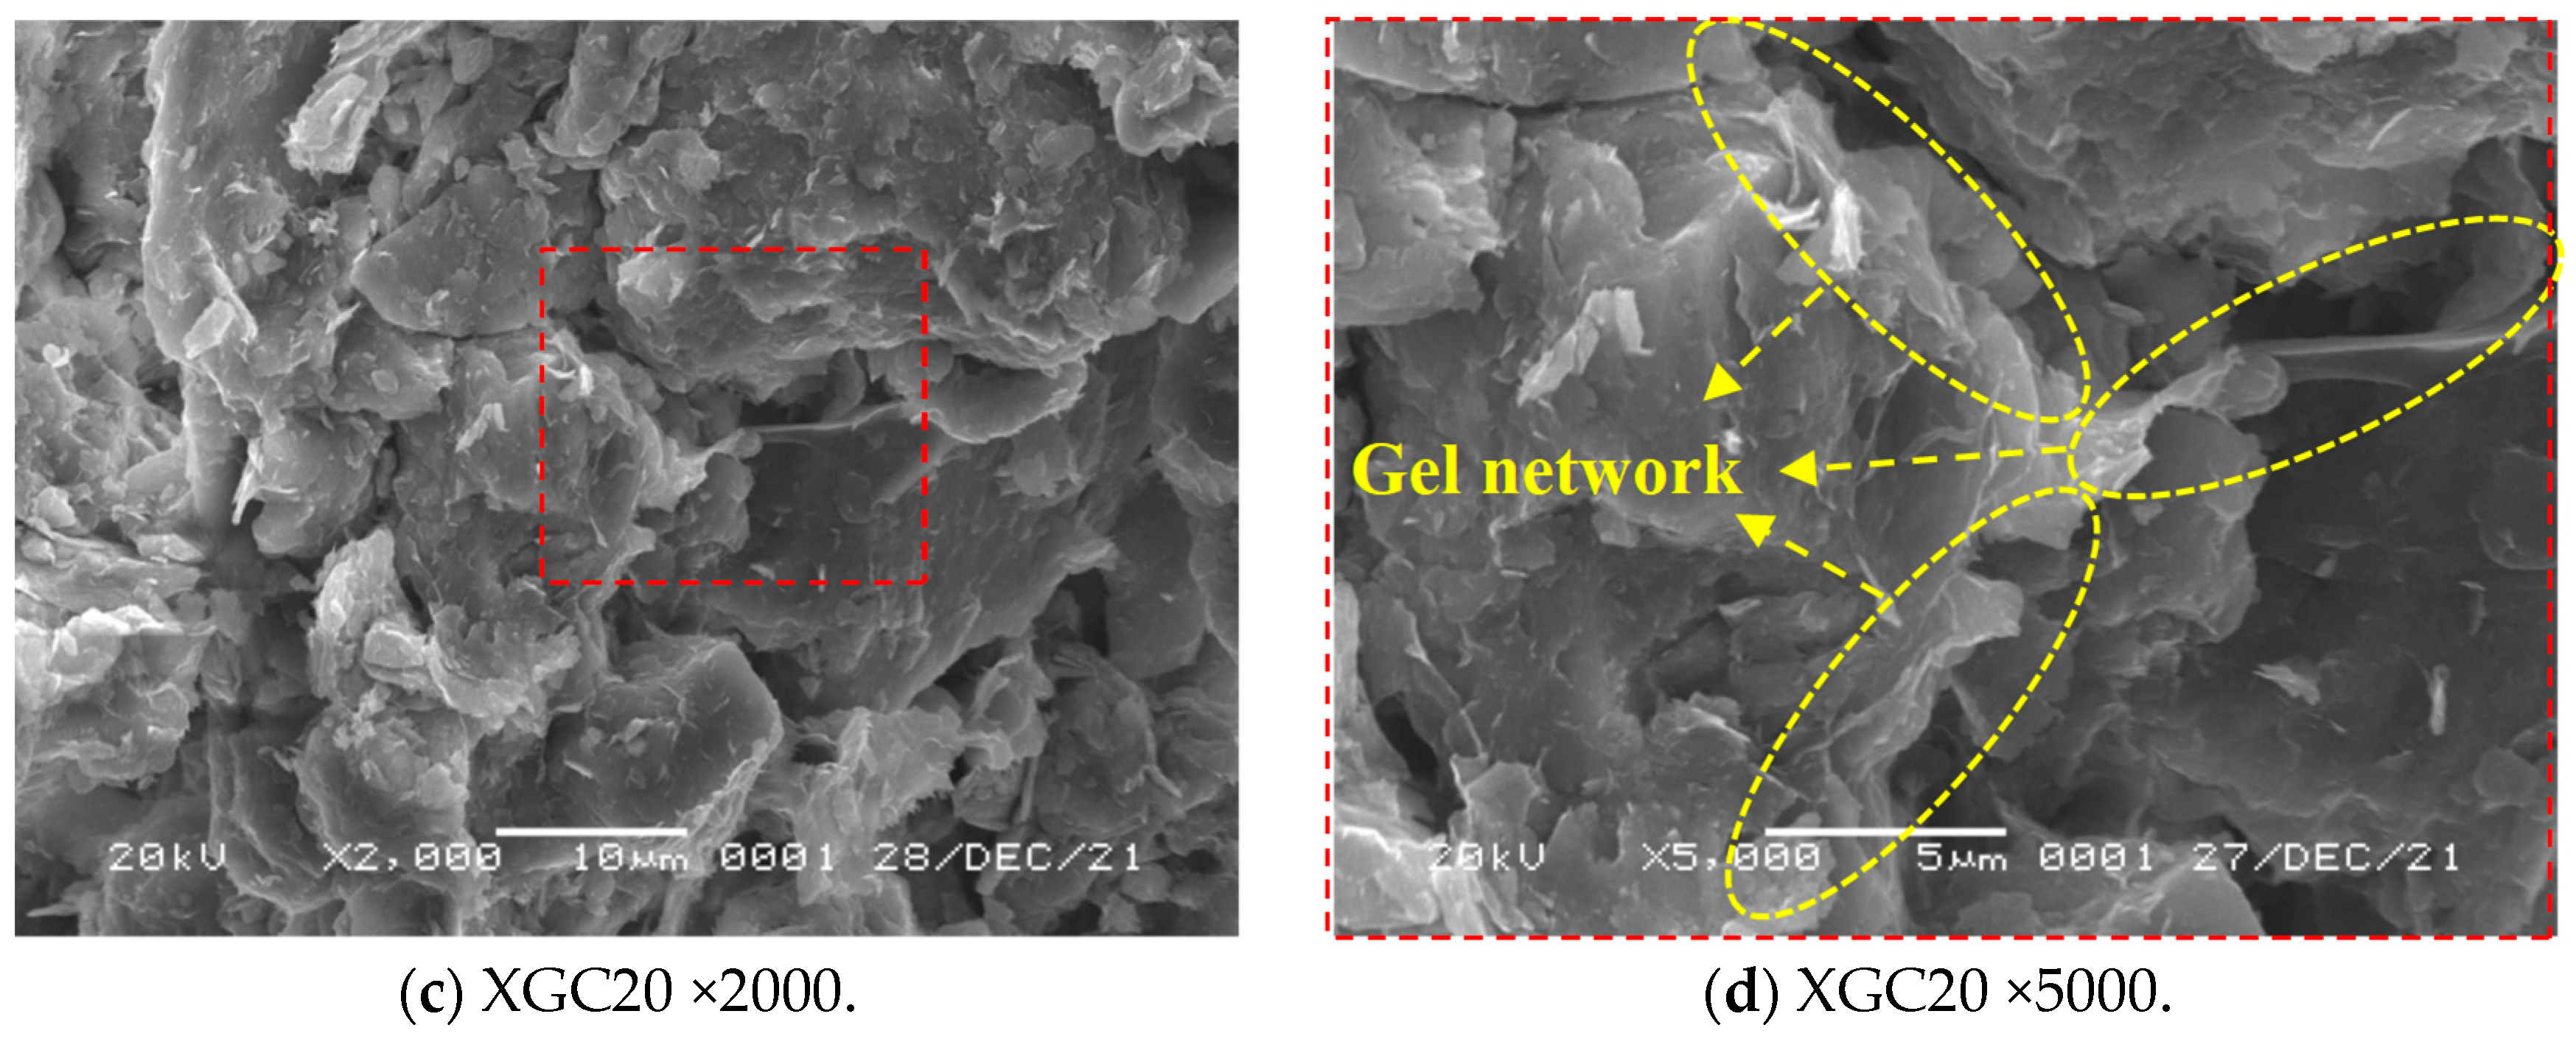
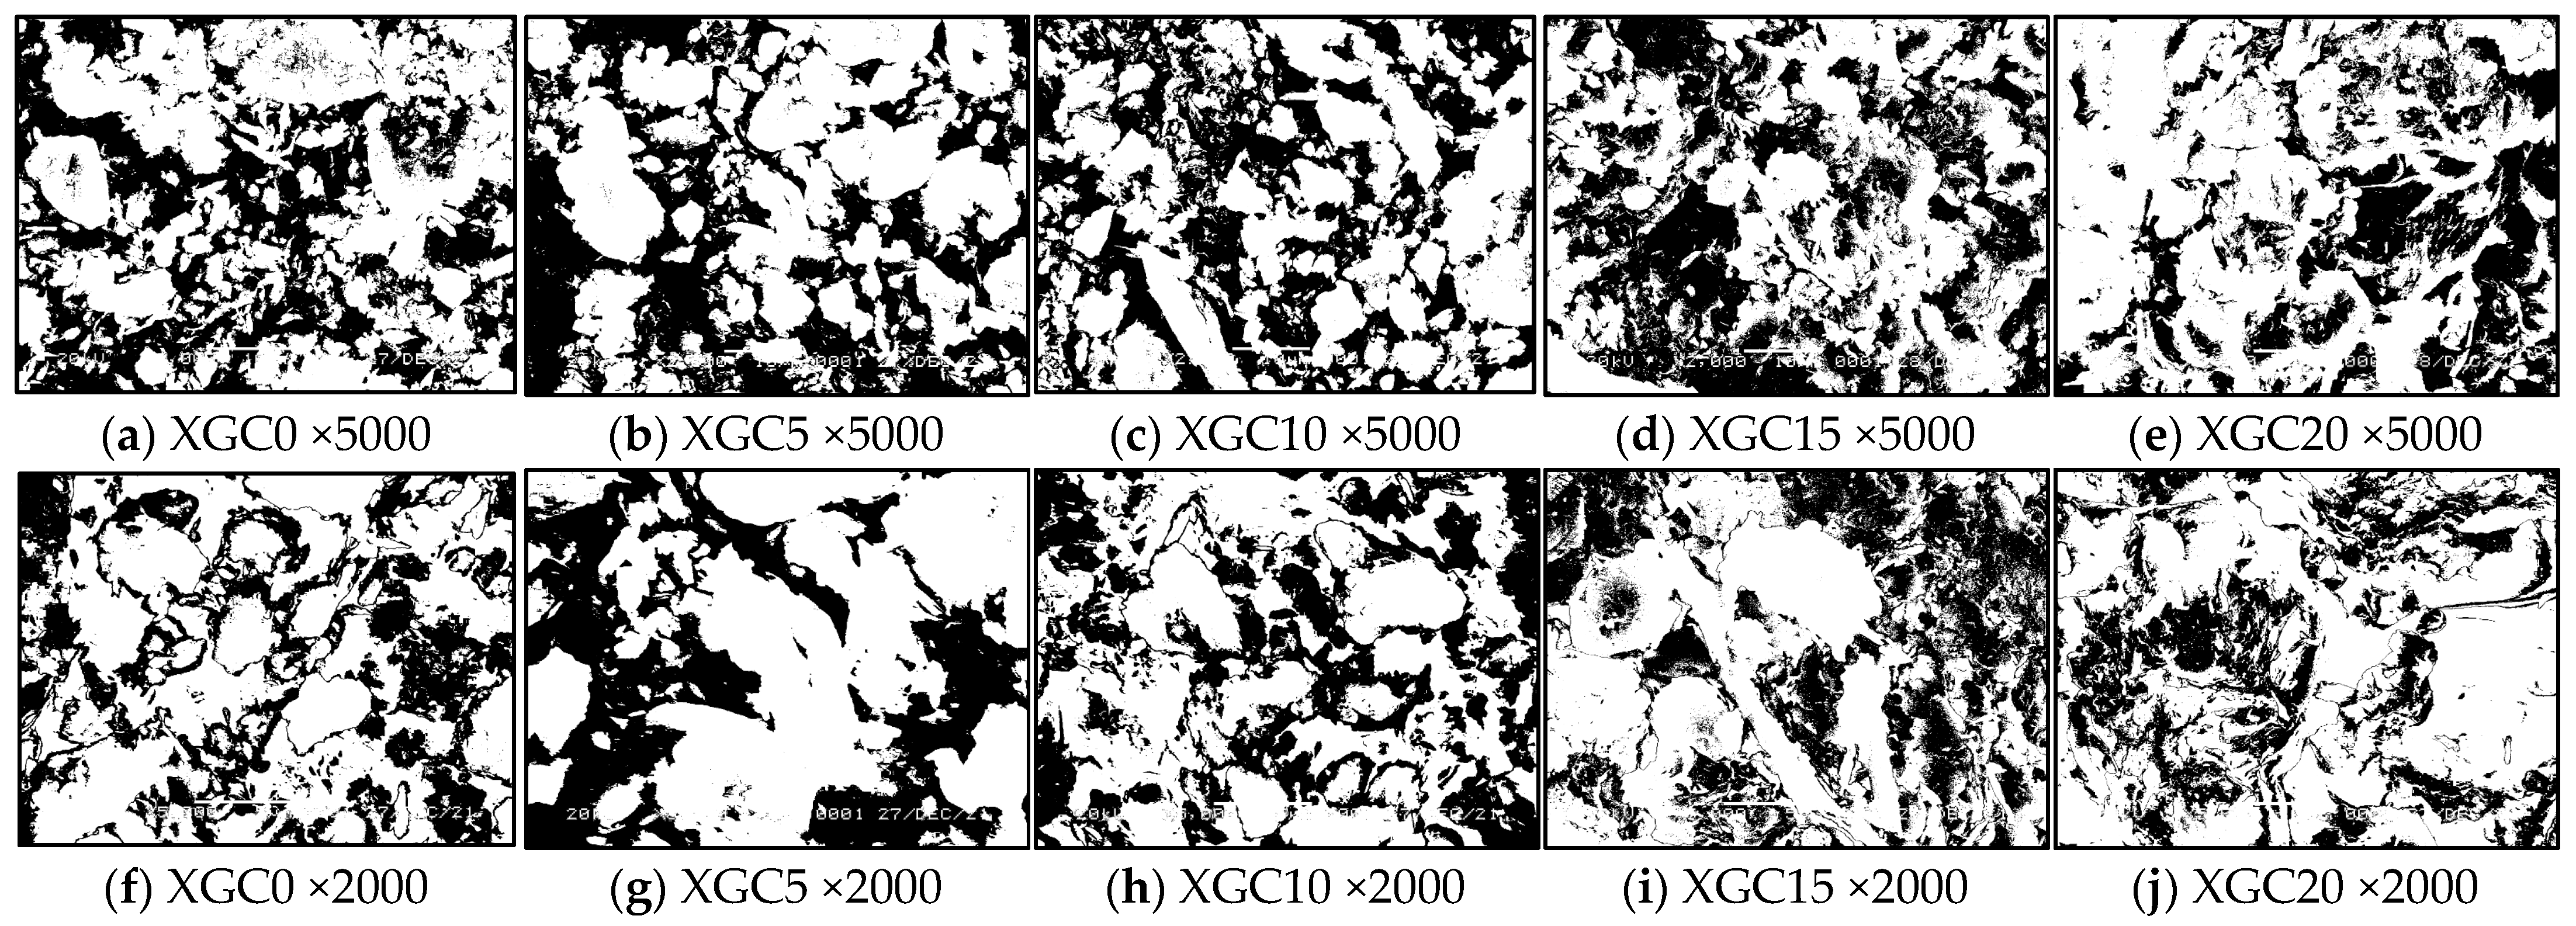
3.4. SEM Test Results and Analysis

Figure 6 and Figure 7 are the SEM images of XGC0, XGC10, and XGC20 powders at magnifications of 2000 and 5000, respectively. It is worth noting that the ×5000 images in Figure 6 and Figure 7 are derived from the red-framed parts of the ×2000, and the substances within the yellow dashed boxes are represented by the text marked in the figures. Figure 6 shows that the internal structure of the sample without XG is relatively loose, and obvious cracks and pores can be seen at a magnification of 5000. With the addition of XG, as shown in Figure 7a,b, a considerable amount of flocculated substances appeared inside the sample, and the combination between the matrices became tighter. However, the distribution of the flocculated substances was relatively loose, scattered throughout the sample. As the dosage of XG continues to increase, as shown in Figure 7c,d, the clay particles are completely wrapped by XG, and the flocculation gel and the matrix are mutually bonded, making the internal structure of the sample more compact. This is manifested in a macroscopic aspect, as the addition of XG can significantly increase the mechanical strength of the clay. The addition of XG can, on the one hand, form hydrogen bonds with charged clay, bridge the connections between clay particles, and enhance the bonding effect of the matrix [17]. On the other hand, XG has a longer and more extended structure, which can form a flocculated structure that encapsulates clay particles, enhancing the overall stability of the clay mass [45].
Figure 4 shows that the negatively charged XG exchanges electrons with some positively charged clay particles. Figure 5 shows that the XG and clay initiate hydrogen bonding after mixing, forming a suitable Xanthan–clay matrix [17]. With the increase in XG content, the matrix also expands, generating greater interaction force between the clay particles that were previously not in contact with each other, thus forming stronger cohesion inside the clay.
Bozyigit [45] used XG to solidify kaolin and showed reticular structures in their SEM images. Chang [17] studied SEM images of XG-cured sand and believed that the curing principle is to form a biofilm on the sand surface and for particles to connect with each other through a thread- or fabric-like XG fiber matrix to improve its strength. Sujatha [18] believed that XG formed dense biofilms and hydrogels in soil pores to improve the mechanical properties of the soil. The solidified forms of XG in different soils are slightly different; essentially, the hydrogel produced by XG encapsulates the soil particles and forms a matrix of XG particles, bridging more soil particles and improving the inter-soil particle size. The interaction force is manifested as the increase in soil cohesion at the macroscopic level [47,49]. Notably, in this study, the flocs formed by XG were more distinct in shape than the XG particle matrix in the aforementioned literature, and there was also a significant increase and enlargement in both quantity and shape. This is because a higher dosage of XG was used in this study, making it easier for them to aggregate and encapsulate clay particles within the samples.
In SEM imaging, there is an apparent distinction between soil particles and pores, so the porosity can be measured and analyzed by separating soil particles or pores. The black-and-white binary analysis method was introduced, and the SEM image was adjusted to black and white to distinguish soil particles from pores. Soil particles were marked as white, pores were marked as black, and a black-and-white binary map was prepared [50], as shown in Figure 8. The porosity was calculated according to the black-and-white binary diagram, as shown in Formula (1) below:
p = A p A × 100 % ,
In Formula (1), P is the porosity, A is the overall area (μm2) of the SEM image, and Ap is the partial area (μm2) of the black pores in the SEM image. According to Formula (1), the porosity of different XGC samples at 5000 times and 2000 times magnification was calculated, and the average porosity was obtained through the weighted average algorithm, as shown in Formula (2). The results are shown in Table 4.
x ¯ = x 1 f 1 + x 2 f 2 + + x n f n 1 n f i ,
In Formula (2), x ¯ is the average porosity, and fi is the weighted average. The SEM image magnified by 5000 times is 1, and the weight of the SEM image magnified by 2000 times is 0.4.
As shown in Table 4, with the increase in XG content, the porosity of the samples gradually decreases. The porosity of the control group without XG is 26.58%, and when the XG content is 20%, the porosity of the samples is 12.92%; the porosity of the latter is 52% lower than that of the former. This might be because, on the one hand, XG can form hydrogen bonds with the clay, increasing the adhesion between the matrices and making them more compact [46]. On the other hand, XG can also wrap clay particles and fill the pores of the sample, thereby reducing the porosity of the sample and increasing its mechanical strength [47].

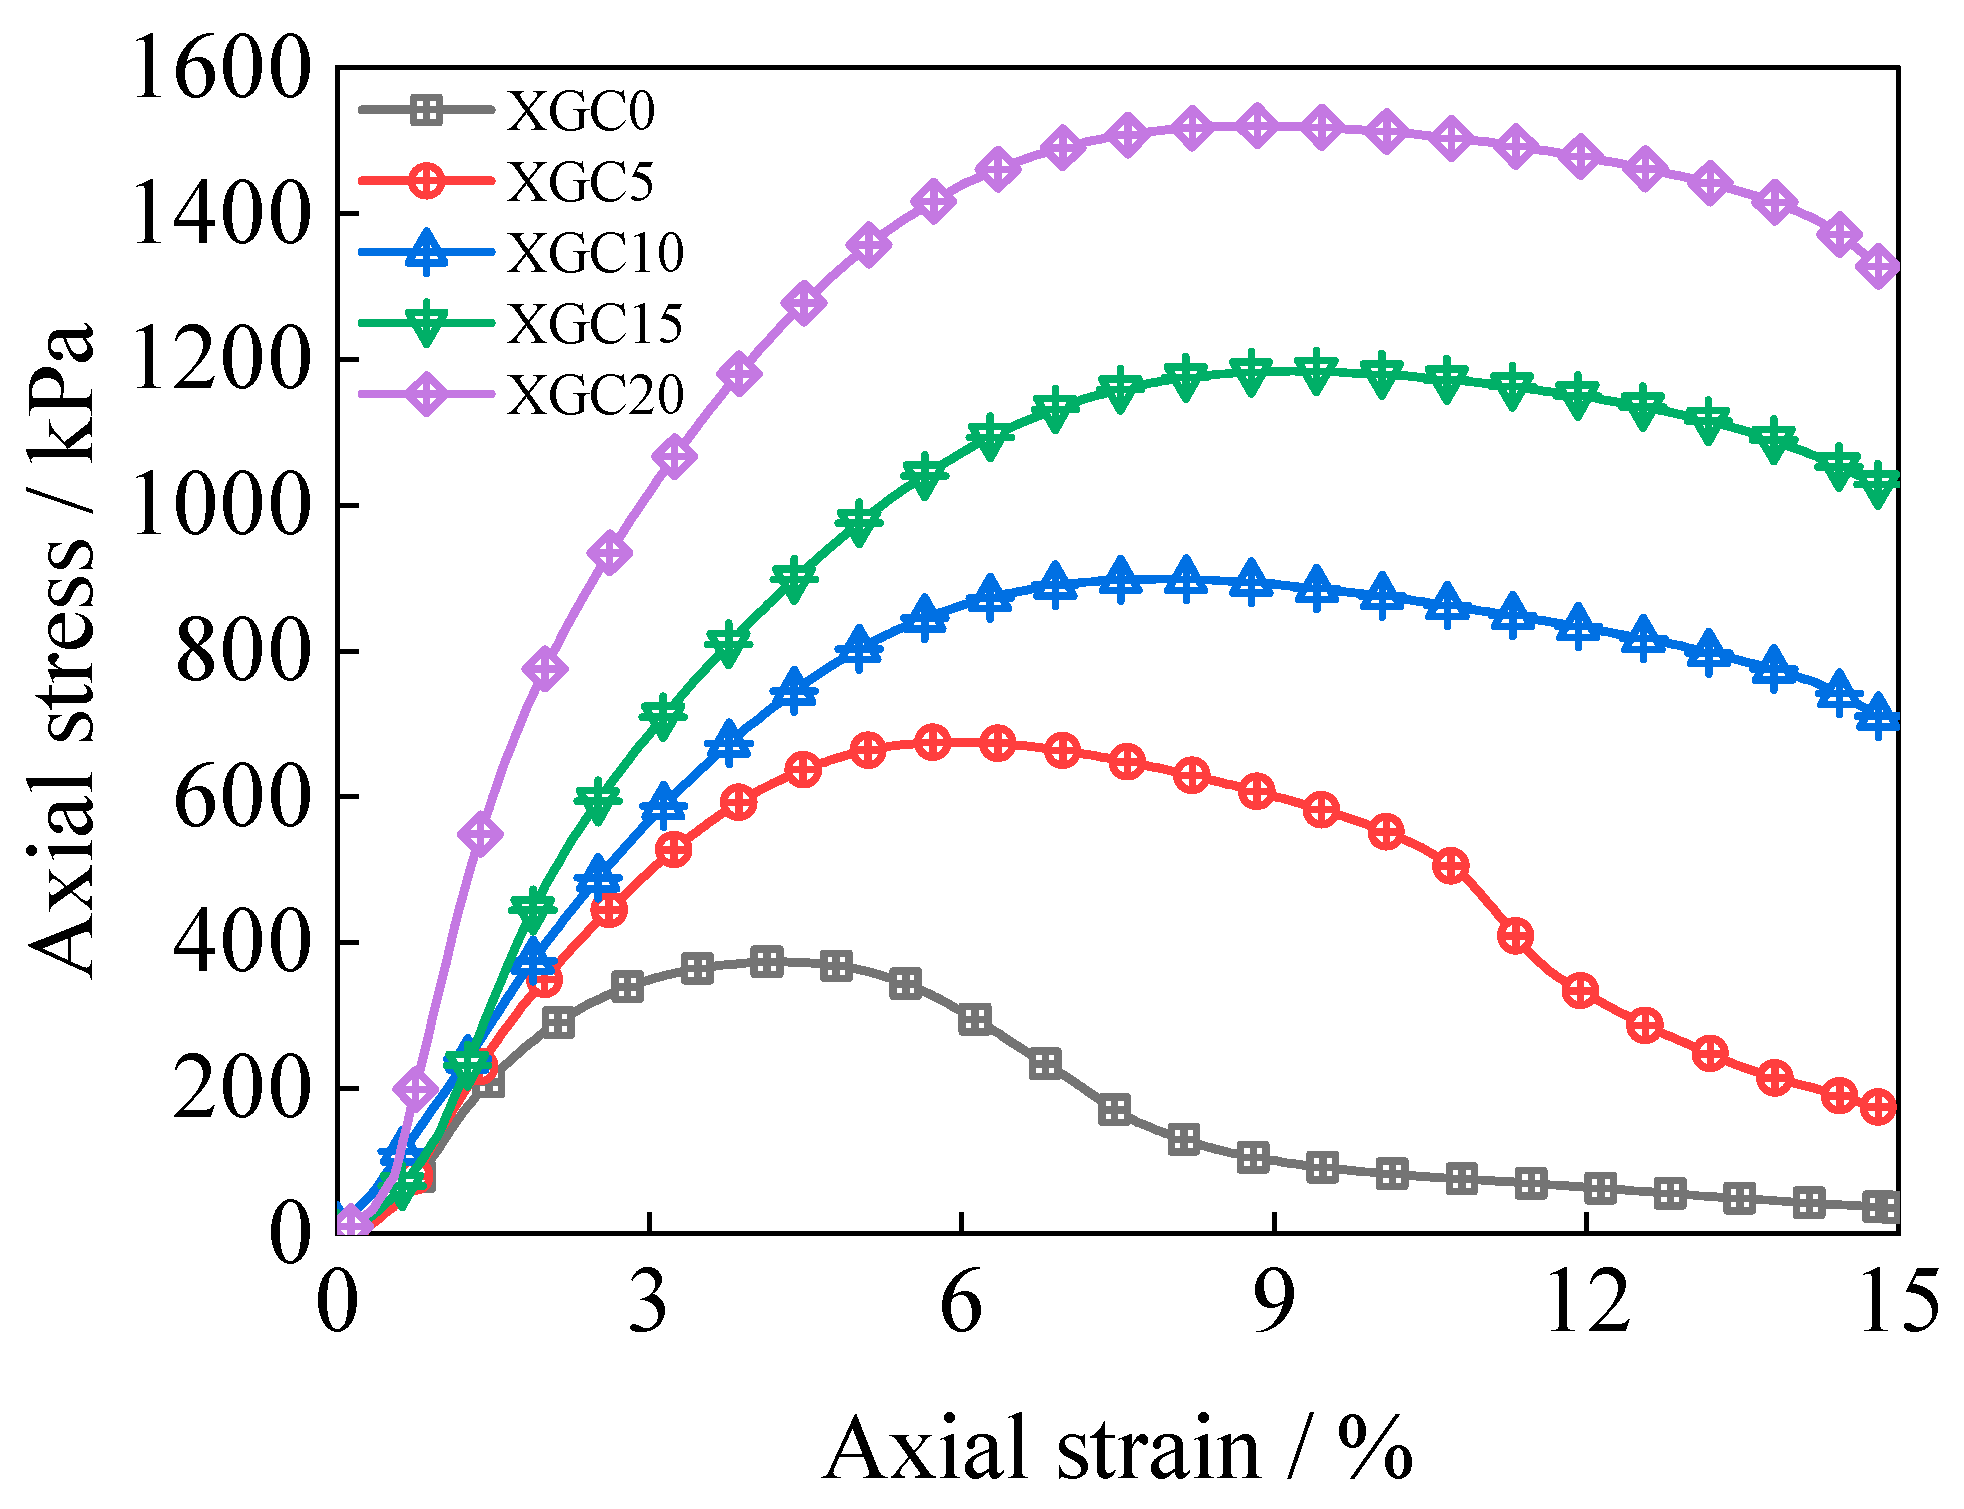
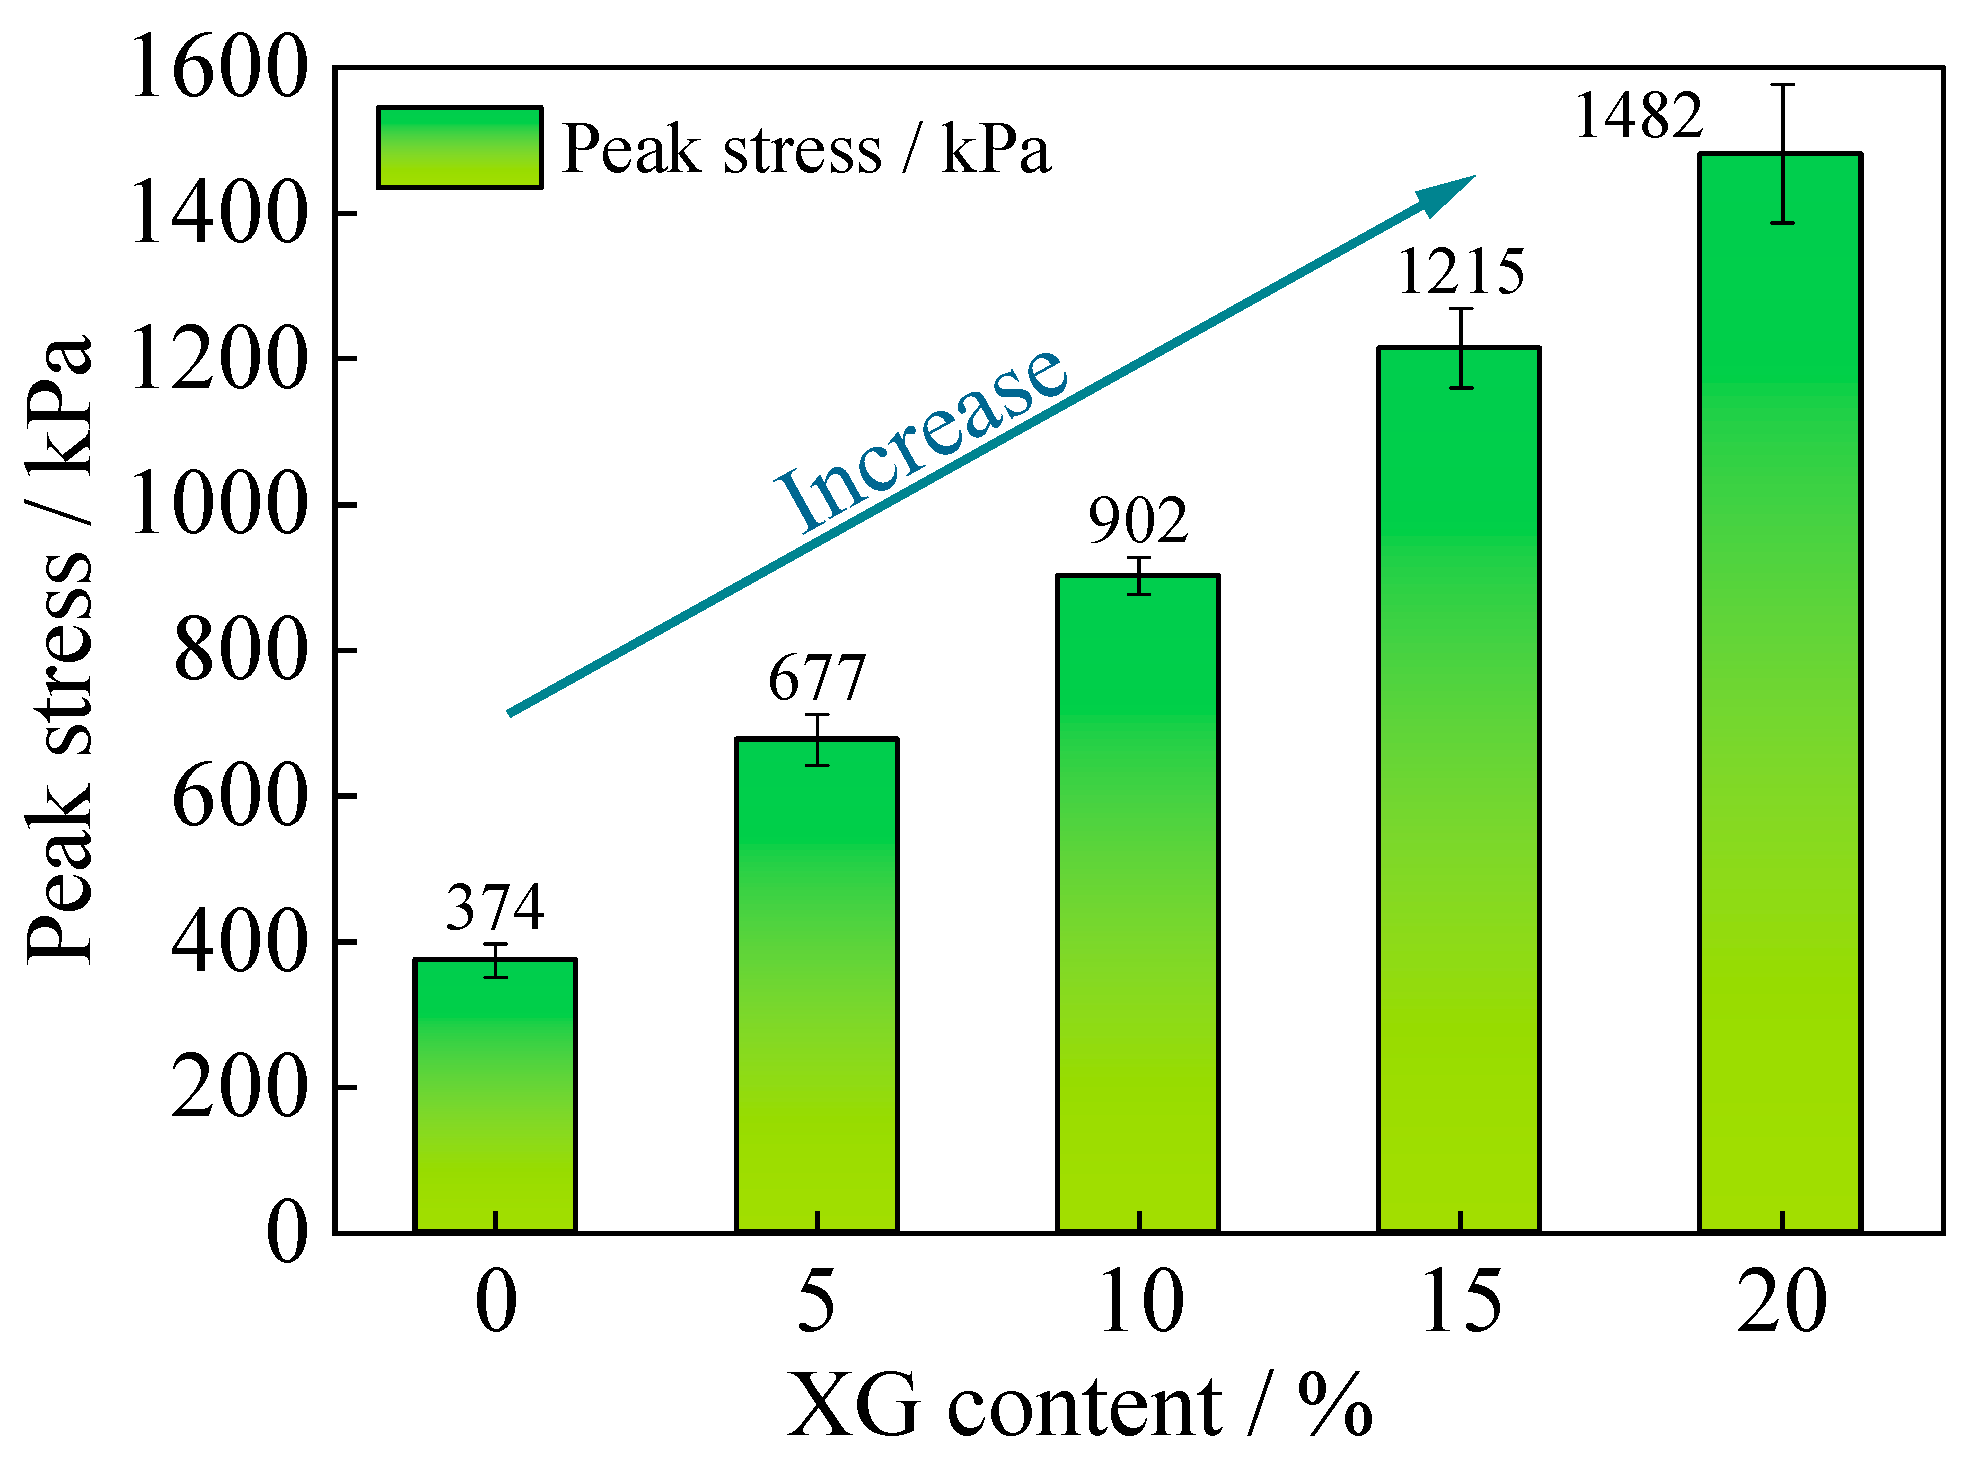
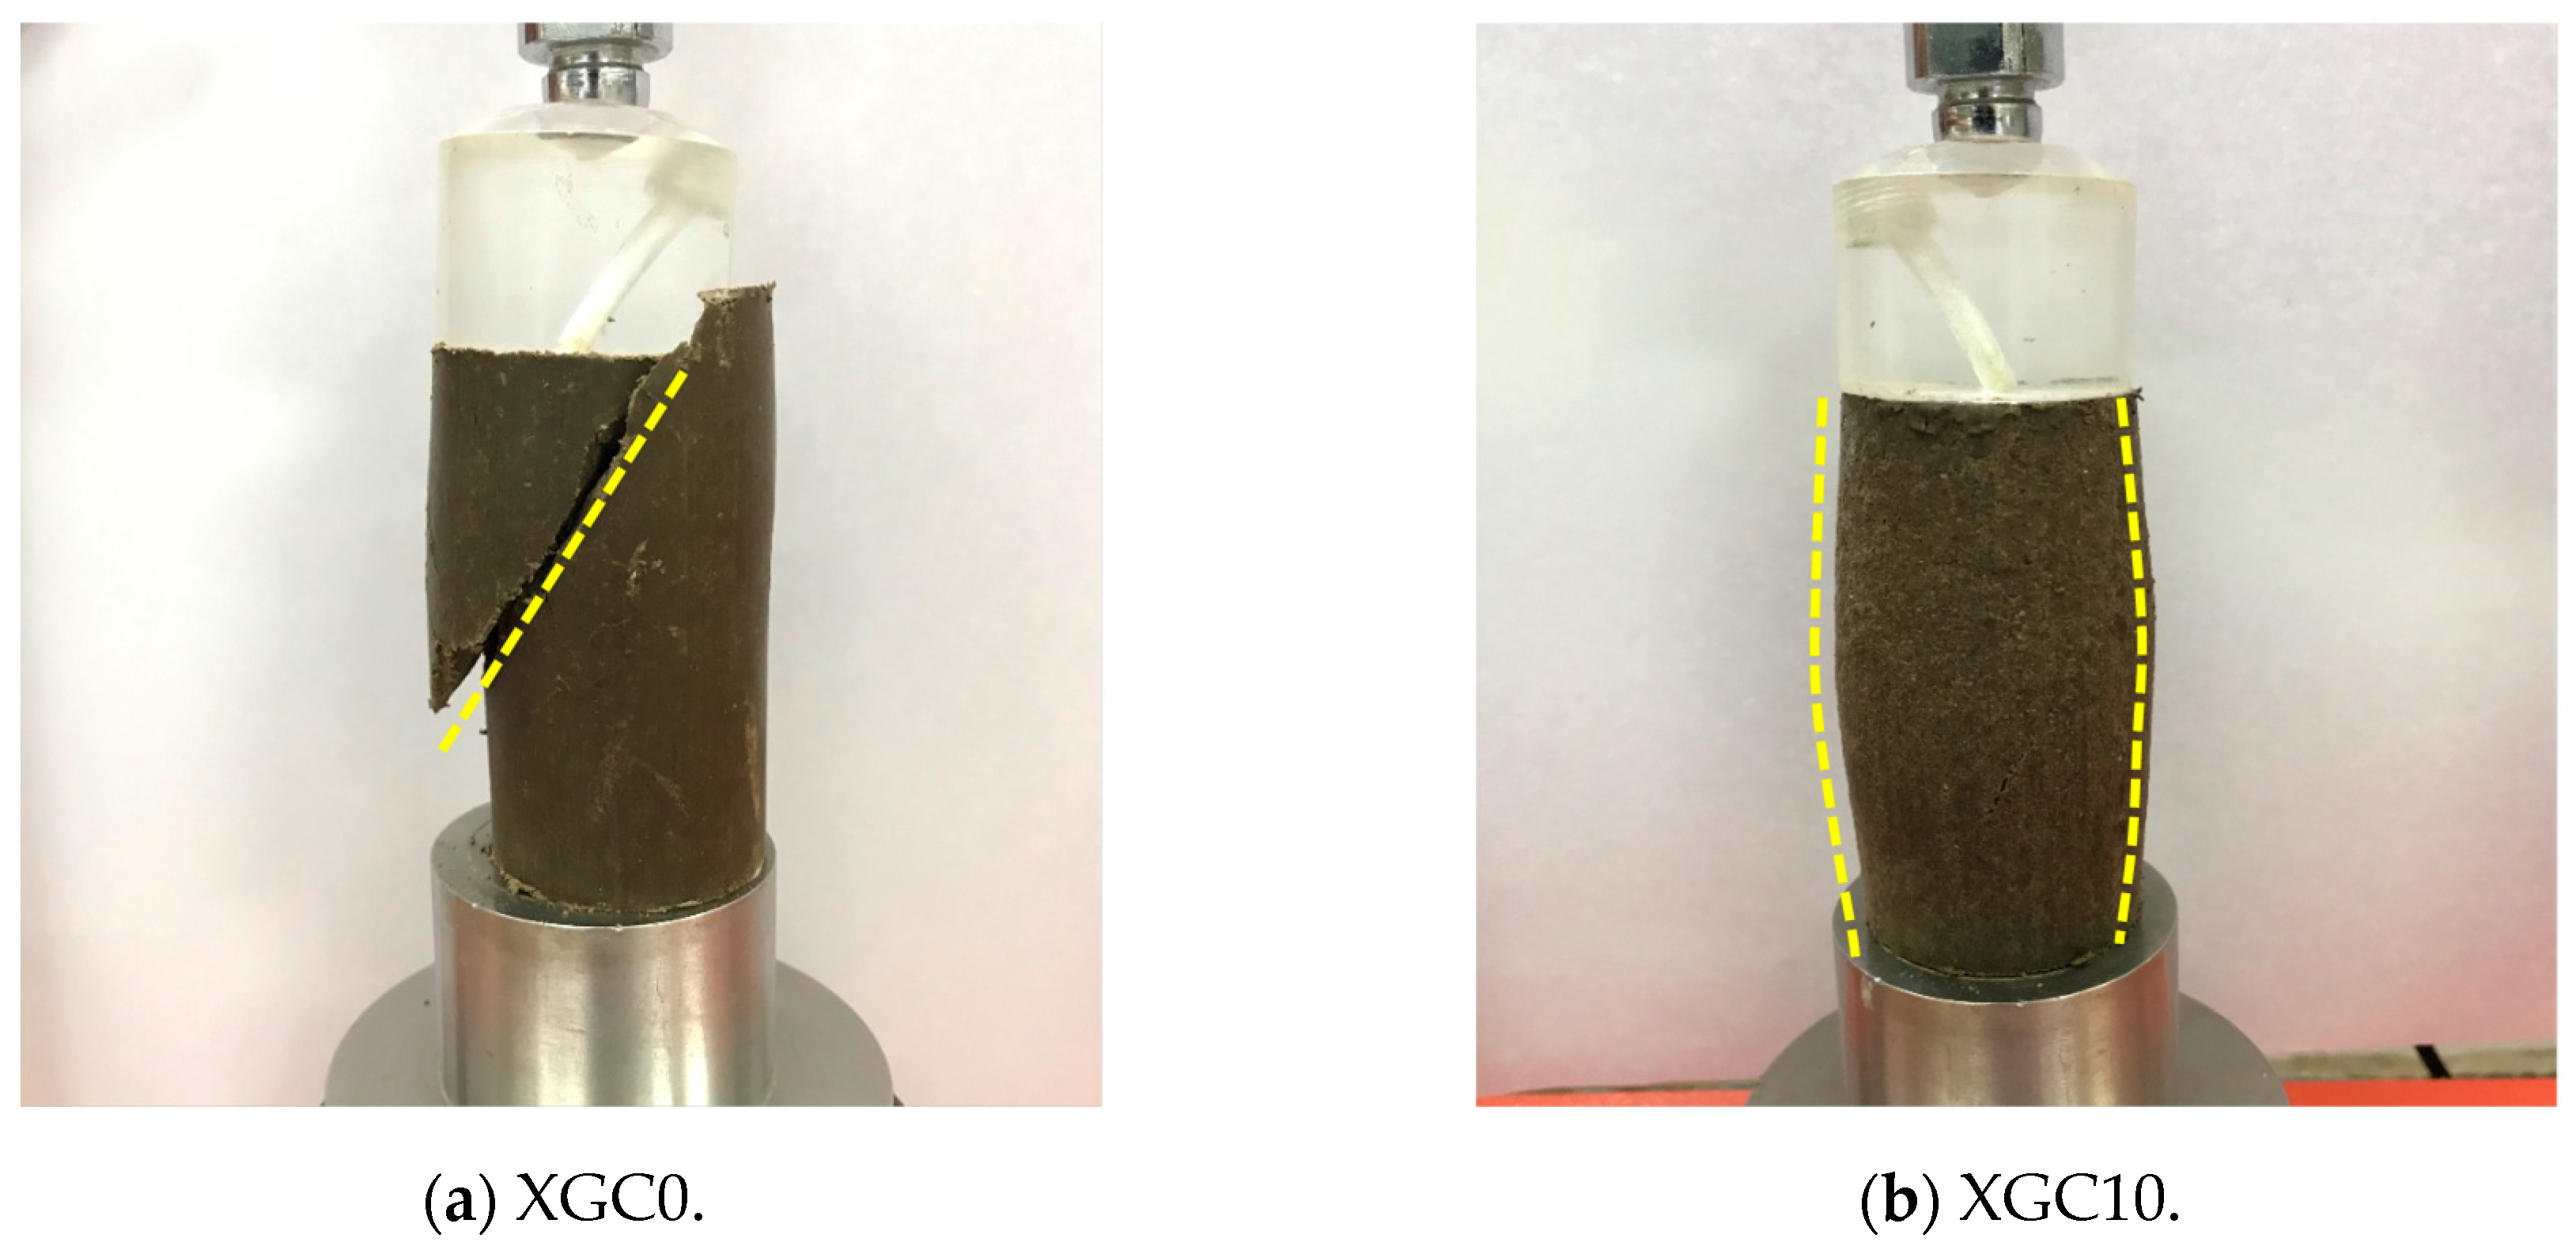
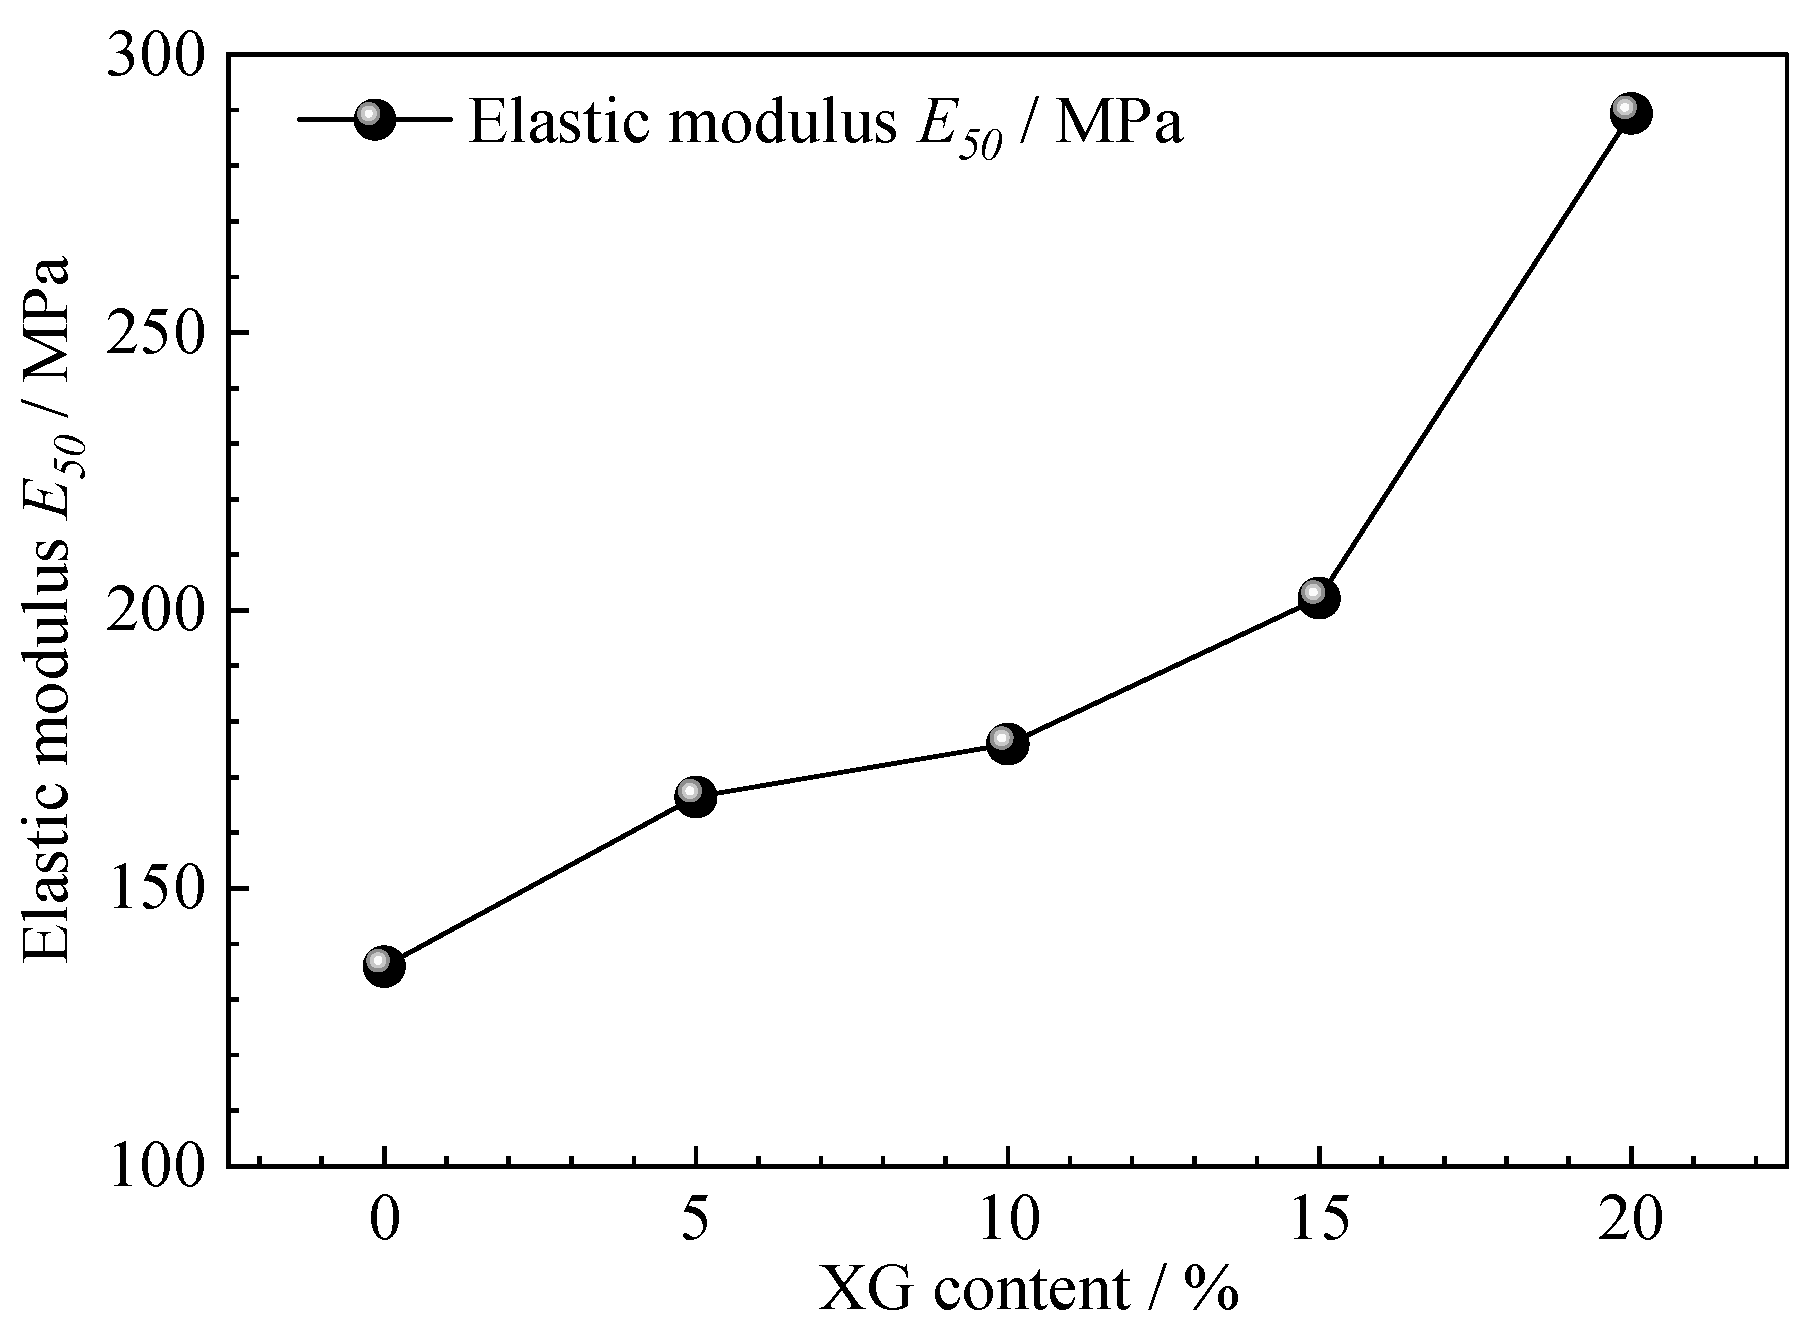
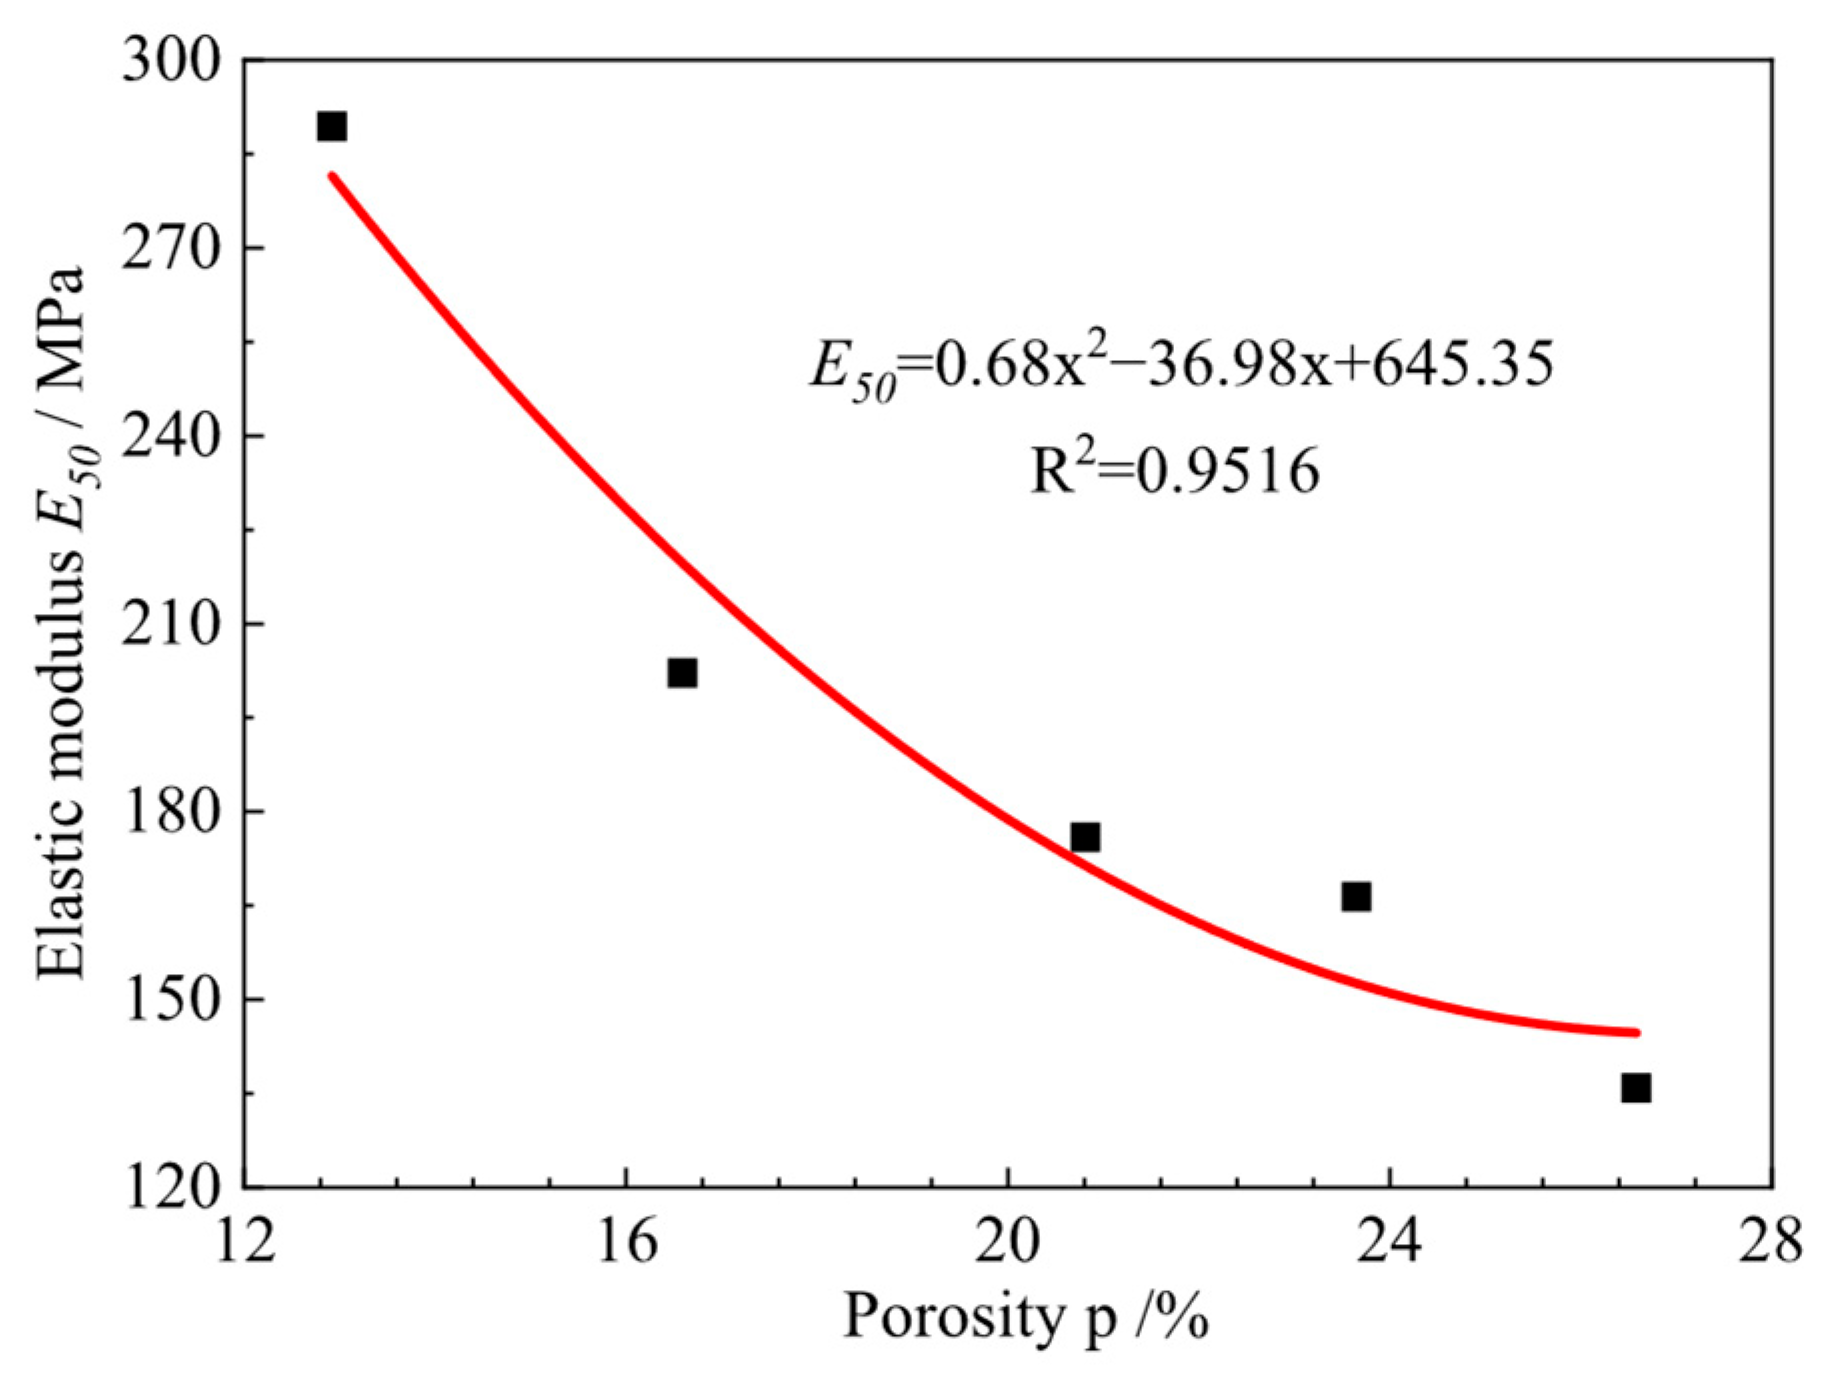
3.5. Results and Analysis of Unconfined Compression Test

Figure 9 shows the stress–strain curves of the XGC samples, and Figure 10 presents the histogram of XG content and peak strength. Figure 9 shows that the addition of XG causes the axial stress of the specimen to increase significantly with the increase in strain in the initial stage. After reaching the peak, the rate of decrease gradually slows down, and the stress–strain curve of the specimen gradually changes from the softening to hardening type. Figure 10 shows that as the XG content increases, the UCS of the sample gradually increases. The initial UCS of the clay is only 374 kPa. When the content of XG is 20%, the UCS of the sample increases to 1482 kPa, which is 296% higher than the former. The UCS of the other groups was also significantly improved compared with the benchmark group without XG. XGC5, XGC10, and XGC15 increased by 81%, 141%, and 225%, respectively. The reason for XG increasing the sample’s UCS may be that XG can undergo charge exchange and hydrogen bonding with clay in the sample, generating a flocculated XGC matrix [51]. With the increase in XG content, the Xanthan–clay matrix expands, and the matrix aggregates together to fill the pores between the clay, thus improving the compressive strength of XGC samples. The XG–clay matrix has a certain elasticity and forms a gel network inside the sample, which increases the stability of the sample and does not negatively affect the strength of the sample due to failure deformation. With the increase in XG, the failure curve therefore gradually develops into a hardening curve [52].
Table 5 shows that the reinforcement effects of XG on different soils vary significantly: the strength increase in silt sand is the highest (400%), followed by kaolin (276%), silty soil (133%), and red soil (113%). Notably, there have been significant differences reported on the effect of clay: the literature reports only a 31% increase at a dosage of 1.5%, while in this study, it can reach 296% at a dosage of 20%. This difference mainly stems from two aspects: one is the dosage effect, and the other is the difference in the characteristics of the clay itself (such as mineral composition and moisture content). The results show that the soil type is the key factor determining the reinforcement effect of XG.
Figure 11 shows the typical failure morphology of the XGC sample. Figure 11a shows that the XGC0 sample formed a crack during failure. Figure 9 shows that the sample strength decreases rapidly due to the occurrence of cracks after the XGC0 sample reaches the peak value. Figure 11b shows that the XGC10 sample changed from shear failure to swelling failure. Figure 9 shows that the XGC10 curve was in a state of slow decay in strength after reaching the peak UCS. Curing clay using XG can improve its ductility and allow it to bear greater loads and retain a specific load-bearing capacity after reaching the ultimate load it can bear.
We recommend the reader refer to the “JTGT F20-2015 Technical Specifications for Construction of Highway Pavement Base Courses” standard [57] and compare the strength differences between XG-cured clay and inorganic binders. The inorganic binder should meet the standard of UCS at 7 days of age. The 7-day UCS standard of cement-stabilized material, lime-stabilized material, and lime fly ash-stabilized material is 1 MPa, 0.5 Mpa, and 0.5 MPa, respectively. The 7-day unconfined strength of XGC10 and XGC15 is 902 kPa and 1215 kPa, respectively. To ensure the engineering structure can remain stable and safe under various adverse conditions, according to the Chinese standard JTG D30-2015 [58], the safety factor of the subgrade design is determined as 1.25. Under this safety factor, the XG-cured clay remains insufficient and cannot replace the cement-stabilized material temporarily in terms of strength, but it can replace lime-stabilized materials.
The elastic modulus E50 [48] was introduced to study the influence of XG on the elastic modulus of clay, and the elastic modulus of different XGC samples is summarized and compared. The calculation formula is shown in Formula (3), and the results are shown in Figure 12:
E 50 = Δ σ Δ ε ,
where E50 is the elastic modulus, ∆σ is the stress value when 50% of the peak stress is reached, and ∆ε is 50% of the peak strain corresponding to peak stress.
Figure 12 shows that the elastic modulus of the XGC sample increases with the increase in XG incorporation. The elastic modulus of the XGC5, XGC10, XGC15, and XGC20 samples is 1.2, 1.3, 1.5, and 2.1 times higher than that of XGC0, respectively, indicating that the addition of XG enhances the hardness of clay and increases its elastic modulus.
Based on the test results of five parallel samples in each group, the relationship between the elastic modulus and porosity of the samples was obtained through calculation and fitting, as shown in Equation (4). With the increase in XG content, the sample’s porosity decreases and the sample’s elastic modulus increases, so the porosity is inversely proportional to the elastic modulus. The quadratic function can show a trend of decreasing first and then increasing, and the fitting accuracy is better. The descending stage conforms to the trend of an inverse function, so the quadratic function is used to fit it. After fitting, R2 = 0.9516, and the fitting accuracy is higher.
In Figure 13, the relationship between porosity and elastic modulus E50 of the XGC sample is as follows:
E 50 = 0.68 x 2 36.98 x + 645.35 .

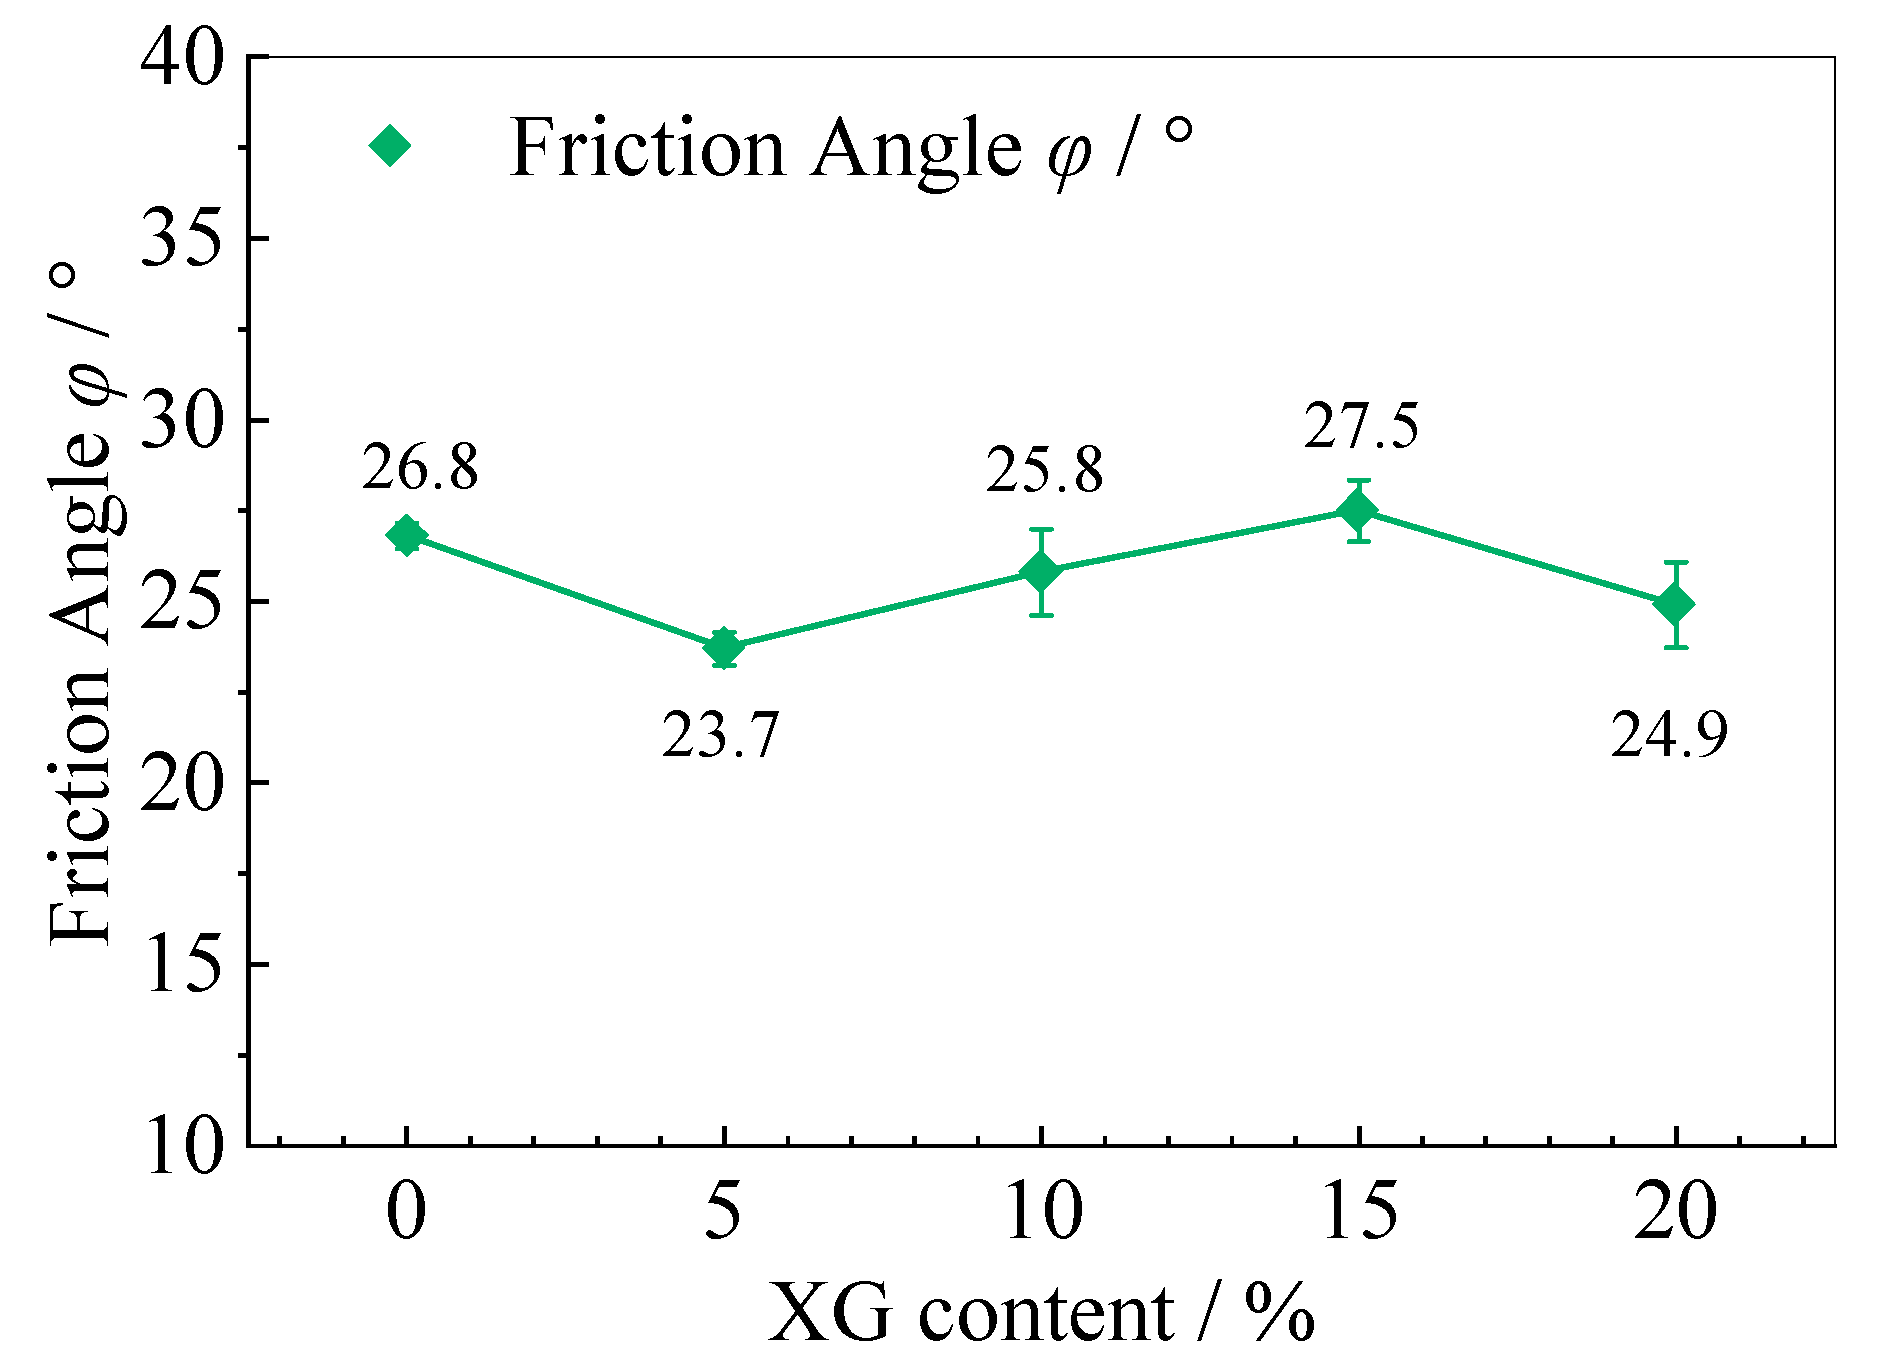
3.6. Triaxial Shear Test Results and Analysis

Figure 14 shows the strain–deviatoric stress curves of the XGC samples under confining pressures of 100 kPa, 200 kPa, 300 kPa, and 400 kPa. As shown in the figure, under different confining pressures, the peak strength of deviatoric stress increases with both the increase in the XG content and the increase in the confining pressure of the XGC samples with various contents. The XGC sample developed from exhibiting a hardening curve to a softening one with the incorporation of XG. XG combined with clay forms flocs, filling the pores between clay and cementing the clay. Simultaneously, a more stable particle bridge is formed through the exchange of electrons to improve the strength of the clay. The failure curve of the XGC0 sample under the action of confining pressure is a hardening curve, while the XGC5, XGC10, XGC15, and XGC20 samples have softening curves under the action of confining pressure. According to the confining pressure effect, it can be explained that the XGC0 sample changes from brittleness to ductile failure with the increase in confining pressure. The XGC5, XGC10, XGC15, and XGC20 samples become softening curves with the increase in confining pressure due to the pseudo-plasticity of XG [17]. Under the action of high shear force, the viscosity will drop sharply.
The Mohr–Coulomb theory was used to calculate the shear resistance index. The XGC10 sample was selected as a typical model to draw the Mohr–Coulomb circle, as shown in Figure 15, and its shear strength index cohesion c and internal friction angle φ were calculated.
Figure 16 is a bar graph showing the relationship between XG content and cohesion. Figure 17 is a line graph showing the relationship between XG content and the friction angle. It can be found that the content of XG has a significant effect on the cohesion of the XGC samples but has little effect on the friction angle. The more XG added, the stronger the cohesion of the XGC samples.
The effect of XG to solidify the clay is mainly achieved by improving the cohesion within the clay. The XG and the clay form a flocculent XGC matrix, which increases the interaction force between the XG and the clay. A gel-like network is formed, which makes the particles more tightly bound together, thereby improving the cohesion in the clay [59].
In addition, to evaluate the significance of the differences between the mixtures, we conducted a statistical analysis on the internal friction angles of the tested samples in each group and obtained the average, variance, and standard deviation of the internal friction angles of the five groups of samples. The specific data are shown in Table 6, showing that the average internal friction angle of each group of samples is 25.7°, with a standard deviation of 1.51°. Notably, the change in internal friction angle between each group of samples is not significant, and the dispersion is small. This study, therefore, suggests that the addition of XG will not significantly affect the internal friction angle of the sample.
XG can solidify and strengthen various soils, but compared with coarse-grained soil, fine-grained soil shows a better enhancement effect [26]. For sand, an XG biofilm is formed on the surface of the sand after XG curing, and the formed viscous hydrogel fills the pores, thereby increasing the cohesion [28,60]. For loess, XG is cationically bonded to soil particles through carboxylic acids and hydroxyl groups to increase cohesion [29]. Table 7 shows the comparison between the triaxial shear test of different types of soils cured by XG and this test. It can be seen from the table that the enhancement range of the shear strength of different types of soil by XG is different.

4. Conclusions

This study mainly explores the effects of different XG dosages on the microscopic mechanism, pH value, and mechanical properties of clay through Zeta potential, infrared spectroscopy, SEM, UCS, and triaxial shear strength tests. The obtained conclusion can provide a theoretical reference for the application of XG in soft clay reinforcement projects. The main conclusions are as follows:
(1) The addition of XG not only causes charge exchange in the clay to form hydrogen bonds but also promotes the bonding between the matrices and reduces the porosity of the sample. XG can cause electrostatic reactions such as ion bridging and charge neutralization in the sample, combine with clay particles to form an XGC matrix, fill the pores between clay particles, and increase the compactness of the sample.
(2) The addition of XG will not affect the pH value change in the clay. Compared with cement-reinforced clay, XG, as a soil stabilizer, can not only increase the mechanical strength of clay but also reduce the harm of clay alkalinity. It is a very eco-friendly soil reinforcement material.
(3) The addition of XG can significantly enhance the UCS and cohesion of the specimen, but it has a relatively small impact on the internal friction angle. When the XG content was 20%, the UCS of the sample was 1482 kPa, and the cohesion was 852 kPa. Compared with the control group without XG addition, the increase was 296% and 806%, respectively. Under different XG dosages, the internal friction angle of the samples remained within the range of 25.7 ± 1.51°, showing no obvious changing trend compared with the control group.
The principal focus of this study is the influence of XG on the mechanical strength, pH value, and microscopic mechanism of clay at the curing age of 7 days. However, no relevant research has been conducted on its mechanical properties and durability under longer curing times. To better evaluate the differences in mechanical properties between XG and cement-stabilized clay, the influence of XG on the mechanical properties and durability (such as resistance to dry and wet conditions and corrosion resistance) of clay at the 28-day curing age should be the focus of future research. In addition, through comparative tests, the time difference between XG-cured clay and soil treated with traditional curing agents, such as cement and lime, to reach the strength stability period can be thoroughly studied to evaluate the suitability of different curing methods.

Author Contributions

Conceptualization, M.X.; Methodology, L.Y.; Validation, J.L.; Resources, L.Y. and W.W.; Writing—original draft, M.X. and J.L.; Writing—review & editing, W.W. All authors have read and agreed to the published version of the manuscript.

Funding

This research received no external funding.

Data Availability Statement

The original contributions presented in this study are included in the article. Further inquiries can be directed to the corresponding author.

Conflicts of Interest

The authors declare no conflicts of interest.

References

  1. Wang, W.; Wu, E.; Huang, S.; Song, X.; Li, N.; Jiang, P. Experimental Investigation on Static and Dynamic Properties of Nanosilica Modified Cement Soil. Constr. Build. Mater. 2024, 412, 134746. [Google Scholar] [CrossRef]
  2. Zhao, X.; Yang, T.; Xiao, J.; Xie, Q.; Zong, Z.; Yu, Z. Mechanical Properties and Field Test of Lime-Soda Residue Stabilized Soil for Subgrade. Constr. Build. Mater. 2024, 419, 135489. [Google Scholar] [CrossRef]
  3. Kim, D.; Park, K. Evaluation of the Grouting in the Sandy Ground Using Bio Injection Material. Geomech. Eng. 2017, 12, 739–752. [Google Scholar] [CrossRef]
  4. Proaño, L.; Sarmiento, A.T.; Figueredo, M.; Cobo, M. Techno-Economic Evaluation of Indirect Carbonation for Co2 Emissions Capture in Cement Industry: A System Dynamics Approach. J. Clean Prod. 2020, 263, 121457. [Google Scholar] [CrossRef]
  5. Semieniuk, G.; Yakovenko, V.M. Historical Evolution of Global Inequality in Carbon Emissions and Footprints Versus Redistributive Scenarios. J. Clean Prod. 2020, 264, 121420. [Google Scholar] [CrossRef]
  6. Loh, P.Y.; Shafigh, P.; Ibrahim, Z. The Ph Measurement of Cement-Based Materials: Effect of Leaching Time, Leaching Technique and Water-to-Solid Ratio. Constr. Build. Mater. 2024, 411, 134525. [Google Scholar] [CrossRef]
  7. González, A.; Jameson, G.; Carteret, R.; Yeo, R. Laboratory Fatigue Life of Cemented Materials in Australia. Road Mater. Pavement Des. 2013, 14, 518–536. [Google Scholar] [CrossRef]
  8. Fedrigo, W.; Heller, L.F.; Brito, L.A.T.; Núñez, W.P. Fatigue of Cold Recycled Cement-Treated Pavement Layers: Experimental and Modeling Study. Sustainability 2023, 15, 7816. [Google Scholar] [CrossRef]
  9. Chakrabarti, S.; Kodikara, J. Shrinkage Behaviour of Crushed Basaltic Rock and Residual Clay Mixture Stabilized with Cementitious Binders. Int. J. Pavement Eng. 2005, 6, 27–37. [Google Scholar] [CrossRef]
  10. Mendonça, A.; Morais, P.V.; Pires, A.C.; Chung, A.P.; Oliveira, P.V. A Review on the Importance of Microbial Biopolymers Such as Xanthan Gum to Improve Soil Properties. Appl. Sci. 2020, 11, 170. [Google Scholar] [CrossRef]
  11. Li, J.; Wen, K.; Zhang, B. Investigation of Mechanical Behavior of Sustainable Construction Materials: Recycled Glass Sand Stabilized with Natural Binder Material—Biopolymers. Constr. Build. Mater. 2024, 418, 135359. [Google Scholar] [CrossRef]
  12. Liu, Y.; Ni, J.; Gu, J.; Liu, S.; Huang, Y.; Sadeghi, H. Influence of Biopolymer-Vegetation Interaction on Soil Hydro-Mechanical Properties under Climate Change: A Review. Sci. Total Environ. 2024, 954, 176535. [Google Scholar] [CrossRef] [PubMed]
  13. Kumar, S.A.; Sujatha, E.R. An Appraisal of the Hydro-Mechanical Behaviour of Polysaccharides, Xanthan Gum, Guar Gum and Β-Glucan Amended Soil. Carbohydr. Polym. 2021, 265, 118083. [Google Scholar] [CrossRef]
  14. Jang, J. A Review of the Application of Biopolymers on Geotechnical Engineering and the Strengthening Mechanisms between Typical Biopolymers and Soils. Adv. Mater. Sci. Eng. 2020, 2020, 1465709. [Google Scholar] [CrossRef]
  15. Fatehi, H.; Ong, D.E.; Yu, J.; Chang, I. Sustainable Soil Treatment: Investigating the Efficacy of Carrageenan Biopolymer on the Geotechnical Properties of Soil. Constr. Build. Mater. 2024, 411, 134627. [Google Scholar] [CrossRef]
  16. Park, D.Y.; Chang, I.; Lee, M.; Cho, G.C. Enhancing Soil Liquefaction Resistance and Small-Strain Dynamic Properties Using Cation-Crosslinked Biopolymer Hydrogel. Soil Dyn. Earthq. Eng. 2025, 190, 109212. [Google Scholar] [CrossRef]
  17. Chang, I.; Im, J.; Prasidhi, A.K.; Cho, G.C. Effects of Xanthan Gum Biopolymer on Soil Strengthening. Constr. Build. Mater. 2015, 74, 65–72. [Google Scholar] [CrossRef]
  18. Sujatha, E.R.; Atchaya, S.; Sivasaran, A.; Keerdthe, R. Enhancing the Geotechnical Properties of Soil Using Xanthan Gum—An Eco-Friendly Alternative to Traditional Stabilizers. Bull. Eng. Geol. Environ. 2021, 80, 1157–1167. [Google Scholar] [CrossRef]
  19. Li, P.; Li, T.; Zeng, Y.; Li, X.; Jiang, X.; Wang, Y.; Xie, T.; Zhang, Y. Biosynthesis of Xanthan Gum by Xanthomonas Campestris Lrelp-1 Using Kitchen Waste as the Sole Substrate. Carbohydr. Polym. 2016, 151, 684–691. [Google Scholar] [CrossRef]
  20. Jensen, P.F.; Kadziola, A.; Comamala, G.; Segura, D.R.; Anderson, L.; Poulsen, J.C.N.; Rasmussen, K.K.; Agarwal, S.; Sainathan, R.K.; Monrad, R.N. Structure and Dynamics of a Promiscuous Xanthan Lyase from Paenibacillus Nanensis and the Design of Variants with Increased Stability and Activity. Cell Chem. Biol. 2019, 26, 191–202. [Google Scholar] [CrossRef]
  21. Han, G.; Chen, Q.; Liu, F.; Cui, Z.; Shao, H.; Liu, F.; Ma, A.; Liao, J.; Guo, B.; Guo, Y. Low Molecular Weight Xanthan Gum for Treating Osteoarthritis. Carbohydr. Polym. 2017, 164, 386–395. [Google Scholar] [CrossRef] [PubMed]
  22. Xu, W.; Li, Z.; Jin, W.; Li, P.; Li, Y.; Liang, H.; Li, Y.; Li, B. Structural and Rheological Properties of Xanthan Gum/Lysozyme System Induced by in Situ Acidification. Food Res. Int. 2016, 90, 85–90. [Google Scholar] [CrossRef]
  23. Riaz, T.; Iqbal, M.W.; Jiang, B.; Chen, J. A Review of the Enzymatic, Physical, and Chemical Modification Techniques of Xanthan Gum. Int. J. Biol. Macromol. 2021, 186, 472–489. [Google Scholar] [CrossRef] [PubMed]
  24. Elella, M.H.A.; Goda, E.S.; Gab-Allah, M.A.; Hong, S.E.; Pandit, B.; Lee, S.; Gamal, H.; Rehman, A.; Yoon, K.R. Xanthan Gum-Derived Materials for Applications in Environment and Eco-Friendly Materials: A Review. J. Environ. Chem. Eng. 2021, 9, 104702. [Google Scholar] [CrossRef]
  25. Wu, M.; Qu, J.; Shen, Y.; Dai, X.; Wei, W.; Shi, Z.; Li, G.; Ma, T. Gel Properties of Xanthan Containing a Single Repeating Unit with Saturated Pyruvate Produced by an Engineered Xanthomonas Campestris Cgmcc 15155. Food Hydrocoll. 2019, 87, 747–757. [Google Scholar] [CrossRef]
  26. Soldo, A.; Miletić, M. Study on Shear Strength of Xanthan Gum-Amended Soil. Sustainability 2019, 11, 6142. [Google Scholar] [CrossRef]
  27. Ni, J.; Hao, G.L.; Chen, J.Q.; Ma, L.; Geng, X.Y. The Optimisation Analysis of Sand-Clay Mixtures Stabilised with Xanthan Gum Biopolymers. Sustainability 2021, 13, 3732. [Google Scholar] [CrossRef]
  28. Lee, S.; Chang, I.; Chung, M.K.; Kim, Y.; Kee, J. Geotechnical Shear Behavior of Xanthan Gum Biopolymer Treated Sand from Direct Shear Testing. Geomech. Eng. 2017, 12, 831–847. [Google Scholar] [CrossRef]
  29. Dehghan, H.; Tabarsa, A.; Latifi, N.; Bagheri, Y. Use of Xanthan and Guar Gums in Soil Strengthening. Clean Technol. Environ. Policy 2019, 21, 155–165. [Google Scholar] [CrossRef]
  30. Chen, C.; Wu, L.; Perdjon, M.; Huang, X.; Peng, Y. The Drying Effect on Xanthan Gum Biopolymer Treated Sandy Soil Shear Strength. Constr. Build. Mater. 2019, 197, 271–279. [Google Scholar] [CrossRef]
  31. Bonal, N.S.; Prasad, A.; Verma, A.K. Effect of Microbial Biopolymers on Mechanical Properties of Bauxite Residue. KSCE J. Civ. Eng. 2021, 25, 2437–2450. [Google Scholar] [CrossRef]
  32. GB/T 50145-2007; Standard for Engineering Classification of Soil. China Planning Publishing House: Beijing, China, 2008.
  33. Sulaiman, H.; Taha, M.R.; Abd Rahman, N.; Taib, A.M. Performance of Soil Stabilized with Biopolymer Materials–Xanthan Gum and Guar Gum. Phys. Chem. Earth 2022, 128, 103276. [Google Scholar] [CrossRef]
  34. Zhang, J.; Jia, M.; Jiang, T.; Kato, S.; Sun, D.A.; Gao, Y.; Yang, Z. Dynamic Deformation Characteristics and Microscopic Analysis of Xanthan Gum-Treated Silty Soil During Wetting Process. J. Rock Mech. Geotech. Eng. 2025, 17, 1149–1162. [Google Scholar] [CrossRef]
  35. Berninger, T.; Dietz, N.; González López, Ó. Water-Soluble Polymers in Agriculture: Xanthan Gum as Eco-Friendly Alternative to Synthetics. Microb. Biotechnol. 2021, 14, 1881–1896. [Google Scholar] [CrossRef] [PubMed]
  36. GB/T50123-2019; Standard for Geotechnical Testing Methods. Ministry of Water Resources and Hydropower Planning and Design Institute: Beijing, China, 2019.
  37. Maierdan, Y.; Zhao, D.; Chokshi, P.H.; Garmonina, M.; Kawashima, S. Rheology, 3d Printing, and Particle Interactions of Xanthan Gum-Clay Binder for Earth Concrete. Cem. Concr. Res. 2024, 182, 107551. [Google Scholar] [CrossRef]
  38. Fatehi, H.; Ong, D.E.; Yu, J.; Chang, I. Biopolymers as Green Binders for Soil Improvement in Geotechnical Applications: A Review. Geosciences 2021, 11, 291. [Google Scholar] [CrossRef]
  39. Duong, L.H.; Nguyen, M.N. Colloidal Interaction of Fly Ash and Soil Clay. Colloid Surf. A-Physicochem. Eng. Asp. 2024, 692, 133944. [Google Scholar] [CrossRef]
  40. Ko, M.S.; Jeon, Y.J.; Kim, K.W. Novel Application of Xanthan Gum-Based Biopolymer for Heavy Metal Immobilization in Soil. J. Environ. Chem. Eng. 2022, 10, 108240. [Google Scholar] [CrossRef]
  41. Chatterji, J.; Borchardt, J. Applications of Water-Soluble Polymers in the Oil Field. J. Pet. Technol. 1981, 33, 2042–2056. [Google Scholar] [CrossRef]
  42. Tinti, A.; Tugnoli, V.; Bonora, S.; Francioso, O. Recent Applications of Vibrational Mid-Infrared (Ir) Spectroscopy for Studying Soil Components: A Review. J. Cent. Eur. Agric. 2015, 16, 141299. [Google Scholar] [CrossRef]
  43. Anandha Kumar, S.; Sujatha, E. Assessing the Potential of Xanthan Gum to Modify in-Situ Soil as Baseliners for Landfills. Int. J. Environ. Sci. Technol. 2022, 19, 10613–10624. [Google Scholar] [CrossRef]
  44. Li, Y.Z.; Wan, J.L.; Jin, F.; Reddy, K.R.; Jiang, N.J.; Du, Y.J. Gas Permeability and Microscopic Mechanisms of Xanthan Gum-Amended Compacted Lean Clay as a Gas Barrier Material. Eng. Geol. 2025, 353, 108095. [Google Scholar] [CrossRef]
  45. Bozyigit, I.; Javadi, A.; Altun, S. Strength Properties of Xanthan Gum and Guar Gum Treated Kaolin at Different Water Contents. J. Rock Mech. Geotech. Eng. 2021, 13, 1160–1172. [Google Scholar] [CrossRef]
  46. Baldovino, J.d.J.A.; de la Rosa, Y.E.N.; Calabokis, O.P.; Vergara, J.A.A.; López, L.C.S. Geotechnical Behavior of Xanthan Gum-Stabilized Clay Reinforced with Polypropylene Fibers. Polymers 2025, 17, 363. [Google Scholar] [CrossRef] [PubMed]
  47. Wang, L.; Weng, Z.; Liu, Q.; Wang, T.; Pan, X.; Li, G.; Wang, Z. Improving the Mechanical Properties of Red Clay Using Xanthan Gum Biopolymer. Int. J. Polym. Sci. 2021, 2021, 1535772. [Google Scholar] [CrossRef]
  48. Wang, W.; Liu, J.; Li, N.; Ma, L. Mechanical Properties and Micro Mechanism of Nano-Sio2 Modified Coastal Cement Soil at Short Age. Acta Mater. Compos. Sin 2022, 39, 1701–1714. [Google Scholar] [CrossRef]
  49. Bağrıaçık, B.; Mahmutluoğlu, B. Model Experiments on Coarse-Grained Soils Treated with Xanthan Gum Biopolymer. Arab. J. Geosci. 2021, 14, 1621. [Google Scholar] [CrossRef]
  50. Wang, W.; Wu, H.; Feng, T.; Jiang, P.; Sun, M.; Yang, S.; Liu, Y.; Li, N.; Song, Y. Study on the Small Strain Dynamic Characteristics and Microscopic Mechanism of Nano-Silica Modified Lime Soil. J. Mater. Res. Technol. 2025, 37, 851–869. [Google Scholar] [CrossRef]
  51. Benmounah, A.; Benyounes, K.K.; Chelah, K.; Djamal, E.D. Effect of Xanthan Gum and Sodium Carboxymetylcellulose on the Rheological Properties and Zeta Potential of Bentonite Suspensions. In Proceedings of the CFM 2017-23ème Congrès Français de Mécanique, Lille, France, 28 August–1 September 2017; AFM, Maison de la Mécanique: Courbevoie, France, 2017. [Google Scholar]
  52. Nsengiyumva, E.M.; Alexandridis, P. Xanthan Gum in Aqueous Solutions: Fundamentals and Applications. Int. J. Biol. Macromol. 2022, 216, 583–604. [Google Scholar] [CrossRef]
  53. Soldo, A.; Miletić, M.; Auad, M.L. Biopolymers as a Sustainable Solution for the Enhancement of Soil Mechanical Properties. Sci Rep. 2020, 10, 267. [Google Scholar] [CrossRef]
  54. Bagheri, P.; Gratchev, I.; Rybachuk, M. Effects of Xanthan Gum Biopolymer on Soil Mechanical Properties. Appl. Sci. 2023, 13, 887. [Google Scholar] [CrossRef]
  55. Rashid, A.S.A.; Tabatabaei, S.; Horpibulsuk, S.; Mohd Yunus, N.Z.; Hassan, W.H.W. Shear Strength Improvement of Lateritic Soil Stabilized by Biopolymer Based Stabilizer. Geotech. Geol. Eng. 2019, 37, 5533–5541. [Google Scholar] [CrossRef]
  56. Cabalar, A.F.; Awraheem, M.H.; Khalaf, M.M. Geotechnical Properties of a Low-Plasticity Clay with Biopolymer. J. Mater. Civ. Eng. 2018, 30, 04018170. [Google Scholar] [CrossRef]
  57. JTG/T F20-2015; Technical Guidelines for Construction of Highway Roadbases. Ministry of Transport of the People’s Republic of China: Beijing, China, 2015.
  58. JTG D30-2015; Specifications for Design of Highway Subgrades. Ministry of Transport of the People’s Republic of China: Beijing, China, 2015.
  59. Zhang, J.; Meng, Z.; Jiang, T.; Wang, S.; Zhao, J.; Zhao, X. Experimental Study on the Shear Strength of Silt Treated by Xanthan Gum During the Wetting Process. Appl. Sci. 2022, 12, 6053. [Google Scholar] [CrossRef]
  60. Ren, F.; Ding, H.; Dong, B.; Qian, X.; Liu, J.; Tan, J. Study on the Improvement of Soil Properties Using Hydrophilic-Hydrophobic Biopolymer Crosslinking. Constr. Build. Mater. 2024, 415, 135101. [Google Scholar] [CrossRef]
  61. Bonal, N.; Prasad, A.; Verma, A. Use of Biopolymers to Enhance the Geotechnical Properties of Coal Mine Overburden Waste. Géotech. Lett. 2020, 10, 179–185. [Google Scholar] [CrossRef]
Figure 1. Structural formula of Xanthan gum (XG).
Buildings 15 02438 g001
Figure 2. Sample preparation process.
Buildings 15 02438 g002
Figure 3. The physical morphology of the mixture under different XG dosages.
Buildings 15 02438 g003
Figure 4. Zeta potential diagram of clay, XG, and XGC20.
Buildings 15 02438 g004
Figure 5. Infrared spectra of clay, XG, and XGC20.
Buildings 15 02438 g005
Figure 6. XGC0 SEM image: (a) ×2000; (b) ×5000.
Buildings 15 02438 g006
Figure 7. XGC10 and XGC20 SEM images: (a) XGC10 ×2000; (b) XGC10 ×5000; (c) XGC20 ×2000; (d) XGC20 ×5000.
Buildings 15 02438 g007aBuildings 15 02438 g007b
Figure 8. Black and white binary diagram of XGC sample at different magnifications: (a) XGC0 ×5000; (b) XGC5 ×5000; (c) XGC10 ×5000; (d) XGC15 ×5000; (e) XGC20 ×5000; (f) XGC0 ×2000; (g) XGC5 ×2000; (h) XGC10 ×2000; (i) XGC15 ×2000; (j) XGC20 ×2000.
Buildings 15 02438 g008
Figure 9. Stress–strain curves of XGC sample.
Buildings 15 02438 g009
Figure 10. Peak strength of XGC sample.
Buildings 15 02438 g010
Figure 11. Failure morphology of XGC samples: (a) XGC0; (b) XGC10.
Buildings 15 02438 g011
Figure 12. Variation of XGC sample dosage and elastic modulus.
Buildings 15 02438 g012
Figure 13. The fitting curve of porosity and elastic modulus E50 of the XGC sample.
Buildings 15 02438 g013
Figure 14. Deviatoric stress–strain curve of XGC samples: (a) XGC0; (b) XGC5; (c) XGC10; (d) XGC15; (e) XGC20.
Buildings 15 02438 g014
Figure 15. Mohr-Coulomb circle of XGC10 sample.
Buildings 15 02438 g015
Figure 16. Histogram of the relationship between XG content and cohesion.
Buildings 15 02438 g016
Figure 17. Line chart of the relationship between XG content and friction angle.
Buildings 15 02438 g017
Table 1. Physical properties index of soil used in the test.
Soil CategoryPlastic Limit (%)Liquid Limit (%)Plasticity
Index
Maximum Dry Density (g·cm−3)Optimal
Moisture
Content (%)
Internal
Friction Angle φ (°)
Cohesion
C (kPa)
Low liquid limit clay15.1539.5224.371.8516.0027.0291.49
Table 2. Test scheme.
Sample NumberMoisture Content (%)XG
Content (%)
Test Method
Zeta
Potential Test
Infrared
Spectroscopy Test
Scanning Electron Microscopy (SEM) TestpH TestUnconfined Compressive Strength (UCS) TestTriaxial Shear Test
XGC0160
XGC5165
XGC101610
XGC151615
XGC201620
Note: A √ in the table indicates that this test has been conducted.
Table 3. pH value of XG cured clay sample.
Sample NameXGC0XGC5XGC10XGC15XGC20
pH7.957.927.967.947.96
Table 4. Porosity of XGC samples at different magnifications (%).
Sample NameXGC0XGC5XGC10XGC15XGC20
Porosity5000 times26.8023.8020.9016.6713.14
2000 times26.0523.2720.6016.4012.38
Average porosity26.5823.6520.8116.5912.92
Table 5. The reinforcing effect of XG on different soils.
Soil TypeSilty SandSilty SoilRed SoilKaolinClayClay
XG content (%)0, 1, 2, 40, 0.5, 1, 20, 0.5, 1, 1.50, 0.5, 1, 1.5, 20, 0.5, 1, 1.5, 2, 30, 5, 10, 15, 20
Moisture content (%)16.521.735252116
Control group strength (kPa)1197120015076421374
Optimal content (%)221.521.520
Maximum improvement range (%)40013311327631296
Curing time (d)577777
References[53][54][55][45][56]this test
Table 6. Statistical analysis of internal friction angle of each group of samples (°).
Sample Value26.823.725.827.524.9
Median25.8
Average25.7
Variance2.28
Standard deviation1.51
Table 7. Triaxial shear test of various soils cured by XG.
Soil TypeLoessSandBauxite SlagClay
XG content (%)0, 0.5, 1, 20, 0.5, 1, 20, 0.25, 0.5, 1, 1.50, 5, 10, 15, 20
Peak strength (kPa)350–550600–10501200–16001127–3071
Cohesion (kPa)100–200140–220221–275263–864
Friction angle (°)13.9–1535–4033.8–39.323.2–28.3
References[29][61][31]this test
Disclaimer/Publisher’s Note: The statements, opinions and data contained in all publications are solely those of the individual author(s) and contributor(s) and not of MDPI and/or the editor(s). MDPI and/or the editor(s) disclaim responsibility for any injury to people or property resulting from any ideas, methods, instructions or products referred to in the content.

