Article

Research on the Risk Factors and Promotion Strategies of BIM Application in China

1
School of Civil Engineering and Architecture, Wuhan University of Technology, Wuhan 430070, China
2
Department of Building and Real Estate, Hong Kong Polytechnic University, Hong Kong 999077, China
3
Office of Strategic Planning and Discipline Development, Wuhan University of Technology, Wuhan 430070, China
4
Wuhan Urban Construction Group, Wuhan 430022, China
*
Author to whom correspondence should be addressed.
Buildings 2025, 15(14), 2421; https://doi.org/10.3390/buildings15142421
Submission received: 11 June 2025 / Revised: 26 June 2025 / Accepted: 7 July 2025 / Published: 10 July 2025

Abstract

Building Information Modeling (BIM) is an emerging information technology tool and management concept in the construction industry, enabling the transition from traditional 2D drawings to 3D models. It helps improve efficiency and promote industrial upgrading in the construction sector. However, in actual project practices, the effectiveness of BIM application has not been as expected, and the return on investment (ROI) may even be negative. Through a literature review, we found that risk identification, correlation analysis, and risk assessment related to BIM implementation require further research. To better promote the application of BIM in the construction industry, this study employs relevant methods to analyze the risk factors of BIM implementation. Through the literature review, 31 BIM implementation risk factors were identified, and 24 major risk factors were extracted using the AHP (Analytic Hierarchy Process) method. The ISM (Interpretative Structural Modeling) method was then used to determine the interrelationships among these major risk factors, establishing a hierarchical model with seven levels. Through MICMAC (Matrices Impacts Corises-Multiplication Appliance Classment) analysis, the BIM implementation risk factors were categorized into three groups, and three-tiered response strategies were proposed at the industry, organizational, and project levels. By analyzing the main risk factors of BIM application in China’s construction industry and formulating corresponding response strategies to promote its successful application, this study contributes to the knowledge system. The findings also provide a reference for other countries and regions to clarify major risk factors and their interrelationships, thereby improving the effectiveness of BIM implementation.

1. Introduction

As the world’s second-largest industry, the construction sector is continuously transforming under the impetus of technological development. BIM, as an emerging technological tool and management concept, represents the direct application of modern information technology in the construction industry and is regarded as an important means to drive industrial upgrading [1]. According to the definition by the National Institute of Building Sciences (NIBS), in a narrow sense, BIM is the digital representation of a building, which not only includes the geometric shape of the building but also other information about the building, such as materials, costs, schedules, energy efficiency, etc. In a broader sense, BIM is the use of advanced digital technologies to establish and store a computer information model of all physical and functional characteristics of a building project throughout its entire lifecycle, enabling owners and operators to use this information for the maintenance of the building throughout its lifecycle [2]. According to the definition by NBIMS (National Building Information Model Standard), BIM is a digital representation of the physical and functional characteristics of a construction project. It serves as a dynamic decision-making tool for creating and managing parametric models of construction projects, enabling the integration and sharing of information throughout the project lifecycle [3]. BIM features completeness, associativity, integration, visualization, simulation, and optimization, offering significant benefits in enhancing productivity, improving project quality, reducing resource waste, and shortening construction cycles [4,5]. During its development, BIM technology has continuously integrated with new technologies, closely collaborating with various stakeholders throughout the project lifecycle and contributing significantly to the planning, construction, and operation stages. BIM represents a major innovation in the construction industry following CAD (Computer Aided Design), transitioning from 2D drawings to 3D models [6]. Currently, the most mature stage of BIM application is the construction phase. As BIM continues to spread, China has actively embraced advanced information technologies, showing strong interest in BIM.
Since 2000, BIM has gradually attracted global attention due to its immense potential, leading many countries to introduce policies for its application and promotion. Denmark, Finland, Norway, Singapore, South Korea, and the UK require the use of BIM in public sector construction projects and encourage its adoption in private projects. Starting in 2016, the UK government mandated 3D BIM models for public sector projects and issued a series of policies and standards, such as BSEN ISO 19650 [7], aiming to complete preparations for BIM Level 3 and digital transformation by 2025 [8]. The Singapore government released BIM application guides 1.0 and 2.0; in 2015, the Building and Construction Authority (BCA) required BIM models for new projects exceeding 5000 m2 and established corresponding MEP (machine, electric, plumbing) delivery standards [9]. In 2016, Norway mandated the use of open standards for BIM in public sector projects [10].
Research indicates that BIM implementation can enhance the achievement of quality, cost, and schedule goals in construction projects [11]. The benefits of BIM technology in construction projects are undeniable. However, adopting BIM for project management must be approached cautiously, as its introduction can significantly disrupt existing organizational structures. BIM is not just a technology but also a process practice that spans the entire project lifecycle, requiring high levels of collaboration among participants at different stages. In practice, the breadth and depth of BIM application have fallen short of expectations, with its actual performance lagging behind its potential advantages [12,13]. In China, 25% of design firms and 33% of construction companies believe they have only experienced a fraction of the value BIM can create, with only 40% of design firms and 45% of construction companies reporting positive ROI from BIM. Similarly, reports from Australia and New Zealand highlight that construction firms perceive they have realized only a small portion of BIM’s potential value. BIM represents a paradigm shift in the construction industry, inevitably leading to risks associated with its application, which can result in suboptimal outcomes. These risks must be identified, analyzed, assessed, and controlled. In this study, BIM risk factors refer to uncertain elements that affect project success after the introduction of BIM technology.
In China, BIM has been introduced for some time, but its application in the construction industry remains at an early stage due to inadequate control of related risks [14,15,16]. While the number of articles on BIM has grown exponentially in recent years, those focusing on BIM risks are relatively scarce. After reviewing extensive literature on the topic, three key research gaps were identified:
  • What are the main risk factors associated with BIM application in China’s construction industry?
  • What are the interrelationships among these risk factors?
  • How can these risk factors be evaluated and addressed?
Therefore, this study aims to identify the main risk factors of BIM application in the Chinese context, explore their interrelationships, classify them based on urgency and importance, and propose targeted response strategies. The findings provide a reference for the widespread adoption of BIM and offer insights for developing countries still in the early stages of BIM application. The paper is structured as follows: Section 1 presents the research background and existing problems; Section 2 outlines the development of BIM and reviews literature on BIM application risks, proposing an initial list of risk factors in the Chinese context; Section 3 describes the research methods and framework; Section 4 analyzes the research data; Section 5 discusses the results and risk response strategies; and Section 6 concludes the study, highlighting limitations and future research directions.

2. Related Work

2.1. Overview of Building Information Modeling

Building Information Modeling is a digital model based on 3D models that links various engineering information, serving as a platform for sharing information among project stakeholders. BIM technology represents an innovative shift from 2D drawings to 3D virtual models. As early as 1975, Chuck Eastman proposed the idea of BIM application, envisioning a computer system for intelligently simulating buildings, which he named the BDS (Building Description System). In 1986, Robert Aish proposed the definition of BM (Building Modeling); subsequently, the definition of BIM was formally introduced by Tolman [17]. Due to limitations in computer hardware and software, BIM research in the 20th century remained largely academic. Jonathan Ingram has made significant contributions to the promotion of BIM-related software [18]. In the 21st century, BIM-related software and standards have developed rapidly, with many companies creating BIM software such as Revit, Bentley, and Catia. In China, the release of the “2011–2015 Construction Industry Informatization Development Outline” marked the beginning of BIM technology implementation. Subsequently, related software was introduced to China, and numerous scholars began researching and developing BIM applications. To adapt to the Chinese market, industry practitioners developed localized BIM software or plugins, such as Glodon BIM5D, Luban BIM, and XCtech for Revit.
Medical Center (University of California, San Francisco, CA, USA)is a notable case of BIM application, where BIM technology was used in both the design and construction phases. Research shows that BIM reduced construction waste by at least 6%, increased installation productivity by 8%, and enabled the assembly of 3–5 additional prefabricated panels per day [19]. BIM applications in Canadian projects demonstrated a 37% improvement in project execution efficiency, a 26% increase in prefabrication rates, a 24% reduction in resource waste, and a 21% enhancement in communication transparency. Additionally, MEP clash detection reduced risks by 37% [20]. In China, Huahu Airport was the first project to use BIM throughout its entire lifecycle. Surveys of project participants revealed that BIM significantly reduced changes, but due to process adjustments, organizational resistance, and lack of experience, its benefits were not as high as expected.

2.2. BIM Risk-Related Research
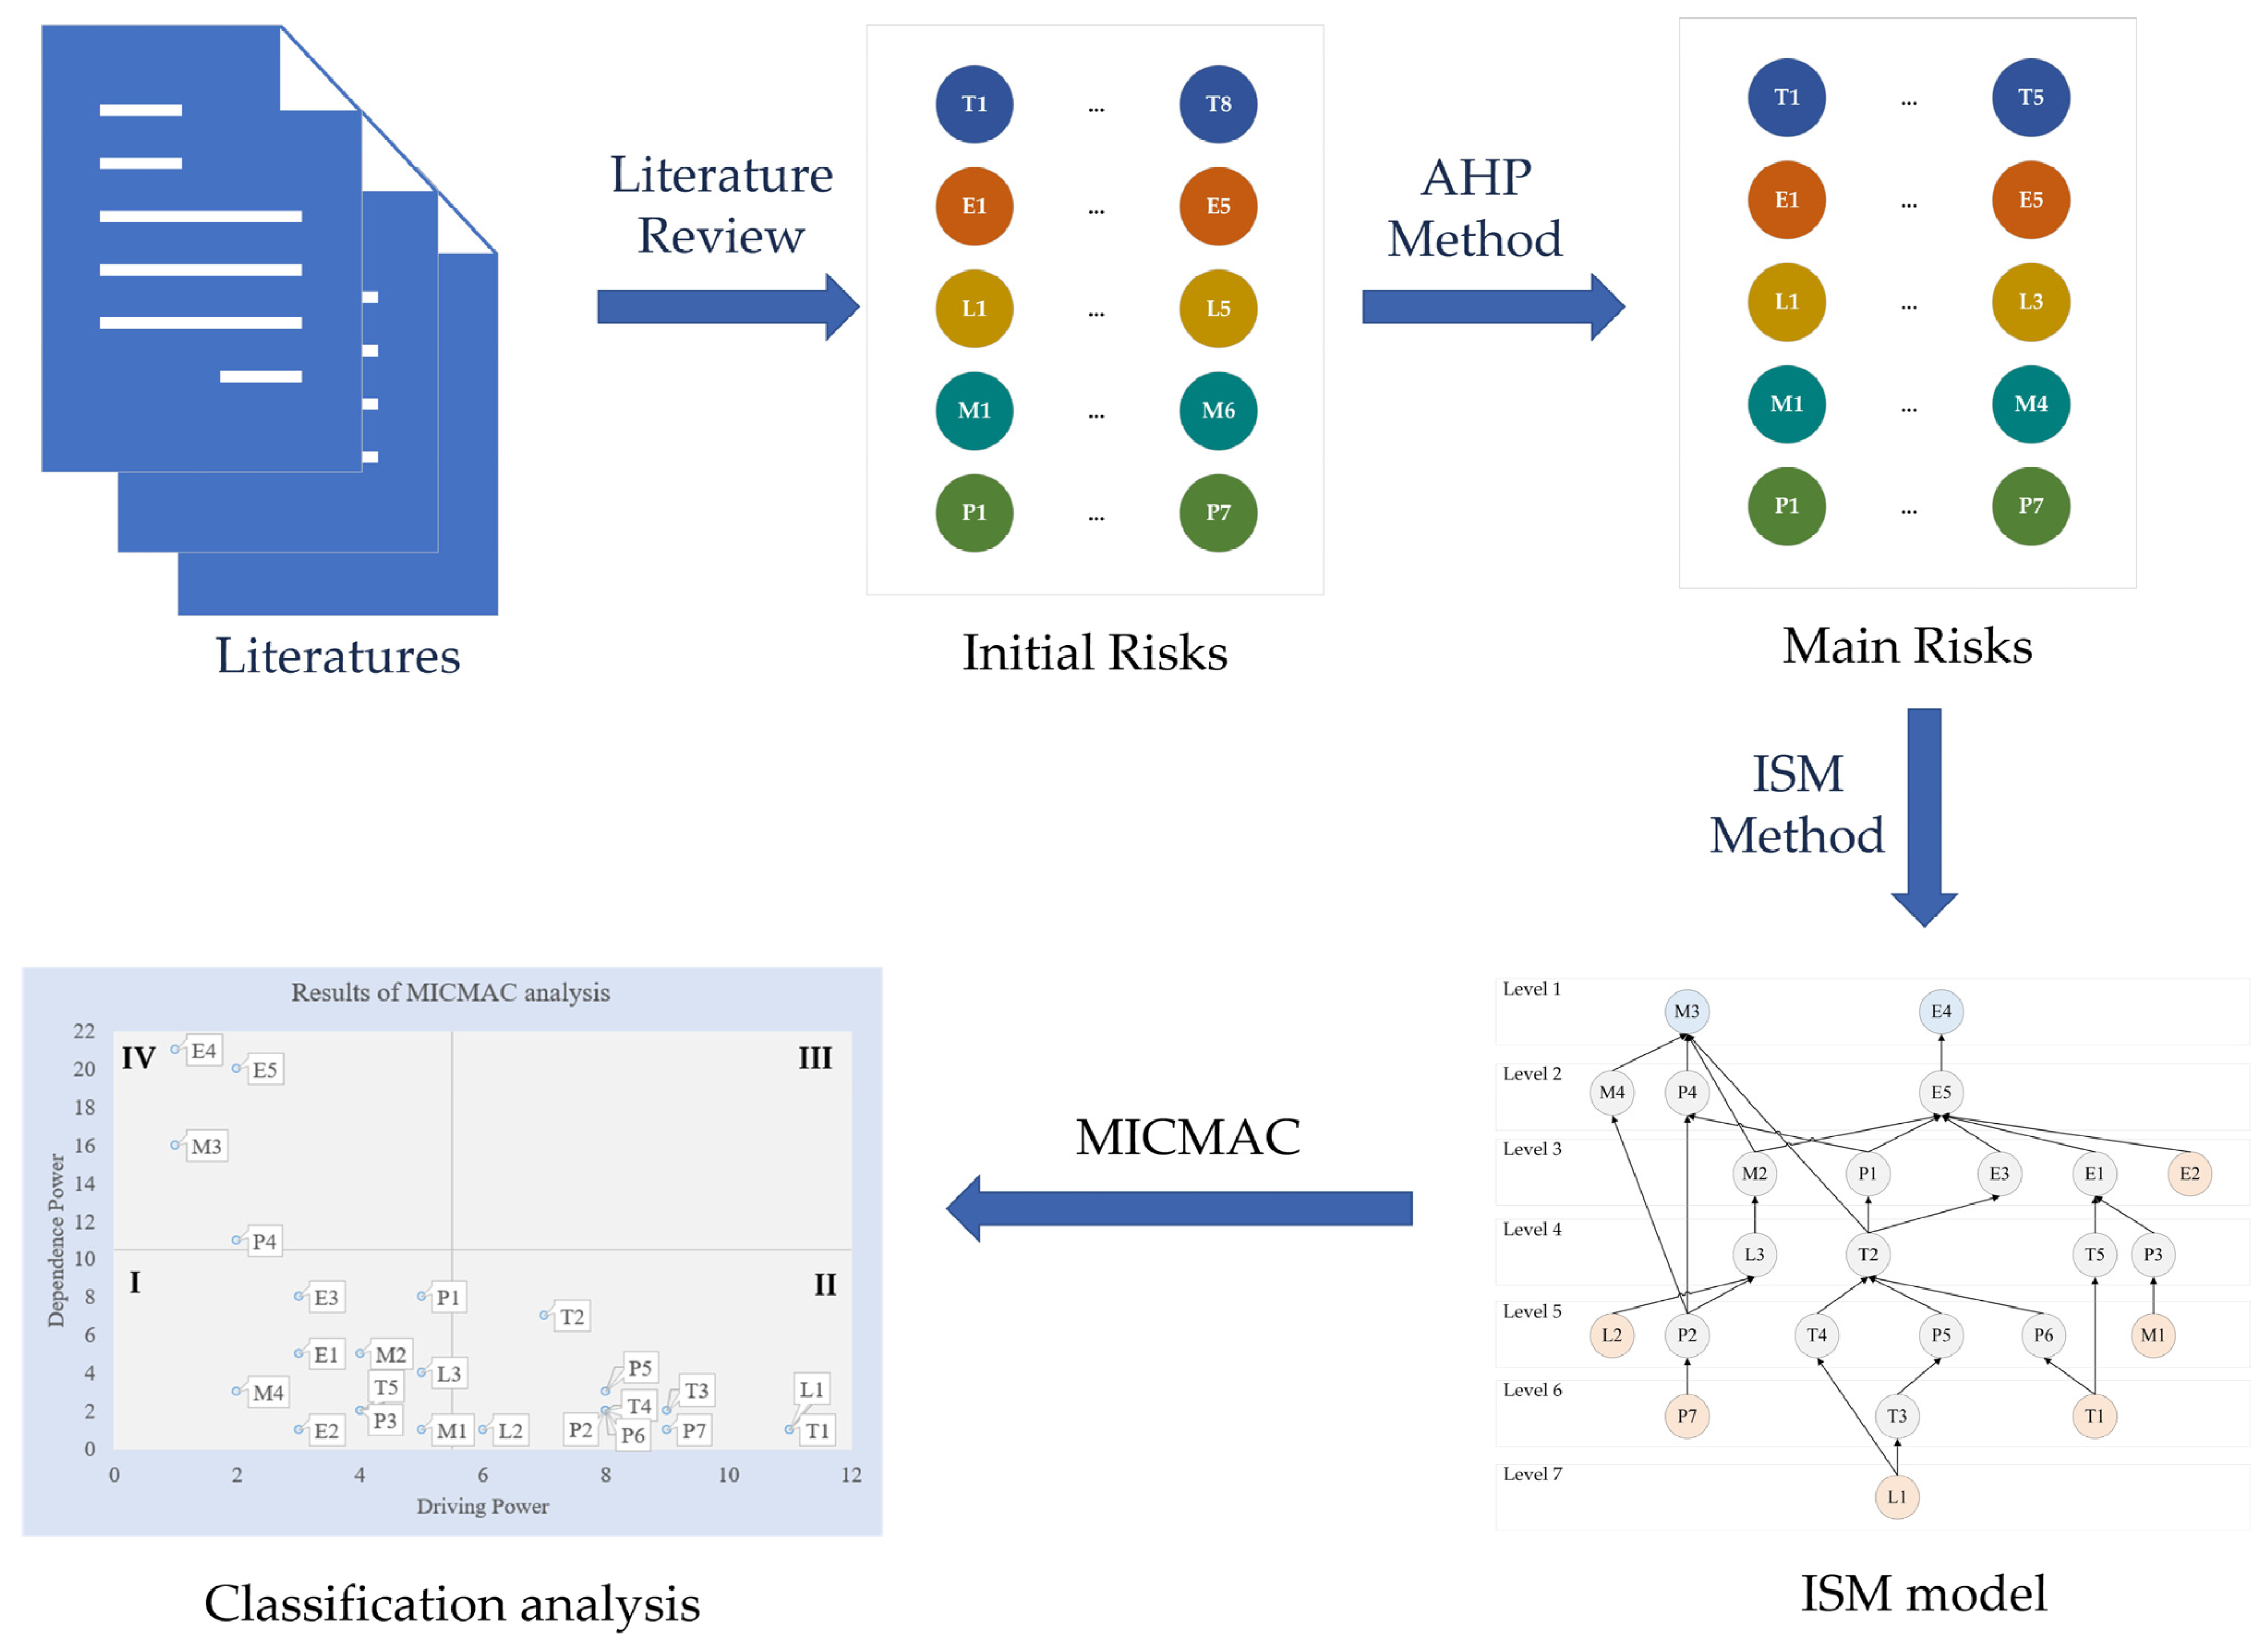
Every new technology brings both progress and risks to the construction industry, and BIM is no exception. According to ISO 31000 [21], risk refers to the effect of uncertainty on project objectives. In this study, BIM risk factors are defined as uncertain elements that affect project success after the introduction of BIM technology. A comprehensive risk analysis of BIM technology and targeted control measures for major risk factors can minimize losses and contribute to the success of BIM projects. Scholars worldwide have begun to recognize BIM’s potential risk factors, with some conducting research on BIM application risks. Others, while not directly discussing BIM risks, have studied challenges and barriers to BIM adoption, reflecting some of its risk factors. Sun argued that BIM, as a new technology and process, introduces many risks and challenges, leading to project delays, cost overruns, and even failure [22]. Further research by Sun categorized BIM application risks into legal, industry environment, financial, technical, and management aspects, using ISM to establish hierarchical relationships among risk factors and statistical methods to analyze their importance [23]. Liang noted that BIM offers new methods for green building development but also presents significant challenges. The complexity of optimizing multiple performance indicators with BIM hinders its widespread adoption in design practices, limiting its use primarily to academic research [24]. Meng identified 16 factors affecting BIM application through an analysis of technical, economic, management, policy, and environmental aspects, focusing on nine key factors such as insufficient technical maturity and high costs [25]. Chien identified 13 risk factors for BIM application in Taiwan through a literature review, covering technical, management, personnel, financial, and legal aspects. Using the DEMATEL method, the interrelationships among these factors were analyzed to determine key risks and formulate response strategies [26]. In Taiwan, models are collaboratively created by stakeholders, but the lack of legal provisions defining model ownership leads to disputes, necessitating relevant laws to address intellectual property issues [27]. Tan studied BIM application risks in prefabricated construction, identifying 20 risk factors through a literature review and narrowing them down to 12 major factors via surveys. ISM was used to analyze hierarchical relationships, and MICMAC categorized the factors, leading to the proposal of a three-tiered response strategy [28]. Sanaz identified 33 BIM application risk factors through a literature review, extracted 32 major factors using FDM, and evaluated their importance using DEMATEL and P-FANP methods, developing the PART risk assessment tool [29]. Zarghami used system dynamics to analyze causal relationships among BIM risk factors, illustrating how their interactions create vicious cycles that threaten successful BIM implementation [30]. Viana reviewed 24 studies to identify 15 BIM implementation risk factors in Brazil, using fuzzy logic to prioritize them. The results showed that insufficient knowledge and experience, software interoperability issues, and cultural resistance were the top three risk factors [19].
Chan identified 12 factors hindering BIM implementation in Hong Kong through a literature review and structured interviews, highlighting stakeholder resistance, organizational incompatibility with BIM processes, and lack of BIM industry standards as the top three barriers [31]. Wu used social network analysis to identify 12 key factors obstructing BIM adoption in China’s construction industry [32]. Liu categorized factors affecting BIM implementation in China into IT capability, technology management, attitudes and behaviors, roles, trust, communication, leadership, learning, and experience [33]. Fan et al. identified legal risks in BIM implementation, arguing that 3D models should have legal validity and highlighting the lack of standard contracts as a major issue, proposing corresponding solutions [34]. Khalid investigated legal and contractual risks through surveys [35]. Mahdian conducted a detailed analysis of legal risks in Iran’s BIM implementation through literature reviews and expert interviews, identifying 41 specific legal risks and improving contract standards for DB and DBB models [36]. Ali comprehensively analyzed risks and challenges in BIM adoption, identifying data accuracy, ownership, and lack of suitable BIM protocols as major risk factors [37]. Jin surveyed BIM application risks in China, finding that a lack of BIM standards, insufficient professionals, high short-term costs, and inadequate BIM software capabilities were the main barriers [38]. Senem identified 41 benefits, 11 risks, and 13 challenges for SMEs in BIM implementation through structured interviews and prioritized risks using the Delphi method [39]. Zhao studied BIM application risks in China’s AEC industry, identifying data issues and cultural resistance as primary factors leading to poor BIM outcomes [40]. Huang et al. categorized factors affecting BIM in green building development into technical, management, economic, and environmental aspects, ranking their severity for different stakeholders to propose targeted recommendations [41].

3. Methodology

This study aims to identify the main risk factors of BIM application and explore their interrelationships to understand BIM technology’s promotion path. To achieve this, the study employs a literature review, AHP, and ISM methods. First, the initial list of BIM application risk factors is identified through a literature review. Next, the AHP method is used to determine the main risk factors as the basis for system modeling. Then, ISM is applied to establish a structural model of BIM application risk factors. Finally, MICMAC analysis is conducted to classify the risk factors based on their driving and dependence power, enabling targeted management strategies. The technical path of this study is shown in Figure 1.

3.1. Initial List of Risk Factors of BIM Application

This study identifies an initial list of risk factors for BIM application through a literature review. First, in order to collect research related to the risks of BIM application, keywords such as “BIM Application/Implementation,” “Risk,” and “Barriers” were searched on databases like “Web of Science” and “CNKI,” with the study period set from 2015 to the present. By reviewing the titles, 54 relevant articles were selected, excluding conference papers and books due to their lower academic rigor compared to research articles. Subsequently, the scope of the remaining articles was reviewed through their keywords and abstracts, leading to the exclusion of 18 articles that were either weakly or not at all related to BIM application risks. Finally, after thoroughly reading the remaining articles, 16 highly relevant papers were selected as the sources for determining the initial list of BIM application risk factors. Based on the TOE framework and PEST analysis [42,43], 31 BIM application risk factors were identified from technical, economic, legal, management, and process perspectives, as shown in Table 1.
The 31 BIM implementation risk factors are defined as follows:
Lack of software function (T1)—The software is not mature enough, the functions are not perfect, and most software cannot be used in each stage of the project.
Model management difficulties (T2)—The amount of data in the model is huge, making it difficult to process a large amount of data in the model, and there are certain difficulties in maintaining the model.
Poor software interaction (T3)—The inefficiency of interoperability between software makes it difficult to exchange information, or it is easy to cause data loss during the interaction.
Low data quality (T4)—Incorrect data exists in the process of input and transmission, and the reliability of information is insufficient.
Data security issues (T5)—Including cloud storage security and information privacy issues, providing project data in a public environment may cause information leakage.
Difficulties in synchronizing data (T6)—The data collected in the construction phase (using laser scanning, RFID, etc.) is difficult to synchronize with the BIM model.
Difficulty in modeling some structures (T7)—The existing BIM software library has difficulty modeling some special-shaped structures.
Complexity of BIM software operations (T8)—Existing BIM software is complicated in operation and difficult to master.
Staff training and recruitment costs (E1)—There are corresponding costs for training staff and recruiting professionals.
Infrastructure costs for BIM implementation (E2)—There are corresponding costs for purchasing and updating BIM software (Revit, Bentley, etc.), as well as the cost of supporting hardware (computers, etc.) required for BIM software.
Increased cost of design and maintenance (E3)—Compared with traditional CAD design, the implementation of BIM technology will increase the cost in the design stage, and the later maintenance will also require a certain cost.
Uncertainty in return on investment (E4)—In the current engineering environment, the investment benefits of applying BIM technology are difficult to predict, and the investment return period is long.
High process investment (E5)—The application of BIM technology has changed the workflow and working methods. For the collaborative BIM implementation, the process cost of all parties has increased, and the short-term investment has increased.
Inadequate BIM standards and protocols (L1)—Lack of BIM implementation standards, protocols, rules for model management, and lack of locally oriented guidelines.
Inadequate BIM-related laws and regulations (L2)—Lack of relevant laws and regulations to ensure the legality of BIM models.
Unclear BIM data ownership (L3)—Copyright of the model and attribution of the as-built model of the project. Many participants work on one model, which might lead to a lack of protection for intellectual property.
Inapplicability of the contracts (L4)—The industry-standard contracts under the BIM implementation environment cannot fully allocate risks, responsibilities, and benefits, and lack effective resolution mechanisms for disputes.
Lack of industry insurance (L5)—Lack of industry insurance to cover risks and losses brought by BIM implementation.
Lack of BIM practice experience (M1)—The lack of sufficient BIM implementation experience among the team members in projects leads to errors.
Lack of support from top managers (M2)—Senior leaders of the company prefer the traditional way of working, and the incentives for employees are insufficient.
Unclear division of responsibilities (M3)—The roles and responsibilities of stakeholders in the construction process are not clear.
Inconsistent cognition from project stakeholders about BIM (M4)—Uncertainty and inefficiency in BIM implementation due to divergence in stakeholders’ perceptions and attitudes of BIM.
Synergy dilemma (M5)—The implementation of BIM technology requires a higher level of collaboration, and the low collaboration ability of all parties in the project leads to data integration problems, model interpretation problems, conflict problems, etc.
Suitability of organizational structures (M6)—The traditional project management organization structure cannot fully meet the needs of BIM technology implementation.
Increase in workload (P1)—The implementation of BIM technology requires the creation of 3D models and the review of data, which increases the workload.
Issues Of Business Process Change (P2)—The implementation of BIM technology has changed the original business flow, but there is no standard BIM implementation process.
Lack of professional and technical personnel (P3)—The team lacks BIM professional and technical personnel, and the mastery of professional knowledge is not enough, which may lead to BIM implementation risks.
Resistance from technicians (P4)—BIM is a new technology. Technicians are used to traditional work modes, and the implementation of new technologies may make technicians resist and unwilling to accept and learn new technologies.
Lack of model sharing (P5)—The reluctance to share data due to the lack of trust among participants and the lack of effective agreement to use models.
Incomplete application of BIM Technology (P6)—The functions of BIM technology are not adaptive to some aspects of the project, and cannot give full play to its value (such as payment).
Changes in delivery mode (P7)—Differences in project delivery modes will have different impacts on the implementation of BIM technology.

3.2. Analytic Hierarchy Process—AHP

The main risk factors are generally determined by comparing the importance levels of various risk factors, with representative methods including the Analytic Hierarchy Process (AHP), Analytic Network Process (ANP), and Entropy Weight Method (EWM). The EWM is particularly effective when the data is relatively complete and free from subjective bias, while ANP is especially suitable for dynamic and complex decision-making problems. Compared to other methods, AHP is well-suited for decision-making problems with a clear hierarchical structure, where expert judgment can be intuitively achieved through pairwise comparison matrices. AHP is especially effective for multi-criteria decision analysis and can efficiently handle the combination of qualitative and quantitative information. The goal of this study is to identify the main risk factors of BIM application, which has a clear hierarchical structure, and the determination of the matrix relies on expert experience. Therefore, the AHP method is employed to identify the major risk factors in BIM application.
The Analytic Hierarchy Process (AHP) is an operations research theory method proposed by American scholar T.L. Saaty in 1971 [44]. The core idea of AHP is to hierarchically and structurally decompose complex multi-criteria decision-making problems, conduct pairwise comparisons of the importance levels among the decomposed indicators, and then determine the relative weight of each factor through qualitative and fuzzy quantification. The application of AHP involves the following four steps:
(1)
Decompose the research problem
Establish a hierarchical structure of the research subject. It is generally divided into the goal level, criterion level, and indicator level, with the top level representing the research objective and the bottom level representing specific risk factors.
(2)
Design a questionnaire
Invite industry experts to conduct pairwise comparisons of indicators under the same criterion level using the 9-point scale method, as well as pairwise comparisons of elements across different criterion levels. Collect the questionnaire results, calculate the average values, and construct a judgment matrix. The meanings of the 9-point scale method are shown in Table 2 below:
(3)
Weight Calculation
Calculate the maximum eigenvalue and eigenvector of the judgment matrix to determine the weights of each factor. First, construct the judgment matrix based on the results, as follows:
C = c 11   c 12 c 1 n c 21   c 22 c 2 n   c n 1   c n 2 c n n
cij represents the average importance degree when comparing the i-th risk factor to the j-th risk factor.
Next, normalize the judgment matrix C column-wise to obtain the standardized matrix D:
D = d 11   d 12 d 1 n d 21   d 22 d 2 n   d n 1   d n 2 d n n ,   d i j = c i j i = 1 n c i j
Subsequently, sum the standardized matrix by rows to obtain the weight vector V:
V = v 1 , v 2 , , v n T ,   v i = j = 1 n d i j
Finally, normalize the weight vector V to obtain the risk factor weight vector W:
W = ( w 1   w 2 w n ) , w i = v i i = 1 n v i
(4)
Consistency Check
To prevent calculation errors caused by inconsistency in the judgment matrix, the Analytic Hierarchy Process requires consistency verification. First, calculate the maximum eigenvalue λmax of the judgment matrix C, then derive the consistency index CI using Equation (5). Finally, combine it with the matrix order to calculate the consistency ratio CR using Equation (6):
C I = λ max n n 1
C R = C I R I
The value of RI depends on the order of the matrix, as shown in the following Table 3:
(5)
Calculation of Actual Weights for Indicator Layer
For each judgment matrix, compute to obtain the weights of the criterion layer factors and the relative weights of the indicator layer factors. Then calculate the actual weights of each indicator layer factor according to Equation (7).
w i j = v i v i j
where vi denotes the weight of the i-th criterion layer indicator, vij represents the relative weight of the j-th indicator under the i-th criterion layer, and wij indicates the actual weight of the j-th indicator under the i-th criterion layer.

3.3. Interpretative Structural Modeling-ISM

System modeling methods include System Dynamics (SD), Structural Equation Modeling (SEM), Interpretative Structural Modeling (ISM), and others. SEM is a statistical modeling technique used to analyze causal relationships between multiple variables and model both direct and indirect effects among different variables. It is commonly used in fields with large amounts of data and clear relationships between variables. SD uses mathematical models to describe and analyze feedback loops and dynamic behavior within a system. It is particularly suitable for describing the time evolution of a system, capable of simulating long-term changes and feedback effects. ISM focuses on the interactions and influences between system elements, requiring no complex mathematical modeling, making it suitable for situations where expert experience is abundant but data is insufficient. ISM is better suited for dealing with clear system elements and relationships. Therefore, in this study, ISM is used for system modeling research. The Interpretative Structural Modeling (ISM) method was developed in 1973 by American scholar John N. Warfield as an approach to analyze complex systems. It transforms ambiguous ideas and perspectives into intuitive, well-structured relational models [28]. The core concept of ISM involves breaking down complex systems into subsystems or elements, then using practical human cognition and computer assistance to represent the system as a multi-level hierarchical structural model. The application of ISM consists of the following six steps:
(1)
Determination of system elements Si. The identification of system elements is based on the specific objectives of the study. In this research, the system elements are the major risk factors of BIM application selected through AHP analysis.
(2)
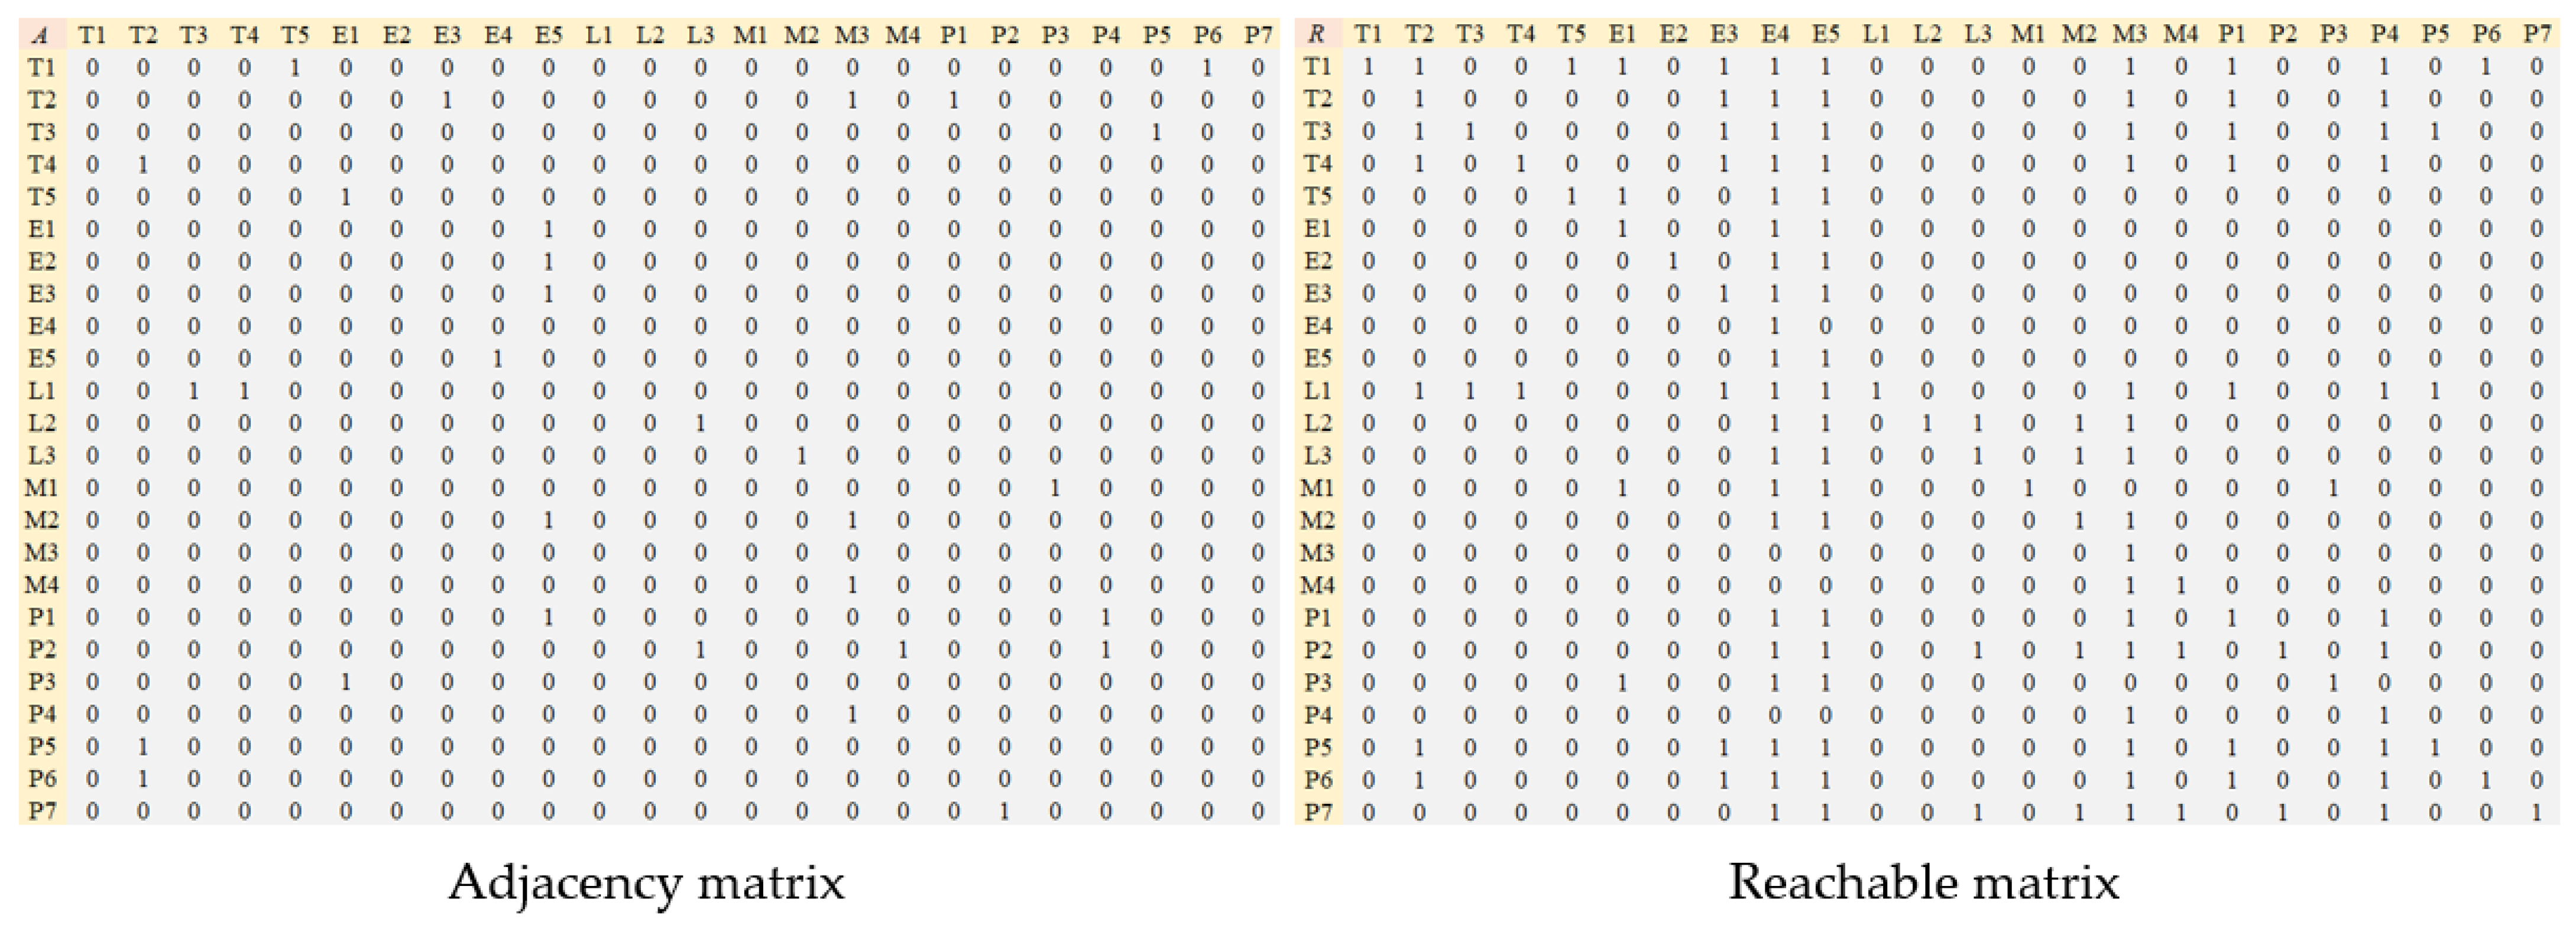
Establish an adjacency matrix A. Semi-structured interviews were conducted with experts to evaluate direct relationships between factors. After consolidating expert opinions, adjacency matrix A was constructed, where element aij equals 0 or 1; 0 indicates no direct relationship between two factors, and 1 indicates a direct relationship exists.
A = a 11   a 12 a 1 n a 21   a 22 a 2 n   a n 1   a n 2 a n n
Note: aij = 0, there is no direct relationship between factor Si and factor Sj. aij = 1, there is a direct relationship between factor Si and factor Sj.
(3)
Calculate the reachability matrix. The reachability matrix indicates the extent to which system elements can reach each other through paths of certain lengths. Reachability matrix R is obtained by performing Boolean algebra operations on the adjacency matrix A plus the identity matrix I.
(4)
Regional Division: Firstly, determine the reachable set, antecedent set, and the intersection of the reachable set (R(Si)) and antecedent set (A(Si)) for each risk factor based on the reachability matrix. Then, use Equation (9) to identify the set of fundamental risk factors. The system’s coherence is determined by whether the intersection of reachable sets of fundamental factors is empty. If the intersection of reachable sets of fundamental factors is not empty, then all system factors are within the same connected domain.
K = S i N A ( S i ) = R ( S i ) A ( S i )
(5)
Level partitions. Based on the reachability matrix, categorize all risk factors in the system into different levels using the definition of maximum sets. Specifically:
L k = S i N L 1 L k 1 R k 1 ( S i ) = R k 1 ( S i ) A k 1 ( S i )
Here, Lk represents the level of risk factors, N represents the set of risk factors, R(Si) denotes the reachable set of risk factor Si, and A(Si) represents the antecedent set of risk factor Si.
(6)
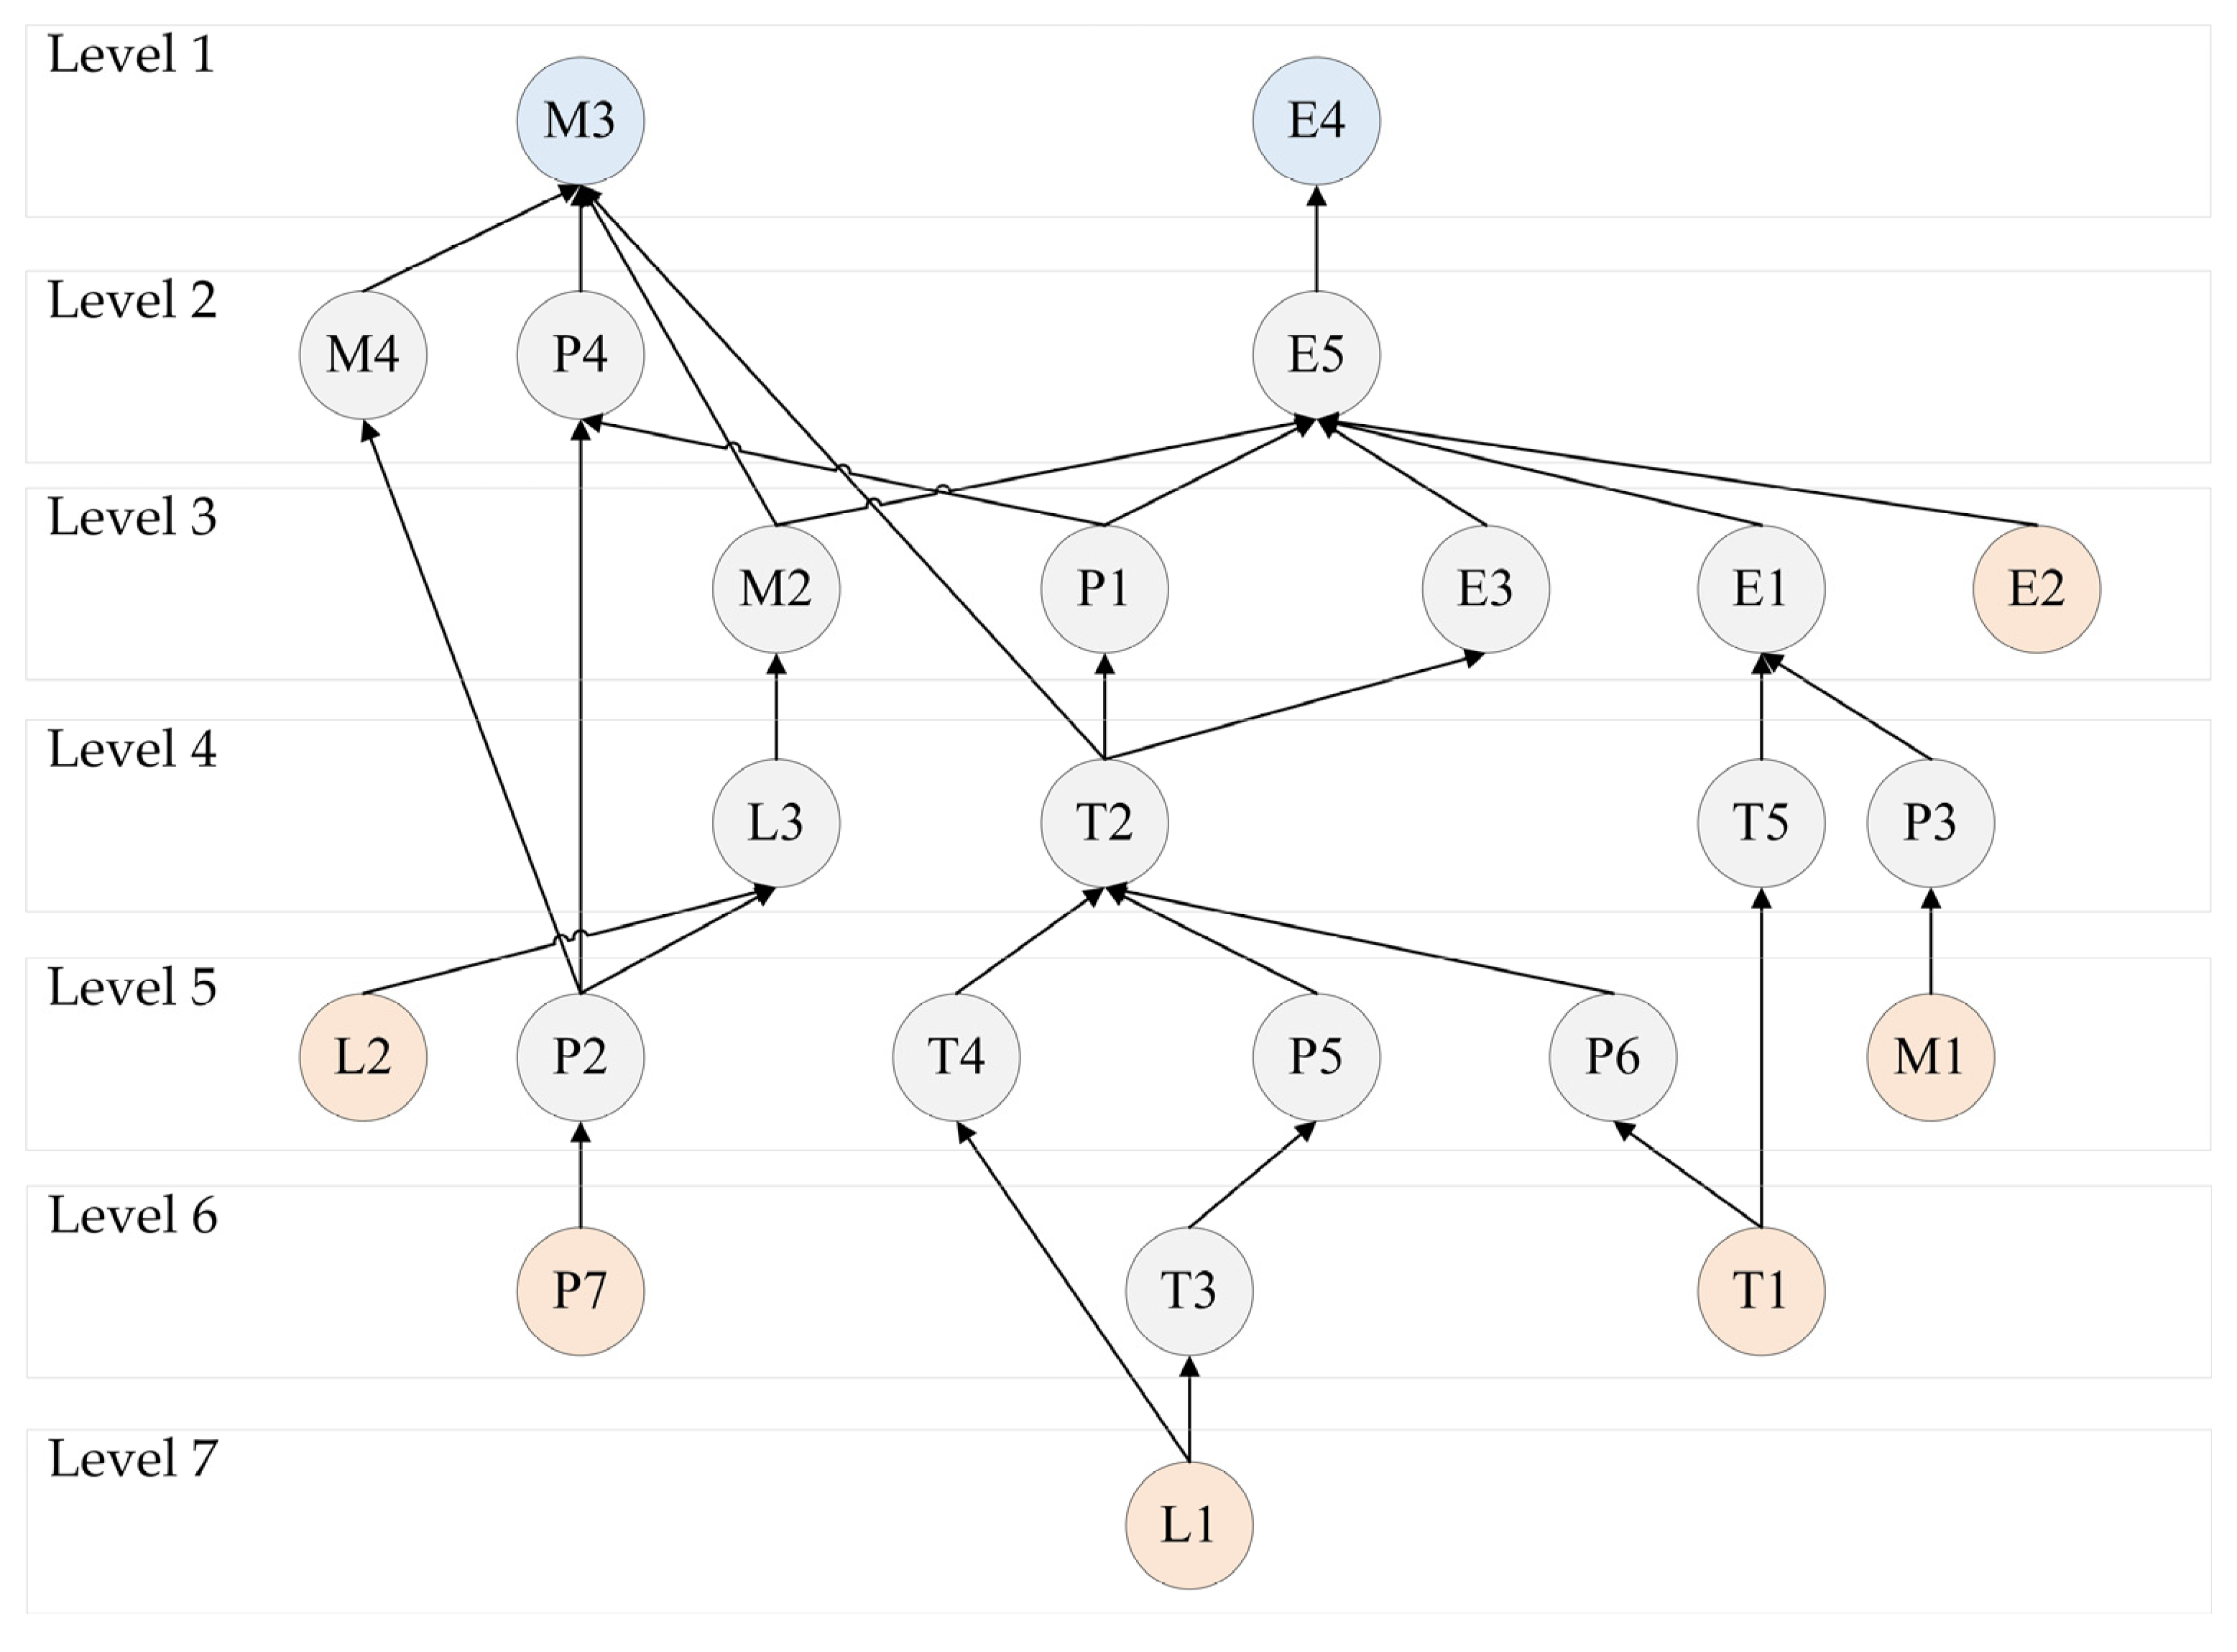
Establishing a Hierarchical Structure Model: Based on the hierarchical division results, a reduced reachable matrix R’ is constructed. After sorting, the reduced reachable matrix becomes a lower triangular matrix. Each constraining factor is plotted according to its level. The relationships between adjacent factors are represented by directed line segments, and if there are directed line segments between adjacent levels, there is no need to plot connections between factors across levels.

3.4. Matrices Impacts Corises-Multiplication Appliance Classification—MICMAC

Building on ISM, Duperrin and Godet introduced the Matrices Impacts Corises-Multiplication Appliance Classment (MICMAC) method to examine the propagation of inter-factor relationships within a system and classify the factors into distinct categories. The primary purpose of MICMAC is to analyze the influence and dependency relationships among factors in complex systems by classifying them according to their driving power and dependence, thereby identifying the system’s key elements through comprehensive analysis. Driving power reflects a factor’s ability to influence others, calculated as the row sum of that factor in the reachability matrix (Equation (11)); dependence power indicates the degree to which a factor is influenced by others, calculated as the column sum of that factor in the reachability matrix (Equation (12)). Through MICMAC analysis, safety risk factors can be categorized into four types: autonomous factors with both low driving power and low dependence; driving factors with high driving power but low dependence; dependent factors with low driving power but high dependence; and linkage factors with both high driving power and high dependence.
D i = j = 1 n r i j
D j = i = 1 n r i j

3.5. Data Collection

In accordance with the calculation requirements of AHP, we designed a questionnaire and conducted a survey through Wenjuanxing (a questionnaire platform), inviting experts from the government, universities, research institutions, investment units, design units, construction units, BIM consulting units, and software development companies to participate. During the collection process, we reviewed the qualifications of the experts, with BIM-related work experience being the foundation for participation in the survey. The basic information of the experts is presented in Table 4. The questionnaire was divided into two parts: the first part collected basic information about the experts, such as educational background, work experience, professional title, and type of expertise; the second part focused on the importance of various risk factors of BIM application in China. Experts performed pairwise comparisons of the importance of each factor using the 9-point scale method. This research was conducted by one professor and three students, and a total of 40 valid responses on the importance of BIM application risk factors in China were collected. The expert information is shown in Table 4. As seen, the experts come from various fields, with at least three experts from each industry, ensuring that the sample represents the general perception within each sector. All experts have considerable BIM work experience, with only two experts having less than one year of work experience. According to further information, these two experts had just graduated from school, and their work experience is limited, but they were also engaged in BIM-related research during their studies.

4. Results and Analysis

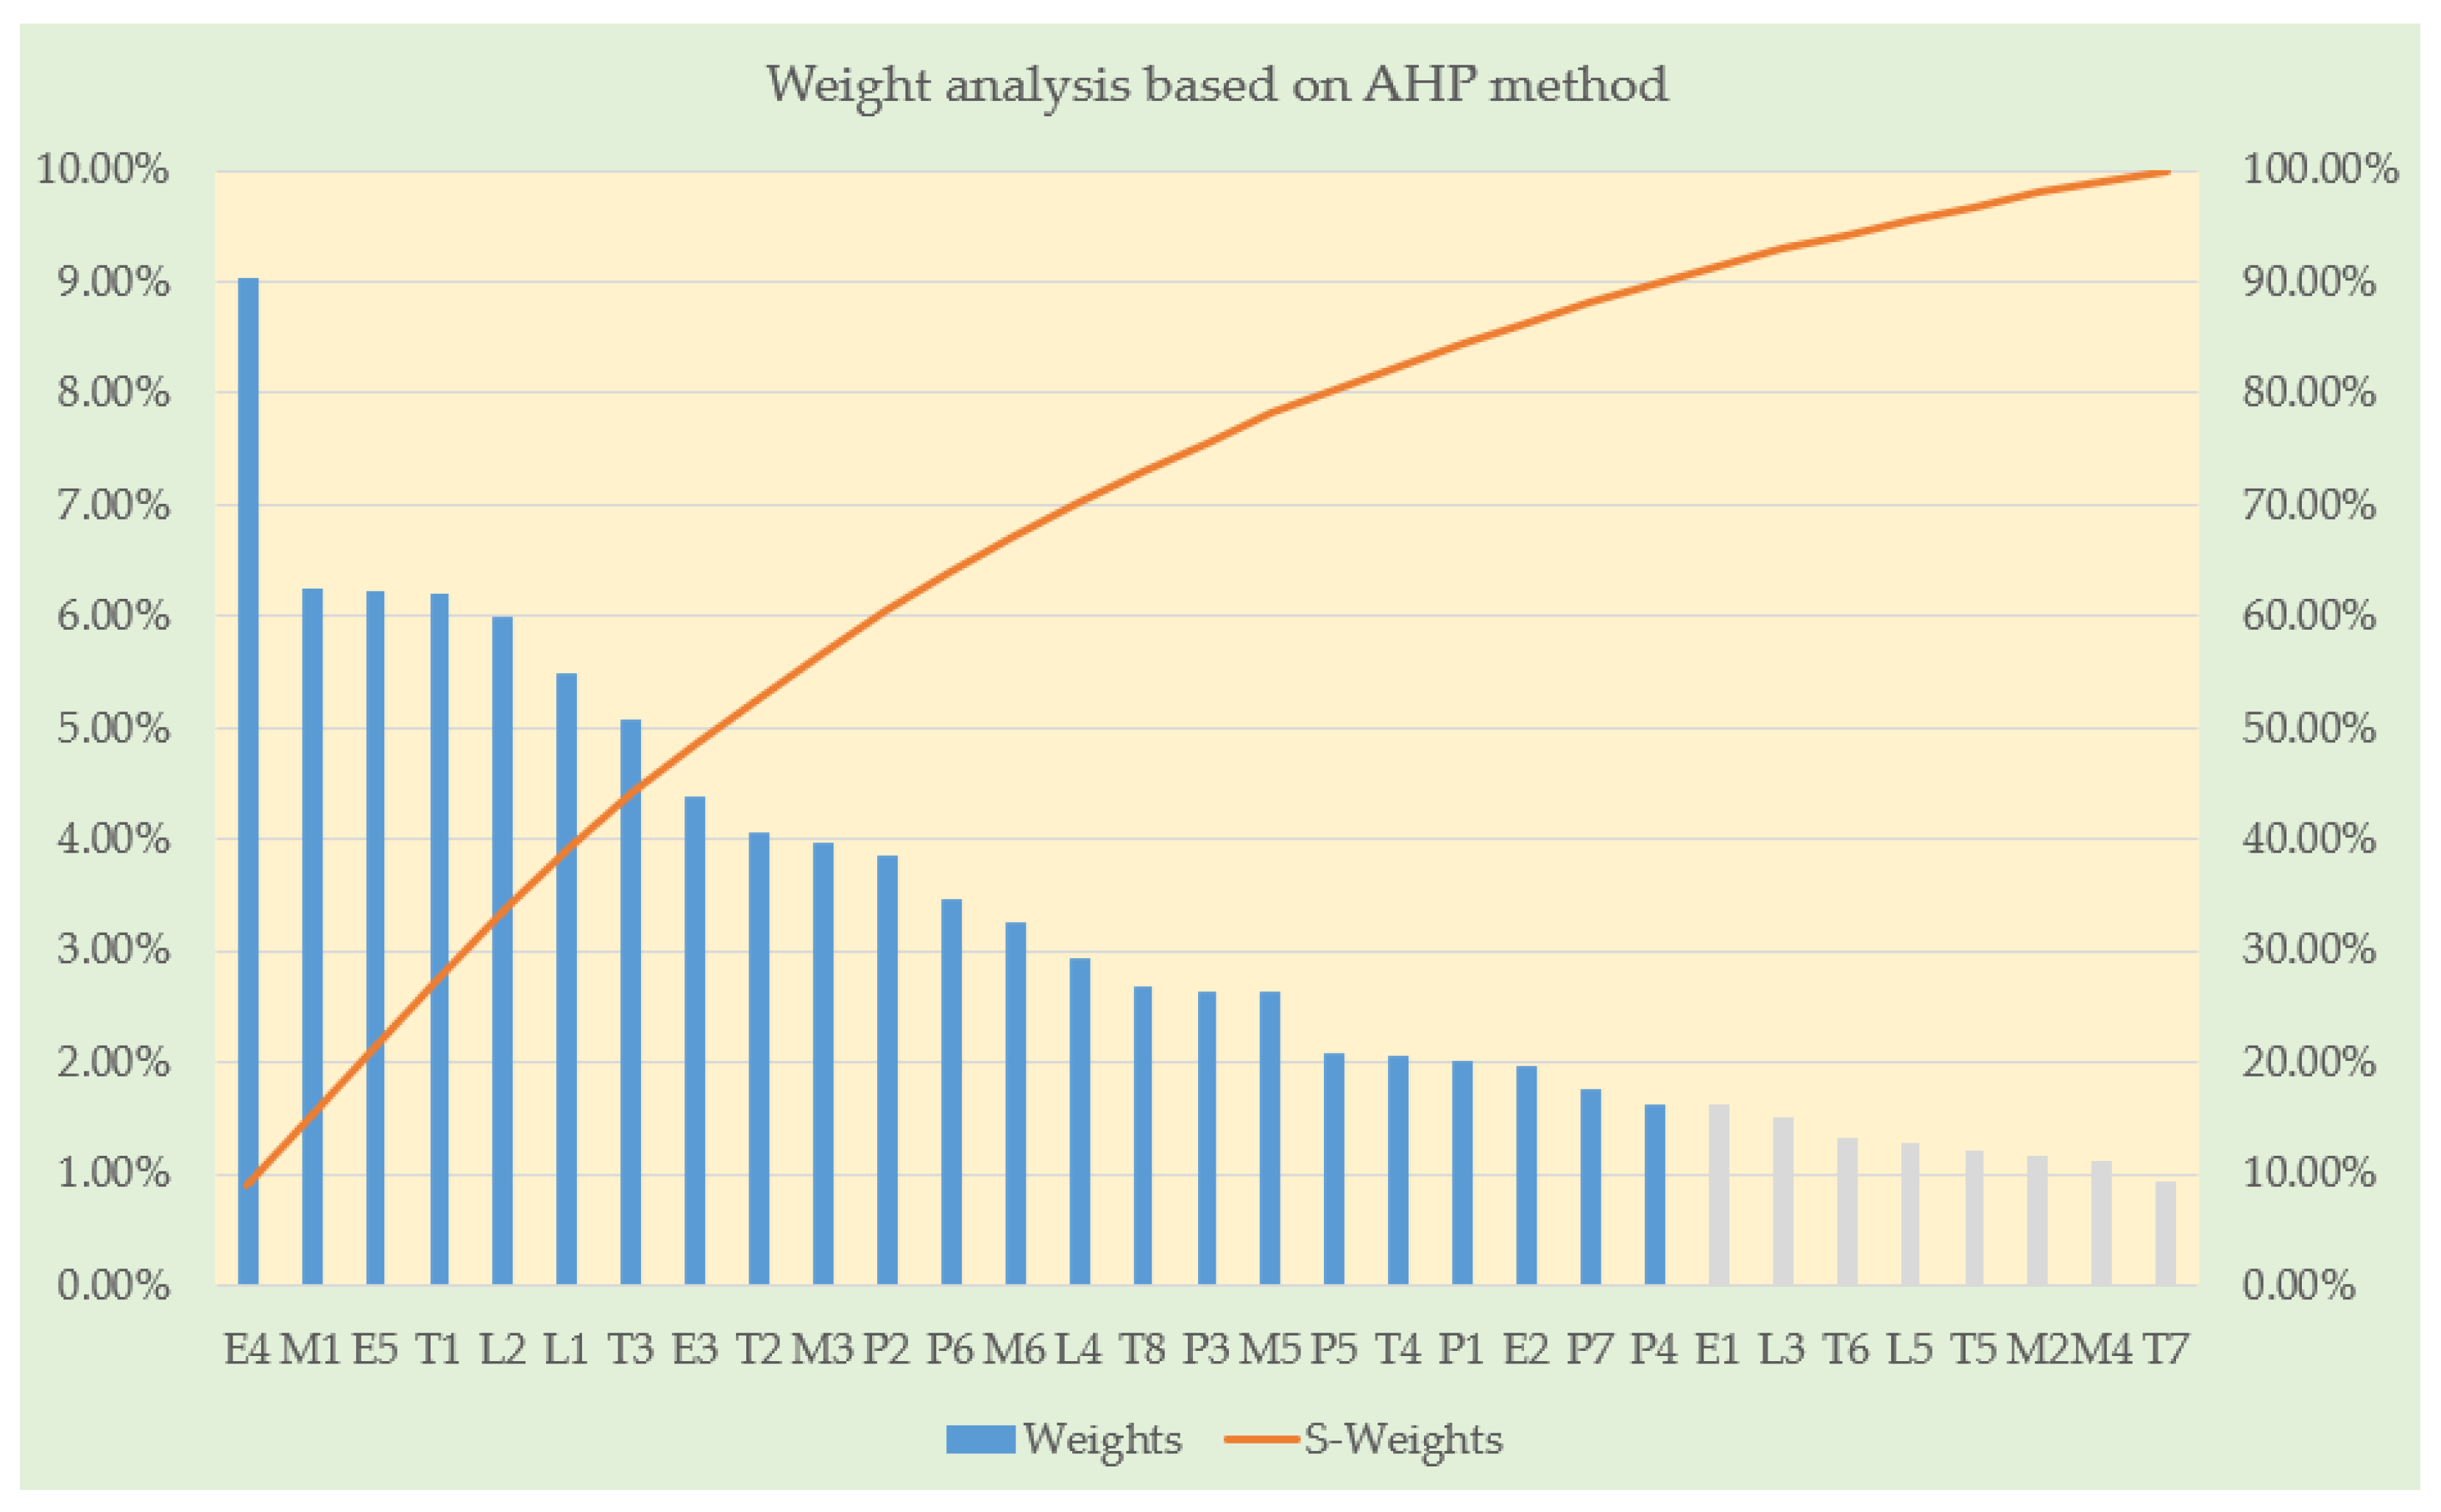
4.1. Determining Key Risk Factors for BIM Application Based on AHP

Based on the 40 expert opinions collected, the average values were calculated to obtain one criterion-level judgment matrix and five indicator-level judgment matrices. The study indicates that a minimum of five experts is required for AHP analysis [45]. Clearly, the opinions of 40 experts have sufficiently met the requirements for AHP analysis. Subsequently, the weights of each factor were computed using Equations (1)–(4), and consistency checks were performed using Equations (5) and (6). Taking the criterion level as an example, the calculation results obtained from the judgment matrix operations are shown in Table 5.
Using the survey results, each judgment matrix was processed, and the actual weights of the indicator-level factors were calculated according to Equation (7). The final criterion-level weights, relative weights of the indicator level, and actual weights are presented in Table 6.
The ABC classification method considers factors with weights in the bottom 10% of the ranking as insignificant. Additionally, interpretative structural modeling (ISM) typically requires a limited number of factors for effective system analysis. Therefore, this study selected risk factors with cumulative weights reaching 90% as the key risk factors for BIM application [46], as illustrated in Figure 2. The AHP results reveal that among the risk factors affecting BIM application, technical factors rank highest at the criterion level, accounting for 23.59% of the total weight, followed by economic and managerial factors, with application process and legal factors having the least influence. Notably, “Uncertainty in return on investment” has the highest individual weight (9.04%) among all risk factors. However, relying solely on weight analysis is insufficient, as risk factors are interrelated. Thus, this study further employs ISM to explore the relationships among the key risk factors.

4.2. Determining Interrelationships Among Key Risk Factors Based on ISM

Based on the AHP results, 24 key risk factors affecting BIM application were identified, as listed in Table 7. However, after determining these key risk factors, it is necessary to further explore their interrelationships. Following the identification of the main risk factors, 40 experts were contacted via email, and seven agreed to participate in interviews. The study shows that the opinions of seven experts are sufficient to meet the requirements of the ISM method [47]. Semi-structured interviews were conducted to assess the pairwise relationships among the factors as perceived by the experts. Discrepancies in expert opinions were resolved through multiple rounds of discussions, ultimately leading to a consensus. This process yielded an adjacency matrix A, which represents the direct relationships between risk factors. In the adjacency matrix, aij = 1 indicates that risk factor Si directly influences risk factor Sj, while aij = 0 indicates no direct influence. After obtaining the adjacency matrix, reachability matrix operations were performed using Boolean algebra, with computations conducted in MATLAB R2022b. The results are presented in Figure 3.
Subsequently, the system’s connectivity was determined by examining whether the intersection of reachable sets for bottom-level elements was empty. Using the definition of the highest-level set, the risk factors were stratified into distinct hierarchical levels, yielding the hierarchical classification presented in Table 8. Based on both the reachability matrix and hierarchical classification results, a multi-level hierarchical structure model for BIM application risk factors was developed, as illustrated in Figure 4.
Based on Table 8 and Figure 4, the interaction among the 24 main risk factors of BIM implementation forms a system, reflected by the ISM model, which illustrates the interrelationships between the factors. Through structural analysis of the model, the system is divided into 7 levels, with the 1st level being the direct factors, levels 2–6 being intermediate factors, and the 7th level being the bottom-level factors. At the bottom level, there is one fundamental factor, namely “Inadequate BIM standards and protocols (L1)”. The bottom-level factors can influence other factors without being influenced by them, representing the fundamental risk factors of BIM implementation. Standards and regulations form the foundation of BIM implementation, and inadequacies in foundational conditions lead to risks that are difficult to avoid in advance. Enhancing the BIM standard system is the fundamental approach to reducing the risks of BIM implementation, as well as the fundamental issue in exploring successful BIM implementation. Furthermore, “Lack of software function (T1)”, “Inadequate BIM-related laws and regulations (L2)”, “Infrastructure preparation of BIM application (E2),” “Lack of BIM practice experience (M1)”, and “Changes in delivery mode (P7)”, although not bottom factors, are also not influenced by other factors and are fundamental risk factors for BIM application. These six factors are the root causes of risks in BIM implementation and are critical factors that need to be addressed in the promotion process of BIM implementation.
“Uncertainty in return on investment (E4)” and “Synergy dilemma (M3)” are factors at the top level of the model and are the most direct causes of risks in BIM implementation. ROI is the most critical factor for enterprises to decide whether to invest in a project or not. Enterprises must ensure that the projects they invest in generate certain benefits for survival and development. Research shows that cost issues are key challenges faced in the promotion of every technology or product. Effective collaboration is a necessary condition for the smooth completion of engineering projects. However, due to differences in understanding and varying levels of mastery of BIM among stakeholders, interface conflicts exist among them. The difficulty in collaboration leads to deviations from project goals. These two factors are the most direct influencers on the successful implementation of BIM and are also the most important risk factors in BIM implementation.
Levels 2–6 are intermediate factors involving risks in five aspects: technology, economy, law, management, and process. Among them, factors with strong transmission effects include “Model management difficulties (T2)” and “High process investment (E5)”. These factors are influenced by basic elements and also affect the top-level factors, demonstrating transmission effects.

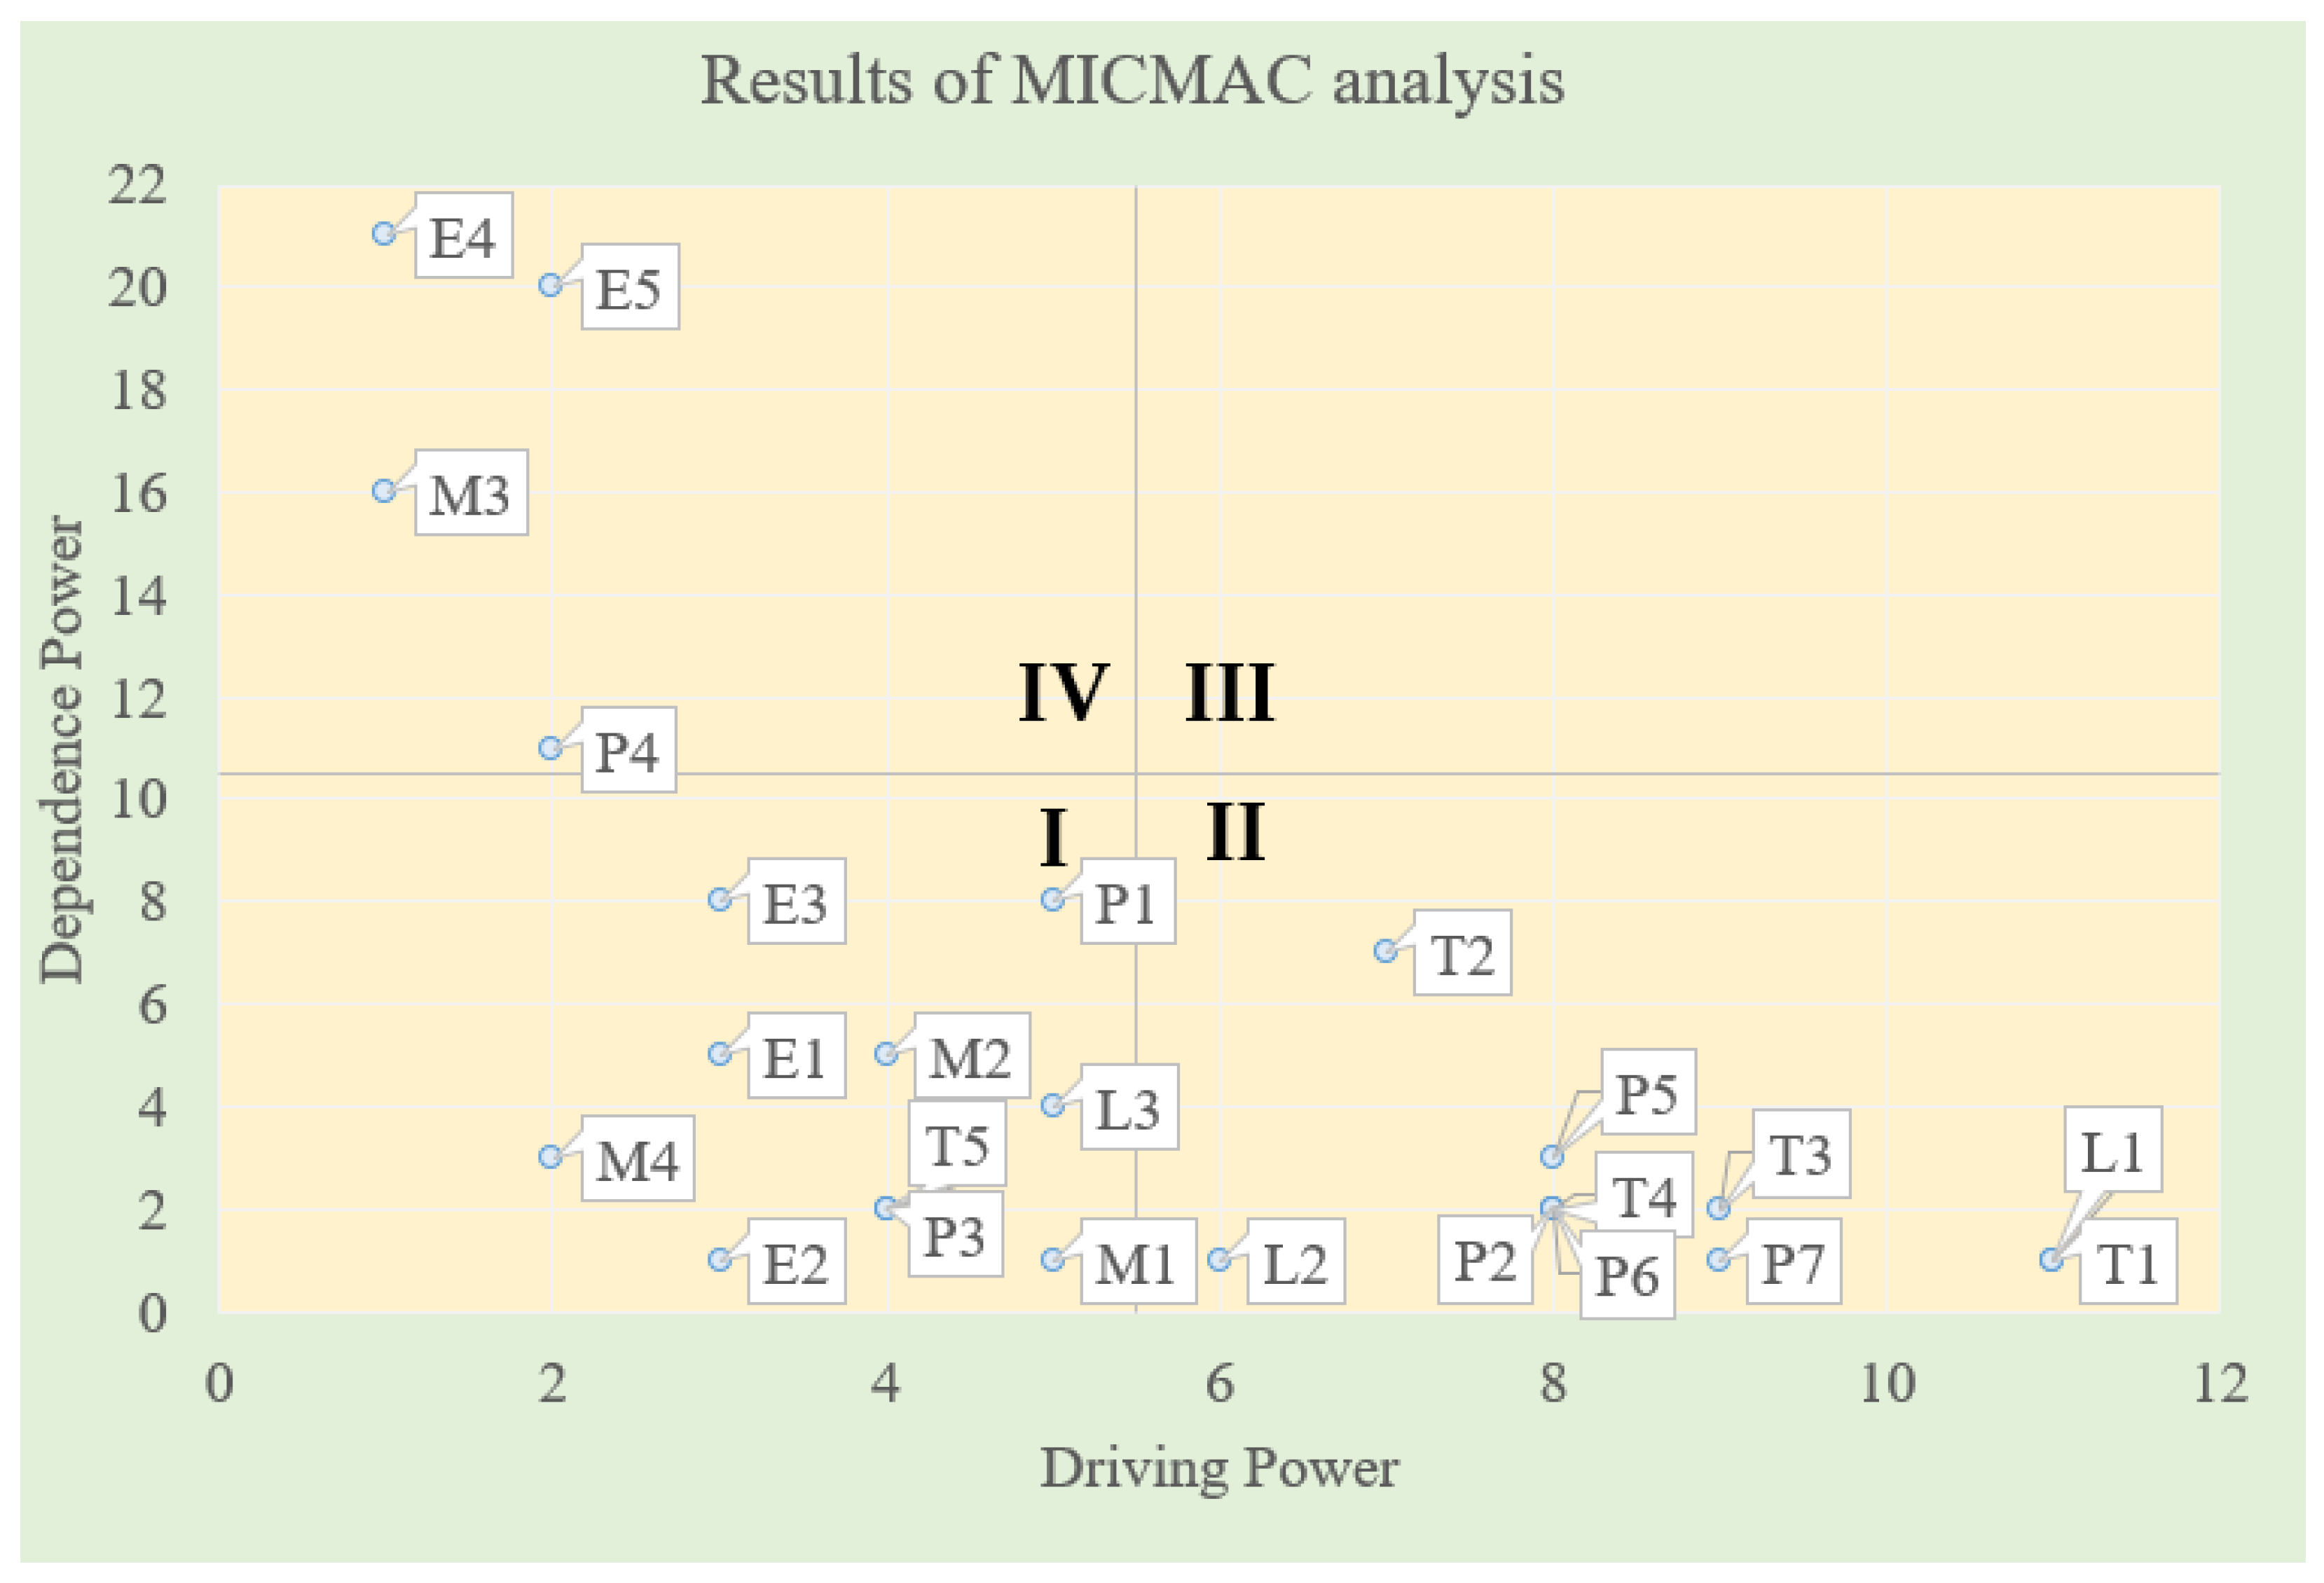
4.3. Classification Analysis of Risk Factors Based on MICMAC

MICMAC analysis, based on the reachability matrix, calculates driving power and dependence power. Driving power is the sum of row values where risk factors lie, while dependence power is the sum of column values where risk factors lie. Using MATLAB R2022b to perform calculations on the reachability matrix, MICMAC classifies the risk factors of BIM application into four categories: autonomous factors, driving factors, linkage factors, and dependent factors. The calculation results are presented in Table 9, and the visual representation of MICMAC analysis is depicted in Figure 5.
In the first quadrant, there are autonomous factors, including “T5, E1, E2, E3, L3, M1, M2, M4, P1, P3”. Autonomous factors have relatively low driving power and dependence power, and their relationships with other factors are straightforward. They play a mediating role between superficial and deep factors. It can be observed that these factors are positioned within the intermediate region of the structural model.
In the second quadrant, there are driving factors, including “T1, T2, T3, T4, L1, L2, P2, P4, P5, P6”. Driving factors have high driving power and low dependence power, where higher driving power indicates a stronger influence on other factors. Among them, “Lack of software function (T1)” and “Inadequate BIM standards and protocols (L1)” have the highest driving power, indicating their strongest driving role in the system. Such factors are deep-level factors in the model, generally located in the lower half of the model, and controlling these factors can effectively reduce the probability of other risk factors occurring.
The third quadrant represents the linkage factors, which have both high driving power and dependence power. According to the MICMAC analysis results, there are no linkage factors in the model, indicating the absence of factors with both high driving power and dependence power. This is consistent with reality, as it is difficult to achieve a significant reduction in the risk level of BIM implementation by addressing a single risk factor.
The fourth quadrant consists of dependent factors, including “E4, E5, M3, P4”. Dependent factors have high dependence power and low driving power, with higher dependence power indicating greater susceptibility to the influence of other factors. Among them, “Uncertainty in return on investment (E4)” has the greatest dependence power, indicating that it is most affected by other risk factors in the system. Such factors typically reside in the upper half of the model and are the most direct reasons for the challenges in successful BIM implementation.

5. Discussion and Recommendations

5.1. Discussion

This study established an initial list of BIM implementation risk factors through a literature review and determined 24 key BIM application risk factors by calculating their weight values using the AHP method. Subsequently, an ISM-based relationship model was constructed to analyze interrelationships among these risk factors. MICMAC analysis further classified the factors at a systemic level.
The research reveals that compared to technical, legal, managerial, and process risks, respondents pay more attention to economic risks in BIM implementation. Among these, “Uncertainty in return on investment (E4)” has the highest weight percentage. Economic risks have consistently been a focal point in BIM implementation—as early as the beginning of the 21st century, researchers recognized that BIM implementation was significantly affected by economic risks [48]. This aligns with the current situation in China, where BIM’s potential remains unrealized due to various factors leading to low returns, causing investors to hold negative attitudes and enterprises to lack motivation for BIM adoption.
The ISM model shows that economic and managerial factors directly impact BIM’s successful application. For enterprises, poor return on investment leads to negative attitudes toward BIM adoption. When market demand for BIM is also weak, related technologies and products are gradually abandoned. Therefore, BIM implementation requires initial government support through policies and economic incentives. Once adoption reaches a certain level, optimized organizational processes, complete industrial chains, and resolved cost issues will naturally lead to satisfactory returns. Simultaneously, collaborative management is equally crucial, as project success largely depends on effective coordination management.
At the model’s foundational level, “Inadequate BIM standards and protocols (L1)” emerges as the fundamental risk factor affecting BIM application. Together with “Lack of software function (T1)”, “Inadequate BIM-related laws and regulations (L2)”, “Infrastructure preparation of BIM application (E2)”, “Lack of BIM practical experience (M1)”, and “Changes in delivery mode (P7)”, these constitute root causes affecting BIM’s successful implementation. Such risk factors require certain transmission paths to ultimately impact BIM implementation, making them relatively less urgent to address.

5.2. Related Response Strategies to the Risk Factors of BIM Implementation

To facilitate the successful implementation of BIM, this study proposes a three-level strategy at the industry, organizational, and project levels, as illustrated in Figure 6. At the industry level, emphasis should be placed on addressing the fundamental reasons affecting BIM implementation. In academia, there should be enhanced research on BIM in the engineering industry to assist governmental bodies in standardization and policy-making. Meanwhile, governmental support for BIM implementation should be based on partial policy backing. Furthermore, governmental support for BIM implementation should include partial policy backing. This has proven effective in the case of the Huahua Airport project in China, where the project ensured the legality of three-dimensional models, providing policy support for BIM implementation in the construction industry. Additionally, appropriate economic subsidies are necessary because China is still in the early stages of BIM technology adoption. Limited experience and other factors result in significant initial investments, necessitating subsidies to cover trial-and-error costs. For software vendors, when the government establishes relevant standards and specifications, they should tailor their BIM software or tools to the Chinese market accordingly. Currently, some software has been developed domestically, but these programs cannot achieve software interoperability like Autodesk’s Revit software suite to meet various construction needs.
At the organizational level, companies should hire BIM experts and organize BIM training for their employees to ensure they have the necessary expertise when participating in BIM projects. Additionally, actively participating in BIM-related projects to gain sufficient experience is essential. At the project level, the implementation of BIM technology has changed workflow and methods, rendering traditional organizational structures and collaborative mechanisms inadequate to meet the needs of BIM implementation. When involved in specific BIM projects, organizational structures should be adjusted, and collaborative mechanisms should be optimized. Addressing various project objectives, such as quality, cost, schedule, safety, etc., management processes tailored to BIM should be established based on 3D models to achieve the goal of lean construction.

6. Conclusions

BIM serves as a crucial tool for addressing production challenges and enhancing efficiency in the construction industry. However, there remains a significant gap between its actual application outcomes and its vast potential, primarily due to risks associated with BIM implementation. This study establishes an initial list of BIM application risk factors through literature review, identifies key risk factors using the Analytic Hierarchy Process (AHP), clarifies interrelationships among these factors and constructs a hierarchical structure via Interpretive Structural Modeling (ISM), and subsequently classifies the risk factors based on driving and dependence power through MICMAC (Matrices Impacts Corises-Multiplication Appliance Classment) analysis. Building on this foundation, a three-tiered strategy to promote BIM implementation is proposed, encompassing industry, organizational, and project levels. The main findings are as follows:
(1)
Through literature review, an initial list of BIM implementation risk factors was established, identifying 31 risk factors across five dimensions: technical, economic, legal, managerial, and procedural. To extract the primary risk factors, questionnaires were distributed to score the relative importance of each factor using a 9-point scale. The AHP method ultimately identified 24 major BIM application risk factors, among which “Uncertainty in return on investment” carried the highest weight.
(2)
Building on the identification of key BIM application risks, the ISM method was applied to analyze interrelationships among risk factors, categorizing them into seven hierarchical levels. MICMAC analysis further classified the risk factors into 10 autonomous factors, 10 driving factors, and 4 dependent factors. The study reveals that “inadequate BIM standards and protocols (L1),” along with “lack of software function (T1),” “Inadequate BIM-related laws and regulations (L2),” “Infrastructure preparation of BIM application (E2),” “Lack of BIM practical experience (M1),” and “Changes in delivery mode (P7),” constitute the root causes of BIM application challenges. Meanwhile, “Uncertainty in return on investment (E4)” and “Synergy-dilemma (M3)” are top-level factors in the model, representing the most direct causes of BIM-related risks.
(3)
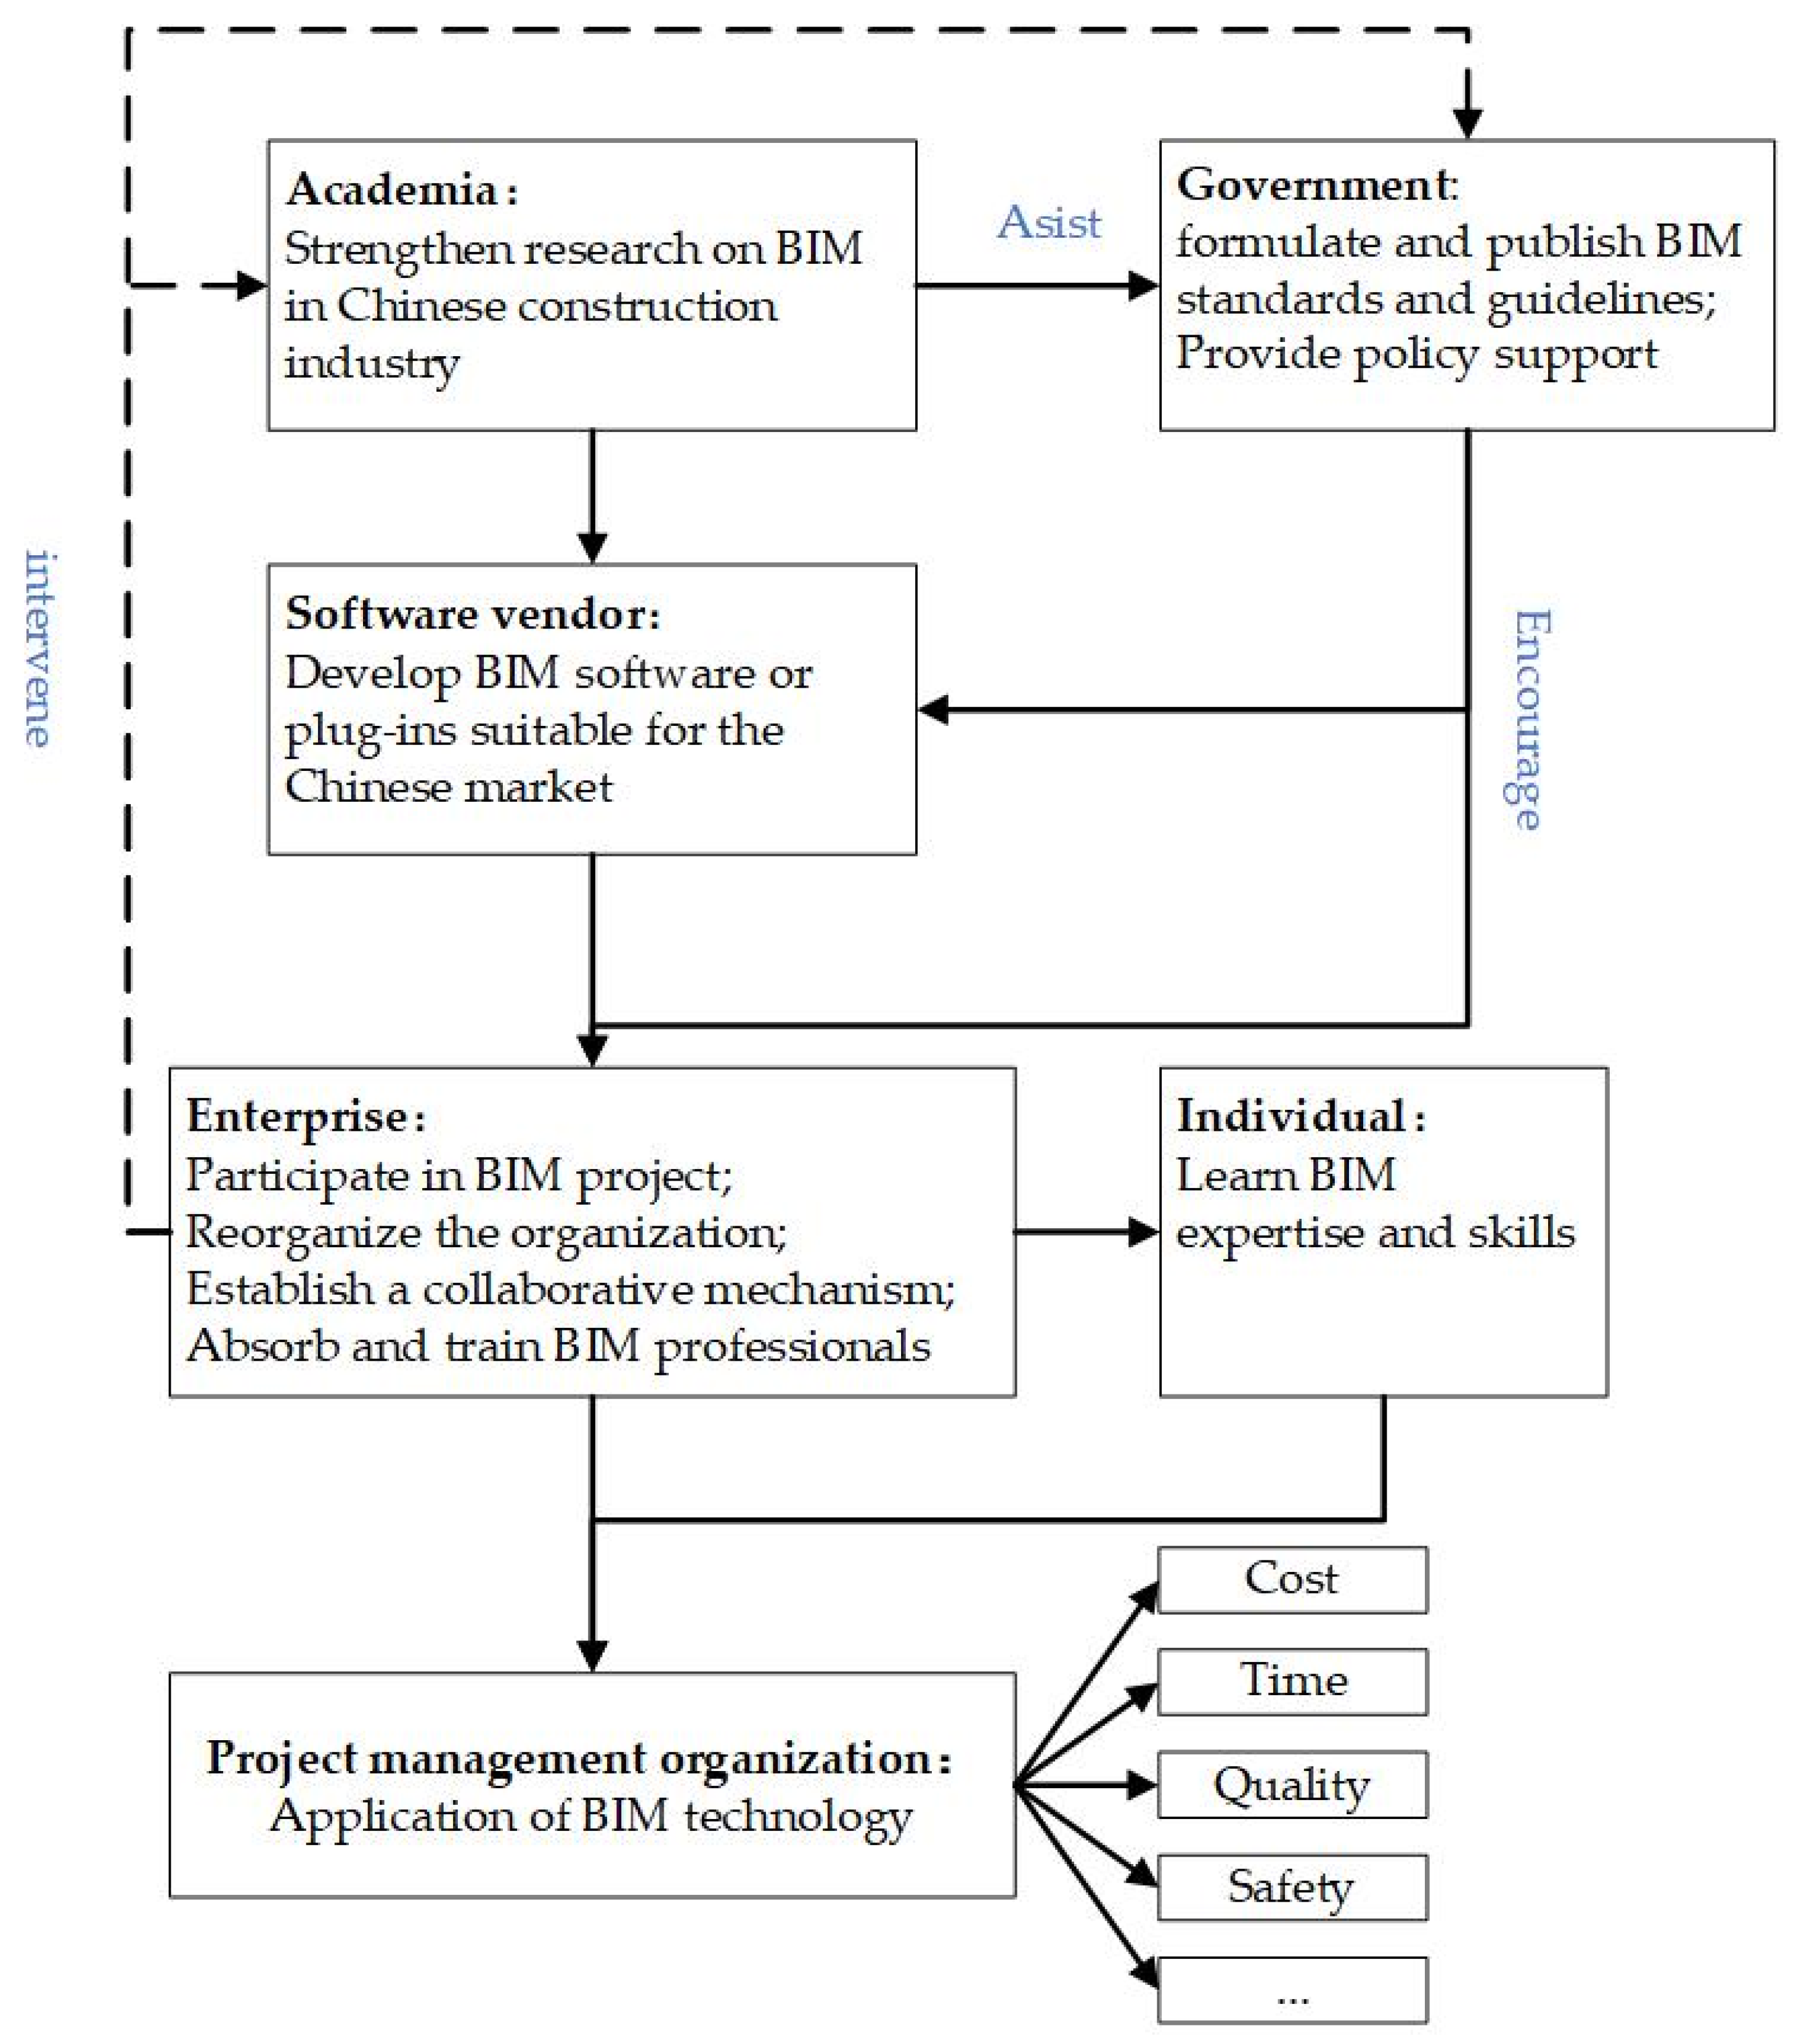
Based on risk classification, a three-tiered strategy to promote BIM implementation was proposed across industry, organizational, and project levels. At the industry level, academia, government, and software vendors should focus on addressing foundational factors. At the organizational level, enterprises and individuals should prioritize organizational restructuring and skill development. At the project level, BIM-based project management should be implemented in alignment with specific project objectives.
This study proposes a management process related to BIM application risks, namely AHP-ISM-MICMAC. The list of risk factors of BIM application established through the literature review and AHP method is more scientific; the interrelationships and hierarchical structure among the risk factors established through ISM are also more reliable, which is the novelty of this research. By using MICMAC for risk classification, key risk factors can be identified, providing guidance for the formulation of BIM application promotion strategies. In different countries and regions, the depth of BIM application varies. The method used in this study provides a reference for other countries and regions to identify the main risk factors and their interrelationships, thereby improving the effectiveness of BIM application.
However, this study has certain limitations. First, it focuses on major risk factors and excludes lower-impact risks to avoid excessive complexity, though this does not imply that these minor risks should be ignored. Second, the relatively small number of participating experts and narrow data sources introduce a degree of subjectivity. Future research could expand the scope to improve objectivity. Furthermore, combined effects among risk factors—such as coupling or counteracting interactions—as well as their influence coefficients, warrant further investigation.

Author Contributions

Conceptualization, S.H.; methodology, C.S. and Y.Z.; validation, C.S. and C.T.; formal analysis, C.T.; investigation, C.S. and Y.G.; resources, C.T.; data curation, Y.Z. and Y.G.; writing—original draft preparation, C.S. and C.T.; writing—review and editing, C.S. and Y.G.; visualization, C.T.; supervision, C.T.; project administration, S.H.; funding acquisition, S.H. All authors have read and agreed to the published version of the manuscript.

Funding

This research was funded by the Start-up Fund for RAPs under the Strategic Hiring Scheme of the Hong Kong Polytechnic University (grant number P0042478) and the Internal Research Fund of the Hong Kong Polytechnic University (grant number P0047899).

Data Availability Statement

All data generated or analyzed during the study are available from the corresponding author by request.

Acknowledgments

The authors would express their thanks to everyone who helped with this research.

Conflicts of Interest

Author Yuchen Gan was employed by the company Wuhan Urban Construction Group. The remaining authors declare that the research was conducted in the absence of any commercial or financial relationships that could be construed as a potential conflict of interest.

References

  1. Rezgui, Y.; Zarli, A. Paving the way to the vision of digital construction: A strategic roadmap. J. Constr. Eng. Manag. 2006, 132, 767–776. [Google Scholar] [CrossRef]
  2. Li, S.; Jiang, Z.; Xu, Z. BIM-Based Model Checking: A Scientometric Analysis and Critical Review. Appl. Sci. 2025, 15, 49. [Google Scholar] [CrossRef]
  3. Giel, B.K.; Issa, R.R.A. Return on Investment Analysis of Using Building Information Modeling in Construction. J. Comput. Civ. Eng. 2013, 27, 511–521. [Google Scholar] [CrossRef]
  4. Heaton, J.; Parlikad, A.K.; Schooling, J. A Building Information Modelling approach to the alignment of organisational objectives to Asset Information Requirements. Autom. Constr. 2019, 104, 14–26. [Google Scholar] [CrossRef]
  5. Charef, R.; Emmitt, S. Uses of building information modelling for overcoming barriers to a circular economy. J. Clean. Prod. 2021, 285, 124854. [Google Scholar] [CrossRef]
  6. Lee, D.-J.; Hyun, J.-O.; Min, S.G.; Lim, J.-Y.; Shin, M.C.; Kwon, S.H. A Case Study on Construction Management Based on BIM Data. KSCE J. Civ. Environ. Eng. Res. 2024, 44, 223–229. [Google Scholar]
  7. BS EN ISO 19650; Organization and Digitization of Information about Buildings and Civil Engineering Works, Including Building Information Modelling (BIM)—Information Management Using Building Information Modelling. British Standards Institution: London, UK, 2019.
  8. Abanda, F.H.; Balu, B.; Adukpo, S.E.; Akintola, A. Decoding ISO 19650 Through Process Modelling for Information Management and Stakeholder Communication in BIM. Buildings 2025, 15, 431. [Google Scholar] [CrossRef]
  9. Hwang, B.G.; Ngo, J.; Her, P.W.Y. Integrated Digital Delivery: Implementation status and project performance in the Singapore construction industry. J. Clean. Prod. 2020, 262, 121396. [Google Scholar] [CrossRef]
  10. Liao, L.; Teo, E.A.L. Critical Success Factors for enhancing the Building Information Modelling implementation in building projects in Singapore. J. Civ. Eng. Manag. 2017, 23, 1029–1044. [Google Scholar] [CrossRef]
  11. Waqar, A.; Othman, I.; Radu, D.; Ali, Z.; Almujibah, H.; Hadzima-Nyarko, M.; Khan, M.B. Modeling the Relation between Building Information Modeling and the Success of Construction Projects: A Structural-Equation-Modeling Approach. Appl. Sci. 2023, 13, 9018. [Google Scholar] [CrossRef]
  12. Chen, Y.; Dib, H.; Cox, R.F.; Shaurette, M.; Vorvoreanu, M. Structural Equation Model of Building Information Modeling Maturity. J. Constr. Eng. Manag. 2016, 142, 04016032. [Google Scholar] [CrossRef]
  13. Altwassi, E.J.; Aysu, E.; Ercoskun, K.; Abu Raed, A. From Design to Management: Exploring BIM’s Role across Project Lifecycles, Dimensions, Data, and Uses, with Emphasis on Facility Management. Buildings 2024, 14, 611. [Google Scholar] [CrossRef]
  14. Cao, P.; Cao, Z.; Huang, D.L.; Wang, J.W. Hybrid Model for BIM Application Maturity in Prefabricated Buildings: A Case Study in Xi’an, China. Buildings 2025, 15, 1322. [Google Scholar] [CrossRef]
  15. Xiang, Y.M.; Mahamadu, A.M.; Florez-Perez, L. Engineering information format utilisation across building design stages: An exploration of BIM applicability in China. J. Build. Eng. 2024, 95, 110030. [Google Scholar] [CrossRef]
  16. Xie, M.J.; Qiu, Y.; Liang, Y.; Zhou, Y.; Liu, Z.; Zhang, G. Policies, applications, barriers and future trends of building information modeling technology for building sustainability and informatization in China. Energy Rep. 2022, 8, 7107–7126. [Google Scholar] [CrossRef]
  17. Ozorhon, B.; Karahan, U. Critical Success Factors of Building Information Modeling Implementation. J. Manag. Eng. 2017, 33, 04016054. [Google Scholar] [CrossRef]
  18. Kuai, X.; Liu, Y.; Bi, M.; Luo, Q. Deciphering Building Information Modeling Evolution: A Comprehensive Scientometric Analysis across Lifecycle Stages. Buildings 2023, 13, 2688. [Google Scholar] [CrossRef]
  19. Viana, V.L.B.; Carvalho, M.T.M. Prioritization of Risks related to BIM Implementation in Brazilian Public Agencies Using Fuzzy Logic. J. Build. Eng. 2020, 36, 102104. [Google Scholar] [CrossRef]
  20. Farooq, U.; Rehman, S.K.U.; Rehman, U.; Faisal, A.; Alyousef, R. Investigating BIM Implementation Barriers and Issues in Pakistan Using ISM Approach. Appl. Sci. 2020, 10, 7250. [Google Scholar] [CrossRef]
  21. ISO 31000; Risk Management—Guidelines. International Organization for Standardization: Geneva, Switzerland, 2009.
  22. Sun, C.; Jiang, S.; Skibniewski, M.J.; Man, Q.; Shen, L. A literature review of the factors limiting the application of BIM in the construction industry. Technol. Econ. Dev. Econ. 2015, 23, 764–779. [Google Scholar] [CrossRef]
  23. Sun, C.; Xu, H.; Jiang, S. Understanding the risk factors of BIM technology implementation in the construction industry: An interpretive structural modeling (ISM) approach. Eng. Constr. Archit. Manag. 2020, 27, 3289–3308. [Google Scholar] [CrossRef]
  24. Liang, R.B.; Ma, H.B.; Wang, P.; Zhao, L. The applications of building information modeling in the life-cycle of green buildings: A comprehensive review. Sci. Technol. Built Environ. 2024, 30, 932–958. [Google Scholar] [CrossRef]
  25. Meng, G.; Hu, H.; Chen, L. The application obstacles of BIM technology in green building project and its key role path analysis. Sci. Rep. 2024, 14, 30330. [Google Scholar] [CrossRef]
  26. Chien, K.F.; Wu, Z.H.; Huang, S.C. Identifying and assessing critical risk factors for BIM projects: Empirical study. Autom. Constr. 2014, 45, 1–15. [Google Scholar] [CrossRef]
  27. Hsu, K.M.; Hsieh, T.Y.; Chen, J.H. Legal risks incurred under the application of BIM in Taiwan. Proc. Inst. Civ. Eng. 2015, 168, 127–133. [Google Scholar] [CrossRef]
  28. Tan, T.; Chen, K.; Xue, F.; Lu, W. Barriers to Building Information Modeling (BIM) implementation in China’s prefabricated construction: An interpretive structural modeling (ISM) approach. J. Clean. Prod. 2019, 219, 949–959. [Google Scholar] [CrossRef]
  29. Tabatabaee, S.; Mahdiyar, A.; Ismail, S. Towards the success of Building Information Modelling implementation: A fuzzy-based MCDM risk assessment tool. J. Build. Eng. 2021, 43, 103117. [Google Scholar] [CrossRef]
  30. Zarghami, S.A. Anatomy of interactions among risk factors influencing implementation of building information modeling (BIM): A system dynamics approach. Eng. Constr. Archit. Manag. 2023, 30, 1527–1541. [Google Scholar] [CrossRef]
  31. Chan, D.W.M.; Olawumi, T.O.; Ho, A.M.L. Perceived benefits of and barriers to Building Information Modelling (BIM) implementation in construction: The case of Hong Kong. J. Build. Eng. 2019, 25, 100764. [Google Scholar] [CrossRef]
  32. Wu, Z.; Lu, Y.; He, Q.; Hong, Q.; Chen, C.; Antwi-Afari, M.F. Investigating the Key Hindering Factors and Mechanism of BIM Applications Based on Social Network Analysis. Buildings 2022, 12, 1270. [Google Scholar] [CrossRef]
  33. Liu, Y.; Van Nederveen, S.; Hertogh, M. Understanding effects of BIM on collaborative design and construction: An empirical study in China. Int. J. Proj. Manag. 2017, 35, 686–698. [Google Scholar] [CrossRef]
  34. Fan, H.Y.; Miroslaw, J. A Critical Review of Legal Issues and Solutions Associated With Building Information Modelling. Technol. Econ. Dev. Econ. 2018, 24, 2098–2130. [Google Scholar] [CrossRef]
  35. Almarri, K.; Aljarman, M.; Boussabaine, H. Emerging contractual and legal risks from the application of building information modelling. Eng. Constr. Archit. Manag. 2019, 26, 2307–2325. [Google Scholar] [CrossRef]
  36. Mahdian, A.; Jalal, M.P.; Roushan, T.Y. Contractual Risks of BIM Implementation and the Proposed Contract Form for DBB and DB Projects. J. Leg. Aff. Disput. Resolut. Eng. Constr. 2023, 15, 06522003. [Google Scholar] [CrossRef]
  37. Ghaffarianhoseini, A.; Tookey, J.; Ghaffarianhoseini, A.; Naismith, N.; Raahemifar, K. Building Information Modelling (BIM) uptake: Clear benefits, understanding its implementation, risks and challenges. Renew. Sustain. Energy Rev. 2016, 75, 1046. [Google Scholar] [CrossRef]
  38. Jin, R.Y.; Hancock, C.M.; Tang, L.; Wanatowski, D. BIM Investment, Returns, and Risks in China’s AEC Industries. J. Constr. Eng. Manag. 2017, 143, 04017089. [Google Scholar] [CrossRef]
  39. Seyis, S. Pros and cons of using building information modeling in the aec industry. J. Constr. Eng. Manag. 2019, 145, 04019046. [Google Scholar] [CrossRef]
  40. Zhao, X.B.; Wu, P.; Wang, X.Y. Risk paths in BIM adoption: Empirical study of China. Eng. Constr. Archit. Manag. 2018, 25, 1170–1187. [Google Scholar] [CrossRef]
  41. Huang, B.; Lei, J.; Ren, F.; Chen, Y.; Zhao, Q.; Li, S.; Lin, Y. Contribution and obstacle analysis of applying BIM in promoting green buildings. J. Clean. Prod. 2021, 278, 123946. [Google Scholar] [CrossRef]
  42. Bian, J.; Wang, Z.; Liu, X. Research on Restrictive Factors of Assembly Building Development based on Principal Components Analysis Method. Constr. Econ. Build. 2021, 42, 76–80. [Google Scholar]
  43. Wang, T.; Wang, X.T.; Wang, L.; Cheong, P.A.Y.; Ali, A.S. Assessment of the development level of regional industrialized building based on cloud model: A case study in Guangzhou, China. J. Build. Eng. 2021, 44, 102547. [Google Scholar] [CrossRef]
  44. Durdyev, S.; Ashour, M.; Connelly, S.; Mahdiyar, A. Barriers to the implementation of Building Information Modelling (BIM) for facility management. J. Build. Eng. 2022, 46, 103736. [Google Scholar] [CrossRef]
  45. Lee, S. Determination of priority weights under multiattribute decision-making situations: Ahp versus fuzzy ahp. J. Constr. Eng. Manag. 2015, 141, 05014015. [Google Scholar] [CrossRef]
  46. Wang, Q.; Shen, C.; Guo, Z.; Zhu, K.; Zhang, J.; Huang, M. Research on the Barriers and Strategies to Promote Prefabricated Buildings in China. Buildings 2023, 13, 1200. [Google Scholar] [CrossRef]
  47. Thomas, D.; Khanduja, D. ISM–ANP hybrid approach to prioritize the barriers in green lean Six Sigma implementation in construction sector. Int. J. Lean Six Sigma 2022, 13, 502–520. [Google Scholar] [CrossRef]
  48. Suermann, P.C.; Issa, R.R.A. Evaluating Industry Perceptions of Building Information Modeling (BIM) Impact on Construction. Electron. J. Inf. Technol. Constr. 2009, 14, 250–256. [Google Scholar]
Figure 1. Research flow.
Buildings 15 02421 g001
Figure 2. Results of AHP weight analysis.
Buildings 15 02421 g002
Figure 3. Adjacency matrix and reachability matrix.
Buildings 15 02421 g003
Figure 4. ISM model for risk factors of BIM implementation.
Buildings 15 02421 g004
Figure 5. The results of the MICMAC analysis.
Buildings 15 02421 g005
Figure 6. Strategies for the risk factors of BIM implementation.
Buildings 15 02421 g006
Table 1. Initial list of risk factors of BIM application.
CategoryCodeRisk FactorsReferences
TechnologyT1Lack of software function[19,23,25,26,28,29]
T2Model management difficulties [19,26,28,29]
T3Poor software interaction[19,23,25,26,28,29,38]
T4Low data quality[19,23,26,28,29]
T5Data security issues[19,25,26,28,29,40]
T6Difficulties in synchronizing data[25,26,28,29,33,40]
T7Difficulty in modeling some structures[25,26,28]
T8Complexity of BIM software operations[22,23,26,29]
EconomicE1Staff training and recruitment costs[19,23,26,29]
E2Infrastructure preparation of the BIM application[22,23,28,29]
E3Increased cost of design and maintenance[22,23,26,28,29]
E4Uncertainty in return on investment[22,23,26,29]
E5High process investment[19,23,26,28,29,38]
LawL1Inadequate BIM standards and protocols[19,23,27,29,31,34,37,38]
L2Inadequate BIM-related laws and regulations[25,26,27,28,31,34,37,38]
L3Unclear BIM data ownership[23,25,26,27,29,37]
L4Inapplicability of the contracts[23,25,27,29,31,34,37]
L5Lack of industry insurance[23,26,28,29,34]
managementM1Lack of BIM practice experience[19,23,25,26,29,33,38]
M2Lack of support from top managers[23,25,26,29,33]
M3Unclear division of responsibilities[19,23,25,29]
M4Inconsistent cognition from project stakeholders about BIM[23,26,28,29]
M5Synergy dilemma[19,23,26,29,33]
M6Suitability of organizational structures[26,28,29,31]
application processP1Increase in workload[23,25,29]
P2Issues of Business Process Change [23,25,28,29]
P3Lack of professional and technical personnel[23,26,29,38]
P4Resistance from technicians[23,25,28,29,31,40]
P5Lack of model sharing[19,23,29]
P6Incomplete application of BIM Technology[23,26,28]
P7Changes in delivery mode[23,26,28,31]
Table 2. Nine-point scale method.
DefinitionScale Value
Factor i is more important than factor j by degree nn
Two factors are equally important1
Factor i is less important than j by degree 1/n1/n
Note: The value of “n” ranges from 1 to 9, where a higher number indicates a greater degree of importance.
Table 3. Reference table for RI values.
Order of a Matrix3456789
RI0.580.901.121.241.321.411.45
Table 4. The basic information for experts.
CharacteristicVariableNumberPercentage (%)
Educational
Background
Bachelor’s Degree and Lower1845.00%
Master Degree1332.50%
Doctoral Degree and Higher922.50%
Work
Content
Government department37.50%
University410.00%
Research institution410.00%
Investment unit615.00%
Design unit615.00%
Construction unit615.00%
BIM consulting unit717.50%
Software development unit410.00%
BIM
Experience
<1years25.00%
1–3 years1332.50%
3–5 years1845.00%
>5 years717.50%
Table 5. Criterion layer judgment matrix and operation result.
CateroriesTechnologyEconomicLawManagementProcessWeight
Technology1.00001.33331.33331.33331.00000.2359
Economic0.75001.00001.33331.66671.33330.2326
Law0.75000.75001.00000.83331.11110.1723
Management0.75000.60001.20001.00001.27780.1843
Process1.00000.75000.90000.78261.00000.1749
λmax = 5.0622, CI = 0.0156, CR = 0.0139 ≤ 0.1
Table 6. Analysis results of BIM application risk factors based on AHP.
Criterion LayerWeightIndicator LayerRelative WeightActual Weight
Technology23.59%Lack of software function26.30%6.20%
Model management difficulties 17.23%4.06%
Poor software interaction21.55%5.08%
Low data quality8.75%2.06%
Data security issues5.18%1.22%
Difficulties in synchronizing data5.63%1.33%
Difficulty in modeling some structures3.99%0.94%
Complexity of BIM software operations11.37%2.68%
Economic23.26%Staff training and recruitment costs6.99%1.63%
Infrastructure preparation of the BIM application8.51%1.98%
Increased cost of design and maintenance18.82%4.38%
Uncertainty in return on investment38.88%9.04%
High process investment26.81%6.24%
Law17.23%Inadequate BIM standards and protocols31.94%5.50%
Inadequate BIM-related laws and regulations34.79%5.99%
Unclear BIM data ownership8.73%1.50%
Inapplicability of the contracts17.02%2.93%
Lack of industry insurance7.52%1.30%
Management18.43%Lack of BIM practice experience33.87%6.24%
Lack of support from top managers6.37%1.17%
Unclear division of responsibilities21.63%3.99%
Inconsistent cognition from project stakeholders about BIM6.07%1.12%
Synergy dilemma14.30%2.63%
Suitability of organizational structures17.76%3.27%
Process17.49%Increase in workload11.57%2.02%
Issues of Business Process Change 22.05%3.86%
Lack of professional and technical personnel15.10%2.64%
Resistance from technicians9.30%1.63%
Lack of model sharing11.99%2.10%
Incomplete application of BIM Technology19.86%3.47%
Changes in delivery mode10.14%1.77%
Table 7. List of main risk factors of BIM implementation.
CategoryCodeRisk Factors
TechnologyT1Lack of software function
T2Model management difficulties
T3Poor software interaction
T4Low data quality
T5Complexity of BIM software operations
FinanceE1Staff training and recruitment costs
E2Infrastructure preparation of the BIM application
E3Increased cost of design and maintenance
E4Uncertainty in return on investment
E5High process investment
LawL1Inadequate BIM standards and protocols
L2Inadequate BIM-related laws and regulations
L3Inapplicability of the contracts
managementM1Lack of BIM practice experience
M2Unclear division of responsibilities
M3Synergy dilemma
M4Suitability of organizational structures
application processP1increase in workload
P2Issues Of Business Process Change
P3Lack of professional and technical personnel
P4Resistance from technicians
P5Lack of model sharing
P6Incomplete application of BIM Technology
P7Changes in delivery mode
Table 8. Set operations and level partitioning.
FactorsReachable SetAntecedent SetCommon SetLevel
T1E1, E3, E4, E5, M3, P1, P4, P6, T1, T2, T5T1T16
T2E3, E4, E5, M3, P1, P4, T2L1, P5, P6, T1, T2, T3, T4T24
T3E3, E4, E5, M3, P1, P4, P5, T2, T3L1, T3T36
T4E3, E4, E5, M3, P1, P4, T2, T4L1, T4T45
T5E1, E4, E5, T5T1, T5T54
E1E1, E4, E5E1, M1, P3, T1, T5E13
E2E2, E4, E5E2E23
E3E3, E4, E5E3, L1, P5, P6, T1, T2, T3, T4E33
E4E4E1, E2, E3, E4, E5, L1, L2, L3, M1, M2, P1, P2, P3, P5, P6, P7, T1, T2, T3, T4, T5E41
E5E4, E5E1, E2, E3, E5, L1, L2, L3, M1, M2, P1, P2, P3, P5, P6, P7, T1, T2, T3, T4, T5E52
L1E3, E4, E5, L1, M3, P1, P4, P5, T2, T3, T4L1L17
L2E4, E5, L2, L3, M2, M3L2L25
L3E4, E5, L3, M2, M3L2, L3, P2, P7L34
M1E1, E4, E5, M1, P3M1M15
M2E4, E5, M2, M3L2, L3, M2, P2, P7M23
M3M3L1, L2, L3, M2, M3, M4, P1, P2, P4, P5, P6, P7, T1, T2, T3, T4M31
M4M3, M4M4, P2, P7M42
P1E4, E5, M3, P1, P4L1, P1, P5, P6, T1, T2, T3, T4P13
P2E4, E5, L3, M2, M3, M4, P2, P4P2, P7P25
P3E1, E4, E5, P3M1, P3P34
P4M3, P4T1, T2, T3, T4, L1, P1, P2, P4, P5, P6, P7P42
P5E3, E4, E5, M3, P1, P4, P5, T2T3, L1, P5P55
P6E3, E4, E5, M3, P1, P4, P6, T2T1, P6P65
P7E4, E5, L3, M2, M3, M4, P2, P4, P7P7P76
Table 9. Calculation results of importance degrees for each risk factor.
FactorsDriving PowerDependence Power
T1111
T277
T392
T482
T542
E135
E231
E338
E4121
E5220
L1111
L261
L354
M151
M245
M3116
M423
P158
P282
P342
Disclaimer/Publisher’s Note: The statements, opinions and data contained in all publications are solely those of the individual author(s) and contributor(s) and not of MDPI and/or the editor(s). MDPI and/or the editor(s) disclaim responsibility for any injury to people or property resulting from any ideas, methods, instructions or products referred to in the content.

