
A Two-Stage Evaluation Framework for Underground Space Development in Green Spaces: A Case Study of Binjiang District, Hangzhou


Abstract
1. Introduction
2. Materials
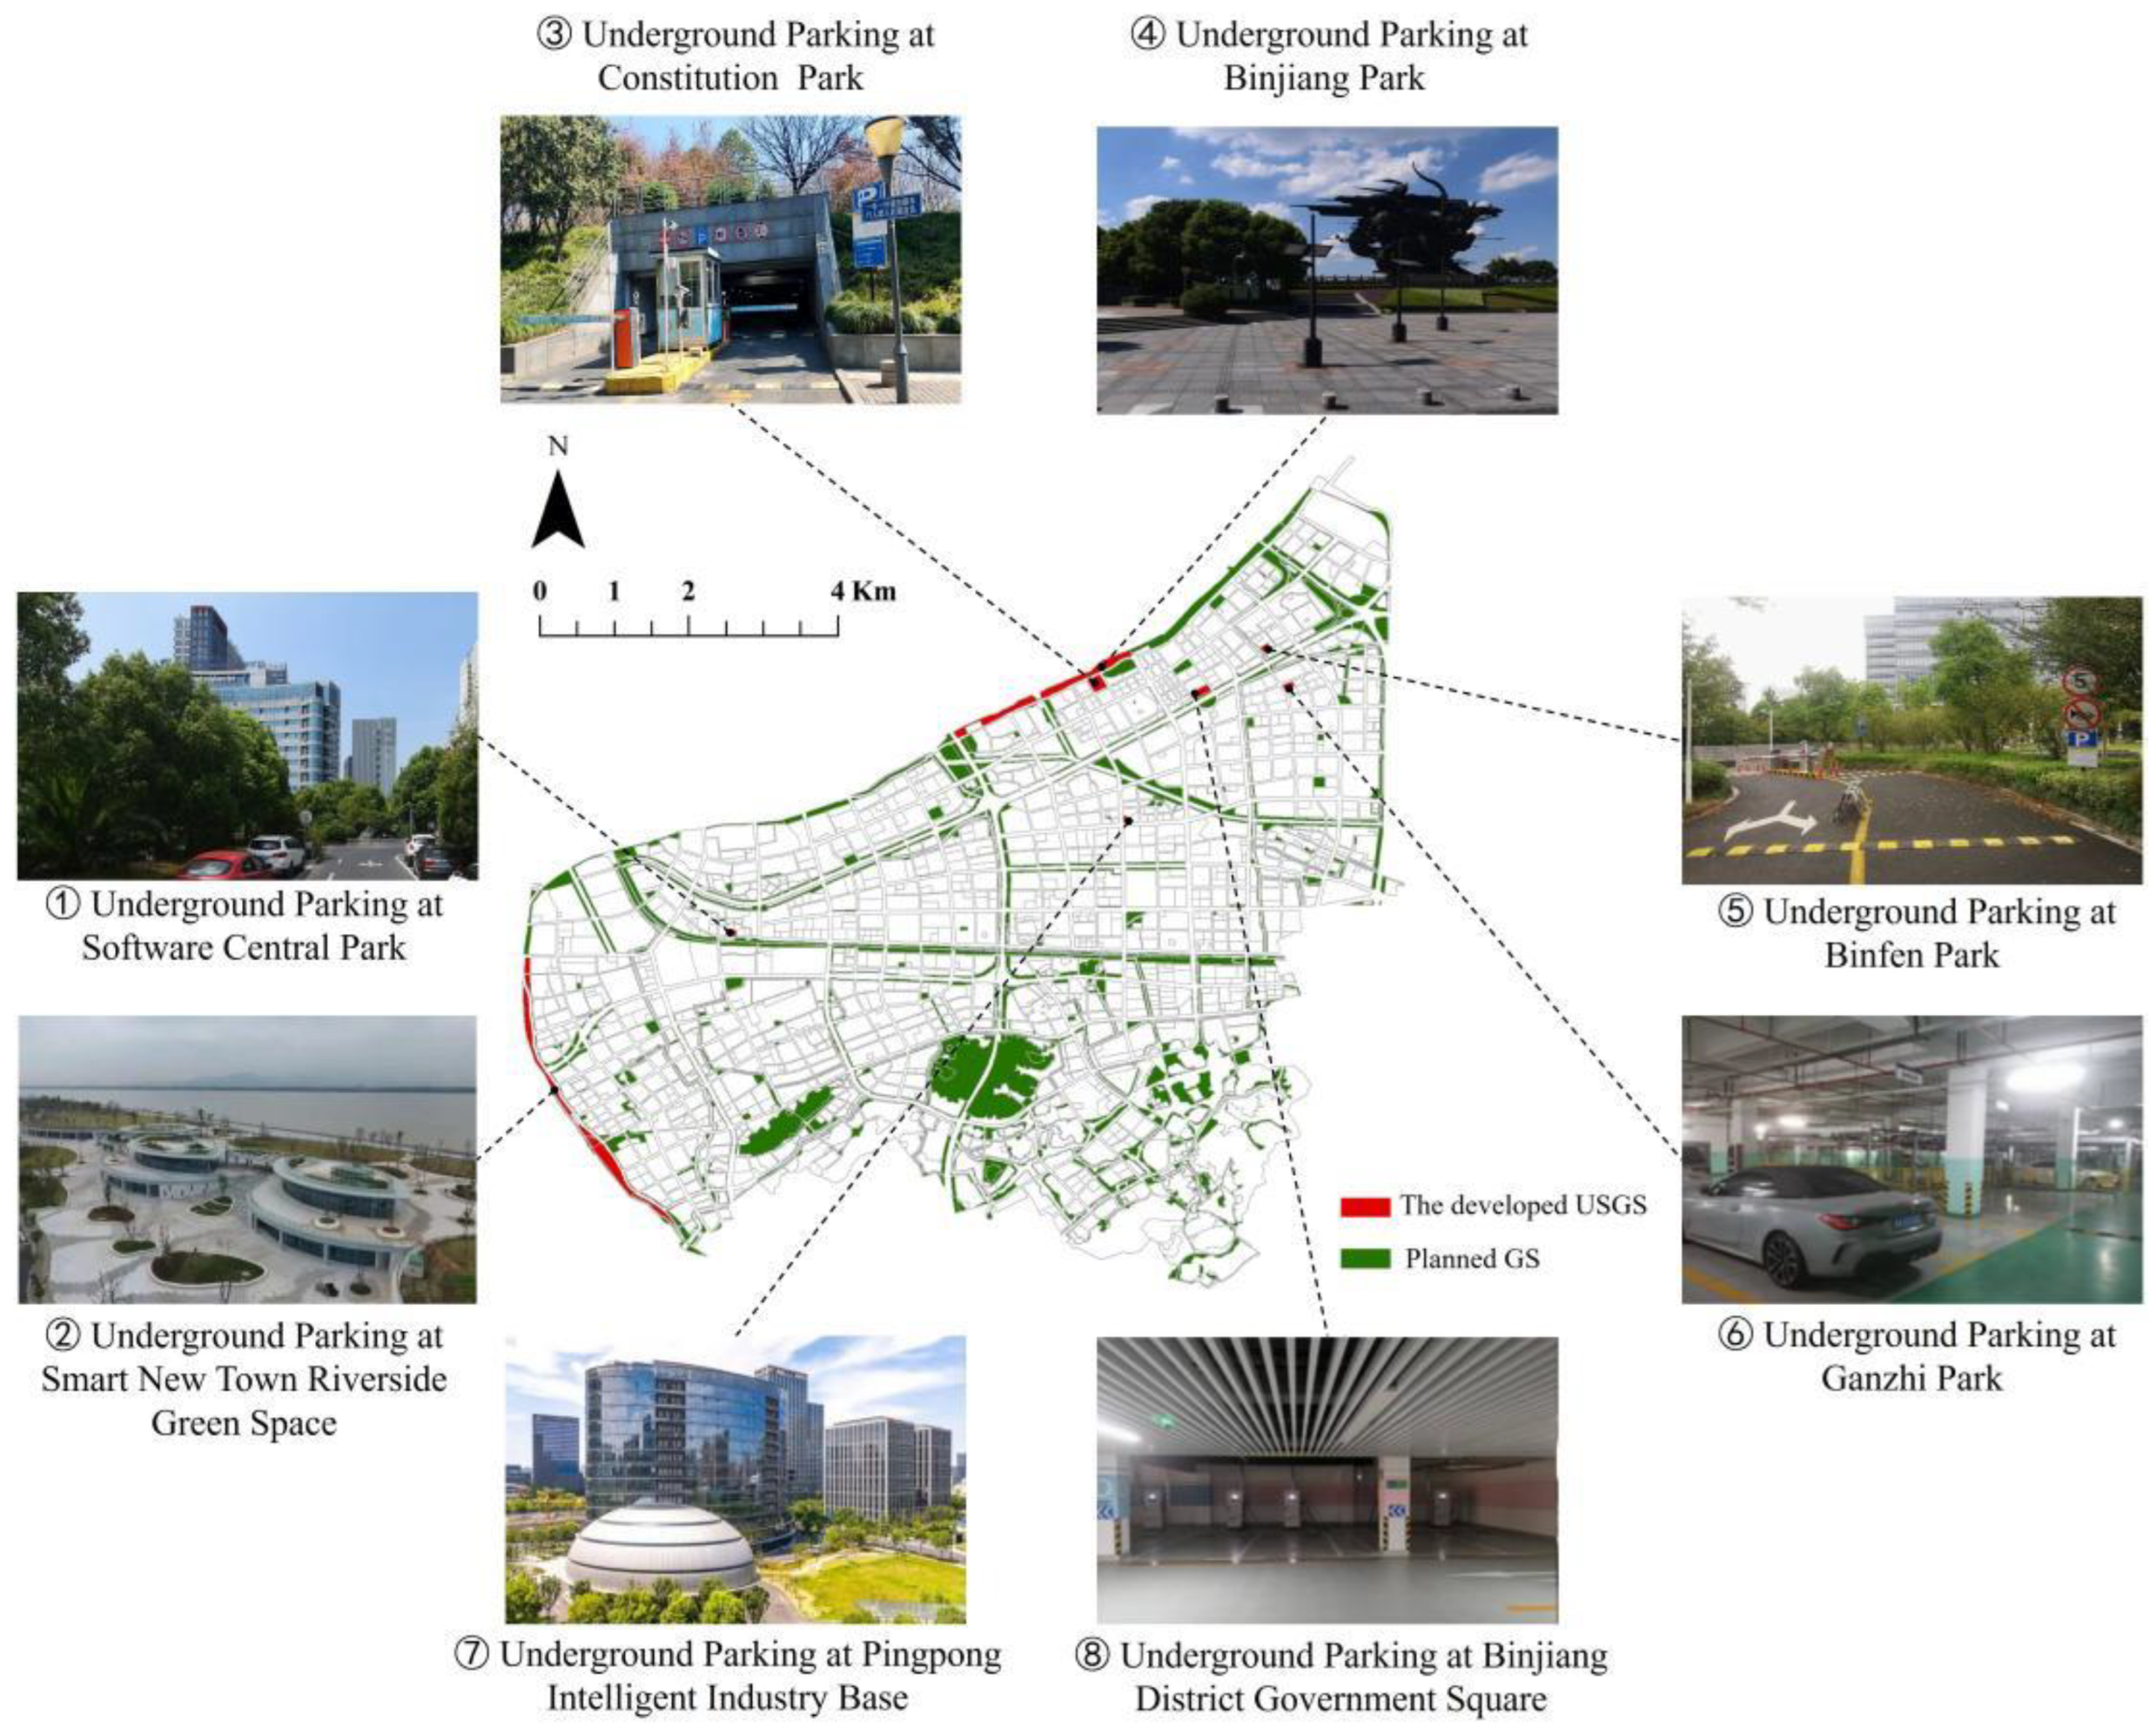
2.1. Study Area
2.2. Data Sources
3. Methods
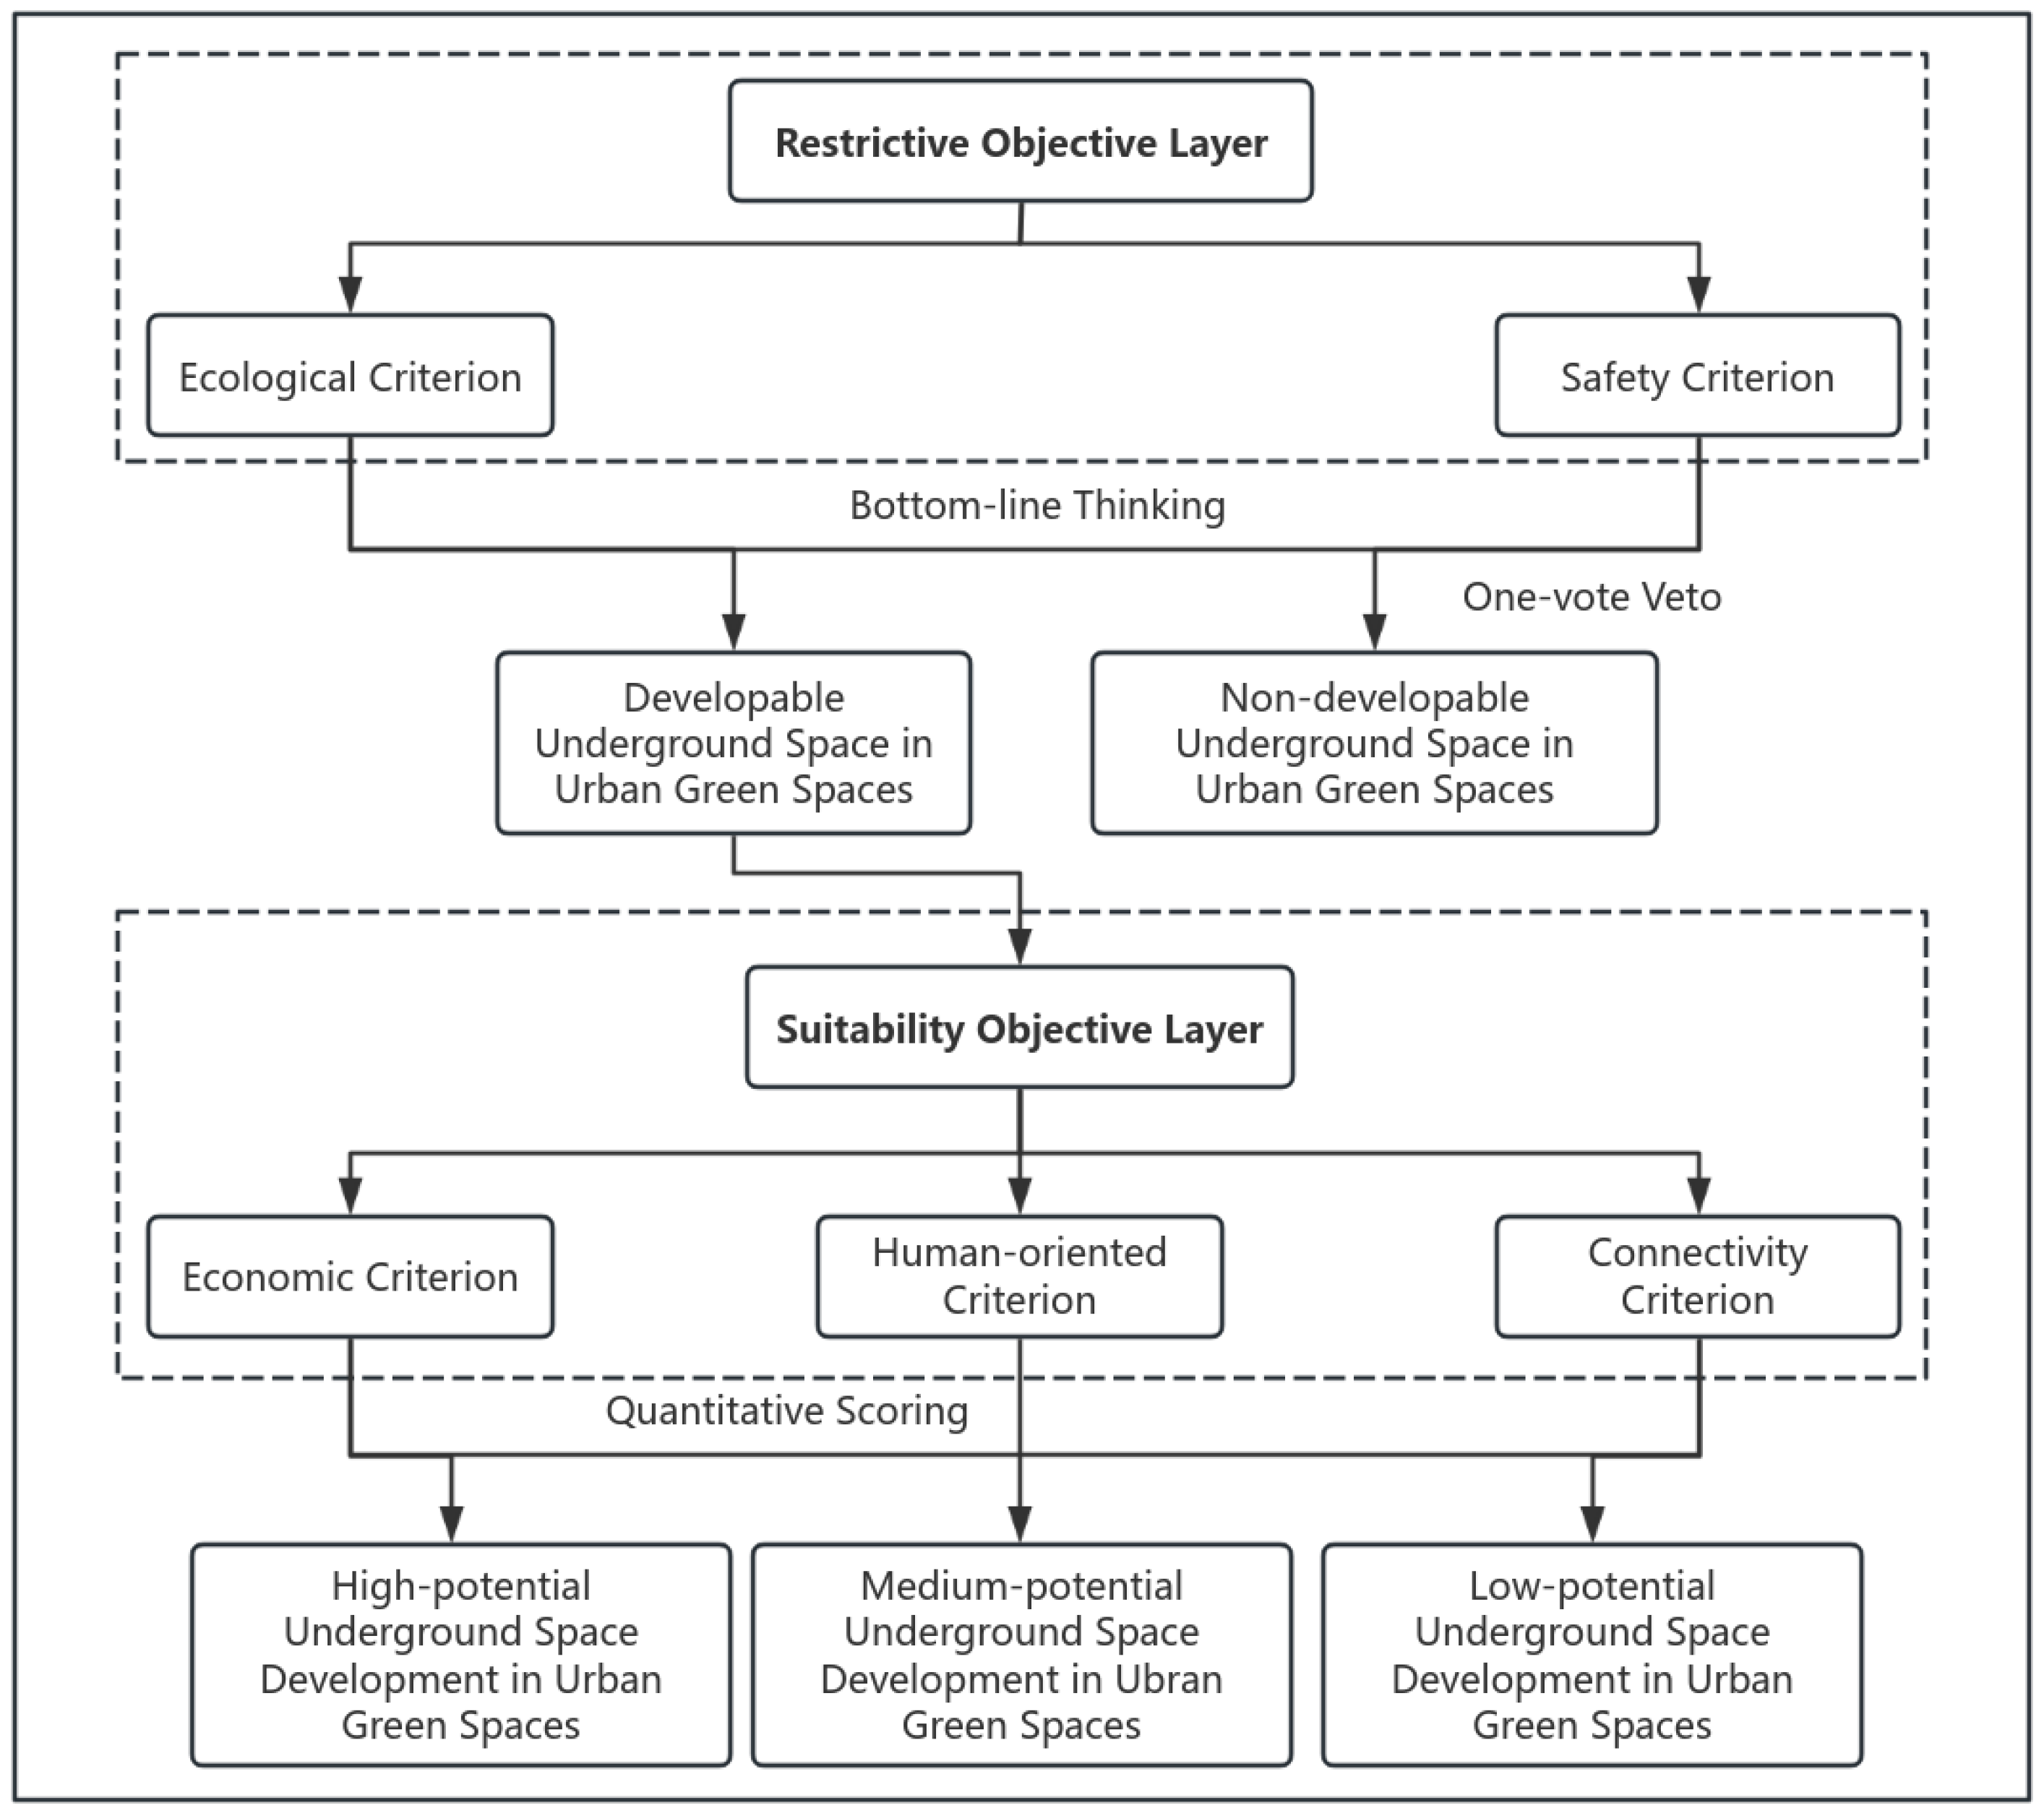
3.1. Constructing an Evaluation Indicator System for the Development Potential of USGSs
3.2. Determining Weights
3.3. Detect Limiting Factors
4. Results
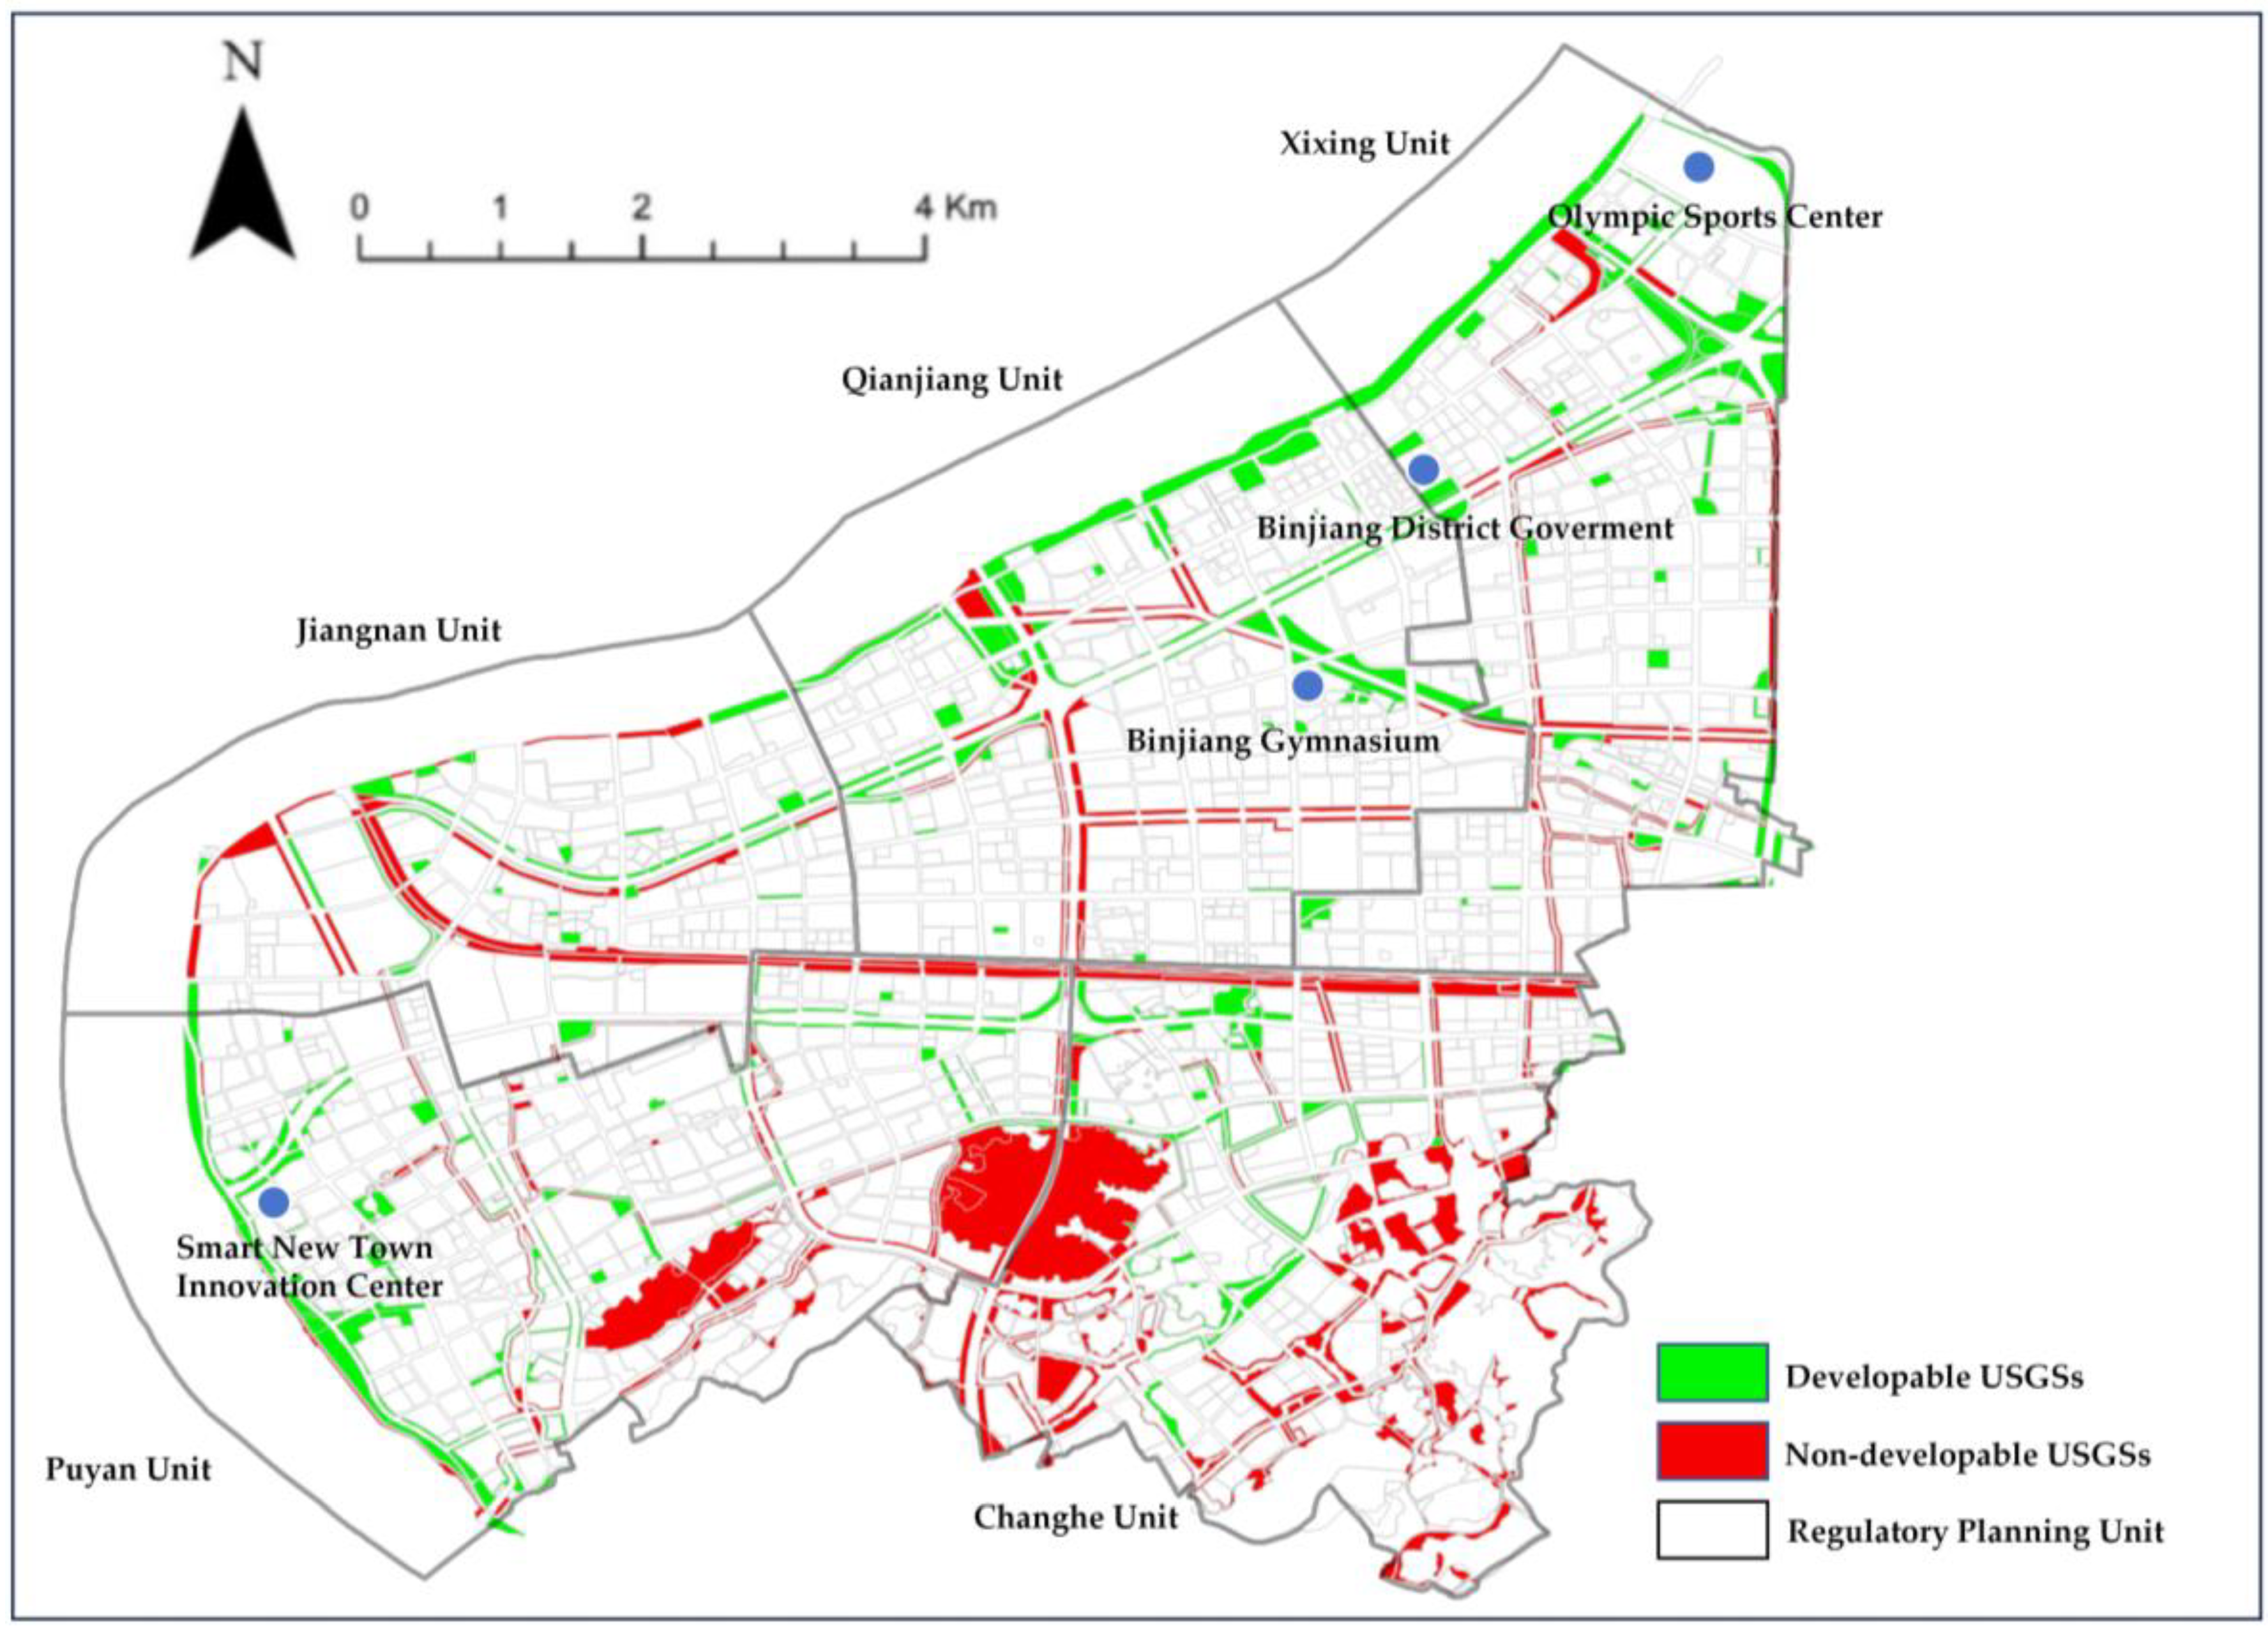
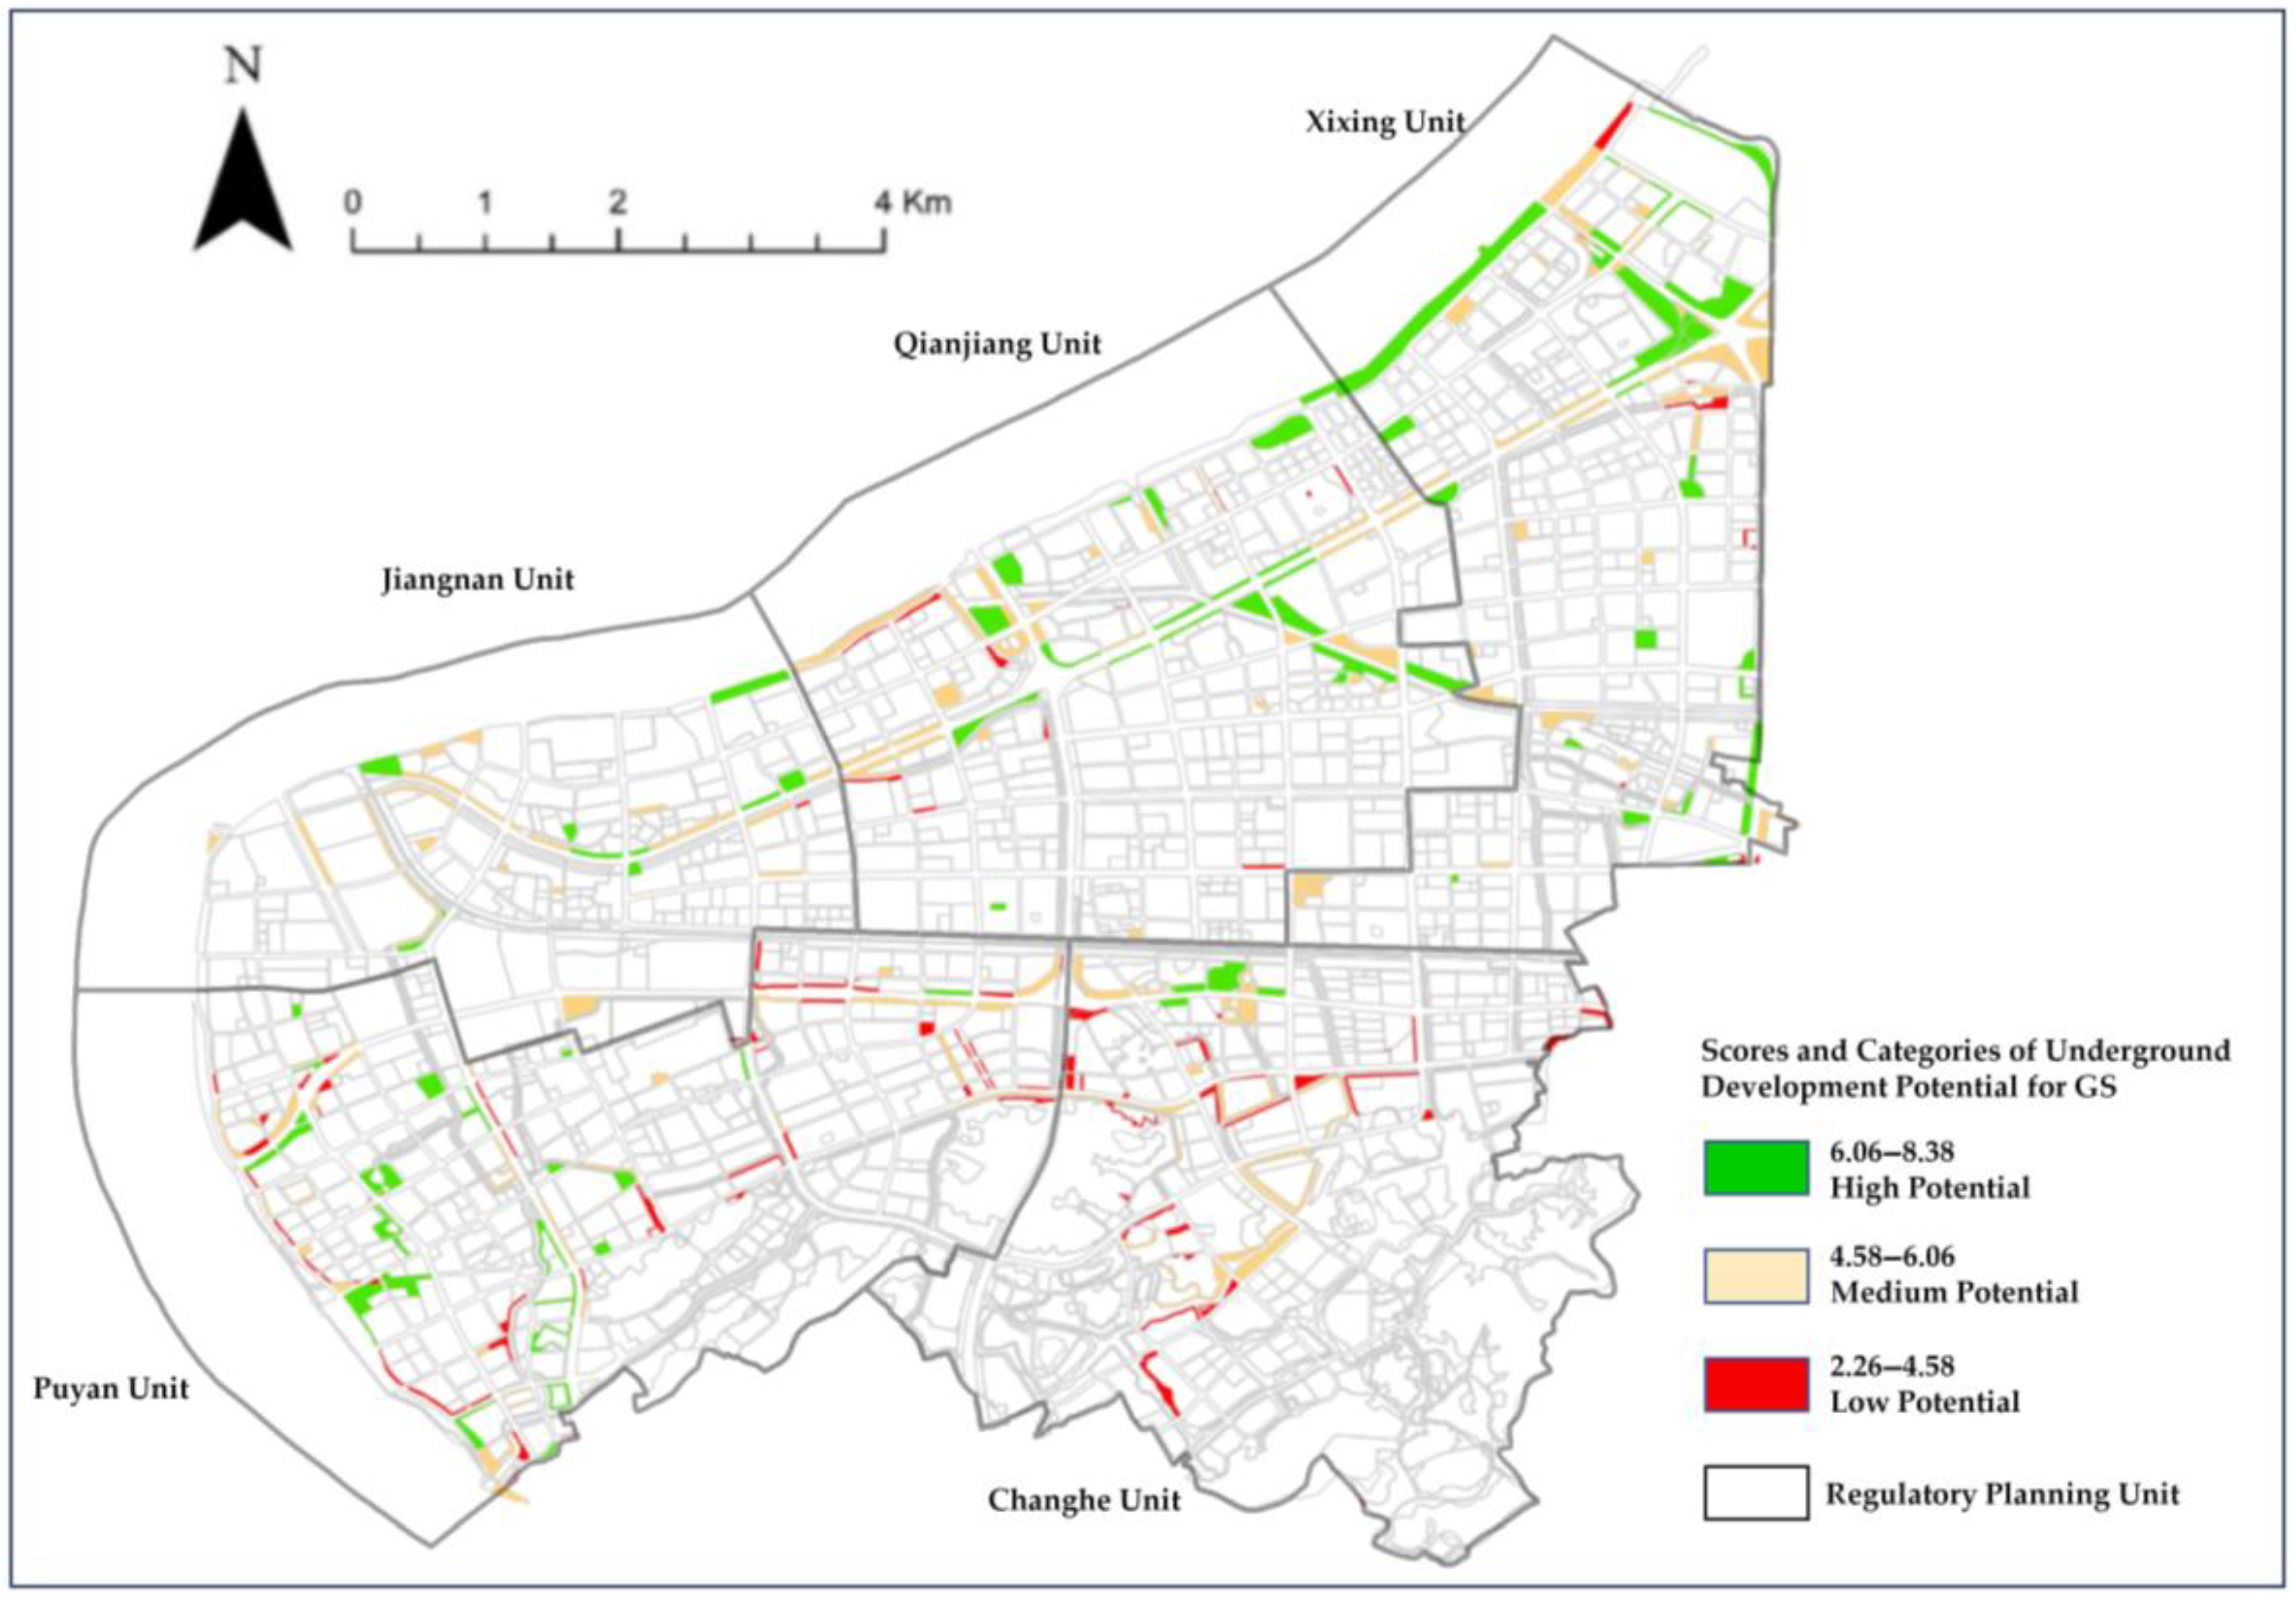
4.1. Evaluation Results
4.2. Analysis of Limiting Factors
5. Discussion
5.1. Strategies for Enhancing the Underground Development Potential of Small GS Patches
5.2. Strategies for Enhancing the Connectivity of USGSs
5.3. Considerations for Stakeholder Engagement and Framework Transferability
6. Conclusions
Author Contributions
Funding
Data Availability Statement
Acknowledgments
Conflicts of Interest
Abbreviations
| USGSs | Underground Space in Green Spaces |
| GS | Green Space |
| DRPs | Detailed Regulatory Plans |
| ha | Hectares |
References
- National Bureau of Statistics Statistical Communique of the People’s Republic of China on the 2024 National Economic and Social Development. Available online: https://www.stats.gov.cn/sj/zxfb/202502/t20250228_1958817.html (accessed on 6 May 2025).
- Sun, M.; Wang, J.; He, K. Analysis on the Urban Land Resources Carrying Capacity during Urbanization—A Case Study of Chinese YRD. Appl. Geogr. 2020, 116, 102170. [Google Scholar] [CrossRef]
- Gu, Y.; Wu, Y.; Liu, J.; Xu, M.; Zuo, T. Ecological Civilization and Government Administrative System Reform in China. Resour. Conserv. Recycl. 2020, 155, 104654. [Google Scholar] [CrossRef]
- Cui, J.; Broere, W.; Lin, D. Underground Space Utilisation for Urban Renewal. Tunn. Undergr. Space Technol. 2021, 108, 103726. [Google Scholar] [CrossRef]
- Peng, F.; Qiao, Y.; Dong, Y.; Yan, Z.; Zhu, H. Development Strategy for Urban Underground Space in the New Development Stage. Strateg. Study CAE 2024, 26, 176. [Google Scholar] [CrossRef]
- Broere, W. Urban Underground Space: Solving the Problems of Today’s Cities. Tunn. Undergr. Space Technol. 2016, 55, 245–248. [Google Scholar] [CrossRef]
- Debrock, S.; Van Acker, M.; Admiraal, H. Design Recommendations for Sustainable Urban Underground Spaces. Tunn. Undergr. Space Technol. 2023, 140, 105332. [Google Scholar] [CrossRef]
- Wang, J.; Duan, H.; Chen, K.; Chan, I.Y.S.; Xue, F.; Zhang, N.; Chen, X.; Zuo, J. Role of Urban Underground-Space Development in Achieving Carbon Neutrality: A National-Level Analysis in China. Engineering 2025, 45, 212–221. [Google Scholar] [CrossRef]
- Wu, Y.; Wen, H.; Fu, M. A Review of Research on the Value Evaluation of Urban Underground Space. Land 2024, 13, 474. [Google Scholar] [CrossRef]
- Wolch, J.R.; Byrne, J.; Newell, J.P. Urban Green Space, Public Health, and Environmental Justice: The Challenge of Making Cities ‘Just Green Enough’. Landsc. Urban Plan. 2014, 125, 234–244. [Google Scholar] [CrossRef]
- Hu, B.; Liu, Y.; Zhang, J. Study on the Composite Utilization of Underground Space of Public Green Space in Beijing Old Town. Archit. J. 2019, 14–19. [Google Scholar]
- Admiraal, H.; Cornaro, A. Future Cities, Resilient Cities—The Role of Underground Space in Achieving Urban Resilience. Undergr. Space 2020, 5, 223–228. [Google Scholar] [CrossRef]
- Zacharias, J.; He, J. Hong Kong’s Urban Planning Experiment in Enhancing Pedestrian Movement from Underground Space to the Surface. Tunn. Undergr. Space Technol. 2018, 82, 1–8. [Google Scholar] [CrossRef]
- Zhang, Y.; Jin, Y. Function Combination Mode in Urban Land Use for Green Space Optimization. Chin. Landsc. Archit. 2016, 32, 98–102. [Google Scholar]
- Huang, W.; Zhu, W. Development and Utilization of Underground Space under the Urban Square and Green Area. Chin. J. Undergr. Space Eng. 2002, 22, 259–263. [Google Scholar]
- Zhang, B.; Xu, N.; Dai, C. Current Status, Trend and Revelation of Worldwide Urban Underground Space Development and Utilization. Earth Sci. Front. 2019, 26, 48–56. [Google Scholar]
- Yao, T.; Xu, Y.; Sun, L.; Liao, P.; Wang, J. Application of Machine Learning and Multi-Dimensional Perception in Urban Spatial Quality Evaluation: A Case Study of Shanghai Underground Pedestrian Street. Land 2024, 13, 1354. [Google Scholar] [CrossRef]
- Zhou, C.A.; Ren, H.; Liu, G.; Chen, C. Comprehensive Evaluation and Case Study of Urban Underground Space Development under Multiple Constraints. Bulg. Chem. Commun. 2017, 49, 90–97. [Google Scholar]
- Chen, Z.-L.; Chen, J.-Y.; Liu, H.; Zhang, Z.-F. Present Status and Development Trends of Underground Space in Chinese Cities: Evaluation and Analysis. Tunn. Undergr. Space Technol. 2018, 71, 253–270. [Google Scholar] [CrossRef]
- Tan, F.; Wang, J.; Jiao, Y.-Y.; Ma, B.; He, L. Suitability Evaluation of Underground Space Based on Finite Interval Cloud Model and Genetic Algorithm Combination Weighting. Tunn. Undergr. Space Technol. 2021, 108, 103743. [Google Scholar] [CrossRef]
- Li, H.-Q.; Parriaux, A.; Thalmann, P.; Li, X.-Z. An Integrated Planning Concept for the Emerging Underground Urbanism: Deep City Method Part 1 Concept, Process and Application. Tunn. Undergr. Space Technol. 2013, 38, 559–568. [Google Scholar] [CrossRef]
- Hou, W.; Yang, L.; Deng, D.; Ye, J.; Clarke, K.; Yang, Z.; Zhuang, W.; Liu, J.; Huang, J. Assessing Quality of Urban Underground Spaces by Coupling 3D Geological Models: The Case Study of Foshan City, South China. Comput. Geosci. 2016, 89, 1–11. [Google Scholar] [CrossRef]
- Dou, F.; Li, X.; Xing, H.; Yuan, F.; Ge, W. 3D Geological Suitability Evaluation for Urban Underground Space Development—A Case Study of Qianjiang Newtown in Hangzhou, Eastern China. Tunn. Undergr. Space Technol. 2021, 115, 104052. [Google Scholar] [CrossRef]
- Deng, F.; Pu, J.; Huang, Y.; Han, Q. 3D Geological Suitability Evaluation for Underground Space Based on the AHP-Cloud Model. Undergr. Space 2023, 8, 109–122. [Google Scholar] [CrossRef]
- Hao, M.; Ren, W.; Xia, W.; Fu, J.; Zhu, H.; Sun, P.; Wang, K.; Xu, M. Suitability Evaluation of Urban Underground Space Development: A Case Study of Qingdao City. Appl. Sci.-Basel 2024, 14, 6617. [Google Scholar] [CrossRef]
- Li, S.; Hong, Z.; Xue, X.; Liu, X.; Shi, W. Comprehensive Evaluation of the Underground Space Resources in Xianyang City. Sci. Rep. 2023, 13, 17348. [Google Scholar] [CrossRef] [PubMed]
- Ma, C.-X.; Peng, F.-L.; Qiao, Y.-K.; Li, H. Evaluation of Spatial Performance of Metro-Led Urban Underground Public Space: A Case Study in Shanghai. Tunn. Undergr. Space Technol. 2022, 124, 104484. [Google Scholar] [CrossRef]
- Peng, J.; Peng, F.-L. A GIS-Based Evaluation Method of Underground Space Resources for Urban Spatial Planning: Part 1 Methodology. Tunn. Undergr. Space Technol. 2018, 74, 82–95. [Google Scholar] [CrossRef]
- Guo, J.; Liu, K.; Ma, Y. A Methodology for Comprehensive Quality Evaluation of Underground Space. Acta Geol. Sin.-Engl. Ed. 2024, 98, 1637–1648. [Google Scholar] [CrossRef]
- Yang, Y.; Wang, R.; Liu, D.; Wu, L.; Su, J. Three-Dimensional Quality Assessment of Urban Underground Space Resource Based on Multiple Geological Environmental Factors. Appl. Sci. 2024, 14, 4046. [Google Scholar] [CrossRef]
- Qi, X.; Fan, C.; Deng, L. The Suitability of Underground Space Development in Terms of Subway Station in Shenyang City. J. Northeast. Univ. Nat. Sci. 2019, 40, 1790–1795. [Google Scholar]
- Yao, T.; Ding, S.; Zhang, Y.; Chen, X.; Xu, Y.; Hu, K.; Xu, X.; Sun, L.; Liang, Z.; Huang, Y.; et al. Research on Range of Appropriate Spatial Scale of Underground Commercial Street Based on Psychological Perception Evaluation. Appl. Sci. 2024, 14, 5435. [Google Scholar] [CrossRef]
- Tian, J.; Xia, Y.; Zhang, J.; Liu, H.; Zhang, M.; Gao, Y.; Liu, J.; Han, B.; Huang, S. Urban Underground Space Geological Suitability-A Theoretical Framework, Index System, and Evaluation Method. Appl. Sci. 2025, 15, 4326. [Google Scholar] [CrossRef]
- Mo, J.; Zhu, L.; Liu, W.; Wen, P.; Xie, Z.; Li, R.; Ji, C.; Cheng, W.; Zhang, Y.; Chen, C.; et al. 3D-CWC: A Method to Evaluate the Geological Suitability for Layered Development and Utilization of Urban Underground Space. Land 2025, 14, 551. [Google Scholar] [CrossRef]
- Zhao, Y.; Liu, H.; Qu, W.; Luan, P.; Sun, J. Research on Geological Safety Evaluation Index Systems and Methods for Assessing Underground Space in Coastal Bedrock Cities Based on a Back-Propagation Neural Network Comprehensive Evaluation-Analytic Hierarchy Process (BPCE-AHP). Sustainability 2023, 15, 8055. [Google Scholar] [CrossRef]
- Jiang, C.; Jiang, T.; Zhu, B.; Liu, W.; Abbood, A.A.A.; Shafieezadeh, M.M. A Comprehensive Evaluation Framework for Green Ecological Urban Underground Space Using Factor Analysis and AHP. Appl. Water Sci. 2025, 15, 71. [Google Scholar] [CrossRef]
- Liu, H.; Li, Z.; He, Q. Suitability Assessment of Multilayer Urban Underground Space Based on Entropy and CRITIC Combined Weighting Method: A Case Study in Xiong’an New Area, China. Appl. Sci. 2023, 13, 10231. [Google Scholar] [CrossRef]
- Ni, X.; Li, J.; Xu, J.; Shen, Y.; Liu, X. Grey Relation Analysis and Multiple Criteria Decision Analysis Method Model for Suitability Evaluation of Underground Space Development. Eng. Geol. 2024, 338, 107608. [Google Scholar] [CrossRef]
- Deng, F.; Cheng, T.; Huang, Y.; Chen, Z.; Han, Q. Evaluation of Urban Underground Space via Automated Constraint Identification and Hybrid Analysis. Tunn. Undergr. Space Technol. 2024, 153, 106005. [Google Scholar] [CrossRef]
- Wang, M.; Wang, H.; Feng, Y.; He, Y.; Han, Z.; Zhang, B. Investigating Urban Underground Space Suitability Evaluation Using Fuzzy C-Mean Clustering Algorithm-A Case Study of Huancui District, Weihai City. Appl. Sci. 2022, 12, 12113. [Google Scholar] [CrossRef]
- Zhang, P.; Jin, T.; Wang, M.; Zhou, N.; Jia, X. Evaluation of the Suitability of Urban Underground Space Development Based on Multi-Criteria Decision-Making and Geographic Information Systems. Appl. Sci. 2025, 15, 543. [Google Scholar] [CrossRef]
- Li, X.; Li, C.; Aurele, P.; Wu, W.; Li, H.; Sun, L.; Liu, C. Multiple Resources and Their Sustainable Development in Urban Underground Space. Tunn. Undergr. Space Technol. 2016, 55, 59–66. [Google Scholar] [CrossRef]
- Zhu, H.; Huang, X.; Li, X.; Zhang, L.; Liu, X. Evaluation of Urban Underground Space Resources Using Digitalization Technologies. Undergr. Space 2016, 1, 124–136. [Google Scholar] [CrossRef]
- Bureau of Statistics of Binjiang District, Hangzhou Economic Operation of the High-Tech Zone (Binjiang District) in 2022. Available online: https://www.hhtz.gov.cn/art/2023/2/1/art_1229574516_4137004.html (accessed on 10 March 2023).
- Egerer, M.; Annighoefer, P.; Arzberger, S.; Burger, S.; Hecher, Y.; Knill, V.; Probst, B.; Suda, M. Urban Oases: The Social-Ecological Importance of Small Urban Green Spaces. Ecosyst. People 2024, 20, 2315991. [Google Scholar] [CrossRef]
- GB 50137-2011; Code for Classification of Urban Land Use and Planning Standards of Development Land. General Administration of Quality Supervision, Inspection and Quarantine of the People’s Republic of China: Beijing, China, 2010.
- Li, C.; Peng, F.; Qian, Y.; Dong, Y. Quantitative Evaluation of the Contribution of Underground Space to Urban Resilience: A Case Study in China. Undergr. Space 2024, 17, 1–24. [Google Scholar] [CrossRef]
- Doyle, M.R. From Hydro/Geology to the Streetscape: Evaluating Urban Underground Resource Potential. Tunn. Undergr. Space Technol. 2016, 55, 83–95. [Google Scholar] [CrossRef]
- Li, X. Spatio-Temporal Evolution Mechanism and Transformation Path of Land Use Function in Developed Area. Ph.D. Thesis, Nanjing Normal University, Nanjing, China, 2020. [Google Scholar]
- Shi, L.; Feng, Y.; Gao, L. The method of territorial spatial development suitability evaluation in the Yangtze River Delta: A case study of Changxing County. Acta Ecol. Sin. 2020, 40, 6495–6504. [Google Scholar] [CrossRef]
- Nie, Z. The Suitability Assessment for Land Territorial Spatial Planning Based on ANN-CA Model and the Internet of Things. Heliyon 2024, 10, e31237. [Google Scholar] [CrossRef]
- Lai, Y.; Wang, Y.; Cheng, J.; Chen, X.; Liu, Q. Review of Constraints and Critical Success Factors of Developing Urban Underground Space. Undergr. Space 2023, 12, 137–155. [Google Scholar] [CrossRef]
- Kumar, R.; Singh, S.; Bilga, P.S.; Jatin; Singh, J.; Singh, S.; Scutaru, M.-L.; Pruncu, C.I. Revealing the Benefits of Entropy Weights Method for Multi-Objective Optimization in Machining Operations: A Critical Review. J. Mater. Res. Technol. 2021, 10, 1471–1492. [Google Scholar] [CrossRef]
- Pan, Y.; Zhang, F.; Guo, Y.; Dong, F. The Interval Estimation Order Relation Analysis Method and Its Application. In Proceedings of the 2010 International Conference on Management and Service Science, Wuhan, China, 24–26 August 2010; pp. 1–4. [Google Scholar]
- Ke, C.; He, S.; Qin, Y. Comparison of Natural Breaks Method and Frequency Ratio Dividing Attribute Intervals for Landslide Susceptibility Mapping. Bull. Eng. Geol. Environ. 2023, 82, 384. [Google Scholar] [CrossRef]
- Chen, Y.; Zhu, M.; Lu, J.; Zhou, Q.; Ma, W. Evaluation of Ecological City and Analysis of Obstacle Factors under the Background of High-Quality Development: Taking Cities in the Yellow River Basin as Examples. Ecol. Indic. 2020, 118, 106771. [Google Scholar] [CrossRef]
- Wang, D.; Li, Y.; Yang, X.; Zhang, Z.; Gao, S.; Zhou, Q.; Zhuo, Y.; Wen, X.; Guo, Z. Evaluating Urban Ecological Civilization and Its Obstacle Factors Based on Integrated Model of PSR-EVW-TOPSIS: A Case Study of 13 Cities in Jiangsu Province, China. Ecol. Indic. 2021, 133, 108431. [Google Scholar] [CrossRef]
- Hangzhou Municipal Planning Bureau Regulations on the Management of Urban Green Lines in Hangzhou. Available online: http://ghzy.hangzhou.gov.cn/art/2017/12/26/art_1229560920_1647164.html (accessed on 12 May 2025).


| Developed USGS 1 | Construction Mode | Parking Capacity | Area of GS (ha) | Underground Floors | The Type of Planned Land Use 2 | Underground/ Green Space 3 |
|---|---|---|---|---|---|---|
| ① | Built separately | 361 | 0.92 | 2 | G3/S4 | 80% |
| ② | Built separately | 920 | 25.70 | 1 | G1/S42 | 15% |
| ③ | Built separately | 195 | 3.24 | 1 | G1/S42 | <50% |
| ④ | Built separately | 199 | 19.60 | 1 | G1 | 82% |
| ⑤ | Joint construction | 281 | 0.76 | 1 | G1/S42 | 85% |
| ⑥ | Joint construction | 422 | 0.93 | 1 | G1/S42 | 90.0% |
| ⑦ | Joint construction | 133 | 0.33 | 2 | G1 | 90% |
| ⑧ | Built separately | 763 | 2.31 | 2 | G3/S42 | 68% |
| Criterion | Indicator | Evaluation Criteria | |
|---|---|---|---|
| Developable Underground Space in Green Spaces | Non-Developable Underground Space in Green Spaces (One-Vote Veto) | ||
| Ecological criterion | Subsurface development suitability of surface vegetation | Tree crown projection area coverage < 70% | Tree crown projection area coverage > 70% |
| Importance of green space for ecological function | Secondary and tertiary landscape corridors and general green spaces | Water source protection areas, mountain core protection zones, primary ecological landscape corridors | |
| Impact of protected plants | No presence of ancient or rare trees | Presence of ancient or rare trees | |
| Safety criterion | Slope suitability for construction | <20° | ≥20° |
| Engineering geology | Other rock and soil mass characteristics | The characteristics of rock and soil mass are soil–rock interfaces, a large distribution of soft soil, and the distribution area of strongly weathered soft rock | |
| Bearing capacity of rock and soil mass ≥ 90 Kpa | Bearing capacity of rock and soil mass < 90 Kpa | ||
| Soft soil thickness < 5 m | Soft soil thickness ≥ 5 m | ||
| Hydrogeology | Underground water depth ≥ 3 m | Underground water depth < 3 m | |
| Aquifer thickness ≤ 9 m | Aquifer thickness > 9 m | ||
| Water outflow from a single well ≤ 3000 m3/d | Water outflow from a single well > 3000 m3/d | ||
| Weak or non-corrosive groundwater | Strongly corrosive groundwater | ||
| Geological disasters | Low-prone region of geological disaster | High-prone region of geological disaster | |
| Surrounding environmental factors | Setback blue line ≥ 10 m | Setback blue line < 10 m | |
| Distance from the outer rail centerline of railway trunk lines ≥ 30 m | Distance from the outer rail centerline of railway trunk lines < 30 m | ||
| Distance from the high-voltage tower ≥ 15 m | Distance from the high-voltage tower < 15 m | ||
| Criterion | Indicator | Evaluation Criteria | ||||
|---|---|---|---|---|---|---|
| 0 | 25 | 50 | 75 | 100 | ||
| Economic criterion | Development cost of USGSs | Construction land planned as green space | —— 1 | Existing green space | —— | Vacant land planned as green space |
| Economic feasibility of green space size | <0.3 ha green space area | 0.3–1 ha green space area | 1–2 ha green space area | 2–5 ha green space area | >5 ha green space area | |
| Economic feasibility of green space morphology | Eccentricity > 10 | —— | Eccentricity 6.6–10 | —— | Eccentricity < 6.6 | |
| Development value of USGSs | Low land price area | Sub-low land price area | Medium land price area | Sub-high land price area | High land price area | |
| Human orientation criterion | Public service demand | Low-demand area | Sub low-demand area | Medium land price area | Sub-high demand area | High-demand area |
| Public service supply gap | Low gap area | Sub-low gap area | Medium gap area | Sub-high gap area | High gap area | |
| Connectivity criterion | Underground space connectivity potential | No adjacent underground space | —— | —— | —— | With adjacent underground space |
| Criterion | Indicator | Weight |
|---|---|---|
| Economic criterion | Development cost of USGSs | 0.127 |
| Economic feasibility of green space’s size | 0.178 | |
| Economic feasibility of green space morphology | 0.140 | |
| Development value of USGSs | 0.116 | |
| Human orientation criterion | Public service demand | 0.154 |
| Public service supply gap | 0.145 | |
| Connectivity criterion | Underground space connectivity potential | 0.140 |
| Indicator | Average Score of the Indicator | Indicator Deviation Degree (I 1) | Obstacle Degree (O 2) |
|---|---|---|---|
| Development cost of USGSs | 0.3 | 0.7 | 0.179 |
| Economic feasibility of green space size | 0.36 | 0.64 | 0.248 |
| Economic feasibility of green space morphology | 0.79 | 0.21 | 0.063 |
| Development value of USGSs | 0.52 | 0.48 | 0.128 |
| Public service demand | 0.67 | 0.33 | 0.108 |
| Public service supply gap | 0.87 | 0.13 | 0.040 |
| Underground space connectivity potential | 0.21 | 0.79 | 0.235 |
| Regulatory Planning Unit | High Potential | Medium Potential | Low Potential | |||
|---|---|---|---|---|---|---|
| Quantity | Area (ha) | Quantity | Area (ha) | Quantity | Area (ha) | |
| Xixing Unit | 33 | 64.09 | 45 | 38.12 | 10 | 4.26 |
| Qianjiang Unit | 21 | 34.92 | 36 | 29.15 | 11 | 4.14 |
| Jiangnan Unit | 9 | 12.64 | 25 | 18.07 | 2 | 0.32 |
| Puyan Unit | 27 | 26.42 | 41 | 21.39 | 53 | 16.42 |
| Changhe Unit | 4 | 6.51 | 19 | 22.55 | 33 | 15.51 |
| Location | Proposed Underground Facilities in GS |
|---|---|
| Adjacent to rail transit stations | Commercial pedestrian spaces, cultural exhibition facilities, leisure facilities, and parking facilities |
| Adjacent to business–office areas | Leisure shopping, catering, fitness, entertainment, and parking facilities |
| Adjacent to large commercial facilities | Commercial and leisure facilities, cargo storage space, and parking facilities |
| Adjacent to large residential areas | Convenience–service facilities such as community commerce, health service stations, fitness facilities, and express delivery supporting facilities |
| Adjacent to municipal facilities | NIMBY (Not In My Back Yard) facilities such as substations and water pump rooms |
Disclaimer/Publisher’s Note: The statements, opinions and data contained in all publications are solely those of the individual author(s) and contributor(s) and not of MDPI and/or the editor(s). MDPI and/or the editor(s) disclaim responsibility for any injury to people or property resulting from any ideas, methods, instructions or products referred to in the content. |
© 2025 by the authors. Licensee MDPI, Basel, Switzerland. This article is an open access article distributed under the terms and conditions of the Creative Commons Attribution (CC BY) license (https://creativecommons.org/licenses/by/4.0/).
Share and Cite
Chen, Q.; Chen, X.; Li, H.; Zhang, X.; Zhang, G. A Two-Stage Evaluation Framework for Underground Space Development in Green Spaces: A Case Study of Binjiang District, Hangzhou. Buildings 2025, 15, 2418. https://doi.org/10.3390/buildings15142418
Chen Q, Chen X, Li H, Zhang X, Zhang G. A Two-Stage Evaluation Framework for Underground Space Development in Green Spaces: A Case Study of Binjiang District, Hangzhou. Buildings. 2025; 15(14):2418. https://doi.org/10.3390/buildings15142418
Chicago/Turabian StyleChen, Qiuxiao, Xiuxiu Chen, Hongbo Li, Xiaoyi Zhang, and Geyuan Zhang. 2025. "A Two-Stage Evaluation Framework for Underground Space Development in Green Spaces: A Case Study of Binjiang District, Hangzhou" Buildings 15, no. 14: 2418. https://doi.org/10.3390/buildings15142418
APA StyleChen, Q., Chen, X., Li, H., Zhang, X., & Zhang, G. (2025). A Two-Stage Evaluation Framework for Underground Space Development in Green Spaces: A Case Study of Binjiang District, Hangzhou. Buildings, 15(14), 2418. https://doi.org/10.3390/buildings15142418