Article

Evaluation of High-Performance Pervious Concrete Mixed with Nano-Silica and Carbon Fiber

1
CCCC Guangzhou Water Transport Engineering Design & Research Institute Co., Ltd., Guangzhou 510320, China
2
School of Transportation Science and Engineering, Jilin Jianzhu University, Xincheng Street, Changchun 130118, China
*
Author to whom correspondence should be addressed.
Buildings 2025, 15(14), 2407; https://doi.org/10.3390/buildings15142407
Submission received: 3 June 2025 / Revised: 4 July 2025 / Accepted: 7 July 2025 / Published: 9 July 2025
(This article belongs to the Section Building Materials, and Repair & Renovation)

Abstract

To address the mechanical deficiencies of traditional pervious concrete and promote its practical implementation, this study developed a high-performance pervious concrete model using conventional materials and methods, achieving a permeability coefficient of 4.5 mm/s with compressive and flexural strengths exceeding 45 MPa and 5 MPa, respectively. Central composite design (CCD) response surface methodology was employed to investigate the individual and synergistic effects of the water–cement ratio (W/C), nano-silica (NS), and carbon fibers (CF) on permeability, compressive strength, and flexural strength. Statistical models demonstrating prediction errors within 7% of experimental values were established, supplemented by a microstructural analysis of the concrete specimens. The results demonstrated that (1) the W/C ratio significantly influences overall performance; (2) NS enhances mechanical strength while reducing permeability, though excessive NS content induces weak interfacial zones that compromise strength; (3) CFs exhibit negligible impact on compressive strength but substantially improve flexural performance; and (4) significant synergistic interactions are present across W/C ratio, NS, and CFs concerning flexural strength parameters, while no significant interaction was observed for compressive strength.

1. Introduction

In recent years, pervious concrete (PC) has emerged as a pivotal material in urban pavements across numerous countries [1,2], characterized by high permeability (1.4 to 12.3 mm/s) and porosity (10 to 30%) [3,4]. This eco-friendly material has garnered significant attention for its potential to mitigate urban challenges, including the heat island effect, noise pollution, traffic safety issues, and groundwater depletion. Despite these advantages, the compressive strength of PC typically ranges from 4 to 25 MPa [5], and the flexural strength ranges from 1.5 to 3.2 MPa [6], which is significantly lower than that of traditional concrete. This limitation is primarily attributed to its porous matrix, essential for permeability but detrimental to strength. The limited mechanical properties of pervious concrete restrict its application to scenarios such as pavements, low-traffic roadways, and tennis courts [7], making it unsuitable for traffic lanes that require resistance to high-frequency traffic loads. Therefore, it is an effective means to improve road performance and a fundamental research direction to promote the development and application of pervious concrete to improve its mechanical properties on the premise of ensuring the permeability performance.
Efforts to bolster PC’s strength have bifurcated into enhancing its mineralogical composition and integrating various fibers [8,9]. Secondary hydration products formed through the pozzolanic reaction in concrete can enhance the bonding ability of the interface transition zone, thereby improving the strength and durability of PC by incorporating various mineral components [10,11,12,13,14]. M. Amala added an appropriate amount of metakaolin to concrete, which increased the 28-day compressive strength and splitting tensile strength of the concrete by 50 and 40%, respectively [15]. Nikhil Saboo and Yu Chen et al. determined that, by adding 5 to 15% fly ash and 6 to 10% silica fume, respectively, it is possible to increase the compressive strength of perishable concrete while maintaining water permeability (reducing porosity by 4 to 8%) [16,17]. Furthermore, with the rise in nanomaterials in recent years, various nanomaterials have been added to concrete admixtures to improve their strength and durability [18,19]. Among these, nano-silica (NS) is the most widely used [20,21,22]. Yonggui Wang et al. increased the compressive strength by 17.3 to 30% by adding 2 to 6% NS to ordinary concrete [23]. A study by Jalal et al. demonstrated that concrete containing 2% NS showed a maximum strength increase of 65% at 28 days [24]. Through microscopic analysis, A.M. Aid et al. found that NS formed a large amount of C-S-H gel in a short period of time through hydration reaction in the internal pores of concrete, which could make adhesive cement paste denser compared with traditional admixtures, such as fly ash and silica fume [25,26,27]. Although NS has been extensively studied in conventional concrete systems, its effects on pervious concrete remain inadequately characterized, with significant contradictions regarding the impacts on permeability. Current research reveals divergent findings: Bashar S. Mohammed and Behrooz Shirgir et al. reported enhanced permeability and mechanical strength [28,29], whereas Rodrigo Valderrama observed a minor reduction in permeability, and Vahid Alimohammadi documented a 41% decline [30,31]. Consequently, further investigation is imperative to elucidate the influence mechanisms of NS pervious concrete performance, particularly the synergistic effects with reinforcing fibers—an area that has been scarcely explored to date.
In addition to improving cement mineral materials, fiber reinforcement is also recognized as an effective approach for enhancing the performance of pervious concrete [7,9,32,33]. Saeid Hesami’s study revealed that the incorporation of polyphenylene sulfide, steel, and glass fibers increases compressive strength by 34–37%, reaching 15–25 MPa, and flexural strength by 63–69%, reaching 2–3 MPa [34]. Jiang ZW et al. confirmed that polypropylene fibers improve permeability and flexural capacity without significantly enhancing compressive strength [35]. Wu et al. and Huang et al. suggested that polypropylene fibers may not significantly enhance the mechanical properties of pervious concrete due to their poor dispersion characteristics [36,37]. Generally, incorporating steel fibers can substantially improve the mechanical performance of concrete [38,39]. Ming-Gin Lee demonstrated that incorporating steel fibers in pervious concrete can achieve 28-day compressive strengths exceeding 40 MPa [40]. However, due to its distinct pore structure, pervious concrete exhibits heightened susceptibility to steel fiber corrosion compared to conventional concrete. This corrosion leads to degradation in both strength and durability, thus impeding its broader application and promotion. Harry Rodin’s investigation established that carbon fiber (CF)’s high elastic modulus produces reinforcement effects analogous to steel fibers, with tensile and flexural strength improvements of 57–84% [41]. Milena et al. supplemented these findings by reporting a 4–11% gain in compressive strength and a significant enhancement in workability [42]. However, research on CF reinforced pervious concrete remains comparatively limited compared to other fiber types. The influence of fiber dosage on the permeability–strength relationship remains unclear. Crucially, the synergistic mechanism between CF and NS at a specific water to cement (W/C) ratio—particularly whether it can achieve high strength enhancement while maintaining controlled permeability loss—requires experimental validation.
Some scholars have researched high-performance pervious concrete. Jiusu Li employed specialized pore structures to achieve a balance between the strength and permeability of high-performance pervious concrete [43]. Lei Lang used magnesium phosphate cement to fabricate specimens with a compressive strength of 41.5 MPa and flexural strength of 28 MPa [44]. Mingen Fei prepared high-performance pervious concrete using acrylated epoxidized soybean oil (AESO) and methylene diphenyl diisocyanate (MDI), achieving a permeability coefficient of 2.64 mm/s with compressive and flexural strengths reaching 37.72 and 7.53 MPa, respectively [45]. Peiliang Shen utilized steam curing to achieve a compressive strength of 60.93 MPa in pervious concrete, sacrificing permeability with a permeability coefficient of only 0.37 mm/s [46]. These approaches—relying on specialized fabrication protocols, non-conventional materials, and curing methods—constrain practical applications.
Therefore, this study aims to bridge the current research gap by exploring a preparation approach for high-performance pervious concrete using conventional materials and optimization methods. Through response surface methodology, this study systematically investigates the effects of three factors—W/C ratio, NS, and CF—on the permeability coefficient, 28-day compressive strength, and flexural strength of pervious concrete. This study reveals the synergistic enhancement mechanism of these components within pervious concrete, providing significant theoretical foundations and practical references for developing high-performance pervious concrete materials that are readily applicable in engineering practice.

2. Materials and Methods
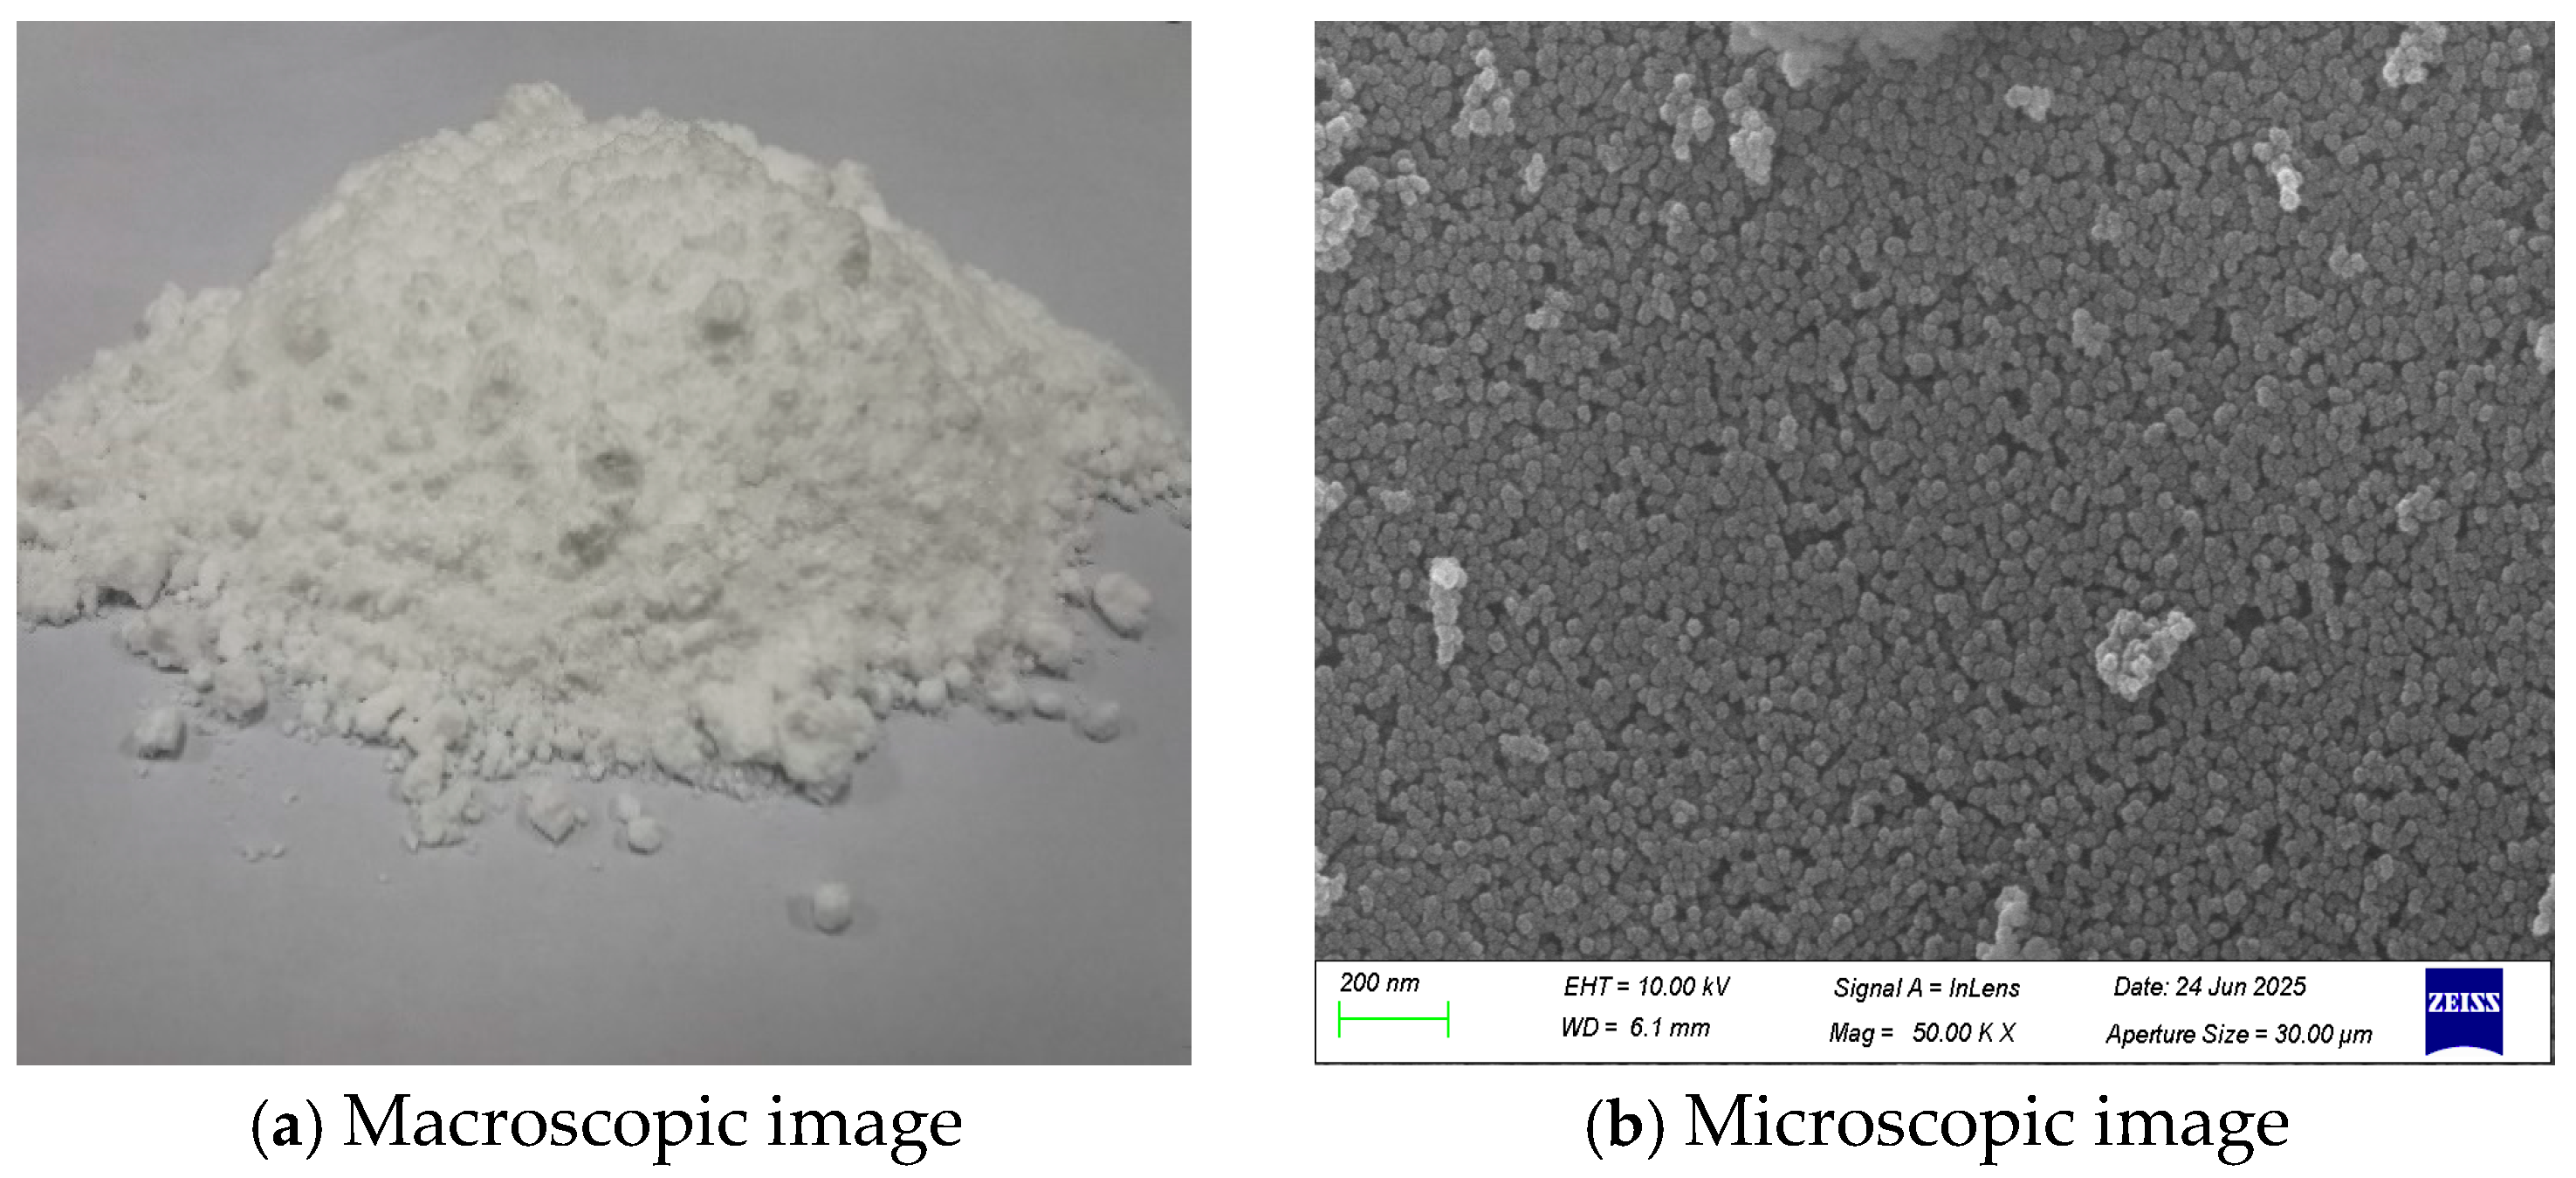
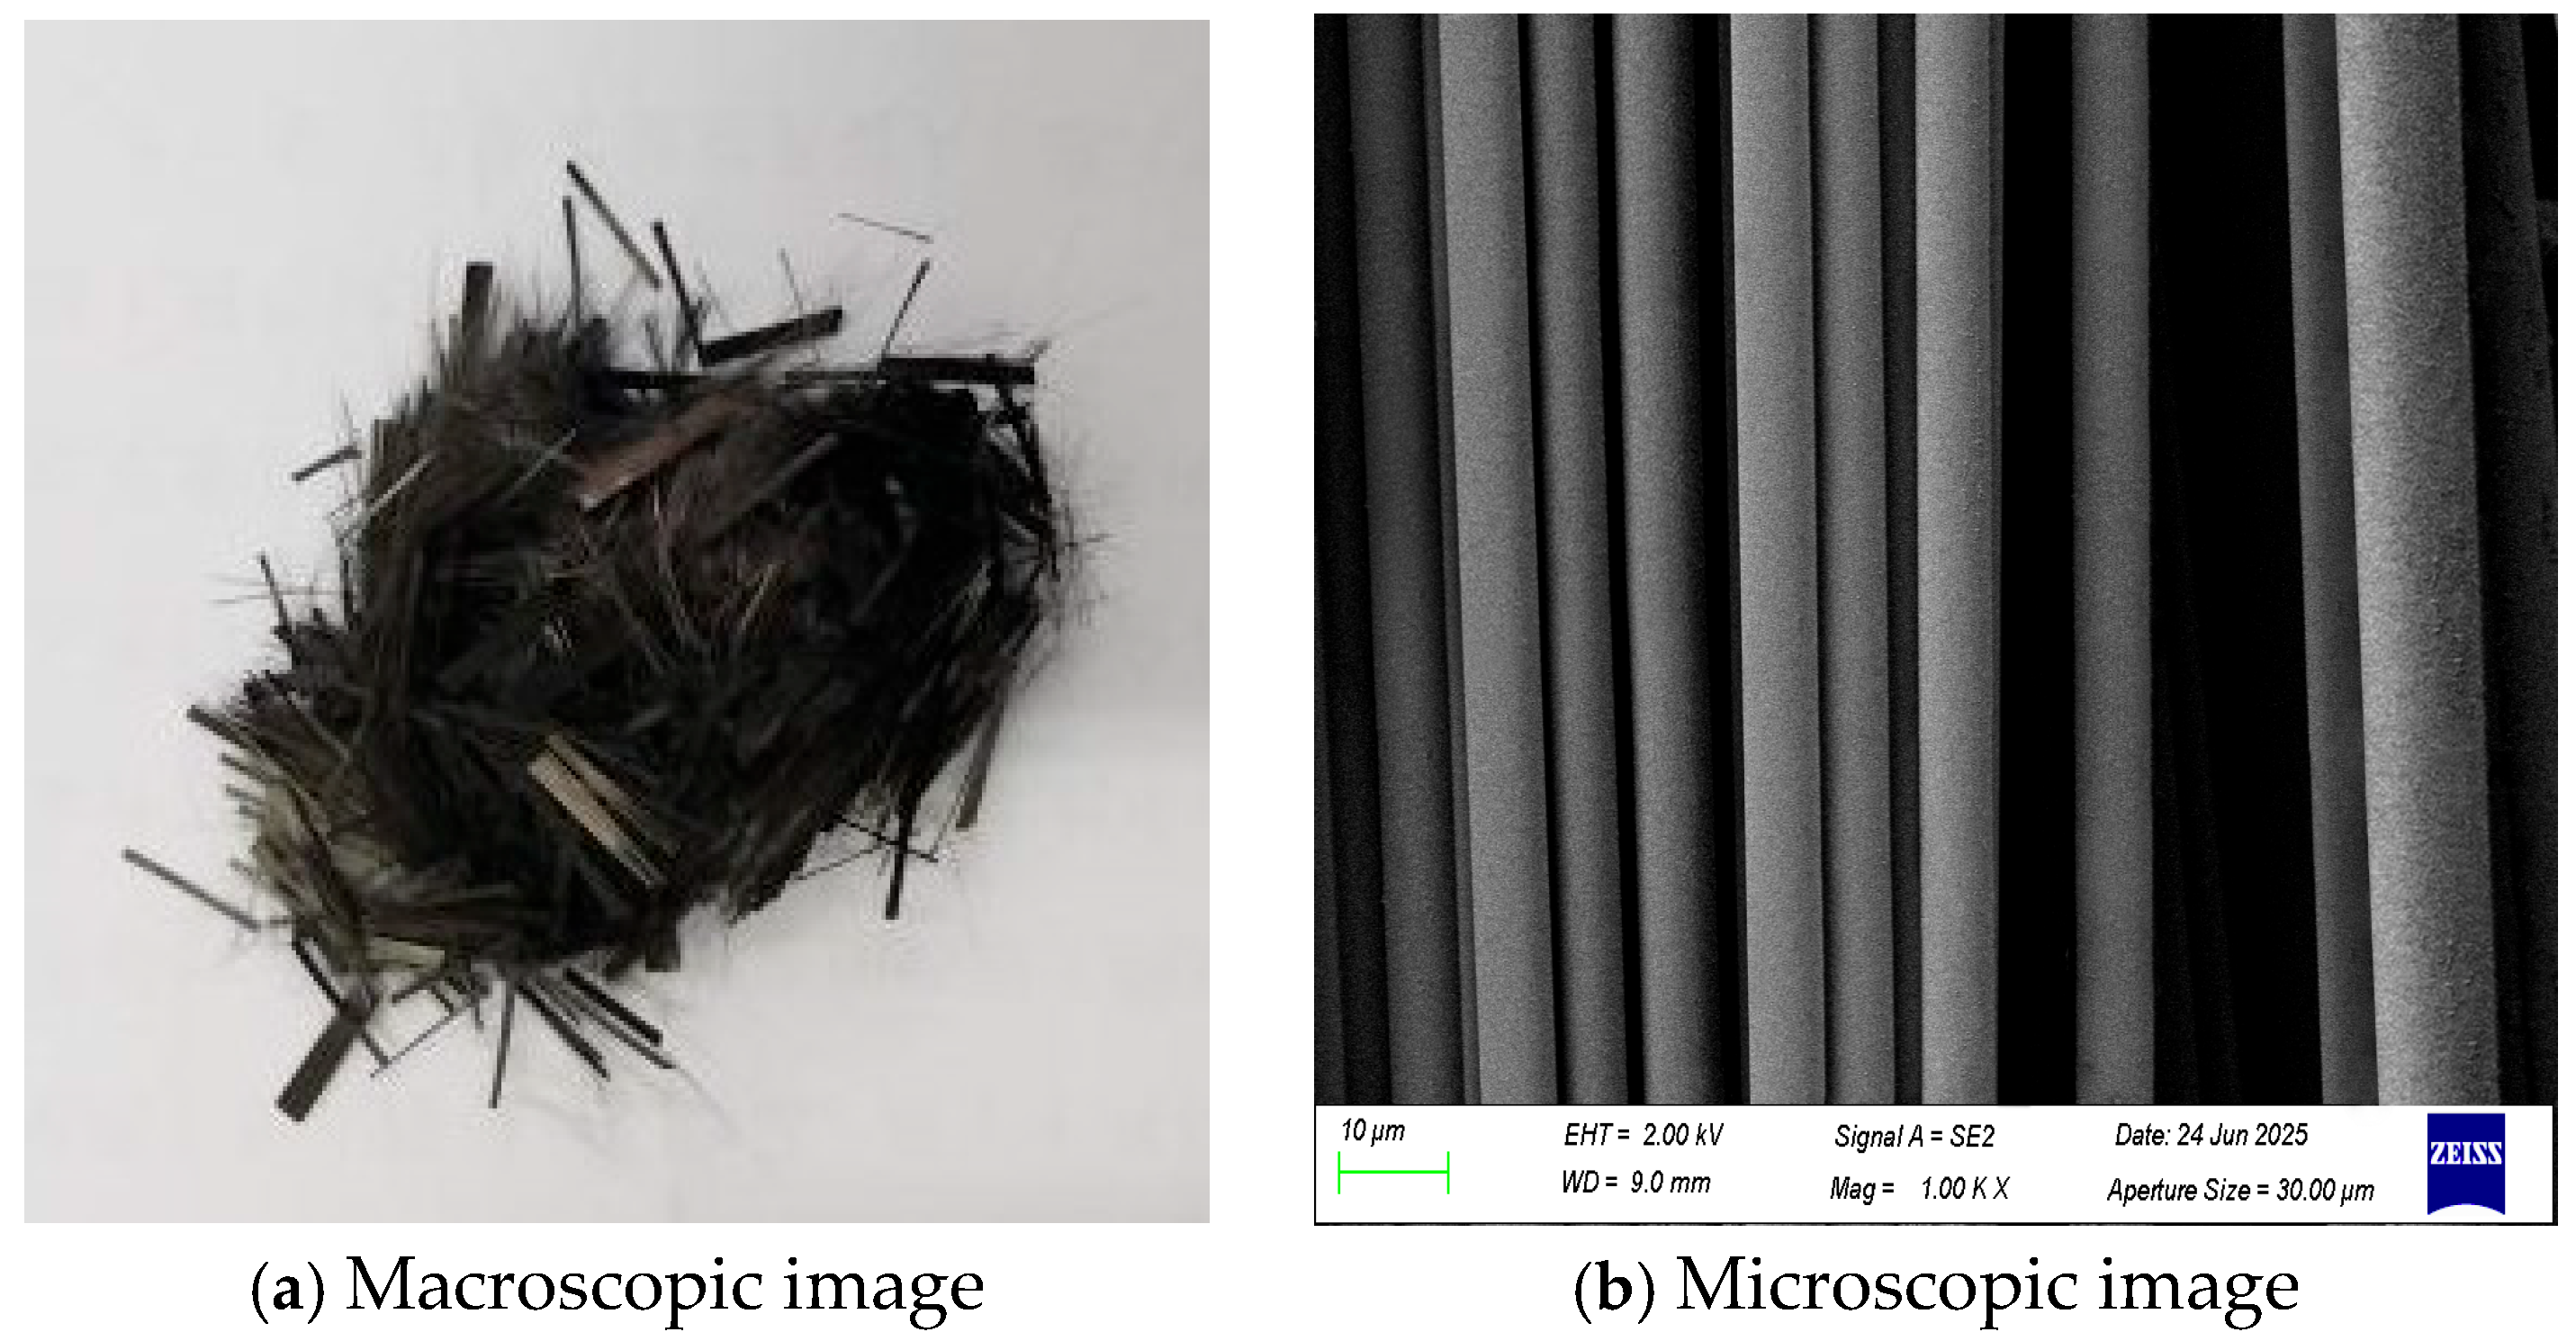
2.1. Materials

The main materials used in this study were P.II 42.5R cement (produced by Jilin Yatai Cement Co., Ltd., Changchun, China), nano-sized silica (NS) (produced by Tansail New Materials CO., Ltd., Nanjing, China), fly ash (FA) (produced by Jilin Yatai Cement Co., Ltd., Changchun, China), carbon fiber (CF) (produced by Jiangsu Chuanyu Carbon Fiber Technology Co., Ltd., Yancheng, China), a water-reducing agent (produced by Shanxi Feike New Material Technology Co., Ltd., Yuncheng, China), coarse aggregate (CA) (provided by Jianhua Building Materials (Jilin) Co., Ltd., Changchun, China), and sand (provided by Jianhua Building Materials (Jilin) Co., Ltd., Changchun, China). A high-range water-reducing agent was added to improve overall performance and enhance workability. The single-sized coarse aggregate, with a nominal particle size of 5 to 10 mm, was used in all mixtures, with a specific gravity of 2.68. Furthermore, the aggregate composition of pervious concrete typically does not include sand. However, some researchers have confirmed that the use of quarry sand increases the compressive strength [47] and improves the admissible stress [48]. Therefore, sand accounting for 7% by weight of the coarse aggregate was used in this study. The mass ratio of coarse aggregates to binder was fixed at 3.5:1. The physicochemical properties of cement, FA, NS, and CF were provided by the manufacturers listed in Table 1, Table 2, Table 3 and Table 4.

2.2. Studied Parameters

The primary objective of this study was to prepare high-performance pervious concrete by adjusting the NS, CF dosing, and W/C ratio and to evaluate the effects of these adjustments on the permeability and mechanical properties of PC. There are three purposes of adding NS. First, FA does not easily participate in the development of the gelled material’s early reaction strength due to its stable property [8,50]. Therefore, using NS’s early intense exothermic reaction can not only accelerate the reaction of FA, but also improve the characteristics of the early strength of cement paste to compensate for the negative effect on the concrete slurry’s early strength of FA [51,52,53,54]. Second, NS can effectively improve the mechanical strength of PC [55]. Jiangjiang Wang et al. demonstrated that a NS dosage of 2–3% significantly improves concrete performance [56]. Lianfei Nie et al. and Chithra, respectively, believed that 1% and 2% NS can significantly improve concrete’s mechanical strength [57,58]. Third, the presence of silica fume in the concrete mixture with CF contributes to the uniform distribution of fibers [59]. In this study, the NS dosage in concrete is recommended to be set within the range of 1% to 3%. The material photograph and microscopic image of NS are shown in Figure 1.
The purpose of adding CF is to enhance the mechanical strength and durability of the pervious concrete. Segura et al. demonstrated that a carbon fiber dosage of 1.2% can achieve the highest compressive strength in concrete fiber-reinforced composites [60]. Nguyen et al. and Mastali et al. found that a 1.5% carbon fiber dosage provides the maximum enhancement of flexural strength in concrete [61,62]. Therefore, in this study, the CF dosage in pervious concrete is set within the range of 1 to 2%. The material photograph and microscopic image of CF are shown in Figure 2.

2.3. Response Surface Design

Response surface methodology (RSM) is a statistically based technique that investigates the optimal response in a specified region of possibilities or provides a better understanding of any response affected by multiple variables [63], which has been applied efficiently in various types of concrete [64,65,66].
In this study, all design points and analyses were conducted using the Design-Expert v12 software (Stat-Ease Inc., Minneapolis, MN, USA). The effects of three independent variables were examined: W/C ratio, ranging from 0.26 to 0.28; CF, from 1 to 2% (volume fraction of cement); and NS, from 1 to 3% (weight fraction of cement). This was conducted using a central composite design (CCD) comprising 19 runs, which included 8 factorial points without replication, 6 axial points without replication, and one center point with 5 replicates. To avoid exceeding the range of values and affecting the working performance of pervious concrete, further rotation in the region of interest proved impractical, leading to a center-faced central composite design with α = 1. The code and control levels of variables in this experiment are shown in Table 5. The mix proportions of PC are shown in Table 6.
Based on design points and their related experimental results, a second-order polynomial model for each response was calculated based on the following equation:
y = β 0 + β i X i + β i i X i 2 + β i j X i X j ,

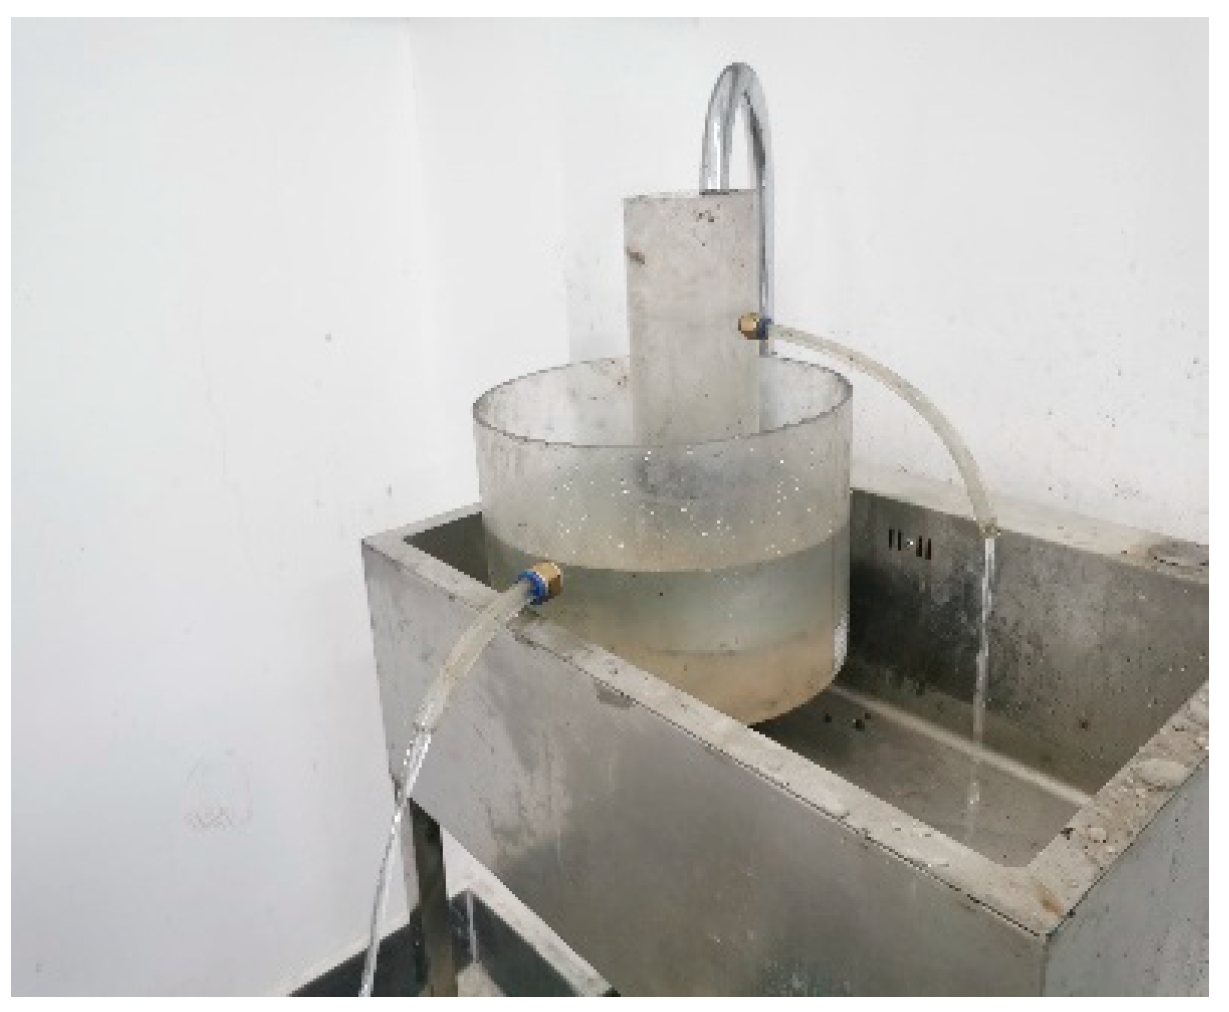
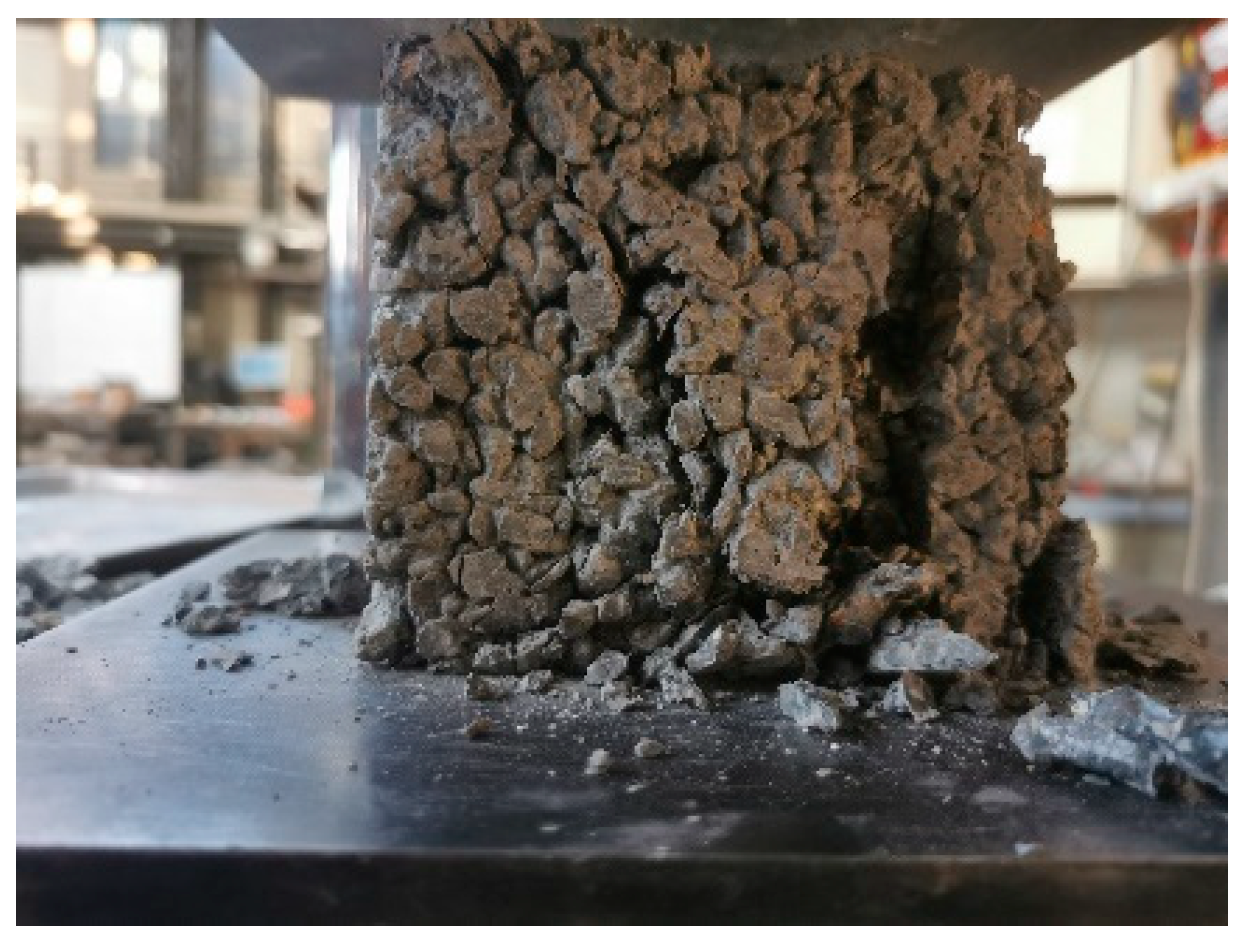
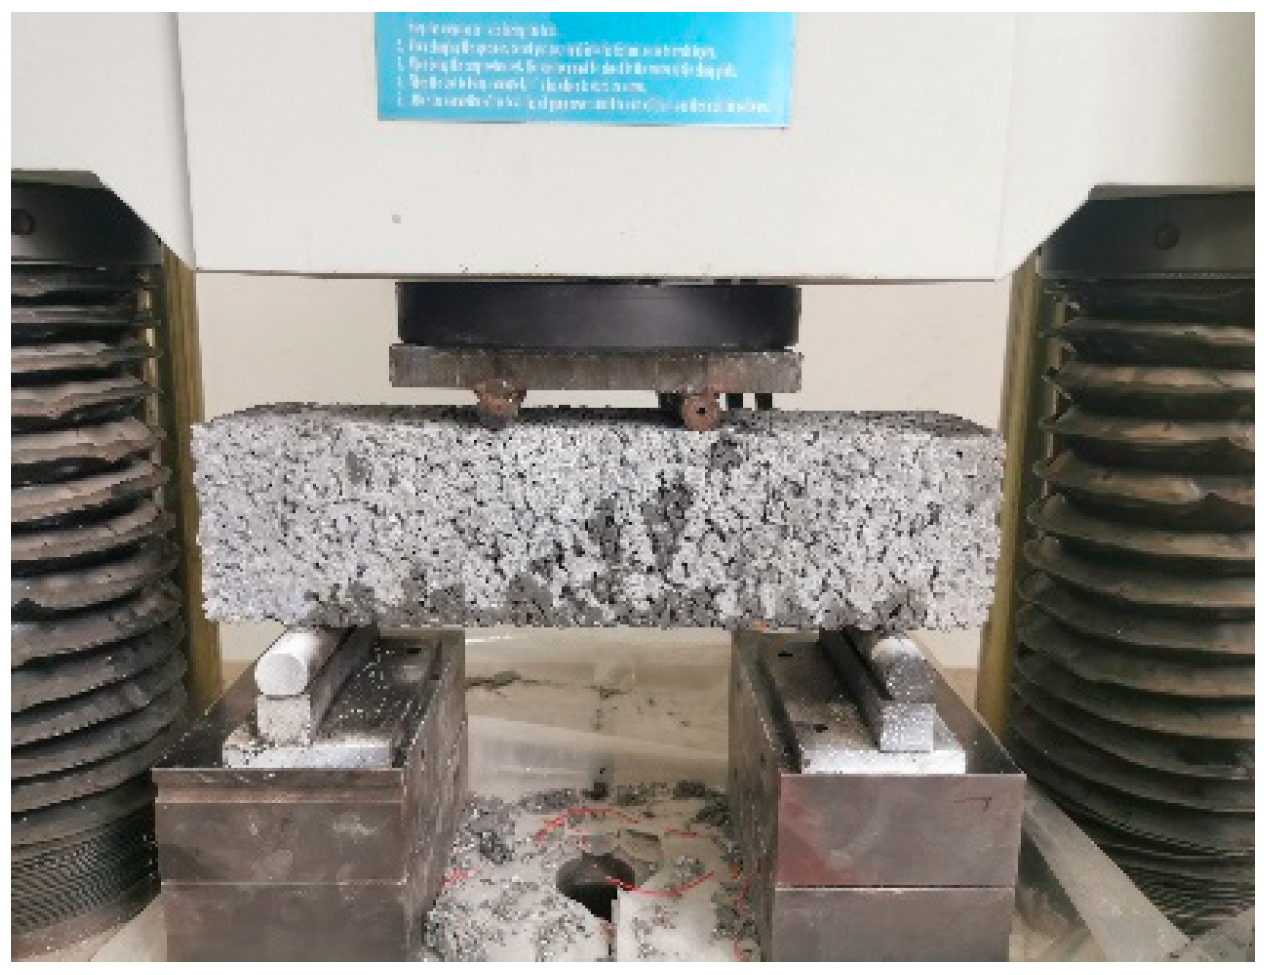
2.4. Testing Methods and Sample Preparation

Sample Preparation

The concrete was mixed using a 60 L vertical forced mixer, produced by Tianjin Qingda Testing Instrument Manufacturing Co., Ltd., Tianjin, China, as illustrated in Figure 3.
The detailed mixing procedure for pervious concrete is as follows:
(1)
Add cement, fly ash, sand, and coarse aggregate; mix for 60 s;
(2)
Add carbon fiber; mix for 30 s;
(3)
Add nano-silica and water-reducing admixture to water, then pour half of the solution into the mixture;
(4)
Mix for 90 s;
(5)
Pour in the remaining 50% of water; mix for 120 s;
(6)
Obtain freshly mixed pervious concrete, as shown in Figure 4.
All specimens were subjected to standard curing for 28 days after a 24-h demolding period.
The constant head method was used for permeability tests per the Chinese standard CJJ/T135-2009 [67]. Three cylindrical specimens, each with a diameter of 100 mm and a height of 50 mm, were prepared for each group. Before the test, petroleum jelly should be applied around the sample, allowing all water to flow through the connected pores in the PC. The PC permeability coefficient was calculated by Darcy’s law:
k t = Q L A H t
The compressive strength and flexural strength tests were conducted according to the Chinese standard GB/T50081-2002 [68]. Three cubic specimens with a size of 100 mm × 100 mm × 100 mm and three prismatic specimens with a size of 100 mm × 100 mm × 400 mm were prepared for each group.
The permeability coefficient, compressive strength, and flexural strength tests are shown in Figure 5, Figure 6 and Figure 7, respectively.

3. Results

3.1. Responses and Prediction Models

The experimental results demonstrated in Table 7 reveal that the permeability coefficient, compressive strength, and flexural strength fall within the ranges of 3.45 to 5.97 mm/s, 35.6 to 45.6 MPa, and 3.77 to 5.64 MPa, respectively, aligning with the criteria outlined in the specification [69]. The final models derived for the permeability coefficient, compressive strength, and flexural strength expressed in terms of the three independent variables (W/C, NS, and CF) are shown in Table 8 (only items with statistically significant p-value < 0.05 are included). The meanings and values of A, B, and C in the regression equation are presented in Table 5.
The variance analysis and regression model statistics of each response are presented in Table 9. For the permeability coefficient, all three independent variables are significant in the prediction model (p-value < 0.05), and only the linear change is presented. In terms of flexural strength, three parameters also influenced the interaction between the secondary effect and the multi-factor. The effect of CF on resistance is insignificant.
The lack of fit above the 10% significance level (p-values of the three response lack-of-fit terms were 0.4153, 0.2457, and 0.2383) confirmed the model’s applicability. This applicability was also confirmed by the high regression coefficient (R2) of the prediction model (permeability coefficient, compressive strength, and flexural strength were 0.9845, 0.9540, and 0.9964, respectively).
According to the pre-coefficient of equations in Table 8 and the p-value of each item in Table 9, the influence degree of the three factors on the permeability coefficient and flexural strength decreases in order of W/C ratio, CF, and NS; the influence degree of the three factors on the compressive strength decreases in order of W/C ratio, NS, and CF.

3.2. Effects of the Factors on Responses

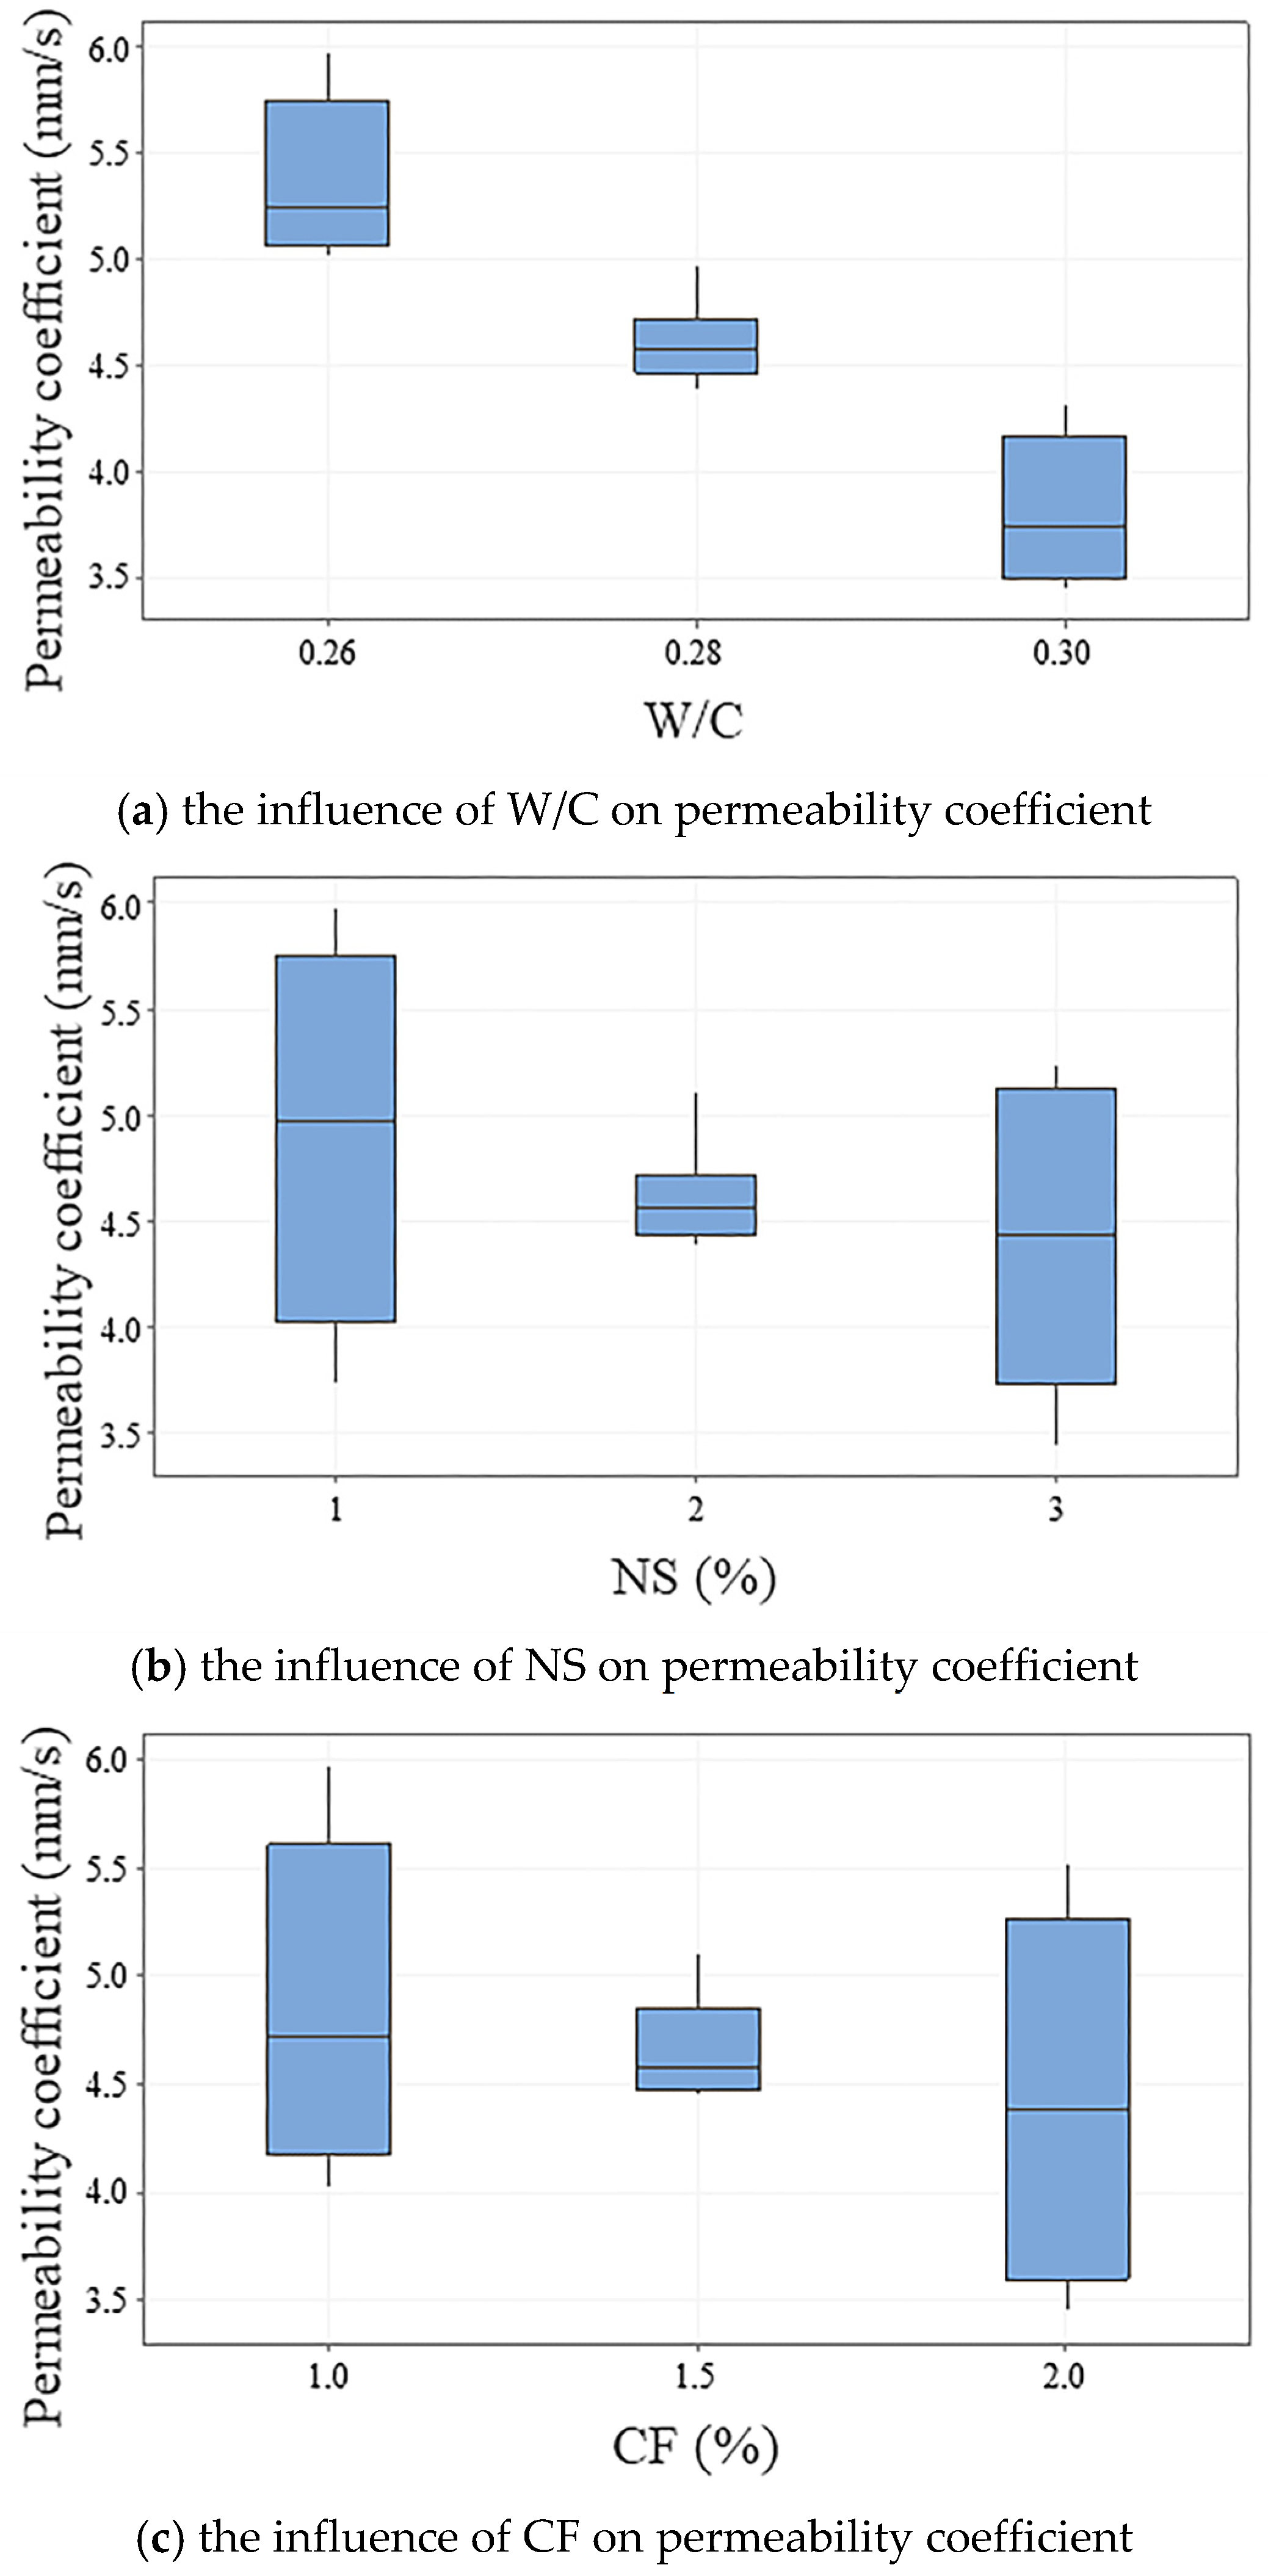
3.2.1. Permeability Coefficient

Perturbation plots reveal significance by illustrating the change in response value due to the movement of each factor from its reference point (levels at 0 for each factor), with one factor changing while the other factors remain at their constant reference values. Figure 8 presents the perturbation plot of the permeability coefficient, illustrating the change in permeability coefficient resulting from the movement of each factor from its reference point.
As illustrated in Figure 8, the increase in all three admixture factors has a negative effect on the permeability coefficient. Among the 19 test groups, Group 8, with the maximum 3% NS doping, 2% CF doping, and 0.3 W/C ratio, achieved the lowest permeability coefficient of 3.45 mm/s. Meanwhile, the curve of factor A (W/C) is steeper than that of B (CF) and C (NS), indicating that the permeability coefficient of pervious concrete is more sensitive to the W/C ratio. This phenomenon can also be observed in Figure 9, which presents a boxplot. Even if there is a synergistic effect of CF and NS, the overall permeability coefficient still tends to decrease with increasing W/C ratio. Although the highest and lowest permeability coefficients occur in the lowest (both 1% doping) and highest groups of CF and NS doping (2% CF doping and 3% NS doping), respectively, the negative effect of both on the permeability coefficient is not as significant as that of the W/C ratio. Meanwhile, the slope of the C curve is greater than the B curve when the value of each factor is less than the central value (the factor code is 0), indicating that the negative effect of CF on the permeability coefficient is more obvious than that of NS. At the same time, the slope of the B curve is greater than the C curve when the value of each factor is greater than the central value, indicating that the permeability coefficient is more sensitive to changes in NS than CF at this time.
The trend of increasing permeability coefficient with decreasing W/C ratio, CF, and NS doping is also depicted in Figure 10. The absolute value of the coefficient of the W/C ratio term in equation R1 of Table 8, 160.81, is significantly larger than the values for the CF and NS terms (0.43 and 2.3, respectively), which also supports this conclusion. The larger W/C brings more cement paste in unit volume, resulting in smaller pores and a lower permeability coefficient. Meanwhile, because the addition of NS produces a large number of capillary pore structures in the hydration reaction [69], and the incorporation of CF affects the connectivity of pores, the water permeability of the experimental group is lower than that of general studies under the negative effects of both [70,71]. As can be seen from the statistical items related to the permeability coefficient in Table 9, only A (W/C) and C (NS) show correlation in this experiment (p-value < 0.05 for the AC item).

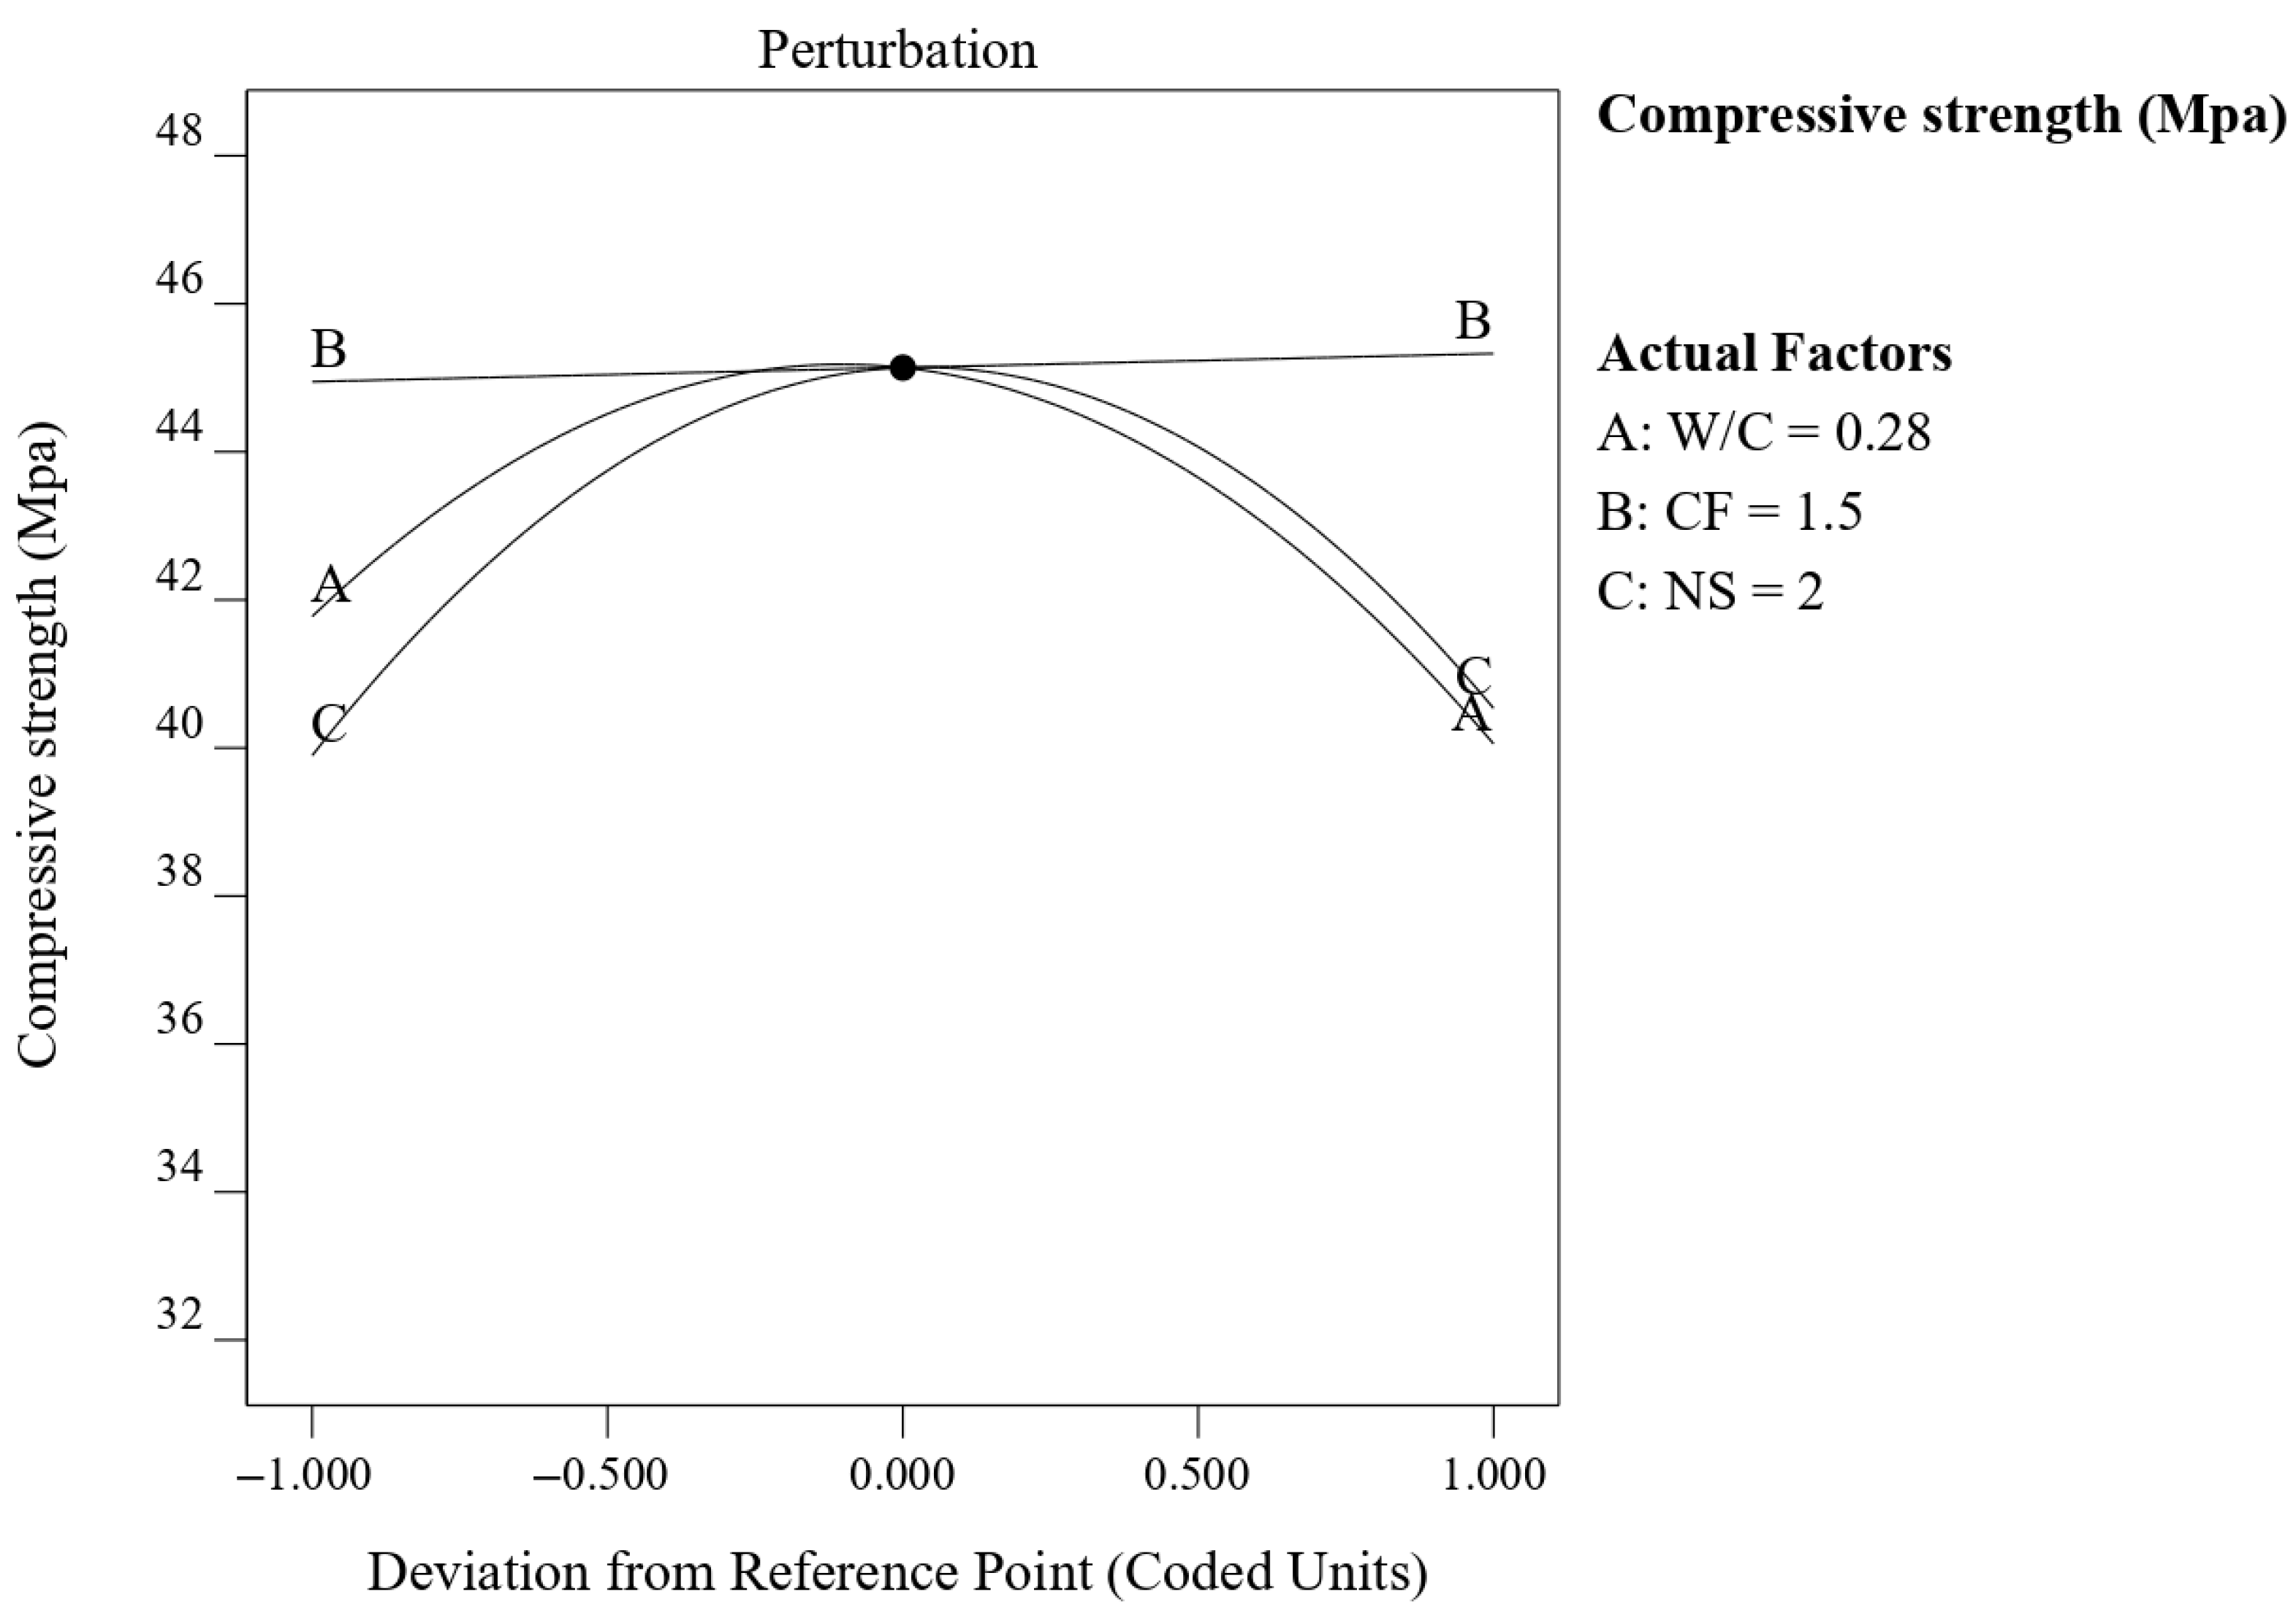
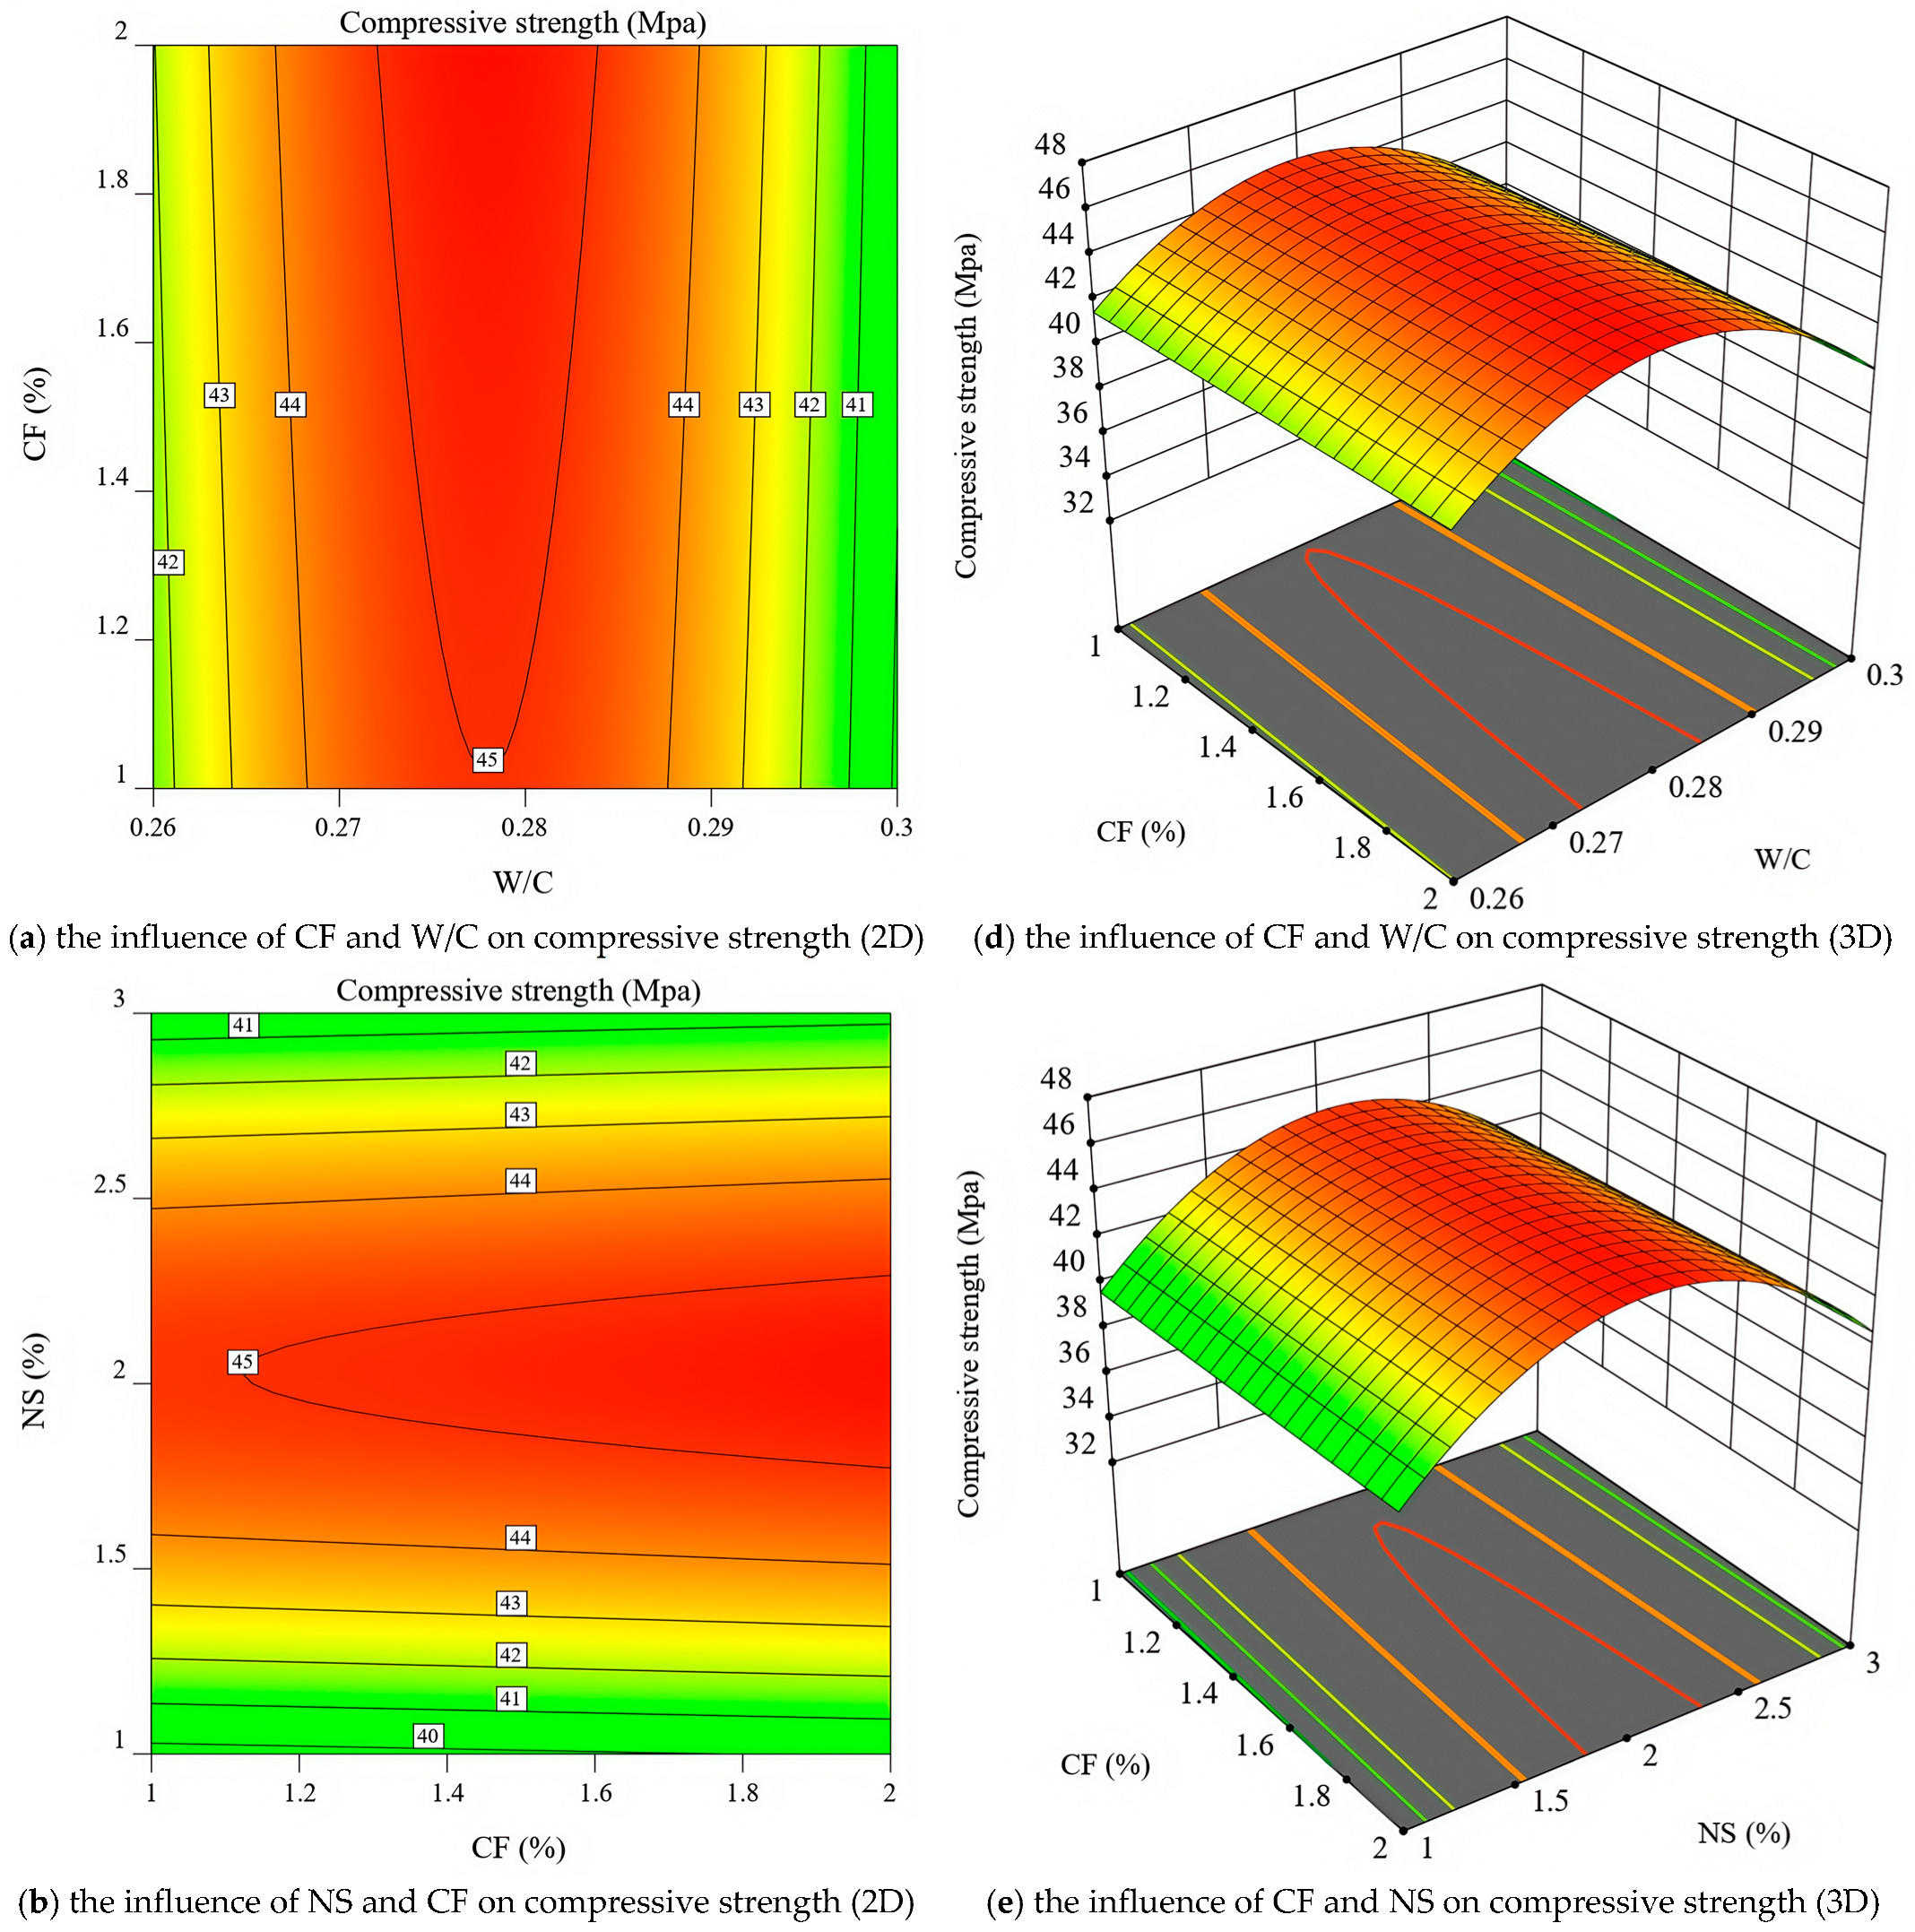
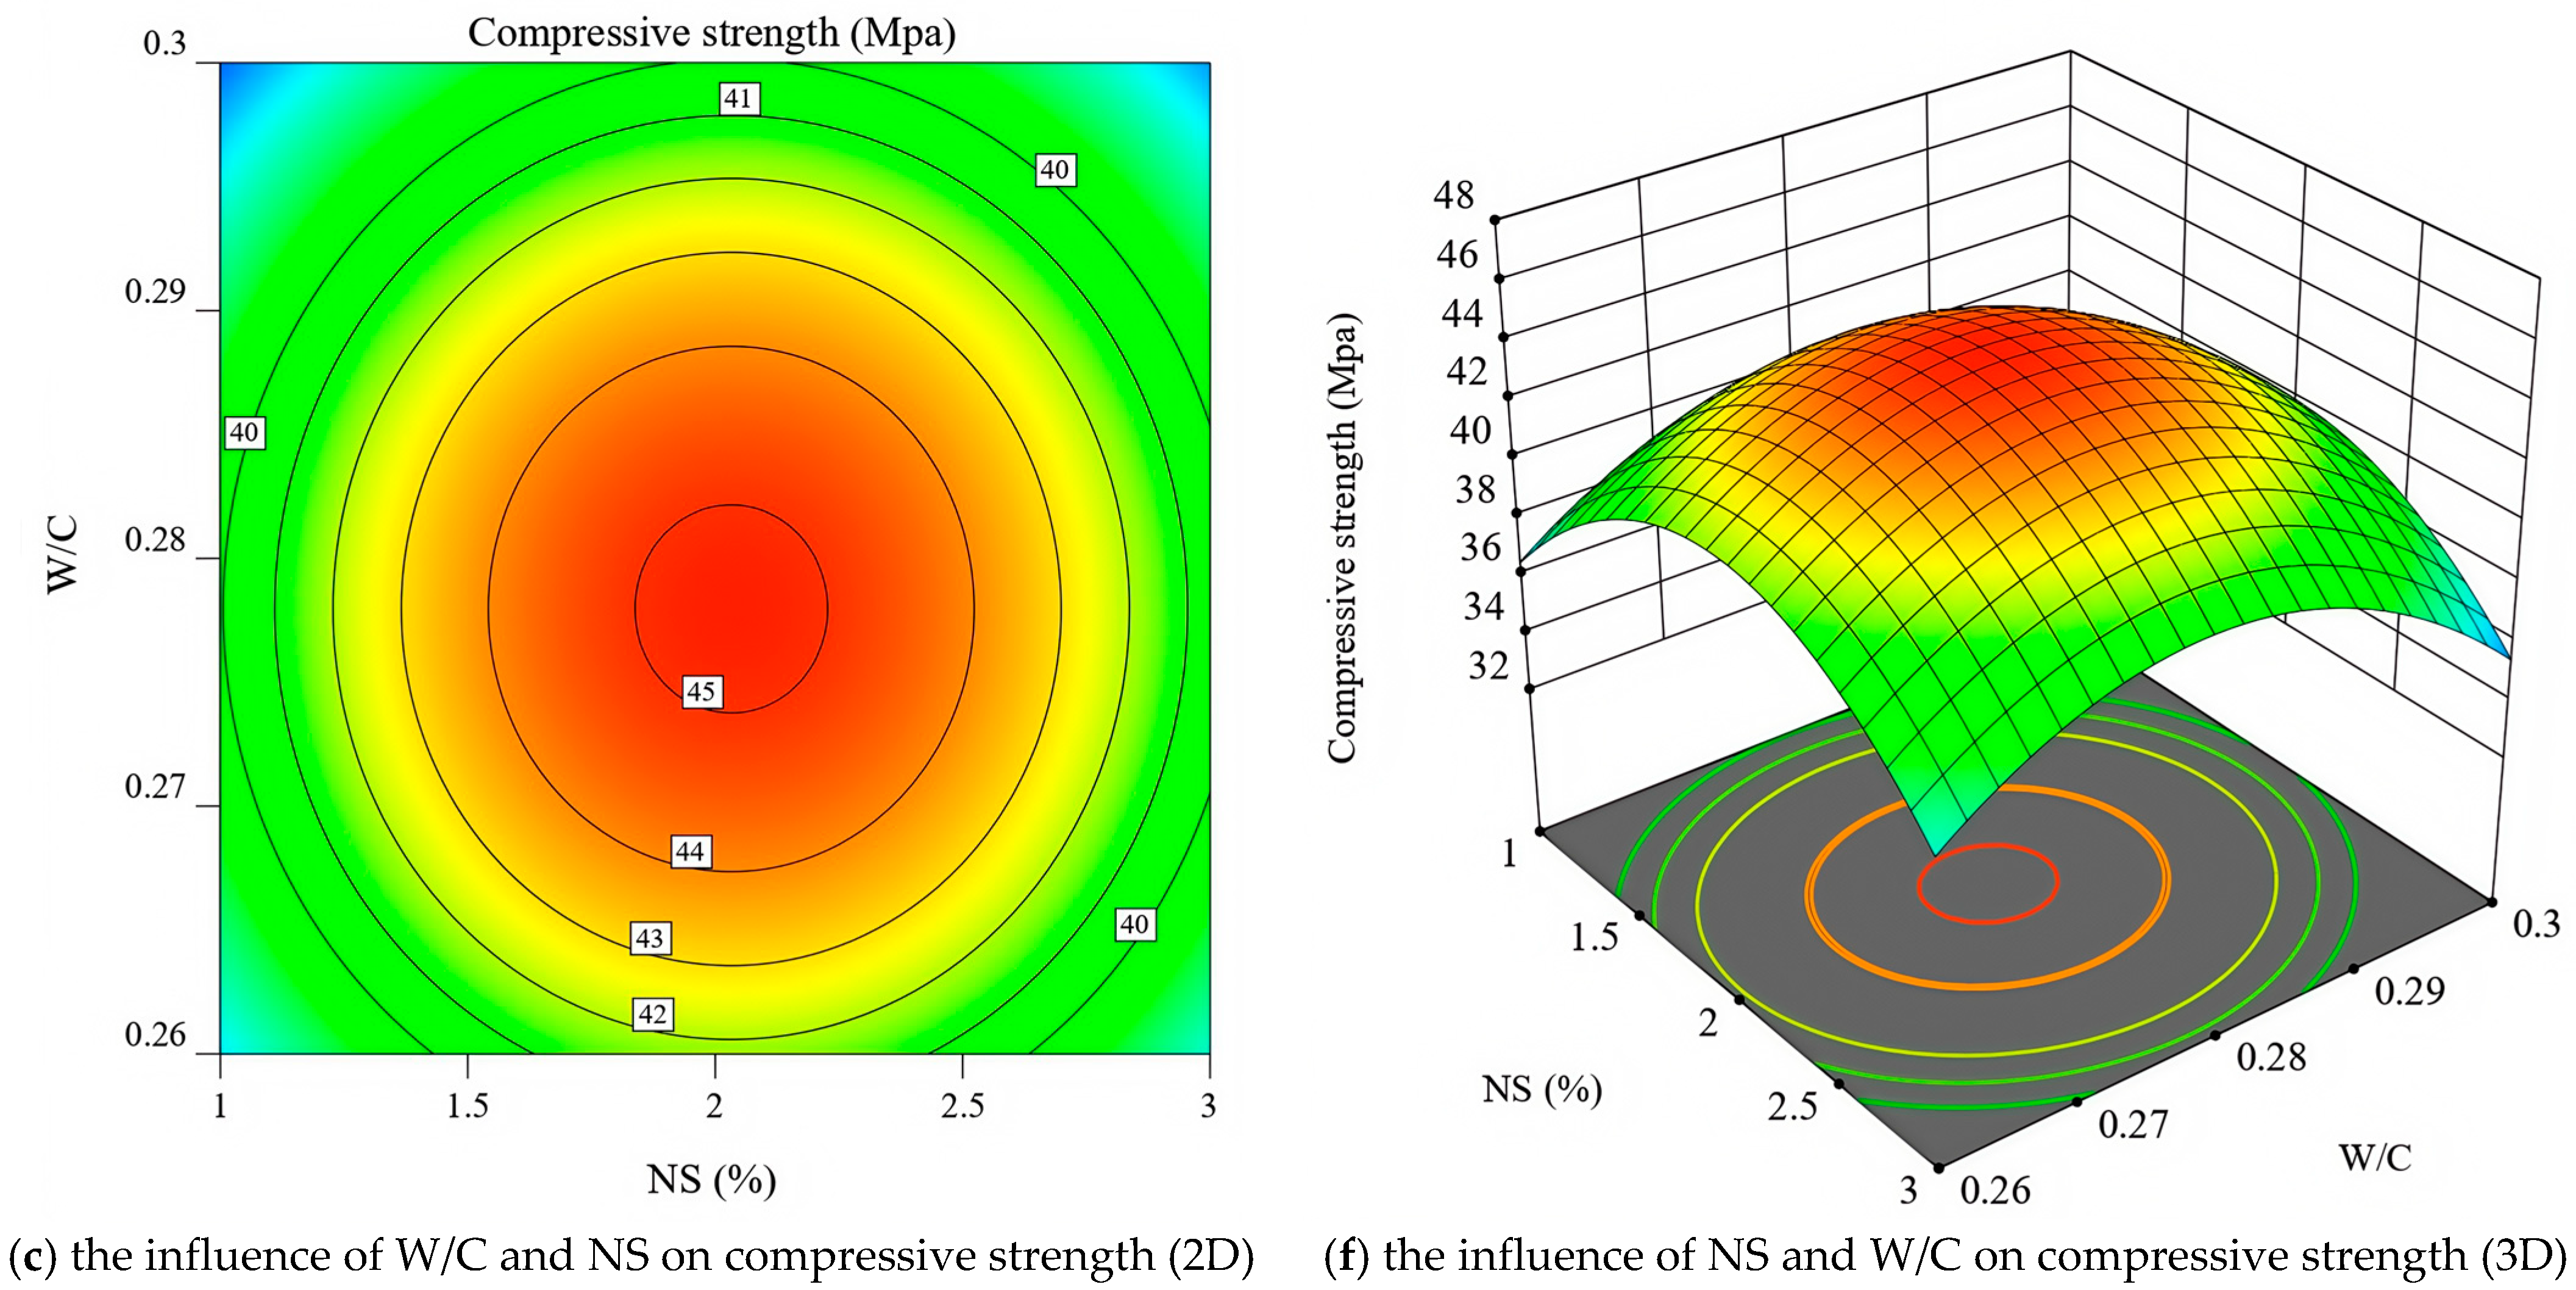
3.2.2. Compressive Strength

Figure 11 shows the change in compressive strength caused by moving each factor from the reference point (levels at 0 for each factor). As shown in Figure 11, the compressive strength increases and then decreases with increasing W/C ratio and NS, and the change in compressive strength with changes in CF doping is not significant. The fact that experimental groups 12 and 18 attained the maximum compressive strength provides additional evidence supporting this regularity. In the range of test parameters, the A curve is steeper than the C curve, indicating that the compressive strength is more sensitive to the change in W/C ratio than NS.
The trend of variation can also be observed in the surface plot shown in Figure 12.
Unlike other concretes, selecting a W/C ratio in pervious concrete does not guarantee an increase in strength. Although the cement slurry with a low W/C ratio has high strength, the slurry volume cannot completely wrap the aggregate, resulting in weak areas. This is more prominent in pervious concrete mixed with fine sand, as the surface area and water absorption of fine sand are higher than those of coarse aggregate. When the W/C ratio is large, although the aggregate can be guaranteed to be completely wrapped, the overall structural strength cannot be guaranteed when the slurry strength is low. Therefore, the mechanical strength of pervious concrete increases and decreases with an increase in the W/C ratio.
The influence of NS on mechanical properties also exhibits a similar trend, as shown in Figure 12c,f. Numerous studies have revealed that the incorporation of NS enhances the quality of cement paste due to its high pozzolanic properties, resulting in finer hydrated phases (C-S-H) [72,73,74] and a denser microstructure (nano-filler), which leads to concrete with enhanced durability [75,76]. However, the inherent characteristics of NS complicate its dispersion; when its concentration is excessively high, the aggregated NS cannot effectively react with the cement paste to enhance strength, resulting in weak areas and voids within the concrete matrix [77]. Furthermore, the surplus NS leads to excessive moisture accumulation in the interstitial spaces between the cement particles, resulting in an overconcentration of water on the surface of these particles. This, in turn, reduces the availability of free water in concrete, therefore hindering complete hydration.
CF had little to no effect on the compressive strength of concrete in the test, as illustrated in Figure 12a,b,d,e, which is consistent with the findings of many scholars [41,42,77,78,79]. Although a few scholars have observed a slight increase in the compressive strength of concrete caused by CF, they believe that this increase is due to CF limiting crack propagation in concrete and providing lateral constraints, thereby compensating for the strength loss caused by porosity [80]. However, due to the large porosity of pervious concrete, the strength loss is too small to compensate. Thus, the effect of CF on improving compressive strength was not observed in the test.
No synergistic effect of multiple factors on the compressive strength was observed in the tests. The shape of the contour in Figure 12c reflects the strength of the interaction between NS and the W/C ratio. The ellipse indicates a significant interaction between the two factors, while the opposite is true for the circle. Therefore, the interaction between NS and the W/C ratio is not significant. Similarly, no synergy was observed between the W/C ratio and NS and the W/C ratio and CF, and there were no synergy items with p-values less than 0.05 in the compressive strength statistics item in Table 9.

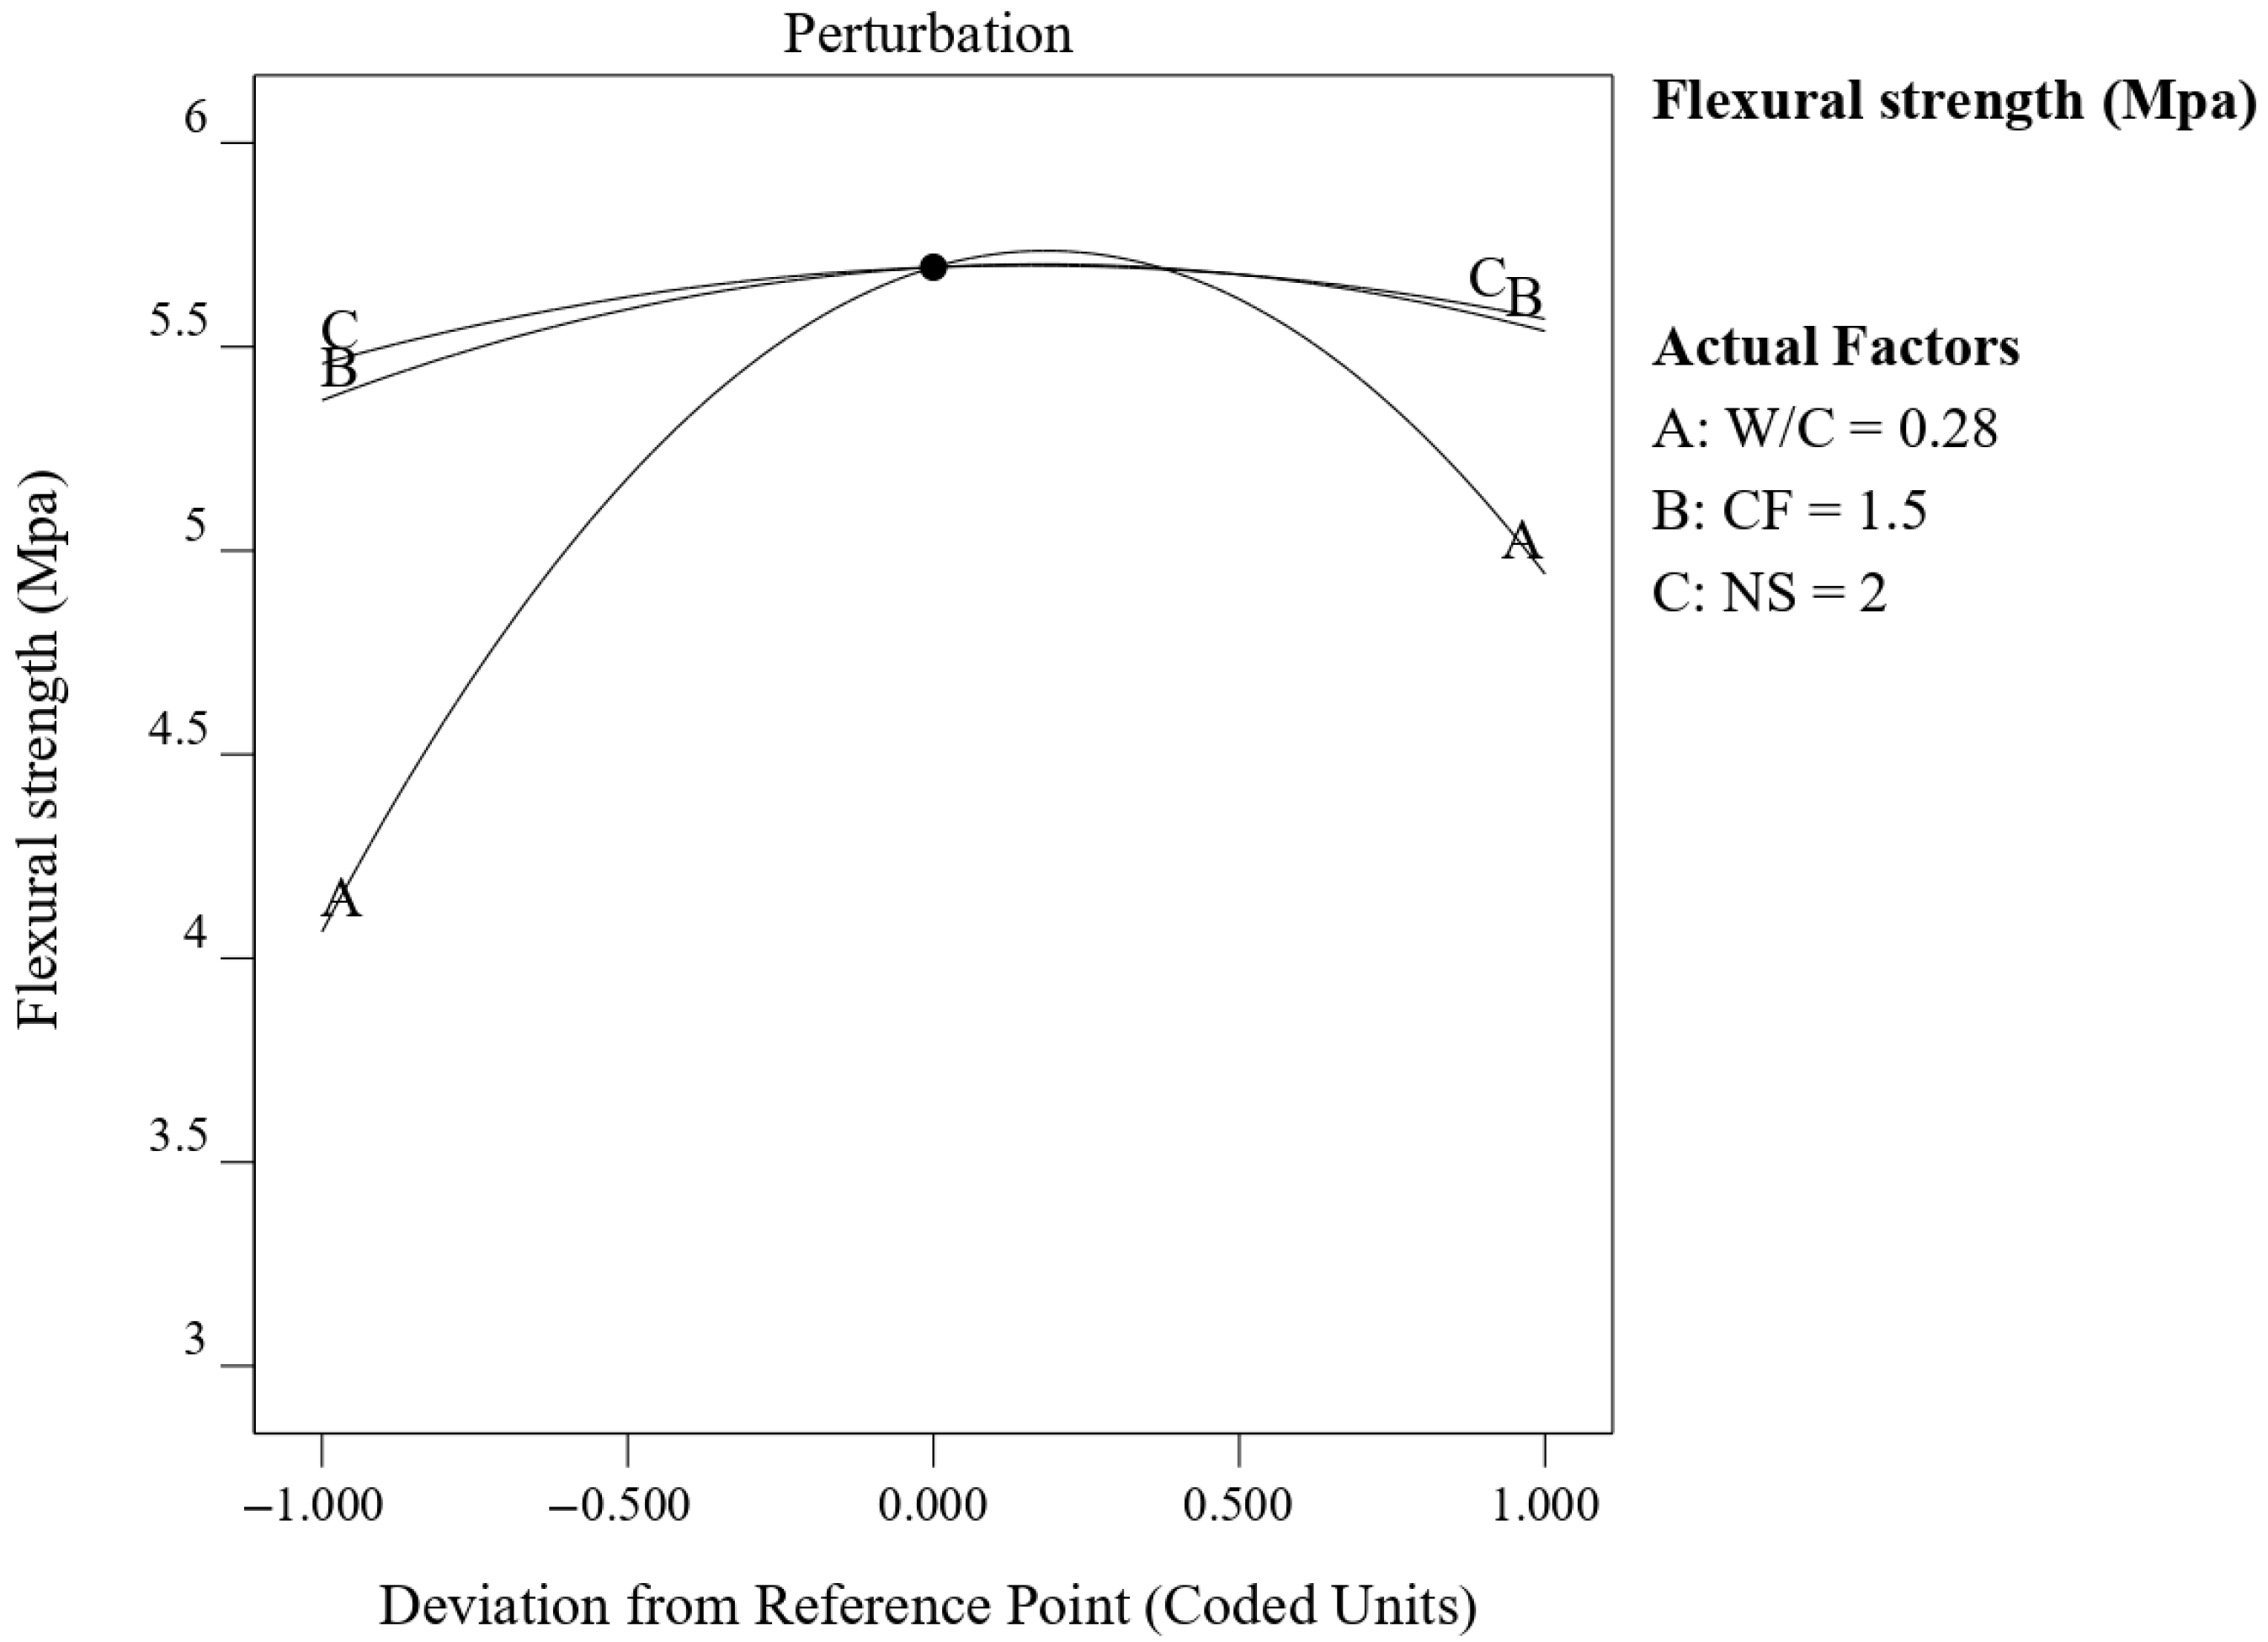
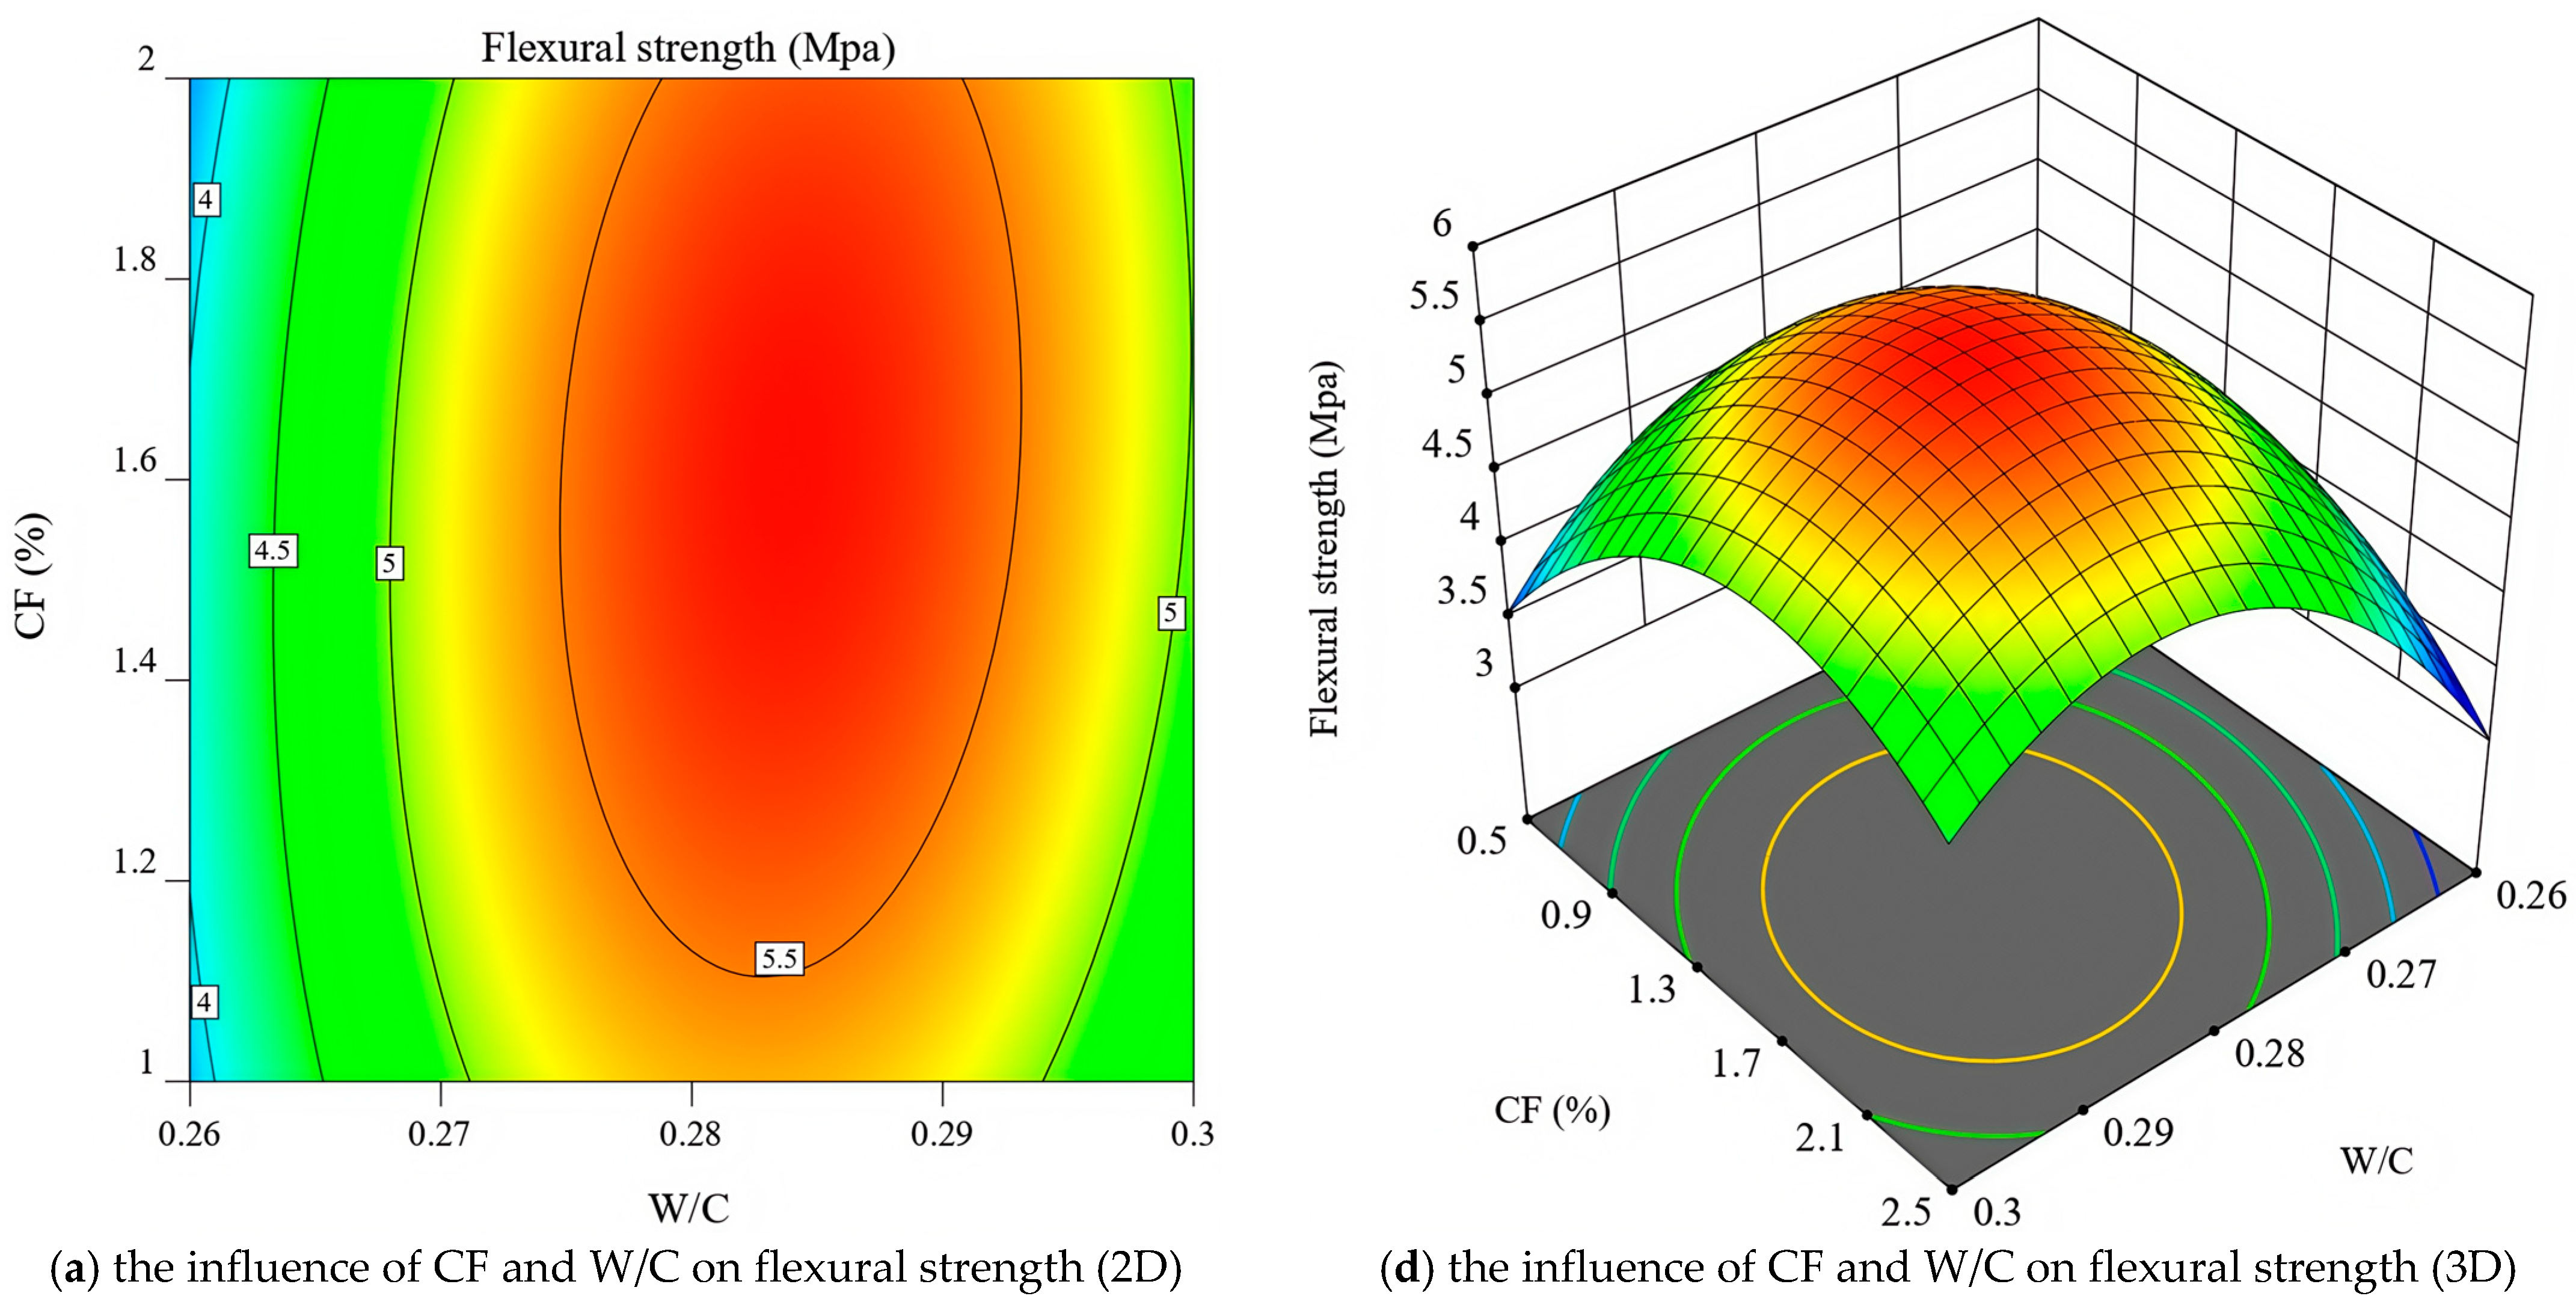
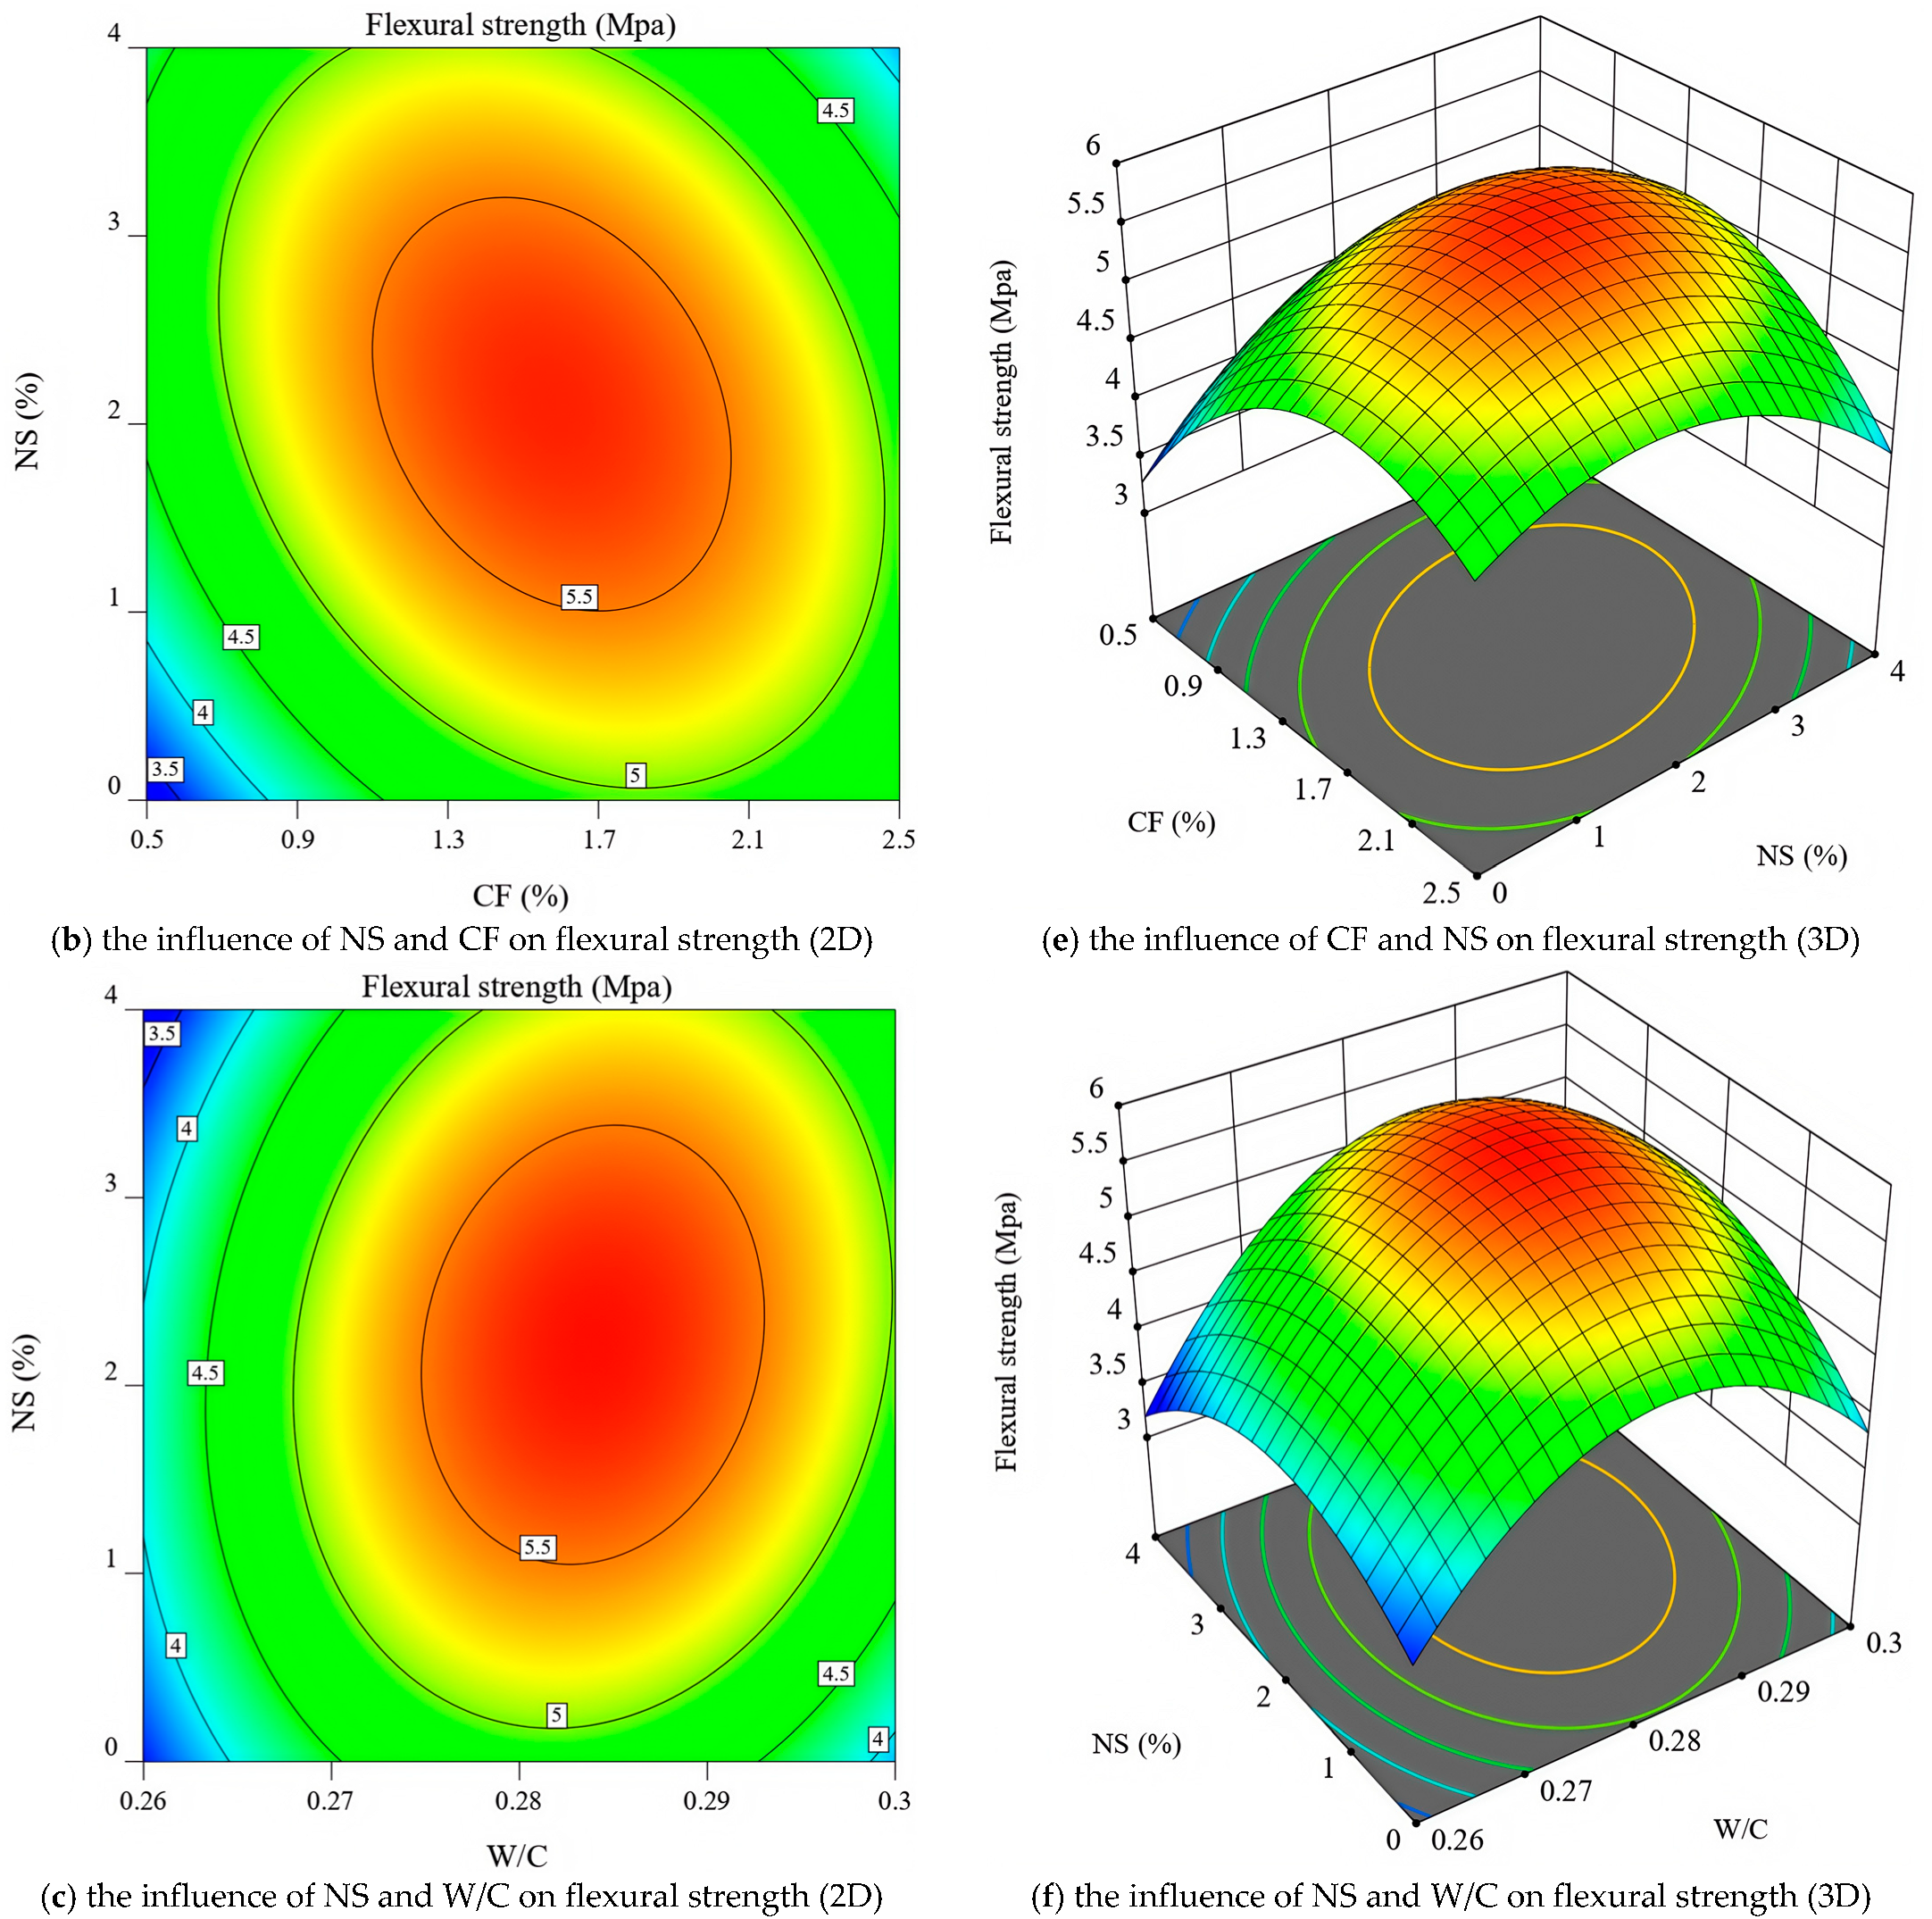
3.2.3. Flexural Strength

Figure 13 illustrates the change in flexural strength caused by moving each factor from the reference point (levels at 0 for each factor). As illustrated in Figure 13, the flexural strength demonstrated a trend of increasing and then decreasing with the increase in all three factors. This trend is further corroborated by the fact that Experimental Group 19 achieved the maximum flexural strength of 5.79 MPa when all three factors were set to level 0. However, the slope of the A curve is the largest, indicating that the flexural strength is the most sensitive to the change in the W/C ratio. The slopes of B and C curves are close to each other, indicating that the flexural strength is similarly sensitive to the change in CF and NS doping, which can be proved by the coefficients for B and C terms in Table 8 R3 (0.2 and 0.6, respectively).
Figure 14 illustrates the surface plot of the flexural strength response model. It can be observed that the effect of the W/C ratio and NS on flexural strength is similar to that of compressive strength. However, the incorporation of appropriate CF can effectively improve the flexural strength of pervious concrete, whereas it has almost no effect on compressive strength, as illustrated in Figure 14a,b,d,e. According to the fiber spacing theory [81,82], dispersed fibers at a reasonable dosage can produce a reverse stress field around the initial crack in pervious concrete, weaken stress concentration at the crack tip, and restrict the further development of cracks. However, CF can improve the continuity of the internal structure of the material. For pervious concrete structures, the strength is generally lower than that of ordinary concrete because of the existence of a large number of discontinuous pores, and the continuity of the internal structure is enhanced after the addition of CF. Therefore, CF, which plays a bridging role, can improve the flexural strength by improving the tensile strength of concrete [83,84]. However, the uneven dispersion caused by the high fiber content leads to a weak point at the bond between the cement slurry and aggregate, which is compromised when a bending load is applied, resulting in a decrease in strength. As illustrated in Figure 14a–c, the 2D surface plot of flexural strength is elliptical, which indicates that all three factors demonstrate a significant interaction in flexural strength, which can also be observed from the fact that the p-values for the flexural strength model terms AB, AC, and BC in Table 9 are less than 0.05.

3.3. Response Optimization

Through numerical optimization design, the factor dosage that satisfies the expected target is studied. Three groups of numerical optimization models are listed in Table 10, with the permeability coefficient, compressive strength, and flexural strength as optimization targets. The predicted permeability coefficient, compressive strength, and flexural strength of Group A were 5.5 mm/s, 40.44 MPa, and 4.29 MPa. The predicted permeability coefficient, compressive strength, and flexural strength of Group B were 4.47 mm/s, 45 MPa, and 5.5 MPa.
From the ratio in Group A, the CF and NS were added in smaller amounts to achieve a higher permeability coefficient, while maintaining a low W/C ratio. However, to achieve higher compressive strength, Group B adopted a higher CF and NS content than Group A, but its predicted permeability coefficient is lower than that of Group A. Group C set the flexural strength as the optimization target; however, due to the significant positive correlation between the compressive strength and the flexural strength, the predicted value of the compressive strength was also high and nearly the same as that of Group B.
Therefore, to verify the equation and obtain the best data statistically, a series of additional experimental tests were performed in the laboratory using the ratios in Table 10, with Group A serving as the permeability coefficient optimization design group and Group B as the representative validation group for the mechanical strength optimization design.

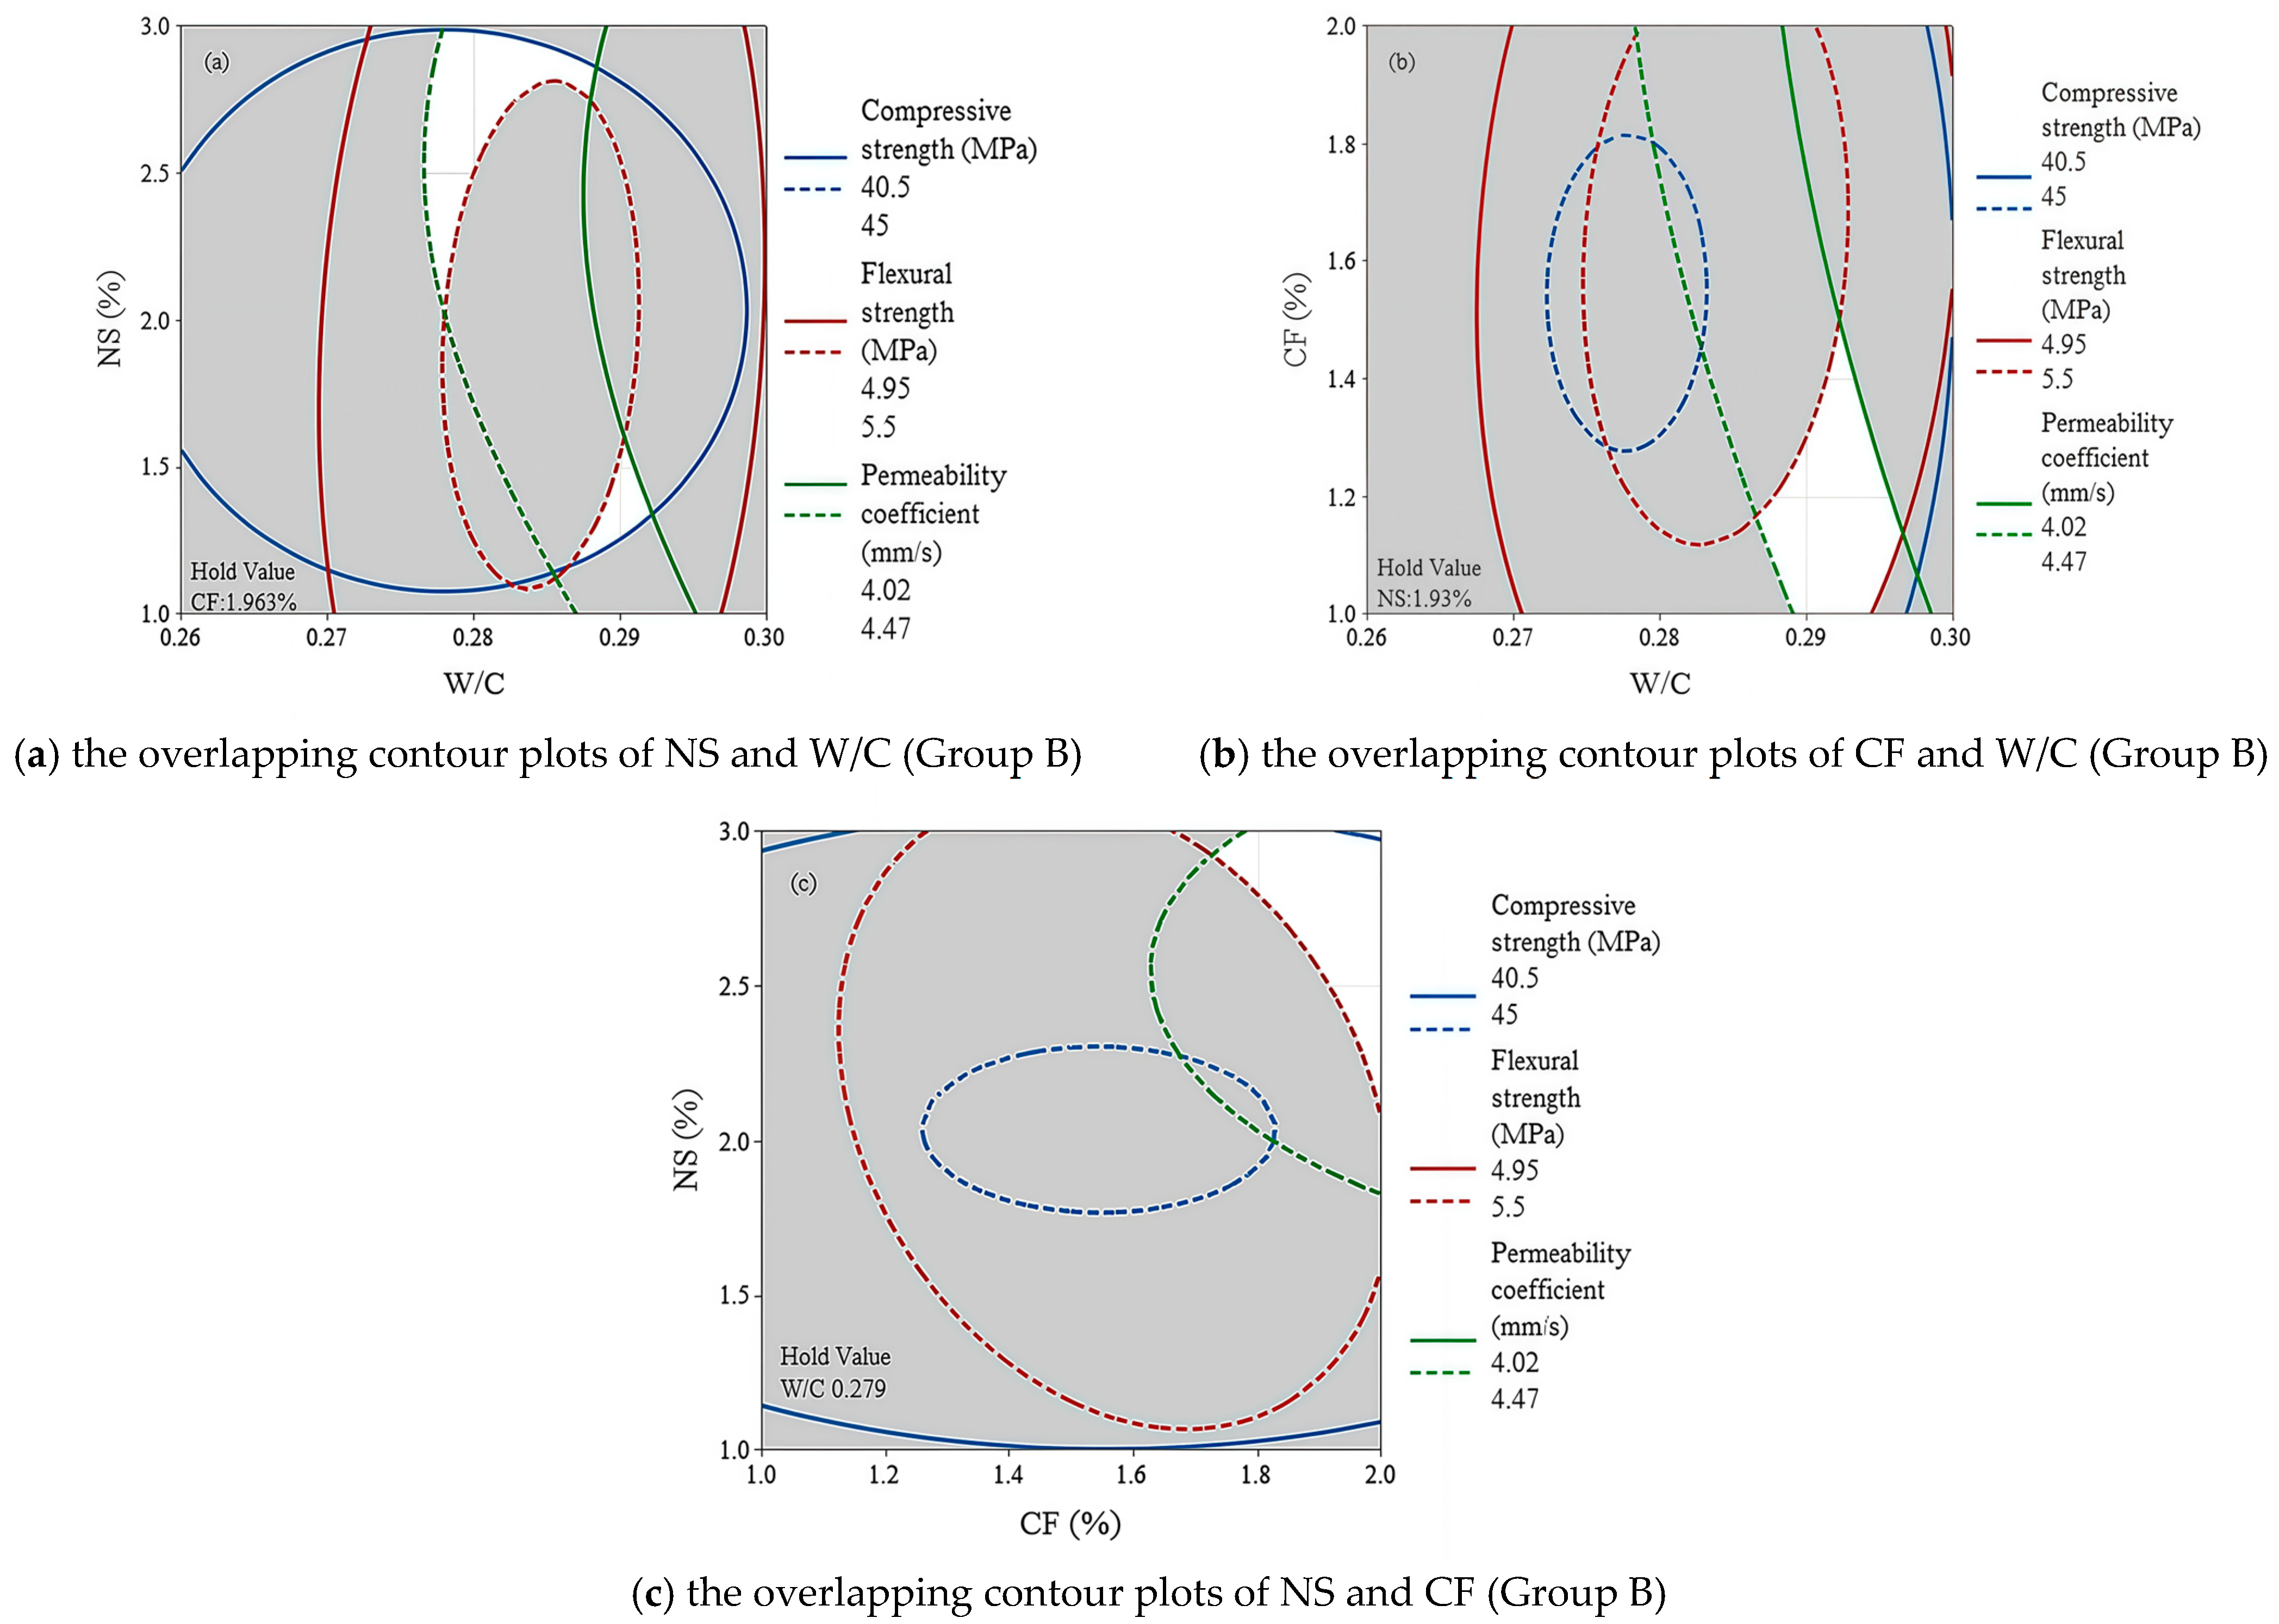
3.4. Overlay Contour Plots

To achieve a wider range of independent variables while approaching the predicted optimization goal, the target response was reduced by 10% based on the predicted response value. The overlapping contour maps presented in Figure 15 and Figure 16 are all drawn according to two independent variables, and the third variable maintains the optimal value of the mix ratio level.
For Optimization Group A, a larger range of independent variables exists to achieve the predicted target range for the properties of permeability coefficient, compressive strength, and flexural strength. For example, as illustrated in Figure 15b, when the NS dosage is 1.359%, the CF dosage increases from 1.359% to 2%, the W/C ratio increases from 0.26 to 0.263, the permeability coefficient is 4.95 to 5.5 mm/s, compressive strength is 36.4 to 40.44 MPa, and the flexural strength is 3.86 to 4.29 MPa. Exceptions are also found in the overlapping contour map, as illustrated in Figure 15a. When the NS content is 2.6% to 3% and the W/C ratio is 0.26 to 0.263, the CF content of 1.208% can also ensure that all properties are within the expected target, while the NS content is far higher than the optimal response value of 1.359%. In Figure 15c, with the change in NS and CF dosage, two regions can achieve the target response. By comparing these two regions, NS is guaranteed at a low level when the CF dosage increases. When the NS content increases, keeping the CF content at a low level is the general rule that the expected response target range can be achieved under the condition of W/C at the optimal ratio.
As shown in Figure 16a, when the CF content is maintained at 1.963%, the NS content varies between 1.93% and 2.78%, and the W/C value ranges from 0.276 to 0.288, ensuring the achievement of the predicted target value. Meanwhile, when the NS content increases from 1.17% to 1.56% and the W/C increases from 0.287 to 0.292, the predicted target can also be achieved. In this case, the NS content is lower than the optimal value, while the W/C is higher than the optimal value.

3.5. Statistical Model Validation

The preparation and curing of A and B are conducted, and the results are presented in Table 11. The deviation between the measured value and the predicted value is within 7%. The error bar charts for the experiments and model predictions are presented in Figure 17, indicating that the model exhibits experimental reliability.

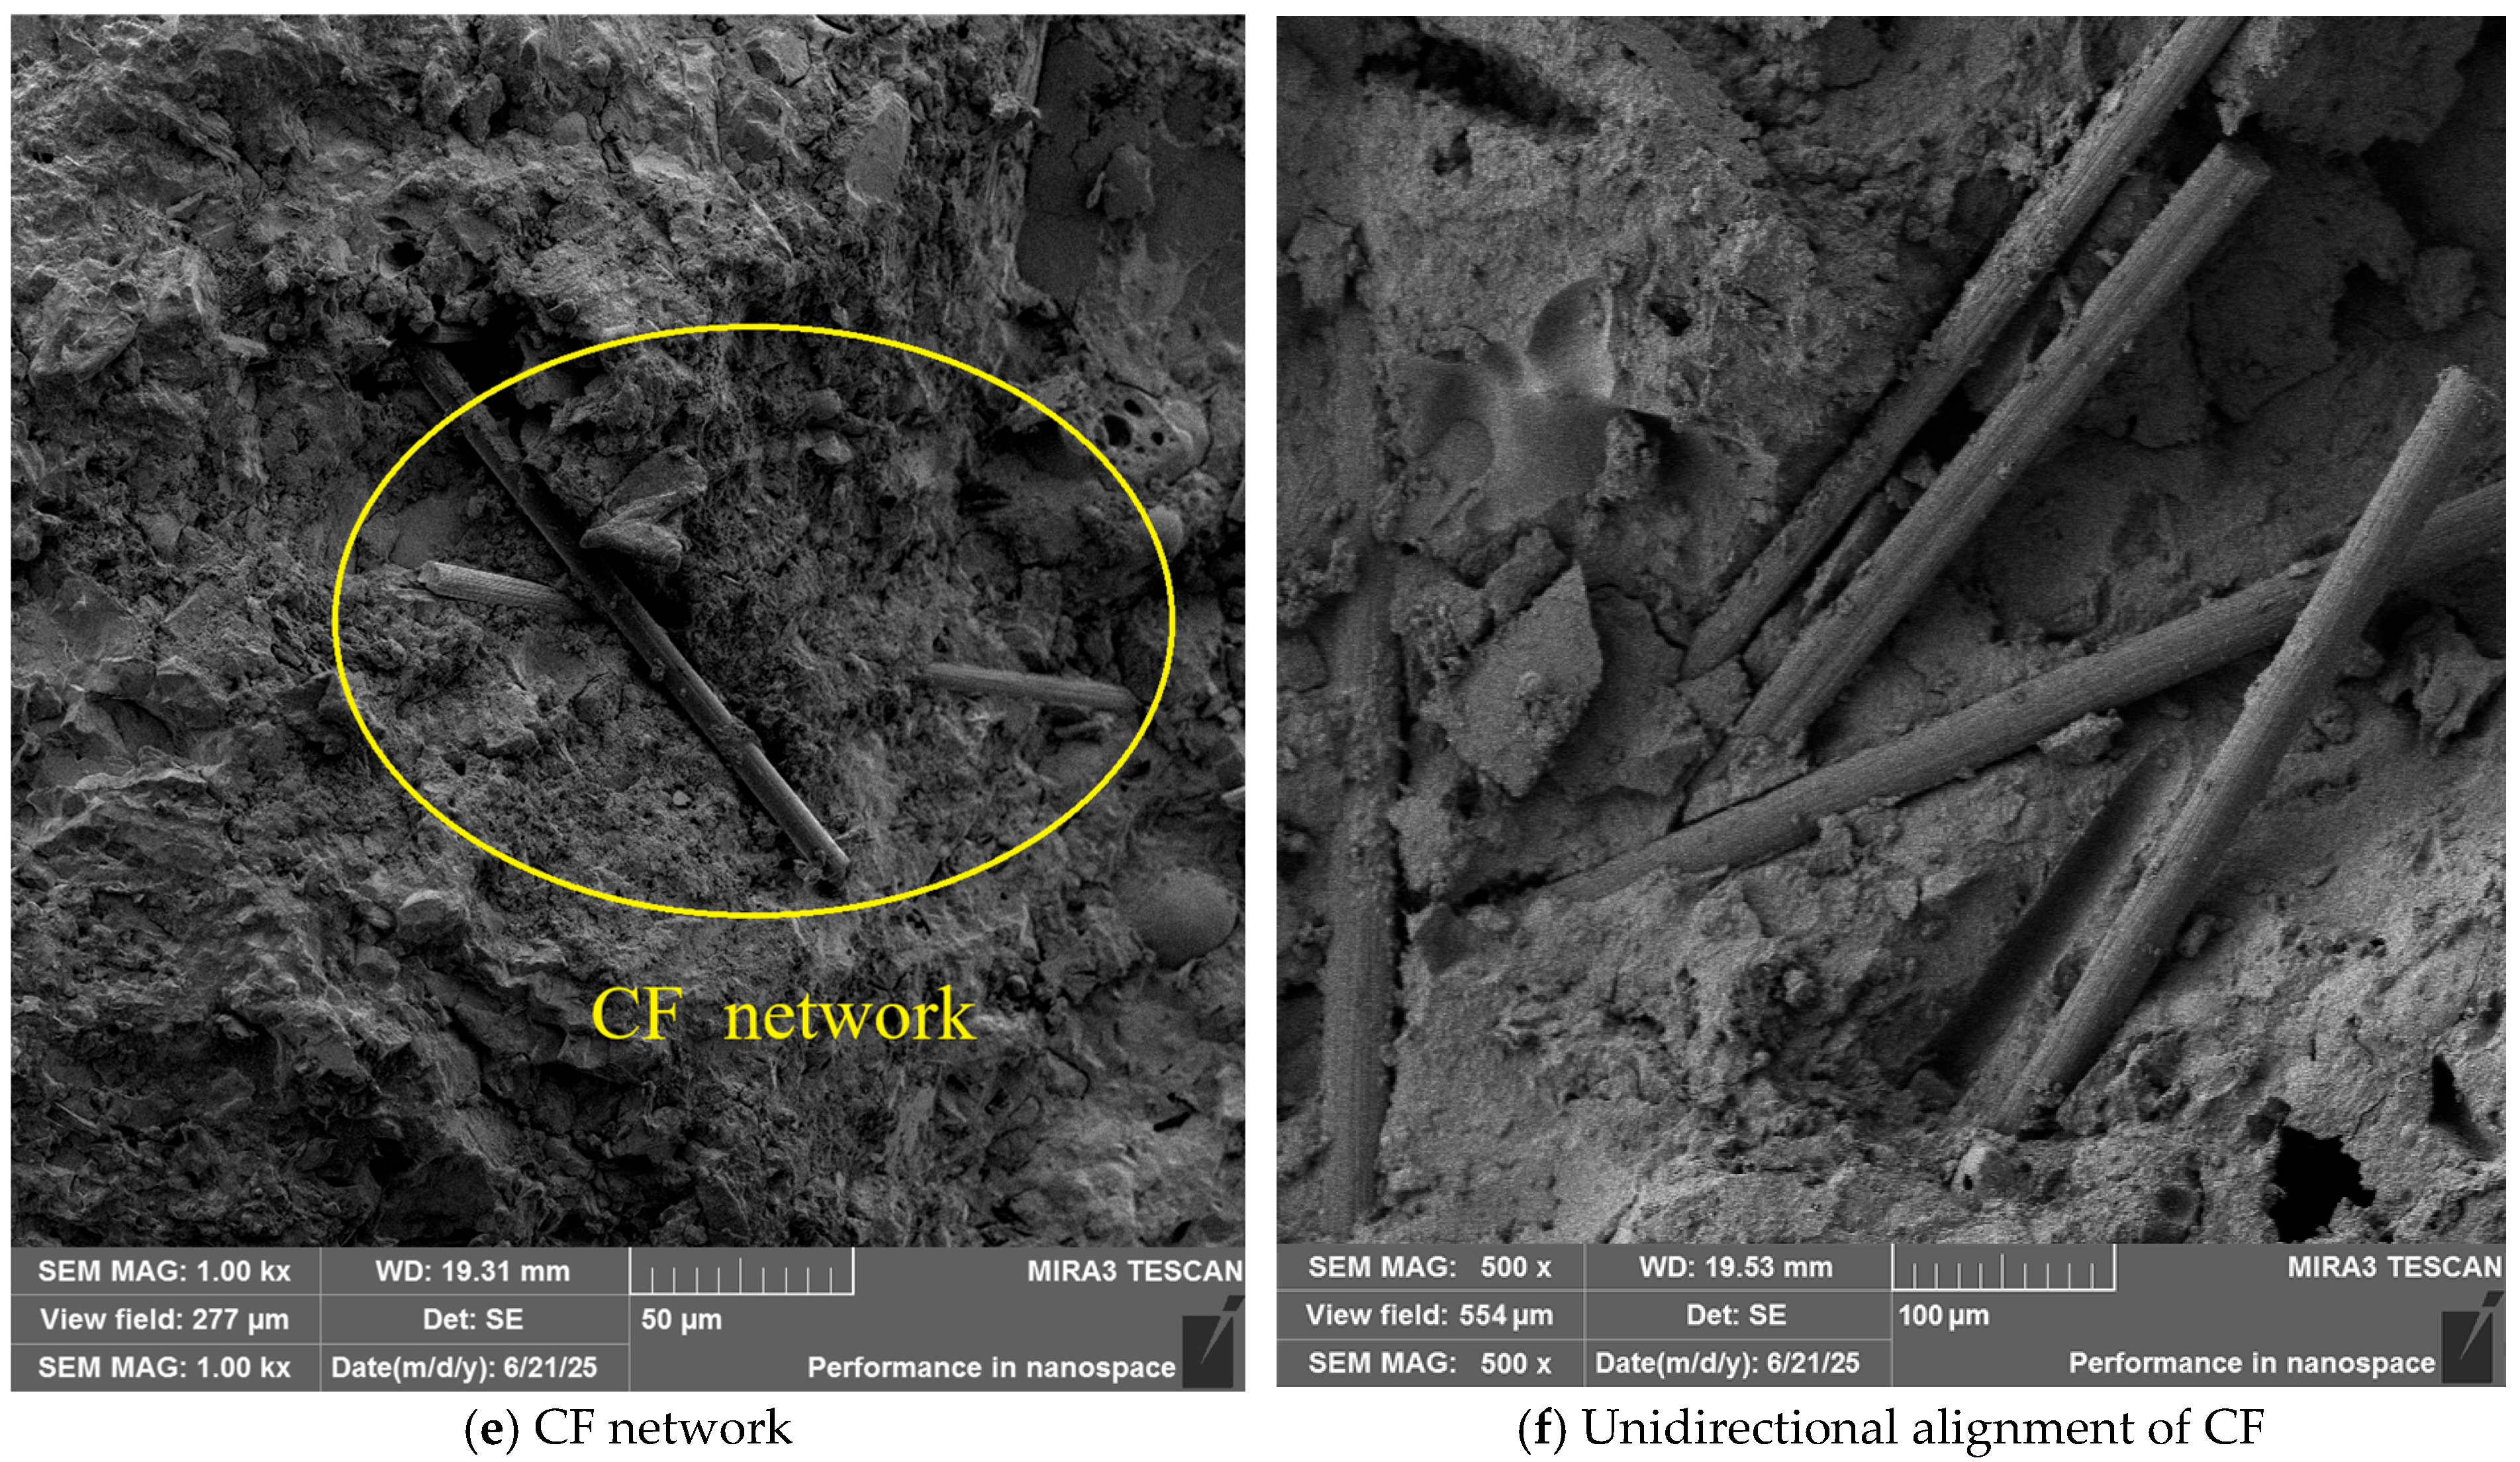
3.6. Scanning Electron Microscope (SEM) Investigations

As illustrated in Figure 18a, the incorporation of NS significantly promoted the densification of hydration products within pervious concrete. Substantial amounts of hydration products not only filled the internal micropores of the pervious concrete, thereby reducing the initiation and propagation of microcracks (Figure 18b), but also enhanced the strength of the interfacial transition zone (ITZ). This improvement facilitated more effective load transfer between aggregates and the cement paste, ultimately enhancing the concrete’s overall mechanical properties.
However, excessive NS incorporation led to the presence of unhydrated and partially hydrated NS particles. These particles created weak interfaces within the concrete matrix, subsequently inducing microcracks (Figure 18c). This phenomenon compromised the structural integrity of the pervious concrete, resulting in a degradation of its mechanical performance.
As depicted in Figure 18d,e, the addition of CF significantly inhibited microcrack propagation. During the initial loading stage, the strong interfacial bond between the fibers and the matrix enabled the CF to effectively bridge microcracks. Through this bridging effect, the fibers established load transfer paths across crack faces, thereby inhibiting crack extension. Furthermore, the interwoven distribution of CF within the pervious concrete formed a three-dimensional reinforcement network. This network substantially improved the adhesion between the cement matrix, aggregates, and fibers. Consequently, even under load, the highly porous pervious concrete maintained its integrity, distributed stress more uniformly, and exhibited significantly improved flexural strength. Nevertheless, the inherent high porosity and interconnected pore structure of pervious concrete limited the effectiveness of CF in enhancing compressive strength.
Excessive CF incorporation (Figure 18f) caused the fibers to agglomerate and align predominantly in a single direction. This agglomeration created weak zones within the concrete, impaired the bond between the fibers and the cement matrix, hindered effective stress transfer between them, and consequently led to a reduction in the mechanical strength of the pervious concrete.

4. Conclusions

This study designed experiments using the response surface methodology central composite design (RSM-CCD), established theoretical models, and elucidated the influence patterns of W/C ratio, NS, and CF on the key properties of pervious concrete. The synergistic interaction mechanisms among these three factors were analyzed. Finally, experimental validation and microscopic analysis were conducted. High-performance pervious concrete exhibiting both high mechanical properties and permeability was successfully fabricated using conventional materials and standard concrete forming techniques. Based on the aforementioned experimental research, the following conclusions are drawn:
(1)
W/C ratio is the primary factor influencing the various properties of pervious concrete. Selecting an appropriate W/C ratio is the foremost task in producing high-performance pervious concrete. An increase in W/C ratio leads to a decrease in the permeability coefficient of pervious concrete, while the mechanical properties initially increase and subsequently decrease. A W/C ratio of 0.28 yields the optimal mechanical performance.
(2)
CF causes a substantial decrease in the permeability of pervious concrete. Simultaneously, the addition of CF has almost no effect on the compressive strength. However, the flexural strength initially increases and then decreases with increasing CF content, with the optimal CF dosage being 1.6%.
(3)
NS significantly reduces the permeability of pervious concrete but markedly enhances its mechanical strength. The optimal NS dosages for achieving the highest compressive strength and flexural strength are 1.9% and 2.2%, respectively.
(4)
The permeability of pervious concrete generally exhibits an inverse relationship with its mechanical strength; compressive strength and flexural strength demonstrate a proportional relationship.
(5)
The synergistic interaction between W/C ratio, NS, and CF significantly exacerbated the reduction in the permeability of pervious concrete.
(6)
W/C ratio, NS, and CF exhibited no significant synergistic effect on the compressive strength. However, a distinct interactive effect was observed concerning the flexural strength.
The high-performance pervious concrete developed in this study overcomes the mechanical limitations of conventional pervious concrete, enabling its application in scenarios demanding higher load-bearing capacity and durability:
(1)
Non-motorized lanes on municipal arterial roads: High-performance pervious concrete provides sufficient structural support and fatigue resistance, mitigating common issues in conventional pervious concrete such as surface raveling, aggregate detachment, and structural failure.
(2)
Bus stop platforms: Bus stops experience frequent acceleration and deceleration, as well as concentrated loads, which impose extreme demands on pavement strength. High-performance pervious concrete can withstand the repeated rolling and braking impact of buses while effectively eliminating surface water ponding on platforms.
(3)
Internal roads in logistics parks and warehousing areas: Internal roads are frequently subjected to heavy traffic from industrial vehicles (e.g., forklifts, light trucks) and localized high-pressure loads from stacked goods. High-performance pervious concrete ensures long-term stability under industrial operating conditions while managing site stormwater runoff.
(4)
Ground paving for electric vehicle (EV) charging stations: In areas requiring installation of charging pile foundations and enduring the static/dynamic loads from EV parking and charging, high-performance pervious concrete provides robust foundational support and enables the rapid drainage of rainwater, eliminating safety hazards associated with water accumulation in charging zones.
While this study has achieved the aforementioned conclusions, further investigations can be conducted in the following aspects:
(1)
Future research should prioritize quantifying, based on this study, the freeze–thaw resistance and long-term durability of high-performance pervious concrete to establish foundational data for expanded applications [85,86].
(2)
Molecular dynamics simulations should be employed to investigate the interfacial molecular interactions between nano-silica (NS), carbon fiber (CF), and other hydration products within the cement matrix. This approach would provide deeper insights into the influence of these materials at the molecular level on the performance of high-performance pervious concrete [87].
(3)
Low-carbon concrete materials are currently an urgent requirement for achieving sustainable human development. Based on this study, further researchers should focus on developing high-performance pervious concrete utilizing low-carbon cementitious materials, such as limestone calcined clay cement (LC3) and hybrid alkaline cement incorporating carbon sequestration technologies [88,89], while conducting comprehensive life cycle assessments (LCAs) to evaluate their environmental impacts [90,91].

Author Contributions

Conceptualization, L.M.; methodology, M.S. (Mingxuan Sun); software, M.S. (Mingxuan Sun); validation, M.S. (Meng Sun); investigation, M.S. (Mingxuan Sun); resources, M.S. (Meng Sun); data curation, M.S. (Mingxuan Sun); writing—original draft preparation, M.S. (Mingxuan Sun), M.S. (Meng Sun); writing—review and editing, Y.Z.; supervision, L.M.; project administration, L.M.; funding acquisition, L.M. All authors have read and agreed to the published version of the manuscript.

Funding

This research was funded by the Science Technology Department Program of Jilin Province (Grant Nos. 20230203036SF, 20220203048SF, 20220203056SF, and 20230203068SF).

Data Availability Statement

Data are contained within the article.

Acknowledgments

The authors would like to thank the technicians from all the institutions involved in this work, who contributed to achieving this study’s objectives.

Conflicts of Interest

Author Mingxuan Sun was employed by the company CCCC Guangzhou Water Transport Engineering Design & Research Institute Co., Ltd. The remaining authors declare that the research was conducted in the absence of any commercial or financial relationships that could be construed as a potential conflict of interest.

Abbreviations

The following abbreviations are used in this manuscript:
W/CWater-to-cement ratio
NSNano-silica
CFCarbon fiber
PCPervious concrete
FAFly ash
RSMResponse surface methodology

References

  1. Yang, J.; Jiang, G. Experimental study on properties of pervious concrete pavement materials. Cem. Concr. Res. 2003, 33, 381–386. [Google Scholar]
  2. Chandrappa, A.K.; Biligiri, K.P. Pervious concrete as a sustainable pavement material–Research findings and future prospects: A state-of-the-art review. Constr. Build. Mater. 2016, 111, 262–274. [Google Scholar]
  3. ACI 522R-10; Report on Pervious Concrete. American Concrete Institute: Farmington Hills, MI, USA, 2010.
  4. Deo, O.; Neithalath, N. Compressive behavior of pervious concretes and a quantification of the influence of random pore structure features. Mater. Sci. Eng. A 2010, 528, 402–412. [Google Scholar]
  5. McCain, G.N.; Dewoolkar, M.M. Porous concrete pavements: Mechanical and hydraulic properties. Transp. Res. Rec. 2010, 2164, 66–75. [Google Scholar]
  6. Adresi, M.; Yamani, A.; Tabarestani, M.K.; Rooholamini, H. A comprehensive review on pervious concrete. Constr. Build. Mater. 2023, 407, 133308. [Google Scholar]
  7. Chiriac, R.; Kiss, Z. Fiber reinforced polymers in pervious concrete-a state of the art review. In Proceedings of the IOP Conference Series: Materials Science and Engineering, Saint-Raphaël, France, 7–11 October 2024; p. 012025. [Google Scholar]
  8. Sathiparan, N.; Dassanayake, D.; Subramaniam, D. Utilization of supplementary cementitious materials in pervious concrete: A review. Int. J. Environ. Sci. Technol. 2024, 21, 5883–5918. [Google Scholar]
  9. Li, J.; Xia, J.; Di Sarno, L.; Gong, G. Fiber utilization in pervious concrete: Review on manufacture and properties. Constr. Build. Mater. 2023, 406, 133372. [Google Scholar]
  10. López-Carrasquillo, V.; Hwang, S. Comparative assessment of pervious concrete mixtures containing fly ash and nanomaterials for compressive strength, physical durability, permeability, water quality performance and production cost. Constr. Build. Mater. 2017, 139, 148–158. [Google Scholar]
  11. Vieira, G.L.; Schiavon, J.Z.; Borges, P.M.; da Silva, S.R.; de Oliveira Andrade, J.J. Influence of recycled aggregate replacement and fly ash content in performance of pervious concrete mixtures. J. Clean. Prod. 2020, 271, 122665. [Google Scholar]
  12. Liu, H.; Luo, G.; Wang, L.; Wang, W.; Li, W.; Gong, Y. Laboratory evaluation of eco-friendly pervious concrete pavement material containing silica fume. Appl. Sci. 2019, 9, 73. [Google Scholar]
  13. Song, H.W.; Pack, S.W.; Nam, S.H.; Jang, J.C.; Saraswathy, V. Estimation of the permeability of silica fume cement concrete. Constr. Build. Mater. 2010, 24, 315–321. [Google Scholar]
  14. Amala, M.; Meenachi, A.; Gopalan, A.; Nanduri, P.R.K.; Ramesh, K. An experimental investigation of M30 grade self compacting concrete using mineral admixtures. Mater. Today Proc. 2023. [Google Scholar] [CrossRef]
  15. Amala, M.; Umarani, C. Experimental investigation on mechanical and microstructural properties of self-compacting geopolymer concrete with different mineral admixtures. Mater. Res. Express 2024, 11, 095305. [Google Scholar]
  16. Saboo, N.; Shivhare, S.; Kori, K.K.; Chandrappa, A.K. Effect of fly ash and metakaolin on pervious concrete properties. Constr. Build. Mater. 2019, 223, 322–328. [Google Scholar]
  17. Chen, Y.; Wang, K.; Wang, X.; Zhou, W. Strength, fracture and fatigue of pervious concrete. Constr. Build. Mater. 2013, 42, 97–104. [Google Scholar]
  18. Zhang, B.; Tan, H.; Shen, W.; Xu, G.; Ma, B.; Ji, X. Nano-silica and silica fume modified cement mortar used as Surface Protection Material to enhance the impermeability. Cem. Concr. Compos. 2018, 92, 7–17. [Google Scholar]
  19. Ahmed, M.A.; Hassanean, Y.A.; Assaf, K.A.; Shawkey, M.A. The Effect of Incorporation of Ferrite Nano-particles on Compressive Strength and Re-sistivity of Self-Compacting Concrete. Open J. Civ. Eng. 2015, 5, 131. [Google Scholar]
  20. Qing, Y.; Zenan, Z.; Deyu, K.; Rongshen, C. Influence of nano-SiO2 addition on properties of hardened cement paste as compared with silica fume. Constr. Build. Mater. 2007, 21, 539–545. [Google Scholar]
  21. Singh, L.P.; Karade, S.R.; Bhattacharyya, S.K.; Yousuf, M.M.; Ahalawat, S. Beneficial role of nanosilica in cement based materials—A review. Constr. Build. Mater. 2013, 47, 1069–1077. [Google Scholar]
  22. Ramadhansyah, P.J.; Mohd Ibrahim, M.Y.; Mohd Rosli, H.; Warid, M.N.; Wan Ibrahim, M.H. Porous concrete pavement containing nano-silica: Pre-review. Adv. Mater. Res. 2014, 911, 454–458. [Google Scholar]
  23. Wang, Y.; Hughes, P.; Niu, H.; Fan, Y. A new method to improve the properties of recycled aggregate concrete: Composite addition of basalt fiber and nano-silica. J. Clean. Prod. 2019, 236, 117602. [Google Scholar]
  24. Jalal, M.; Mansouri, E.; Sharifipour, M.; Pouladkhan, A.R. Mechanical, rheological, durability and microstructural properties of high performance self-compacting concrete containing SiO2 micro and nanoparticles. Mater. Des. 2012, 34, 389–400. [Google Scholar]
  25. Said, A.M.; Zeidan, M.S.; Bassuoni, M.T.; Tian, Y. Properties of concrete incorporating nano-silica. Constr. Build. Mater. 2012, 36, 838–844. [Google Scholar]
  26. Ren, J.; Lai, Y.; Gao, J. Exploring the influence of SiO2 and TiO2 nanoparticles on the mechanical properties of concrete. Constr. Build. Mater. 2018, 175, 277–285. [Google Scholar]
  27. Ji, T. Preliminary study on the water permeability and microstructure of concrete incorporating nano-SiO2. Cem. Concr. Res. 2005, 35, 1943–1947. [Google Scholar]
  28. Mohammed, B.S.; Adamu, M. Mechanical performance of roller compacted concrete pavement containing crumb rubber and nano silica. Constr. Build. Mater. 2018, 159, 234–251. [Google Scholar]
  29. Shirgir, B.; Hassani, A.; Khodadadi, A. Experimental study on permeability and mechanical properties of nanomodified porous concrete. Transp. Res. Rec. 2011, 2240, 30–35. [Google Scholar]
  30. Valderrama, R.; Santos, D.; Eyzaguirre, C. Influence of nanosilica and polypropylene fibers on the permeability, compressive and flexural strength of pervious concrete. In Proceedings of the E3S Web of Conferences, Les Mureaux, France, 21–22 November 2024; p. 04001. [Google Scholar]
  31. Alimohammadi, V.; Maghfouri, M.; Nourmohammadi, D.; Azarsa, P.; Gupta, R.; Saberian, M. Stormwater runoff treatment using pervious concrete modified with various nanomaterials: A comprehensive review. Sustainability 2021, 13, 8552. [Google Scholar] [CrossRef]
  32. Seifeddine, K.; Amziane, S.; Toussaint, E. State of the art on the mechanical properties of pervious concrete. Eur. J. Environ. Civ. Eng. 2022, 26, 7727–7755. [Google Scholar]
  33. Ma, L.; Sun, M.; Zhang, Y. The Mechanical and Self-Sensing Properties of Carbon Fiber-and Polypropylene Fiber-Reinforced Engineered Cementitious Composites Utilizing Environmentally Friendly Glass Aggregate. Buildings 2024, 14, 938. [Google Scholar]
  34. Hesami, S.; Ahmadi, S.; Nematzadeh, M. Effects of rice husk ash and fiber on mechanical properties of pervious concrete pavement. Constr. Build. Mater. 2014, 53, 680–691. [Google Scholar]
  35. Jiang, Z.W.; Sun, Z.P.; Wang, P.M. Effects of some factors on properties of porous pervious concrete. J. Build. Mater. 2005, 8, 513–519. [Google Scholar]
  36. Huang, B.; Wu, H.; Shu, X.; Burdette, E.G. Laboratory evaluation of permeability and strength of polymer-modified pervious concrete. Constr. Build. Mater. 2010, 24, 818–823. [Google Scholar]
  37. Wu, H.; Huang, B.; Shu, X.; Dong, Q. Laboratory evaluation of abrasion resistance of portland cement pervious concrete. J. Mater. Civ. Eng. 2011, 23, 697–702. [Google Scholar]
  38. Shah, A.A.; Ribakov, Y. Recent trends in steel fibered high-strength concrete. Mater. Des. 2011, 32, 4122–4151. [Google Scholar]
  39. Zheng, Y.; Lv, X.; Hu, S.; Zhuo, J.; Wan, C.; Liu, J. Mechanical properties and durability of steel fiber reinforced concrete: A review. J. Build. Eng. 2024, 82, 108025. [Google Scholar]
  40. Lee, M.-G.; Wang, W.-C.; Wang, Y.-C.; Hsieh, Y.-C.; Lin, Y.-C. Mechanical properties of high-strength pervious concrete with steel fiber or glass fiber. Buildings 2022, 12, 620. [Google Scholar] [CrossRef]
  41. Rodin, I.I.I.H.; Rangelov, M.; Nassiri, S.; Englund, K. Enhancing mechanical properties of pervious concrete using carbon fiber composite reinforcement. J. Mater. Civ. Eng. 2018, 30, 04018012. [Google Scholar]
  42. Rangelov, M.; Nassiri, S.; Haselbach, L.; Englund, K. Using carbon fiber composites for reinforcing pervious concrete. Constr. Build. Mater. 2016, 126, 875–885. [Google Scholar]
  43. Lang, L.; Duan, H.; Chen, B. Properties of pervious concrete made from steel slag and magnesium phosphate cement. Constr. Build. Mater. 2019, 209, 95–104. [Google Scholar]
  44. Li, J.; Zhang, Y.; Liu, G.; Peng, X. Preparation and performance evaluation of an innovative pervious concrete pavement. Constr. Build. Mater. 2017, 138, 479–485. [Google Scholar]
  45. Fei, M.; Luo, C.; Zheng, X.; Fu, T.; Ling, K.; Chen, H.; Liu, W.; Qiu, R. High-performance pervious concrete using cost-effective modified vinyl ester as binder. Constr. Build. Mater. 2024, 414, 134908. [Google Scholar]
  46. Shen, P.; Lu, J.X.; Zheng, H.; Liu, S.; Poon, C.S. Conceptual design and performance evaluation of high strength pervious concrete. Constr. Build. Mater. 2021, 269, 121342. [Google Scholar]
  47. Lian, C.; Zhuge, Y. Optimum mix design of enhanced permeable concrete–an experimental investigation. Constr. Build. Mater. 2010, 24, 2664–2671. [Google Scholar]
  48. Bonicelli, A.; Giustozzi, F.; Crispino, M. Experimental study on the effects of fine sand addition on differentially compacted pervious concrete. Constr. Build. Mater. 2015, 91, 102–110. [Google Scholar]
  49. GB 175-2020; Portland Cement. General Administration of Quality Supervision, Inspection and Quarantine of the People’s Republic of China: Beijing, China, 2020. (In Chinese)
  50. Khankhaje, E.; Kim, T.; Jang, H.; Kim, C.-S.; Kim, J.; Rafieizonooz, M. Properties of pervious concrete incorporating fly ash as partial replacement of cement: A review. Dev. Built Environ. 2023, 14, 100130. [Google Scholar]
  51. Jo, B.W.; Kim, C.H.; Tae, G.H.; Park, J.B. Characteristics of cement mortar with nano-SiO2 particles. Constr. Build. Mater. 2007, 21, 1351–1355. [Google Scholar]
  52. Singh, L.P.; Bhattacharyya, S.K.; Mishra, G.; Ahalawat, S. Reduction of calcium leaching in cement hydration process using nanomaterials. Mater. Technol. 2012, 27, 233–238. [Google Scholar]
  53. Kontoleontos, F.; Tsakiridis, P.E.; Marinos, A.; Kaloidas, V.; Katsioti, M. Influence of colloidal nanosilica on ultrafine cement hydration: Physicochemical and microstructural characterization. Constr. Build. Mater. 2012, 35, 347–360. [Google Scholar]
  54. Singh, L.P.; Bhattacharyya, S.K.; Ahalawat, S. Preparation of size controlled silica nano particles and its functional role in cementitious system. J. Adv. Concr. Technol. 2012, 10, 345–352. [Google Scholar]
  55. Rahul, R.; Kumar, M.S.R. Influence of nano-silica and shredded plastics in pervious concrete. Matéria 2024, 29, e20240127. [Google Scholar]
  56. Wang, J.; Yang, Y.; Chu, J.; Mo, K.H.; Yap, P.S. Recent developments in utilization of nano silica in self-compacting concrete: A review. Struct. Concr. 2023, 24, 7524–7548. [Google Scholar]
  57. Nie, L.; Li, X.; Li, J.; Zhu, B.; Lin, Q. Analysis of high performance concrete mixed with nano-silica in front of sulfate attack. Materials 2022, 15, 7614. [Google Scholar] [CrossRef] [PubMed]
  58. Chithra, S.; Kumar, S.S.; Chinnaraju, K. The effect of Colloidal Nano-silica on workability, mechanical and durability properties of High Performance Concrete with Copper slag as partial fine aggregate. Constr. Build. Mater. 2016, 113, 794–804. [Google Scholar]
  59. Chen, P.W.; Chung, D.D. Concrete reinforced with up to 0.2 vol% of short carbon fibres. Composites 1993, 24, 33–52. [Google Scholar]
  60. Segura, I.; Faneca, G.; Torrents, J.; Aguado, A. Self-sensing concrete made from recycled carbon fibres. Smart Mater. Struct. 2019, 28, 105045. [Google Scholar]
  61. Nguyen, H.; Carvelli, V.; Fujii, T.; Okubo, K. Cement mortar reinforced with reclaimed carbon fibres, CFRP waste or prepreg carbon waste. Constr. Build. Mater. 2016, 126, 321–331. [Google Scholar]
  62. More, F.M.D.S.; Subramanian, S.S. Impact of fibres on the mechanical and durable behaviour of fibre-reinforced concrete. Buildings 2022, 12, 1436. [Google Scholar] [CrossRef]
  63. Box, G.E.; Wilson, K.B. On the experimental attainment of optimum conditions. Breakthr. Stat. Methodol. Distrib. 1992, 270–310. [Google Scholar] [CrossRef]
  64. Sonebi, M.; Bassuoni, M.T. Investigating the effect of mixture design parameters on pervious concrete by statistical modelling. Constr. Build. Mater. 2013, 38, 147–154. [Google Scholar]
  65. Mohammed, B.S.; Achara, B.E.; Nuruddin, M.F.; Yaw, M.; Zulkefli, M.Z. Properties of nano-silica-modified self-compacting engineered cementitious composites. J. Clean. Prod. 2017, 162, 1225–1238. [Google Scholar]
  66. Ferdosian, I.; Camões, A. Eco-efficient ultra-high performance concrete development by means of response surface methodology. Cem. Concr. Compos. 2017, 84, 146–156. [Google Scholar]
  67. Ministry of Housing and Urban-Rural Construction of the People’s Republic of China. Technical Specification for Pervious Cement Concrete Pavement; China Architecture & Building Press: Beijing, China, 2009. (In Chinese) [Google Scholar]
  68. Ministry of Housing and Urban-Rural Construction of the People’s Republic of China. Standard for Test Method of Mechanical Properties on Ordinary Concrete; China Architecture & Building Press: Beijing, China, 2002. (In Chinese) [Google Scholar]
  69. Zhang, M.H.; Li, H. Pore structure and chloride permeability of concrete containing nano-particles for pavement. Constr. Build. Mater. 2011, 25, 608–616. [Google Scholar]
  70. Singh, A.; Sampath, P.V.; Biligiri, K.P. A review of sustainable pervious concrete systems: Emphasis on clogging, material characterization, and environmental aspects. Constr. Build. Mater. 2020, 261, 120491. [Google Scholar]
  71. Zhong, R.; Leng, Z.; Poon, C.S. Research and application of pervious concrete as a sustainable pavement material: A state-of-the-art and state-of-the-practice review. Constr. Build. Mater. 2018, 183, 544–553. [Google Scholar]
  72. Land, G.; Stephan, D. The influence of nano-silica on the hydration of ordinary Portland cement. J. Mater. Sci. 2012, 47, 1011–1017. [Google Scholar]
  73. Madani, H.; Bagheri, A.; Parhizkar, T. The pozzolanic reactivity of monodispersed nanosilica hydrosols and their influence on the hydration characteristics of Portland cement. Cem. Concr. Res. 2012, 42, 1563–1570. [Google Scholar]
  74. Mohammed, B.S.; Adamu, M. Non-destructive evaluation of nano silica-modified roller-compacted rubbercrete using combined SonReb and response surface methodology. Road Mater. Pavement Des. 2019, 20, 815–835. [Google Scholar]
  75. Afroughsabet, V.; Biolzi, L.; Ozbakkaloglu, T. High-performance fiber-reinforced concrete: A review. J. Mater. Sci. 2016, 51, 6517–6551. [Google Scholar]
  76. Hu, Y.; Wang, Z.; Chen, Z.; Wang, C.; Ding, S.; Nie, Z.; Hou, T.; Zhao, G. The Improving Role of Basalt Fiber on the Sulfate–Chloride Multiple Induced Degradation of Cast-In-Situ Concrete. Materials 2024, 17, 4454. [Google Scholar]
  77. Rehder, B.; Banh, K.; Neithalath, N. Fracture behavior of pervious concretes: The effects of pore structure and fibers. Eng. Fract. Mech. 2014, 118, 1–6. [Google Scholar]
  78. Meddah, M.S.; Bencheikh, M. Properties of concrete reinforced with different kinds of industrial waste fibre materials. Constr. Build. Mater. 2009, 23, 3196–3205. [Google Scholar]
  79. Xiong, C.; Li, Q.; Lan, T.; Li, H.; Long, W.; Xing, F. Sustainable use of recycled carbon fiber reinforced polymer and crumb rubber in concrete: Mechanical properties and ecological evaluation. J. Clean. Prod. 2021, 279, 123624. [Google Scholar]
  80. Romualdi, J.P.; Mandel, J.A. Tensile strength of concrete affected by uniformly distributed and closely spaced short lengths of wire reinforcement. J. Proc. 1964, 61, 657–672. [Google Scholar]
  81. Landis, C.M.; McMeeking, R.M. Stress concentrations in composites with interface sliding, matrix stiffness and uneven fiber spacing using shear lag theory. Int. J. Solids Struct. 1999, 36, 4333–4361. [Google Scholar]
  82. Pan, N. Theoretical determination of the optimal fiber volume fraction and fiber-matrix property compatibility of short fiber composites. Polym. Compos. 1993, 14, 85–93. [Google Scholar]
  83. Ali, A.H.; Mohamed, H.M.; Benmokrane, B.; ElSafty, A. Theory-based approaches and microstructural analysis to evaluate the service life-retention of stressed carbon fiber composite strands for concrete bridge applications. Compos. Part B Eng. 2019, 165, 279–292. [Google Scholar]
  84. Liu, W.; Chen, P. Theoretical analysis and experimental investigation of the occurrence of fiber bridging in unidirectional laminates under Mode I loading. Compos. Struct. 2021, 257, 113383. [Google Scholar]
  85. Xie, N.; Akin, M.; Shi, X. Permeable concrete pavements: A review of environmental benefits and durability. J. Clean. Prod. 2019, 210, 1605–1621. [Google Scholar]
  86. Wu, H.; Liu, Z.; Sun, B.; Yin, J. Experimental investigation on freeze–thaw durability of Portland cement pervious concrete (PCPC). Constr. Build. Mater. 2016, 117, 63–71. [Google Scholar]
  87. Liu, M.; Dai, W.; Li, M.; Jin, W.; Yang, X.; Han, Y.; Huang, M. Mechanism of interface performance enhancement of nano-SiO2 modified polyvinyl alcohol fiber reinforced geopolymer concrete: Experiments, microscopic characterization, and molecular simulation. J. Build. Eng. 2024, 98, 111062. [Google Scholar]
  88. Wang, Y.-S.; Meng, L.-Y.; Chen, L.; Wang, X.-Y. An innovative strategy for CO2 conversion and utilization: Semi-wet carbonation pretreatment of wollastonite to prepare carbon-fixing products and produce LC3. Cem. Concr. Compos. 2025, 160, 106050. [Google Scholar]
  89. Wang, Y.-S.; Lin, R.; Wang, X.-Y. Insights on solid CO2 mixing method for hybrid alkaline cement (HAC): Performance, sustainability, and experimental system improvement. Cem. Concr. Compos. 2025, 161, 106096. [Google Scholar]
  90. Liu, J.; Li, H.; Wang, Y.; Zhang, H. Integrated life cycle assessment of permeable pavement: Model development and case study. Transp. Res. Part D Transp. Environ. 2020, 85, 102381. [Google Scholar]
  91. Chen, X.; Wang, H. Life-cycle assessment and multi-criteria performance evaluation of pervious concrete pavement with fly ash. Resour. Conserv. Recycl. 2022, 177, 105969. [Google Scholar]
Figure 1. NS.
Figure 1. NS.
Buildings 15 02407 g001
Figure 2. CF.
Figure 2. CF.
Buildings 15 02407 g002
Figure 3. Vertical forced mixer.
Buildings 15 02407 g003
Figure 4. Freshly mixed pervious concrete.
Buildings 15 02407 g004
Figure 5. Permeability coefficient test.
Buildings 15 02407 g005
Figure 6. Compressive strength test.
Buildings 15 02407 g006
Figure 7. Flexural strength test.
Buildings 15 02407 g007
Figure 8. Perturbation plot for permeability coefficient.
Buildings 15 02407 g008
Figure 9. Boxplot of the influence of three factors on permeability coefficient.
Buildings 15 02407 g009
Figure 10. Influence of three factors on permeability coefficient.
Buildings 15 02407 g010
Figure 11. Perturbation plot for compressive strength.
Buildings 15 02407 g011
Figure 12. Influence of three factors on compressive strength.
Buildings 15 02407 g012aBuildings 15 02407 g012b
Figure 13. Perturbation plot for flexural strength.
Buildings 15 02407 g013
Figure 14. Influence of three factors on flexural strength.
Buildings 15 02407 g014aBuildings 15 02407 g014b
Figure 15. Overlapping contour plots of Optimization Group A.
Buildings 15 02407 g015
Figure 16. Overlapping contour plots of Optimization Group B.
Buildings 15 02407 g016
Figure 17. Error bar charts of the experiments and predictions.
Buildings 15 02407 g017
Figure 18. Microscopic image of pervious concrete.
Buildings 15 02407 g018aBuildings 15 02407 g018b
Table 1. Physical and chemical properties of cement.
PropertiesStandard Value [49]Actual Value
Physical propertiesSpecific surface area (m2/kg)≥300329
Initial set (min)≥45192
Final set (min)≤600240
Chemical propertiesLoss on ignition (%)≤5.03.64
MgO (%)≤5.01.01
CaO (%)≥66.066.54
SiO2 (%)≥20.021.03
Al2O3 (%)≥4.04.36
Fe2O3 (%)≥2.02.32
CaSO4·2H2O (%)≥2.02.14
SO3 (%)≤3.52.16
Cl (%)≤0.060.021
Table 2. Physicochemical properties of FA.
IndexFineness
(%)
Water Demand Ratio (%)Loss on
Ignition (%)
Moisture
Content
(%)
SO3
(%)
CaO3
(%)
Stability (Reye Method) (mm)Intensity
Activity Index (%)
Value14.2990.770.110.10.68374
Table 3. Physicochemical properties of NS.
IndexSiO2 (%)Fe (%)Mn (%)Pb (%)Specific
Surface Area (m2/g)
Mean Grain Size (nm)Bulk Density (g/cm3)
Value99.10.010.0020.00001202220.15
Table 4. Physicochemical properties of CF.
IndexTensile Strength
(MPa)
Tensile
Modulus
(GPa)
Density
(g/cm3)
Diameter
(μm)
Length
(mm)
Carbon Content
(%)
Value35002281.7576>95
Table 5. Levels of factors of RSM.
FactorCodeLevels of Code
−101
W/CA0.260.280.3
CF (%)B11.52
NS (%)C123
Table 6. The mix proportions of PC.
GroupW/CCFNSContent (kg/m3)
(%)(%)CementFly ashNSCASandCFWaterSP
10.2611394.2744.34.431553108.72.501132.2
20.311394.2744.34.431553108.72.50130.72.2
30.2621394.2744.34.431553108.74.991132.2
40.321394.2744.34.431553108.74.99130.72.2
50.2613385.4144.313.291553108.72.501132.2
60.313385.4144.313.291553108.72.50130.72.2
70.2623385.4144.313.291553108.74.991132.2
80.323385.4144.313.291553108.74.99130.72.2
90.261.52389.8444.38.861553108.73.741132.2
100.31.52389.8444.38.861553108.73.74130.72.2
110.2812389.8444.38.861553108.72.50121.82.2
120.2822389.8444.38.861553108.74.99121.82.2
130.281.51394.2744.34.431553108.73.74121.82.2
140.281.53385.4144.313.291553108.73.74121.82.2
15-190.281.52389.8444.38.861553108.73.74121.82.2
Table 7. CCD experimental design and results.
Test NumberDesign of TestsPermeability CoefficientCompressive StrengthFlexural Strength
ABCmm/sMPa
1−1−105.9736.43.64
21−104.3233.74.02
3−1105.5236.53.84
41103.7434.44.64
5−1−115.2437.23.77
61−114.0234.84.53
7−1115.0137.43.42
81113.4535.14.82
9−1005.1141.73.96
101004.0642.65.01
110−104.7244.75.39
120104.3845.35.48
1300−14.9741.65.42
140014.4441.35.57
150004.5445.65.64
160004.6344.35.73
170004.4944.95.69
180004.7245.25.70
190004.5743.55.79
Table 8. Regression equation of responses.
ResponseRegression Equation
Permeability coefficientR1 = −9.32 + 160.81 A − 0.43 B − 2.30 C + 4.06 A × C − 371.13 A2 + 0.23 C2
Compressive strengthR2 = − 791.06 + 5866.58 A + 0.38 B + 20.00 C − 10552.82 A2 − 4.92 C2
Flexural strengthR3 = − 228.93 + 1658.06 A − 0.20 B − 0.60 C + 13.25 A × B + 6.13 A × C − 0.22 B × C − 2978.99 A2 − 0.97B2 − 0.18C2
Table 9. ANOVA and regression models statistics.
ResponseSourceSum of SquaresDegrees of
Freedom
Mean SquareF-valuep-Value
Permeability
coefficient
R2 0.9845
Adjusted R2 0.9767
Predicted R2
0.9534
Model7.3061.22126.94<0.0001
A-W/C6.0515.27631.20<0.0001
B-CF0.470910.470949.110.0001
C-NS0.557010.557058.08<0.0001
AC0.052810.05285.510.0369
A20.069510.06957.250.0196
C20.169210.169217.640.0012
Residual0.1151120.0096
Lack of Fit0.083780.01051.330.4153
Pure Error0.031440.0078
Compressive strengthModel321.60564.3253.88<0.0001
A-W/C7.4017.406.200.0271
B-CF0.361010.36100.30240.5917
R2 0.9540C-NS1.0211.020.85790.3712
Adjusted R2A256.23156.2347.10<0.0001
0.9363C276.42176.4264.02<0.0001
Predicted R2Residual15.52131.191.420.3874
0.8868Lack of Fit12.8291.422.110.2457
Pure Error2.7040.6750
Flexural Model12.5591.39278.30<0.0001
strengthA-W/C1.9311.93384.76<0.0001
B-CF0.072210.072214.420.0042
R2 0.9964C-NS0.030210.03026.040.0363
Adjusted R2AB0.140510.140528.040.0005
0.9928
Predicted R2
0.9717
AC0.120110.120123.970.0009
BC0.096810.096819.330.0017
A23.8813.88774.57<0.0001
B20.159510.159531.840.0003
C20.090110.090117.990.0022
Residual0.045190.0050
Lack of Fit0.032950.00662.160.2383
Pure Error0.012240.0030
Table 10. Prediction and desirability of the optimum mix designs.
Mix DesignPermeability
(mm/s)
Compressive Strength
(MPa)
Flexural Strength (MPa)Desirability
W/CCF (%)NS (%)PredictionPredictionPrediction
A0.2631.2081.3595.540.444.290.928
B0.2791.9631.934.468455.50.981
C0.2841.5972.1624.31144.85.80.984
Table 11. Results of validation group.
AB
PredictionActualErrorPredictionActualError
Permeability coefficient (mm/s)5.55.25.5%4.4684.75.20%
Compressive strength (MPa)40.44423.8%45426.67%
Flexural strength (MPa)4.294.42.56%5.55.25.46%
Disclaimer/Publisher’s Note: The statements, opinions and data contained in all publications are solely those of the individual author(s) and contributor(s) and not of MDPI and/or the editor(s). MDPI and/or the editor(s) disclaim responsibility for any injury to people or property resulting from any ideas, methods, instructions or products referred to in the content.

