
New Bound and Hybrid Composite Insulation Materials from Waste Wheat Straw Fibers and Discarded Tea Bags

 ,
,  ,
,
Abstract
1. Introduction
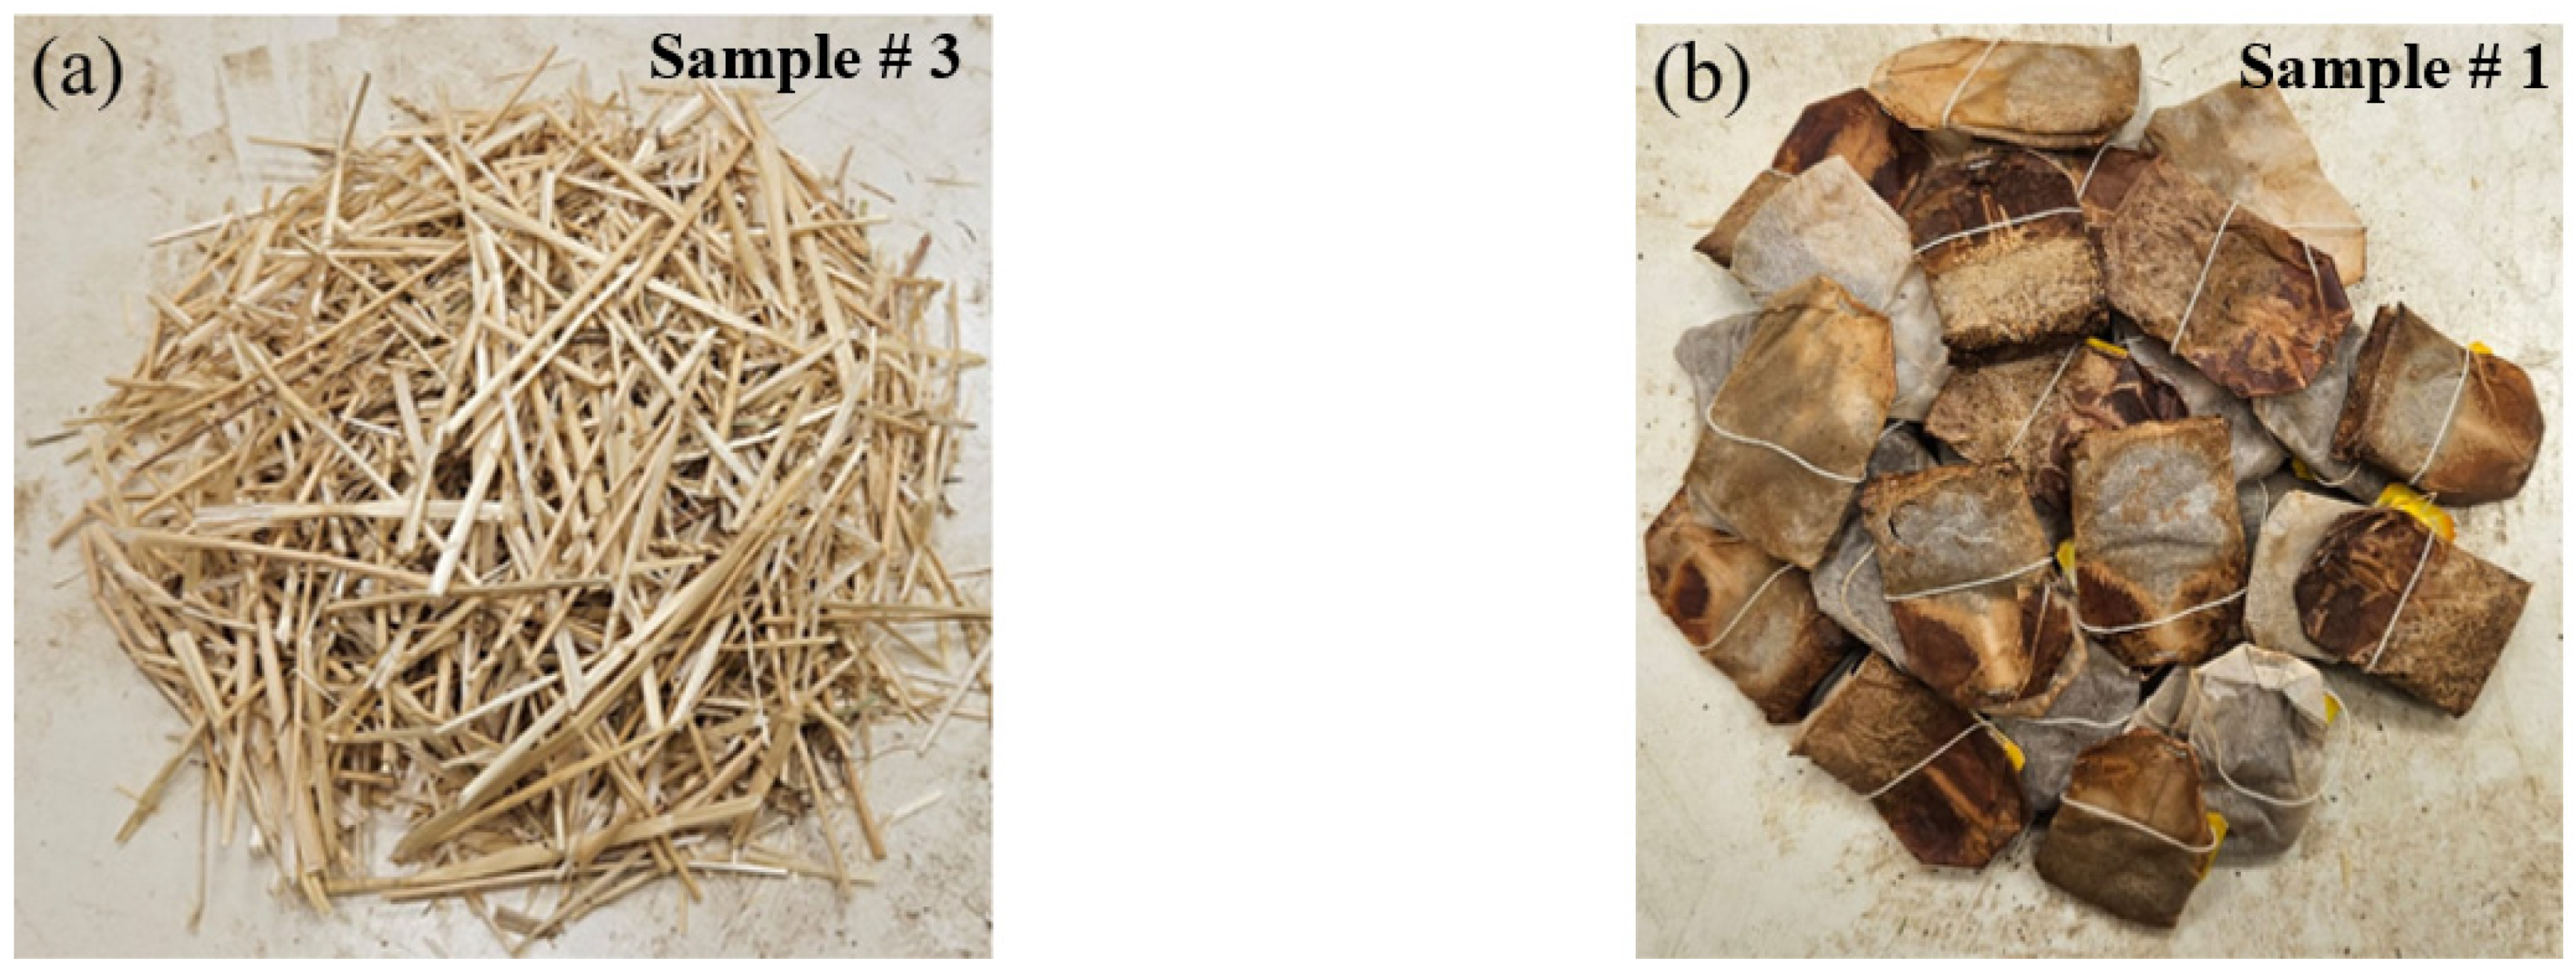
2. Materials
3. Method
4. Test Analyses and Characterization
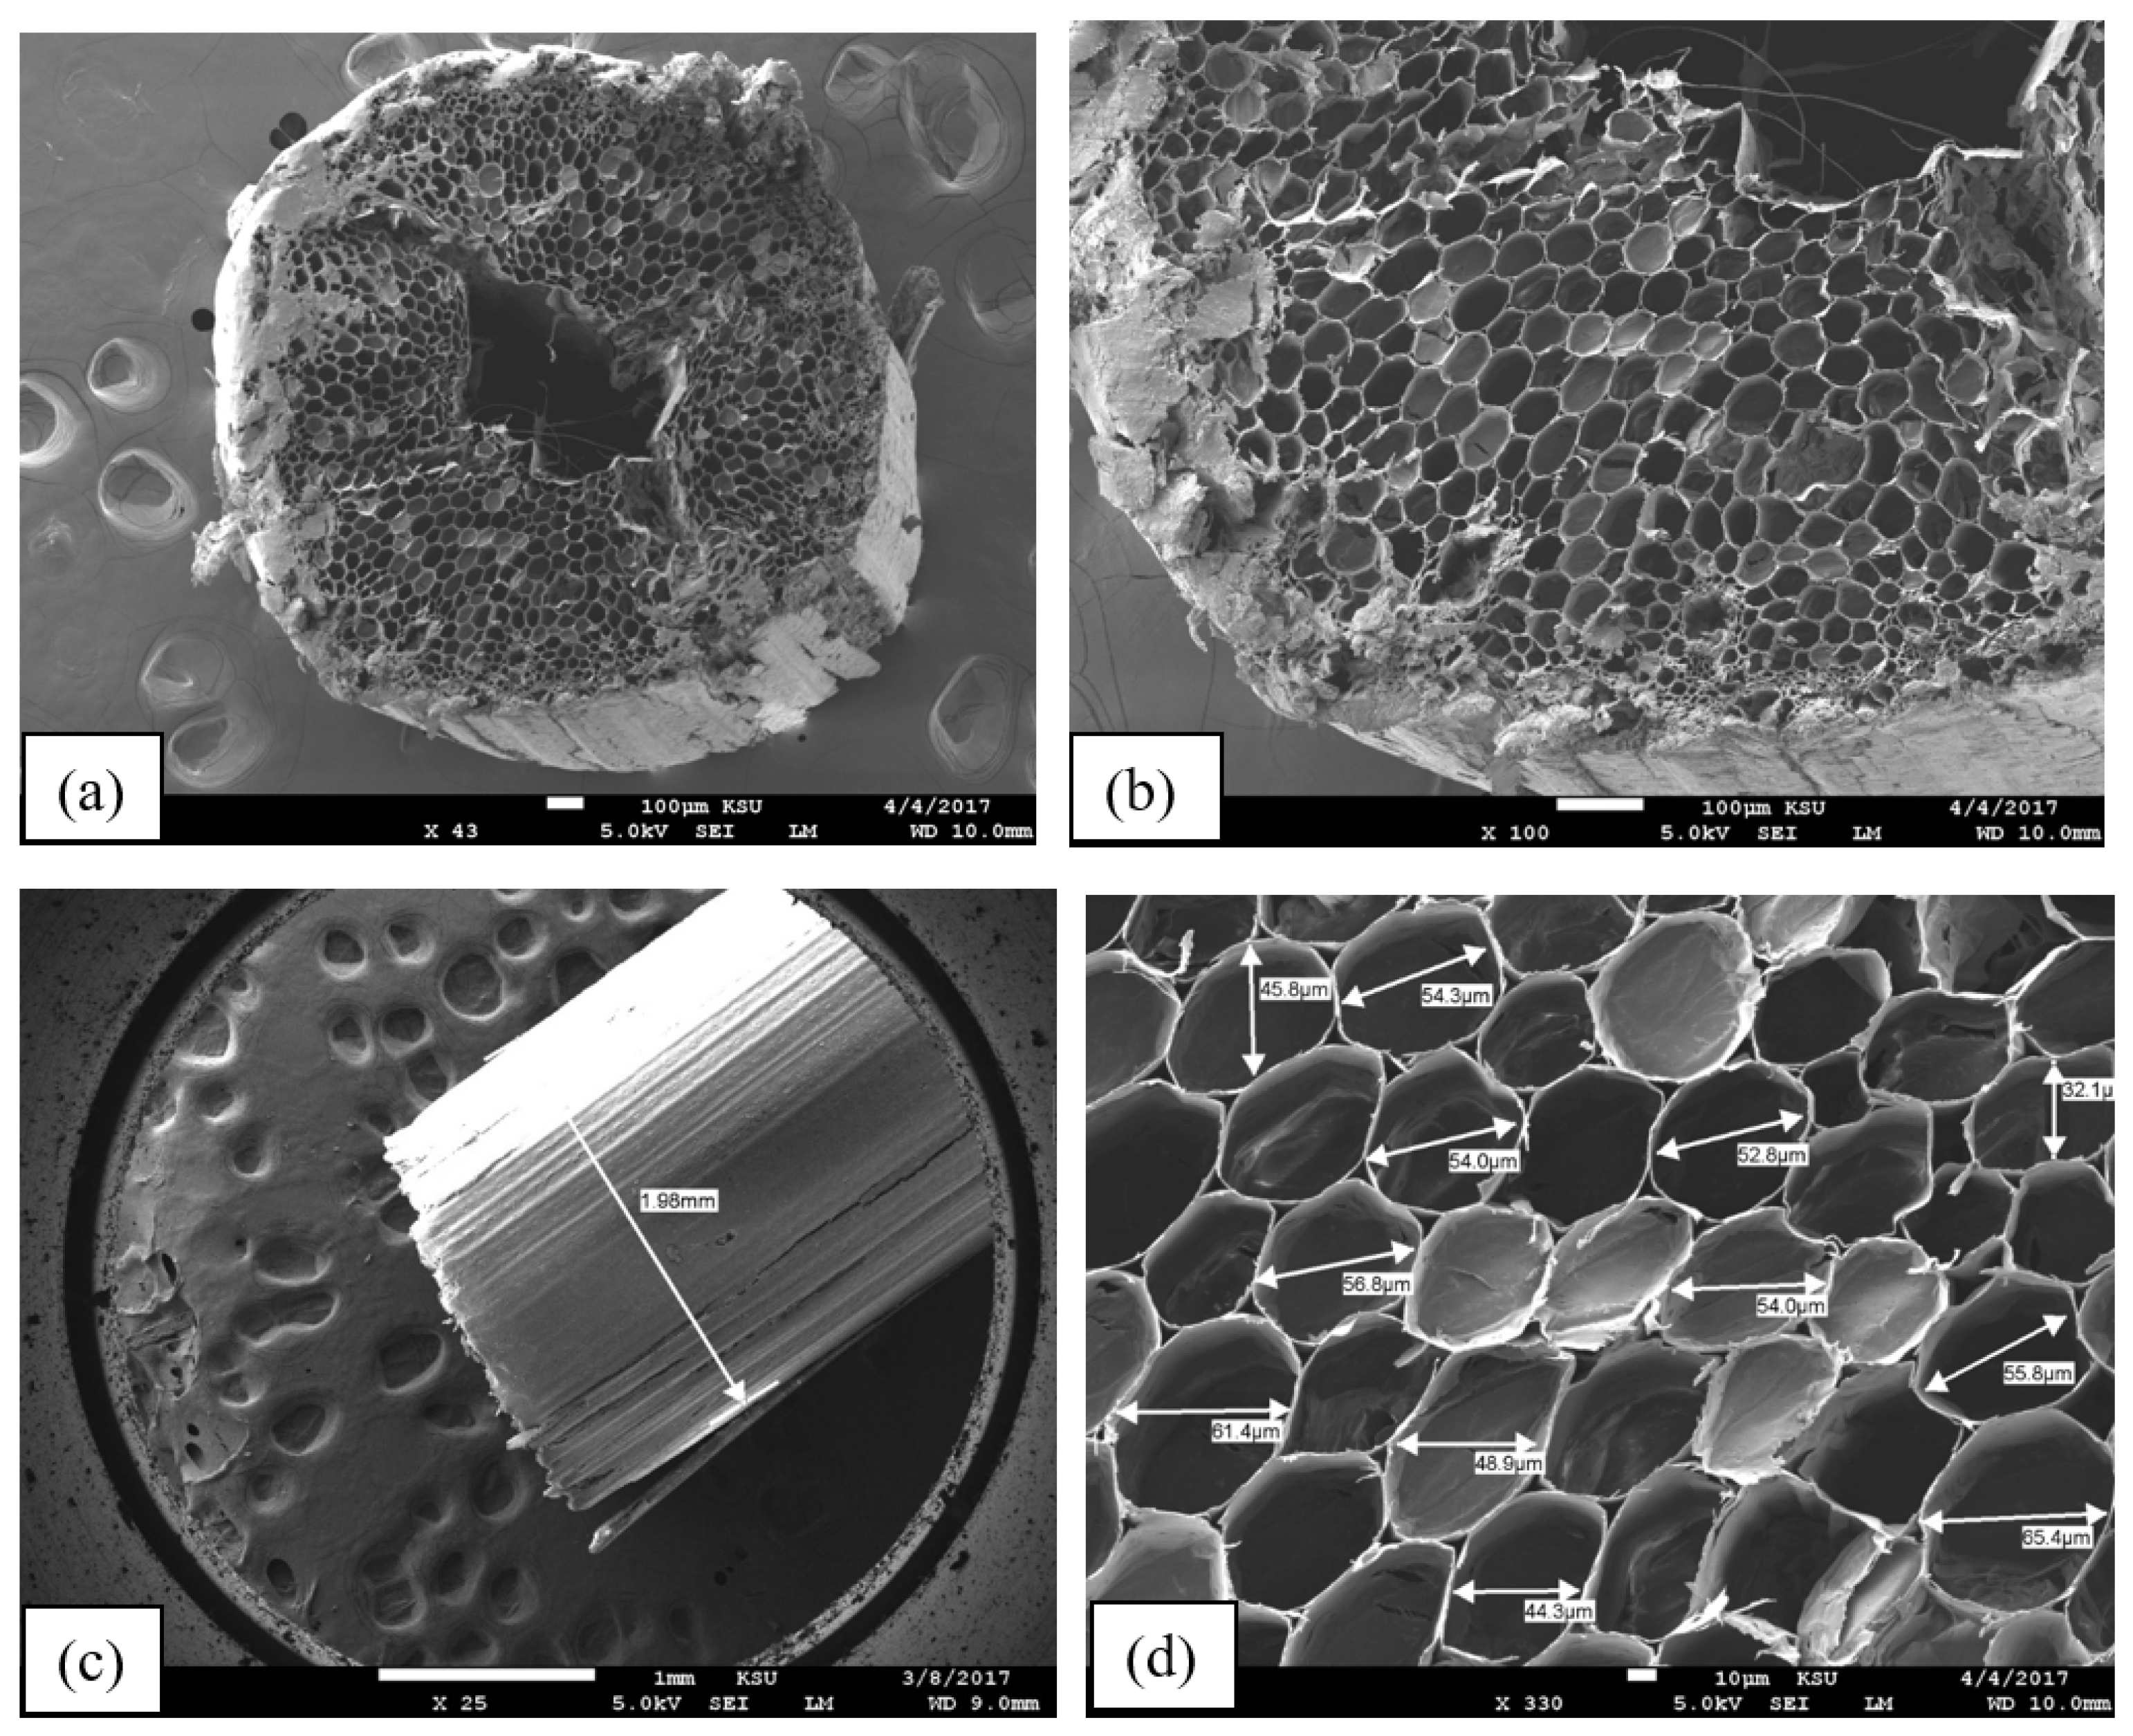
4.1. Scanning Electron Microscopy Analysis (SEM)
4.2. Thermal Conductivity Measurement
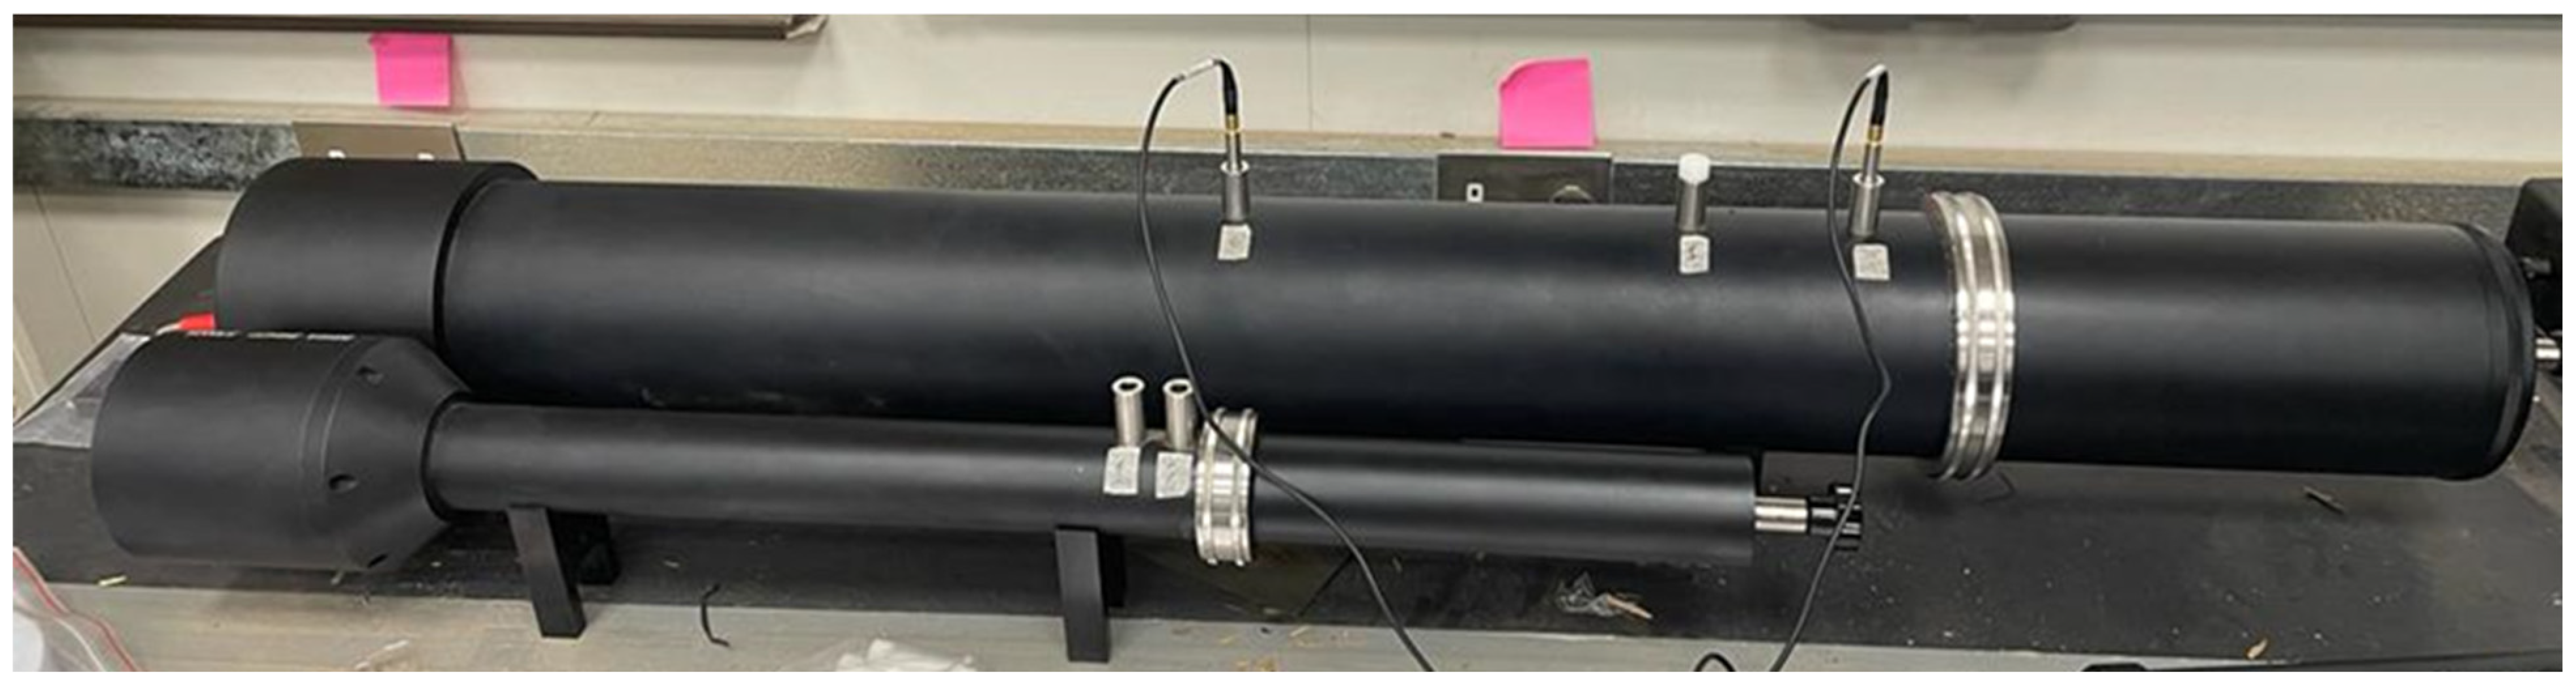
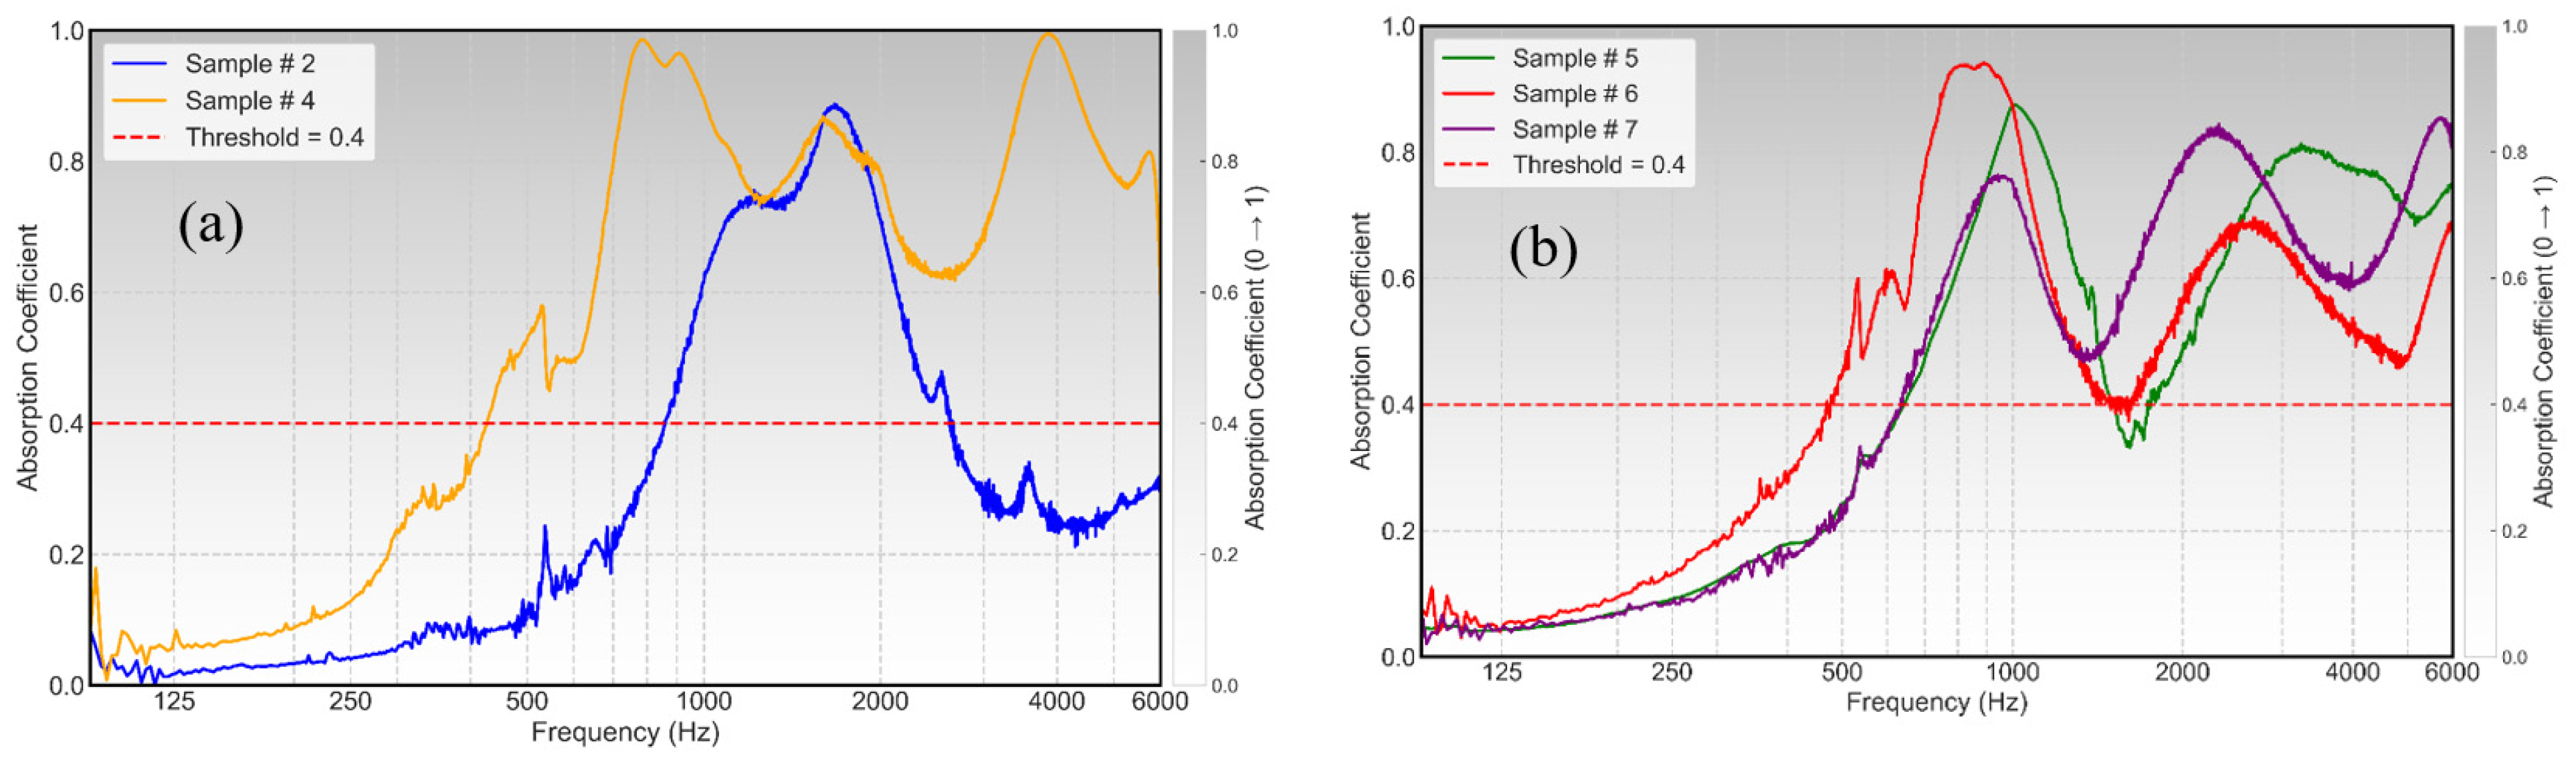
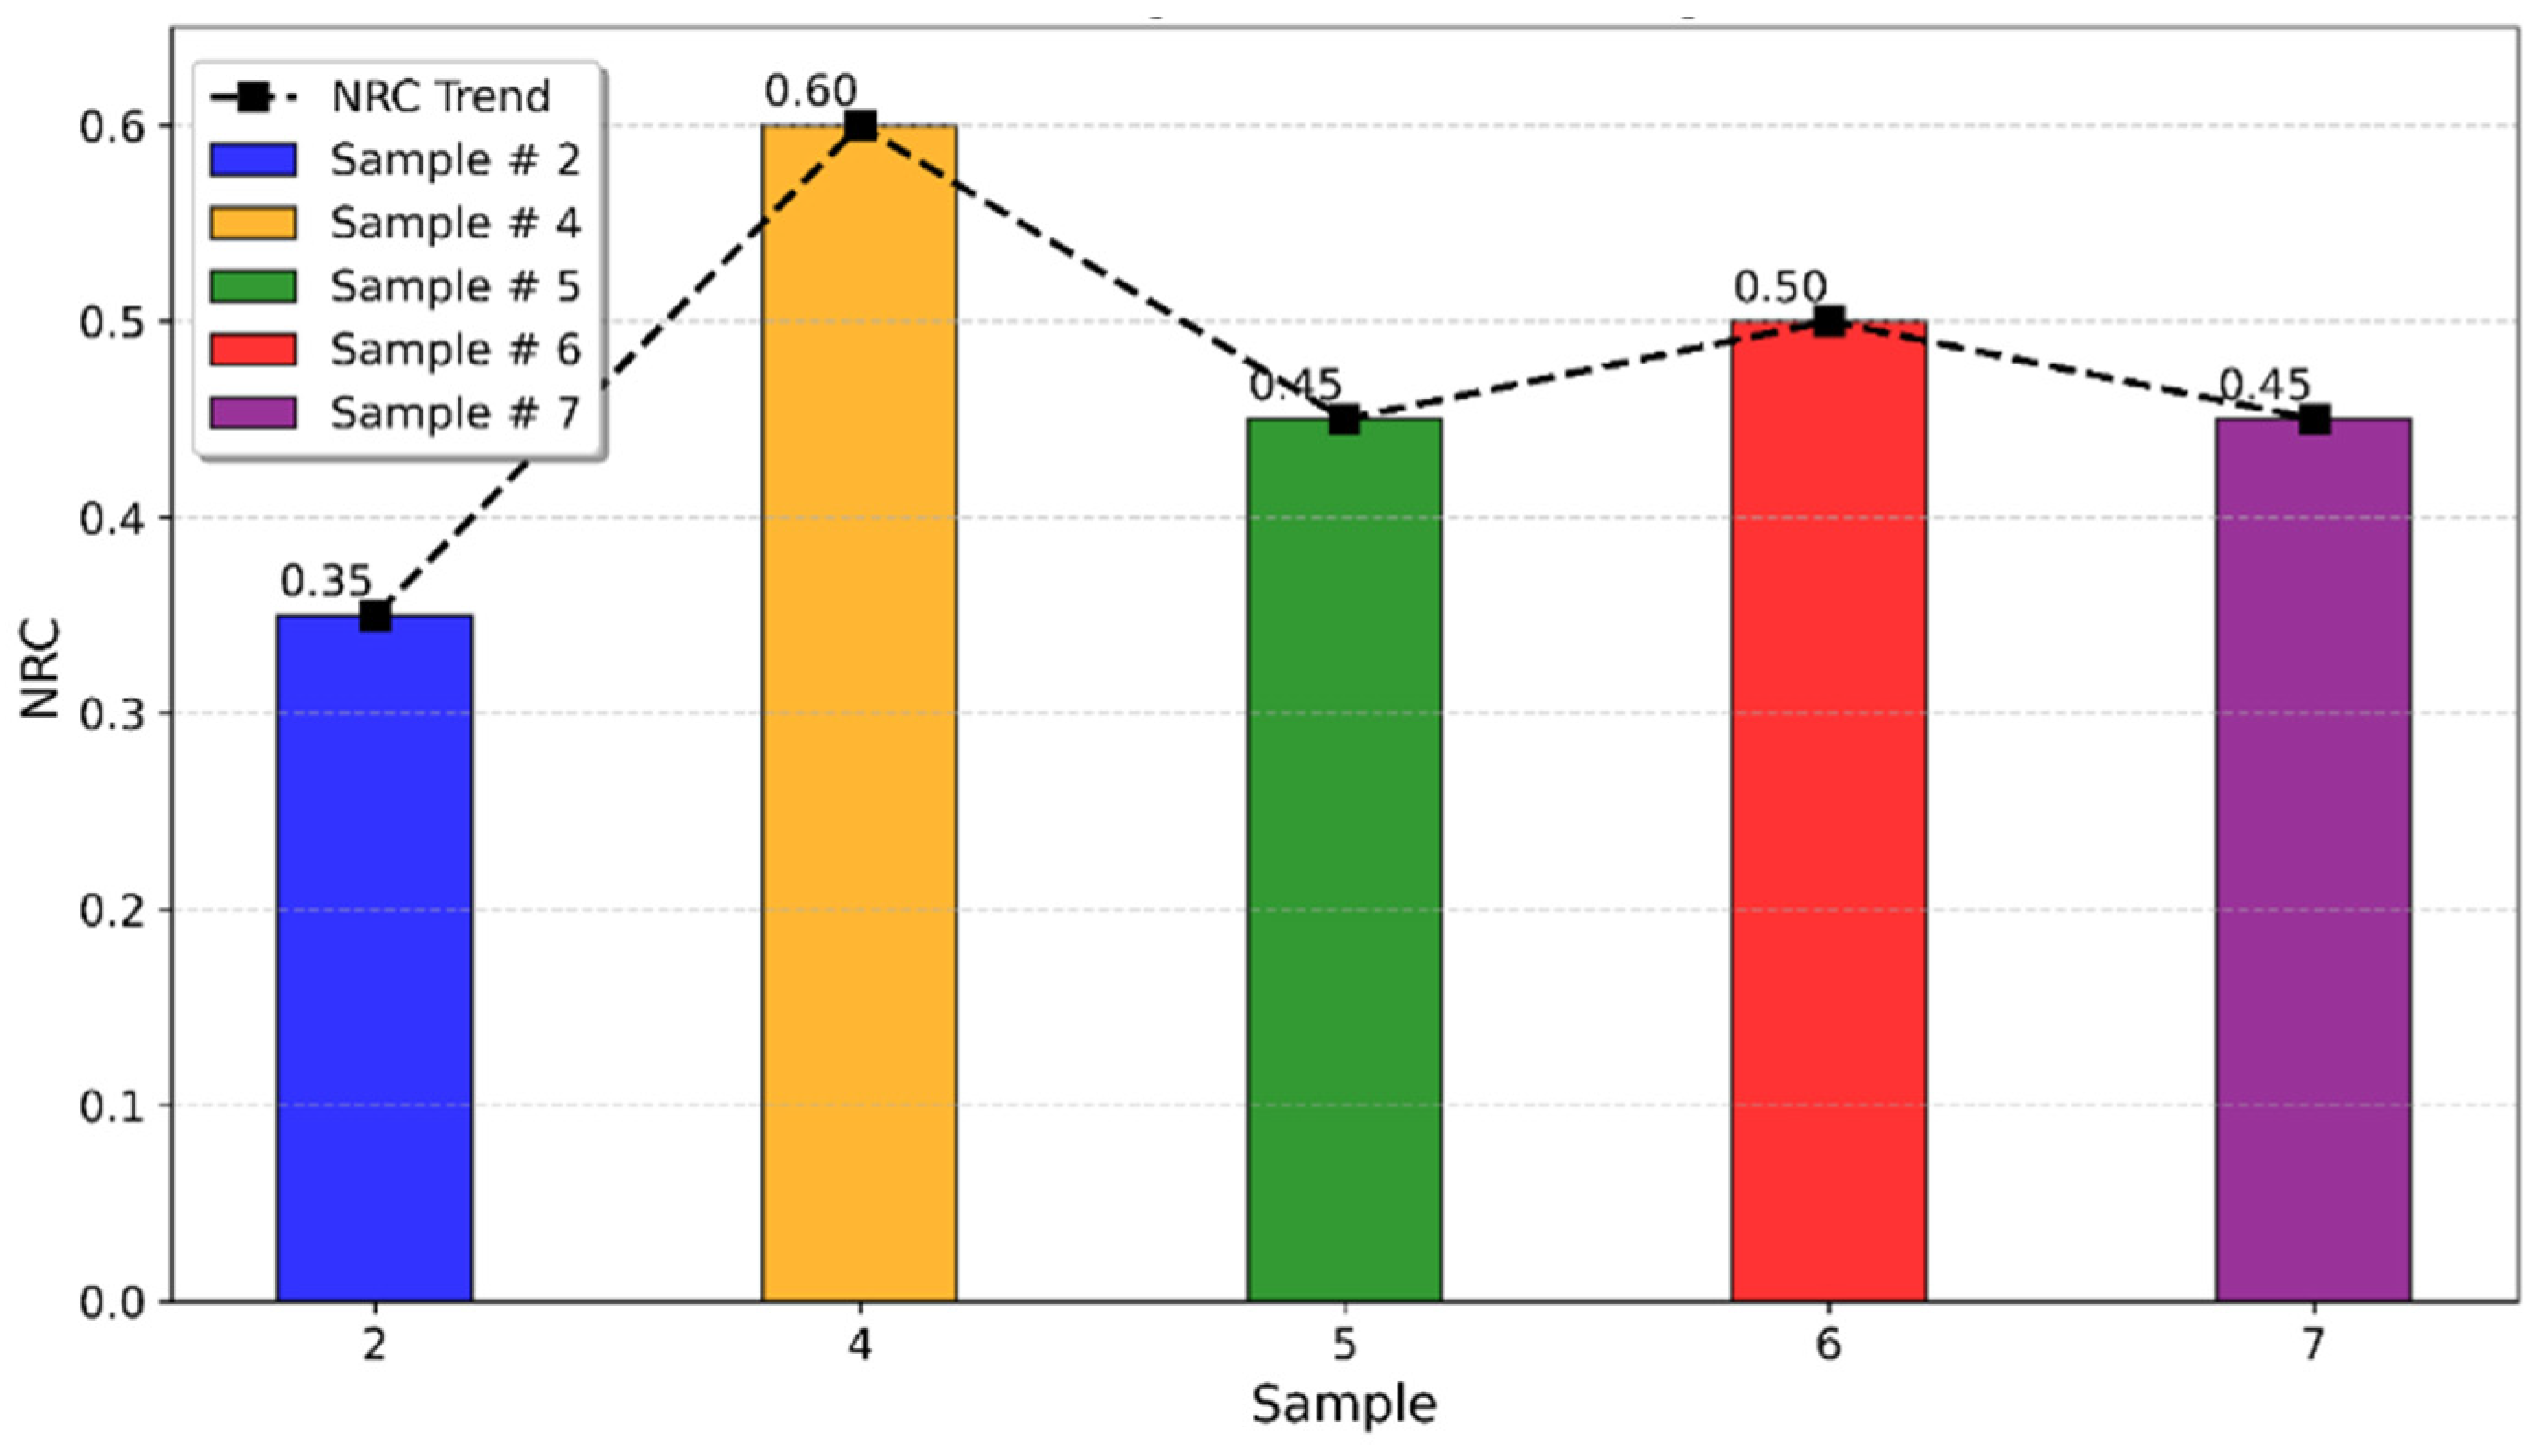
4.3. Sound Absorption Coefficient (SAC) Determination
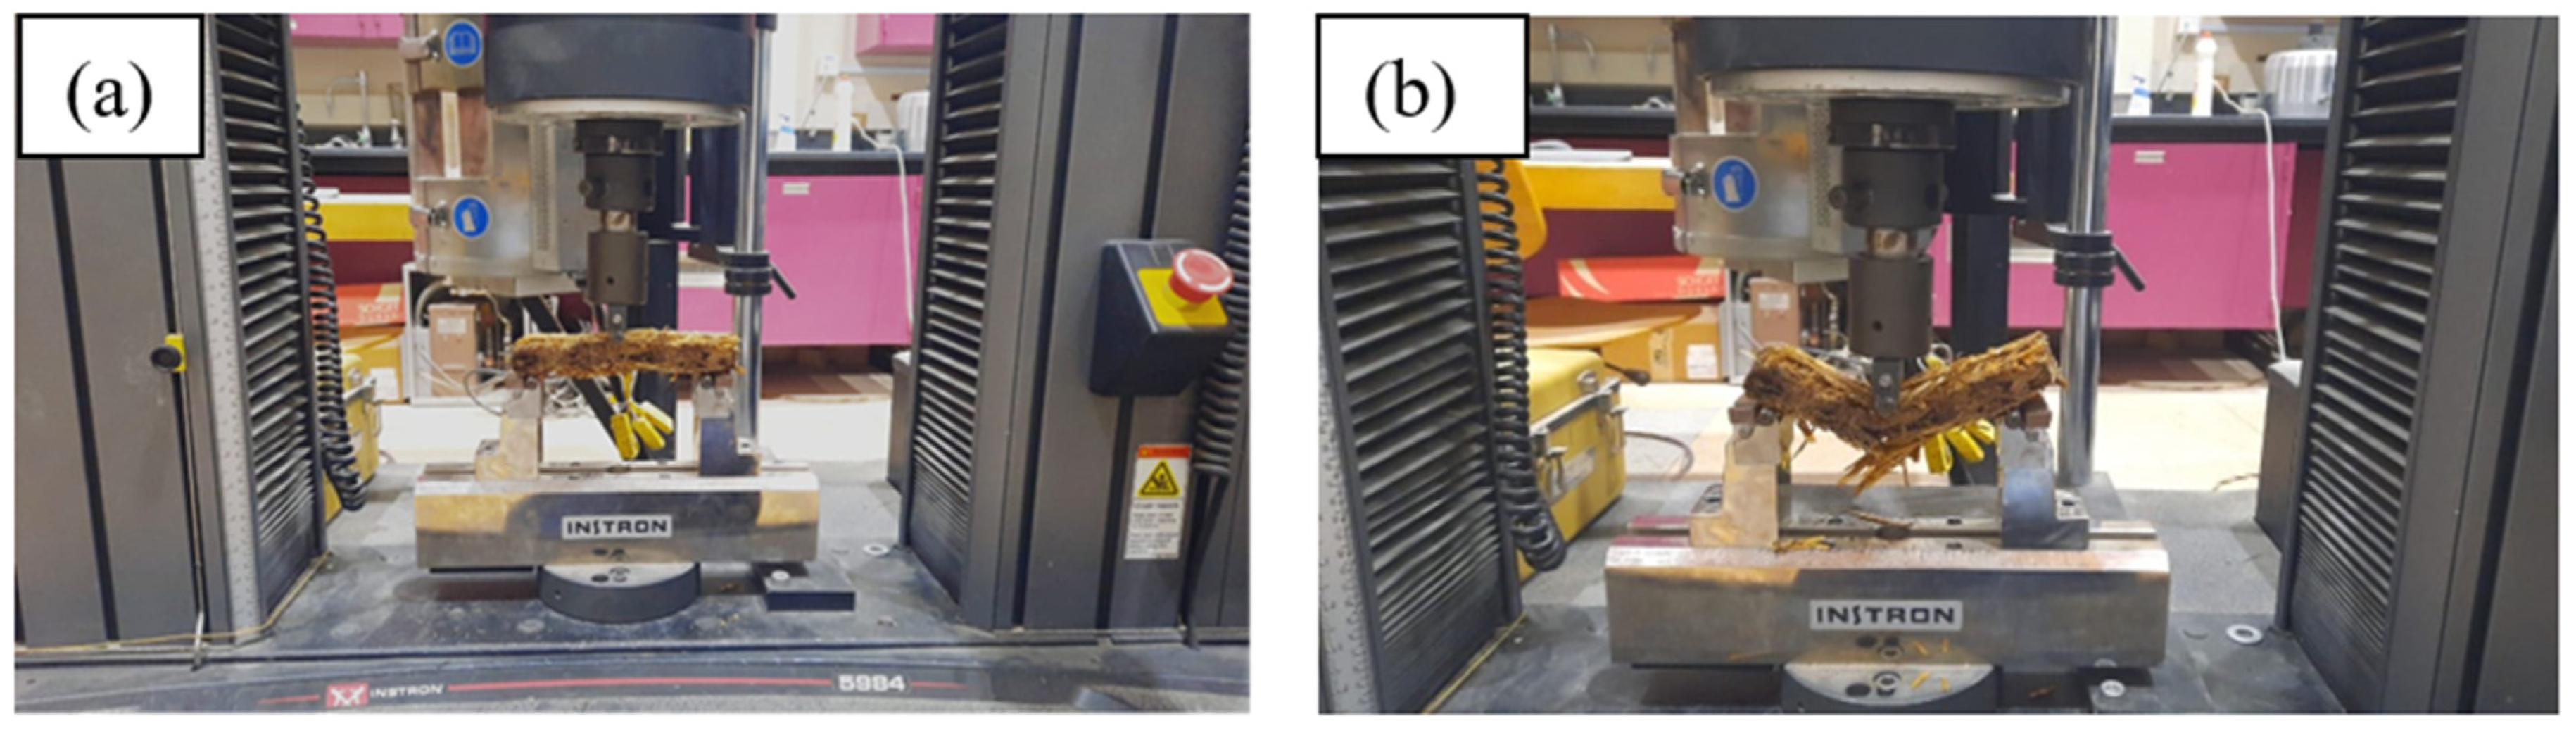
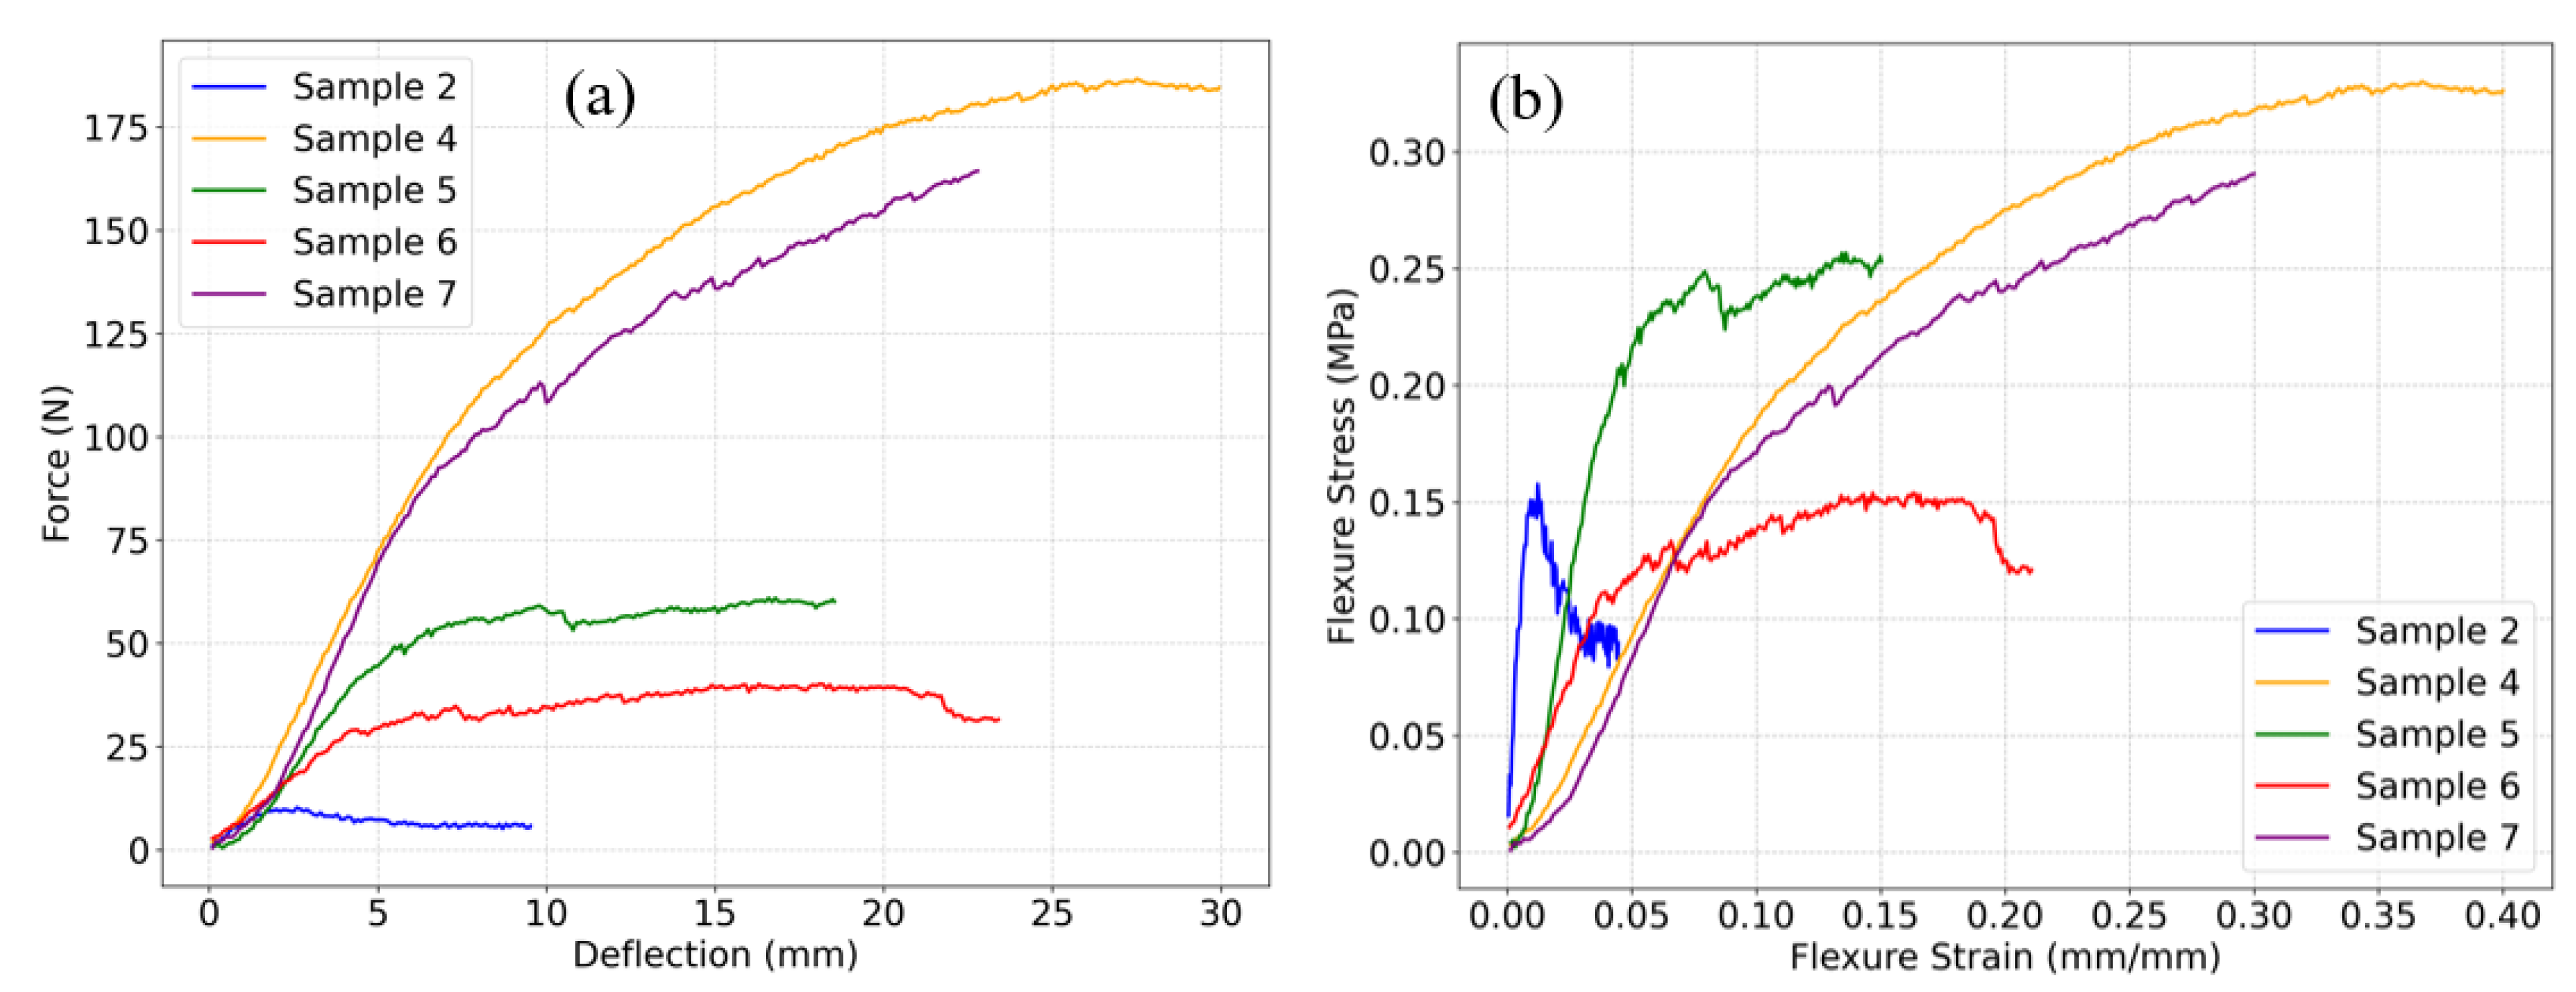
4.4. Bending Moment (BM) Test
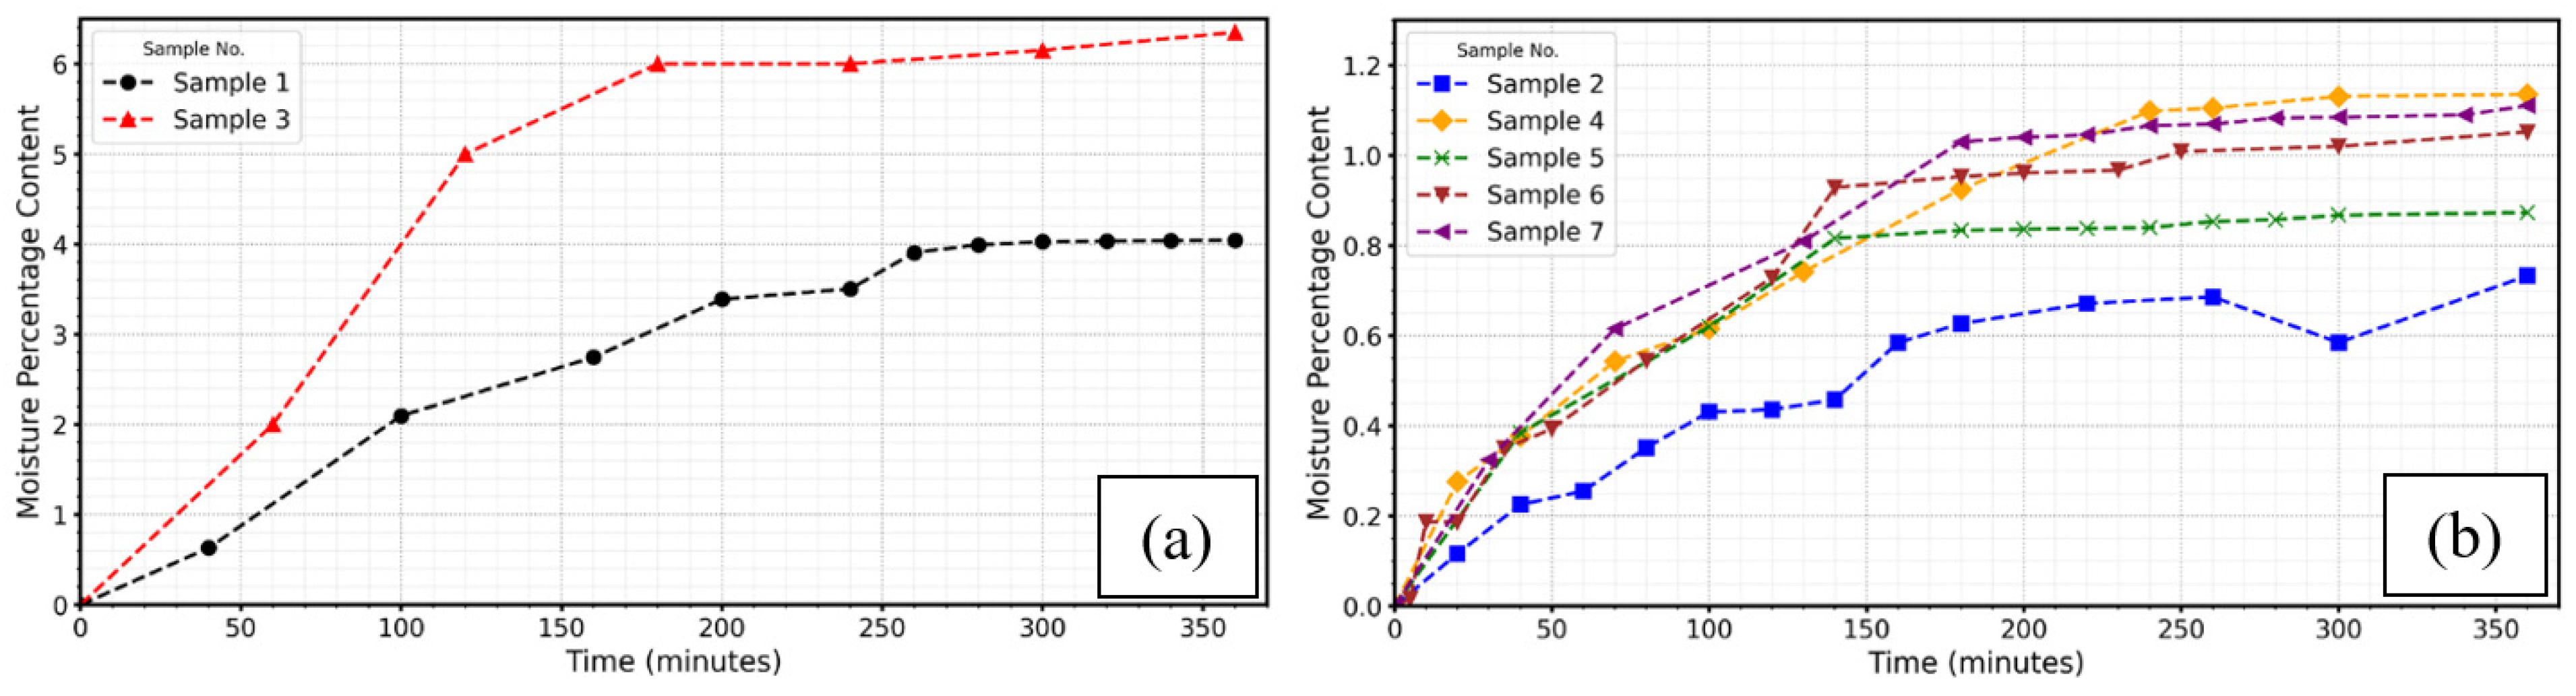
4.5. Moisture Content
5. Results and Discussion
6. Conclusions
Author Contributions
Funding
Data Availability Statement
Acknowledgments
Conflicts of Interest
References
- Yemis, O.; Mazza, G. Optimization of furfural and 5-hydroxymethylfurfural production from wheat straw by a microwave-assisted process. Bioresour. Technol. 2012, 109, 215–223. [Google Scholar] [CrossRef] [PubMed]
- Sajid, M.; Asad, M.; Akram, A.; Yasir, M.; Arshad, M.; Raza, R. Sustainability of Villages Through Electricity from Wheat Straw in Pakistan. AAAFM Energy 2020, 1, 27–35. [Google Scholar]
- Backer, W.S. Utilization of Saudi Wheat Straw in the Production of Protein-rich Biomass. JKAU Sci. 2013, 25, 55–63. [Google Scholar] [CrossRef]
- Wang, Z.; Ahmad, W.; Zhu, A.; Zhao, S.; Ouyang, Q.; Chen, Q. Recent advances review in tea waste: High-value applications, processing technology, and value-added products. Sci. Total Environ. 2024, 946, 174225. [Google Scholar] [CrossRef] [PubMed]
- Sel, E.; Düzova, I.; Gül, Z.S. From waste to design: The potentials of recycled coffee, tea residue and cardboard cups as acoustical panels. In Proceedings of the Forum Acusticum 2023, Torino, Italy, 11–15 September 2023. [Google Scholar] [CrossRef]
- Liu, L.; Zou, S.; Li, H.; Deng, L.; Bai, C.; Zhang, X.; Wang, S.; Li, N. Experimental physical properties of an eco-friendly bio-insulation material based on wheat straw for buildings. Energy Build. 2019, 201, 19–36. [Google Scholar] [CrossRef]
- Tlaiji, G.; Ouldboukhitine, S.; Pennec, F.; Biwole, P. Thermal and Mechanical Behavior of Straw-Based Construction: A Review. Constr. Build. Mater. 2022, 316, 125915. [Google Scholar] [CrossRef]
- Rojas, C.; Cea, M.; Iriarte, A.; Valdés, G.; Navia, R.; Cárdenas-R, J.P. Thermal insulation materials based on agricultural residual wheat straw and corn husk biomass, for application in sustainable buildings. Sustain. Mater. Technol. 2019, 20, e00102. [Google Scholar]
- Csanády, D.; Fenyvesi, O.; Nagy, B. Heat Transfer in Straw-Based Thermal Insulating Materials. Materials 2021, 14, 4408. [Google Scholar] [CrossRef]
- Soto, M.; Rojas, C.; Cárdenas-Ramírez, J.P. Characterization of a Thermal Insulating Material Based on a Wheat Straw and Recycled Paper Cellulose to Be Applied in Buildings by Blowing Method. Sustainability 2023, 15, 58. [Google Scholar] [CrossRef]
- Ali, M.; Alabdulkarem, A.; Nuhait, A.; Al-Salem, K.; Iannace, G.; Almuzaiqer, R.; Al-Turki, A.; Al-Ajlan, F.; Al-Mosabi, Y.; Al-Sulaimi, A. Thermal and acoustic characteristics of novel thermal insulating materials made of Eucalyptus Globulus leaves and wheat straw fibers. J. Build. Eng. 2020, 32, 101452. [Google Scholar] [CrossRef]
- Ali, M.; Alabdulkarem, A.; Nuhait, A.; Al-Salem, K.; Almuzaiqer, R.; Bayaquob, O.; Salah, H.; Alsaggaf, A.; Algafri, Z. Thermal Analyses of Loose Agave, Wheat Straw Fibers and Agave/Wheat Straw as New Hybrid Thermal Insulating Materials for Buildings. J. Nat. Fibers 2021, 18, 2173–2188. [Google Scholar] [CrossRef]
- Ali, M.; Alabdulkarem, A.; Nuhait, A.; Al-Salem, K.; Iannace, G.; Almuzaiqer, R. Characteristics of Agro Waste Fibers as New Thermal Insulation and Sound Absorbing Materials: Hybrid of Date Palm Tree Leaves and Wheat Straw Fibers. J. Nat. Fibers 2022, 19, 6576–6594. [Google Scholar] [CrossRef]
- Shi, J.-S.; Li, J.-Z.; Fan, Y.-M.; Ma, H.-X. Preparation and properties of waste tea leaves particleboard. For. Stud. China 2006, 8, 41–45. [Google Scholar] [CrossRef]
- Tutuş, A.; Kazaskeroğlu, Y.; Çiçekler, M. Evaluation of Tea Wastes in Usage Pulp and Paper Production. BioResources 2015, 10, 5407–5416. [Google Scholar]
- Ozturk, S.; Sutcu, M.; Erdogmus, E.; Gencel, O. Influence of tea waste concentration in the physical, mechanical and thermal properties of brick clay mixtures. Constr. Build. Mater. 2019, 217, 592–599. [Google Scholar] [CrossRef]
- Bagheri, S.; Nodoushan, R.J.; Azimzadeh, M. Sound absorption performance of tea waste reinforced polypropylene and nanoclay biocomposites. Polym. Bull. 2023, 80, 5203–5218. [Google Scholar] [CrossRef]
- Crespo-Lopez, L.; Coletti, C.; Arizzi, A.; Cultrone, G. Effects of using tea waste as an additive in the production of solid bricks in terms of their porosity, thermal conductivity, strength and durability. Sustain. Mater. Technol. 2024, 39, e00859. [Google Scholar] [CrossRef]
- Ali, M.; Almuzaiqer, R.; Al-Salem, K.; Alshehri, H.; Nuhait, A.; Alabdullatif, A.; Almubayrik, A. New Eco-Friendly Thermal Insulation and Sound Absorption Composite Materials Derived from Waste Black Tea Bags and Date Palm Tree Surface Fibers. Polymers 2024, 16, 2989. [Google Scholar] [CrossRef]
- ASTM-C518; Standard Test Method for Steady-State Thermal Transmission Properties by Means of the Heat Flow Meter Apparatus (C 518). American Society of Testing and Materials (ASTM): West Conshohocken, PA, USA, 2010.
- Ali, M.; Almuzaiqer, R.; Al-Salem, K.; Alabdulkarem, A.; Nuhait, A. New novel thermal insulation and sound-absorbing materials from discarded facemasks of COVID-19 pandemic. Sci. Rep. 2021, 11, 23240. [Google Scholar] [CrossRef]
- ISO 10534-1; Determination of Sound Absorption Coefficient and Impedance in Impedance Tubes—Part 1: Method Using Standing Wave Ratio. ISO: Rome, Italy, 1996.
- ISO 10534-2; Determination of Sound Absorption Coefficient and Impedance in Impedance Tubes—Part 2: Transfer-Function Method. ISO: Rome, Italy, 1998.
- ASTM D790-03; Standard Test Methods for Flexural Properties of Unreinforced and Reinforced Plastics and Electrical Insulating Materials. ASTM International: West Conshohocken, PA, USA, 2003. Available online: www.astm.org (accessed on 1 June 2025).
- ASTM D2974-07A; Standard Test Methods for Moisture, Ash, and Organic Matter of Peat and Other Organic Soils. ASTM International: West Conshohocken, PA, USA, 2007.
- Asdrubali, F.; D’ALessandro, F.; Schiavoni, S. A review of unconventional sustainable building insulation materials. Sustain. Mater. Technol. 2015, 4, 1–17. [Google Scholar] [CrossRef]
- Intini, F.; Kühtz, S. Recycling in buildings: An LCA case study of a thermal insulation panel made of polyester fiber, recycled from post-consumer PET bottles. Int. J. Life Cycle Assess. 2011, 16, 306–315. [Google Scholar] [CrossRef]
- Berardi, U.; Iannace, G. Acoustic characterization of natural fibers for sound absorption applications. Build. Environ. 2015, 94, 840–852. [Google Scholar]
- Danihelova, A.; Nemec, M.; Gergel, T.; Gejdos, M.; Gordanova, J.; Scensny, P. Usage of Recycled Technical Textiles as Thermal Insulation and an Acoustic Absorber. Sustainability 2019, 11, 2966. [Google Scholar] [CrossRef]
- Sun, Y.; Xu, Y.; Li, W.; Yue, X. Functional modification of softwood fiber and its application in natural fiber-based sound-absorbing composite. Ind. Crop. Prod. 2024, 218, 119044. [Google Scholar] [CrossRef]
- Sharma, S.; Shukla, S.; Sethy, A. Acoustical behaviour of natural fibres-based composite boards as sound-absorbing materials. J. Indian Acad. Wood Sci. 2020, 17, 66–72. [Google Scholar] [CrossRef]
- Zhang, C.; Li, H.; Gong, J.; Chen, J.; Li, Z.; Li, Q.; Cheng, M.; Li, X.; Zhang, J. The review of fiber-based sound-absorbing structures. Text. Res. J. 2023, 93, 434–449. [Google Scholar] [CrossRef]
- Nguyen, D.M.; Grillet, A.-C.; Diep, T.M.H.; Bui, Q.B.; Woloszyn, M. Influence of thermo-pressing conditions on insulation materials from bamboo fibers and proteins based bone glue. Ind. Crop. Prod. 2018, 111, 834–845. [Google Scholar]
- Dukhan, N.; Rayess, N.; Hadley, J. Characterization of aluminum foam–polypropylene interpenetrating phase composites: Flexural test results. Mech. Mater. 2010, 42, 134–141. [Google Scholar]
- Bainbridge, D.A. High performance low cost buildings of straw, Agriculture. Ecosyst. Environ. 1986, 16, 281–284. [Google Scholar] [CrossRef]


| Material | Board Number | ||||||
|---|---|---|---|---|---|---|---|
| TB Loose (# 1) | TB Bound (# 2) | WSF Loose (# 3) | WSF Bound (# 4) | Hybrid (# 5) | Hybrid (# 6) | Hybrid (# 7) | |
| TB % | 100 | 65.4 | 0.0 | 0.0 | 48.0 | 33.0 | 17.0 |
| WSF % | 0.0 | 0.0 | 100 | 62.0 | 16.0 | 33.0 | 53.0 |
| Resin ratio to the total mass % | 0.0 | 34.6 | 0.0 | 38.0 | 36.0 | 34.0 | 30.0 |
| Thickness (mm), δ | 41.0 | 18.0 | 22.0 | 51.0 | 30 | 34.0 | 50.0 |
| The volume of the sample (cm3) | 3330 | 1620 | 1500 | 4590 | 2700 | 3060 | 4500 |
| Fig. # | Figure 1b | Figure 2a | Figure 1a | Figure 2b | Figure 2c | Figure 2d | Figure 2e |
| Density of dried samples (kg/m3) | 132 | 472 | 78.0 | 177 | 291 | 250 | 158 |
| Total dried mass (g) | 439 | 765 | 117.0 | 810 | 786 | 764 | 711 |
| Specimen No. | Thickness (δ) (mm) | Width (b) (mm) | Span (L) (mm) | Slope (S) (N/mm) |
|---|---|---|---|---|
| 2 | 18 | 47.34 | 150.0 | 3.193 |
| 4 | 51 | 50.70 | 150.0 | 10.185 |
| 5 | 30 | 57.84 | 150.0 | 8.839 |
| 6 | 34 | 51.51 | 150.0 | 4.908 |
| 7 | 50 | 52.20 | 150.0 | 16.565 |
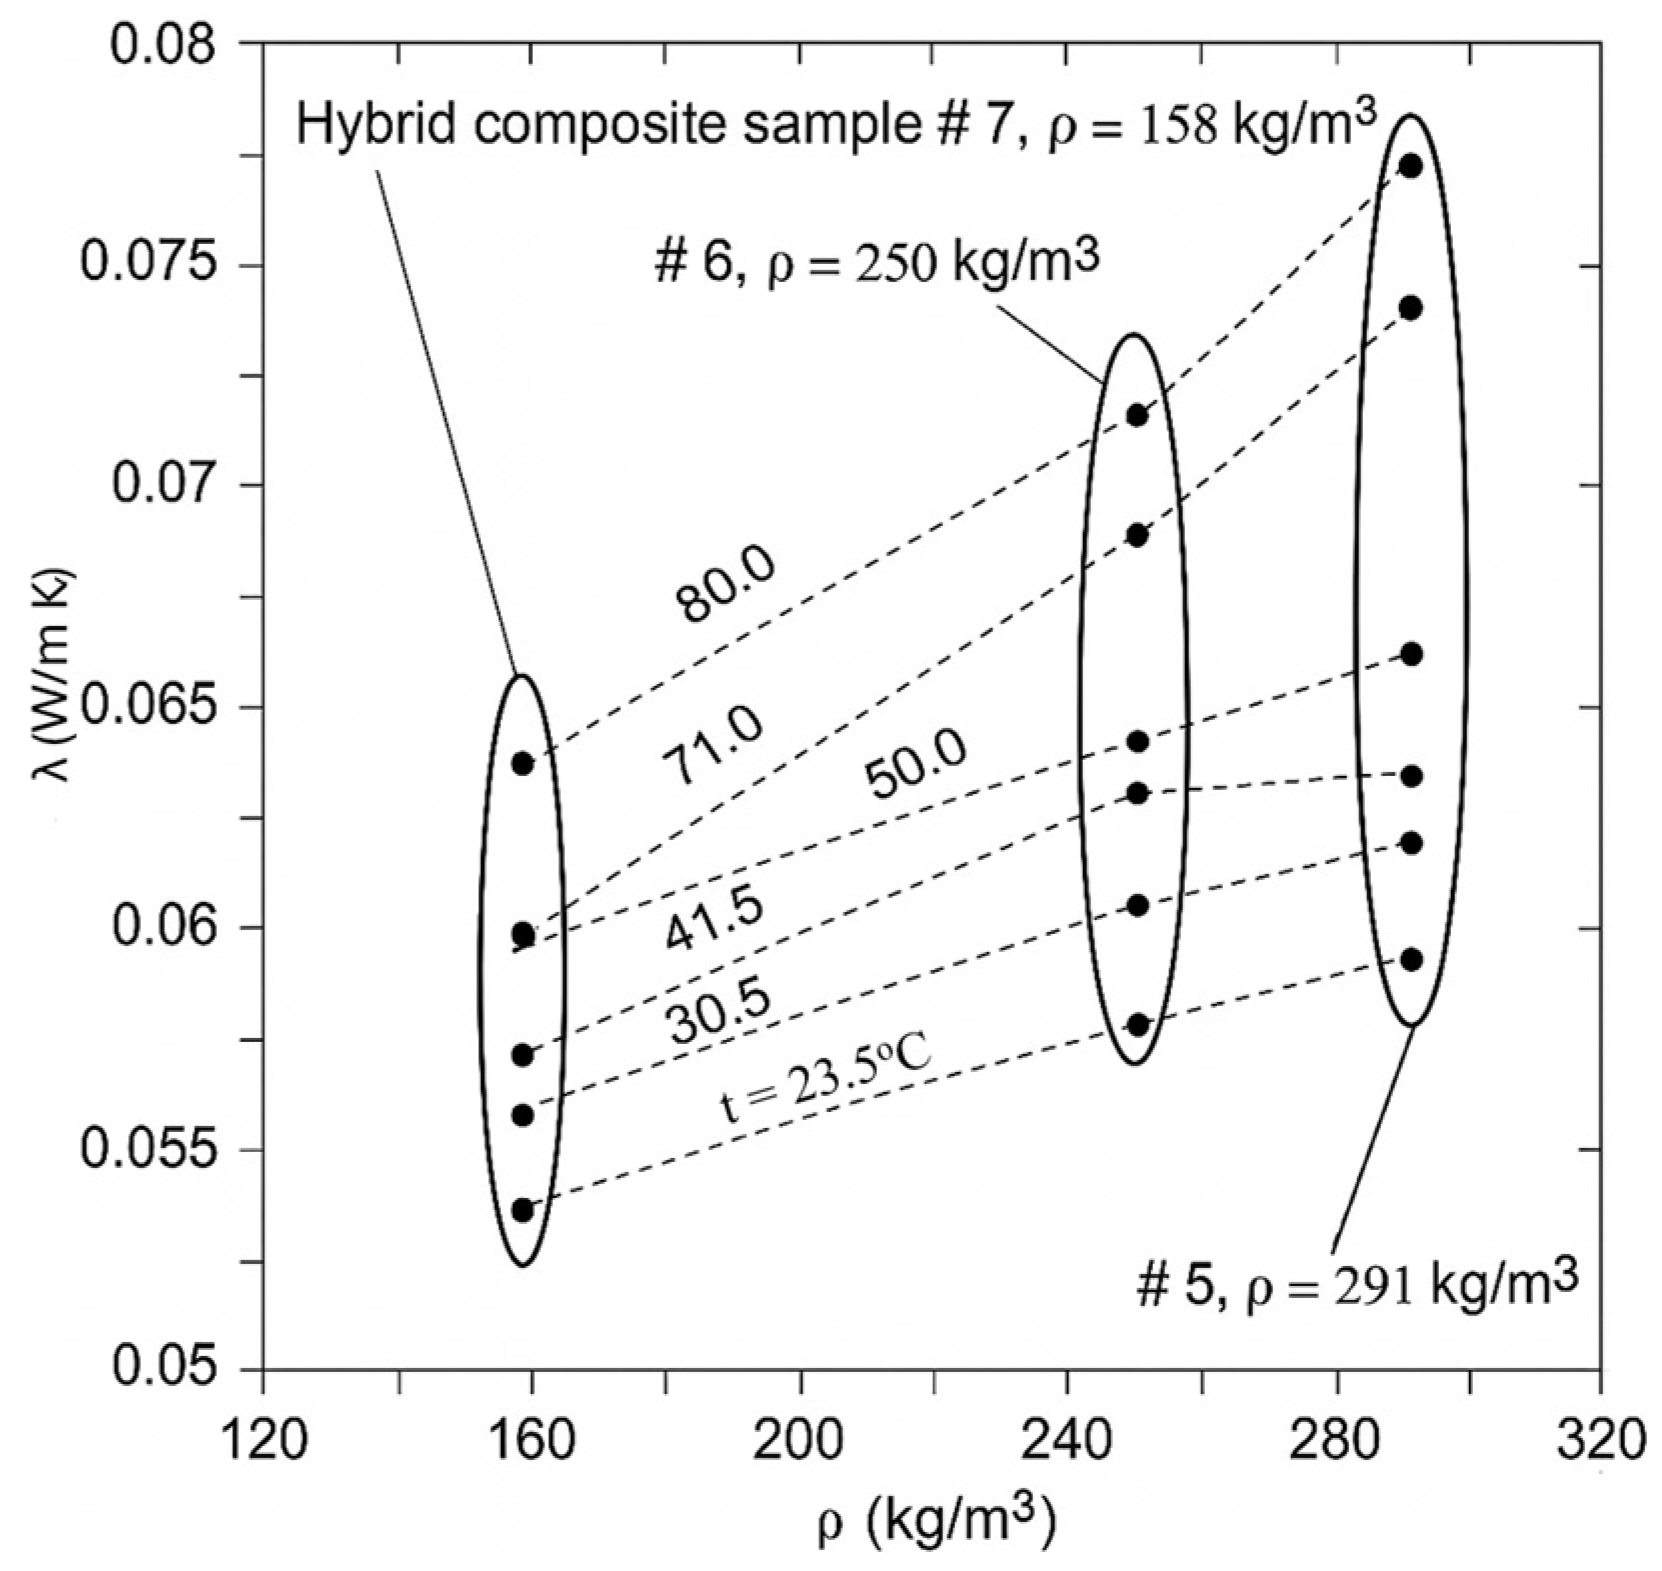
| Correlation | λ = (B × t) + A | ||||
|---|---|---|---|---|---|
| Sample # | Symbol | A | B | R2, % | Density, kg/m3 |
| 1 (TBs loose) | ο | 0.049 | 0.0002 | 92.6 | 132.0 |
| 2 (TBs bound) | ● | 0.064 | 0.0004 | 98.7 | 472.0 |
| 3 (WSFs loose) | ◊ | 0.038 | 0.0002 | 99.0 | 78.0 |
| 4 (WSFs bound) | ♦ | 0.046 | 0.0002 | 99.5 | 177.0 |
| 5 (Hybrid) | ■ | 0.052 | 0.0003 | 99.1 | 291.0 |
| 6 (Hybrid) | ▲ | 0.053 | 0.0002 | 98.7 | 250.0 |
| 7 (Hybrid) | + | 0.051 | 0.0002 | 93.2 | 158.0 |
| Materials | Density (kg/m3) | Thermal Conductivity Coefficient, λ (W/m K) | Ref. |
|---|---|---|---|
| TBs (# 1), loose | 132 | 0.054–0.067 | This article |
| TBs (# 2), bound | 472 | 0.073–0.095 | This article |
| WSFs (# 3) loose | 78.0 | 0.042–0.054 | This article |
| WSFs (# 4) bound | 177.0 | 0.049–0.062 | This article |
| (# 5), hybrid | 291.0 | 0.059–0.076 | This article |
| (# 6), hybrid | 250.0 | 0.058–0.072 | This article |
| (# 7), hybrid | 158.0 | 0.054–0.065 | This article |
| Commercialized recycled (PET) | 15–60 | 0.034–0.039 | [26] |
| Recycled glass fiber produced for commercial use | 100–165 | 0.038–0.050 | [26] |
| Polyurethane foam | 30–80 | 0.02–0.027 | |
| Rock wool | 40–200 | 0.033–0.040 | [26] |
| Expanded polystyrene (XPS) | 15–35 | 0.031–0.038 | [26] |
| Extruded polystyrene (EPS) | 32–40 | 0.032–0.037 | [26] |
| Kenaf | 30–180 | 0.034–0.043 | [26] |
| Sheep wool | 10–25 | 0.038–0.054 | [26] |
| Recycled Polyethylene Terephthalate (PET) | 30 | 0.0355 | [27] |
Disclaimer/Publisher’s Note: The statements, opinions and data contained in all publications are solely those of the individual author(s) and contributor(s) and not of MDPI and/or the editor(s). MDPI and/or the editor(s) disclaim responsibility for any injury to people or property resulting from any ideas, methods, instructions or products referred to in the content. |
© 2025 by the authors. Licensee MDPI, Basel, Switzerland. This article is an open access article distributed under the terms and conditions of the Creative Commons Attribution (CC BY) license (https://creativecommons.org/licenses/by/4.0/).
Share and Cite
Ali, M.; Almuzaiqer, R.; Alshehri, H.; Alanazi, M.A.; Almudhhi, T.; Nuhait, A. New Bound and Hybrid Composite Insulation Materials from Waste Wheat Straw Fibers and Discarded Tea Bags. Buildings 2025, 15, 2402. https://doi.org/10.3390/buildings15142402
Ali M, Almuzaiqer R, Alshehri H, Alanazi MA, Almudhhi T, Nuhait A. New Bound and Hybrid Composite Insulation Materials from Waste Wheat Straw Fibers and Discarded Tea Bags. Buildings. 2025; 15(14):2402. https://doi.org/10.3390/buildings15142402
Chicago/Turabian StyleAli, Mohamed, Redhwan Almuzaiqer, Hassan Alshehri, Mohammed A. Alanazi, Turki Almudhhi, and Abdullah Nuhait. 2025. "New Bound and Hybrid Composite Insulation Materials from Waste Wheat Straw Fibers and Discarded Tea Bags" Buildings 15, no. 14: 2402. https://doi.org/10.3390/buildings15142402
APA StyleAli, M., Almuzaiqer, R., Alshehri, H., Alanazi, M. A., Almudhhi, T., & Nuhait, A. (2025). New Bound and Hybrid Composite Insulation Materials from Waste Wheat Straw Fibers and Discarded Tea Bags. Buildings, 15(14), 2402. https://doi.org/10.3390/buildings15142402