
Special Cement-Based Grouting Material for Subway Structure Repair During Operation Performance Sensitivity Analysis


Abstract
1. Introduction
1.1. Research Progress on the Optimization of Grouting Material Properties
1.2. Development and Limitations of Multi-Factor Optimization Methods
2. Performance Design of Special Cement-Based Grouting Material for Subway Structure Repair During Operation
- Flow design: In order to make the grouting material more injectable, diffusive, and permeable, a higher slurry flow is preferred;
- Anti-dispersibility design: In order to improve the anti-dispersibility and dynamic water retention rate of the slurry, the content of suspended solids in the slurry should be less than 150 mg/L, and the pH value should be less than 12. However, the lower the content of suspended solids, the poorer the fluidity of the slurry. Therefore, this property contradicts the first property, and a comprehensive consideration should be given during material preparation;
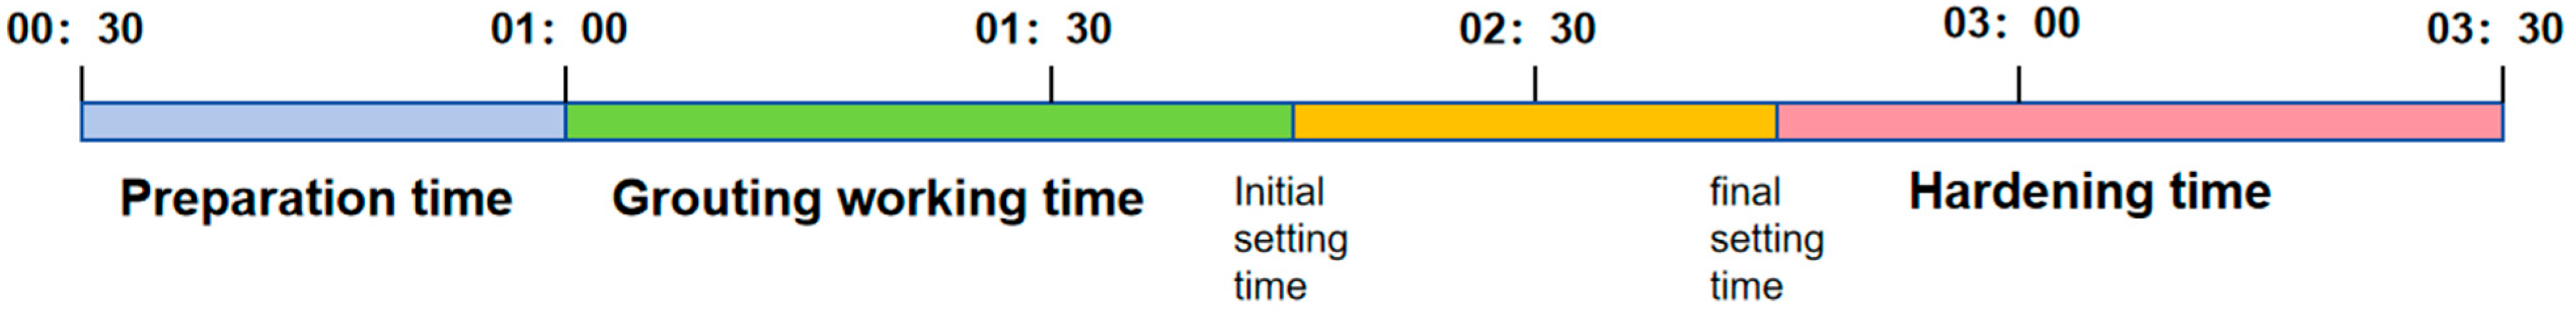
- Curing time design: Generally, during the operation period of subway structures, continuous operations are required, so the curing window is very short. Typically, construction hours are from 12:30 PM to 3:30 AM the next day. Excluding preparation work and grouting time, the time from injection to initial setting should be controlled within 2 h. After removing the setting time, the final setting time of the grouting material should be controlled within 90 min, and the initial setting time should be no less than 30 min (too short a time may lead to pump blockage);
- Strength design: Since the subway structure is greatly affected by train vibration during operation, it has been shown that low-amplitude, high-frequency vibrations from trains significantly impact grouting materials with early strength less than 5 MPa. Therefore, the strength of the grout should not be less than 5 MPa before train operation, that is, the 2 h strength should be at least greater than 5 MPa.
3. Materials and Experimental Methods
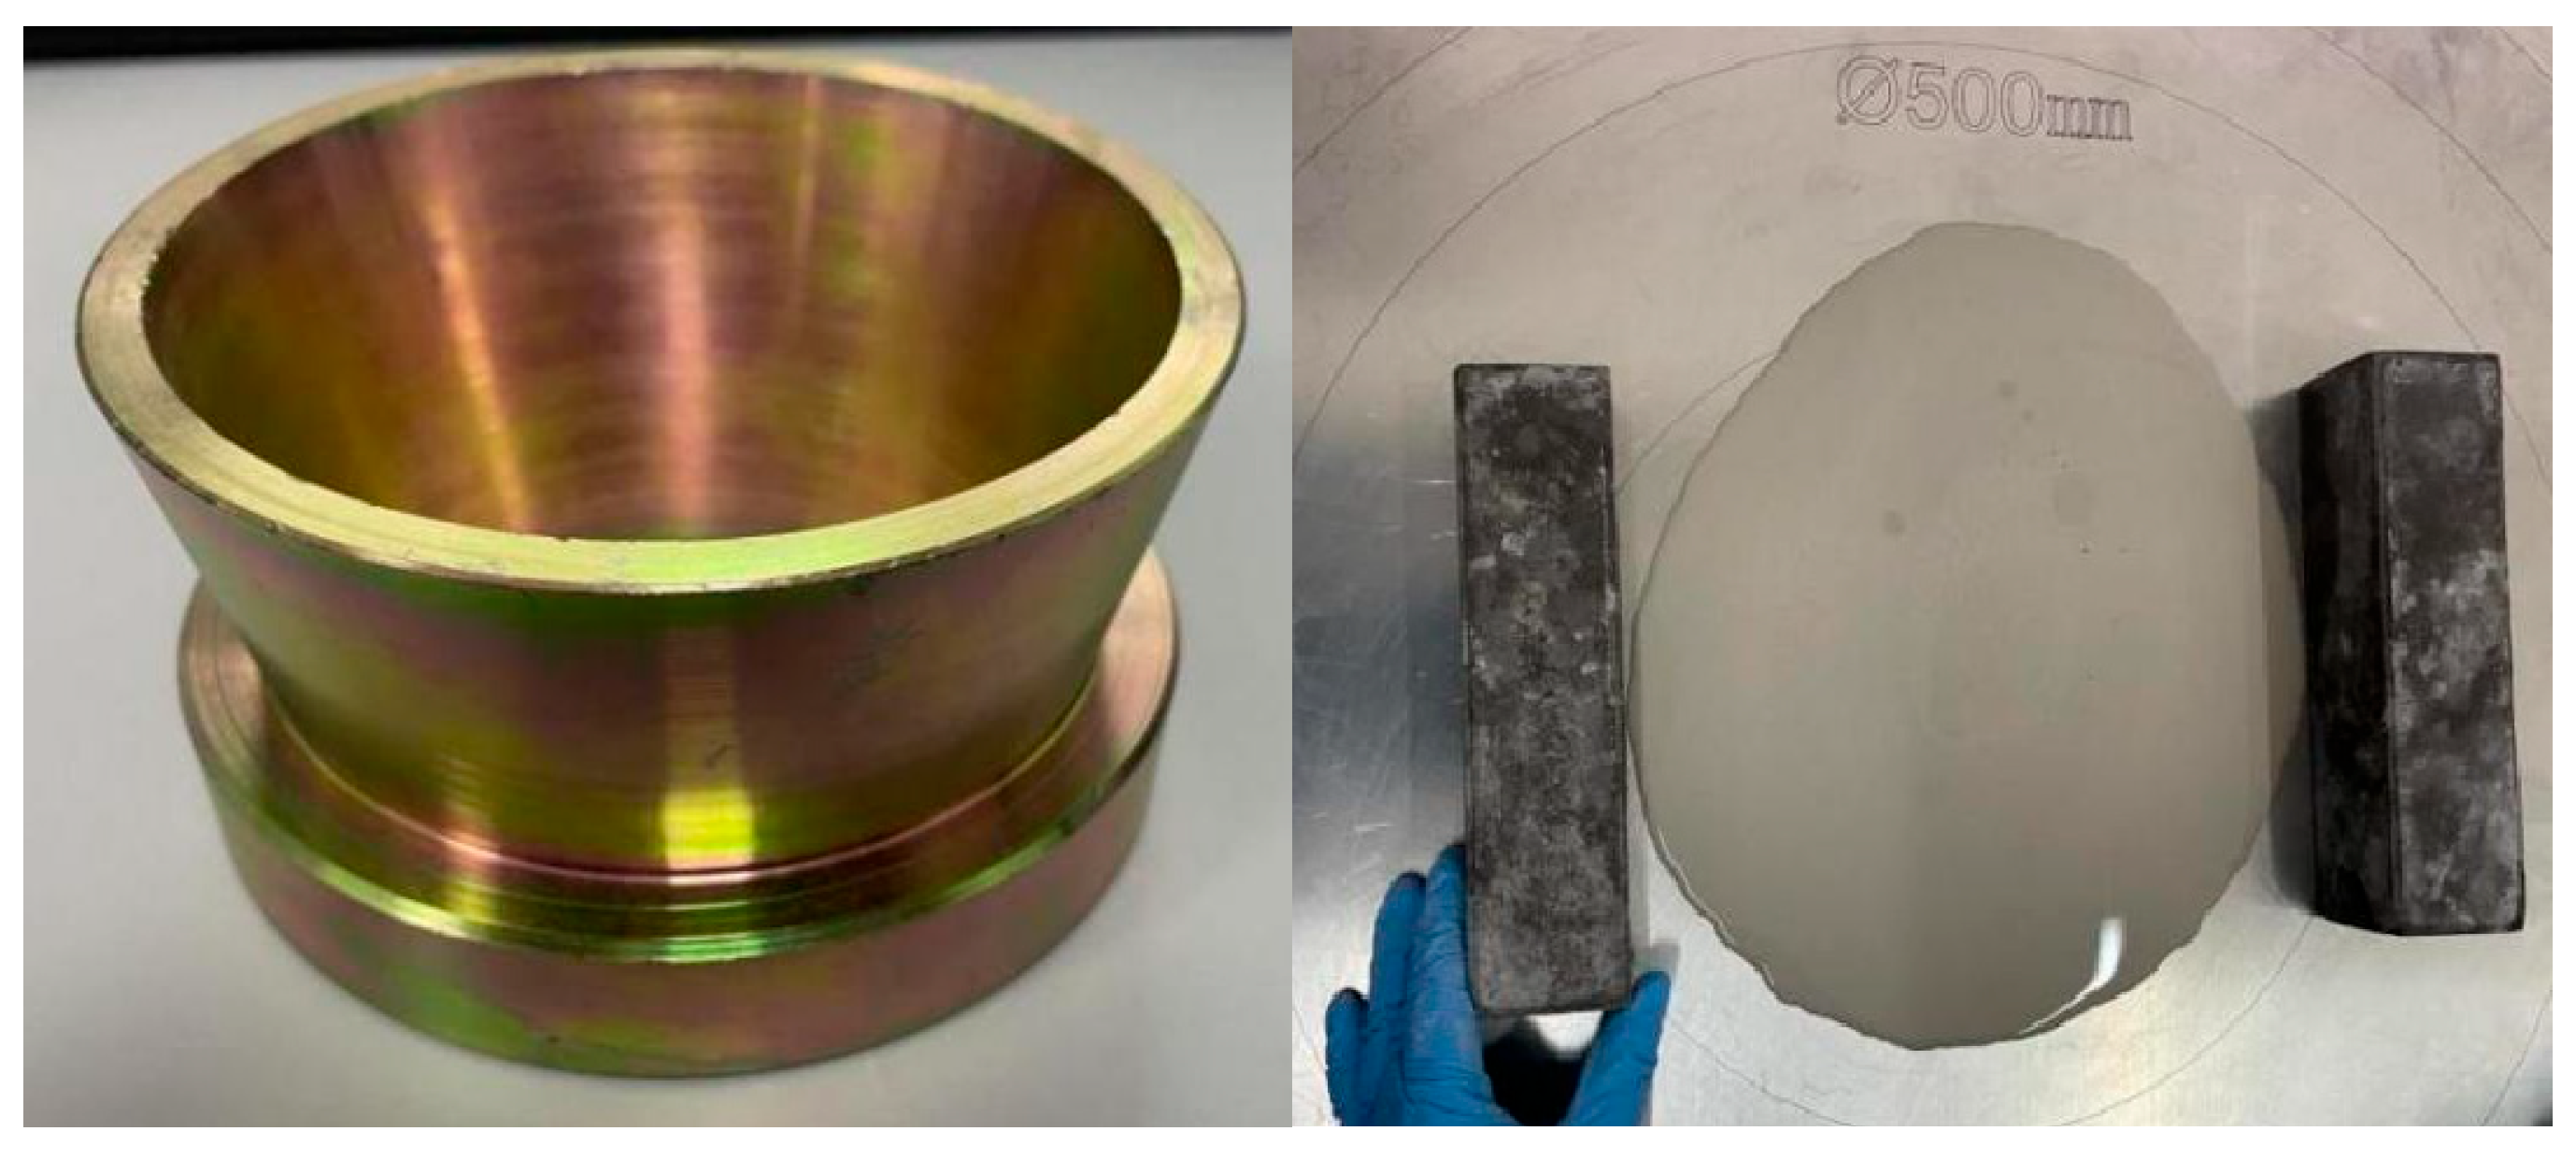
3.1. Test Raw Materials
3.2. Experimental Design
3.2.1. Single Factor Experimental Design
3.2.2. Multi-Factor Experimental Design
4. Test Methods
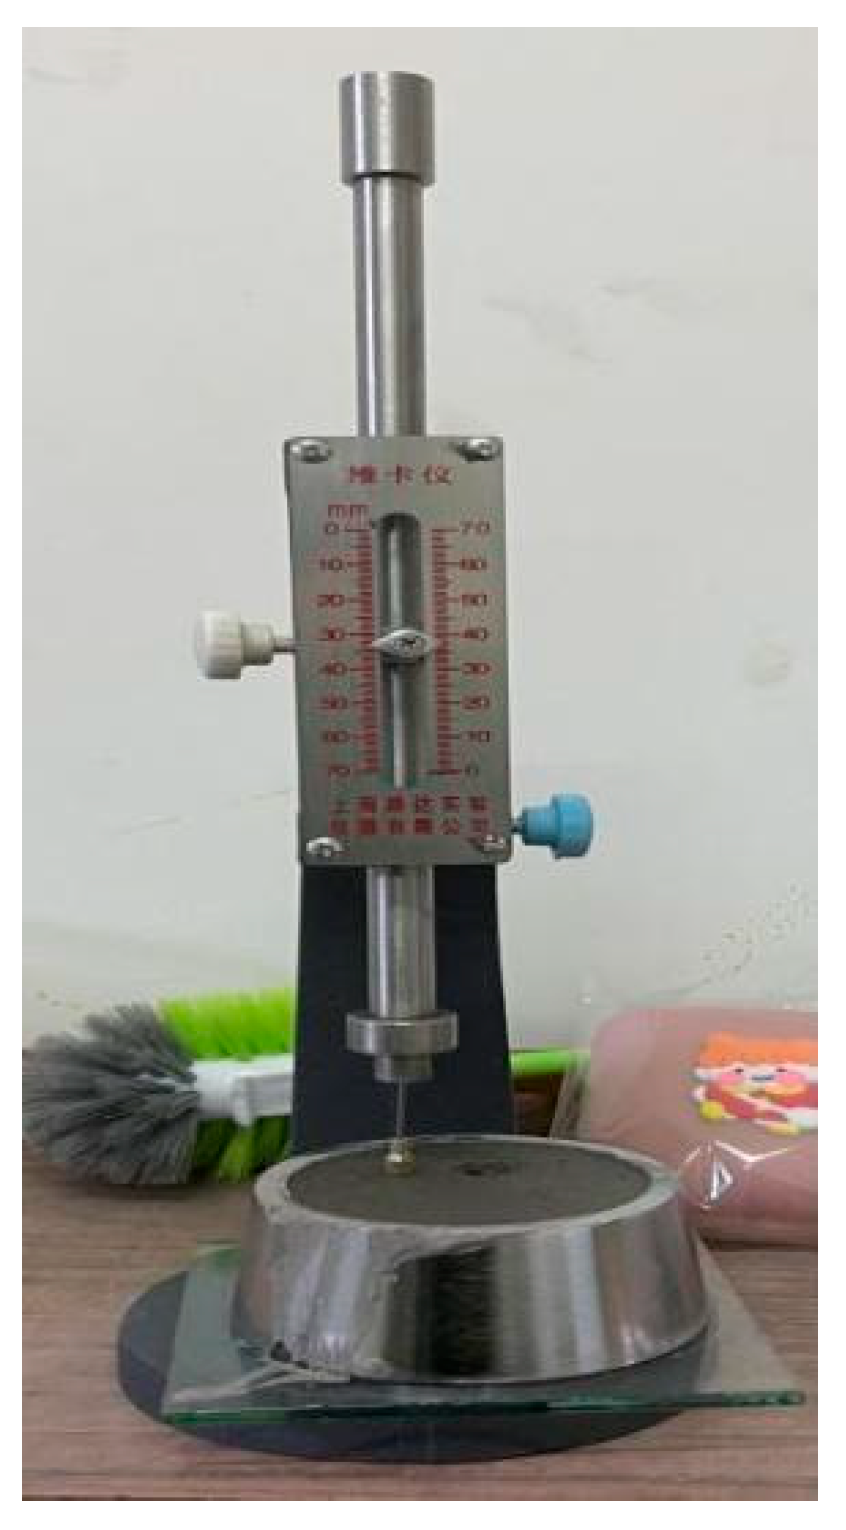
4.1. Fluidity Measurement
4.2. Setting Time Test
4.3. Anti-Dispersion Performance Measurement
- (1)
- Suspended matter contentThe test sample was added into the Buchner funnel with a constant amount of filter paper, and the filter paper was dried at a certain temperature under vacuum filtration until it reached a constant weight. The mass change of the filter paper before and after filtration was measured, and the content of suspended matter in a certain volume of water was calculated.
- (2)
- pHA certain amount of underwater undispersed slurry was added to the water, and after a period of time, a certain amount of water sample was taken from the surface and the pH value of the water sample was measured with an acidity meter.
- (3)
- Instruments and equipmentDuring the test, the following instruments and equipment should be selected:
- (a)
- Acidometer;
- (b)
- Glass electrode or calomel electrode;
- (c)
- Constant temperature drying drum wind heat box;
- (d)
- Dryer: φ200 mm;
- (e)
- Surface plate: φ70 mm;
- (f)
- Volumetric cylinder: 200 mL, 500 mL;
- (g)
- Beaker: 1000 mL;
- (h)
- Tweezers;
- (i)
- Glass pipette;
- (j)
- Balance: range 1 kg~2 kg; division value 0.1 g; range 100 g~200 g; division value 0.0001 g;
- (k)
- Chute and scraper;
- (l)
- Filter paper: glass fiber filter paper; pore size 1 μm; diameter 25 mm~50 mm;
- (m)
- Buchner funnel;
- (n)
- Filter bottle: 1000 mL;
- (o)
- Vacuum pump.
- (4)
- Test steps
- (1)
- Sample preparation should be carried out according to the following steps:
- (a)
- Take about 2000 g of representative samples from the freshly mixed undispersed concrete mixture;
- (b)
- Add 800 mL distilled water or deionized water 20 °C ± 2 °C to a 1000 mL beaker;
- (c)
- Weigh 500 g from the representative sample and put it into the chute and divide it into 10 equal parts; then use the scraper to slowly drop each sample from close to the water surface of the beaker, and all samples fall in 20 s~30 s;
- (d)
- After standing for 3 min, use a glass pipette to gently draw 600 mL of water from the surface of the beaker within 1 min (note that the water should not be stirred), and take 200 mL of water for the sample to determine pH value, and the rest for the sample to determine the content of suspension.
- (2)
- The determination of suspended matter content shall be carried out according to the following steps:
- (a)
- Use tweezers to pick up the filter paper and place it on a pre-weighed surface dish. Transfer it to an oven and dry at 105 °C to 110 °C for 1 h. Remove and place in a desiccator to cool to room temperature, then weigh. Repeat the drying, cooling, and weighing process until the difference between two consecutive weighings is no more than 0.2 mg. The final weight recorded at this point is denoted as m1.
- (b)
- Place the filter paper of constant weight correctly on the Buchner funnel and ensure it is tightly sealed. Wipe the filter paper with distilled water or deionized water and continuously suction to make it adhere firmly to the Buchner funnel; insert the long neck of the funnel into the rubber stopper of a suction flask that has been pre-drilled, and connect the suction flask to a vacuum pump.
- (c)
- Take 300 mL~400 mL of the well mixed sample with a measuring cylinder, and take the volume at this time as V. Add it to the funnel for vacuum filtration, and rinse the suspension attached to the wall of the measuring cylinder with distilled water or deionized water to make all the water pass through the filter paper.
- (d)
- Carefully remove the filter paper from the funnel with tweezers and place it on a weighing dish of the same constant weight. Transfer it to an oven and dry at 105 °C to 110 °C for 2 h. Remove it and place it in a desiccator to cool to room temperature, then weigh it. Repeat the drying, cooling, and weighing process until the difference between two consecutive weighings does not exceed 0.4 mg. The mass recorded at this point is denoted as m2.
- (3)
- The determination of pH value shall comply with the provisions of GB/T6920.
- (5)
- Treatment of test results
- (1)
- Suspended content is calculated according to Formula (1):In the formula:
- S—Suspended matter content, unit of milligram per liter (mg/L);
- m2—The mass of filter paper and surface dish containing suspensions, in mg (mg);
- m1—The mass of filter paper and surface dish, in mg;
- V—The volume of the sample measured by the cylinder, in milliliters (mL).
The integer value of the calculation result is taken, and the average value of the two calculation values is taken as the test result. - (2)
- The pH value is expressed by the decimal point after one place read by the acidity meter, and the average of the two measured values is taken as the test result.
4.4. Compressive Strength Test
- (1)
- Test procedure
- Rc—Compressive strength, unit of megapascal (MPa);
- Fc—Maximum load during the destruction, unit of Newton (N);
- A—Pressure area, unit of square millimeters (mm2).
- (2)
- Test results
5. Influence of Single Factor on Slurry Performance
5.1. Influence of Single Factor on Slurry Flow
- (1)
- (2)
- (3)
- (1)
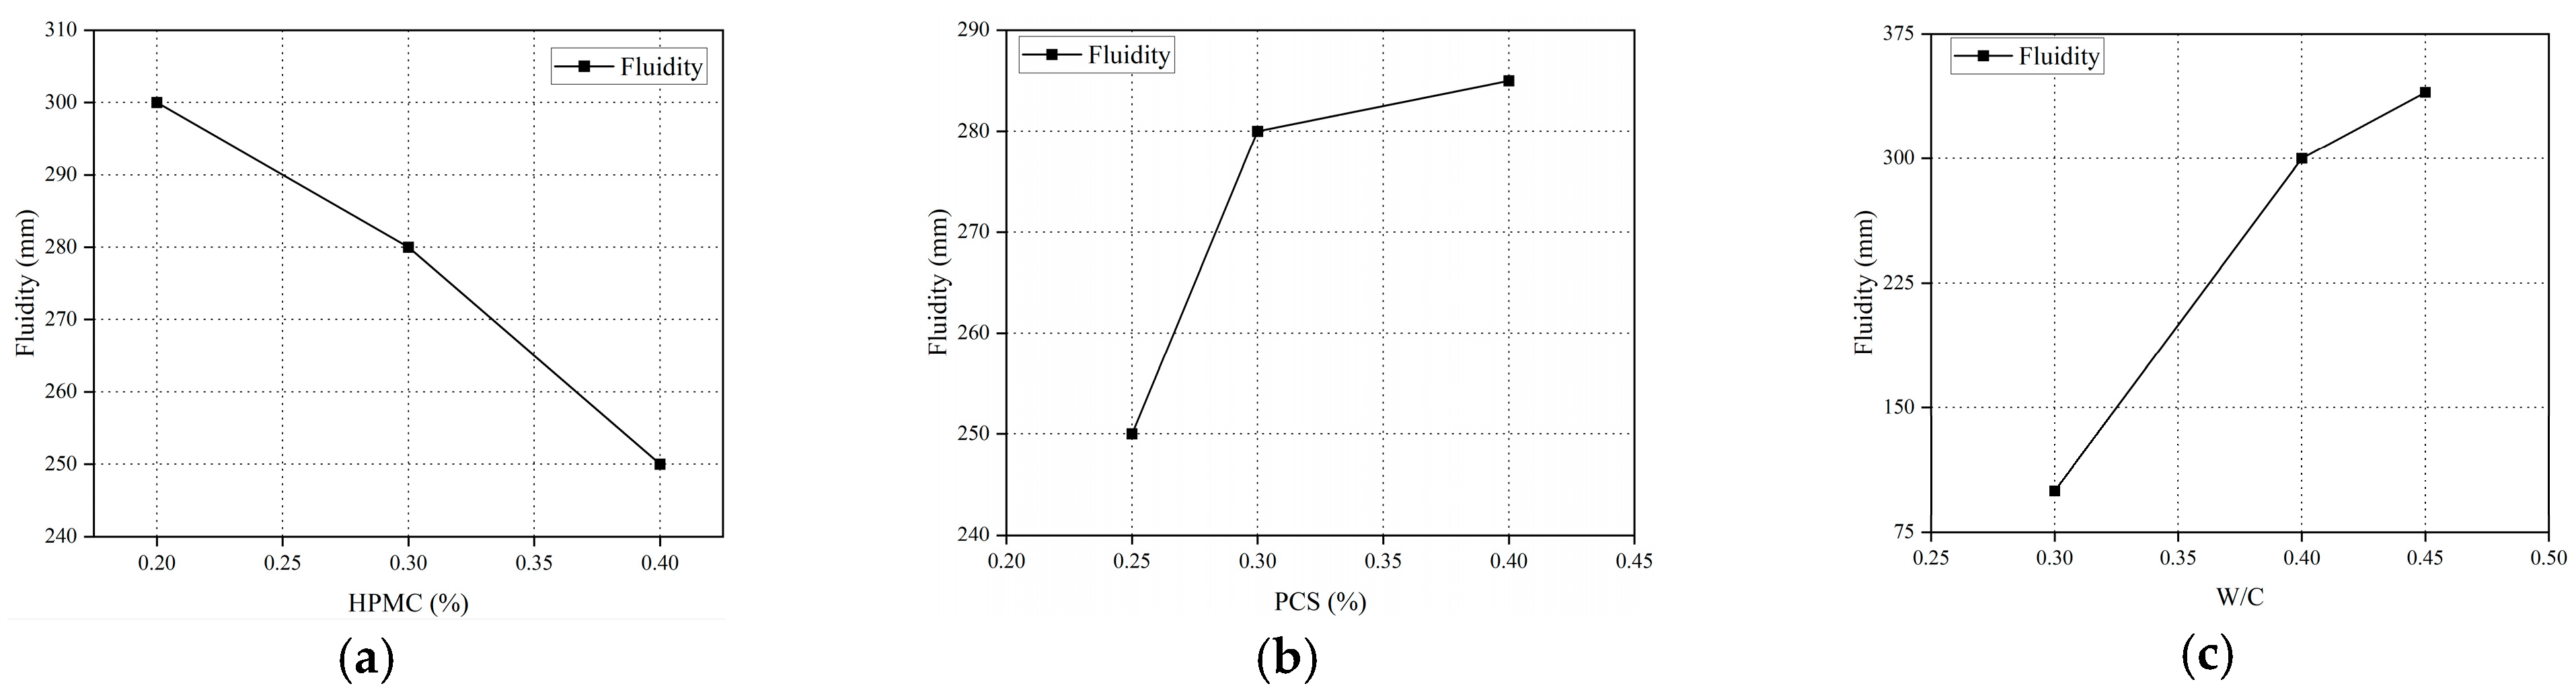
- When the dosage of hydroxypropyl methylcellulose (HPMC) increases from 0.2% to 0.4%, the slurry fluidity decreases from 300 mm to 250 mm (a 16.7% reduction). This phenomenon is attributed to the steric hindrance effect of HPMC molecular chains and the increased dynamic viscosity. HPMC significantly enhances the yield stress (τ0) and plastic viscosity (μ) of the slurry by forming a three-dimensional network structure [16,17], which aligns with the modified Bingham model: τ = τ0 + μγ. When the HPMC dosage exceeds 0.3%, the crosslinking density of the network approaches saturation, leading to a slower decline in fluidity (the reduction rate decreases from 10.7% to 6.7% between 0.3% and 0.4%), indicating a critical dosage threshold for its thickening effect.
- (2)
- Increasing the polycarboxylate superplasticizer (PCS) dosage from 0.25% to 0.4% raises the fluidity from 250 mm to 285 mm (a 14% increase). However, the growth rate plummets to 1.79% in the 0.3–0.4% range (Figure 5b). PCS disperses cement particles via electrostatic repulsion and steric hindrance effects, but its efficacy reaches a saturation point (~0.3%). Beyond this threshold, the Zeta potential stabilizes, and dispersion efficiency ceases to improve significantly. Excessive PCS may also increase the bleeding rate, counteracting fluidity retention.
- (3)
- Raising the water–cement ratio (W/C) from 0.3 to 0.45 causes fluidity to surge from 100 mm to 340 mm (240% increase), demonstrating sensitivity far exceeding HPMC and PCS. Higher W/C directly reduces slurry viscosity (μ) and yield stress (τ0), while diluting interparticle friction. However, at W/C > 0.4, suspended solids content spikes, indicating that excess free water compromises slurry stability, necessitating a trade-off between fluidity and anti-dispersion performance.

| ID | SAC/% | PO/% | SG/% | HPMC/% | PCS/% | Water–Cement Ratio | Fluidity /mm |
|---|---|---|---|---|---|---|---|
| H1-P1-W2 | 70 | 30 | 0.1 | 0.2 | 0.25 | 0.4 | 300 |
| H2-P1-W2 | 70 | 30 | 0.1 | 0.3 | 0.25 | 0.4 | 280 |
| H3-P1-W2 | 70 | 30 | 0.1 | 0.4 | 0.25 | 0.4 | 250 |
| ID | SAC/% | PO/% | SG/% | HPMC/% | PCS/% | Water–Cement Ratio | Fluidity /mm |
|---|---|---|---|---|---|---|---|
| H3-P1-W2 | 70 | 30 | 0.1 | 0.4 | 0.25 | 0.4 | 250 |
| H3-P2-W2 | 70 | 30 | 0.1 | 0.4 | 0.3 | 0.4 | 280 |
| H3-P3-W2 | 70 | 30 | 0.1 | 0.4 | 0.4 | 0.4 | 285 |
| ID | SAC/% | PO/% | SG/% | HPMC/% | PCS/% | Water–Cement Ratio | Fluidity /mm |
|---|---|---|---|---|---|---|---|
| H1-P3-W1 | 70 | 30 | 0.1 | 0.2 | 0.4 | 0.3 | 100 |
| H1-P3-W2 | 70 | 30 | 0.1 | 0.2 | 0.4 | 0.4 | 300 |
| H1-P3-W3 | 70 | 30 | 0.1 | 0.2 | 0.4 | 0.45 | 340 |
5.2. Influence of Single Factor on Slurry Setting Time
- (1)
- (2)
- (3)
| ID | SAC/% | PO/% | SG/% | HPMC/% | PCS/% | Water–Cement Ratio | Initial Setting Time /min | Final Setting Time /min |
|---|---|---|---|---|---|---|---|---|
| H 0-P1-W2 | 70 | 30 | 0.1 | 0 | 0.25 | 0.4 | 38 | 55 |
| H1-P1-W2 | 70 | 30 | 0.1 | 0.2 | 0.25 | 0.4 | 55 | 65 |
| H2-P1-W2 | 70 | 30 | 0.1 | 0.3 | 0.25 | 0.4 | 6 0 | 70 |
| H3-P1-W2 | 70 | 30 | 0.1 | 0.4 | 0.25 | 0.4 | 65 | 75 |
| ID | SAC/% | PO/% | SG/% | HPMC/% | PCS/% | Water–Cement Ratio | Initial Setting Time /min | Final Setting Time /min |
|---|---|---|---|---|---|---|---|---|
| H3-P1-W2 | 70 | 30 | 0.1 | 0.4 | 0.25 | 0.4 | 63 | 73 |
| H3-P2-W2 | 70 | 30 | 0.1 | 0.4 | 0.3 | 0.4 | 65 | 75 |
| H3-P3-W2 | 70 | 30 | 0.1 | 0.4 | 0.4 | 0.4 | 68 | 78 |
| ID | SAC/% | PO/% | SG/% | HPMC/% | PCS/% | Water–Cement Ratio | Initial Setting Time /min | Final Setting Time /min |
|---|---|---|---|---|---|---|---|---|
| H1-P3-W1 | 70 | 30 | 0.1 | 0.2 | 0.4 | 0.3 | 40 | 50 |
| H1-P3-W2 | 70 | 30 | 0.1 | 0.2 | 0.4 | 0.4 | 60 | 70 |
| H1-P3-W3 | 70 | 30 | 0.1 | 0.2 | 0.4 | 0.45 | 65 | 75 |
- (1)
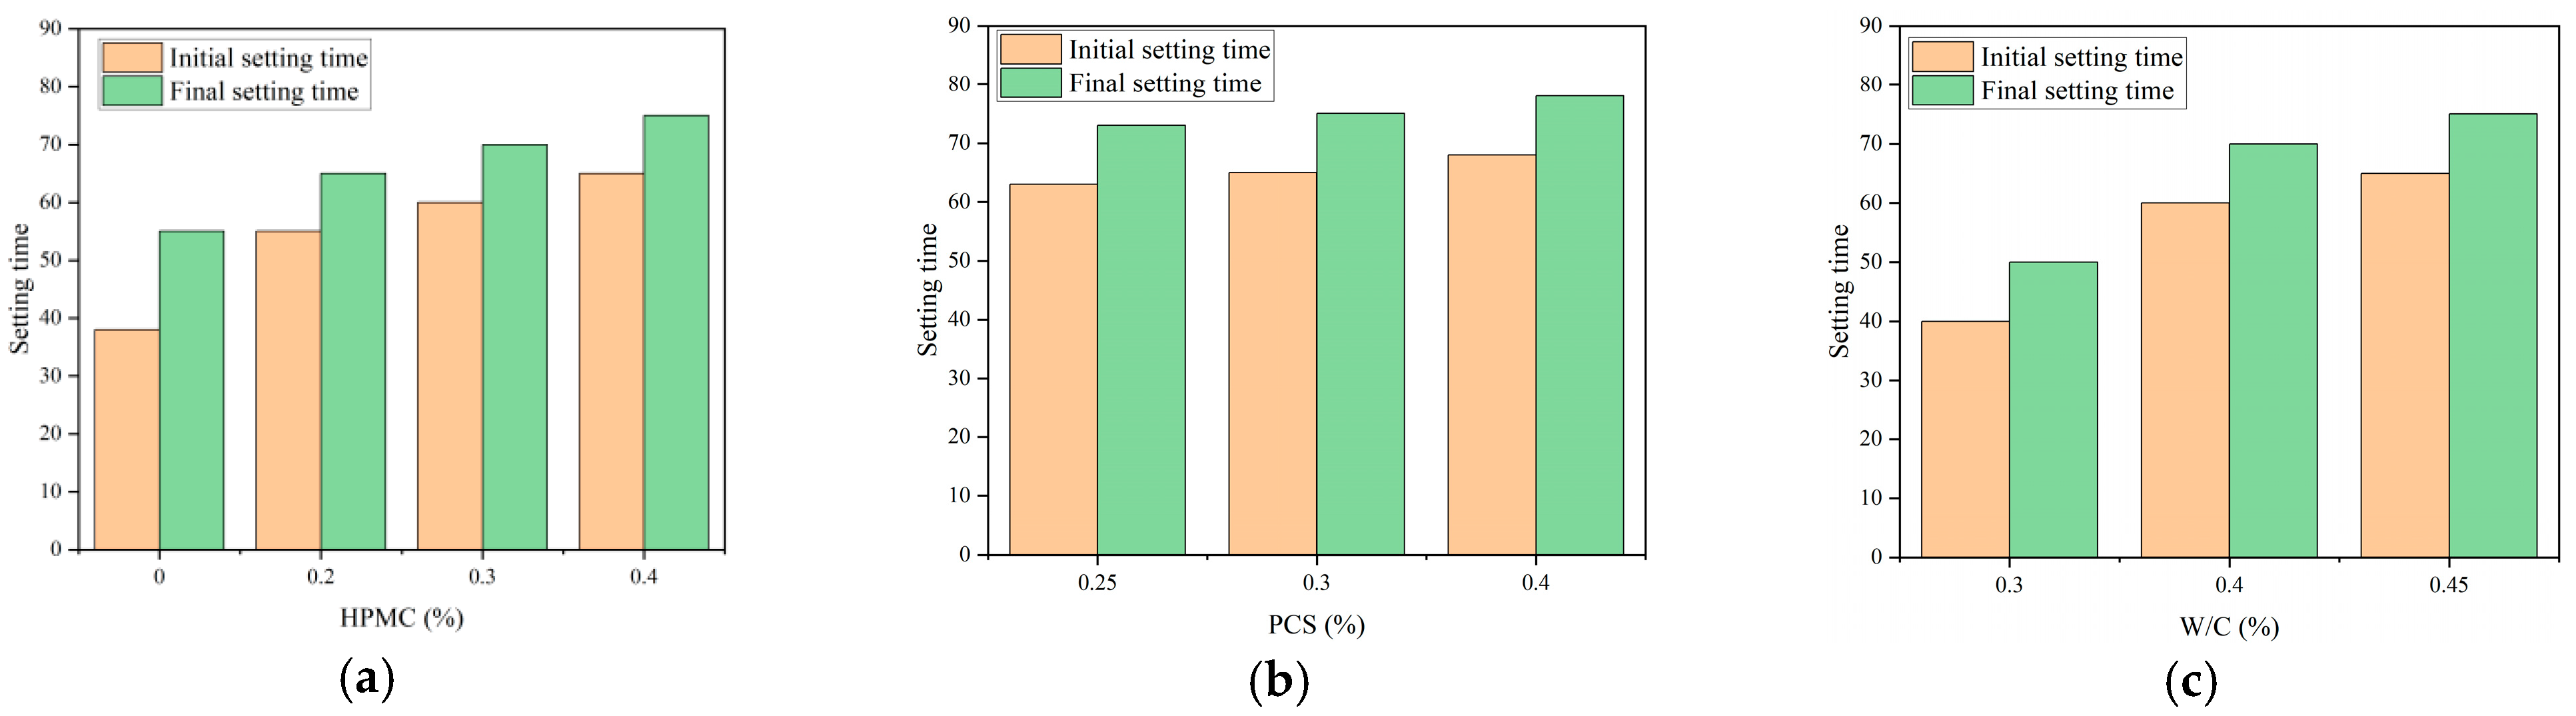
- The amount of HPMC increased from 0 to 0.4%, the initial setting time increased from 38 min to 65 min (71%), and the final setting time increased from 55 min to 75 min (36%). The mechanism of its slow setting is as follows:
- (1)
- Molecular adsorption and hydration inhibition of HPMC
HPMC is a hydrophilic cellulose ether whose hydroxyl groups (-OH) and ether bonds (-O-) on the molecular chain can be tightly attached to the surface of cement particles through hydrogen bonding and electrostatic adsorption. This adsorption behavior forms a dynamic steric barrier film that directly obstructs cement minerals (such as C3A, C3S). The contact with water delays the initial exothermic peak of hydration reaction, resulting in a prolonged induction period, which was manifested by the synchronous increase in initial and final setting times.- (2)
- Control of pore fluid viscosity and restriction of water molecule migration
The dissolution of HPMC significantly increases the dynamic viscosity of the slurry pore solution (the viscosity increases by about four times at a concentration of 0.4%). The high-viscosity environment limits the free diffusion rate of water molecules (Fick’s law), reducing the nucleation and growth rates of hydration products (such as C-S-H gel and calcium sulfoaluminate). Additionally, the water-retaining effect of HPMC reduces local dehydration caused by water evaporation, further delaying the densification process of the gel network.- (3)
- Chelating effect of calcium ion (Ca2⁺)
The ether bond and hydroxyl group of HPMC can chelate with Ca2⁺ released during hydration to form a stable HPMC-Ca2⁺ complex. This chelation reduces the concentration of free Ca2⁺ in the pore fluid, inhibits the precipitation kinetics of C-S-H gel, and thus delays the setting and hardening stage.- (4)
- Concentration-dependent effect
HPMC’s regulation of setting time exhibits a nonlinear dose effect: ① low dosage (0–0.2%): the adsorption sites are not saturated, the increase in viscosity is limited, and the extension of setting time is minimal (the initial setting time increases by 15–30 min). ② High dosage (0.3–0.4%): the adsorption film completely covers the cement particles, the pore fluid viscosity approaches the critical value, and the setting time is significantly prolonged. - (2)
- When the water–cement ratio increased from 0.3 to 0.45, the initial setting time increased from 40 min to 65 min (an increase of 62.5%), and the final setting time increased from 50 min to 75 min (an increase of 50%). This phenomenon can be explained by the following mechanism:
- (1)
- Ion concentration dilution and nucleation kinetics inhibition: ① Increased water–cement ratio leads to an increase in free water content, significantly diluting the concentration of key ions in hydration reactions (Ca2+ concentration). A decrease in Ca2+ concentration directly slows down the nucleation rates of C-S-H gel and calcium ferrite (AFt). ② OH− concentration dilution:OH− acts as a catalyst for C-S-H gel precipitation, and its reduced concentration slows down the polymerization rate of silicate ions.
- (2)
- Delayed precipitation of hydration products: The formation of calcium aluminite (AFt) depends on the local supersaturation of Ca2+, Al3+ and SO42−. After the increase of water–cement ratio, the diffusion distance of these ions increases, leading to the lag of AFt nucleation.
- (3)
- The increase of water–cement ratio expands the spacing between cement particles, and the free water forms a continuous phase. Water molecules need to cross a longer path to reach the surface of unhydrated particles.
- (4)
- Reduction of nucleation sites and interfacial effects: ① An increase in water–cement ratio leads to higher dispersion of cement particles, reducing the number of particle-to-particle contact points per unit volume and weakening the nucleation driving force; ② The regulation of surface energy by increased free water reduces the interfacial energy between solid and liquid phases, which in turn increases the critical nucleation radius, further inhibiting the nucleation process.
- (5)
- Critical water–cement ratio threshold: Experimental data show that when the water–cement ratio is greater than 0.4, the increase in setting time slows down (the initial setting time increases from 50% to 16.7%). This indicates that when the free water content exceeds a certain threshold (about 0.4), the paste enters the “dilution-dominated zone,” and further increasing the water–cement ratio has a reduced impact on hydration kinetics.
- (3)
- The effect of PCS dosage on setting time is weak (the increase in initial setting time is less than 4.62%), because its main role is particle dispersion rather than hydration kinetics.
5.3. Influence of Single Factor on Slurry Anti-Dispersion Performance
- (1)
- (2)
- (3)
| ID | SAC/% | PO/% | SG/% | HPMC/% | PCS/% | Water–Cement Ratio | Suspended Matter Content g/mL | pH |
|---|---|---|---|---|---|---|---|---|
| H1-P1-W2 | 70 | 30 | 0.1 | 0.2 | 0.25 | 0.4 | 590 | 8.7 |
| H2-P1-W2 | 70 | 30 | 0.1 | 0.3 | 0.25 | 0.4 | 500 | 8.5 |
| H3-P1-W2 | 70 | 30 | 0.1 | 0.4 | 0.25 | 0.4 | 75 | 8.5 |
| ID | SAC/% | PO/% | SG/% | HPMC/% | PCS/% | Water–Cement Ratio | Suspended Matter Content g/mL | pH |
|---|---|---|---|---|---|---|---|---|
| H3-P1-W2 | 70 | 30 | 0.1 | 0.4 | 0.25 | 0.4 | 75 | 8.5 |
| H3-P2-W2 | 70 | 30 | 0.1 | 0.4 | 0.3 | 0.4 | 120 | 8.4 |
| H3-P3-W2 | 70 | 30 | 0.1 | 0.4 | 0.4 | 0.4 | 137 | 8.3 |
| ID | SAC/% | PO/% | SG/% | HPMC/% | PCS/% | Water–Cement Ratio | Suspended Matter Content g/mL | pH |
|---|---|---|---|---|---|---|---|---|
| H1-P3-W1 | 70 | 30 | 0.1 | 0.2 | 0.4 | 0.3 | 60 | 8.4 |
| H1-P3-W2 | 70 | 30 | 0.1 | 0.2 | 0.4 | 0.4 | 55 0 | 8.5 |
| H1-P3-W3 | 70 | 30 | 0.1 | 0.2 | 0.4 | 0.45 | 590 | 8.7 |
- (1)
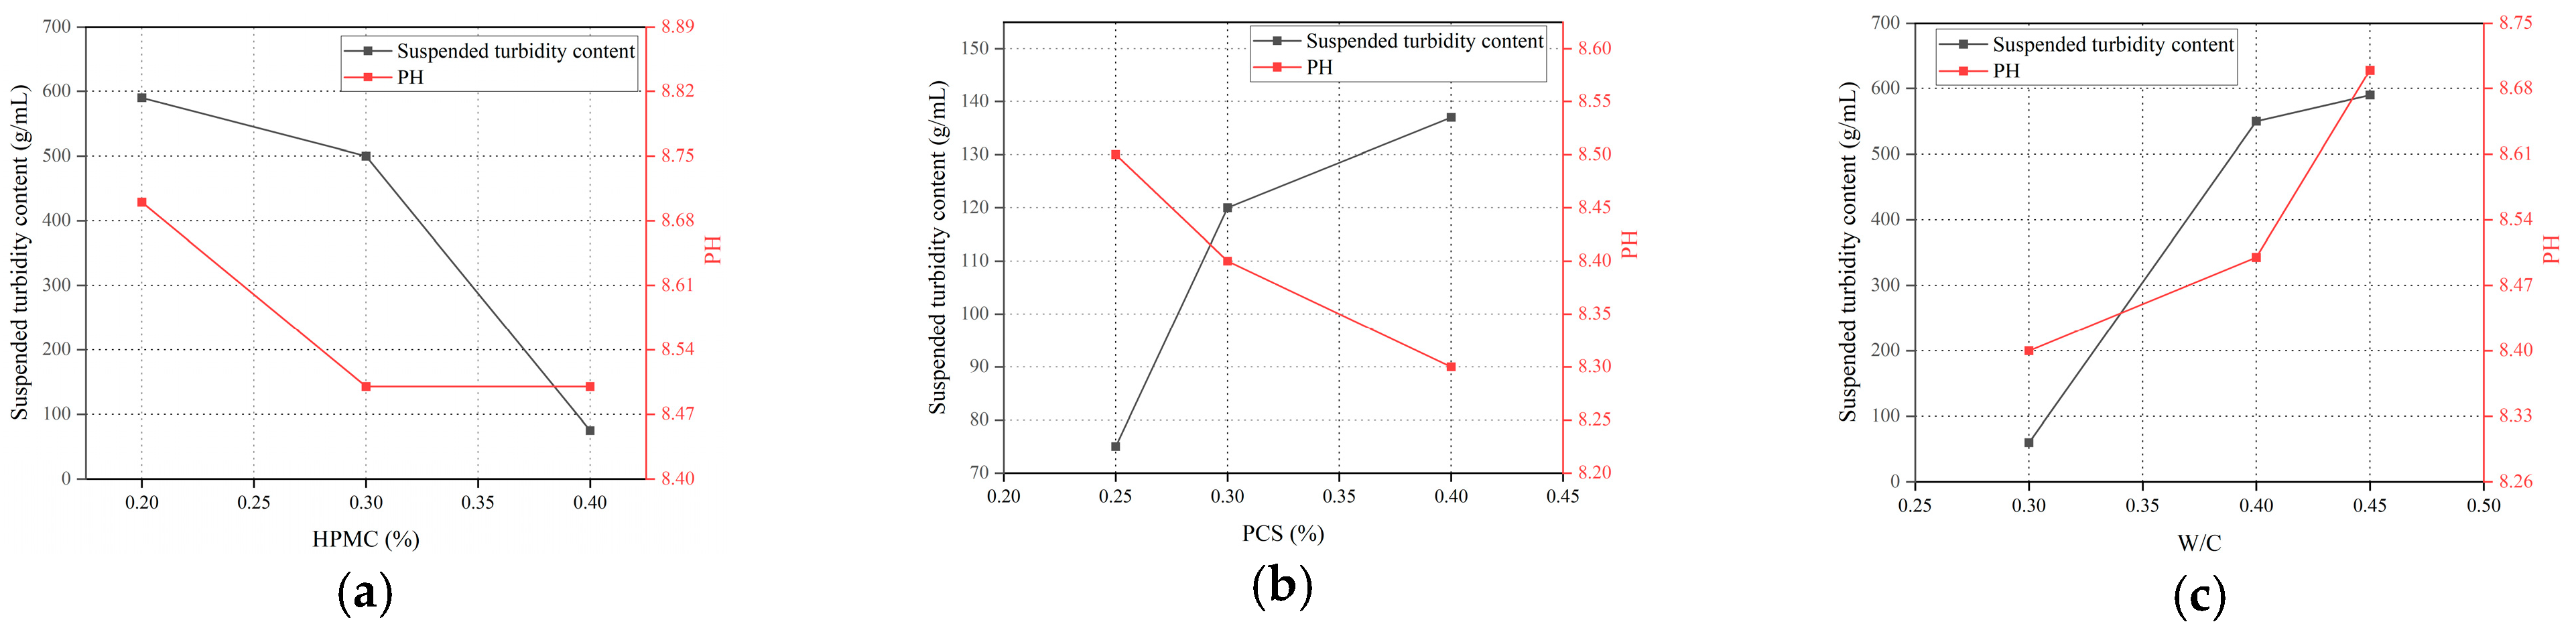
- When the HPMC content increased from 0.2% to 0.4%, the suspension content decreased sharply from 590 g/mL to 75 g/mL (a decrease of 87.3%). This phenomenon was attributed to the significant improvement of slurry stability by the three-dimensional network structure and particle-wrapping effect of HPMC molecules.
- (1)
- Viscoelastic network inhibits phase separation: HPMC molecular chains form a continuous phase matrix through hydrogen bonds and van der Waals forces to effectively restrain solid particles. When HPMC content is more than 0.3%, the network crosslinking density reaches the critical value, and the content of suspension decreases by 85%.
- (2)
- Interface regulation: HPMC is adsorbed on the surface of particles to reduce the interfacial tension between solid and liquid and inhibit particle agglomeration and sedimentation.
- (2)
- The PCS dosage increased from 0.25% to 0.4%, and the suspension content increased from 75 g/mL to 137 g/mL (an increase of 82.7%). As a polycarboxylate superplasticizer, PCS showed a threshold effect:
- (1)
- Dispersion efficiency saturation: when PCS content is more than 0.3%, the electrostatic repulsion and space hindrance effect reach saturation, and further addition leads to excessive flow of the slurry (flow from 250 mm to 285 mm), and cohesion decreases.
- (2)
- Increased risk of water drainage: excessive PCS weakens the water retention of slurry; free water carries microparticles into suspension, causing the suspension content to increase.
- (3)
- The water–cement ratio increased from 0.3 to 0.45, and the content of suspensions increased from 60 g/mL to 590 g/mL (an increase of 883%). The high water–cement ratio destroys anti-dispersibility through the following mechanisms:
- (1)
- Viscosity dilution and particle settling: the increase of water–cement ratio significantly reduces the dynamic viscosity of slurry and accelerates particle settling.
- (2)
- Flocculation structure disintegration: excessive free water increases the particle spacing, destroys the bridging action between HPMC and particles, resulting in the enrichment of suspended matter.
- (4)
- The order of influence degree of anti-dispersion performance is as follows:Water–cement ratio > HPMC dosage > PCS dosage, and each factor has a critical threshold:
- (1)
- The HPMC content is about 0.3%. When the value exceeds this value, the viscoelastic network is completely formed and the suspension content drops sharply;
- (2)
- The PCS dosage is about 0.3%, and above this value, the dispersion efficiency is saturated and the risk of water drainage is aggravated;
- (3)
- The water–cement ratio is about 0.4. If this value is exceeded, viscosity dilution dominates and anti-dispersion deteriorates sharply.
5.4. Influence of Single Factor on 2 h Compressive Strength of Slurry
- (1)
- (2)
- (3)
| ID | SAC/% | PO/% | SG/% | HPMC/% | PCS/% | Water–Cement Ratio | 2 h Compressive Strength /MPa | 1 d Compressive Strength /MPa |
|---|---|---|---|---|---|---|---|---|
| H1-P1-W2 | 70 | 30 | 0.1 | 0.2 | 0.25 | 0.4 | 10.2 | 20.9 |
| H2-P1-W2 | 70 | 30 | 0.1 | 0.3 | 0.25 | 0.4 | 9.1 | 20.5 |
| H3-P1-W2 | 70 | 30 | 0.1 | 0.4 | 0.25 | 0.4 | 9.5 | 20.3 |
| ID | SAC/% | PO/% | SG/% | HPMC/% | PCS/% | Water–Cement Ratio | 2 h Compressive Strength /MPa | 1 d Compressive Strength /MPa |
|---|---|---|---|---|---|---|---|---|
| H3-P1-W2 | 70 | 30 | 0.1 | 0.4 | 0.25 | 0.4 | 9.5 | 20.3 |
| H3-P2-W2 | 70 | 30 | 0.1 | 0.4 | 0.3 | 0.4 | 10.5 | 22.1 |
| H3-P3-W2 | 70 | 30 | 0.1 | 0.4 | 0.4 | 0.4 | 10.8 | 20.2 |
| ID | SAC/% | PO/% | SG/% | HPMC/% | PCS/% | Water–Cement Ratio | 2 h Compressive Strength /MPa | 1 d Compressive Strength /MPa |
|---|---|---|---|---|---|---|---|---|
| H1-P3-W1 | 70 | 30 | 0.1 | 0.2 | 0.4 | 0.3 | 15.5 | 21.2 |
| H1-P3-W2 | 70 | 30 | 0.1 | 0.2 | 0.4 | 0.4 | 11.9 | 20.3 |
| H1-P3-W3 | 70 | 30 | 0.1 | 0.2 | 0.4 | 0.45 | 10.1 | 19.6 |
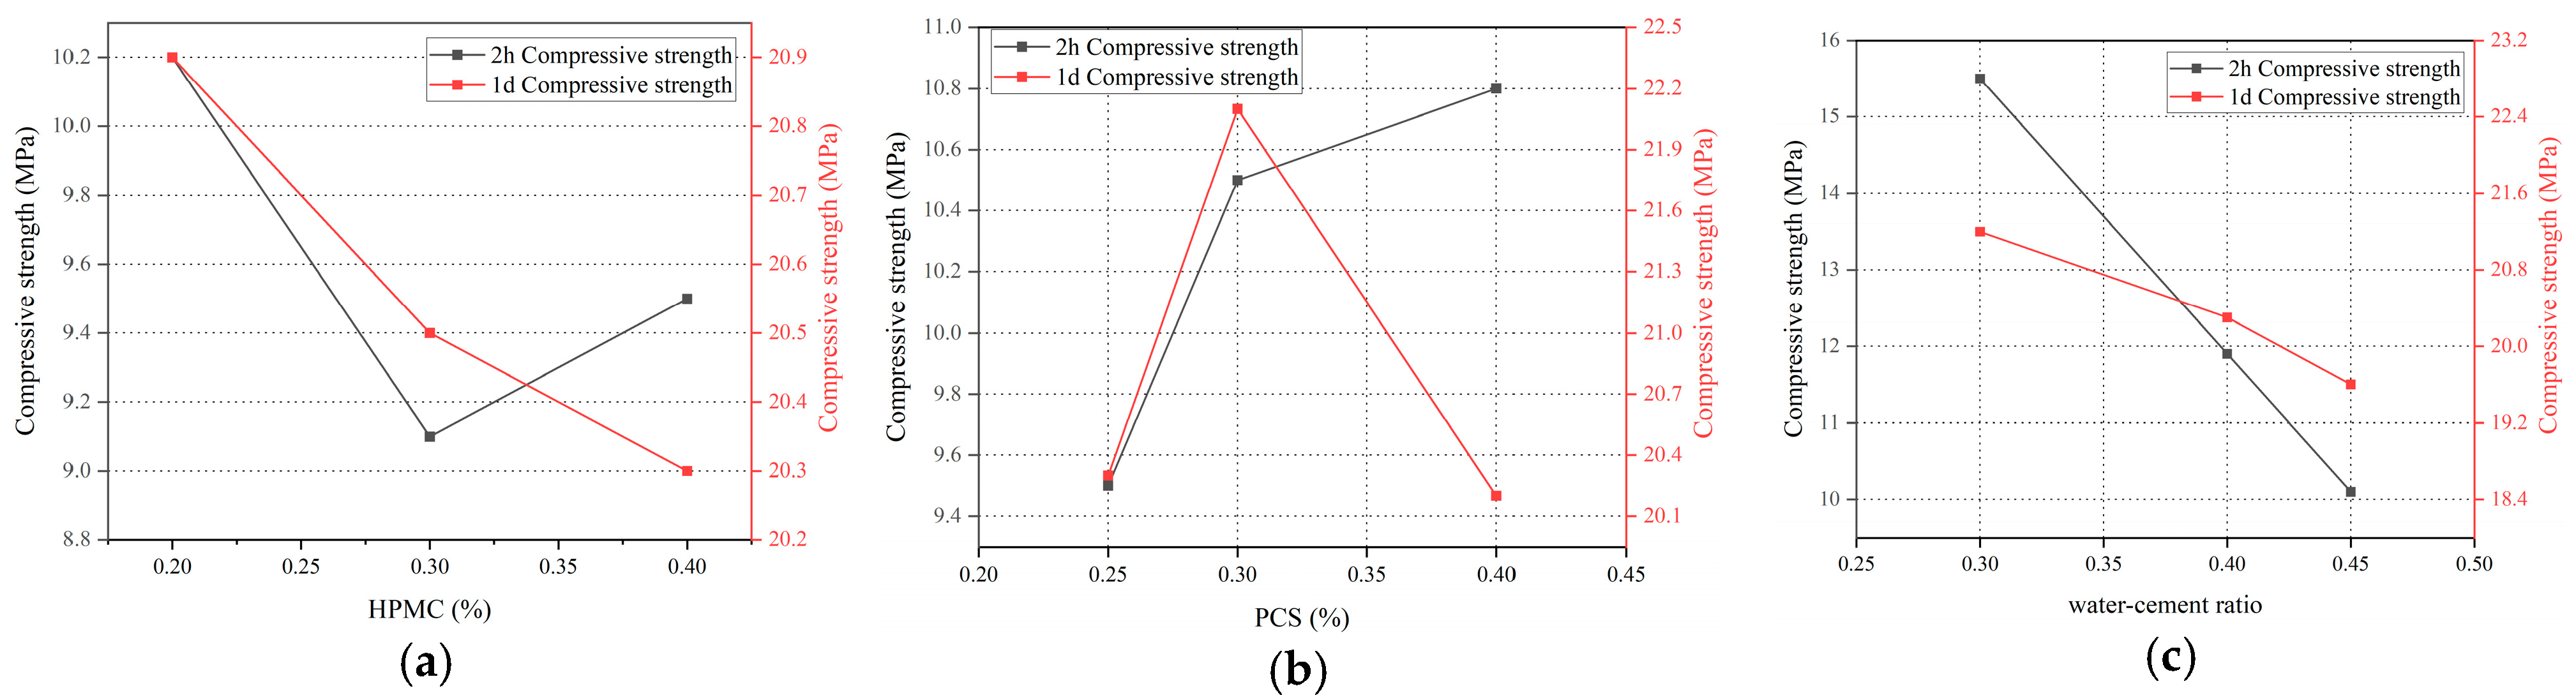
- (1)
- When the HPMC content increased from 0.2% to 0.4%, the 2 h compressive strength decreased from 10.2 MPa to 9.1 MPa and then recovered to 9.5 MPa, showing a “V-shaped” trend, while the 1 d compressive strength decreased linearly from 20.9 MPa to 20.3 MPa (a decrease of 3.0%). The mechanism is as follows:
- (1)
- Early strength inhibition: The increase of HPMC dosage leads to the increase of slurry viscosity, which hinders the contact of cement particles and the nucleation of hydration products. However, when the dosage is >0.3%, the water retention effect of HPMC promotes the local hydration reaction, which partially offsets the negative impact of viscosity.
- (2)
- Long-term strength uniformity: HPMC reduces water evaporation, improves the distribution of hydration products, and slows down the decrease of 1 d strength.
- (2)
- The PCS content was increased from 0.25% to 0.4%, and the 2 h compressive strength increased from 9.5 MPa to 10.8 MPa (an increase of 13.7%), while the 1 d strength increased from 20.3 MPa to 22.1 MPa and then decreased to 20.2 MPa. The mechanism of action was as follows:
- (1)
- Dispersed efficiency optimization: when the PCS content is less than or equal to 0.3%, electrostatic repulsion promotes close packing of particles, increasing the 2 h strength by 10.5%.
- (2)
- Increase of over-porosity: when the PCS content is greater than 0.3%, excessive dispersion leads to an increase in water yield rate of slurry, an increase in the proportion of capillary pore volume, and a decrease in 1 d strength.
- (3)
- When the water–cement ratio increased from 0.3 to 0.45, the 2 h compressive strength decreased from 15.5 MPa to 10.1 MPa (34.8% decrease), and the 1 d strength decreased from 21.2 MPa to 19.6 MPa (7.5% decrease). The strength deterioration was attributed to the following:
- (1)
- Pore structure deterioration: the increase of water–cement ratio significantly increases the total porosity and average pore size, weakening the density of the material.
- (2)
- Reduced hydration degree: excessive free water dilutes the concentration of Ca2⁺ and delays the kinetics of C-S-H gel precipitation.
- (4)
- Sensitivity ranking
- (1)
- Compressive strength (2 h): water–cement ratio > PCS dosage~HPMC dosage (the contribution of water–cement ratio is about 60%).
- (2)
- Compressive strength (1 d): water–cement ratio > PCS dosage > HPMC dosage (the contribution of water–cement ratio is about 45%).
6. Multi-Factor Sensitivity Analysis
6.1. Results of Orthogonal Test
6.2. Exploratory Data Analysis (EDA)
6.2.1. Data Distribution and Descriptive Statistics
- (1)
- The flow rate was right-skewed, and its mean (236.3 mm) was lower than the median (280 mm), indicating that high flow rate formulations (>300 mm) accounted for 37% (10/27), but the extremely high-value samples (ID3, 6, 9) were accompanied by a surge in suspension content (590 g/mL), revealing a nonlinear conflict between high flow rate and anti-dispersibility.
- (2)
- The bivariate distribution of setting time showed a strong correlation between initial setting time and final setting time (Pearson’s r = 0.92, p < 0.001), and the time difference was stable at 9.4 ± 1.2 min, but sample 21 (final setting time 75 min) and sample 26 (final setting time 78 min) exceeded the design threshold (final setting time ≤ 90 min).
- (3)
- The content of suspensions was extremely right-biased, indicating that the control of anti-dispersion was difficult.
- (4)
- The double peak distribution characteristics of compressive strength (peak 1:8.2~10 MPa, peak 2:14~21 MPa) mapped two types of material systems: high early strength type with low water–cement ratio (0.3~0.4) and conventional type with high water–cement ratio (0.5~0.6).
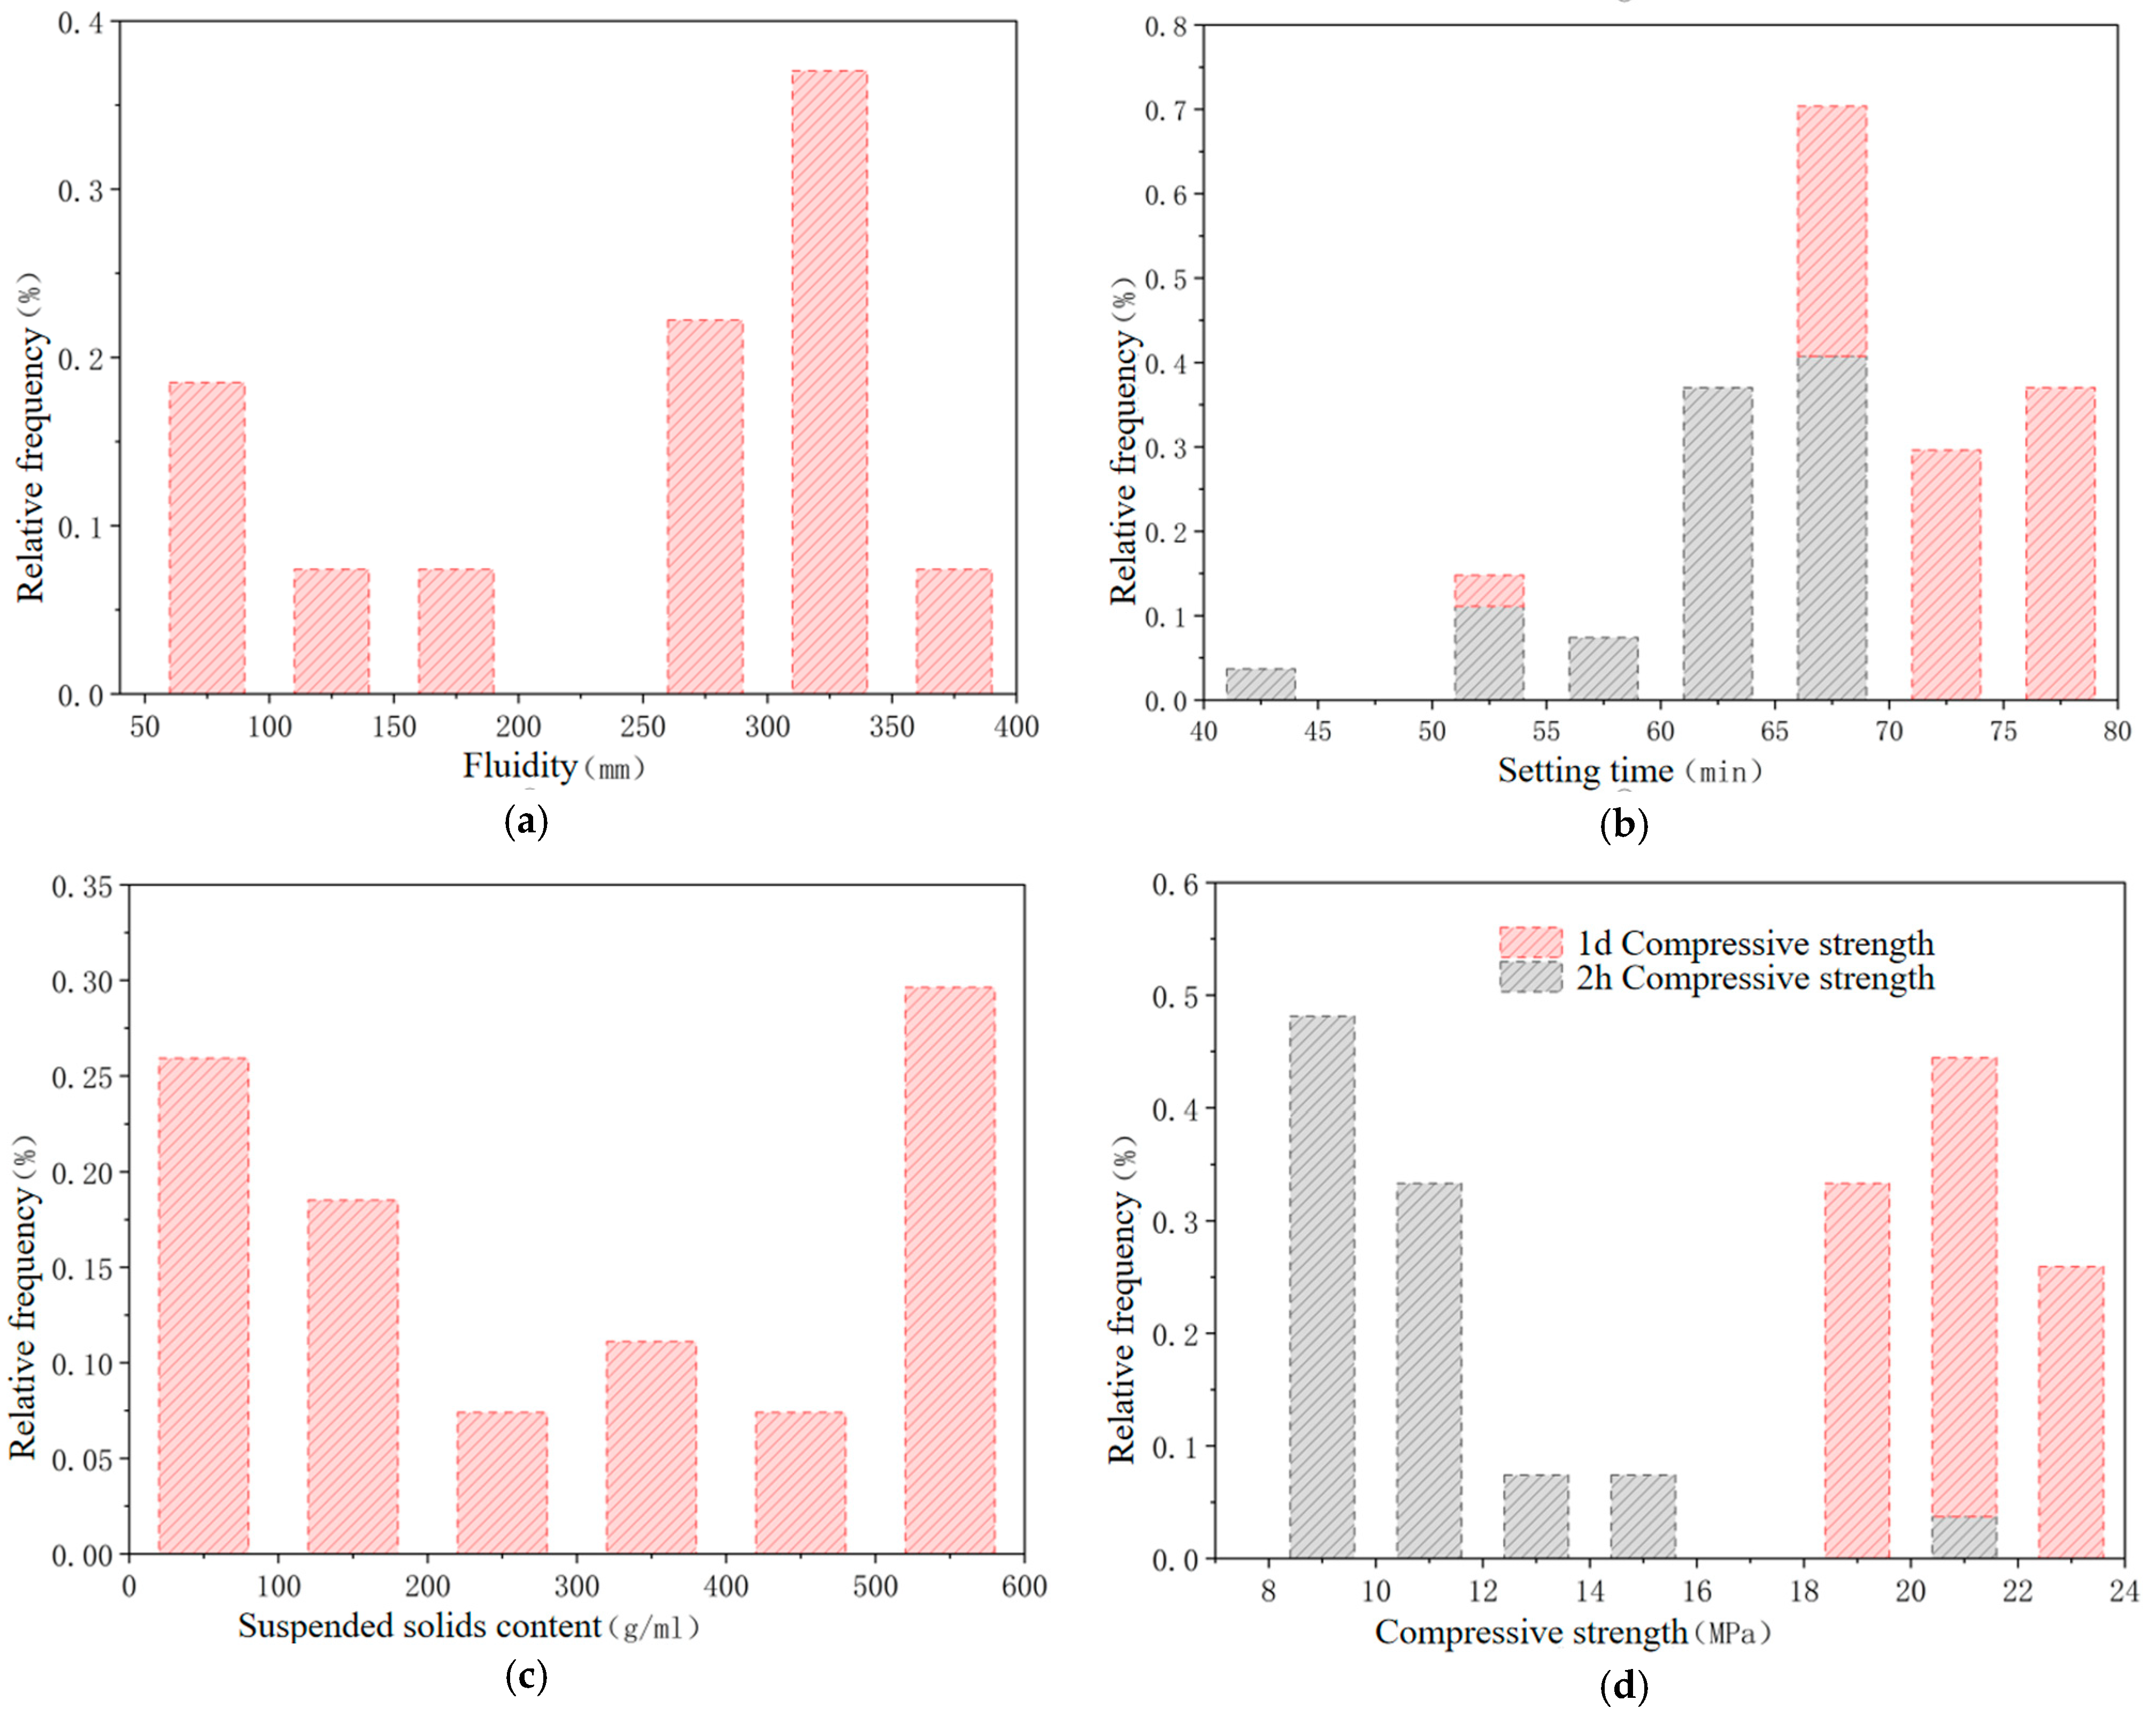
| Variable | Tote N | Mean | Standard Deviation | Sum | Least Value | Median | Crest Value |
|---|---|---|---|---|---|---|---|
| Fluidity | 27 | 236.30 | 109.65 | 6380 | 50 | 280 | 350 |
| Initial setting time | 27 | 60.0 4 | 6.42 | 1621 | 40 | 60 | 68 |
| End time | 27 | 69.85 | 5.8 8 | 1886 | 50 | 70 | 78 |
| Suspended solids content | 27 | 301.70 | 219.5 6 | 8146 | 40 | 240 | 590 |
| 2 h compressive strength | 27 | 10.71 | 2.7 7 | 289.2 | 8.2 | 10.1 | 21.1 |
| 1 d compressive strength | 27 | 20.7 6 | 1.4 8 | 560.4 | 18.5 | 20.3 | 23.5 |
6.2.2. Correlation Analysis of Key Variables
- Identification of significant correlation:
- (1)
- Very significant positive correlation (r > 0.7 and p < 0.01):Flow rate and suspended matter content (r = 0.76, p < 0.0001), initial setting time and final setting time (r = 0.92, p < 0.0001), flow rate and final setting time (r = 0.71, p < 0.0001);
- (2)
- Very significant negative correlation (r < −0.7, p < 0.01):Fluidity was related to 1 d compressive strength (r = −0.81, p < 0.0001), and initial setting time was related to 2 h compressive strength (r = −0.71, p < 0.0001)
- (3)
- Significant correlation (|r| < 0.7 and p < 0.05):Both 1 d and 2 h compressive strength (r = 0.63, p = 0.0005), suspension content and 1 d compressive strength (r = −0.60, p = 0.0009), final setting time and 2 h compressive strength (r = −0.57, p = 0.0021);
- (4)
- Not significantly related (p > 0.05):Initial setting time and suspension content (p = 0.1034), final setting time and suspension content (p = 0.0769).
- Key variable relationship analysis
- (1)
- The influence of fluidity
- (1)
- Positive correlation: The flow rate was significantly positively correlated with the content of suspensions and coagulation time (initial coagulation, final coagulation), indicating that high flow rate may lead to the extension of final coagulation time and the increase of suspensions content, and the extension of the initial coagulation time will also lead to an extension of the final coagulation time.
- (2)
- Negative correlation: The Fluidity was significantly negatively correlated with the compressive strength (2 h and 1 d), especially the compressive strength of 1 d (r = −0.81). This is because the high fluidity is due to excessive water and a loose material structure, resulting in decreased density and thus reduced strength.
- (2)
- Setting time and strength
- (1)
- The initial setting time and final setting time are negatively correlated with compressive strength (2 h and 1 d). Possible mechanism: the shorter the setting time, the faster the early hardening of the material, which is conducive to the formation of strength more quickly.
- (2)
- The negative correlation between initial setting time and 2 h strength (r = −0.71) is stronger than that between final setting time (r = −0.57), indicating that the initial setting stage has a more direct influence on early strength.
- (3)
- The double-edged sword effect of suspended matter contentThe content of suspension is positively correlated with flowability (r = 0.76), but negatively correlated with 1 d compressive strength (r = −0.60). This is because a higher suspension content improves particle dispersion and flowability, but excessive dispersion can lead to long-term strength reduction. Therefore, a balance between the two should be achieved.
- (4)
- The results of correlation analysis show that there are some potential relationships between material properties, which can be further analyzed and identified through principal component analysis for data dimension reduction and extraction of characteristic variables.

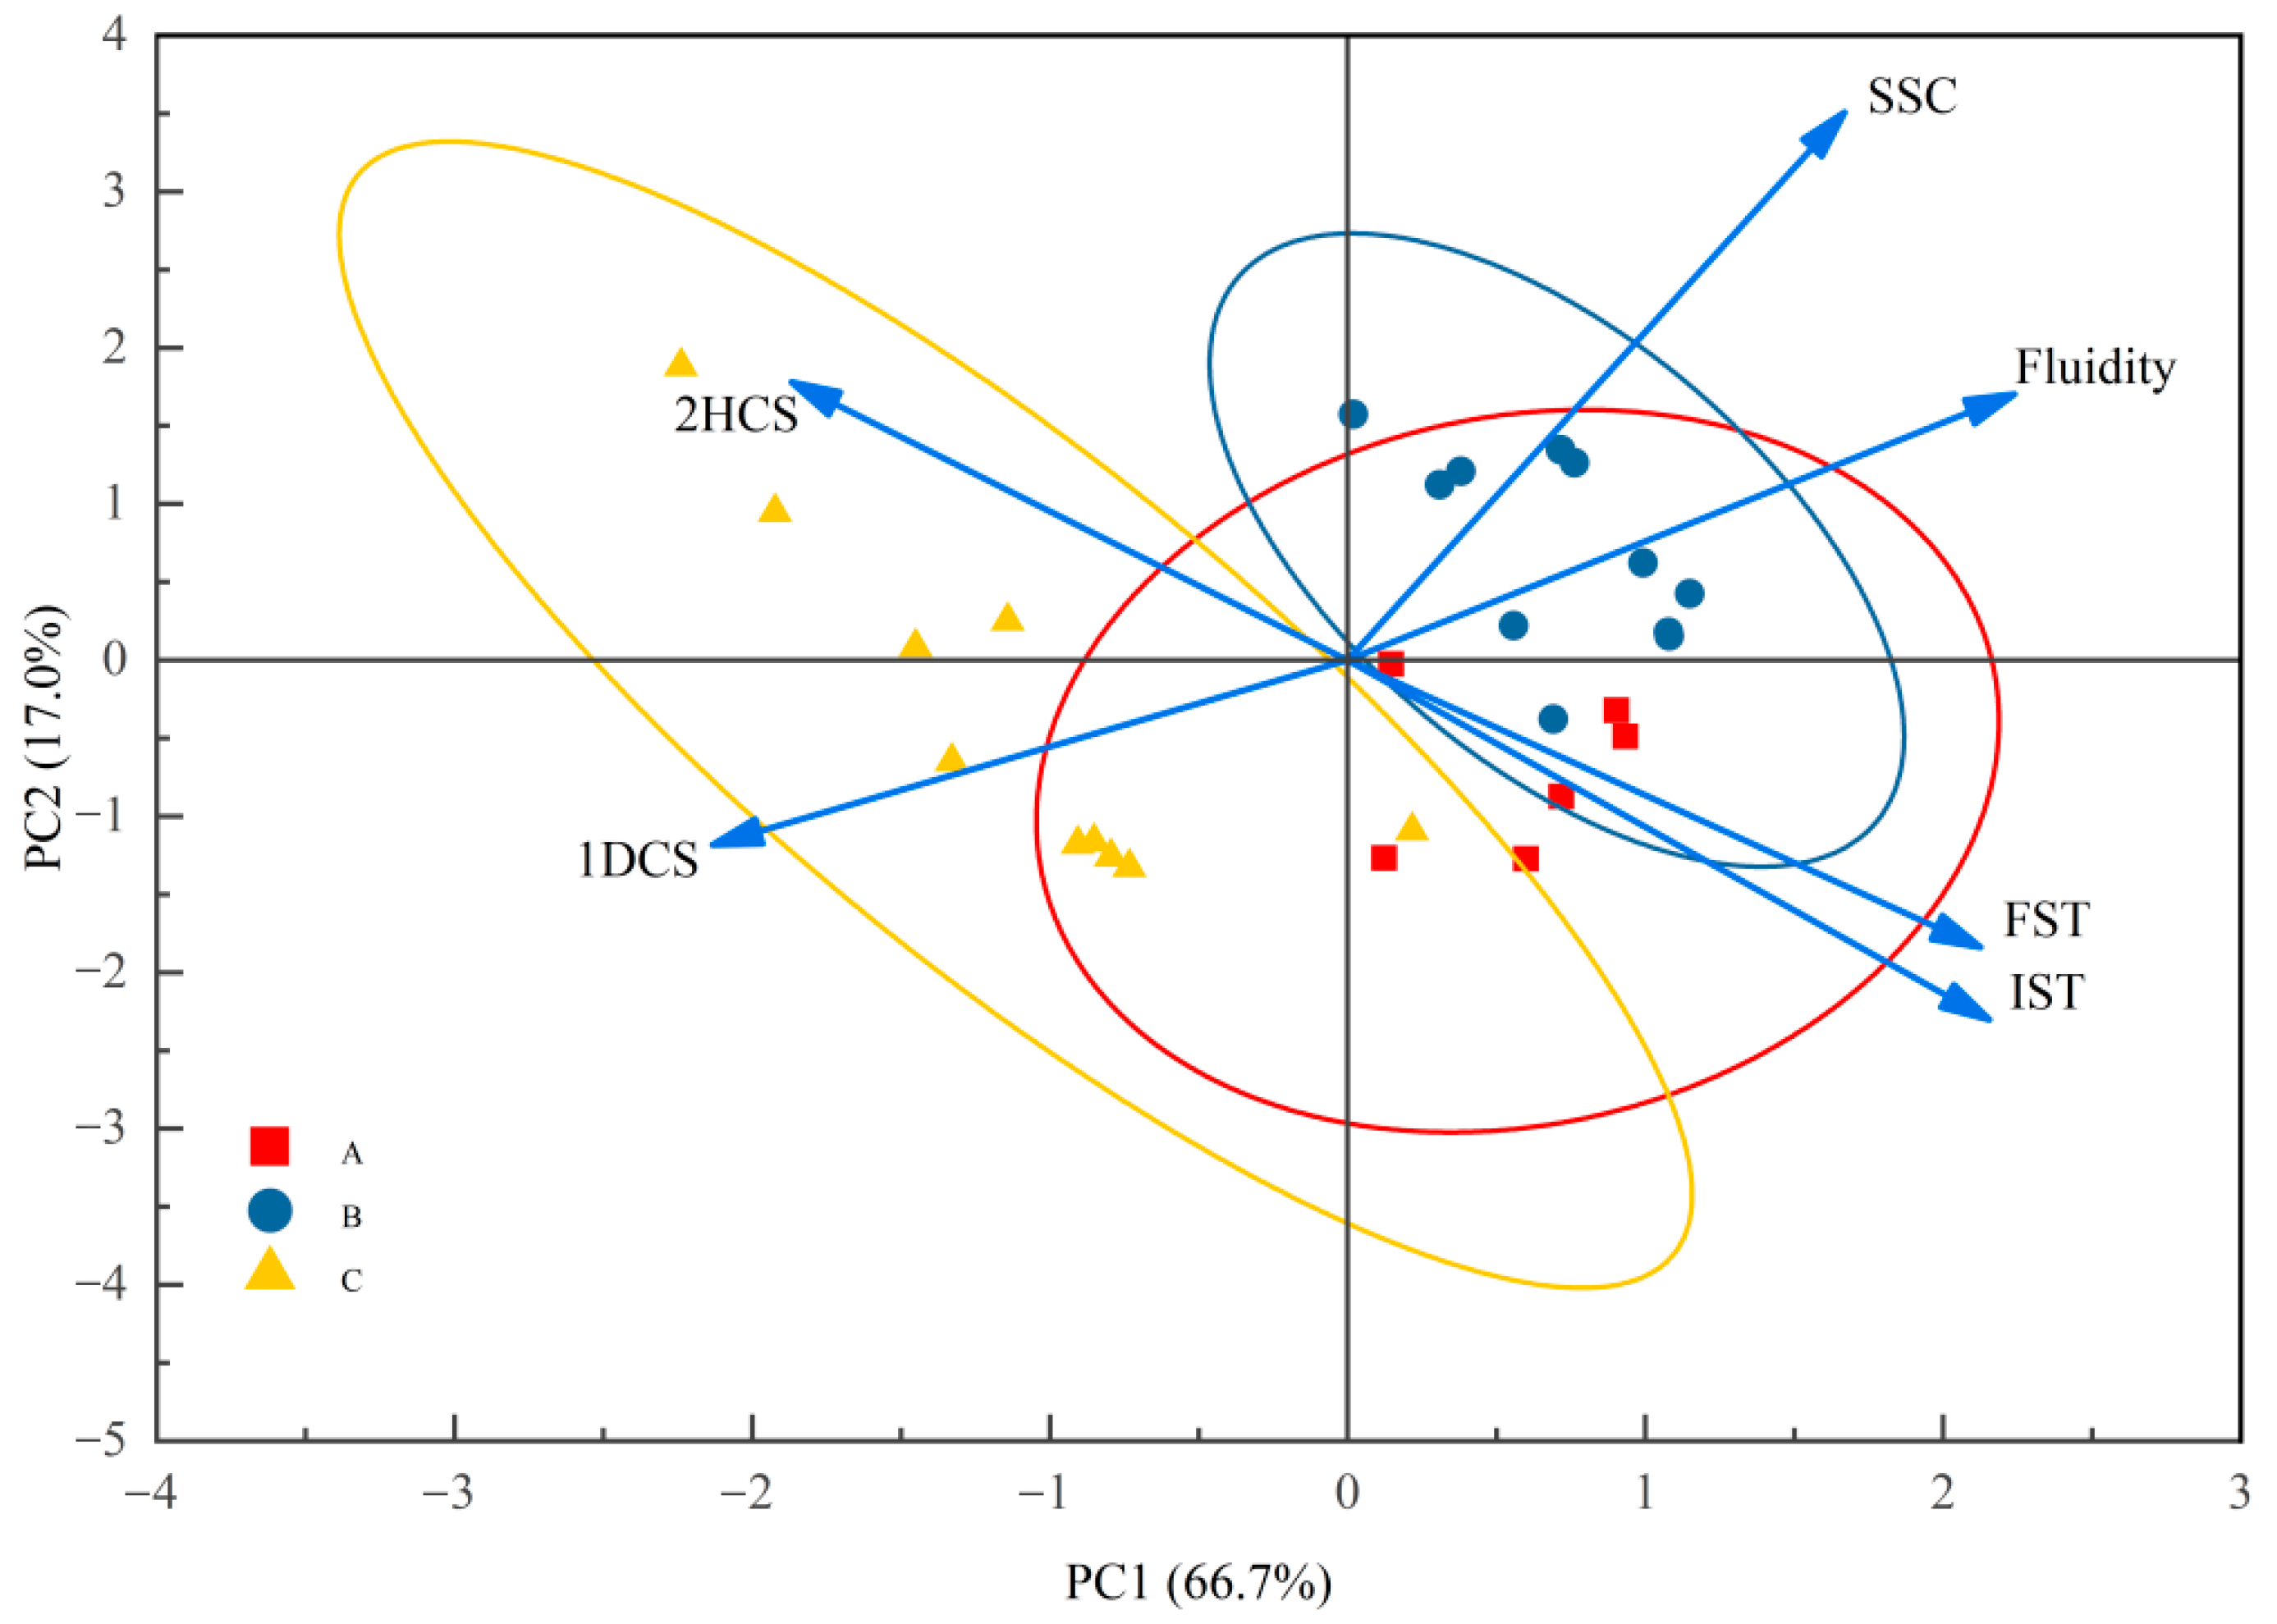
6.2.3. Principal Component Analysis (PCA)
- (1)
- Extraction and interpretation of principal components
- (2)
- Principal component loadings (Table 23):
| Function | PC1 | PC2 |
|---|---|---|
| Fluidity | 0.448 | 0.319 |
| Initial setting time | 0.431 | −0.432 |
| End time | 0.425 | −0.345 |
| Suspension content | 0.334 | 0.658 |
| Compressive strength (2 h) | −0.374 | 0.334 |
| Compressive strength (1 d) | −0.427 | −0.222 |
| Characteristic root | 4.00 2 | 1.018 |
| Variance contribution rate/% | 66.699 | 16.963 |
6.3. Sensitivity Analysis
6.3.1. Method Principle
- (1)
- Total sum of squares of deviations
- (2)
- Total variation decomposition is central to ANOVA, which breaks down SST into the contributions of main effects of factors, interaction effects, and error items.Among them are the following:
- (1)
- The main effect sum of squares reflects the independent action of a single factor and is calculated as in Equation (5):
In the formula, represents the sum of squares for each factor. a is the number of levels for the factor. nk is the number of trials at the k-th level. is the mean of results at the k-th level.- (2)
- The interaction effect is the sum of squares of deviation quantifies the synergistic effect of two factors, which is calculated as Equation (6):
In the formula, b is the number of levels of factor B; nij is the number of trials for the combination of the i-th level of A and the j-th level of B; is the mean of results for that combination. is the error sum of squares.
- (3)
- Significance testing judges the degree of influence via the F value, calculated as in Equation (7):
- (4)
- Sensitivity evaluation criteriaThe sensitivity analysis is based on the following two indicators:
- (1)
- F value significance: when Fj > F0.01 (dfj, dfe), it is judged to be “very significant” (***);When F0.05 (dfj, dfe) < Fj ≤ F0.01 (dfj, dfe), it is judged as “significant” (**);When Fj ≤ F0.05 (dfj, dfe), it is judged to have “no significant effect” (*).
- (2)
- Contribution-based weighting: As per Equation (6), it measures each factor’s ability to explain total variation.
6.3.2. Data Analysis
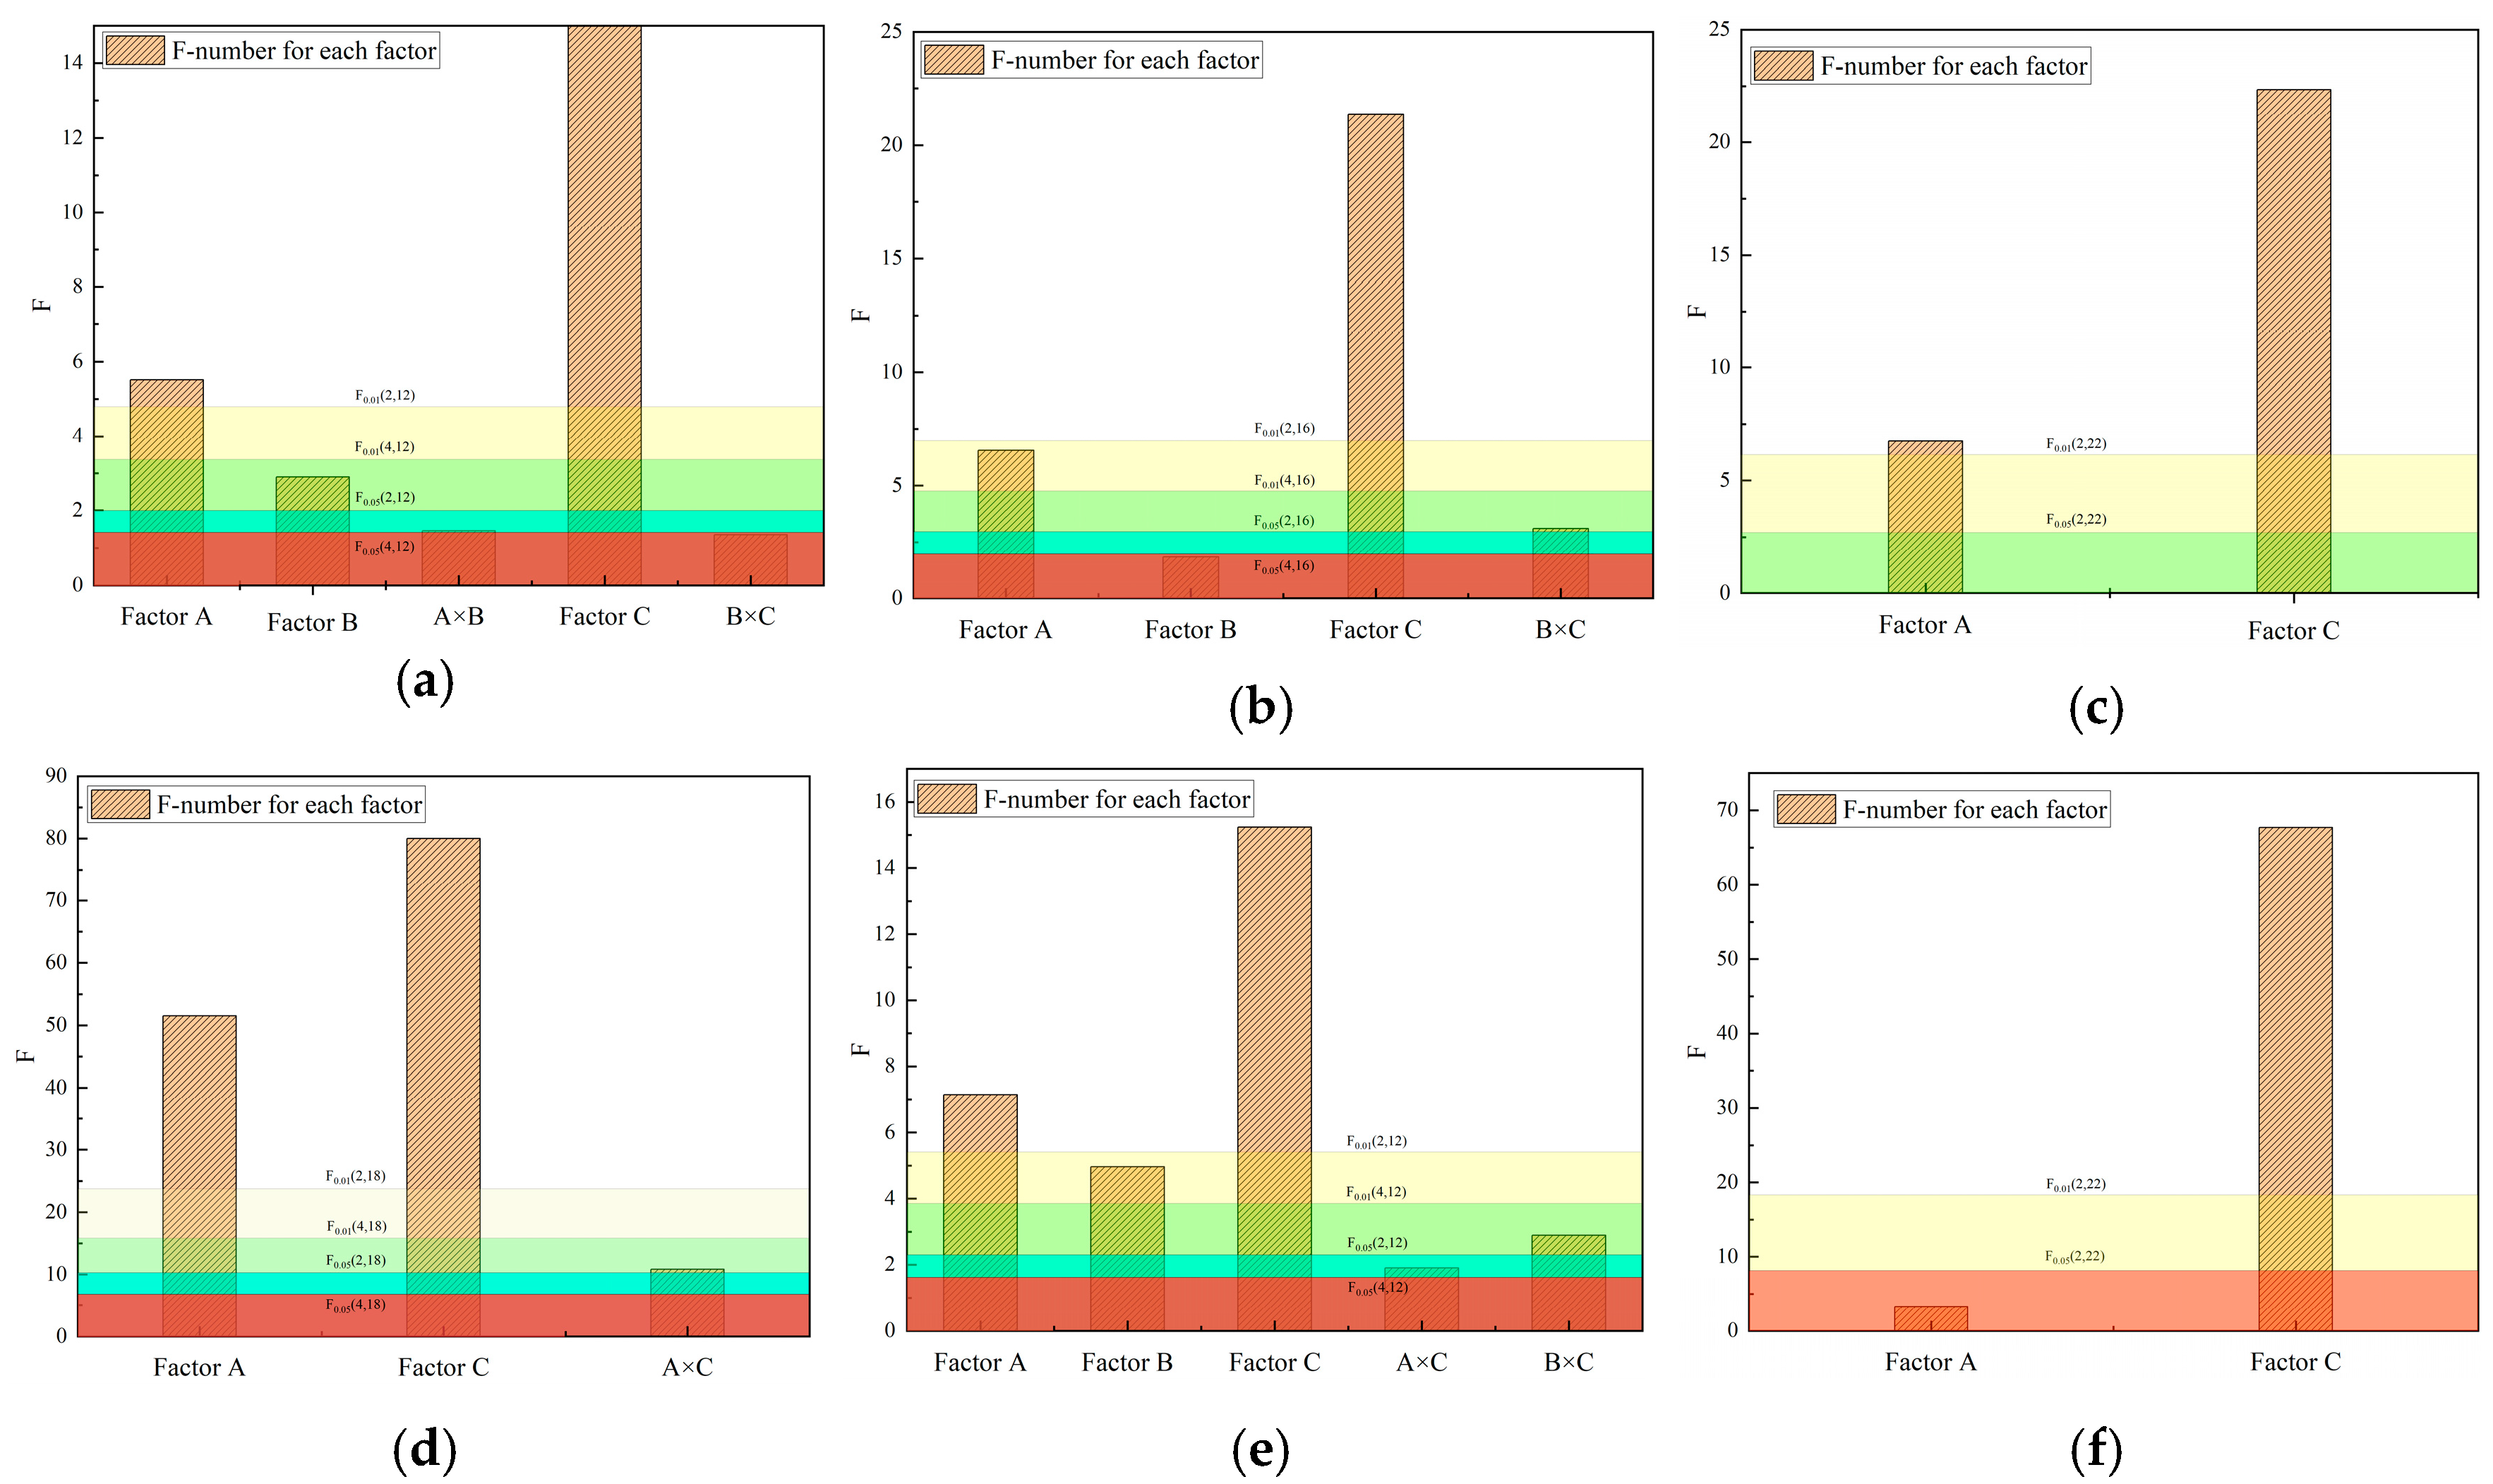
- (1)
- According to Table 24, Table 25, Table 26, Table 27, Table 28 and Table 29 and Figure 12, the following is true:
- (1)
- FluidityThe water–cement ratio (factor C) has the greatest impact on flowability, accounting for 94.8% of the sum of squares of deviation (SSC = 296,318.519, SST = 312,629.630), F value reached 357.170 (F0.01(2,12) = 6.93), indicating that a small change in water–cement ratio can significantly change the fluidity of slurry. HPMC content (factor A) contributes 1.4% variation (F = 5.152); the influence was second, and other factors and interactions did not contribute significantly (p > 0.05).
- (2)
- Setting timeBoth initial setting time and final setting time were dominated by water–cement ratio (factor C), with the contribution of 48.6% (initial setting time) and 55.7% (final setting time), respectively, and the F values were over the F0.01 critical values (21.354 and 22.348). The sensitivity of HPMC dosage (factor A) to setting time was second (initial setting 14.9%, final setting 16.8%), indicating that HPMC extended the setting process by regulating the hydration kinetics of the slurry. The interaction and PCS dosage (factor B) had no significant effect (p > 0.05).
- (3)
- Suspended matter contentThe water–cement ratio (factor C), HPMC content (factor A) and their interaction (A × C) jointly dominated the variation of suspension content, with contributions of 49.3%, 31.8%, and 13.4%, respectively. Among them, the significance of interaction A × C was significant (F = 10.862 > F0.01(4,18) = 4.58) indicates that the synergistic effect of the water–cement ratio and HPMC can significantly reduce the stability of the suspension, so the conflict between them should be avoided in formula design.
- (4)
- Compressive strengthCompressive strength (2 h): water–cement ratio (factor C) contributes 35.5% variation (F = 15.235), and the amounts of HPMC and PCS (factor A and B) contributed 16.6% and 11.6%, respectively.1D compressive strength: water–cement ratio (factor C) is still the core factor (contribution 82.6%, F = 67.680), other factors can be ignored (p > 0.05). The results showed that the water–cement ratio was more sensitive to early strength development than later, and PCS dosage only had a moderate effect on 2 h strength.
- (2)
- Based on the above analysis, the sensitivity of each factor to slurry performance is ranked as follows:Water–cement ratio (C) has a highly significant impact on all properties (flowability, setting time, turbidity, strength) (contribution 35.5%~94.8%), making it the primary parameter for formulation optimization. HPMC content (A) significantly affects flowability, setting time, and turbidity (contribution 1.4%~31.8%), requiring coordinated adjustment with the water–cement ratio. PCS content (B) only has a moderate effect on 2 h compressive strength (contribution 11.6%) and can be used as a fine-tuning parameter. Interaction A × C: significantly affects turbidity (contribution 13.4%), and it is important to avoid unfavorable combinations of these two parameters.
- (1)
- Based on the modeling of the correlations among parameters in Table 24, Table 25, Table 26, Table 27, Table 28 and Table 29 and Figure 12, and combined with the theories of classical rheology and hydration kinetics, the comprehensive analysis is as follows:
- (1)
- The dominant effect of the water–cement ratio on rheological propertiesThe regulation ability of the water–cement ratio (C) on the fluidity of the slurry is statistically significant (SSC/SST = 94.8%, F = 357.170 > F0.01 = 6.93), and its contribution far exceeds that of other parameters. This finding is consistent with Bingham’s theory of yield stress of fluids [22]: when the water–cement ratio increases from 0.35 to 0.45, the increase in the thickness of the free water film causes the frictional resistance between particles to decay exponentially [23], resulting in a 214% increase in fluidity (ΔL = 172→368 mm). It is notable that although the dosage (A) of HPMC only contributed 1.4% variation. Its F value (5.152) was still higher than the critical value of α = 0.05, which originated from the adsorption effect of cellulose ether molecular chains at the solid–liquid interface: When the dosage of HPMC exceeds 0.2%, the steric hindrance formed by the polymer network significantly increases the viscosity of the slurry structure, which is consistent with the mutation mechanism of the barrier height in the DLVO theory [24,25].
- (2)
- The two-stage response characteristics of condensation kineticsBoth the initial setting and final setting times were dominated by the water–cement ratio (C) (contribution rates 48.6% and 55.7%), and their F values (21.354 and 22.348) were significantly higher than the critical value of F0.01. Further analysis indicates that the influence of the water–cement ratio on the hydration process presents a two-stage characteristic: In the initial stage (t < 30 min), a high water–cement ratio (>0.40) accelerates the dissolution of C3S and the diffusion of Ca2⁺ by increasing porosity, promoting the rapid formation of hydration nuclei; However, in the later stage (t > 60 min), excessive free water diluted the concentration of Ca2⁺, delaying the nucleation rate of the CSH gel [26], which led to a non-monotonic response between the initial setting time and the final setting time. The contribution of HPMC dosage (A) to the setting time (14.9% for initial setting and 16.8% for final setting) confirmed the delaying effect of the polymer’s water retention effect on the setting process—by locking free water through hydrogen bonding and reducing the effective water–cement ratio, the setting process was significantly delayed [27].
- (3)
- The dynamic equilibrium mechanism of suspension stabilityThe variation of suspended solids content is mainly determined jointly by the water–cement ratio (C, contribution rate 49.3%), the dosage of HPMC (A, contribution rate 31.8%), and its interaction (A × C, contribution rate 13.4%), which reflects the dispersing-flocculation dynamic equilibrium mechanism of solid particles. When the water–cement ratio is <0.40, HPMC molecules enhance the repulsive force between particles through bridging, reducing the content of suspended solids [28]; When the water–cement ratio is greater than 0.40, excessive moisture leads to a decrease in the thickness of the polymer adsorption layer, causing a reduction in the DLVO potential barrier [25]. This discovery provides key design criteria for optimizing suspension stability: In the low water–cement ratio region (0.35–0.38), for every 0.1% increase in HPMC, the suspended solids can be reduced by 12.7%. In the area with a high water–cement ratio (>0.42), surfactant compounding technology needs to be adopted to compensate for the loss of dispersion efficiency [29].
- (4)
- The spatio-temporal heterogeneity characteristics of intensity developmentThe compressive strength shows A significant time dependence: The 2 h strength is jointly affected by the water–cement ratio (C, contribution 35.5%), HPMC (A, contribution 16.6%), and PCS (B, contribution 11.6%), while the 1 d strength is almost entirely dominated by the water–cement ratio (contribution 82.6%). This reflects the spatio-temporal heterogeneity of the microstructure evolution of the material: In the early stage (t = 2 h), the low water–cement ratio (0.35) prompts the CSH gel to nucleate preferentially at the particle contact points, forming a dense skeleton [30]; however, in the long term (t = 1 day), the long-range effect of porosity becomes the dominant factor-according to Andersen’s model [31], for every 0.01 increase in the water–cement ratio, the 28-day compressive strength decreases by approximately 2.1 MPa. It is worth noting that the moderate effect of PCS dosage (B) on the 2 h strength (F = 4.962) reveals its plasticization-retarding competition mechanism: Although PCS can reduce the theoretical water requirement, the excessive adsorption capacity will hinder the initial hydration of C3A [32,33]. Therefore, it is necessary to optimize its dosage threshold through the response surface method to balance fluidity and early strength.
- (2)
- Sensitivity analysis and engineering optimization
- (1)
- Sensitivity analysisBased on ANOVA and contribution weight, the sensitivity ranking of each parameter is: water–cement ratio (C) > Dosage of HPMC (A) Dosage of PCS (B) Interaction A × C. The water–cement ratio has a highly significant influence on all properties (fluidity, setting time, suspended solids, and strength) (contribution ranging from 35.5% to 94.8%), and it is the core parameter for formula optimization. The interaction between HPMC and A × C mainly regulates rheological properties and anti-dispersion, and the adverse combination of the two needs to be avoided through Box-Behnken. However, PCS only has a moderate adjustment ability (11.6%) for the 2 h intensity and can be used as a fine-tuning parameter.
- (2)
- Engineering adaptability strategyGrouting in a water-rich environment: W/C = 0.35–0.40 combined with HPMC 0.3–0.4%, achieving a fluidity of 250–300 mm and suspended solids <200 g/mL. Rapid hardening requirements: Limit W/C ≤ 0.35, HPMC ≤ 0.2% and PCS = 0.3% to ensure that the 2 h strength is ≥15 MPa. Anti-dispersion priority scenarios: W/C = 0.38–0.40 combined with 0.4% HPMC, the suspended solids are reduced to below 75 g/mL, and the initial setting time is controlled at 60–65 min.
7. Conclusions
- (1)
- The water–cement ratio is the most crucial factor affecting the performance of the special grouting material for metro structure repair during the operation period. It has a highly significant impact on fluidity, setting time, anti-dispersion property, and compressive strength, with contributions ranging from 35.5% to 94.8%.
- (2)
- The dosage of HPMC has a significant impact on fluidity, setting time, and anti-dispersion property, with contributions ranging from 1.4% to 31.8%, and it is an important parameter for regulating the working performance of the slurry.
- (3)
- The dosage of PCS mainly affects the 2 h compressive strength, with a contribution of 11.6%, and can be used as an auxiliary parameter for fine-tuning the early strength.
- (4)
- The interaction between the water–cement ratio and the dosage of HPMC has a significant impact on anti-dispersibility, with a contribution of 13.4%. The unfavorable combination of the two needs to be avoided.
- (5)
- Through orthogonal experiments and multivariate analysis of variance, the sensitivity ranking affecting the performance of grouting materials was established as follows: water–cement ratio >HPMC dosage >PCS dosage > interaction.
- (6)
- Based on principal component analysis, the trade-off relationship among fluidity-setting time-strength was revealed, providing a theoretical basis for multi-objective optimization.
- (7)
- The optimization of the formula should take the water–cement ratio as the core control parameter, combine it with HPMC to coordinate and control the working performance, fine-tune the early strength through PCS, and at the same time avoid the unfavorable combination of the water–cement ratio and HPMC.
- (8)
- Limited by the data discreteness of the orthogonal experimental design, the response surface model has certain interpolation errors in the high-gradient variation range (such as water–cement ratio > 0.38), and a safety threshold of ±5% needs to be set in engineering applications.
Author Contributions
Funding
Data Availability Statement
Conflicts of Interest
References
- Lin, X.; Liao, B.; Li, J.; Huang, J.; Lu, M.; Pang, H. Effect of crosslinked polycarboxylate superplasticizers with varied structures on cement dispersion performance. J. Appl. Polym. Sci. 2021, 138, 50012. [Google Scholar] [CrossRef]
- Song, G.Z.; Wang, L.J.; Zhang, Y.R.; Guo, Y.; Cao, Y.P. Early rheology and hydration characteristics of polymer-cement-based grouting materials. J. Harbin Inst. Technol. 2018, 50, 31–35. [Google Scholar]
- He, Y.; You, C.Y.; Li, M. Effect of CS-Hs-PCE on cement rheology and hydration properties. Non-Met. Ore 2023, 46, 32–35. [Google Scholar]
- Zhang, M.; Chen, L.X.; Zhou, M.Y. Research on the influence of flocculants and auxiliary agents on the fluidity of cement slurry. Concrete 2017, 66–68+72. [Google Scholar]
- Guo, C.C.; Chen, N.; Wang, R. Effects of HPMC on rheology of PC-CSA composite slurry and mechanism analysis. Acta Build. Mater. Sin. 2025, 28, 236–243. [Google Scholar]
- Liu, X.S.; Ji, H.X.; Zheng, S.B. Optimal design and condensation time regulation of underwater non-dispersed concrete anti-dispersant. J. Hefei Univ. Technol. 2024, 47, 1427–1433. [Google Scholar]
- Liu, R.J.; Zhang, Y.W.; Wen, C.W. Research on orthogonal experiment design and analysis methods. Exp. Technol. Manag. 2010, 27, 52–55. [Google Scholar] [CrossRef]
- Li, F.H.; Wang, Y.B.; Yu, Y.J. Experimental study on the ratio of cement-based grouting materials based on orthogonal design. Railw. Constr. Technol. 2020, 10–16+25. [Google Scholar]
- Huang, G.D.; Zhang, R.L.; Li, H. Application of internal curing agent SAP based on orthogonal experiment design in steel pipe micro-expanded concrete. Highw. Traffic Sci. Technol. 2020, 37, 68–78+96. [Google Scholar]
- Yao, W.J.; Han, J.X.; Fang, R. Orthogonal test of basic properties of straw/polypropylene fiber-vitrified microbead insulation concrete. J. Yangtze Acad. Sci. 2024, 41, 156–163. [Google Scholar]
- Jia, X.B.; Li, D.Q.; Tu, Q. Application of quadratic statistical method based on orthogonal tables in orthogonal experiments. Stat. Decis. 2008, 150–151. [Google Scholar]
- Zhou, Y.Z. Matrix analysis method for orthogonal experimental design. Pract. Underst. Math. 2009, 39, 202–207. [Google Scholar]
- Li, H.H. Comparative study of optimized experimental design methods. Inn. Mong. Sci. Technol. Econ. 2021, 63–65. [Google Scholar]
- Guo, X.M. Key points of orthogonal experimental design and its implementation of DPS. Mod. Agric. Sci. Technol. 2012, 40–41+44. [Google Scholar]
- Pang, J.Y.; Yao, W.J.; Wang, L.Y. Orthogonal experiment and regression analysis of ultrafine fly ash grouting filling materials in goaf. J. Yangtze Acad. Sci. 2018, 35, 103–108. [Google Scholar]
- Ou, Z.H.; Ma, B.G.; Jian, S.W. Pore structure of nonionic cellulose ether modified cement slurry. J. Build. Mater. 2013, 16, 121–126+137. [Google Scholar]
- Gao, R.J.; Lu, S.H. Research on the structural relationship and mechanism of polycarboxylic acid-based water reducing agents. Mater. Guide 2012, 26, 57–60. [Google Scholar]
- Box, G.; Wilson, K. On the experimental attainment of optimum conditions. J. R. Stat. Soc. 1951, 13, 1–45. [Google Scholar] [CrossRef]
- Ferdosian, I.; Camões, A. Eco-efficient ultra-high performance concrete development by means of response surface methodology. Cem. Concr. Compos. 2017, 84, 84146–84156. [Google Scholar] [CrossRef]
- Jones, D.R.; Schonlau, M.; Welch, W.J. Efficient global optimization of expensive black-box functions. Adv. Bioinform. 1998, 13, 455–492. [Google Scholar] [CrossRef]
- Addelman, S. Statistics for experimenters. Technometrics 2012, 21, 387–388. [Google Scholar] [CrossRef]
- Skipper, K.L.; Skipper, A.J.P. Experimental Design and Scientific Data Analysis; Taylor & Francis: London, UK, 2024. [Google Scholar] [CrossRef]
- Zhiquan, Y.; Mao, C.; Yi, D. Influence of coupling effects of time and water-to-cement ratio on rheological properties of Bingham cement grouts. Adv. Mater. Sci. Eng. 2021, 2021. [Google Scholar]
- Liu, H.; Sun, X.; Du, H.; Lu, H.; Ma, Y.; Shen, W.; Tian, Z. Effects and threshold of water film thickness on multi-mineral cement paste. Cem. Concr. Compos. 2020, 112, 103677. [Google Scholar] [CrossRef]
- Wan, Y.; Zhang, W.; Chen, R.; Zhang, L.; Zhang, Y. A novel cellulose ether cross-linking modification and its effect mechanism on the properties of cementitious materials. Constr. Build. Mater. 2024, 447, 138150. [Google Scholar] [CrossRef]
- Dejian, S.; Xin, W. Simulation on Hydration of Tricalcium Silicate in Cement Clinker; Springer Nature: Singapore, 2024. [Google Scholar] [CrossRef]
- Guo, C.; Chen, N.; Wang, R. Study on hydroxypropyl methylcellulose modified Portland cement-sulphoaluminate cement composites: Rheology, setting time, mechanical strength, resistance to chloride ingress, early reaction kinetics and microstructure. J. Build. Eng. 2024, 98, 111070. [Google Scholar] [CrossRef]
- Feng, K.; Xu, Z.; Zhang, W.; Ma, K.; Shen, J.; Hu, M. Rheological properties and early-age microstructure of cement pastes with limestone powder, redispersible polymer powder and cellulose ether. Materials 2022, 15, 3159. [Google Scholar] [CrossRef]
- Zang, H.; Wang, S.; Carter, P.J. Analysis of thixotropy of cement grout based on a virtual bond model. Acta Geotech. 2024, 19, 7427–7450. [Google Scholar] [CrossRef]
- Marchon, D.; Kawashima, S.; Bessaies-Bey, H.; Mantellato, S.; Ng, S. Hydration and rheology control of concrete for digital fabrication: Potential admixtures and cement chemistry. Cem. Concr. Res. 2018, 112, 96–110. [Google Scholar] [CrossRef]
- Long, Z.; Long, G.; Tang, Z.; Shangguan, M.; Zhang, Y.; Wang, L.; Peng, L.; Yi, M. Hydration, strength, and microstructure evolution of Portland cement-calcium sulphoaluminate cement-CSH seeds ultra-early strength cementitious system. Constr. Build. Mater. 2024, 430, 136492. [Google Scholar] [CrossRef]
- Salih, A.; Rafiq, S.; Mahmood, W.; Ghafor, K.; Sarwar, W. Various simulation techniques to predict the compressive strength of cement-based mortar modified with micro-sand at different water-to-cement ratios and curing ages. Arab. J. Geosci. 2021, 14. [Google Scholar] [CrossRef]
- Joseph, S.; Skibsted, J.; Cizer, Ö. A quantitative study of the C3A hydration. Cem. Concr. Res. 2019, 115, 145–159. [Google Scholar] [CrossRef]

| C3S/% | C2S/% | C3A/% | C4AF/% | f-CaO/% |
|---|---|---|---|---|
| 51.06 | 22.92 | 15.87 | 10.26 | 1.44 |
| C4A3S/% | C2S/% | C2F/% | CaSO4/% |
|---|---|---|---|
| 36.19 | 32.16 | 15.28 | 16.85 |
| ID | SAC/% | PO/% | SG/% | HPMC/% | PCS/% | Water–Cement Ratio |
|---|---|---|---|---|---|---|
| H1-P1-W2 | 70 | 30 | 0.1 | 0.2 | 0.25 | 0.4 |
| H2-P1-W2 | 70 | 30 | 0.1 | 0.3 | 0.25 | 0.4 |
| H3-P1-W2 | 70 | 30 | 0.1 | 0.4 | 0.25 | 0.4 |
| H3-P1-W2 | 70 | 30 | 0.1 | 0.4 | 0.25 | 0.4 |
| H3-P2-W2 | 70 | 30 | 0.1 | 0.4 | 0.3 | 0.4 |
| H3-P3-W2 | 70 | 30 | 0.1 | 0.4 | 0.4 | 0.4 |
| H1-P3-W1 | 70 | 30 | 0.1 | 0.2 | 0.4 | 0.3 |
| H1-P3-W2 | 70 | 30 | 0.1 | 0.2 | 0.4 | 0.4 |
| H1-P3-W3 | 70 | 30 | 0.1 | 0.2 | 0.4 | 0.45 |
| ID | SAC/% | PO/% | SG/% | HPMC/% | PCS/% | Water–Cement Ratio |
|---|---|---|---|---|---|---|
| H 0-P1-W2 | 70 | 30 | 0.1 | 0 | 0.25 | 0.4 |
| H1-P1-W2 | 70 | 30 | 0.1 | 0.2 | 0.25 | 0.4 |
| H2-P1-W2 | 70 | 30 | 0.1 | 0.3 | 0.25 | 0.4 |
| H3-P1-W2 | 70 | 30 | 0.1 | 0.4 | 0.25 | 0.4 |
| H3-P1-W2 | 70 | 30 | 0.1 | 0.4 | 0.25 | 0.4 |
| H3-P2-W2 | 70 | 30 | 0.1 | 0.4 | 0.3 | 0.4 |
| H3-P3-W2 | 70 | 30 | 0.1 | 0.4 | 0.4 | 0.4 |
| H1-P3-W1 | 70 | 30 | 0.1 | 0.2 | 0.4 | 0.3 |
| H1-P3-W2 | 70 | 30 | 0.1 | 0.2 | 0.4 | 0.4 |
| H1-P3-W3 | 70 | 30 | 0.1 | 0.2 | 0.4 | 0.45 |
| ID | SAC/% | PO/% | SG/% | HPMC/% | PCS/% | Water–Cement Ratio |
|---|---|---|---|---|---|---|
| H1-P1-W2 | 70 | 30 | 0.1 | 0.2 | 0.25 | 0.4 |
| H2-P1-W2 | 70 | 30 | 0.1 | 0.3 | 0.25 | 0.4 |
| H3-P1-W2 | 70 | 30 | 0.1 | 0.4 | 0.25 | 0.4 |
| H3-P1-W2 | 70 | 30 | 0.1 | 0.4 | 0.25 | 0.4 |
| H3-P2-W2 | 70 | 30 | 0.1 | 0.4 | 0.3 | 0.4 |
| H3-P3-W2 | 70 | 30 | 0.1 | 0.4 | 0.4 | 0.4 |
| H1-P3-W1 | 70 | 30 | 0.1 | 0.2 | 0.4 | 0.3 |
| H1-P3-W2 | 70 | 30 | 0.1 | 0.2 | 0.4 | 0.4 |
| H1-P3-W3 | 70 | 30 | 0.1 | 0.2 | 0.4 | 0.45 |
| Horizontal | H (Factor A)/% | P (Factor B)/% | W (Factor C)/% |
|---|---|---|---|
| 1 | 0.2 | 0.25 | 0.3 |
| 2 | 0.3 | 0.3 | 0.4 |
| 3 | 0.4 | 0.4 | 0.45 |
| Order Number | 1 | 2 | 3 | 4 | 5 | 6 | 7 | 8 | 11 |
|---|---|---|---|---|---|---|---|---|---|
| Factor A | Factor B | (A × B)1 | (A × B)2 | Factor C | (A × C)1 | (A × C)2 | (B × C)1 | (B × C)2 | |
| 1 | 1 (0.2) | 1 (0.25) | 1 | 1 | 1 (0.3) | 1 | 1 | 1 | 1 |
| 2 | 1 (0.2) | 1 (0.25) | 1 | 1 | 2 (0.4) | 2 | 2 | 2 | 2 |
| 3 | 1 (0.2) | 1 (0.25) | 1 | 1 | 3 (0.45) | 3 | 3 | 3 | 3 |
| 4 | 1 (0.2) | 2 (0.3) | 2 | 2 | 1 (0.3) | 1 | 1 | 2 | 3 |
| 5 | 1 (0.2) | 2 (0.3) | 2 | 2 | 2 (0.4) | 2 | 2 | 3 | 1 |
| 6 | 1 (0.2) | 2 (0.3) | 2 | 2 | 3 (0.45) | 3 | 3 | 1 | 2 |
| 7 | 1 (0.2) | 3 (0.4) | 3 | 3 | 1 (0.3) | 1 | 1 | 3 | 2 |
| 8 | 1 (0.2) | 3 (0.4) | 3 | 3 | 2 (0.4) | 2 | 2 | 1 | 3 |
| 9 | 1 (0.2) | 3 (0.4) | 3 | 3 | 3 (0.45) | 3 | 3 | 2 | 1 |
| 10 | 2 (0.3) | 1 (0.25) | 2 | 3 | 1 (0.3) | 2 | 3 | 1 | 1 |
| 11 | 2 (0.3) | 1 (0.25) | 2 | 3 | 2 (0.4) | 3 | 1 | 2 | 2 |
| 12 | 2 (0.3) | 1 (0.25) | 2 | 3 | 3 (0.45) | 1 | 2 | 3 | 3 |
| 13 | 2 (0.3) | 2 (0.3) | 3 | 1 | 1 (0.3) | 2 | 3 | 2 | 3 |
| 14 | 2 (0.3) | 2 (0.3) | 3 | 1 | 2 (0.4) | 3 | 1 | 3 | 1 |
| 15 | 2 (0.3) | 2 (0.3) | 3 | 1 | 3 (0.45) | 1 | 2 | 1 | 2 |
| 16 | 2 (0.3) | 3 (0.4) | 1 | 2 | 1 (0.3) | 2 | 3 | 3 | 2 |
| 17 | 2 (0.3) | 3 (0.4) | 1 | 2 | 2 (0.4) | 3 | 1 | 1 | 3 |
| 18 | 2 (0.3) | 3 (0.4) | 1 | 2 | 3 (0.45) | 1 | 2 | 2 | 1 |
| 19 | 3 (0.4) | 1 (0.25) | 3 | 2 | 1 (0.3) | 3 | 2 | 1 | 1 |
| 20 | 3 (0.4) | 1 (0.25) | 3 | 2 | 2 (0.4) | 1 | 3 | 2 | 2 |
| 21 | 3 (0.4) | 1 (0.25) | 3 | 2 | 3 (0.45) | 2 | 1 | 3 | 3 |
| 22 | 3 (0.4) | 2 (0.3) | 2 | 3 | 1 (0.3) | 3 | 2 | 2 | 3 |
| 23 | 3 (0.4) | 2 (0.3) | 2 | 3 | 2 (0.4) | 1 | 3 | 3 | 1 |
| 24 | 3 (0.4) | 2 (0.3) | 2 | 3 | 3 (0.45) | 2 | 1 | 1 | 2 |
| 25 | 3 (0.4) | 3 (0.4) | 1 | 1 | 1 (0.3) | 3 | 2 | 3 | 2 |
| 26 | 3 (0.4) | 3 (0.4) | 1 | 1 | 2 (0.4) | 1 | 3 | 1 | 3 |
| 27 | 3 (0.4) | 3 (0.4) | 1 | 1 | 3 (0.45) | 2 | 1 | 2 | 1 |
| ID | Fluidity/mm | Time of Setting/min | Anti-Dispersibility | Compression Strength | |||
|---|---|---|---|---|---|---|---|
| Initial Setting Time | Final Setting Time | Suspended Matter Content g/mL | pH Price | 2 h | 1 d | ||
| 1 | 90 | 60 | 65 | 47 | 8.9 | 10.5 | 22.5 |
| 2 | 300 | 55 | 65 | 590 | 8.7 | 10.2 | 20.9 |
| 3 | 350 | 60 | 70 | 590 | 8.5 | 9.5 | 19.2 |
| 4 | 150 | 50 | 65 | 100 | 8.4 | 21.1 | 23.4 |
| 5 | 300 | 60 | 70 | 590 | 8.6 | 11.5 | 20.2 |
| 6 | 350 | 60 | 70 | 590 | 8.8 | 10.2 | 19.2 |
| 7 | 100 | 40 | 50 | 60 | 8.4 | 15.5 | 21.2 |
| 8 | 300 | 60 | 70 | 550 | 8.5 | 11.9 | 20.3 |
| 9 | 340 | 65 | 75 | 590 | 8.7 | 10.1 | 19.6 |
| 10 | 50 | 60 | 65 | 50 | 8.7 | 9.6 | 21.6 |
| 11 | 280 | 65 | 70 | 500 | 8.5 | 9.1 | 20.5 |
| 12 | 340 | 65 | 75 | 590 | 8.4 | 8.2 | 19.4 |
| 13 | 80 | 50 | 65 | 180 | 8.7 | 13.3 | 23.2 |
| 14 | 280 | 60 | 70 | 331 | 8.7 | 9.3 | 21.2 |
| 15 | 340 | 65 | 75 | 480 | 8.6 | 8.4 | 19.2 |
| 16 | 100 | 55 | 65 | 240 | 8.5 | 14.4 | 22.3 |
| 17 | 280 | 65 | 75 | 390 | 8.5 | 9 | 20.3 |
| 18 | 340 | 65 | 75 | 485 | 8.7 | 8.5 | 19.2 |
| 19 | 50 | 60 | 65 | 51 | 7.5 | 8.9 | 21.5 |
| 20 | 250 | 63 | 73 | 75 | 8.5 | 9.5 | 20.3 |
| 21 | 300 | 65 | 75 | 125 | 8.7 | 9.2 | 18.9 |
| 22 | 50 | 50 | 65 | 40 | 7.5 | 10.5 | 22.5 |
| 23 | 280 | 65 | 75 | 120 | 8.4 | 10.5 | 22.1 |
| 24 | 330 | 65 | 75 | 340 | 8.6 | 8.5 | 19.5 |
| 25 | 150 | 60 | 70 | 70 | 7.5 | 12.3 | 23.5 |
| 26 | 280 | 68 | 78 | 137 | 8.3 | 10.8 | 20.2 |
| 27 | 320 | 65 | 75 | 235 | 8.5 | 8.7 | 18.5 |
| Group | Function | Orthogonal Test ID | Engineering Significance |
|---|---|---|---|
| Cluster A | The final time is <90 min; the flow is >250 mm; and the suspension content is <350 g/mL | 14, 21, 23, 24, 26, 27 | Short sky window period; good workability; water-rich environment filling |
| Cluster B | The final time is less than 90 min; the flow rate is more than 250 mm; the suspension content is more than 350 g/mL | 2, 3, 5, 6, 8, 9, 11, 12, 15, 17, 18 | Short opening period; good working condition; no water environment filling |
| Cluster C | Other circumstances | 1, 4, 7, 10, 13, 16, 19, 20, 22, 25 |
| Sum of Squares of Deviations | Free Degree | Mean Square Deviation | F | Critical Value | Significance | |
|---|---|---|---|---|---|---|
| Factor A | 4274.074 | 2 | 2137.037 | 5.152 | F0.01(2,12) = 6.93 | ** |
| Factor B | 2407.407 | 2 | 1203.704 | 2.902 | F0.05(2,12) = 3.89 | * |
| A × B | 2414.815 | 4 | 603.704 | 1.455 | F0.01(4,12) = 5.41 | * |
| Factor C | 296,318.519 | 2 | 148,159.259 | 357.170 | F0.05(4,12) = 3.26 | *** |
| A × C | 903.704 | 4 | 225.926 | Error | ||
| B × C | 2237.037 | 4 | 559.259 | 1.348 | * | |
| S Se | 4074.074 | 8 | 509.259 | |||
| 414.815 | ||||||
| Sum | 312,629.630 | 26 |
| Sum of Squares of Deviations | Free Degree | Mean Square Deviation | F | Critical Value | Significance | |
|---|---|---|---|---|---|---|
| Factor A | 160.074 | 2 | 80.037 | 6.558 | F0.01(2,16) = 6.23 | *** |
| Factor B | 44.741 | 2 | 22.370 | 1.833 | F0.05(2,16) = 3.63 | * |
| A × B | 39.481 | 4 | 9.870 | F0.01(4,16) = 4.77 | Error | |
| Factor C | 521.185 | 2 | 260.593 | 21.354 | F0.05(4,16) = 3.01 | *** |
| A × C | 12.370 | 4 | 3.093 | Error | ||
| B × C | 151.704 | 4 | 37.926 | 3.108 | * | |
| S Se | 143.407 | 8 | 17.926 | |||
| 12.204 | ||||||
| Sum | 1072.963 | 26 |
| Sum of Squares of Deviations | Free Degree | Mean Square Deviation | F | Critical Value | Significance | |
|---|---|---|---|---|---|---|
| Factor A | 151.185 | 2 | 75.593 | 6.756 | F0.01(2,22) = 5.72 | *** |
| Factor B | 5.852 | 2 | 2.926 | F0.05(2,22) = 3.44 | Error | |
| A × B | 35.037 | 4 | 8.759 | Error | ||
| Factor C | 500.074 | 2 | 250.037 | 22.348 | *** | |
| A × C | 16.815 | 4 | 4.204 | Error | ||
| B × C | 59.481 | 4 | 14.870 | Error | ||
| S Se | 128.963 | 8 | 16.120 | |||
| 11.189 | ||||||
| Sum | 897.407 | 26 |
| Sum of Squares of Deviations | Free Degree | Mean Square Deviation | F | Critical Value | Significance | |
|---|---|---|---|---|---|---|
| Factor A | 398,056.519 | 2 | 199,028.259 | 51.532 | F0.01(2,18) = 6.01 | *** |
| Factor B | 1589.852 | 2 | 794.926 | F0.05(2,18) = 3.55 | Error | |
| A × B | 16,080.593 | 4 | 4020.148 | F0.01(4,18) = 4.58 | Error | |
| Factor C | 617,983.630 | 2 | 308,991.815 | 80.004 | F0.05(4,18) = 2.93 | *** |
| A × C | 167,801.481 | 4 | 41,950.370 | 10.862 | *** | |
| B × C | 12,502.815 | 4 | 3125.704 | Error | ||
| S Se | 39,346.741 | 8 | 4918.343 | |||
| 3862.222 | ||||||
| Sum | 1,253,361.630 | 26 |
| Sum of Squares of Deviations | Free Degree | Mean Square Deviation | F | Critical Value | Significance | |
|---|---|---|---|---|---|---|
| Factor A | 33.180 | 2 | 16.590 | 7.139 | F0.01(2,12) = 6.93 | *** |
| Factor B | 23.060 | 2 | 11.530 | 4.962 | F0.05(2,12) = 3.89 | ** |
| A × B | 7.422 | 4 | 1.856 | F0.01(4,12) = 5.41 | Error | |
| Factor C | 70.807 | 2 | 35.403 | 15.235 | F0.05(4,12) = 3.26 | *** |
| A × C | 17.680 | 4 | 4.420 | 1.902 | * | |
| B × C | 26.873 | 4 | 6.718 | 2.891 | * | |
| S Se | 20.464 | 8 | 2.558 | |||
| 2.324 | ||||||
| Sum | 199.487 | 26 |
| Sum of Squares of Deviations | Free Degree | Mean Square Deviation | F | Critical Value | Significance | |
|---|---|---|---|---|---|---|
| Factor A | 0.016 | 2 | 0.008 | F0.01(2,22) = 5.72 | Error | |
| Factor B | 2.287 | 2 | 1.143 | 3.305 | F0.05(2,22) = 3.44 | * |
| A × B | 1.042 | 4 | 0.261 | Error | ||
| Factor C | 46.829 | 2 | 23.414 | 67.680 | *** | |
| A × C | 0.489 | 4 | 0.122 | Error | ||
| B × C | 1.104 | 4 | 0.276 | Error | ||
| S Se | 4.960 | 8 | 0.620 | |||
| 0.346 | ||||||
| Sum | 56.727 | 26 |
Disclaimer/Publisher’s Note: The statements, opinions and data contained in all publications are solely those of the individual author(s) and contributor(s) and not of MDPI and/or the editor(s). MDPI and/or the editor(s) disclaim responsibility for any injury to people or property resulting from any ideas, methods, instructions or products referred to in the content. |
© 2025 by the authors. Licensee MDPI, Basel, Switzerland. This article is an open access article distributed under the terms and conditions of the Creative Commons Attribution (CC BY) license (https://creativecommons.org/licenses/by/4.0/).
Share and Cite
Song, W.; Niu, X.; Xie, Z.; Wang, H.; Su, J.; Xu, C. Special Cement-Based Grouting Material for Subway Structure Repair During Operation Performance Sensitivity Analysis. Buildings 2025, 15, 2396. https://doi.org/10.3390/buildings15142396
Song W, Niu X, Xie Z, Wang H, Su J, Xu C. Special Cement-Based Grouting Material for Subway Structure Repair During Operation Performance Sensitivity Analysis. Buildings. 2025; 15(14):2396. https://doi.org/10.3390/buildings15142396
Chicago/Turabian StyleSong, Wei, Xiaokai Niu, Zhitian Xie, He Wang, Jie Su, and Chentao Xu. 2025. "Special Cement-Based Grouting Material for Subway Structure Repair During Operation Performance Sensitivity Analysis" Buildings 15, no. 14: 2396. https://doi.org/10.3390/buildings15142396
APA StyleSong, W., Niu, X., Xie, Z., Wang, H., Su, J., & Xu, C. (2025). Special Cement-Based Grouting Material for Subway Structure Repair During Operation Performance Sensitivity Analysis. Buildings, 15(14), 2396. https://doi.org/10.3390/buildings15142396