Abstract
Rapid identification of vessel height within the navigable space beneath bridges is crucial for ensuring bridge safety. To prevent bridge collisions caused by vessels exceeding their height limits, this article introduces a real-time warning framework for excessive vessel height based on video spatial transformation. The specific contributions include the following: (1) A spatial transformation-based method for locating vessel coordinates in the channel using buoys as control points, employing laser scanning to obtain their world coordinates from a broad channel range, and mapping the pixel coordinates of the buoys from side channel images to the world coordinates of the channel space, thus achieving pixel-level positioning of the vessel’s waterline intersection in the channel. (2) For video images, a key point recognition network for vessels based on attention mechanisms is developed to obtain pixel coordinates of the vessel’s waterline and top, and to capture the posture and position of multiple vessels in real time. (3) Analyzing the posture of vessels traveling in various directions within the channel, the method accounts for the pixel distance of spatial transformation control points and vessel height to determine vessel positioning coordinates, solve for the vessel’s height above water, and combine with real-time waterline height to enable over-height vessel collision warnings for downstream channel bridges. The method has been deployed in actual navigational scenarios beneath bridges, with the average error in vessel height estimation controlled within 10 cm and an error rate below 0.8%. The proposed approach enables real-time automatic estimation of vessel height in terms of computational speed, making it more suitable for practical engineering applications that demand both real-time performance and system stability. The system exhibits outstanding performance in terms of accuracy, stability, and engineering applicability, providing essential technical support for intelligent bridge safety management.
1. Introduction
Background and Motivation
As the shipping industry grows, the size of vessels significantly increases, leading to frequent incidents where excessively tall vessels collide with the lower structures of bridges, causing not only structural damage but also, in severe cases, complete destruction of bridges and extensive loss of life. Currently, while most bridges incorporate collision protection structures at bridge piers, there is relatively little protection for the undersides of the beams. To prevent vessels from accidentally exceeding the standard navigational height under bridges and to provide over-height vessels with sufficient time to slow down or change course before approaching the bridge, real-time data on vessel position and height are integrated prior to their entry into the bridge’s proximity.
The review of previous studies on bridge and vessel collisions includes methods proposed by Wu et al. [1] based on fuzzy logic for collision warning, integrating vessel characteristics, bridge parameters, and environmental factors using fuzzy reasoning. Zhang et al. [2] introduced a video-based method for preventing collisions between bridges and vessels, including vessel positioning, analysis of abnormal vessel trajectories, and a yaw warning system. Hou [3] developed an automatic sea surface segmentation, vessel detection, and Synthetic Aperture Radar and Automatic Identification System (SAR-AIS) matching program, as well as a method for maritime target classification based on Gaofen-3(GF-3) SAR data, for detecting and identifying vessels. Zhang et al. [4] proposed a data-driven method for detecting potential ship–bridge collisions in inland waterways by combining KDE-based waterway feature extraction with a velocity obstacle model. The introduction above describes some active detection and warning methods to prevent ships from colliding with bridges. There is also considerable research on passive methods to deal with ships veering off course and colliding with bridges. Sha and colleagues [5] used finite element simulation to study the structural response of the lower parts of bridges under the impact of ships, and based on the simulation results, proposed effective reinforcement methods. Fang and others [6] introduced a novel composite bumper system for bridge piers that reduces the risk factor of ship-to-bridge collisions by extending the collision time. Zhu and colleagues [7] developed a new Foam-filled Lattice Composite Bumper System (FLCBS) and Fiber-reinforced Polymer (FRP) composite materials, which, through modular manufacturing and installation techniques, effectively enhanced the protection of bridge piers against ship collisions. Ye [8] indicates that the Constant Added Mass (CAM) method cannot accurately capture hydrodynamic effects. The study proposes an improved analytical formula that better estimates the energy absorption during such collisions. Nian [9] proposes an innovative Functionally Graded Lattice Filled Protection Structure (FGLPS) that significantly enhances energy absorption and reduces impact damage in thin-walled structures under ship collisions. For assessing damage after a ship strikes a bridge, Guo and colleagues [10] proposed an optimal sensor placement strategy that enriches the data available for damage detection to determine the extent of bridge damage following a ship collision. Gholipour and others [11] identified an effective bridge damage index method based on factors such as pier deflection, internal energy absorbed by piers, and axial load-bearing capacity of pier columns. With bridges enduring damage over long-term service due to traffic loads, environmental factors, and sudden incidents, effective bridge monitoring methods have become crucial for ensuring structural safety. Jeong and colleagues [12] introduced an information modeling framework to support bridge monitoring applications, integrating geometric models, analysis models, Bridge Management Systems (BMS), and Structural Health Monitoring Systems (SHM) for integrated management of bridge information and sensor data. Farhangdoust and others [13] summarized non-destructive testing methods for bridge expansion joints. Ni and others [14] combined SHM data with Bayesian regression models to assess the health status of bridge expansion joints.
In recent years, with the advancement of positioning technology, three-dimensional (3D) scanning technology has increasingly been used in routine bridge inspections. Xi et al. [15] used terrestrial laser scanning technology to monitor high-temperature deformations in a long-span steel truss arch bridge with a main span of 432 m, proposing an effective measurement method for surface deformation based on non-uniform rational B-spline surfaces derived from 3D point cloud data. Yoon [16] introduced a method combining laser scanning and signal processing to automatically determine the optimal placement of prefabricated bridge deck panels relative to prefabricated beams, minimizing mismatches between shear notches and connectors, thus accelerating the construction process. Almukhtar et al. [17], through proof of concept, revealed the applications of 3D laser scanning technology in construction, explored its compatibility with emerging technologies like Building Information Modeling (BIM), and strengthened the connection between 3D laser scanning and BIM methodologies. Liu et al. [18] introduced a bridge pier crack assessment method based on unmanned aerial vehicles (UAVs) and 3D scene reconstruction that corrects perspective distortions and geometrical distortions on non-flat structural surfaces, achieving accurate crack localization and assessment. SAR, with its high-resolution imaging capabilities, is currently being used in deep learning-based vessel recognition. Wei et al. [19] facilitated the study of vessel detection and instance segmentation based on Convolutional Neural Networks (CNN) by constructing a high-resolution SAR image dataset, demonstrating its effectiveness and feasibility on high-resolution SAR images. Cui et al. [20] proposed a multi-scale ship detection method in SAR images based on a Dense Attention Pyramid Network (DAPN), which effectively extracts rich resolution and semantic information and refines feature maps, achieving high-precision detection of ships in various scenes. Yang et al. [21] introduced a single-stage ship detector that, by incorporating a coordinate attention module and a receptive field enhancement module, accurately detects and identifies ship targets in SAR images, displaying superior performance on multiple public datasets.
Due to the low cost and ease of signal analysis of video images, deep learning networks for computer vision analysis of video information have shown high efficiency in recognizing ship targets, widely applied in identifying vessels in navigational channels. Chen et al. [22] proposed a detection method combining an improved Generative Adversarial Network (GAN) with a CNN for detecting small target ships in video images. Zheng et al. [23] addressing issues of large parameters, high computational demand, and poor real-time performance in ship target detection, proposed the MobileNet Compact YOLOv5 (MC-YOLOv5s) algorithm based on You Only Look Once Version 5 (YOLOv5), utilizing the MobileNetV3 Small lightweight network as a replacement for the YOLOv5 feature extraction backbone, enhancing the detection accuracy of ship targets in videos. Chen et al. [24] presented an integrated YOLO framework based on video for vessel behavior analysis, accurately detecting ships and identifying historical behaviors to enhance the capacity and safety of terminal transportation networks. Li et al. [25], based on ship bow classification and hull boundary determination, utilized new ship bow features in the polar coordinate transformation domain, combined with support vector machine classification and surrounding consistency lines, effectively detecting nearshore vessels with accuracy and robustness. Zhang [26] proposed a big data analytics method to actively reduce grounding risks, achieving trajectory prediction for operational vessels.
In current bridge anti-collision research, the focus is often placed on the protection and early warning of bridge piers, with less attention given to the protection and early warning of the bridge underside. However, the underside of bridges is also a potential collision risk area, especially for bridges spanning water bodies or navigational channels. When vessels travel on water, collisions between their bottom and the underside of bridges can cause severe damage to bridge structures, and even lead to accidents, making the accurate and real-time acquisition of vessel heights in navigational channels a critical step in ensuring the safety of the bridge underside. However, for bridges with spans of hundreds of meters, the water bodies they span are often crowded with vessels, making the heights, speeds, and trajectories of vessels variable and complex. To obtain real-time heights of multiple target vessels and provide timely warnings, further research is needed.
Based on the overview provided, this paper proposes an innovative method for over-height vessel warning, combining precise point cloud coordinates with camera-captured images for positioning. This method uses deep learning and spatial transformation to calculate the height of vessels in transit, thereby enabling early warning for vessels exceeding height limits near bridges. The main contributions include the following: (1) Proposing a method for locating navigational channel vessels by combining three-dimensional laser scanning with two-dimensional video images, utilizing the high precision of 3D laser scanning and the efficiency of video image processing to achieve accurate three-dimensional coordinate positioning of camera-captured channel images. (2) Developing a multi-target ship key point recognition framework, capable of accurately identifying the pixel coordinates of the ship’s waterline and highest points, obtaining various navigational postures of ships in the near-bridge area channel, and providing key information for subsequent height calculations. (3) It enables real-time ship body positioning and provides warnings for yawing ships; at the same time, it introduces a spatially related transformation method for calculating ship height, which can output the height of ships above the water surface in real time. This method also considers the real-time water levels on multiple bridges downstream, providing real-time warnings for ships that exceed the height limits across the entire bridge group. These contributions integrate ship height monitoring and collision warnings into one system, using various technical means to achieve real-time acquisition and analysis of channel ship height information, providing significant technical support for ship safety management.
The framework of the article is as follows: the first part introduces the research background of this paper; the second part introduces the proposed method framework and details its core theories and technologies; the third part introduces the spatial transformation and 3D laser point cloud for precise coordinate positioning in the channel; the fourth part discusses edge detection-based key feature extraction and vessel positioning; the fifth part introduces the calculation of various vessel heights and joint over-height and yaw warnings for multiple bridges; the sixth part demonstrates the application and verification of the proposed method on a bridge over the Yangtze River, proving its effectiveness; and the seventh part presents the conclusions of the paper.
2. Theoretical Framework
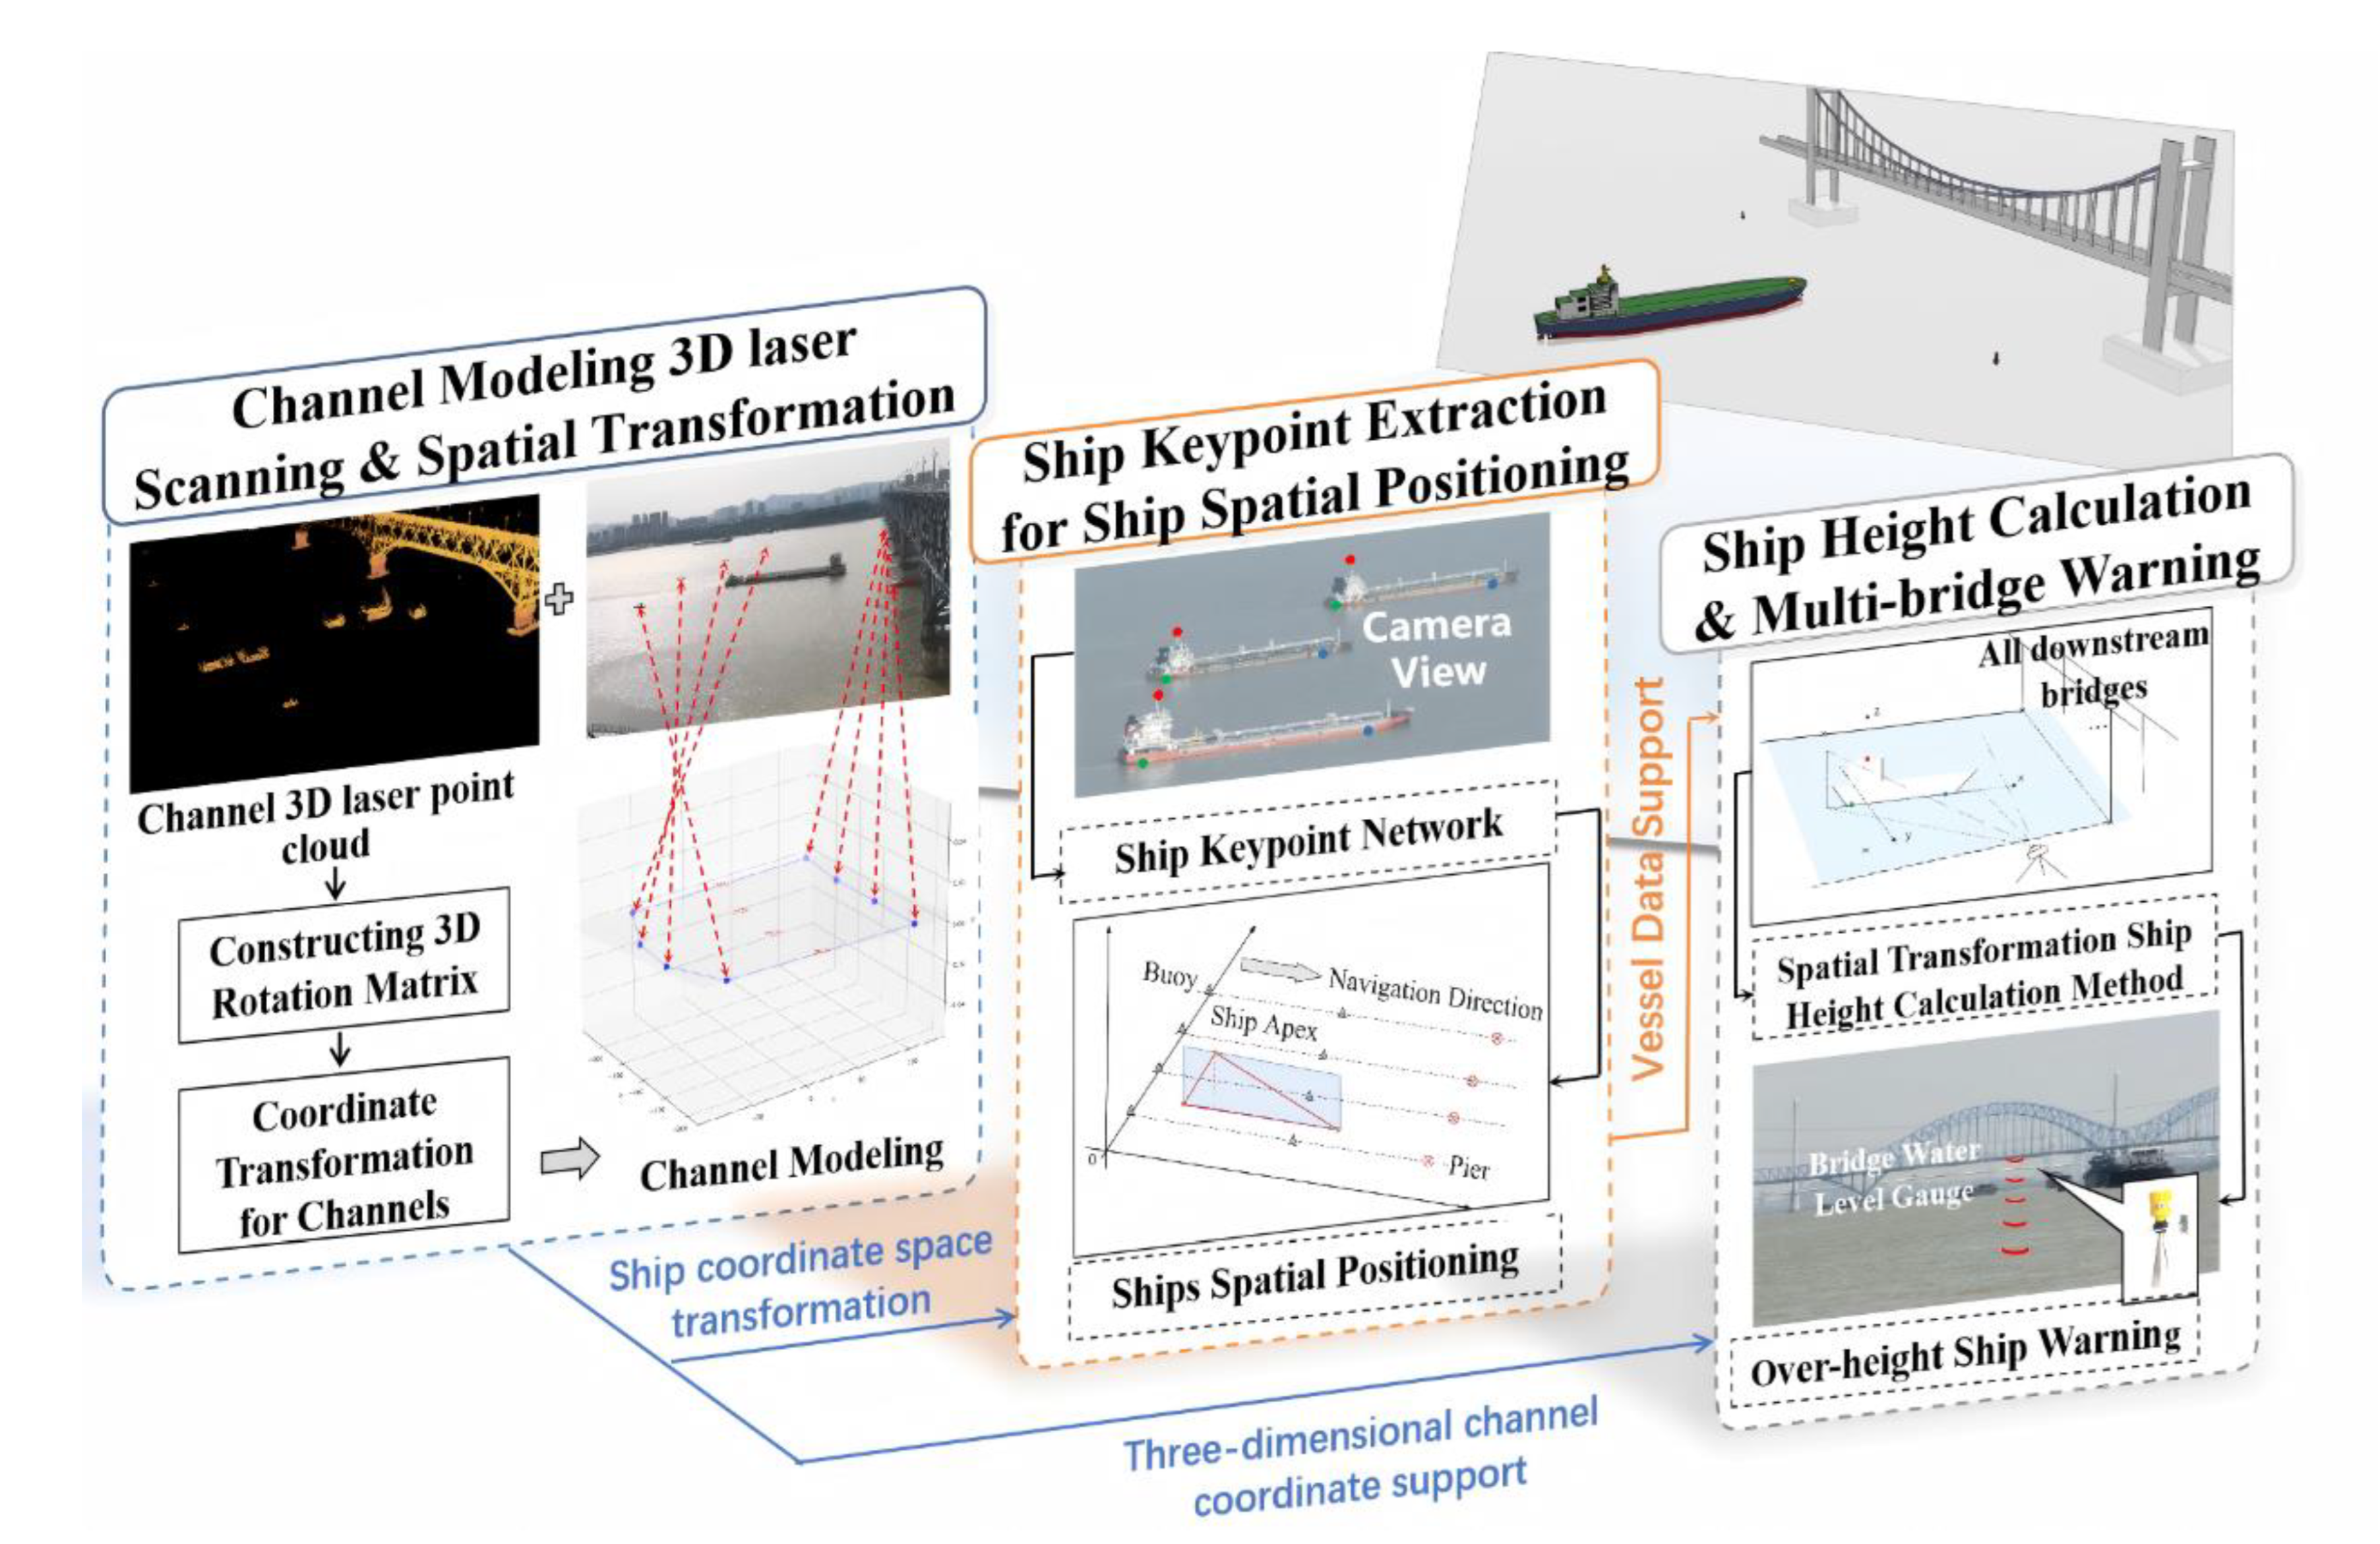
This article details a method for excessive height measurement and warning for vessels based on 3D laser and video sensing, aimed at real-time computation of ship height above the waterline and height limit warnings. The overall framework of the proposed method is illustrated in Figure 1. This method integrates 3D laser scanning with video imaging to address the challenge of vessel positioning in wide water areas. First, the system utilizes the high precision of laser scanning to perform one-time accurate modeling of key channel positions, while using video imagery as a continuous, long-term monitoring data source. By combining two-dimensional video data with spatial information, it extracts the spatial location of navigation channels from images, leveraging the high efficiency, strong anti-interference capability, and rich visual content of video technology. Next, a deep learning-based key point detection model is developed to automatically extract the two-dimensional pixel coordinates of critical ship features, such as the waterline and the top of the vessel, from video frames. Finally, to obtain real-time vessel height, this study proposes a spatial transformation method that maps the extracted 2D pixel coordinates to 3D world coordinates. Based on the automatically identified key points, the method enables real-time calculation of the actual vessel height above the water surface. This height is then correlated with water gauge data from all downstream bridges to facilitate timely risk assessment and issue warnings for over-height vessels, providing strong technical support for preventing ship–bridge collisions.
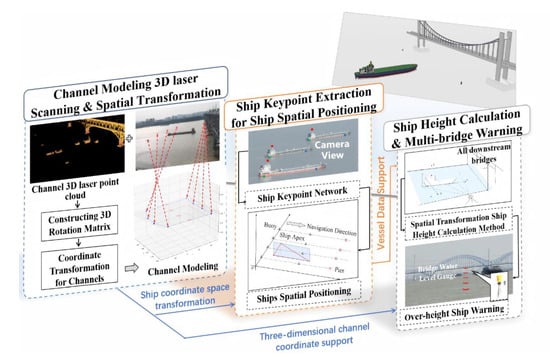
Figure 1.
Framework of the real-time collision warning system for over-height ships at bridges.
3. Precise Channel Coordinate Positioning Based on Spatial Transformation and 3D Laser Point Cloud
3.1. Principle and Structure of Spatial Transformation
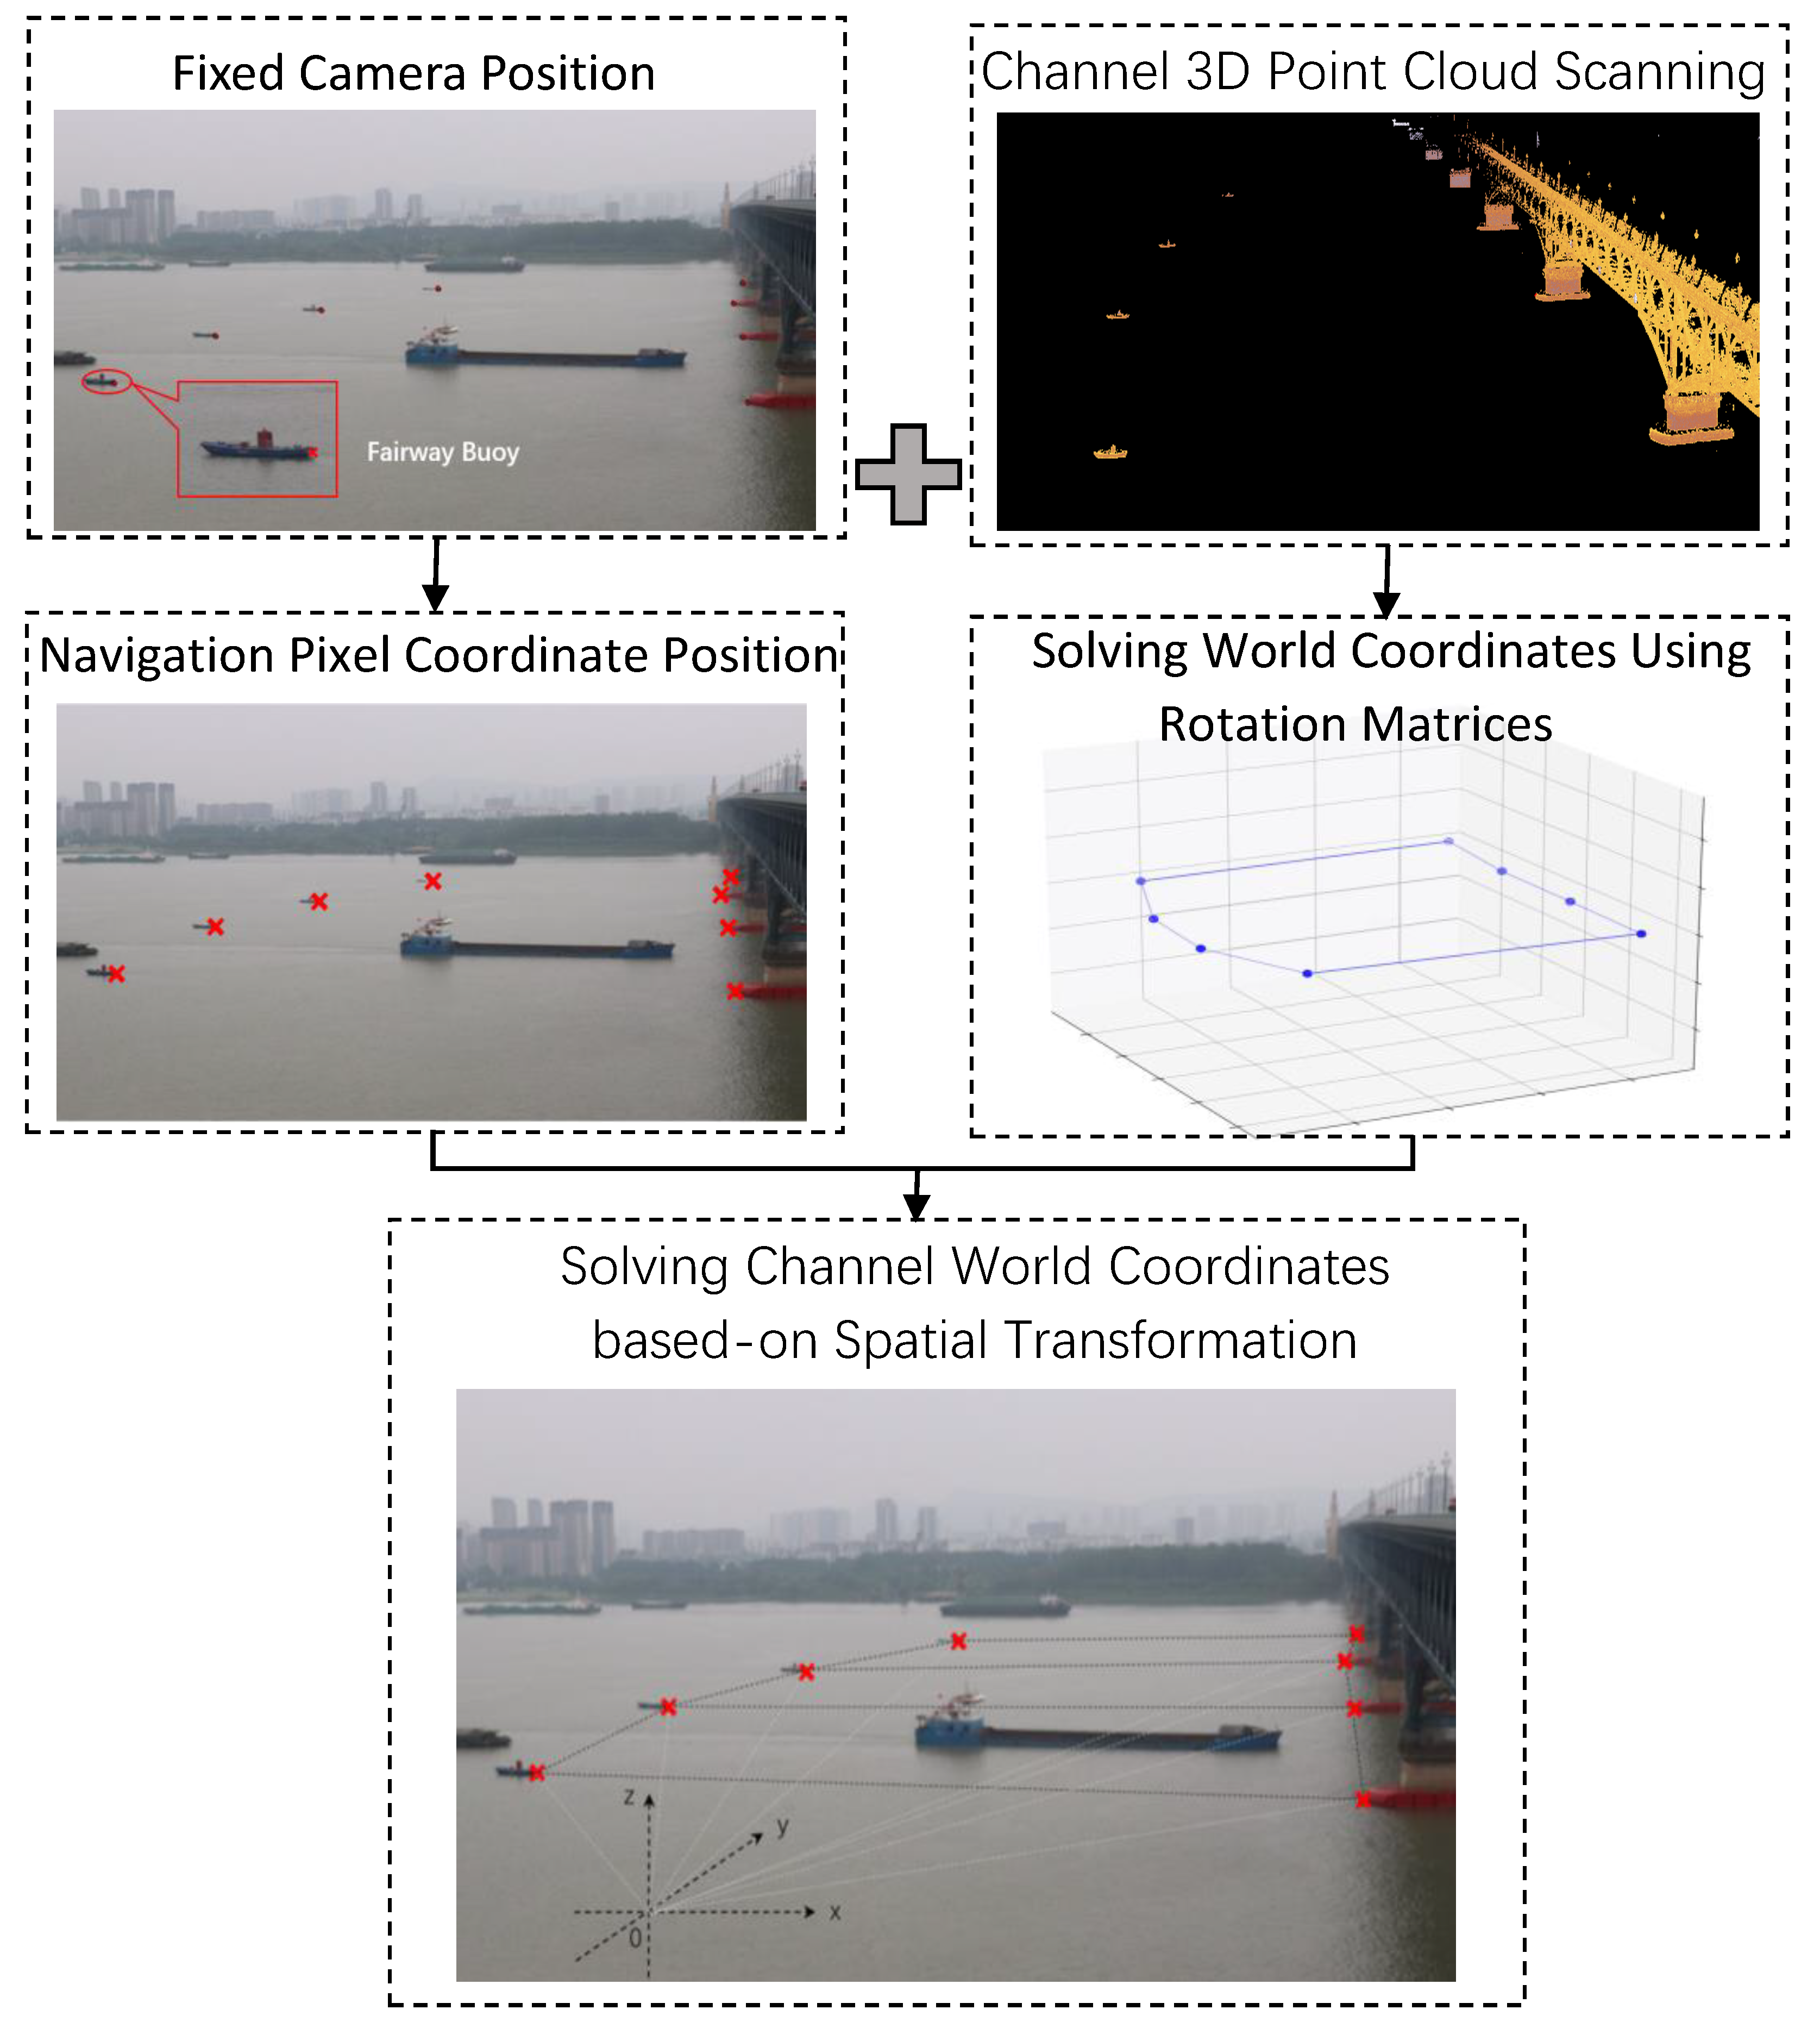
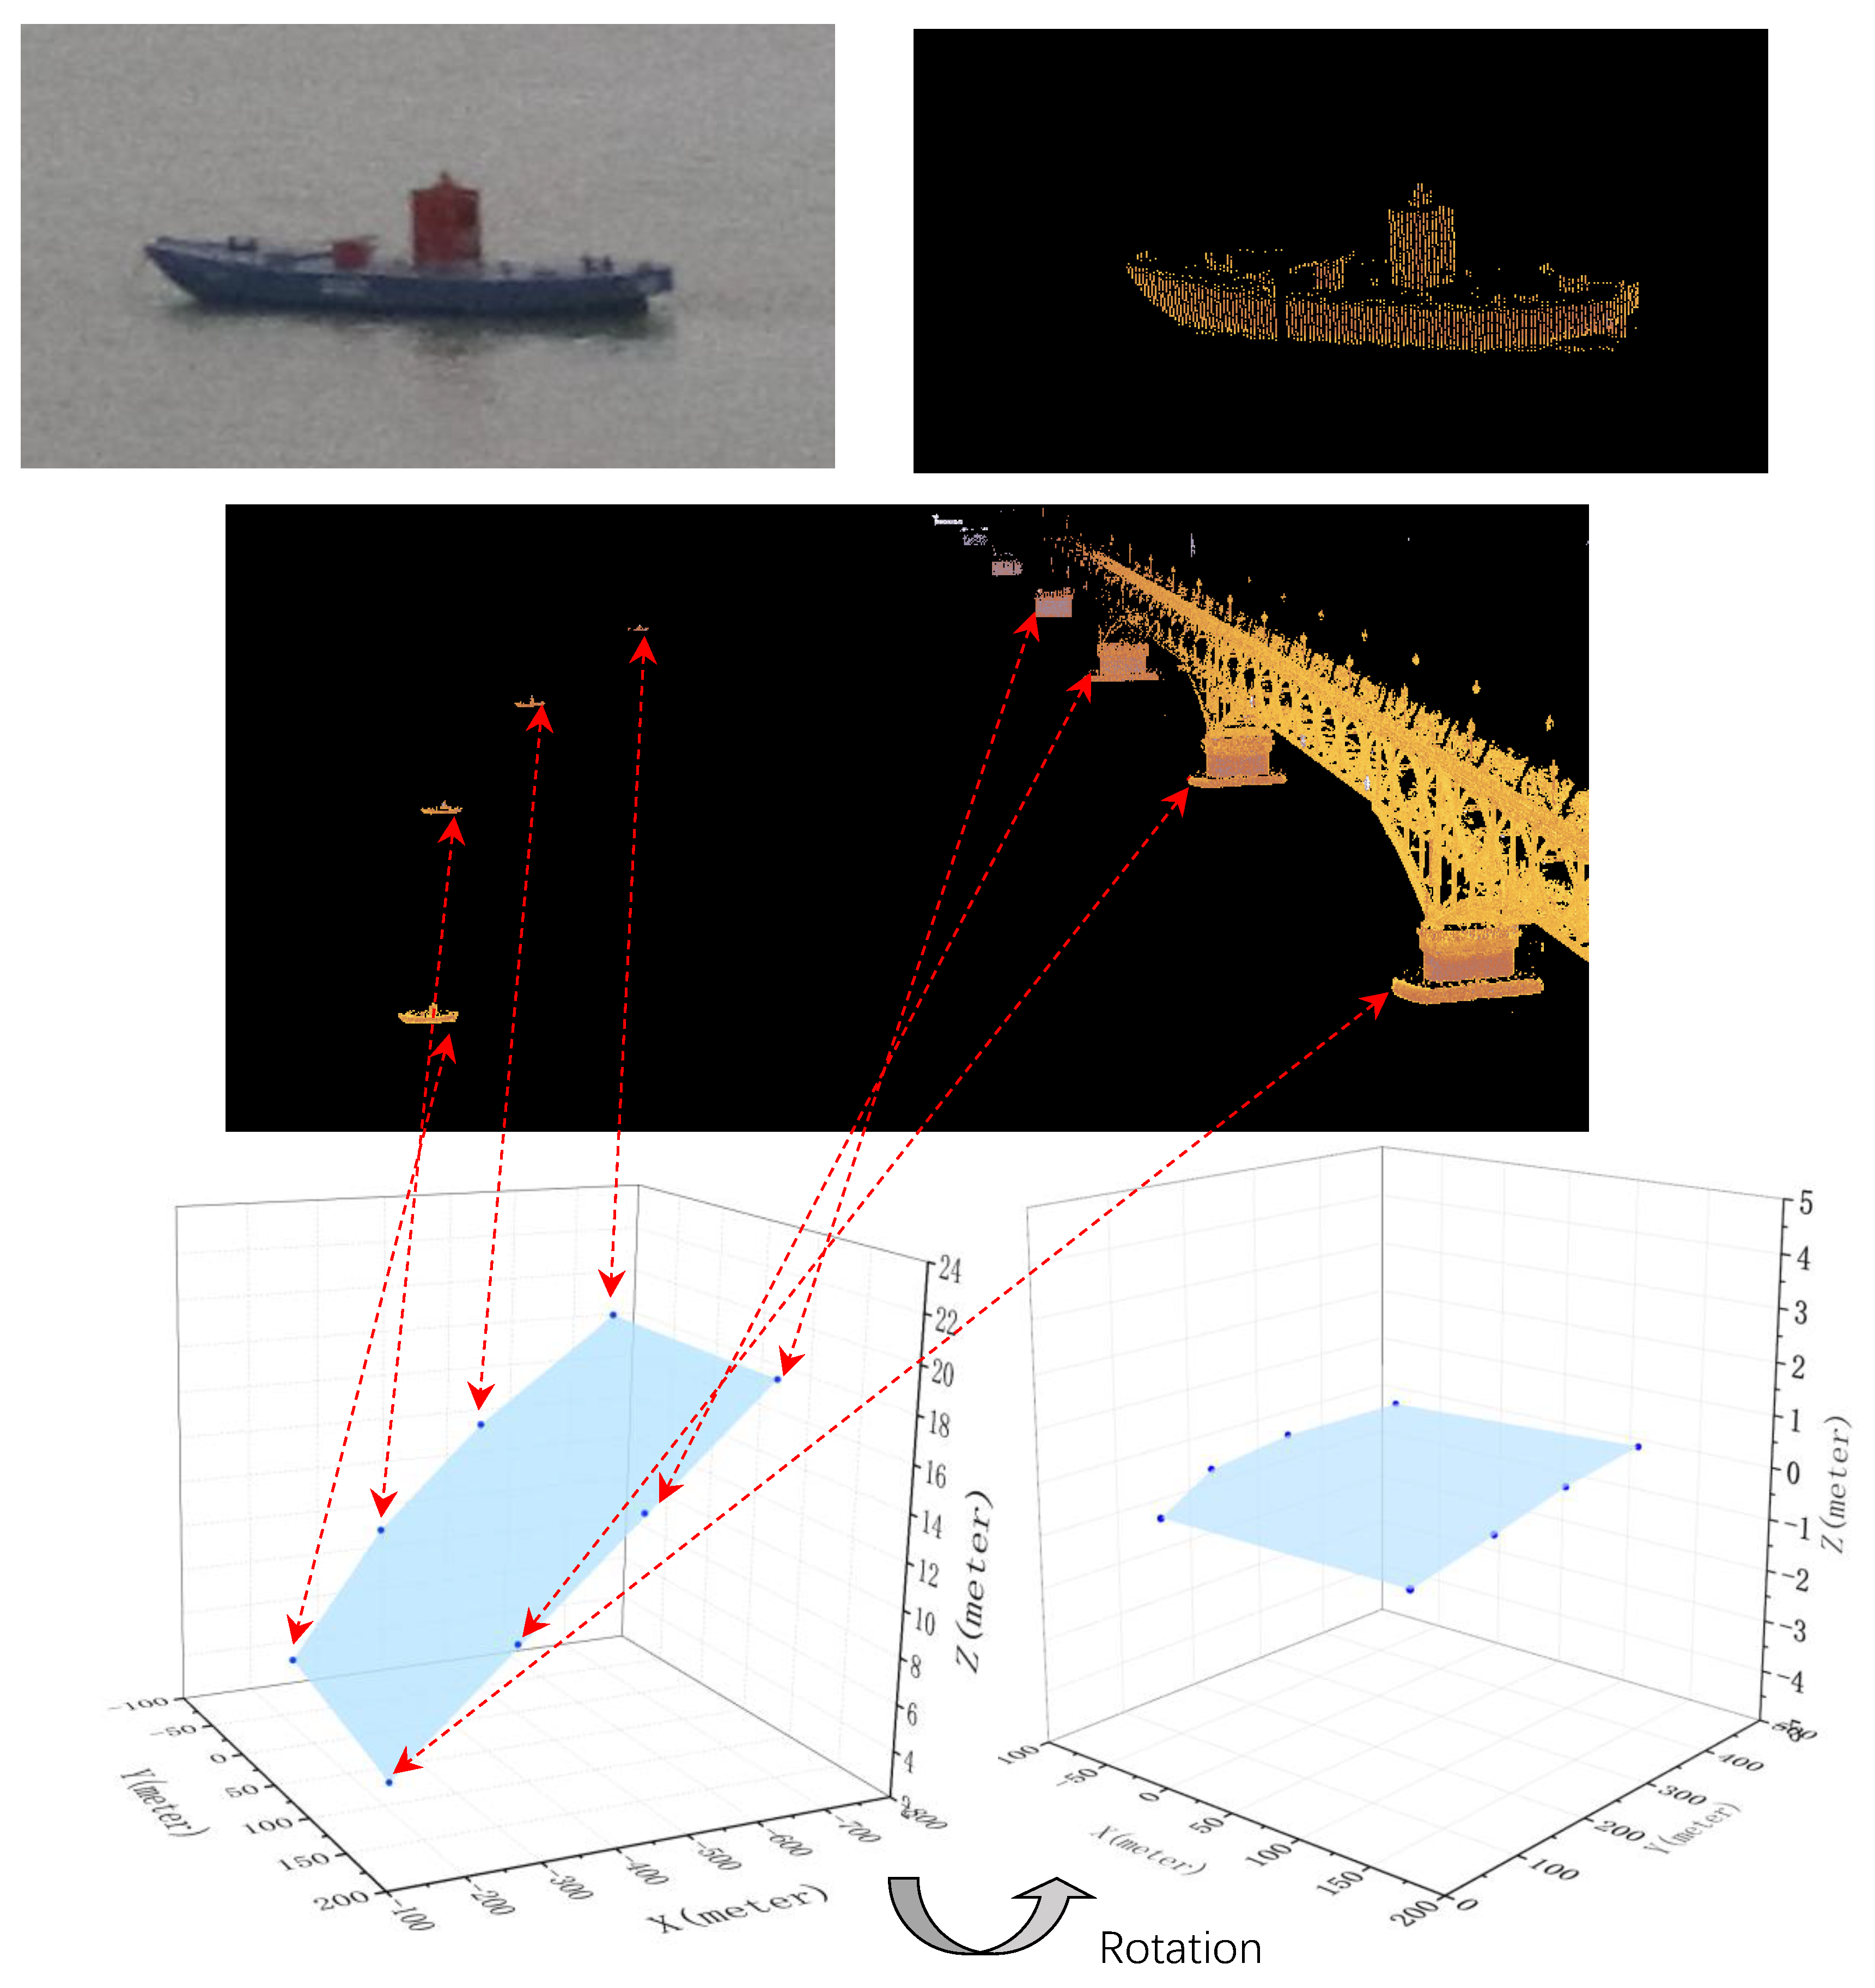
This chapter proposes a method that utilizes laser scanning to obtain precise depth information, addressing the challenge of cameras failing to capture accurate depth information of targets at long distances in vast water bodies. The core of this method integrates three-dimensional data obtained from laser scanning into two-dimensional video images for channel monitoring, thus addressing challenges of wide fields of view, long-duration, and high-precision real-time monitoring, as shown in Figure 2. Specifically, Figure 2 illustrates the spatially positioned feature points (red crosses), zoomed-in buoy details (red box), spatial boundary connections (blue lines and dots), and the 3D coordinate axis directions (dotted lines), which together demonstrate the transformation from image pixels to real-world coordinates. The test bridge investigated in this study is a combined highway–railway bridge. The main span features a steel truss structure with a total length of 1577 m. Its configuration includes nine piers and 10 spans, arranged in a sequence of 1 × 128 m + 3 × 160 m + 3 × 160 m + 3 × 160 m. Cameras are fixedly installed on the navigation shore, covering the navigational area and buoys in the direction of ship entry. Multiple buoys are selected on the vast water surface to form a coordinate network covering the detection area. At the same time, a one-time scan of the camera-monitored area is performed using a laser scanner. The purpose of this step is to obtain the real-world coordinates corresponding to each point of the water surface coordinate grid in the monitoring images. This approach establishes a mapping relationship between the image pixel coordinate system and the world coordinate system. Based on the spatial transformation method, the three-dimensional world coordinates corresponding to any pixel coordinate point on the channel in video monitoring can be calculated.

Figure 2.
Integration of the channel image pixel coordinate system with the world coordinate system.
3.2. Calculation of Channel Spatial Coordinates Based on Laser Scanning
To obtain depth information of vessels, the first step is to acquire the overall position information of the channel. As the camera’s field of view, fixed on the shore, is occupied by a vast expanse of water, it is necessary to identify appropriate feature points for spatial positioning. For this purpose, buoys covering the entire monitored channel area are selected as control points. These buoys can obtain position information on the water surface through a 3D laser scanner and also locate the pixel coordinates of the buoys in the monitoring video. For this study, the RIEGL VZ-400i laser scanner (RIEGL Laser Measurement Systems GmbH, Horn, Austria) was used, which has a Peak Pulse Repetition Rate (PRR) of 100 kHz, an azimuth scanning angle of 0.010 degrees, and an elevation scanning angle of 0.020 degrees, resulting in a total of 3,121,929-point cloud data. Figure 3 displays the images used for buoy positioning and the details of the laser scanning. To further reduce positioning errors, the study uses eight uniformly distributed buoy vertices across the monitored water area to form a positioning network, establishing a mapping relationship with the two-dimensional monitoring image. The three-dimensional coordinates of these points are as shown in Table 1. The first to third columns represent the three-dimensional coordinates (x, y, z) of four pier control points arranged sequentially from the shore toward the channel, measured in meters. The fourth to sixth columns show the corresponding three-dimensional coordinates of four buoys, also obtained through laser scanning, with units in meters.

Figure 3.
Acquisition of three-dimensional point cloud coordinates for the channel.

Table 1.
Three-dimensional laser scanning of channel marker coordinates.
The method for processing the three-dimensional coordinate data of channel buoys obtained from the 3D laser scanner is illustrated in the diagram. Although these buoys’ intersections on the water surface are at the same horizontal level, the vertical coordinates of the three-dimensional points obtained from scanning are not consistent. To facilitate subsequent coordinate space transformation with corresponding points in the image, a three-dimensional rotation matrix construction method is used to rotate the channel’s three-dimensional data obtained from the scanner to a coordinate system where the vertical coordinates are at the same horizontal level.
The rotation angle is defined in Equation (1):
where n is the number of control points selected. The variable z denotes the vertical coordinate of the reference point, and (x1, y1) represents the horizontal position coordinates of the first pier near the shore in the three-dimensional space. The three-dimensional rotation matrix used here by Szeliski [27] can be represented in Equation (2):
The coordinates of each point after rotation are calculated using Equation (3):
After the rotation, the vertical coordinates of the horizontal plane are set to zero, thus obtaining the post-rotation coordinates of the channel control points, as shown in Table 2. The first to third columns represent the new coordinates of the pier control points after coordinate rotation, where the z-values have been normalized to zero to place them on a unified horizontal plane. The fourth to sixth columns show the rotated coordinates of the corresponding buoy control points, also with z-values set to zero, thereby facilitating the subsequent transformation between two-dimensional image pixel coordinates and three-dimensional world coordinates. This processing step aims to adjust the coordinate system so that the buoys are on the same horizontal plane in the vertical coordinate direction, facilitating subsequent coordinate transformation and data processing.
Table 2.
Processed three-dimensional laser scanning coordinates of channel markers.
Based on the positions of these eight points, a spatial coordinate system is established.
3.3. Principle of Transformation from Two-Dimensional Image Coordinates to Three-Dimensional Space
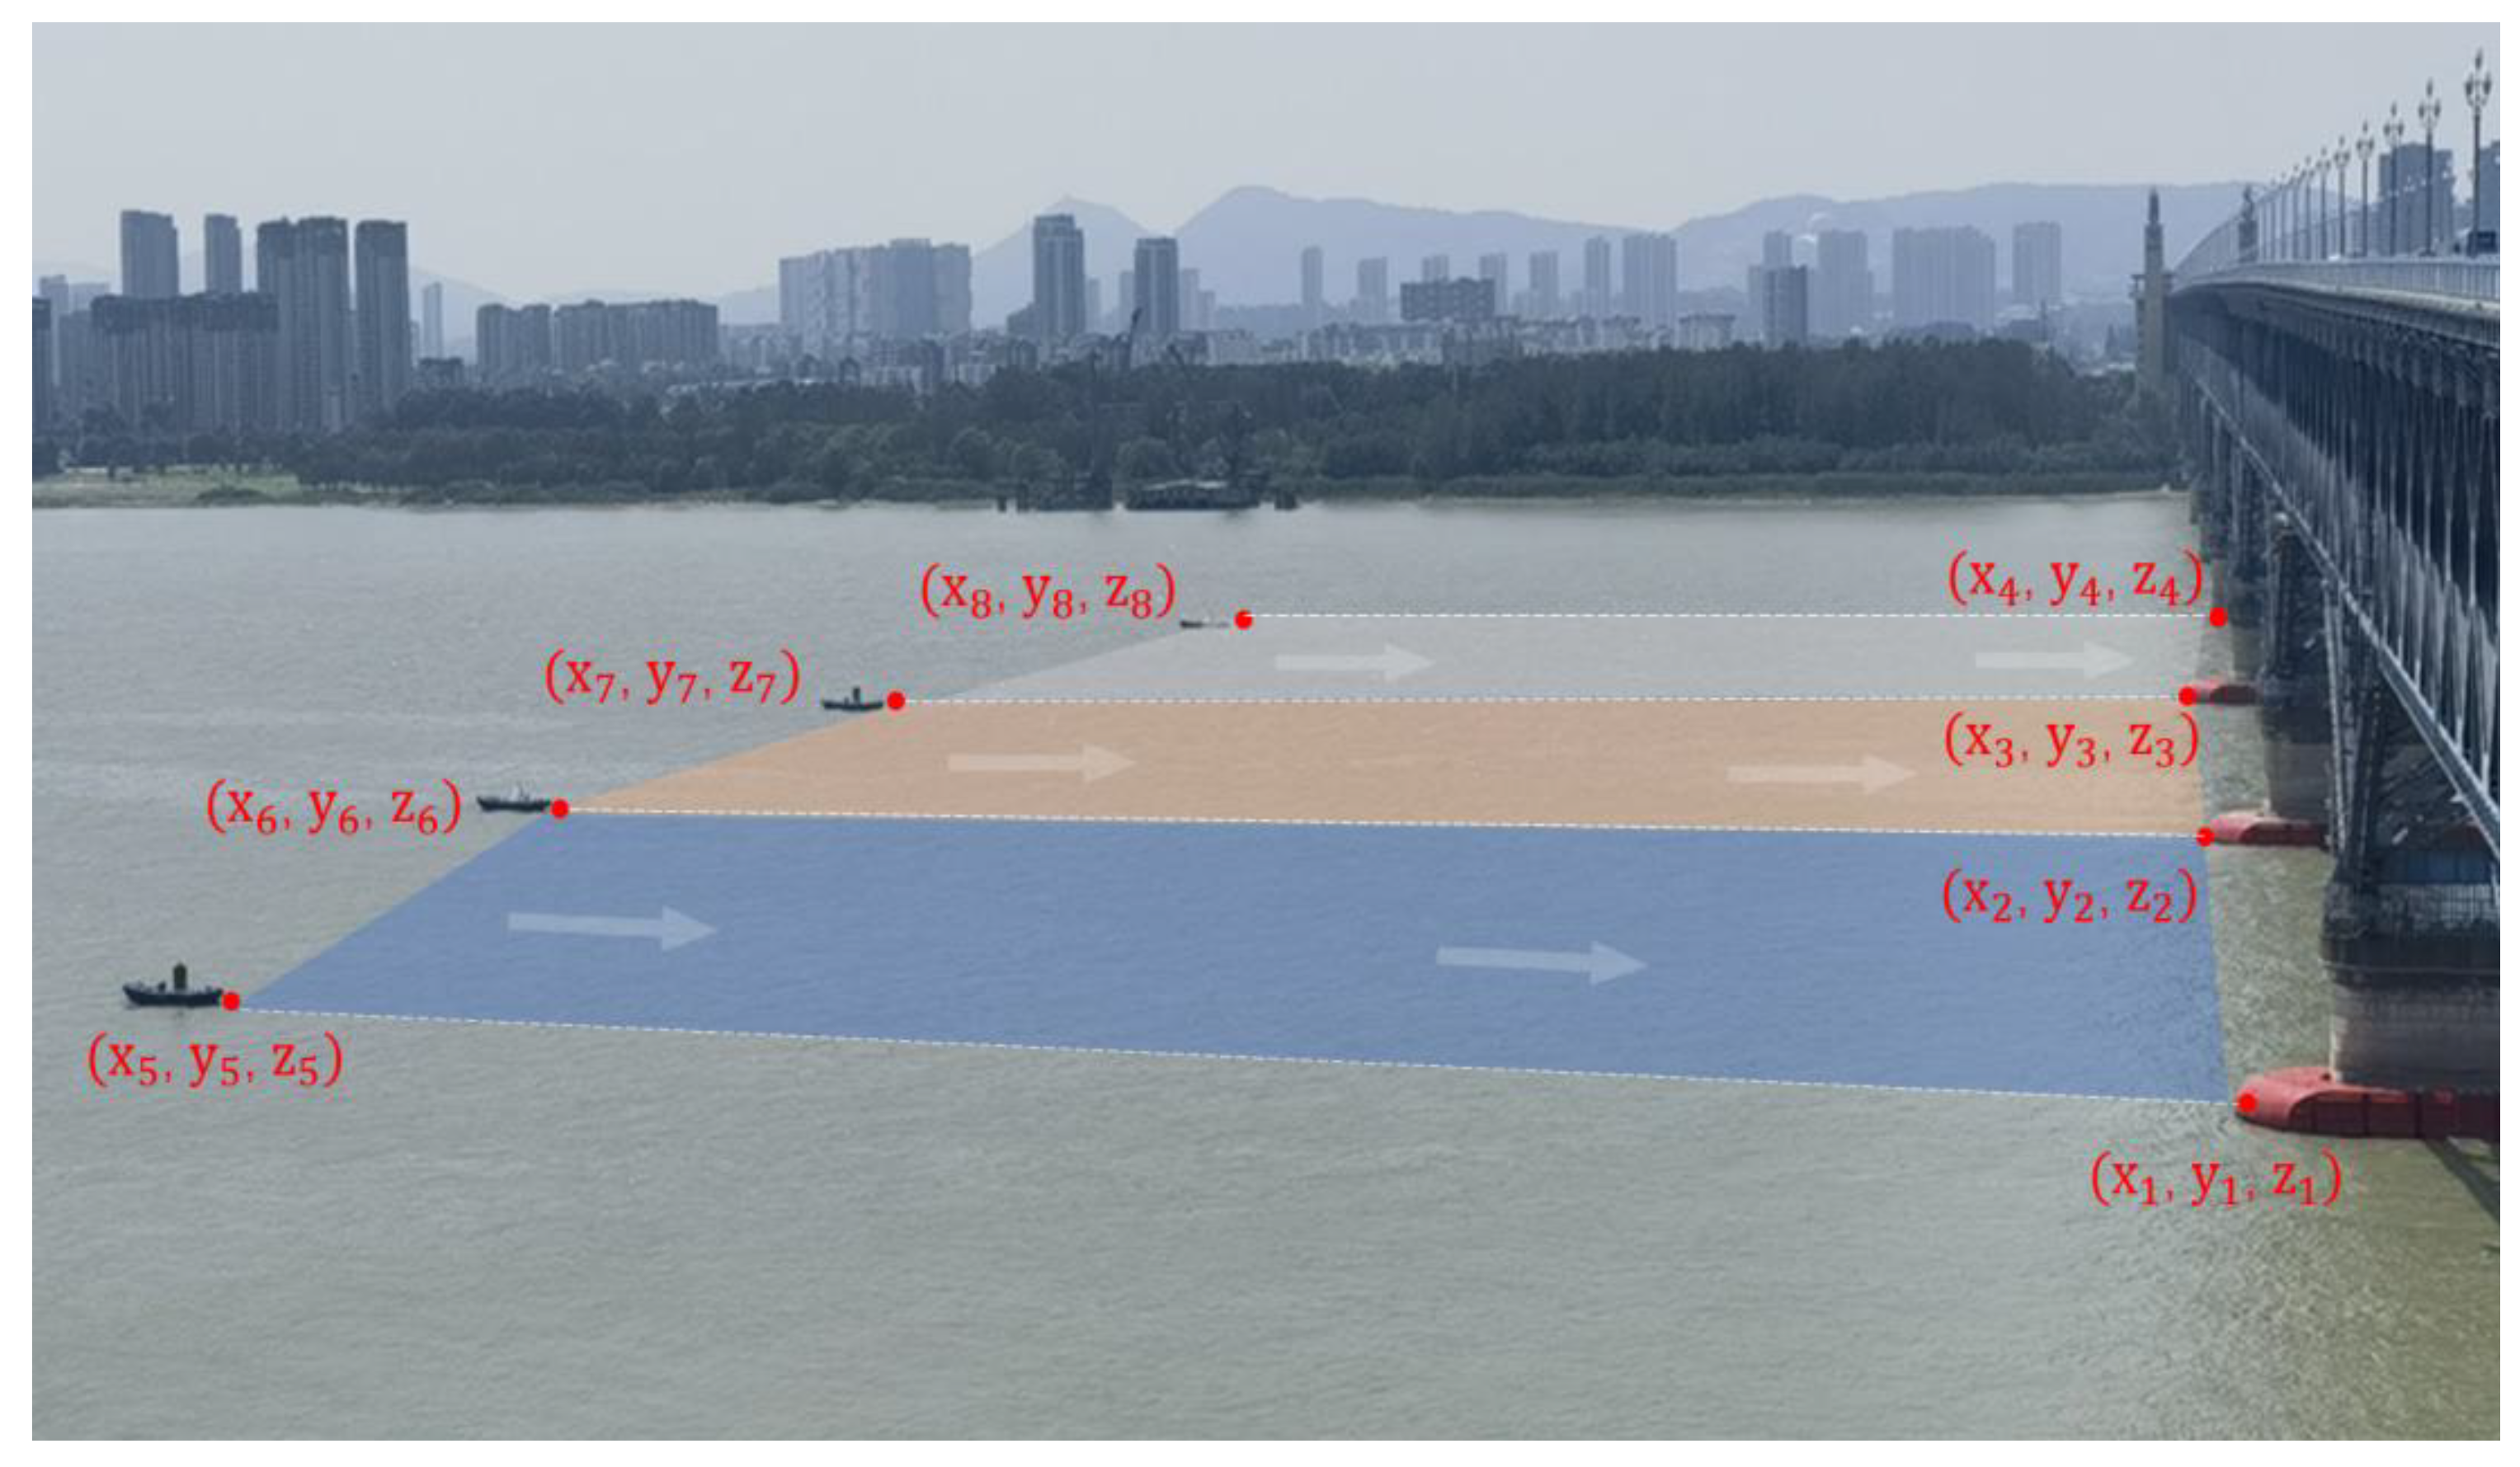
After observing the navigational buoys on the channel and obtaining their pixel coordinates in the image through monitoring video, we can obtain the real-world three-dimensional coordinates of the buoys through the laser scanner, as shown in Figure 4. The mapping relationship between these two types of coordinates is crucial because they can be used to establish a corresponding relationship between the two-dimensional pixel coordinates of the image and the world coordinates on the water surface.
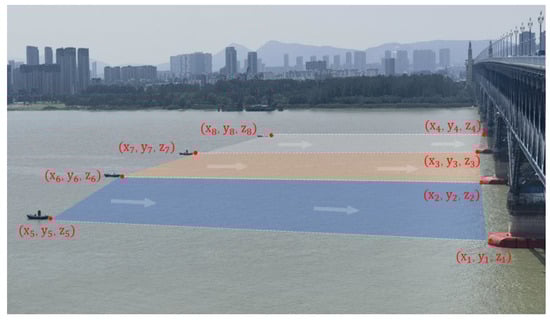
Figure 4.
Three-dimensional spatial modeling of channel images.
In constructing this mapping relationship, we use the water surface as the xy-plane, and the direction perpendicular to the water surface as the z-axis. Since the buoy points are on the same horizontal plane, we can match the corresponding points by constructing an augmented matrix, which optimizes the mapping transformation between image pixel coordinates and real-world coordinates.
The construction of the augmented matrix involves real-world coordinates (xi, yi) and pixel coordinates (xi′, yi′). At least four control points with no three collinear are needed to estimate the homography [28]. This matrix is represented in Equation (4):
Matrix A is a 2N × 9 matrix, where N is the total number of selected control point coordinates, with each row representing the relationship of a corresponding point. This augmented matrix represents the linear relationship between pixel coordinates and real-world coordinates.
Construct a column vector B containing all the real target plane coordinates, as shown in Equation (5):
Solving the system of equations using the least squares method or other linear equation solving techniques, as shown in Equation (6):
Organize it into a 3 × 3 homography matrix H, which can be specifically represented as
Based on the control points associated with image pixel coordinates and real-world coordinates on the channel in monitoring videos, this homography matrix H, as shown in Equation (7), can be used to achieve the output of any point’s pixel coordinates on the channel in the video corresponding to its real-world coordinates.
4. Ship Key Feature Extraction and Body Positioning Based on Edge Detection
4.1. Ship Recognition and Key Point Acquisition
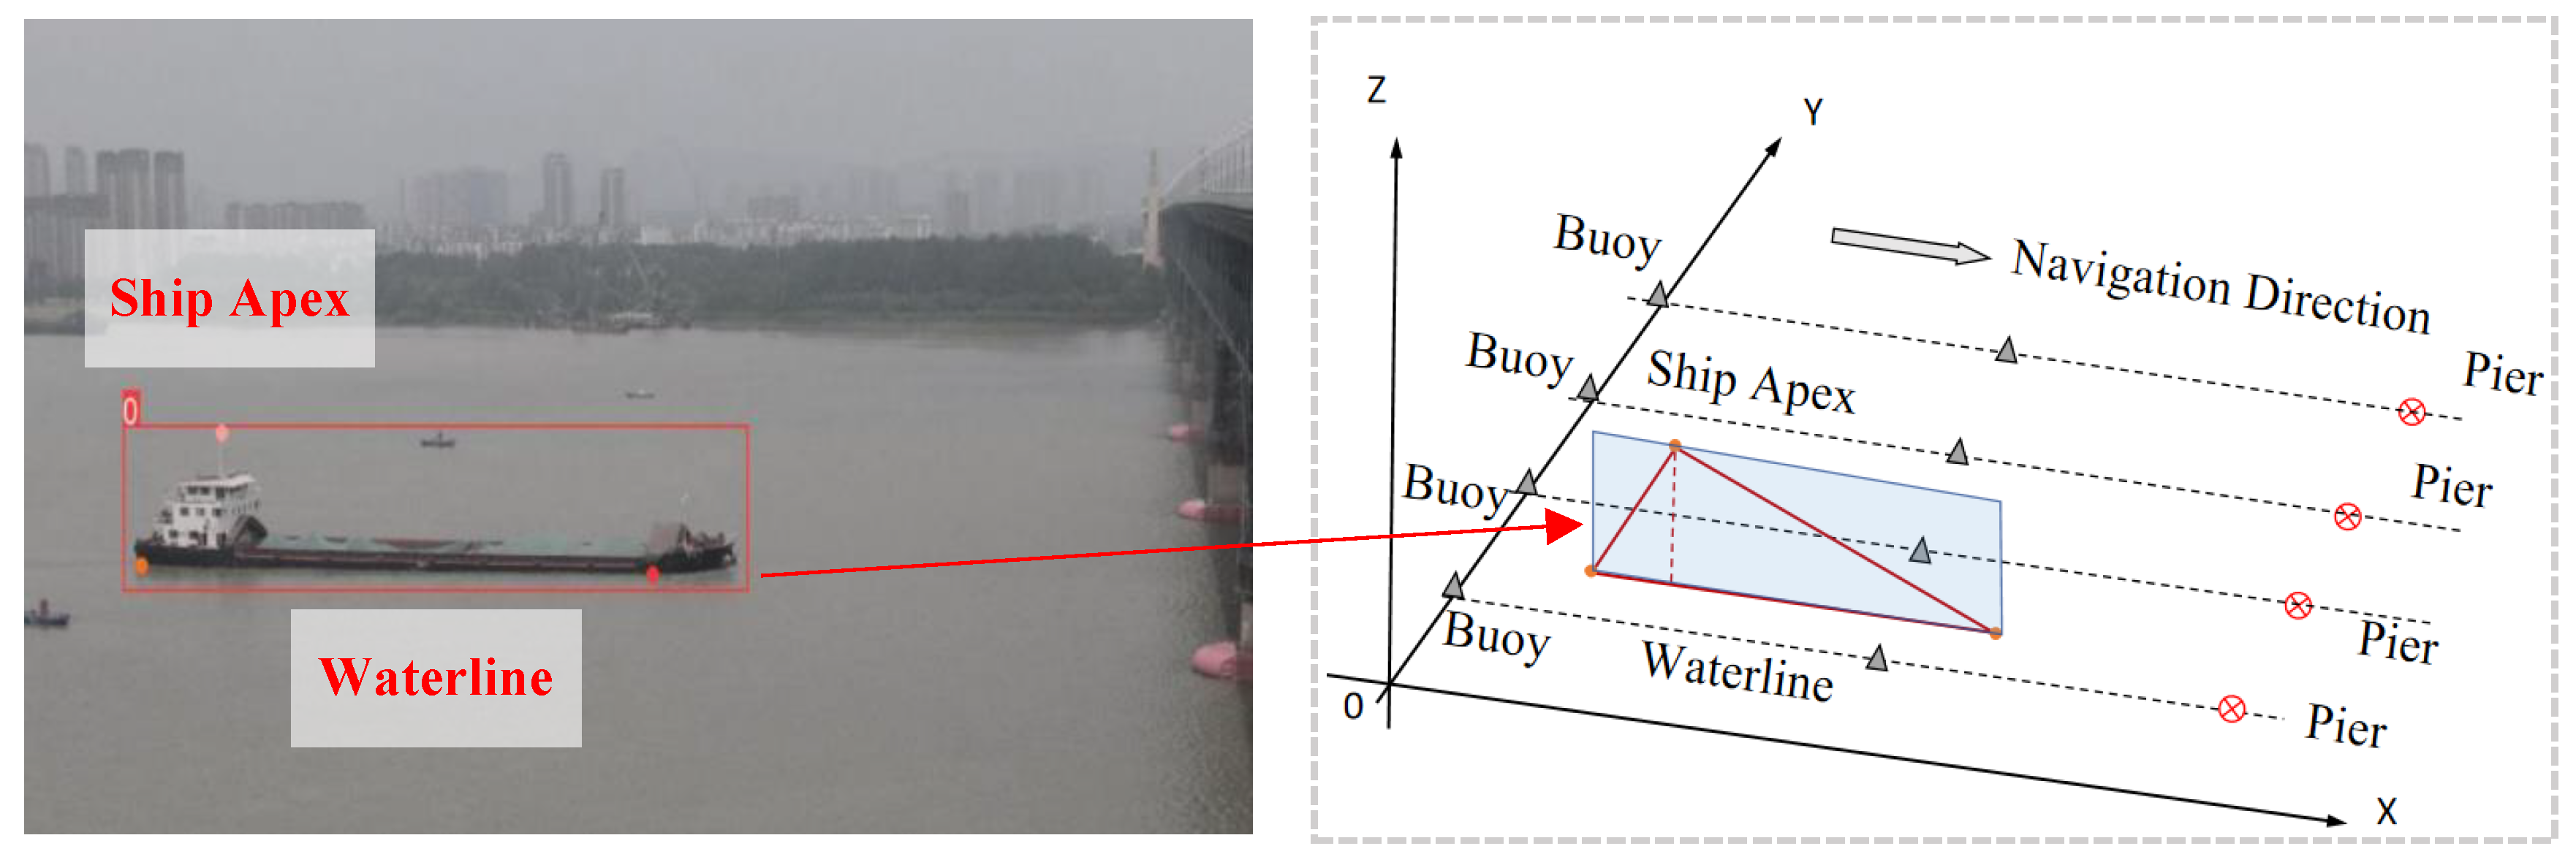
The essence of acquiring key information about ships is identifying specific key points of the ships in the image. The proposed method recognizes and obtains the real position information of ships within the image. After modeling the overall position information of the vast channel, the part of the channel and the ship video images in the monitored channel area are analyzed, as indicated in Figure 5. This paper presents a second-order method for extracting the coordinates of key points of ships navigating the channel, including the positions and highest points. Considering the channel space is relatively open, factors such as buoys, birds, water ripples, and changes in lighting that affect the precision of identifying ship key points still exist. The proposed method’s first stage uses YOLOv8 for real-time extraction of multi-target ship targets in the channel, which has already integrated some optimizations for small target detection, such as preprocessing the training data by resampling, rotating, and translating to increase the number of training samples for neural network learning, excluding irrelevant background information while focusing on key ship features, following the method proposed by Zhao et al. [29], this process refines the identification of ships in complex scenes. In the second stage, the High-Resolution Network (HRNet) module is introduced into the ship key point recognition architecture, adding a multi-dimensional attention mechanism to further extract key features within the target area delineated by the four corners, identifying the ship’s highest point as the top of the ship, and considering the line connecting two points on the ship’s waterline as the position of the ship waterline, following the network design proposed by Wang et al. [30]. After determining the network architecture for key point detection, high-definition images of the ship’s side are needed to create a training dataset for ship height measurements. Over 2000 side-view ship images were captured to form the database for this method’s ship target extraction training; further, for the selected ship area, it is necessary to extract the pixel coordinates of the waterline where the ship intersects the water and the ship’s highest point.
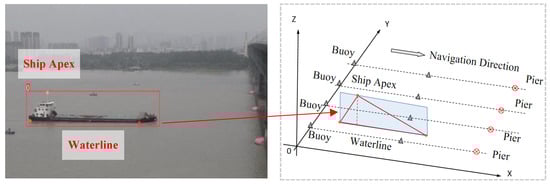
Figure 5.
Extraction of key feature points and positioning of the ship body.
4.2. Three-Dimensional Ship Body Positioning
To further transform the ship information in the video stream into precise coordinate information, the specific process includes targeting the ship identification area range, then selecting the waterline position coordinates as the ship body pixel coordinates. Since the ship’s waterline is the intersection line between the ship and the channel’s water surface, the two positioning points of the ship’s waterline also lie on the horizontal plane of the channel. Utilizing the channel space transformation principle proposed in the previous section, the pixel coordinates of the ship waterline in the channel can be converted into the ship body coordinates in the real-world model, thus completing the real-time acquisition of the ship body postures and positions of multiple target ships in the channel from the video images. Additionally, since the ship is vertical to the water surface, the highest point of the ship in the image is taken as the actual vertex of the ship. The two points on the waterline simplify the overall position shape information of the ship into the position information of the three-point plane required for height measurement. The triangular plane formed by these three points is perpendicular to the horizontal plane of the channel in space, as shown in the figure. The waterline position of the ship in the image represents the current direction and spatial coordinates of the ship’s body, and the distance between the ship’s highest point and the waterline represents the height information of the ship.
5. Multi-Pose Ship Height Calculation and Joint Over-Height and Yaw Warning
5.1. Multi-Pose Ship Height Calculation Method
The ship key feature recognition model in this paper has successfully obtained the two pixel coordinate points of the intersection between the ship and the water surface in the channel monitoring video, as well as the ship’s highest pixel coordinates. First, we need to spatially locate the target ship’s body. The method used involves correlating the three-dimensional world coordinates of control points obtained by the laser scanner with video monitoring images, using formula H to calculate the position of the ship’s waterline, and selecting two real coordinate points based on the distance.
When the camera is directly facing the ships navigating the channel, as shown in Figure 6, the pixel height of the ships on the water surface can be calculated by Equation (8):
where (x1′, y1′) are the pixel coordinates of the ship’s vertex, (x2′, y2′) are the pixel coordinates at the waterline of the ship’s bow, and (x3′, y3′) are the pixel coordinates at the waterline of the ship’s stern. (x2, y2, z2) and (x3, y3, z3) are the real-world coordinates of the ship’s waterline at the bow and stern. Most of the time, the direction of a ship’s travel is nearly parallel to the channel, and the waterline information captured by the camera can serve as the direction of the ship’s travel. However, when the ship is traveling diagonally within the channel, it is necessary to consider the depth errors that may occur due to yawing. The yaw angle α of the ship can be represented by Equation (9):
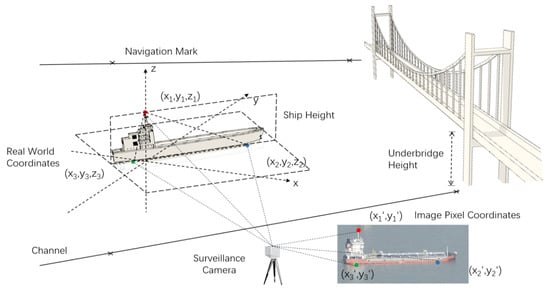
Figure 6.
Multi-pose ship height calculation method based on spatial transformation.
When side images of ships are captured as they navigate in various attitudes, side surveillance images of the ship can be considered as cross-sectional information of the ship’s longitudinal section. As a whole, when considering the yaw angle of the ship, the three-dimensional height coordinates in the real world can be calculated using the pixel coordinates of the ship’s highest point and the three-dimensional spatial coordinates of its body positioning points. The expression for its height h is shown in Equation (10):
By considering the spatial position information of the ship’s waterline, the real lateral coordinates of the ship can be obtained. The error impact on height measurement brought by this factor can be calculated by refining the orientation of the ship’s body, thus obtaining the real-time height of various navigational attitudes of ships in the channel.
5.2. Yaw Warning and Multi-Bridge Over-Height Warning
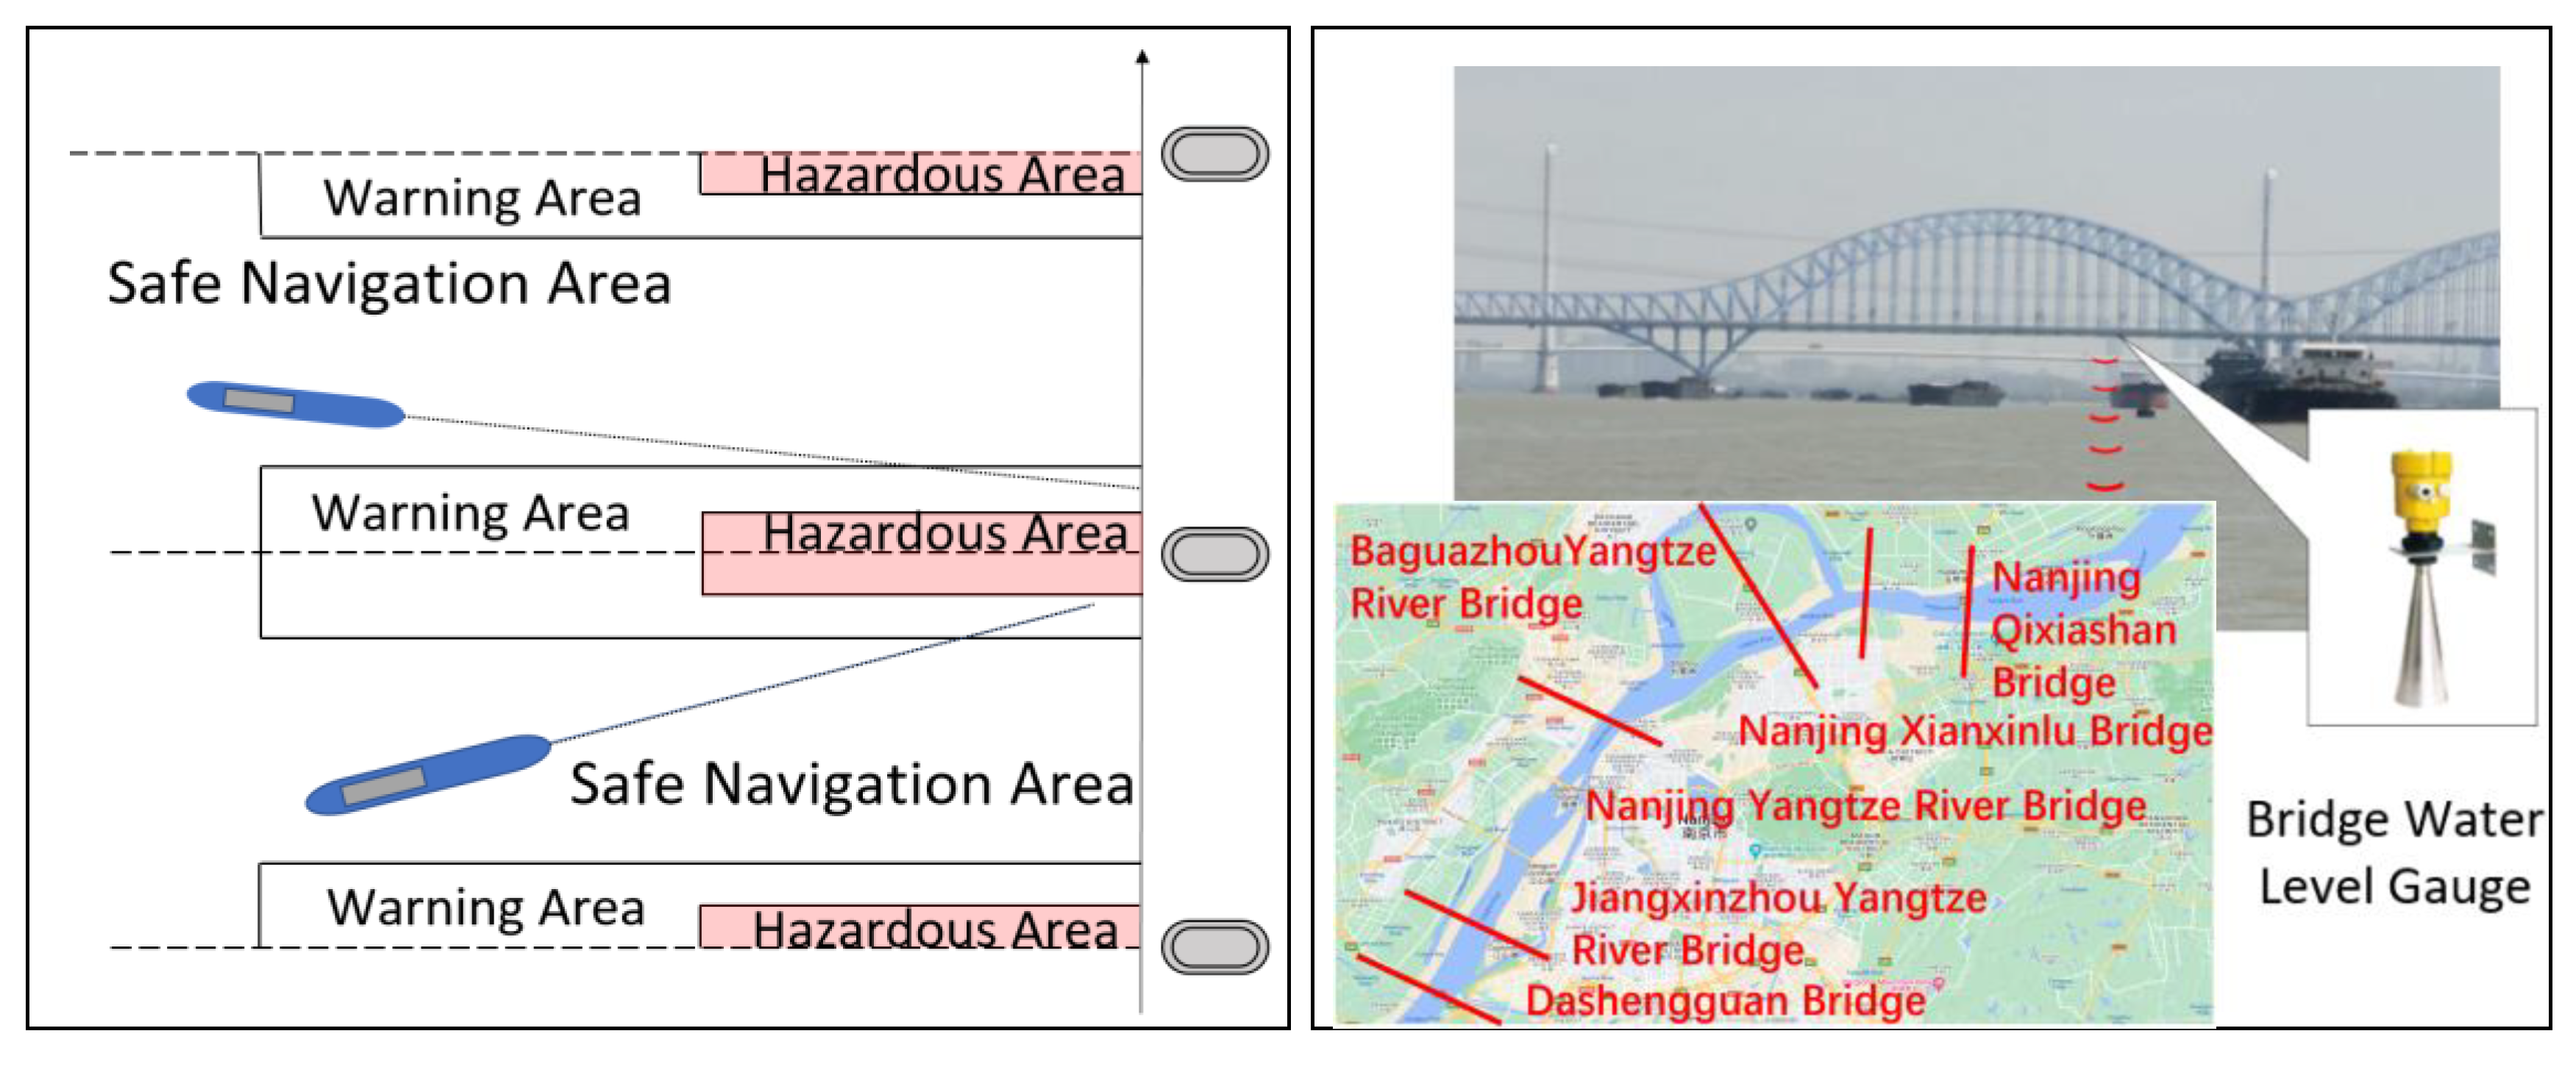
After identifying multi-target ships and extracting their overall body positions, ships with a high risk of yaw collision with bridges are defined as abnormal ships. As shown in Figure 7, on the y-axis where the bridge piers are located, the areas outside the two bridge piers formed by historical trajectories are designated as dangerous areas for ship navigation, with a navigation cue line set 20 m inside the warning line. Based on the distance from the bridge piers, they are designated as warning and danger zones, respectively. Using the spatial transformation algorithm, the spatial coordinates of multiple ships and their direction of travel in the image can be calculated, and the angle α with the horizontal channel can be determined by a formula. In the surveillance video, if the extended line of the ship’s travel direction exceeds the navigation cue line range for a fixed number of frames and exceeds the tracking warning area, strong light prompts are used. When the predicted yaw path reaches the danger zone, a sound and light alarm is triggered, which stops only when the ship’s predicted direction of travel returns to the safe area.

Figure 7.
Ship yaw and over-height warning method.
The spatial transformation method proposed in this article can obtain the real-time height of multi-target ships in the navigation area. Water gauges installed under the bridge obtain the real-time distance from the bottom of the bridge to the water surface, which is the clear height of the bridge during that period. If the difference between the clear height and the real-time height of the ship is less than the safety value required by the bridge, a sound and light alarm will be triggered along with a voice prompt about the ship’s over-height condition, to allow the ship to brake in time to avoid the disaster caused by hitting the bridge. In areas where the channel passes through densely populated areas and bridges are densely distributed along the channel, as shown in the figure, water gauges installed on each bridge in the area can obtain the navigational height of the channel in that region. Combining this with calculations from a camera on the height of ships in the channel helps reduce monitoring costs, increase data utilization, and implement integrated height over-limit warnings for dense bridge groups.
6. Experiment
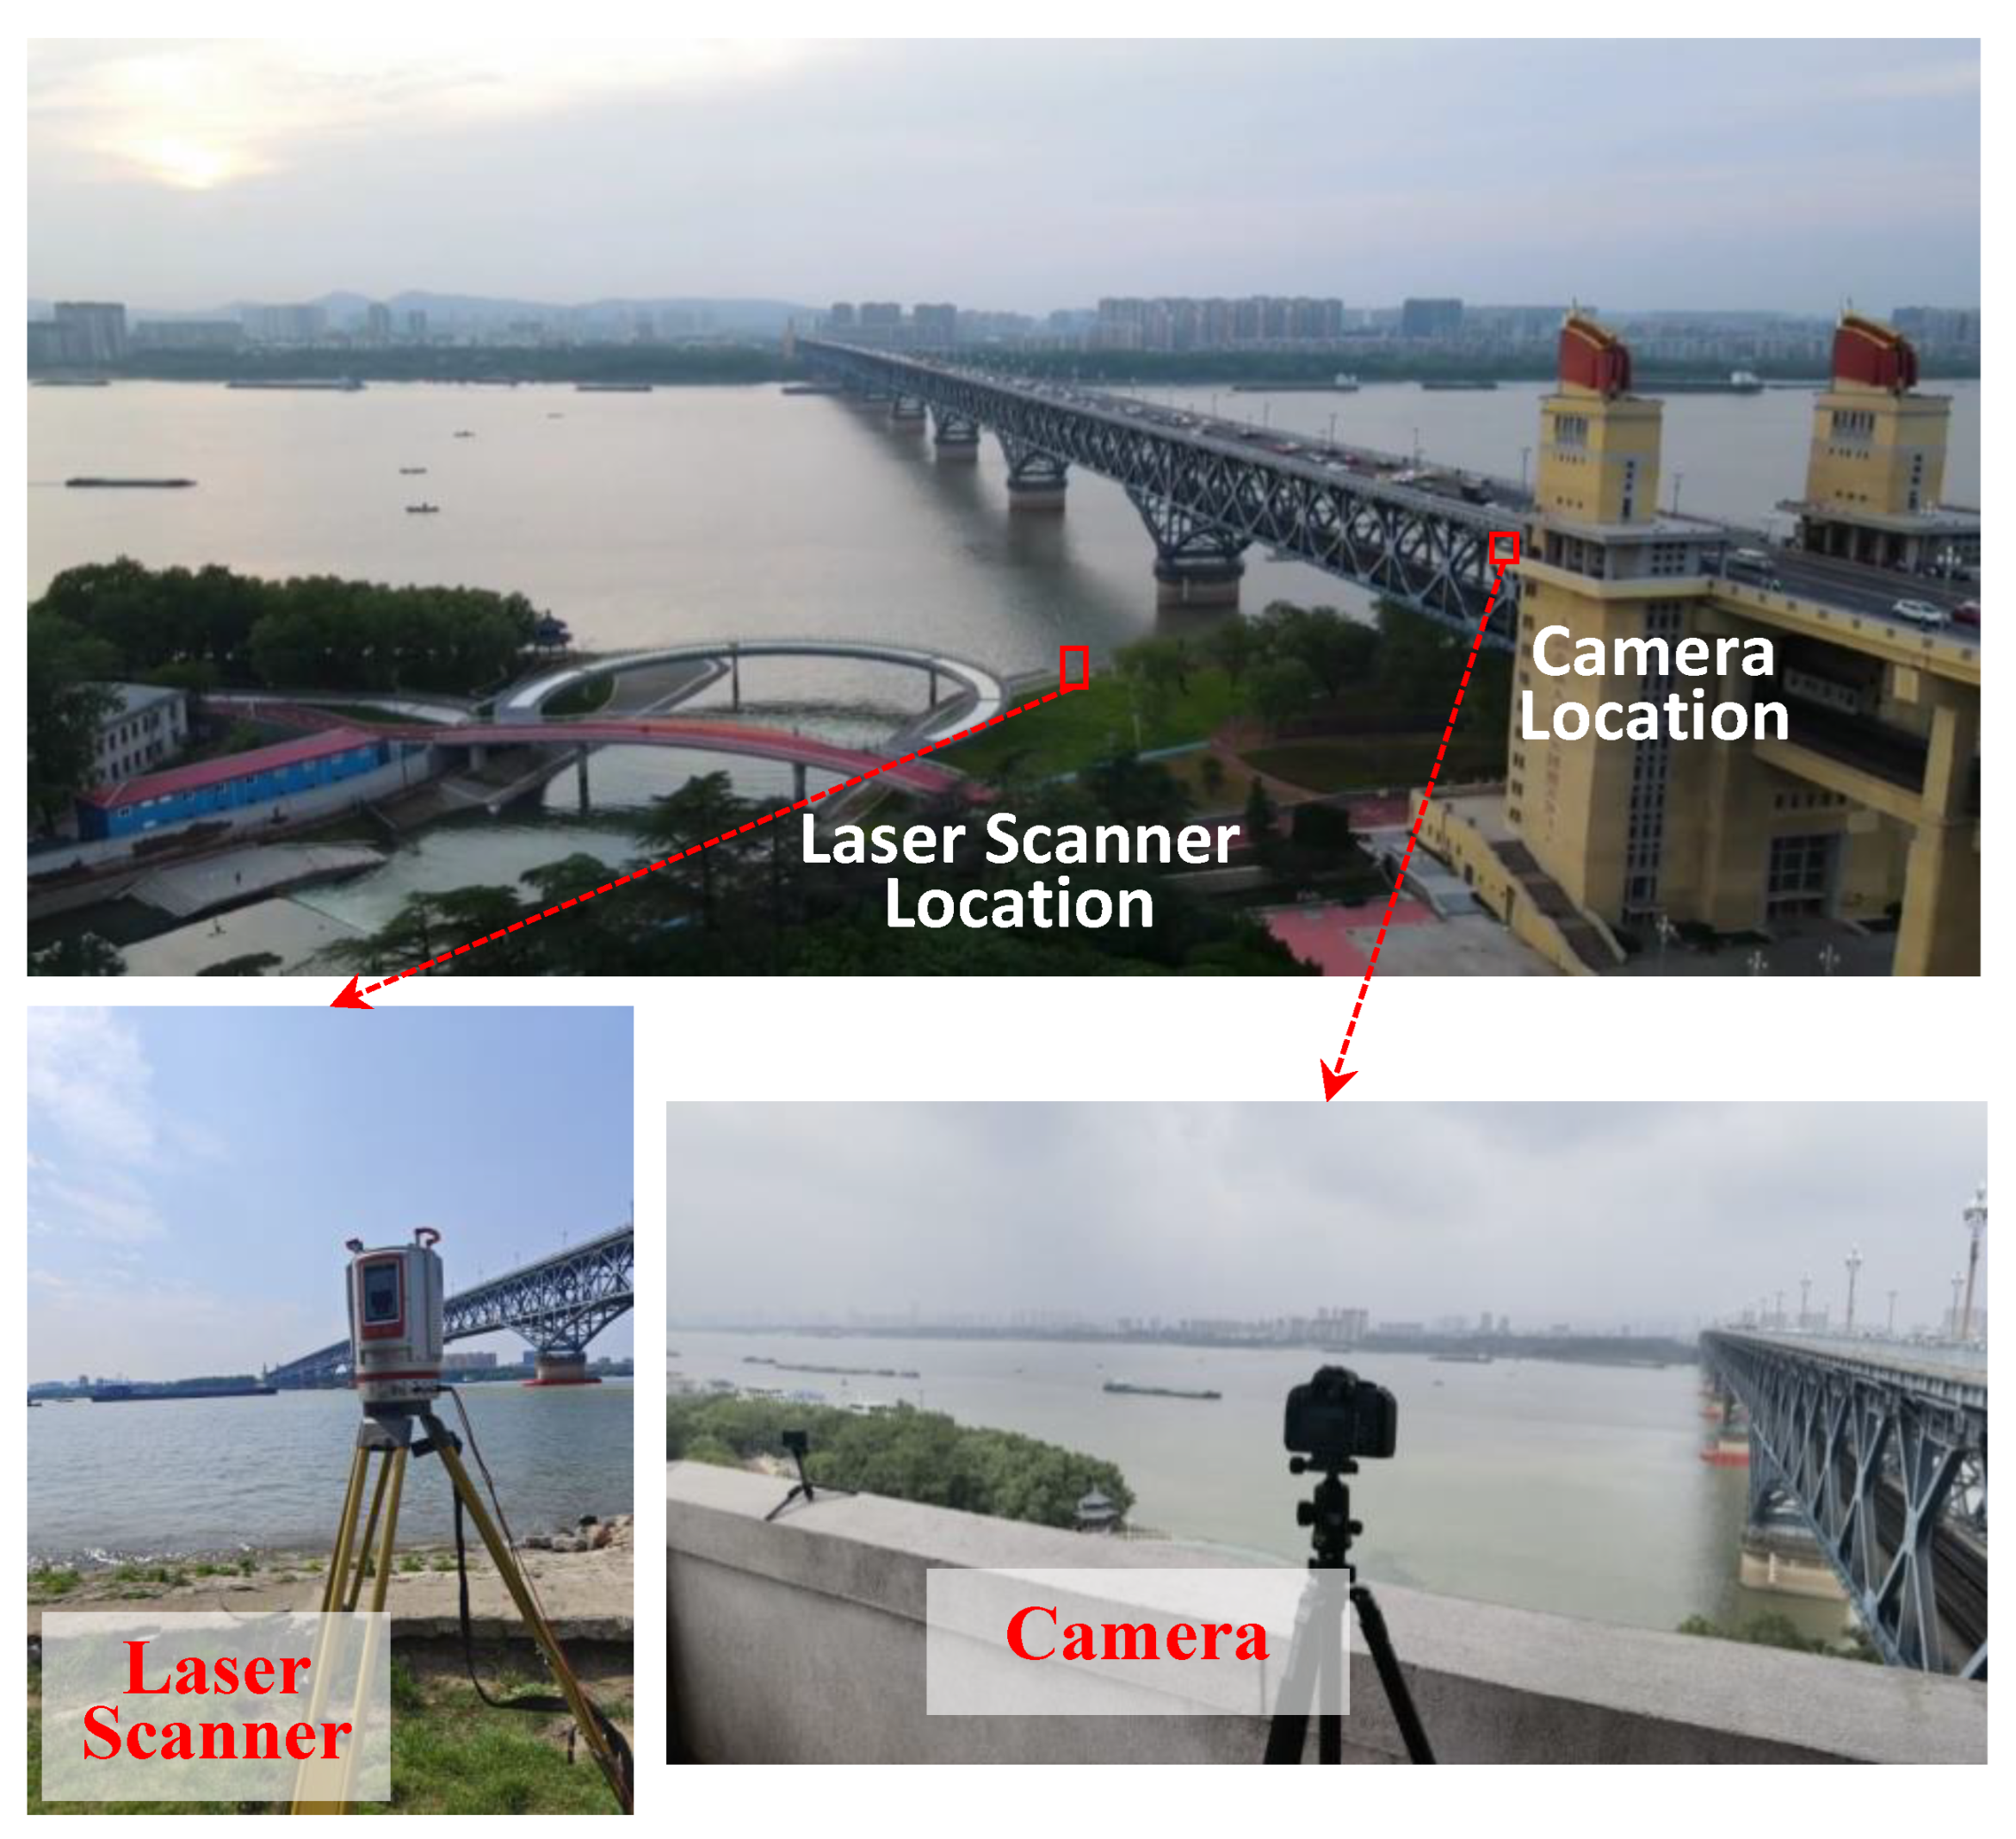
The bridge tested in this study, as shown in Figure 8, is a dual-use railway and highway bridge spanning the Yangtze River. The main bridge has a steel truss structure, with a total length of 1577 m, utilizing a 9-pier, 10-span design with a span combination of 1 × 128 m + 3 × 160 m + 3 × 160 m + 3 × 160 m. Cameras were mounted near the bridgehead on the side of the navigational area, fixed in position to continuously capture the navigational monitoring area. The cameras used have a resolution of 5328 × 4000. A RIEGL VZ-400i laser scanner was used, positioned along the shoreline near the navigational channel and the vessels. The selected device demonstrates excellent performance in terms of precision, efficiency, and environmental adaptability, making it well-suited for large-scale navigation monitoring in bridge areas. It supports flexible adjustment of pulse emission frequencies, which were set to 100 kHz and 300 kHz in this study to allow for adaptive control of sampling density and to ensure the quality of point cloud data. Additionally, it offers high angular resolution, with azimuth and elevation angle resolutions reaching up to 0.0005°, enabling fine reconstruction of the ship’s surface features on the water. This provides strong data support for subsequent 3D modeling and height estimation. Its scanned channel coordinates were used in conjunction with the images to locate the vessels, and the vessel’s side point cloud data, after post-processing, provided the vessel heights for comparison and validation against the methods discussed in this paper.

Figure 8.
Overview of the ship height acquisition test.
Initially, the channel was scanned using a laser scanner with a pulse emission frequency of 100 kHz, an azimuth scanning angle of 0.010 degrees, and an elevation scanning angle of 0.020 degrees, yielding a total of 3,121,929 point cloud data points. The mesh positioning points used for localization are shown in Table 2 after processing.
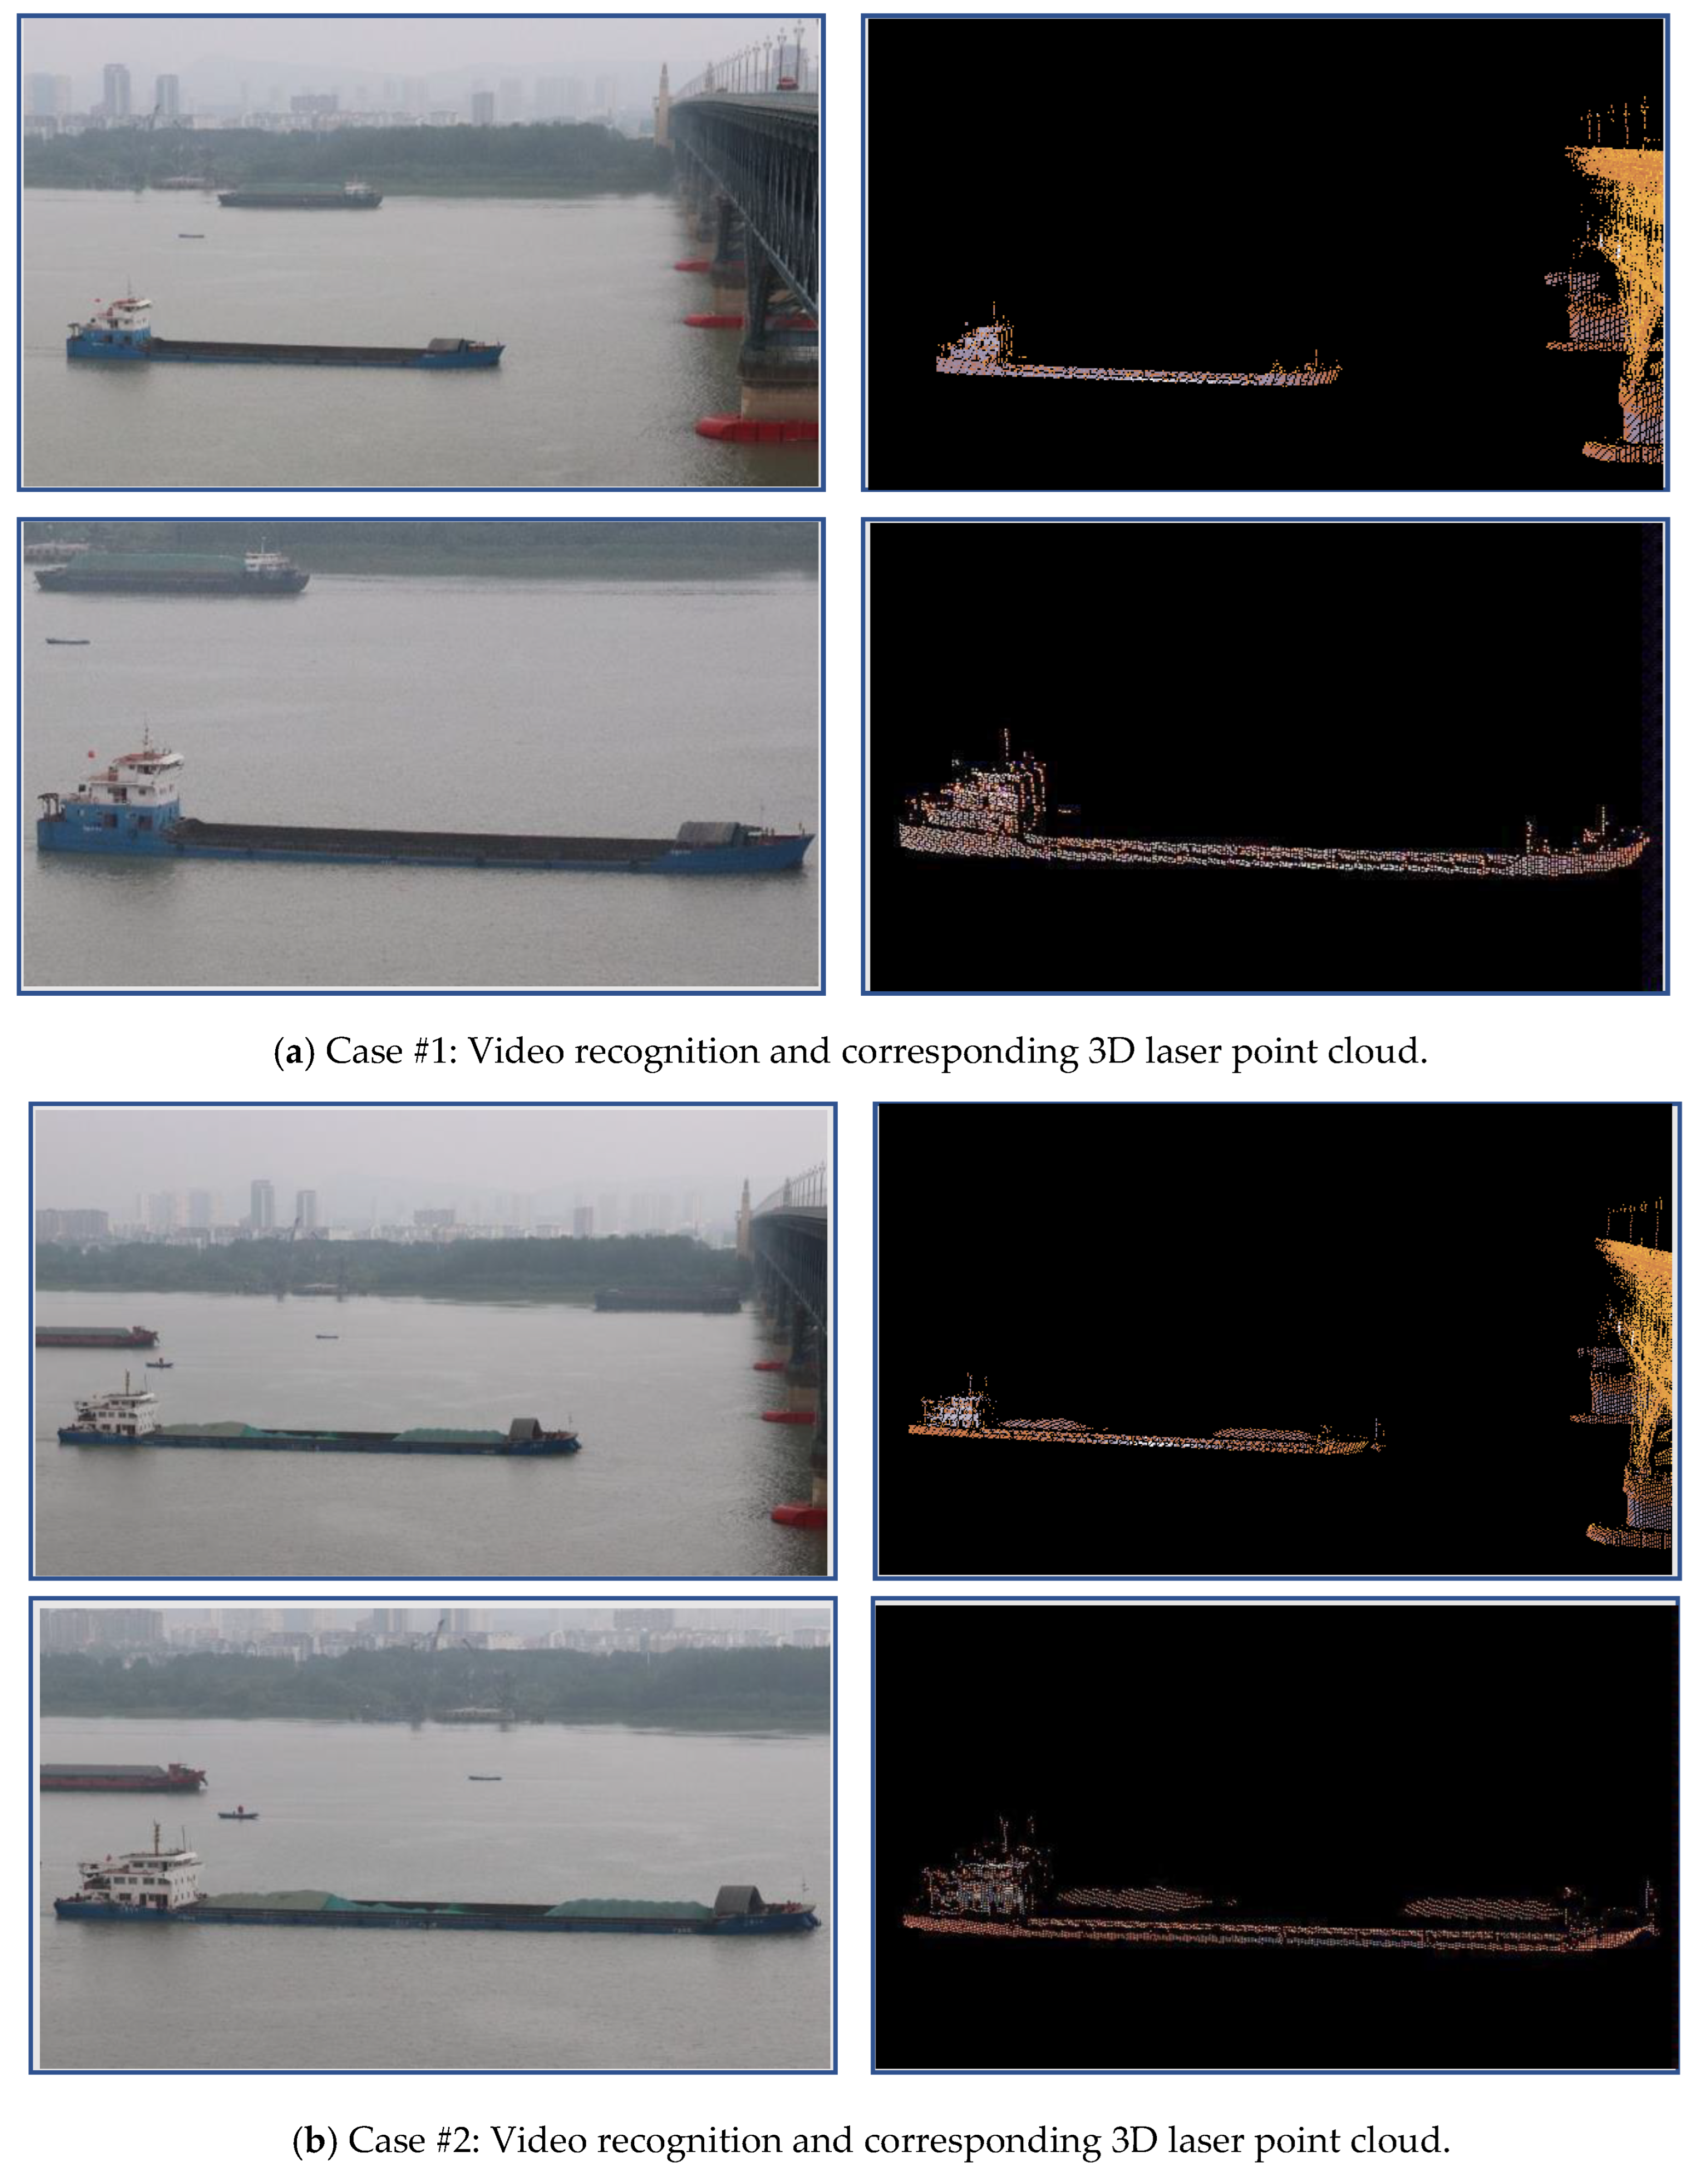
The camera’s shooting area needed to cover the navigational channel, slightly tilted downwards to integrate three-dimensional spatial coordinates for depth information acquisition. This paper presents experimental diagrams for the calculation of ship height using both video images and three-dimensional laser scanning methods, as illustrated in Figure 9. The ship key point recognition model proposed in this paper automatically identifies multi-target ships, their highest points, and waterline coordinates, and uses a spatial transformation algorithm to map two-dimensional pixel coordinates to three-dimensional coordinates. Using these methods, the heights of various ships on the water were calculated while simultaneously capturing ship images in the channel with a laser scanner operating at a pulse emission frequency of 300 kHz, an azimuth scanning angle of 0.080 degrees, and an elevation scanning angle of 0.080 degrees. These parameters influence the accuracy and speed of scanning. After post-processing the point cloud data, the obtained vessel height information was fully consistent with actual vessel height data and was verified against two sets of data using the method described in this paper and the phased radar ray method, with results shown in Table 3.
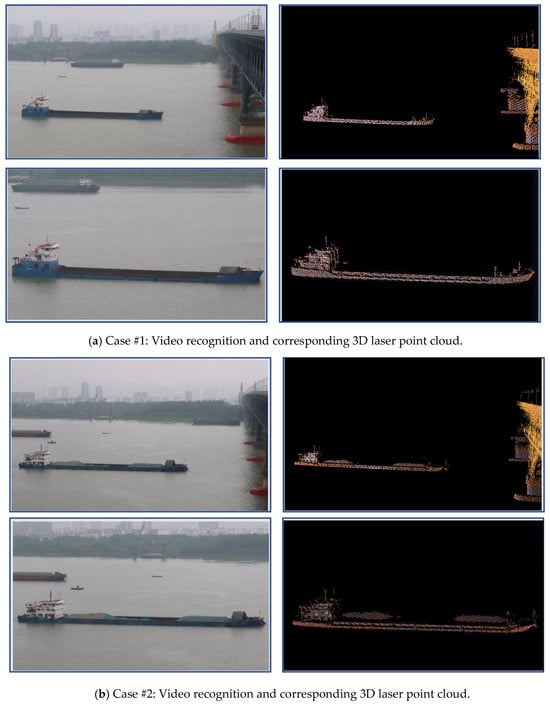
Figure 9.
Spatial transformation method and 3D laser scanning for ship height real bridge verification.
Table 3.
The ship-height test result of spatial transformation and 3D laser scanning.
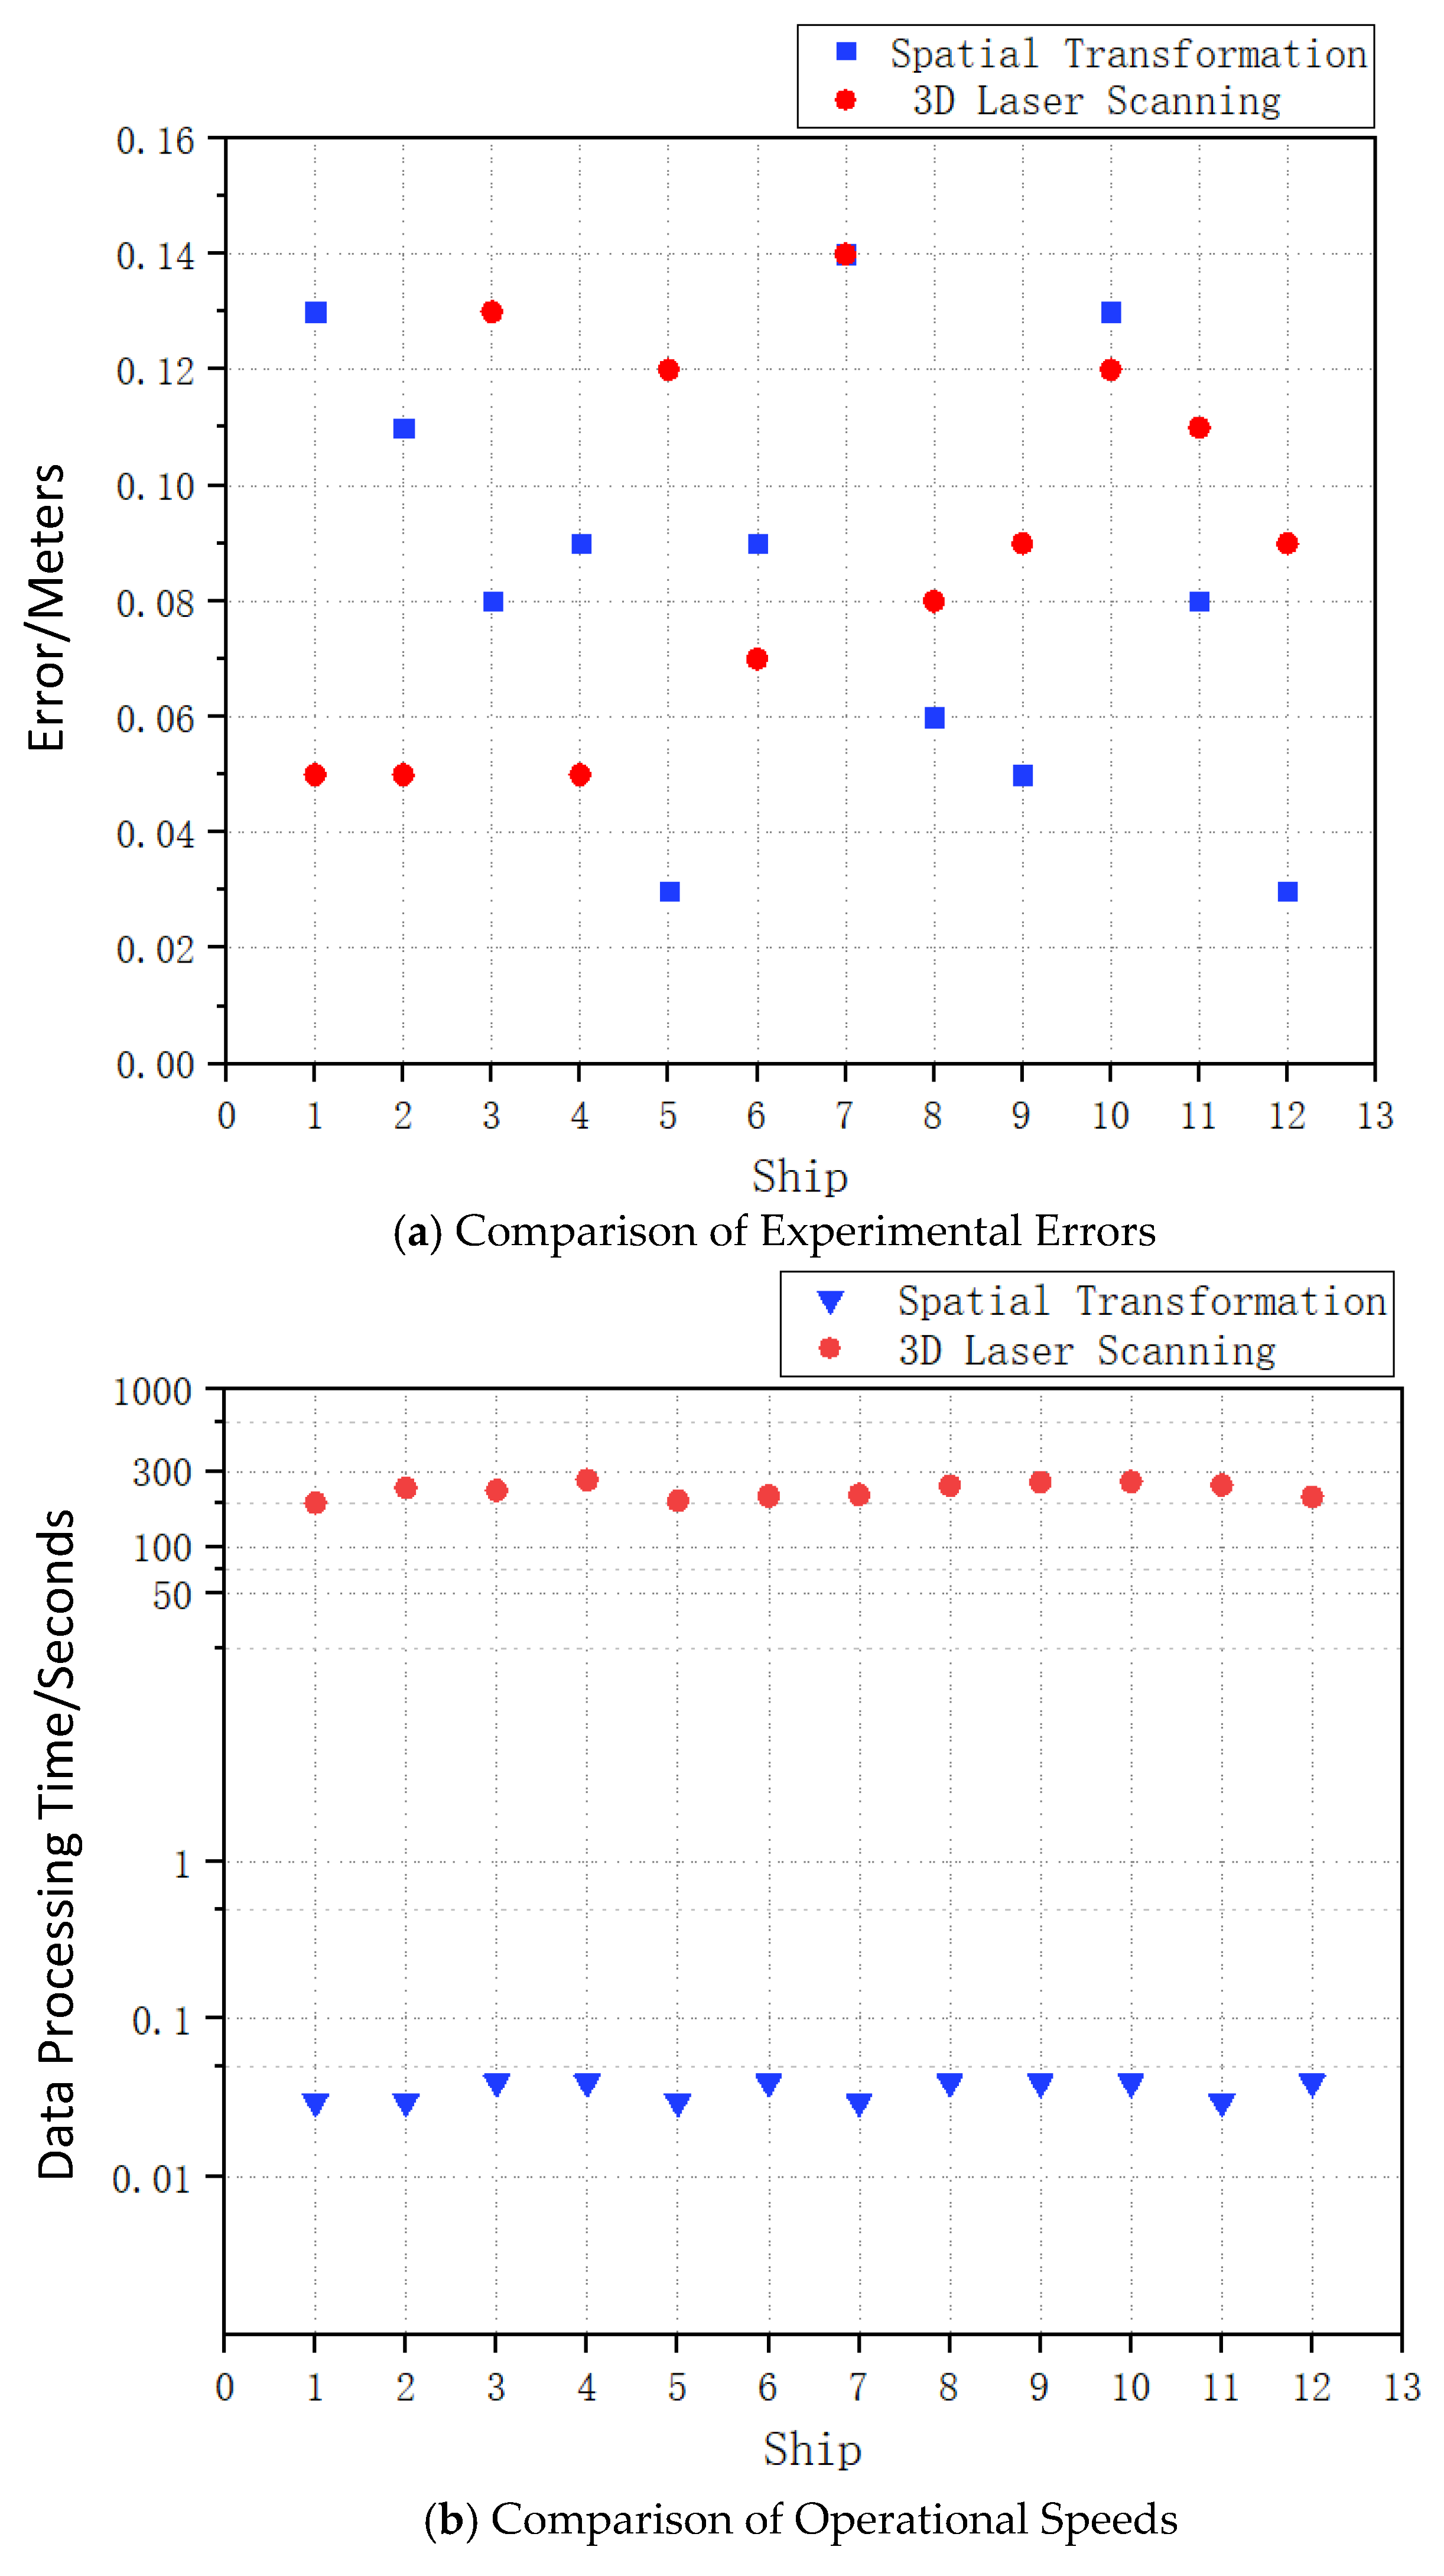
The experimental results from the actual bridge indicate that there are some discrepancies in the ship height data obtained by the two approaches, as shown in Table 3 and Figure 10, with the average difference from the actual ship height being less than 10 cm and an error rate within 0.8%. However, due to factors such as the scan output speed and data processing volume of the laser scanner, the method described in this paper significantly leads in computational speed, enabling real-time automatic calculation of ship height for practical engineering scenarios. Compared with the binocular stereo vision system based on a colinear long-focus camera array proposed by Zeng et al. [31], which achieved a height measurement error of less than 0.1 m through a face-to-face deployment, the method proposed in this study demonstrates superior engineering applicability while maintaining comparable measurement accuracy. In particular, regarding computational efficiency, the use of a laser scanner for one-time rapid modeling and the lightweight spatial transformation framework developed in this paper enable real-time and automatic ship height calculation. This approach eliminates the need for complex dual-camera calibration on both sides of the river or the setup of a fixed baseline across the channel. For the required net height under the bridge of at least 1.5 m, the ship height data discrepancy remains within the safe range, offering high measurement precision for large vessel height measurements in navigational areas. To extend the early warning distance along the navigation channel, the camera can be relocated further upstream. Through spatial transformation calculations, the ship’s height information within the monitoring area can be obtained in real time. Combined with auxiliary data such as water level gauges, this enables longer-range early warnings, providing more sufficient response time and protection for the monitored bridge and downstream bridge groups.
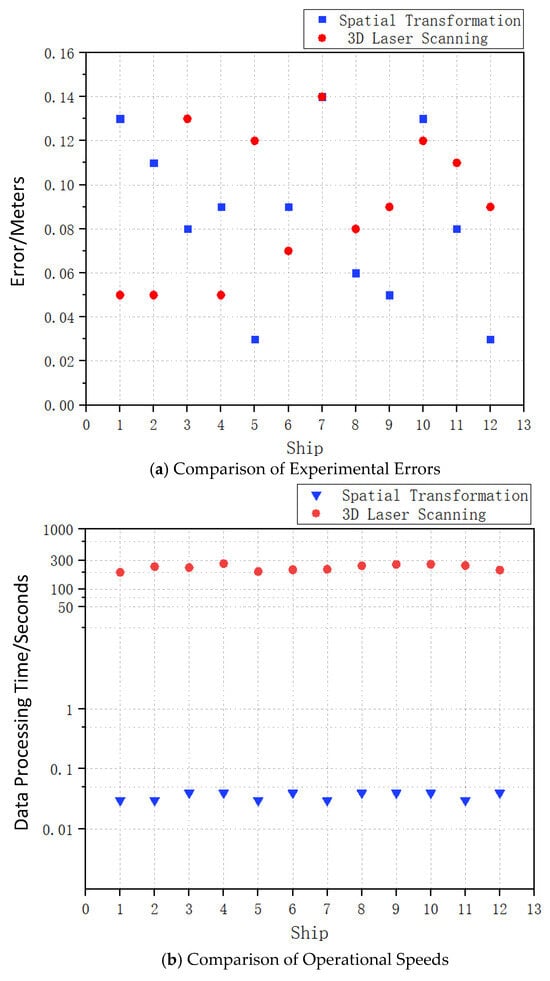
Figure 10.
Comparison of (a) experimental errors and (b) operational speeds in ship height acquisition.
7. Conclusions
This study proposes a real-time collision warning method for over-height vessels in bridge areas, based on spatial transformation and deep learning. The method integrates laser scanning and video perception technologies to establish a spatial computation model that converts two-dimensional image data into three-dimensional spatial coordinates. Additionally, a ship key point recognition network based on an attention mechanism is developed to rapidly extract coordinates of the waterline and the topmost point of the vessel, enabling accurate analysis of vessel posture and height within the navigation channel and issuing warnings for over-height vessels.
The main conclusions of this study are as follows: A vessel positioning method integrating 3D laser scanning and 2D video imagery was proposed. By leveraging the high precision of laser scanning, the channel area was modeled in a single pass, and a spatial transformation algorithm was applied to enable real-time mapping between image pixel coordinates and real-world coordinates. This effectively addresses the challenge of accurate vessel localization in wide waterways. Furthermore, a multi-target ship recognition algorithm was developed, and a key point coordinate database for vessel height estimation was established based on a multi-dimensional attention mechanism. By accurately and efficiently extracting three critical coordinates for height calculation, the method replaces traditional full-contour recognition approaches, thereby minimizing the influence of external disturbances and enhancing the accuracy of vessel posture and spatial data extraction. In addition, a formula for calculating above-water vessel height in video frames was derived and integrated into a warning mechanism capable of detecting both vessel yaw and over-height conditions, providing reliable technical support for real-time navigation safety.
Field tests conducted in real bridge areas demonstrate the method’s strong applicability. The proposed height estimation method achieved an average error of less than 10 cm, with a relative error below 0.8%, meeting the minimum safety clearance requirement of 1.5 m for bridge navigation. The system is capable of issuing early warnings before potential collisions occur, showing clear potential for practical engineering applications.
Although this study has achieved promising results in over-height vessel warning in bridge areas, certain limitations remain. The current method heavily relies on the synchronization quality between video images and laser scanning data. When issues such as occlusion, strong reflections, or image blurring occur, the extraction of key feature points can be disturbed, affecting the accuracy of vessel identification and height estimation. Moreover, under challenging weather conditions such as dense fog, strong sunlight, or nighttime darkness, the video-based perception capability is significantly weakened, further limiting the reliable recognition of the vessel’s top and waterline. To enhance system adaptability, the integration of multi-source heterogeneous sensors, such as radar and infrared, can be considered to improve performance under low-visibility conditions. In parallel, image preprocessing techniques, including defogging, glare suppression, and enhancement, should be explored to improve image quality, thereby enhancing the reliability of depth information extraction and height calculation. Additionally, future efforts will focus on addressing spatial coverage limitations and early warning range constraints caused by deployment strategies. This includes exploring more intelligent and wide-area monitoring approaches to improve the system’s adaptability and early warning capability in complex waterways and multi-bridge scenarios.
Author Contributions
Methodology, S.G.; Software, S.G.; Validation, S.G.; Formal analysis, S.G.; Investigation, J.Z.; Data curation, J.Z.; Writing—original draft, S.G.; Writing—review & editing, J.Z.; Funding acquisition, J.Z. All authors have read and agreed to the published version of the manuscript.
Funding
The research presented was financially supported by the National Key R&D Program of China (No. 2022YFC3801700), the National Natural Science Foundation of China (No. 52378289), and the Research Fund for Advanced Ocean Institute of Southeast University (No. KP202407).
Data Availability Statement
The data presented in this study are available on request from the corresponding author on reasonable request. The data are not publicly available due to privacy policies.
Conflicts of Interest
The authors declare that they have no known competing financial interests or personal relationships that could have appeared to influence the work reported in this paper.
Abbreviations
| Abbreviation | Full Term |
| SAR | Synthetic Aperture Radar |
| AIS | Automatic Identification System |
| GF-3 | Gaofen-3 |
| FLCBS | Foam-filled Lattice Composite Bumper System |
| FRP | Fiber-reinforced Polymer |
| CAM | Constant Added Mass |
| FGLPS | Functionally Graded Lattice Filled Protection Structure |
| BMS | Bridge Management Systems |
| SHM | Structural Health Monitoring Systems |
| 3D | Three-Dimensional |
| BIM | Building Information Modeling |
| UAV | Unmanned Aerial Vehicle |
| CNN | Convolutional Neural Networks |
| DAPN | Dense Attention Pyramid Network |
| GAN | Generative Adversarial Network |
| YOLOv5 | You Only Look Once Version 5 |
| MC-YOLOv5s | MobileNet Compact YOLOv5 |
| YOLOv3 | You Only Look Once Version 3 |
| PRR | Peak Pulse Repetition Rate |
| HRNet | High-Resolution Network |
References
- Wu, B.; Yip, T.L.; Yan, X.; Soares, C.G. Fuzzy logic based approach for ship-bridge collision alert system. Ocean Eng. 2019, 187, 106152. [Google Scholar] [CrossRef]
- Zhang, B.; Xu, Z.; Zhang, J.; Wu, G. A warning framework for avoiding vessel-bridge and vessel-vessel collisions based on generative adversarial and dual-task networks. Comput.-Aided Civ. Infrastruct. Eng. 2021, 37, 629–649. [Google Scholar] [CrossRef]
- Hou, X.; Ao, W.; Song, Q.; Lai, J.; Wang, H.; Xu, F. FUSAR-Ship: Building a high-resolution SAR-AIS matchup dataset of Gaofen-3 for ship detection and recognition. Sci. China Inf. Sci. 2020, 63, 140303. [Google Scholar] [CrossRef]
- Zhang, L.; Chen, P.; Li, M.; Chen, L.; Mou, J. A data-driven approach for ship-bridge collision candidate detection in bridge waterway. Ocean Eng. 2022, 266, 113137. [Google Scholar] [CrossRef]
- Sha, Y.; Amdahl, J.; Liu, K. Design of steel bridge girders against ship forecastle collisions. Eng. Struct. 2019, 196, 109277. [Google Scholar] [CrossRef]
- Fang, H.; Mao, Y.; Liu, W.; Zhu, L.; Zhang, B. Manufacturing and evaluation of Large-scale Composite Bumper System for bridge pier protection against ship collision. Compos. Struct. 2016, 158, 187–198. [Google Scholar] [CrossRef]
- Zhu, L.; Liu, W.; Fang, H.; Chen, J.; Zhuang, Y.; Han, J. Design and simulation of innovative foam-filled Lattice Composite Bumper System for bridge protection in ship collisions. Compos. Part B Eng. 2018, 157, 24–35. [Google Scholar] [CrossRef]
- Ye, X.; Fan, W.; Sha, Y.; Hua, X.; Wu, Q.; Ren, Y. Fluid-structure interaction analysis of oblique ship-bridge collisions. Eng. Struct. 2023, 274, 115129. [Google Scholar] [CrossRef]
- Nian, Y.; Wan, S.; Wang, X.; Zhou, P.; Avcar, M.; Li, M. Study on crashworthiness of nature-inspired functionally graded lattice metamaterials for bridge pier protection against ship collision. Eng. Struct. 2023, 277, 115404. [Google Scholar] [CrossRef]
- Guo, Y.; Ni, Y.; Chen, S. Optimal sensor placement for damage detection of bridges subject to ship collision. Struct. Control. Health Monit. 2016, 24, e1963. [Google Scholar] [CrossRef]
- Gholipour, G.; Zhang, C.; Mousavi, A.A. Nonlinear numerical analysis and progressive damage assessment of a cable-stayed bridge pier subjected to ship collision. Mar. Struct. 2020, 69, 102662. [Google Scholar] [CrossRef]
- Jeong, S.; Hou, R.; Lynch, J.P.; Sohn, H.; Law, K.H. An information modeling framework for bridge monitoring. Adv. Eng. Softw. 2017, 114, 11–31. [Google Scholar] [CrossRef]
- Farhangdoust, S.; Mehrabi, A. Health Monitoring of Closure Joints in Accelerated Bridge Construction: A Review of Non-Destructive Testing Application. J. Adv. Concr. Technol. 2019, 17, 381–404. [Google Scholar] [CrossRef]
- Ni, Y.; Wang, Y.; Zhang, C. A Bayesian approach for condition assessment and damage alarm of bridge expansion joints using long-term structural health monitoring data. Eng. Struct. 2020, 212, 110520. [Google Scholar] [CrossRef]
- Xi, C.X.; Zhou, Z.-X.; Xiang, X.; He, S.; Hou, X. Monitoring of long-span bridge deformation based on 3D laser scanning. Instrum. Mes. Métrologie 2018, 18, 113–130. [Google Scholar] [CrossRef]
- Yoon, S.; Wang, Q.; Sohn, H. Optimal placement of precast bridge deck slabs with respect to precast girders using 3D laser scanning. Autom. Constr. 2018, 86, 81–98. [Google Scholar] [CrossRef]
- Almukhtar, A.; Saeed, Z.O.; Abanda, H.; Tah, J.H.M. Reality Capture of Buildings Using 3D Laser Scanners. CivilEng 2021, 2, 214–235. [Google Scholar] [CrossRef]
- Liu, Y.; Nie, X.; Fan, J.; Liu, X. Image-based crack assessment of bridge piers using unmanned aerial vehicles and three-dimensional scene reconstruction. Comput. Civ. Infrastruct. Eng. 2019, 35, 511–529. [Google Scholar] [CrossRef]
- Wei, S.; Zeng, X.; Qu, Q.; Wang, M.; Su, H.; Shi, J. HRSID: A High-Resolution SAR Images Dataset for Ship Detection and Instance Segmentation. IEEE Access 2020, 8, 120234–120254. [Google Scholar] [CrossRef]
- Cui, Z.; Li, Q.; Cao, Z.; Liu, N. Dense Attention Pyramid Networks for Multi-Scale Ship Detection in SAR Images. IEEE Trans. Geosci. Remote Sens. 2019, 57, 8983–8997. [Google Scholar] [CrossRef]
- Yang, X.; Zhang, X.; Wang, N.; Gao, X. A Robust One-Stage Detector for Multiscale Ship Detection With Complex Background in Massive SAR Images. IEEE Trans. Geosci. Remote Sens. 2021, 60, 1–12. [Google Scholar] [CrossRef]
- Chen, Z.; Chen, D.; Zhang, Y.; Cheng, X.; Zhang, M.; Wu, C. Deep learning for autonomous ship-oriented small ship detection. Saf. Sci. 2020, 130, 104812. [Google Scholar] [CrossRef]
- Zheng, Y.; Zhang, Y.; Qian, L.; Zhang, X.; Diao, S.; Liu, X.; Cao, J.; Huang, H.; Teh, J.S. A lightweight ship target detection model based on improved YOLOv5s algorithm. PLoS ONE 2023, 18, e0283932. [Google Scholar] [CrossRef]
- Chen, X.; Qi, L.; Yang, Y.; Luo, Q.; Postolache, O.; Tang, J.; Wu, H. Video-Based Detection Infrastructure Enhancement for Automated Ship Recognition and Behavior Analysis. J. Adv. Transp. 2020, 2020, 7194342. [Google Scholar] [CrossRef]
- Li, S.; Zhou, Z.; Wang, B.; Wu, F. A Novel Inshore Ship Detection via Ship Head Classification and Body Boundary Determination. IEEE Geosci. Remote Sens. Lett. 2016, 13, 1920–1924. [Google Scholar] [CrossRef]
- Zhang, M.; Kujala, P.; Musharraf, M.; Zhang, J.; Hirdaris, S. A machine learning method for the prediction of ship motion trajectories in real operational conditions. Ocean Eng. 2023, 283, 114905. [Google Scholar] [CrossRef]
- Szeliski, R. Computer Vision: Algorithms and Applications, 2nd ed.; Springer: Berlin/Heidelberg, Germany, 2022. [Google Scholar]
- Hartley, R.; Zisserman, A. Multiple View Geometry in Computer Vision, 2nd ed.; Cambridge University Press: Cambridge, UK, 2004. [Google Scholar] [CrossRef]
- Zhao, X.; Song, Y. Improved Ship Detection with YOLOv8 Enhanced with MobileViT and GSConv. Electronics 2023, 12, 4666. [Google Scholar] [CrossRef]
- Wang, J.; Sun, K.; Cheng, T.; Jiang, B.; Deng, C.; Zhao, Y.; Liu, D.; Mu, Y.; Tan, M.; Wang, X.; et al. Deep High-Resolution Representation Learning for Visual Recognition. IEEE Trans. Pattern Anal. Mach. Intell. 2020, 43, 3349–3364. [Google Scholar] [CrossRef] [PubMed]
- Zeng, F.; Xiao, C.; Wang, W.; Gan, L.; Yuan, H.; Li, Q. A Novel Ship-Height Measurement System Based on Optical Axes Collinear Stereo Vision. IEEE Sens. J. 2023, 23, 6282–6291. [Google Scholar] [CrossRef]

Disclaimer/Publisher’s Note: The statements, opinions and data contained in all publications are solely those of the individual author(s) and contributor(s) and not of MDPI and/or the editor(s). MDPI and/or the editor(s) disclaim responsibility for any injury to people or property resulting from any ideas, methods, instructions or products referred to in the content. |
© 2025 by the authors. Licensee MDPI, Basel, Switzerland. This article is an open access article distributed under the terms and conditions of the Creative Commons Attribution (CC BY) license (https://creativecommons.org/licenses/by/4.0/).