
Stress-Deformation Mechanisms of Tunnel Support in Neogene Red-Bed Soft Rock: Insights from Wireless Remote Monitoring and Spatiotemporal Analysis


Abstract
1. Introduction
2. Materials and Methods
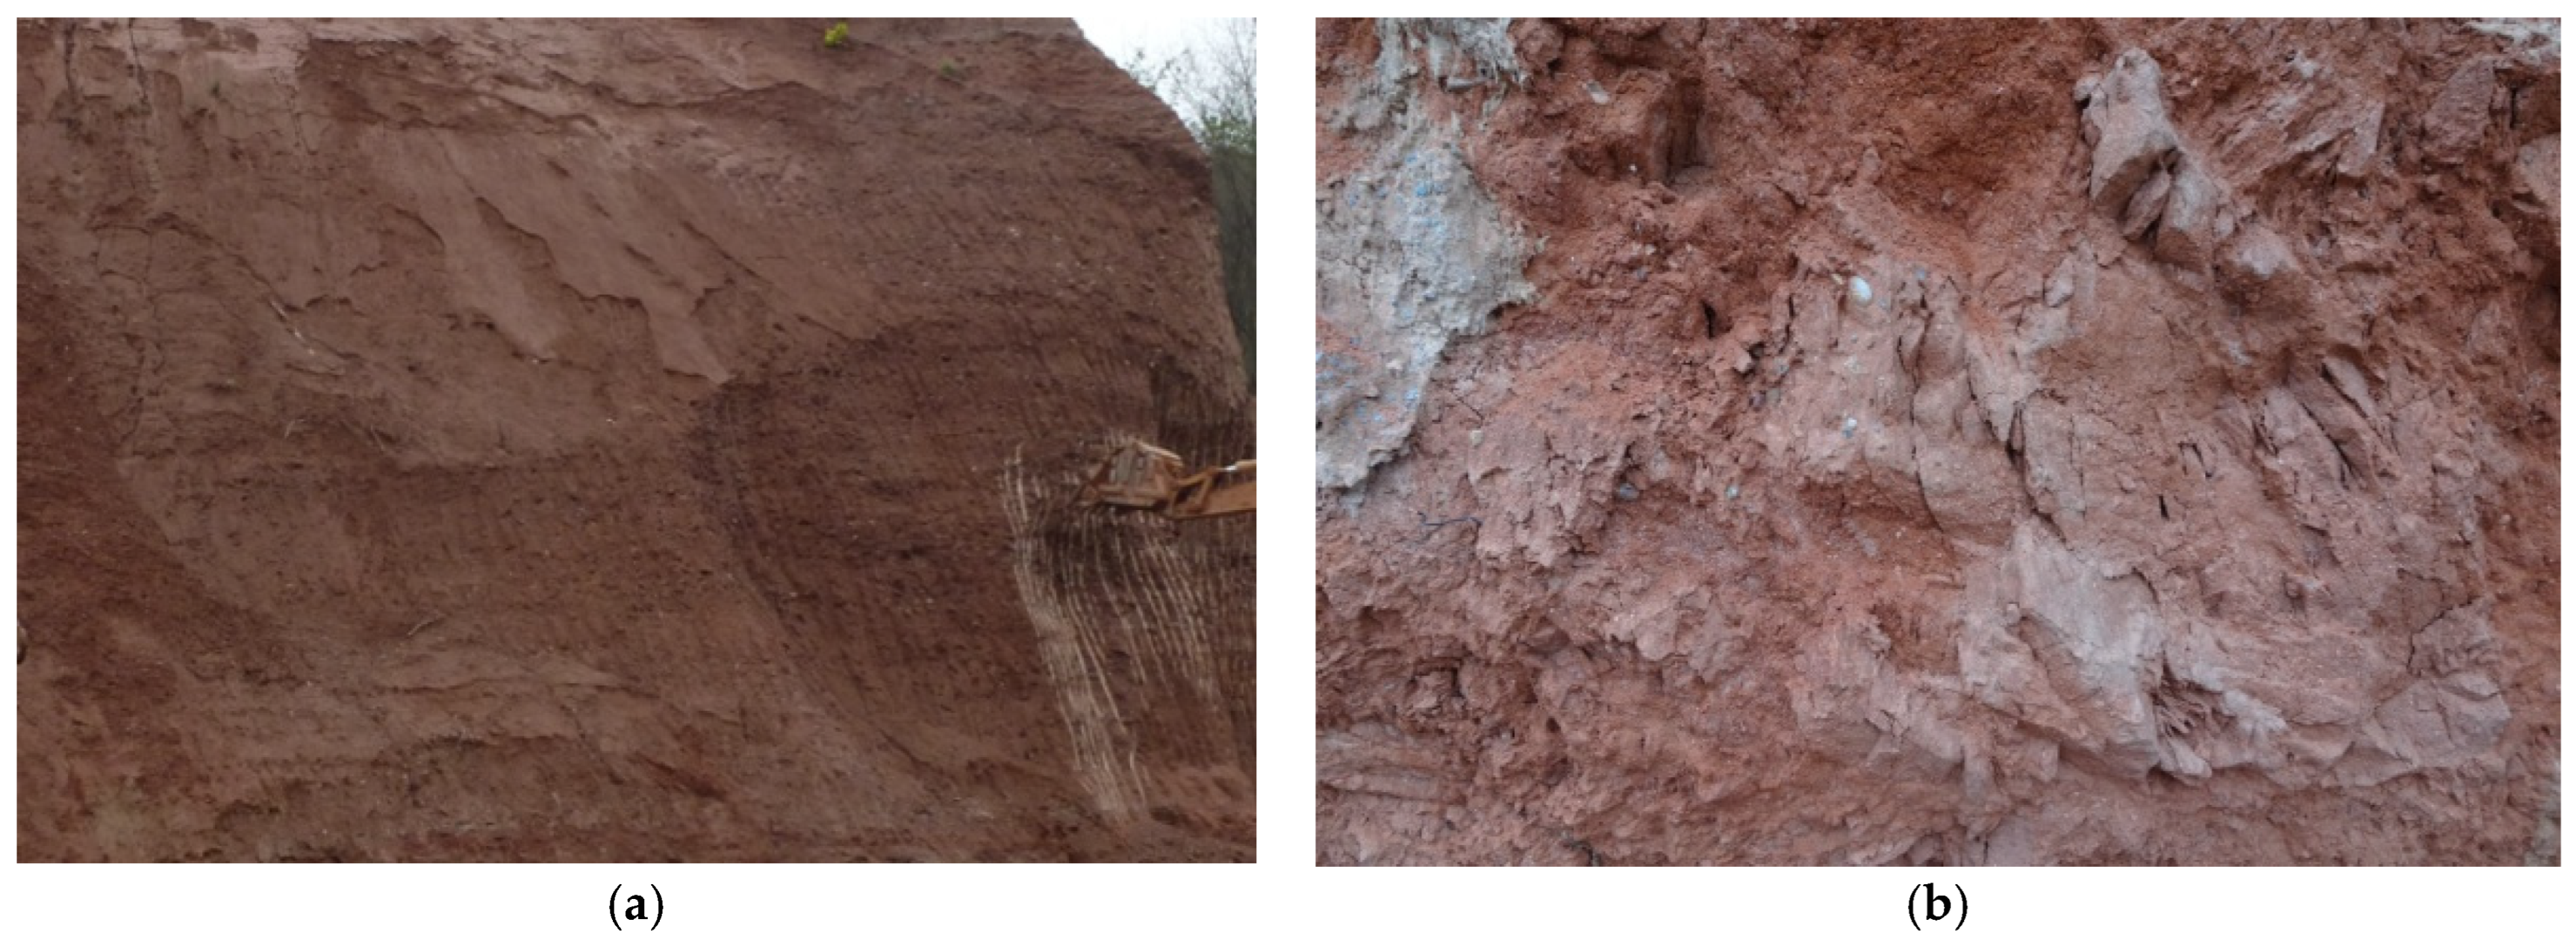
2.1. Test Subjects
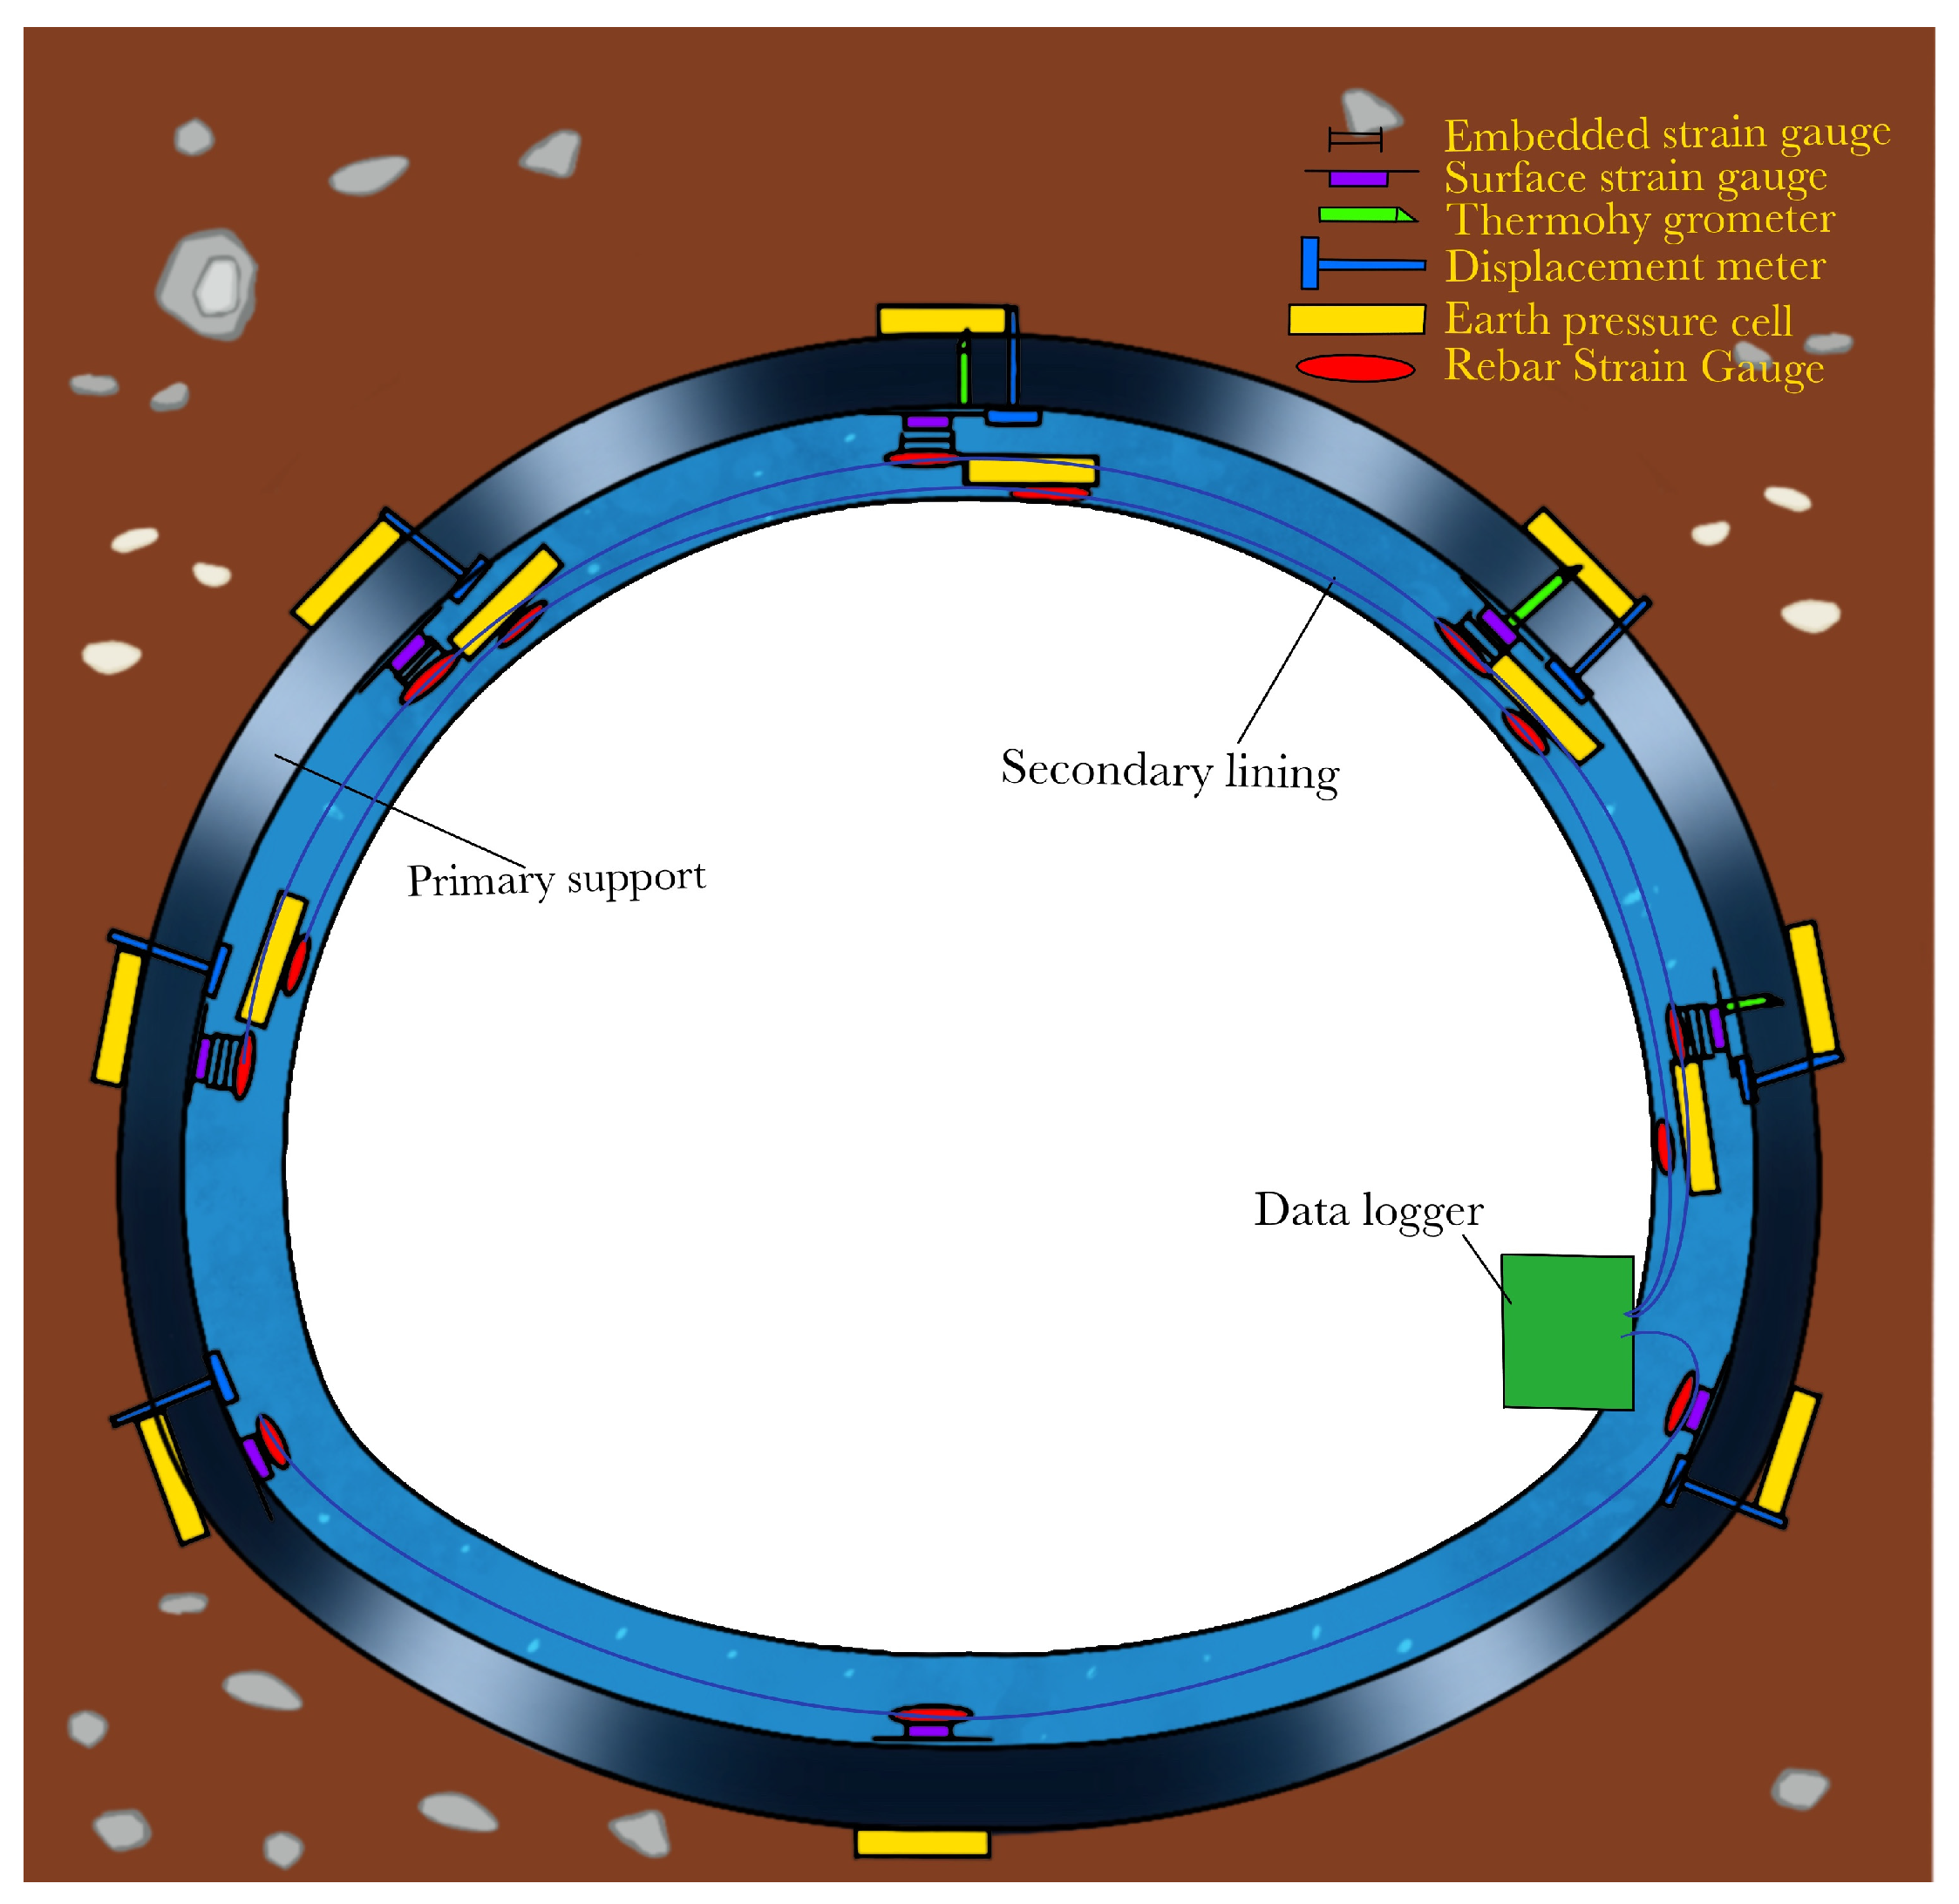
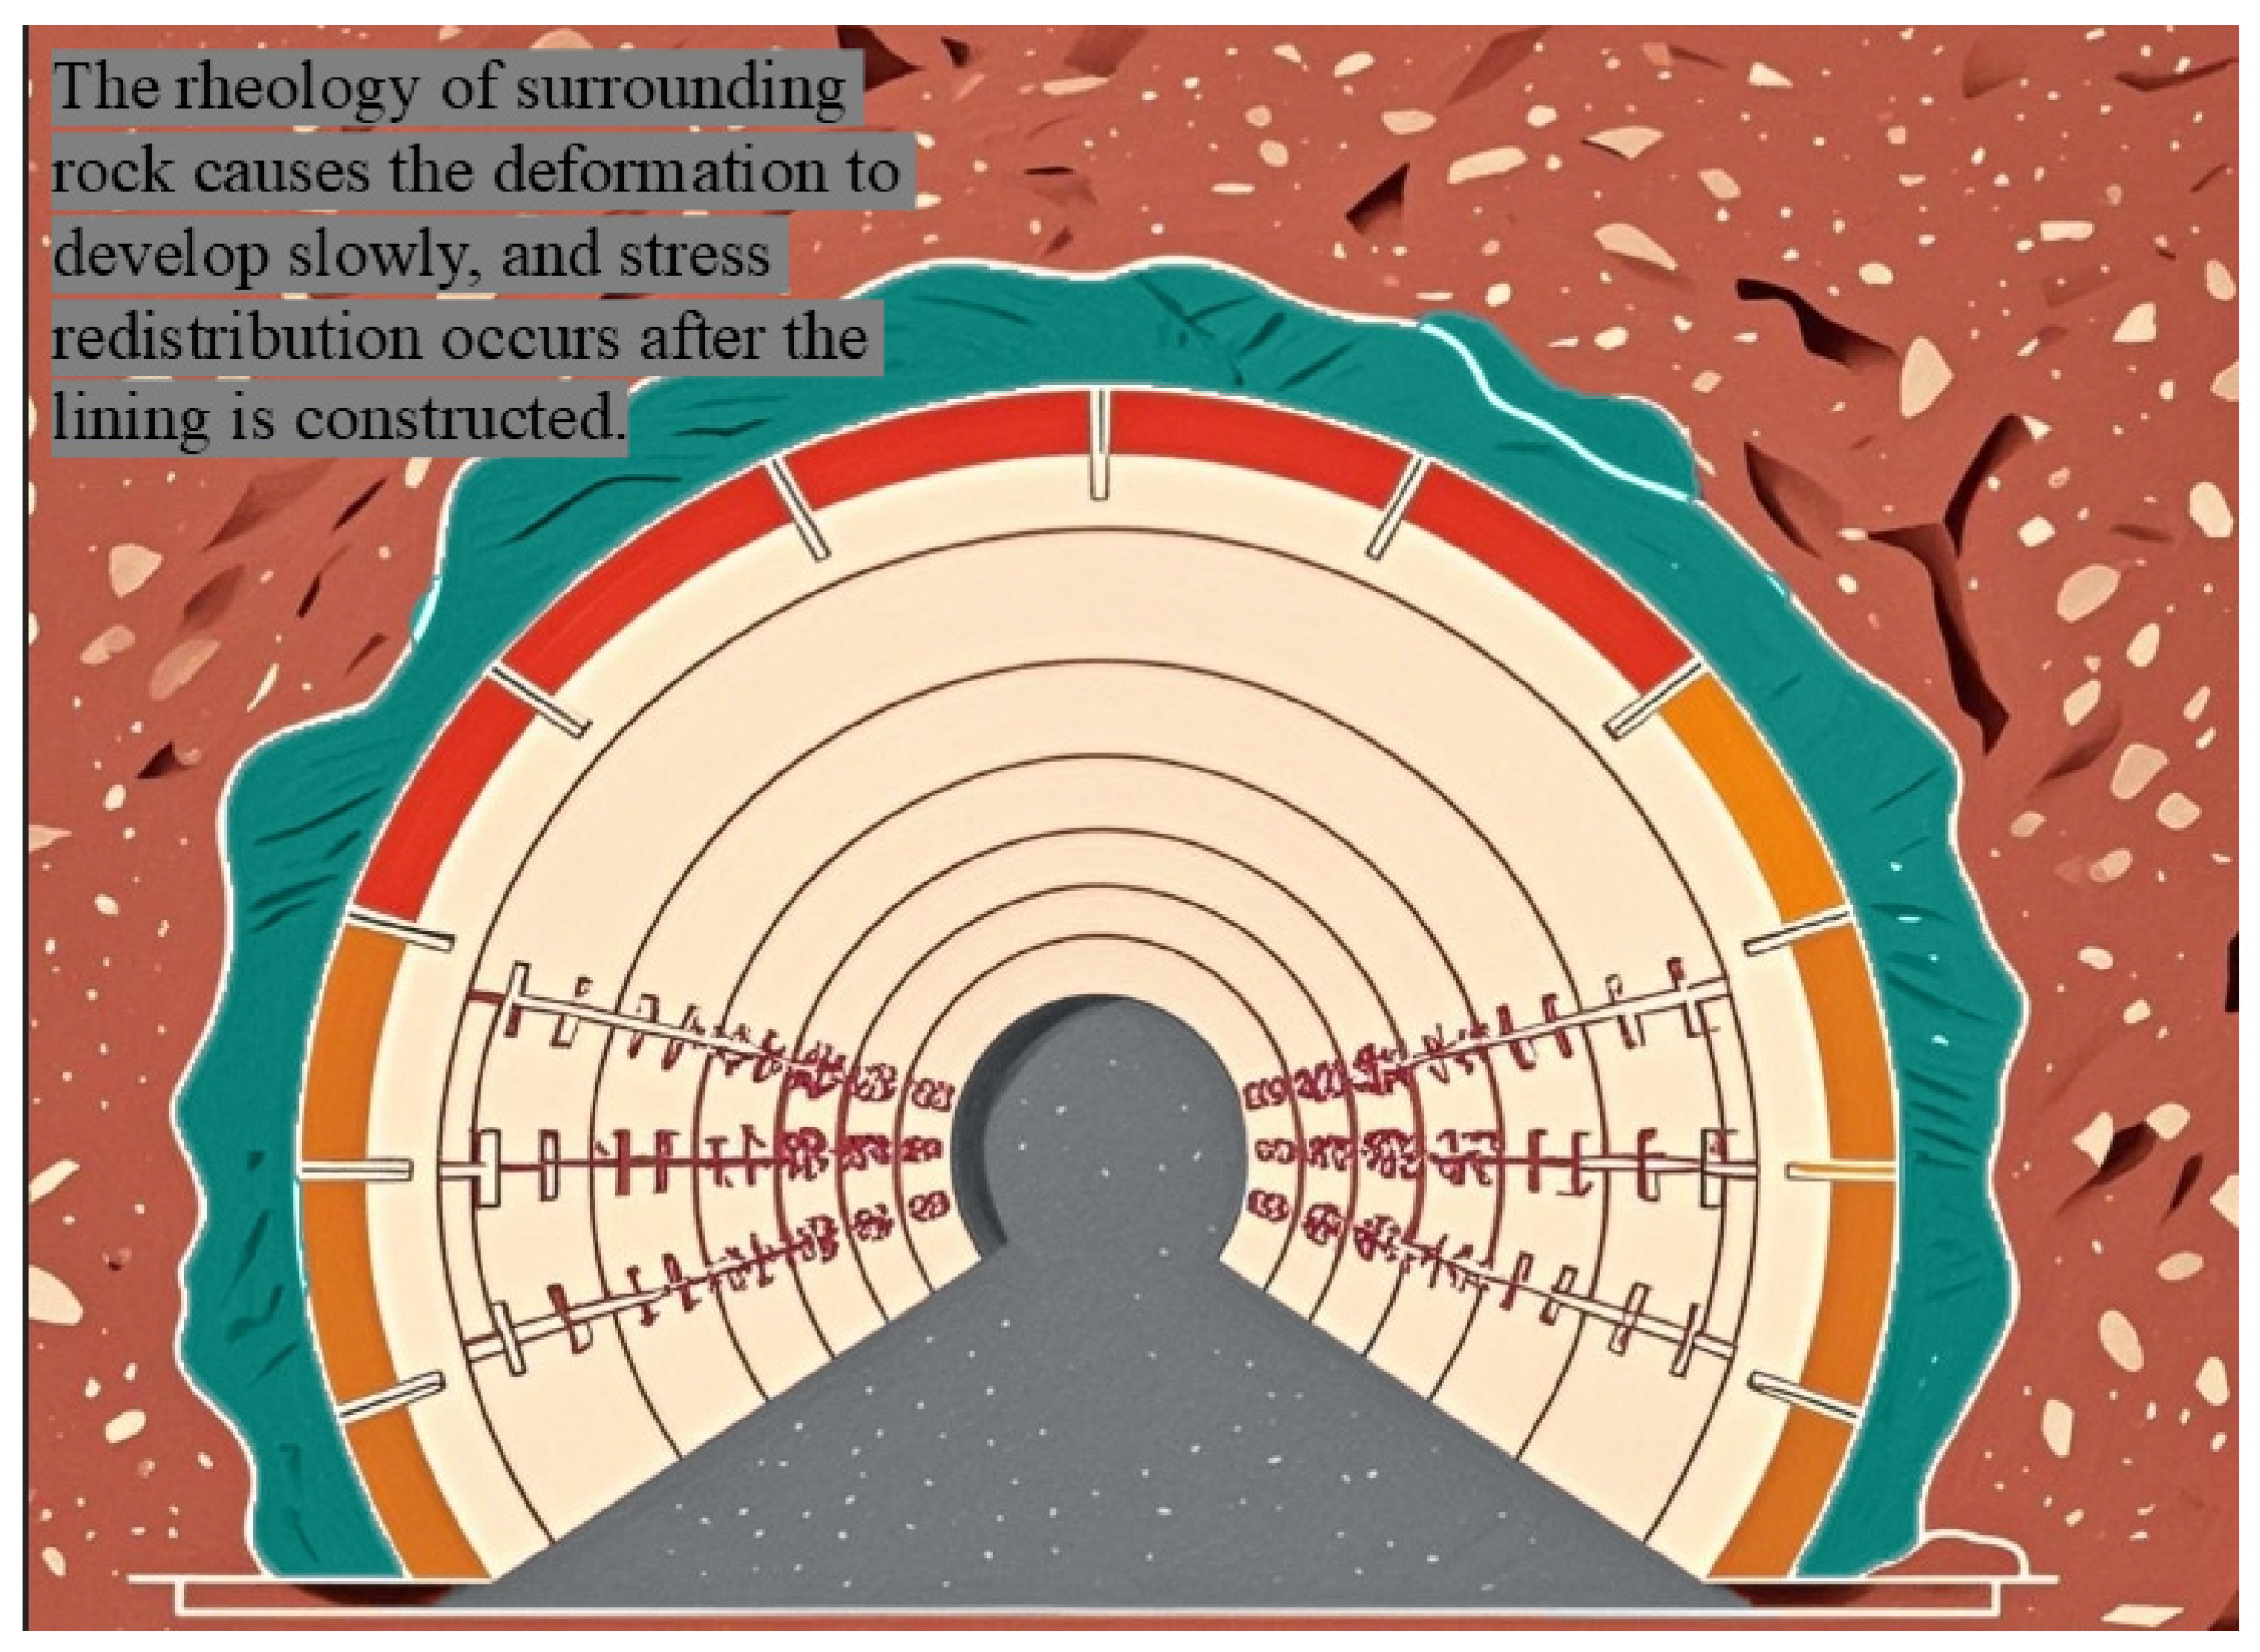
2.2. Infinite Remote Monitoring System
3. Results
3.1. Mechanical Behavior and Deformation Characteristics of Anchor Bolts
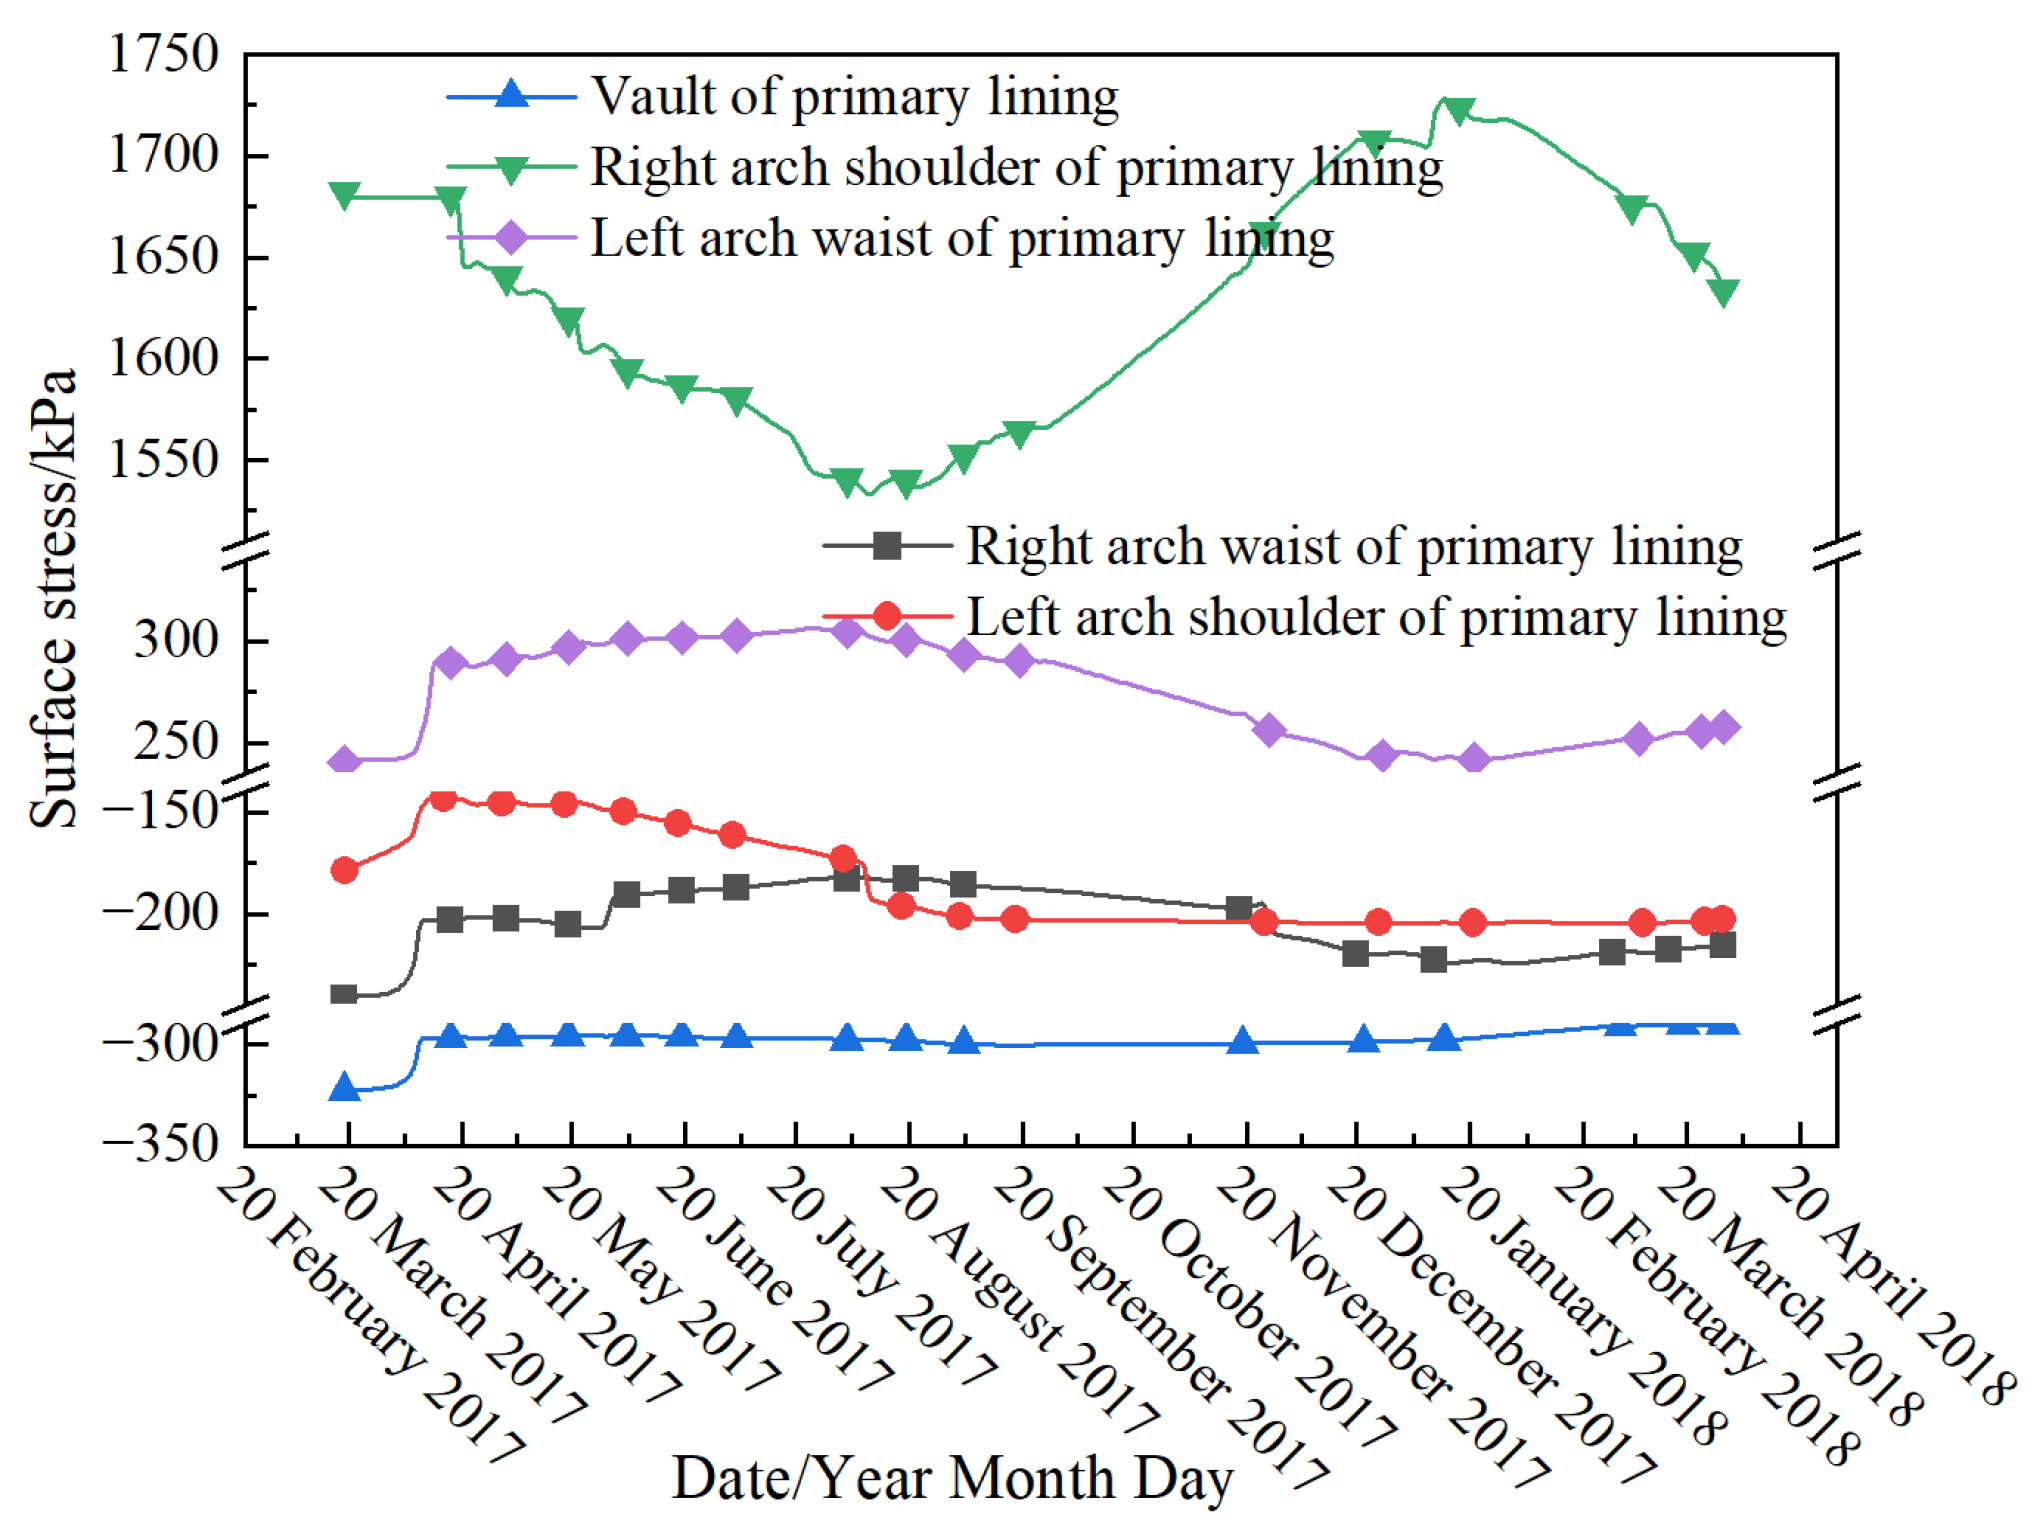
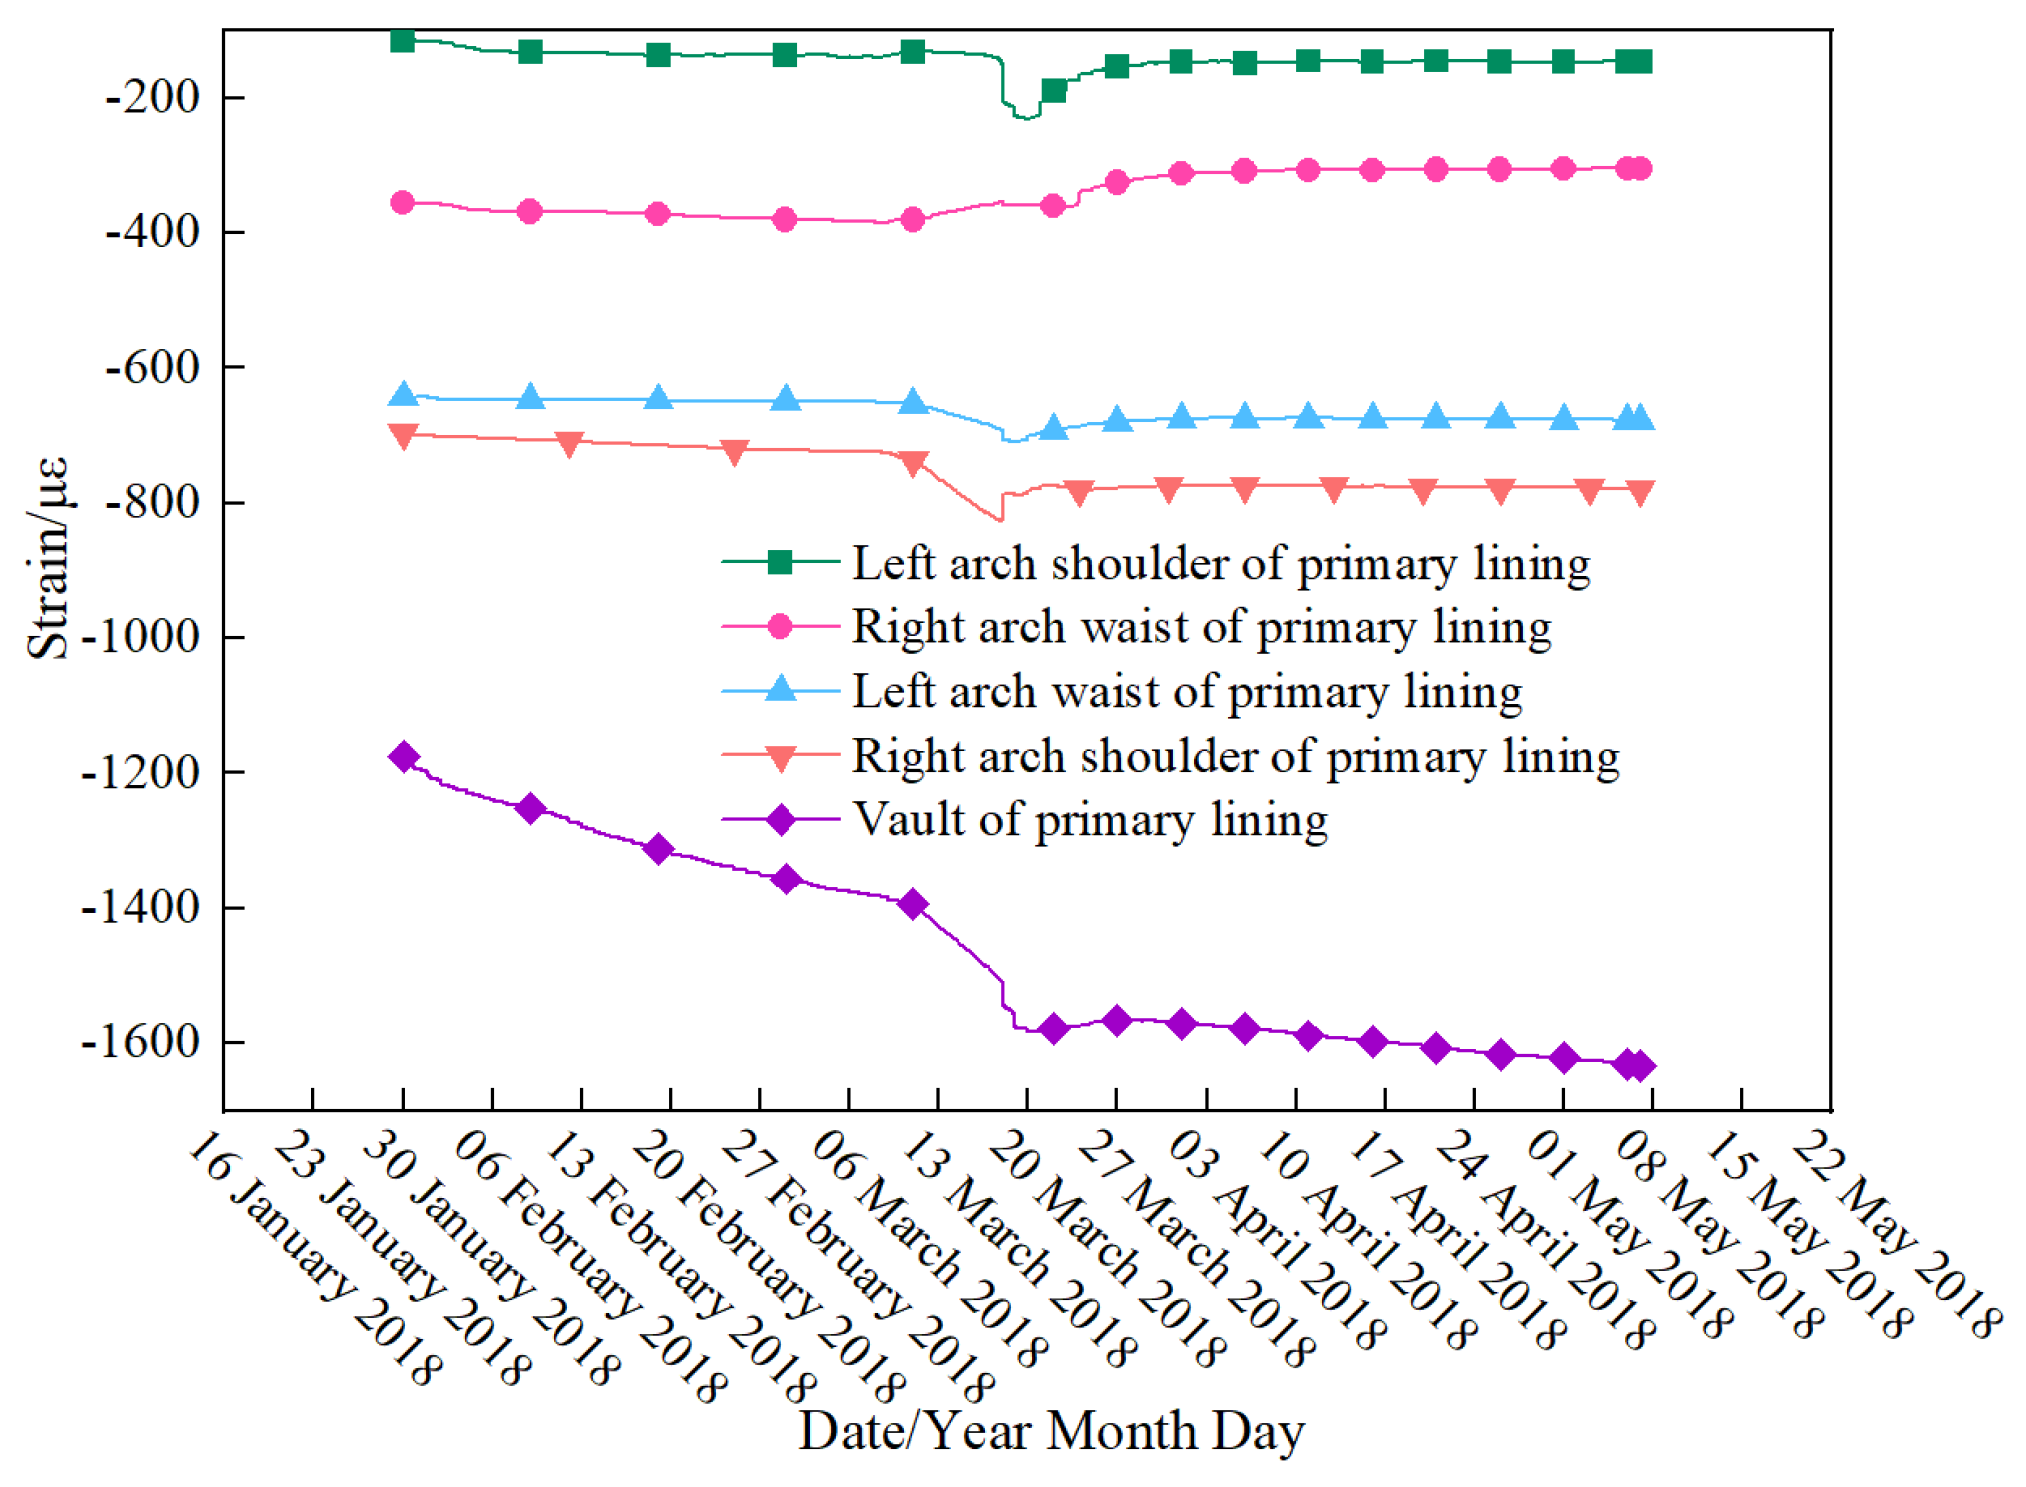
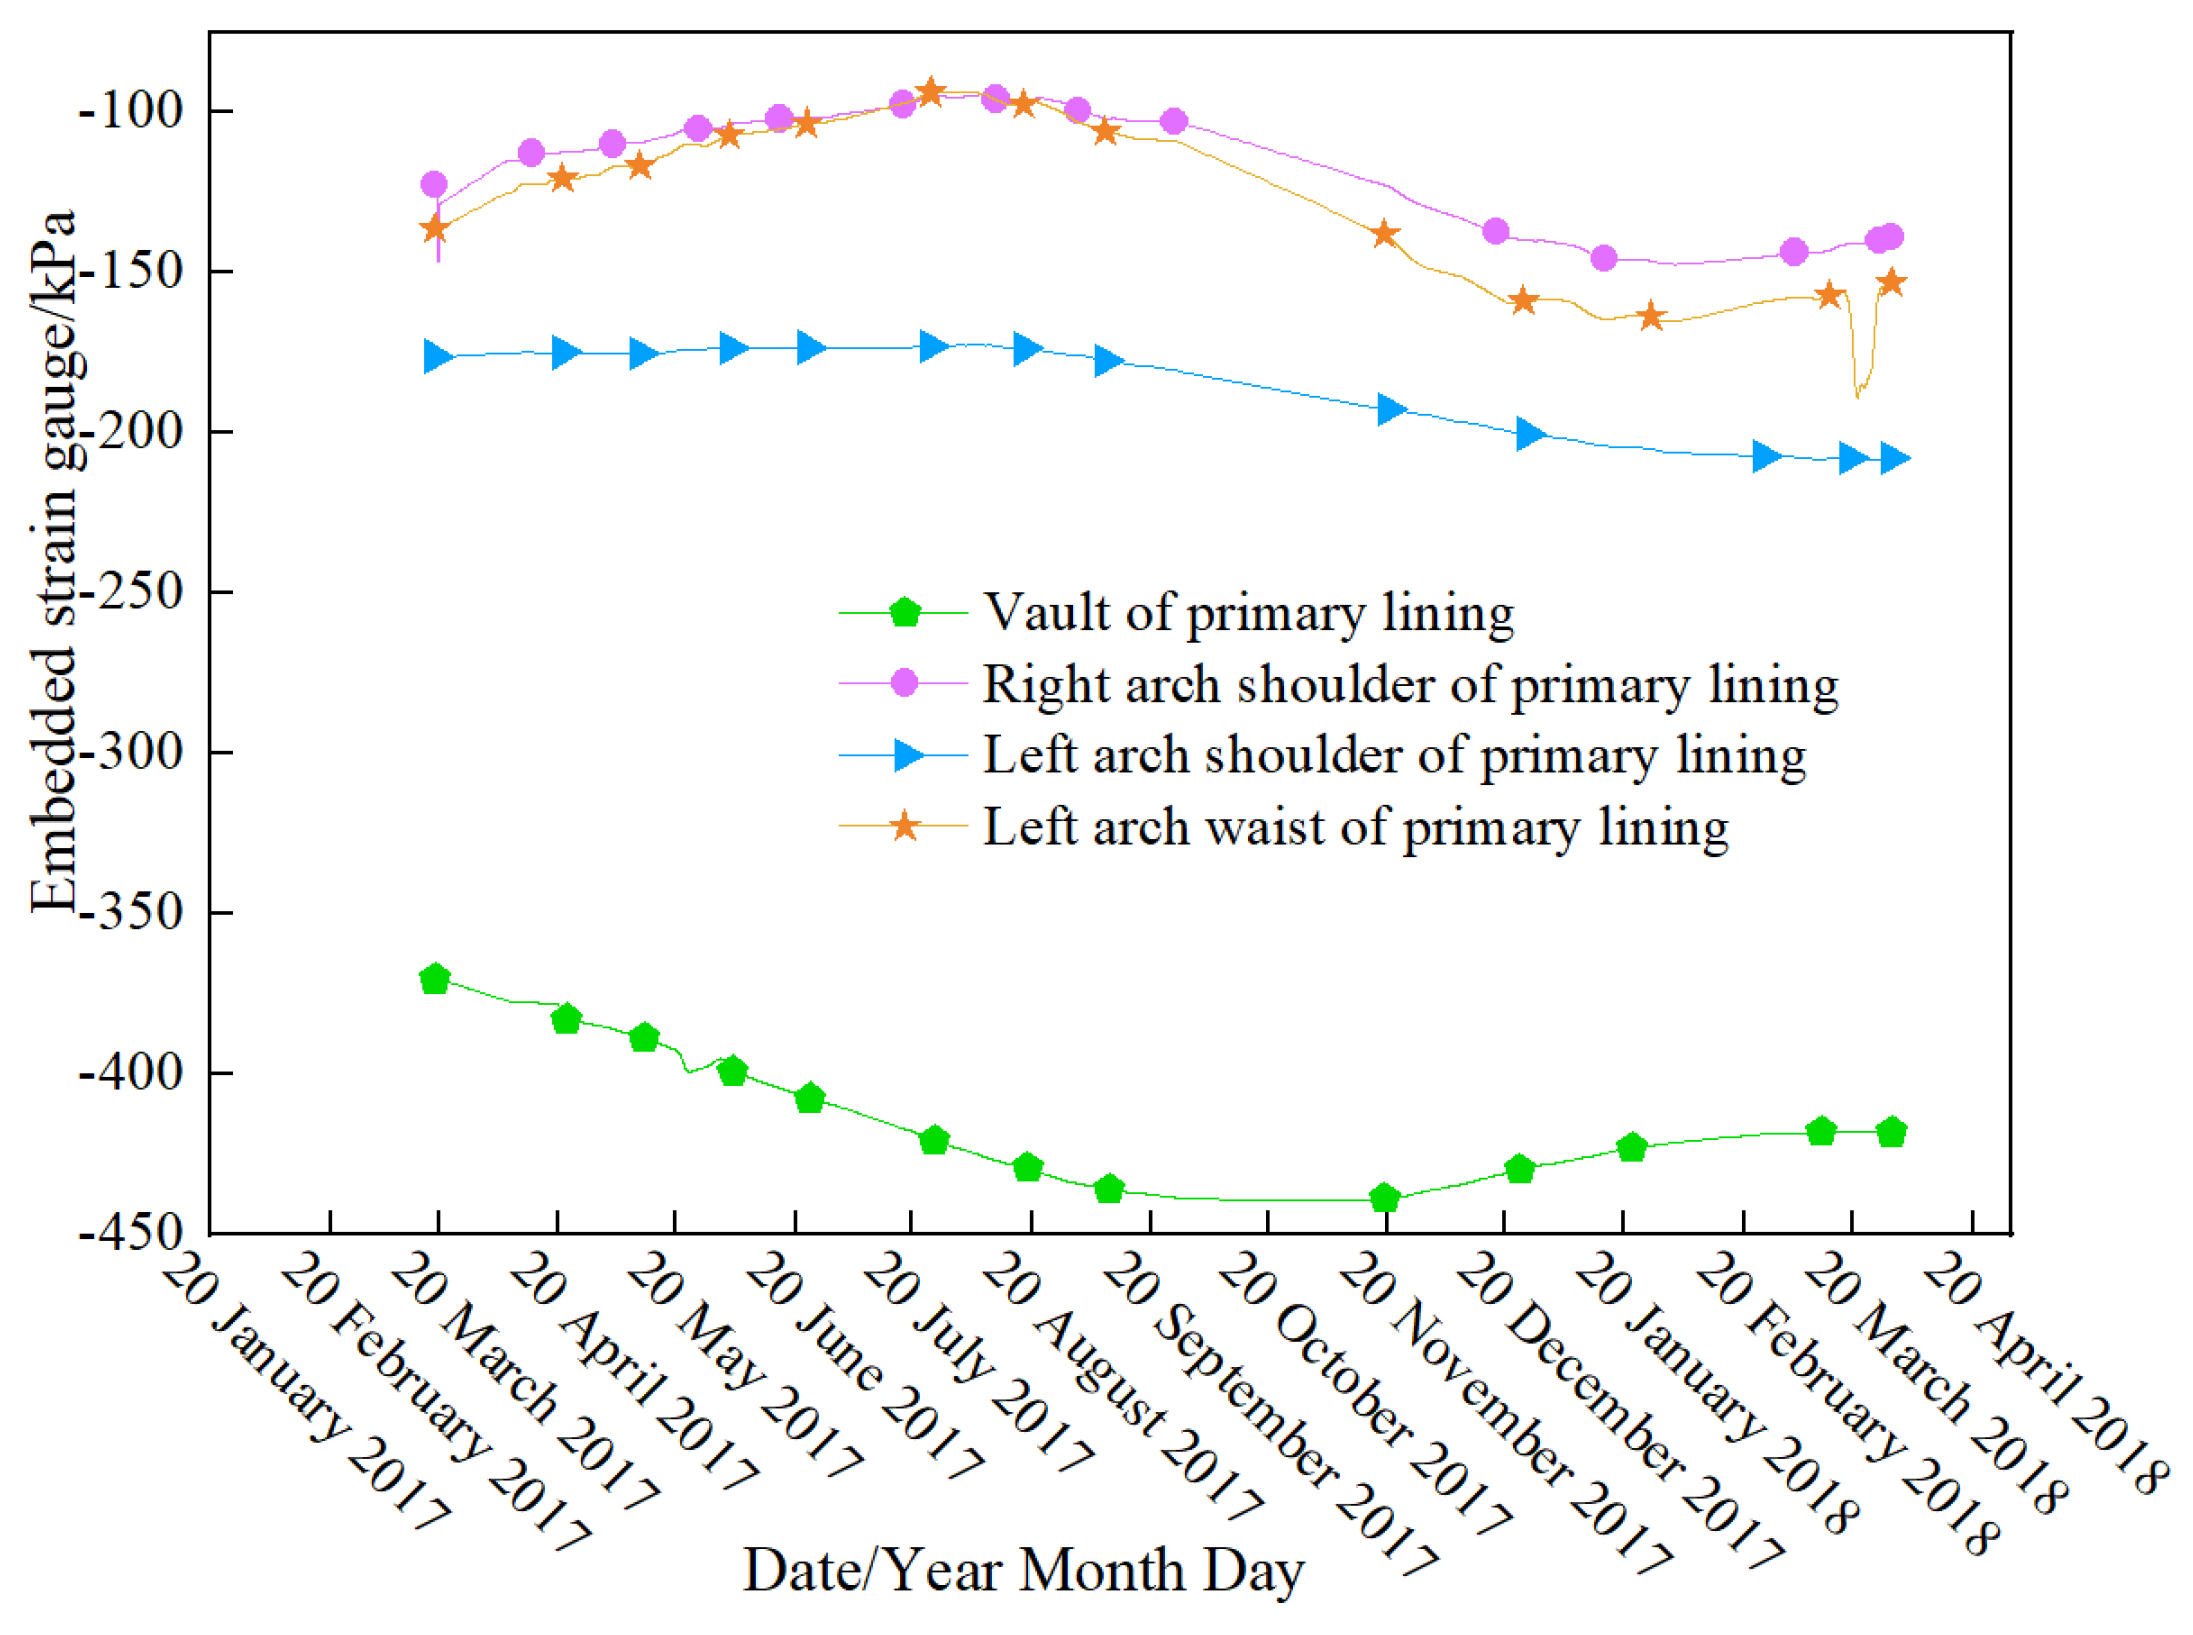
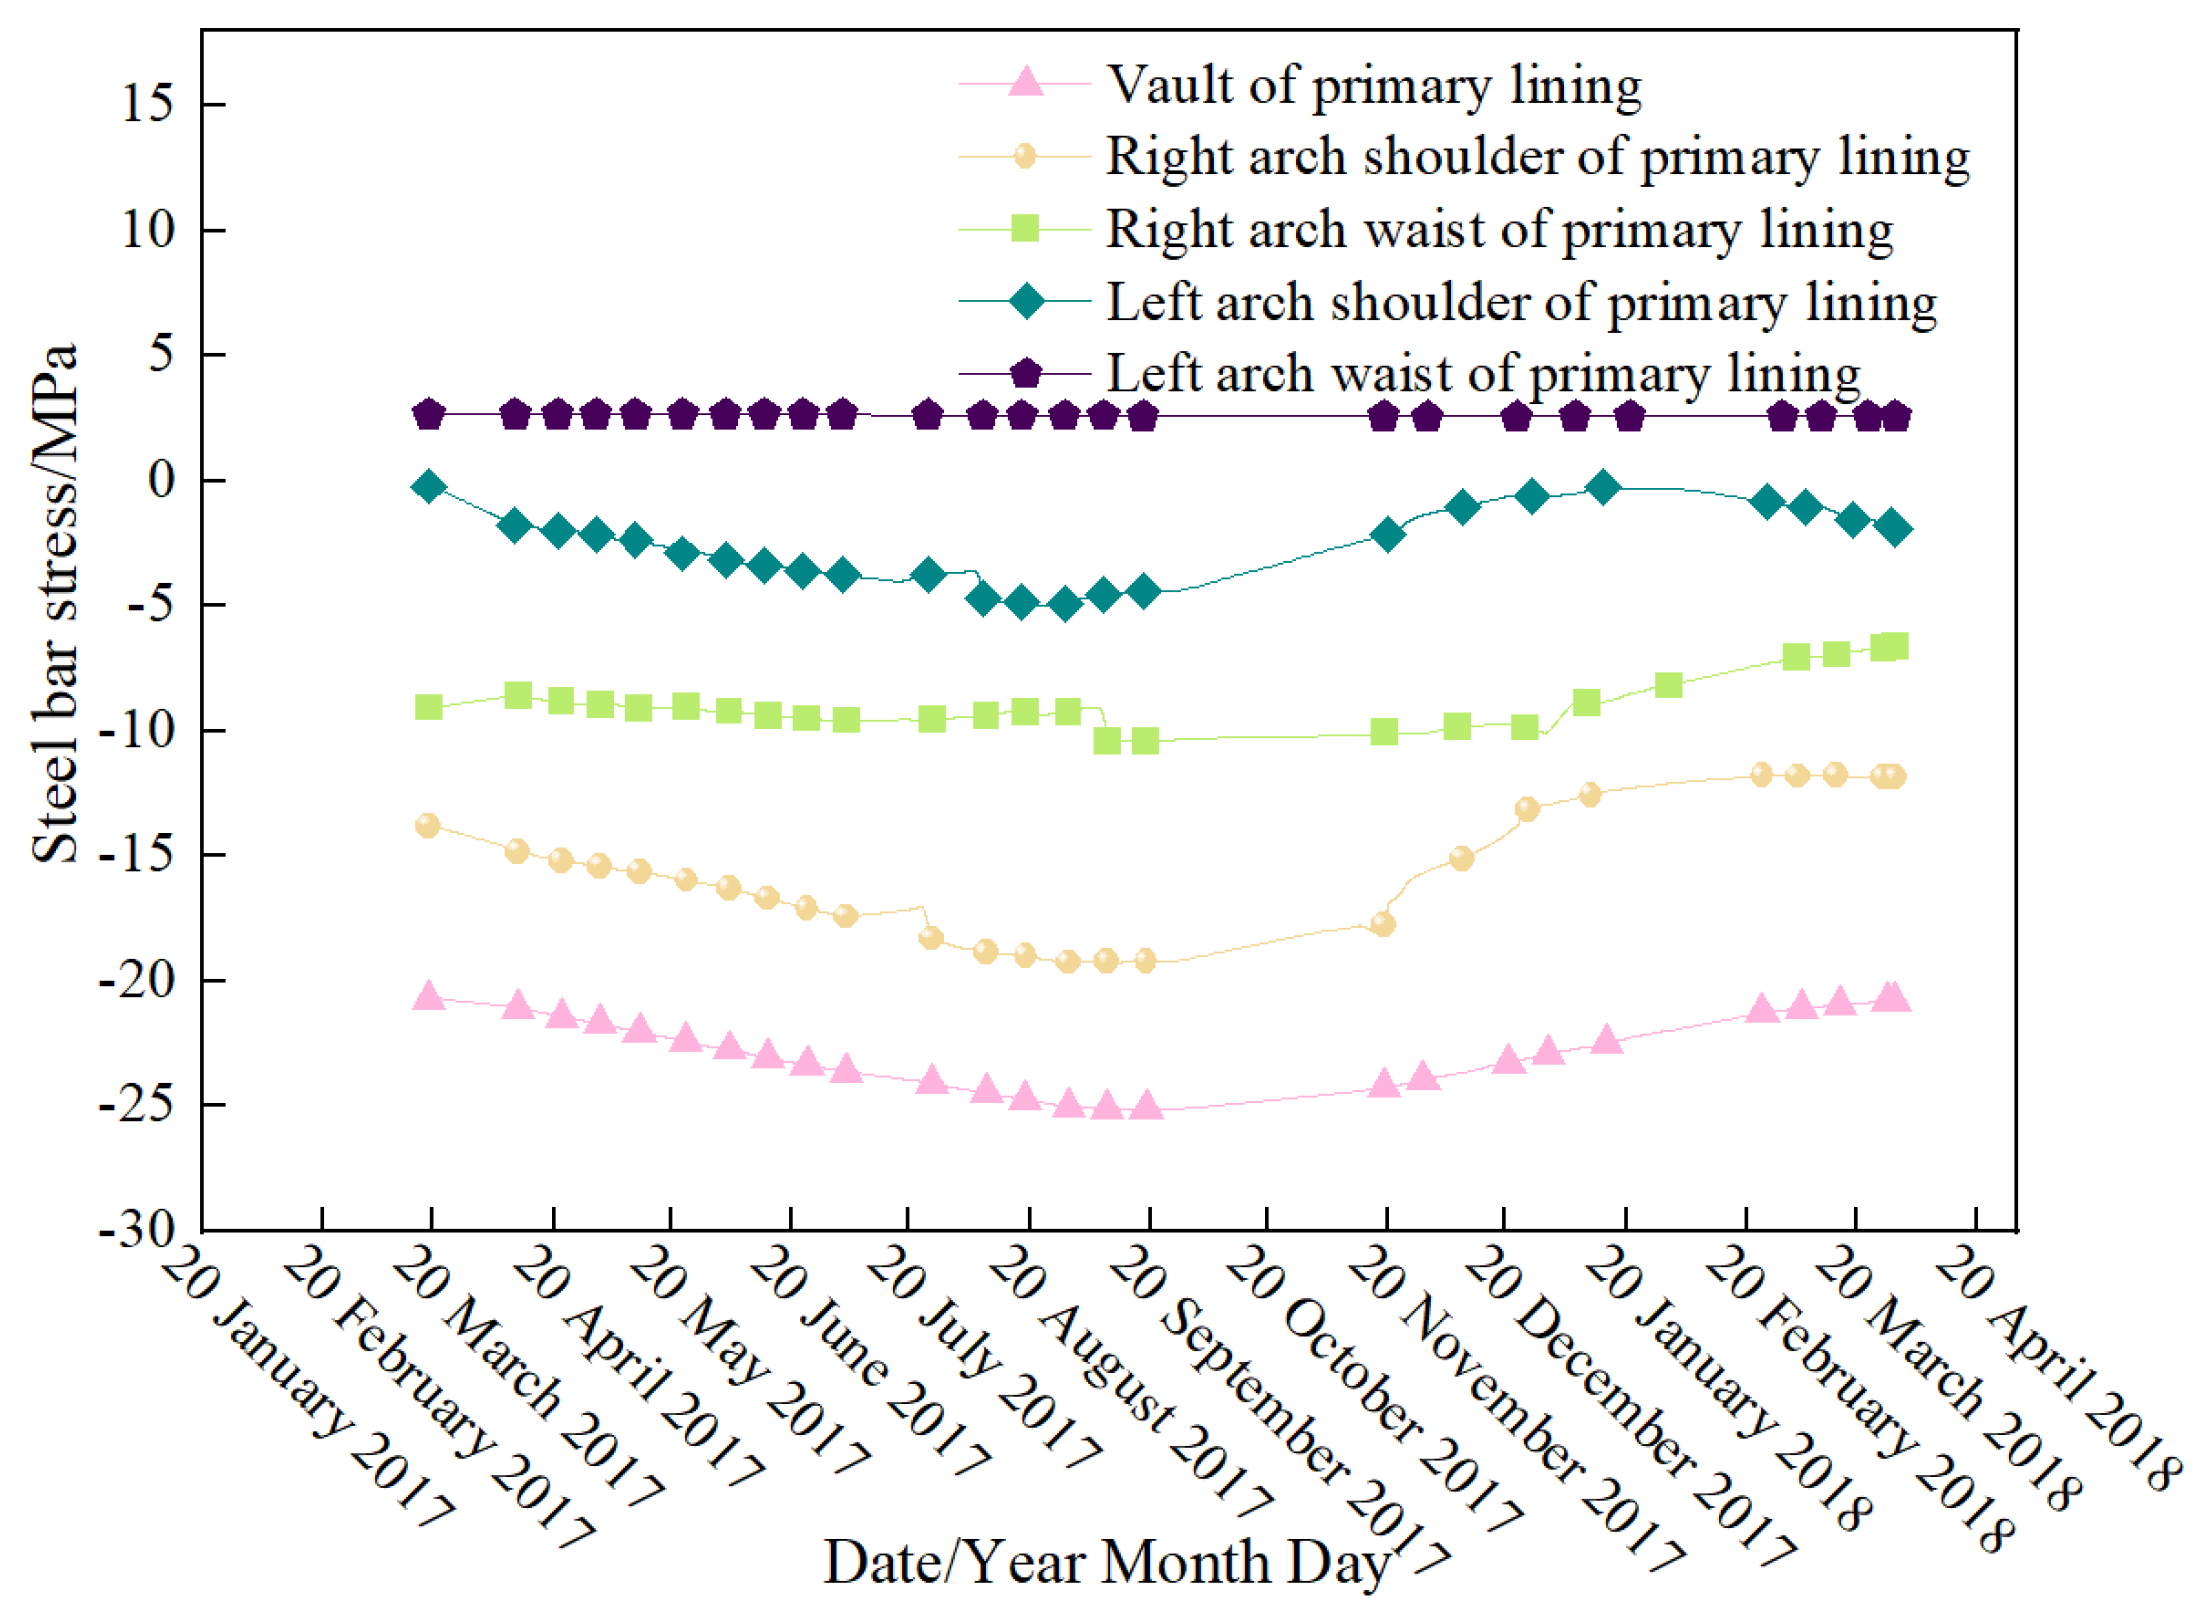
3.2. Mechanical Behavior and Deformation Characteristics of Primary Lining
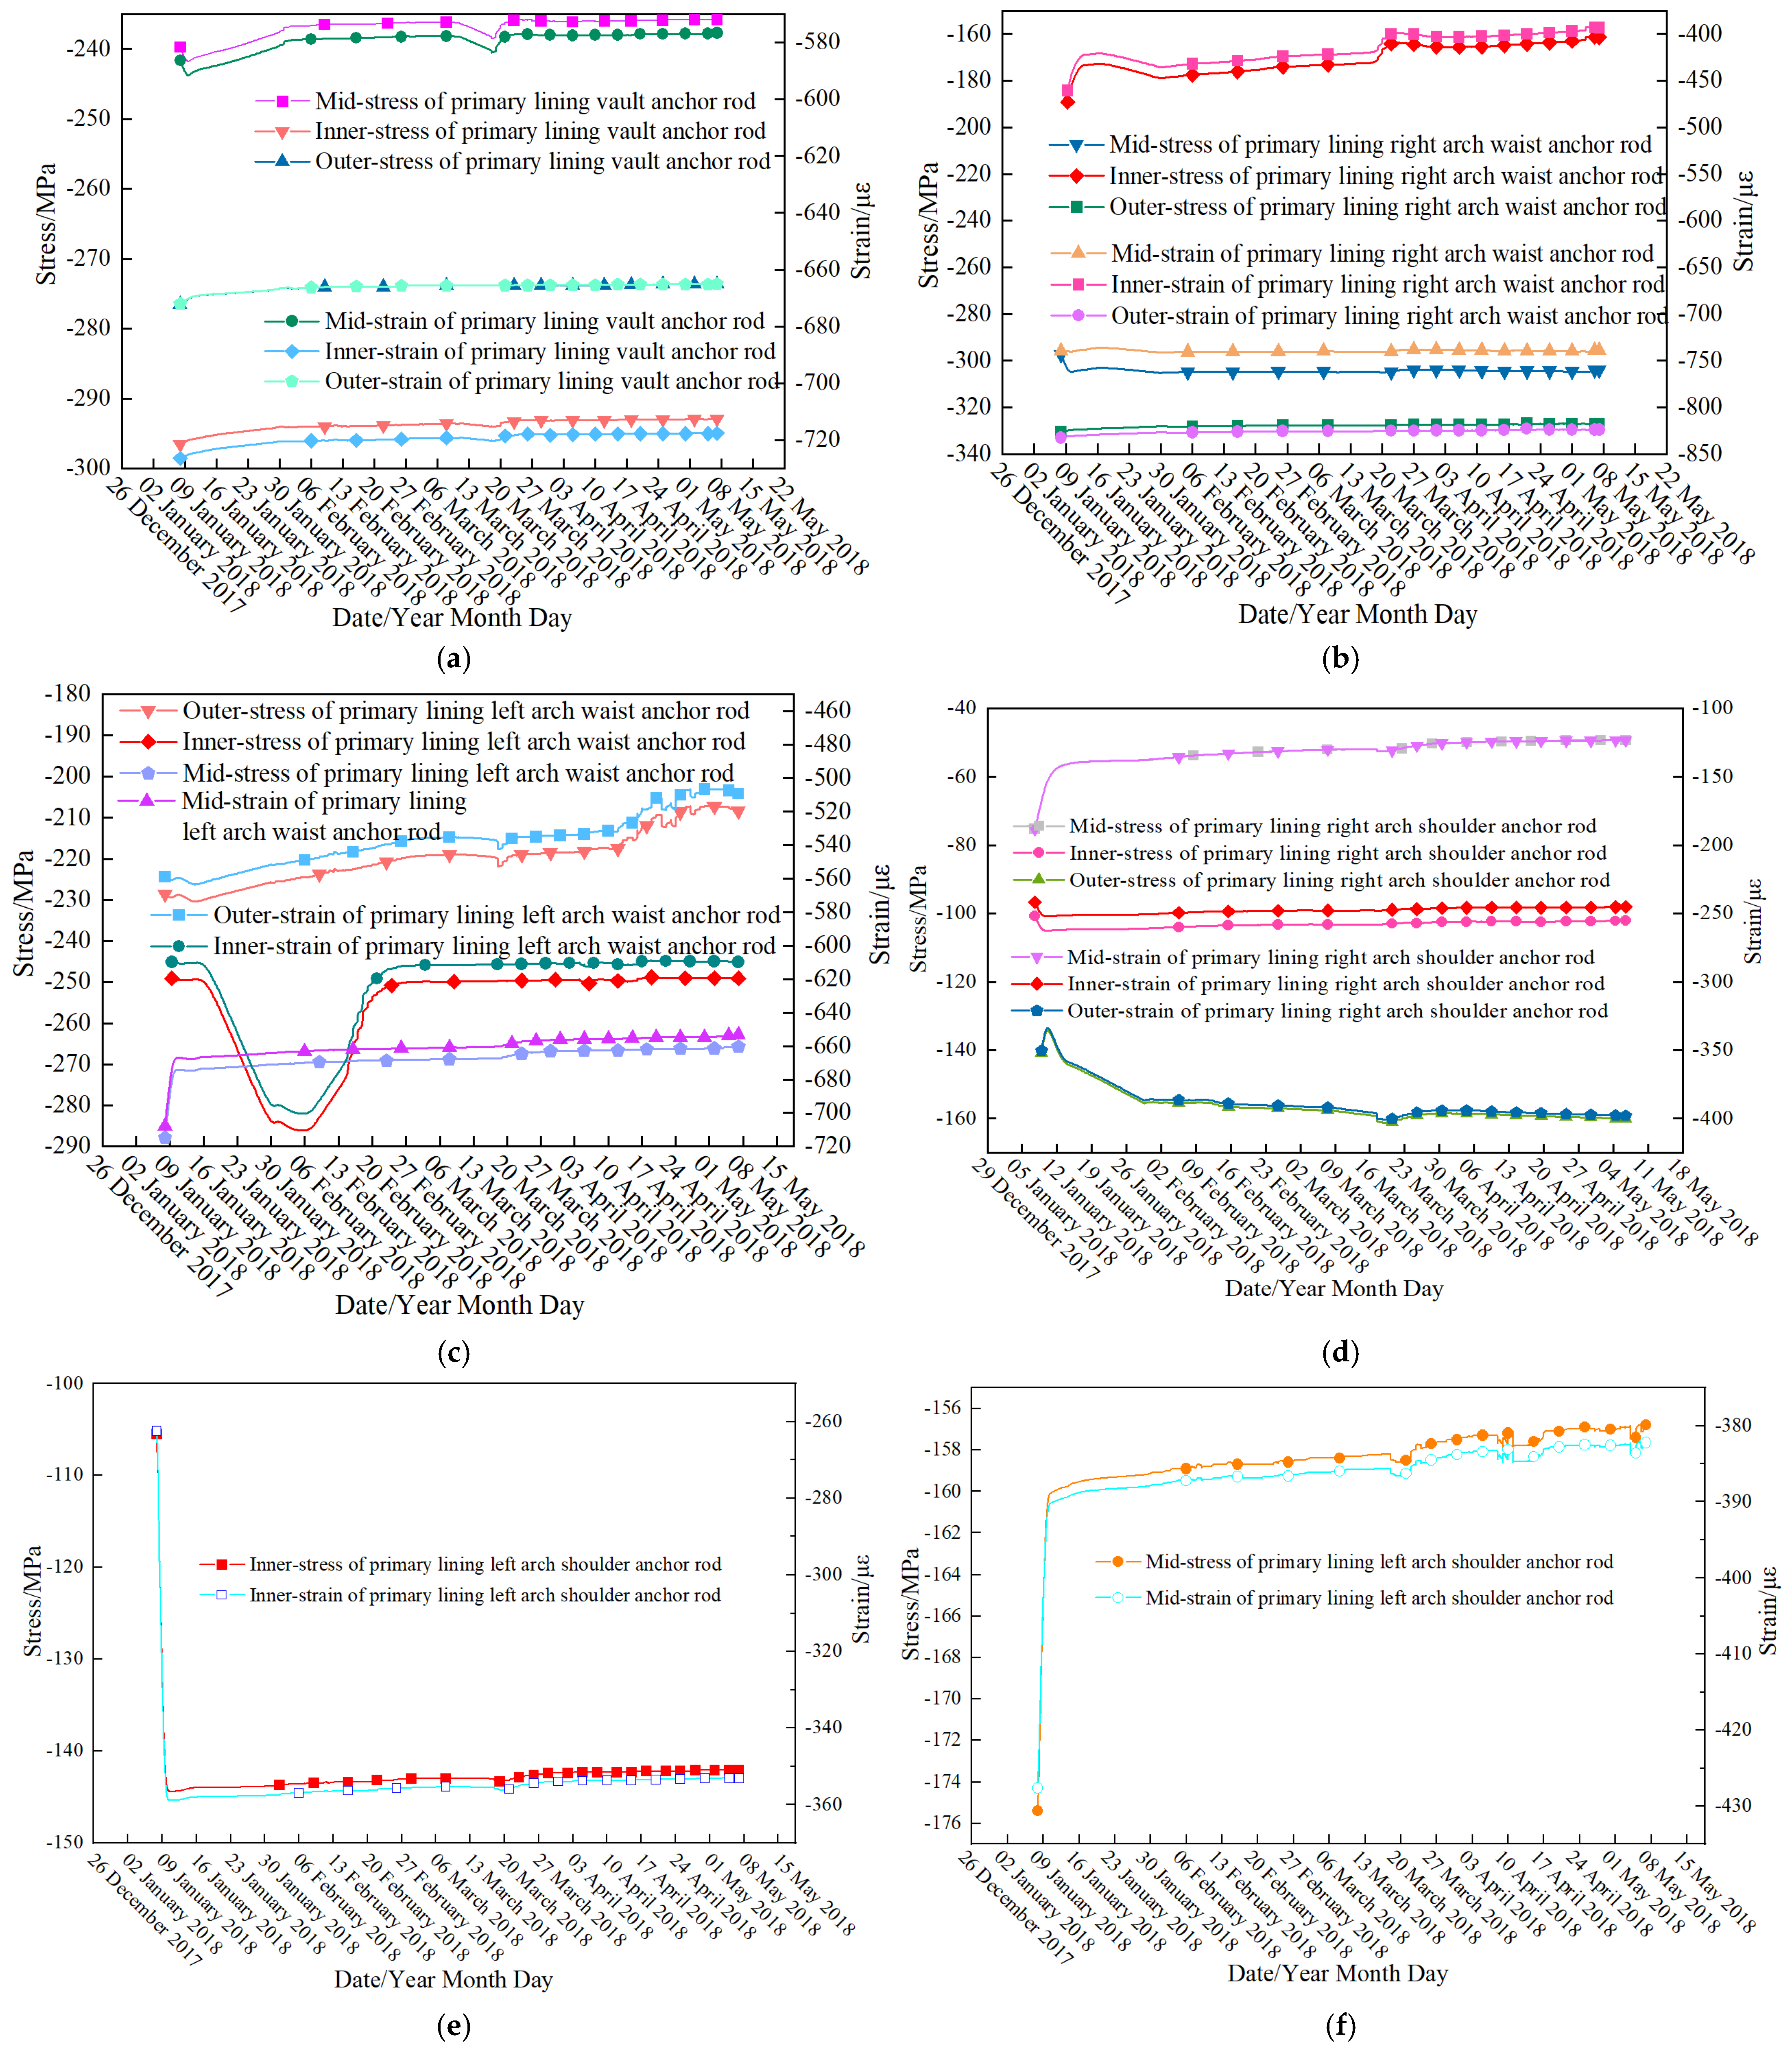
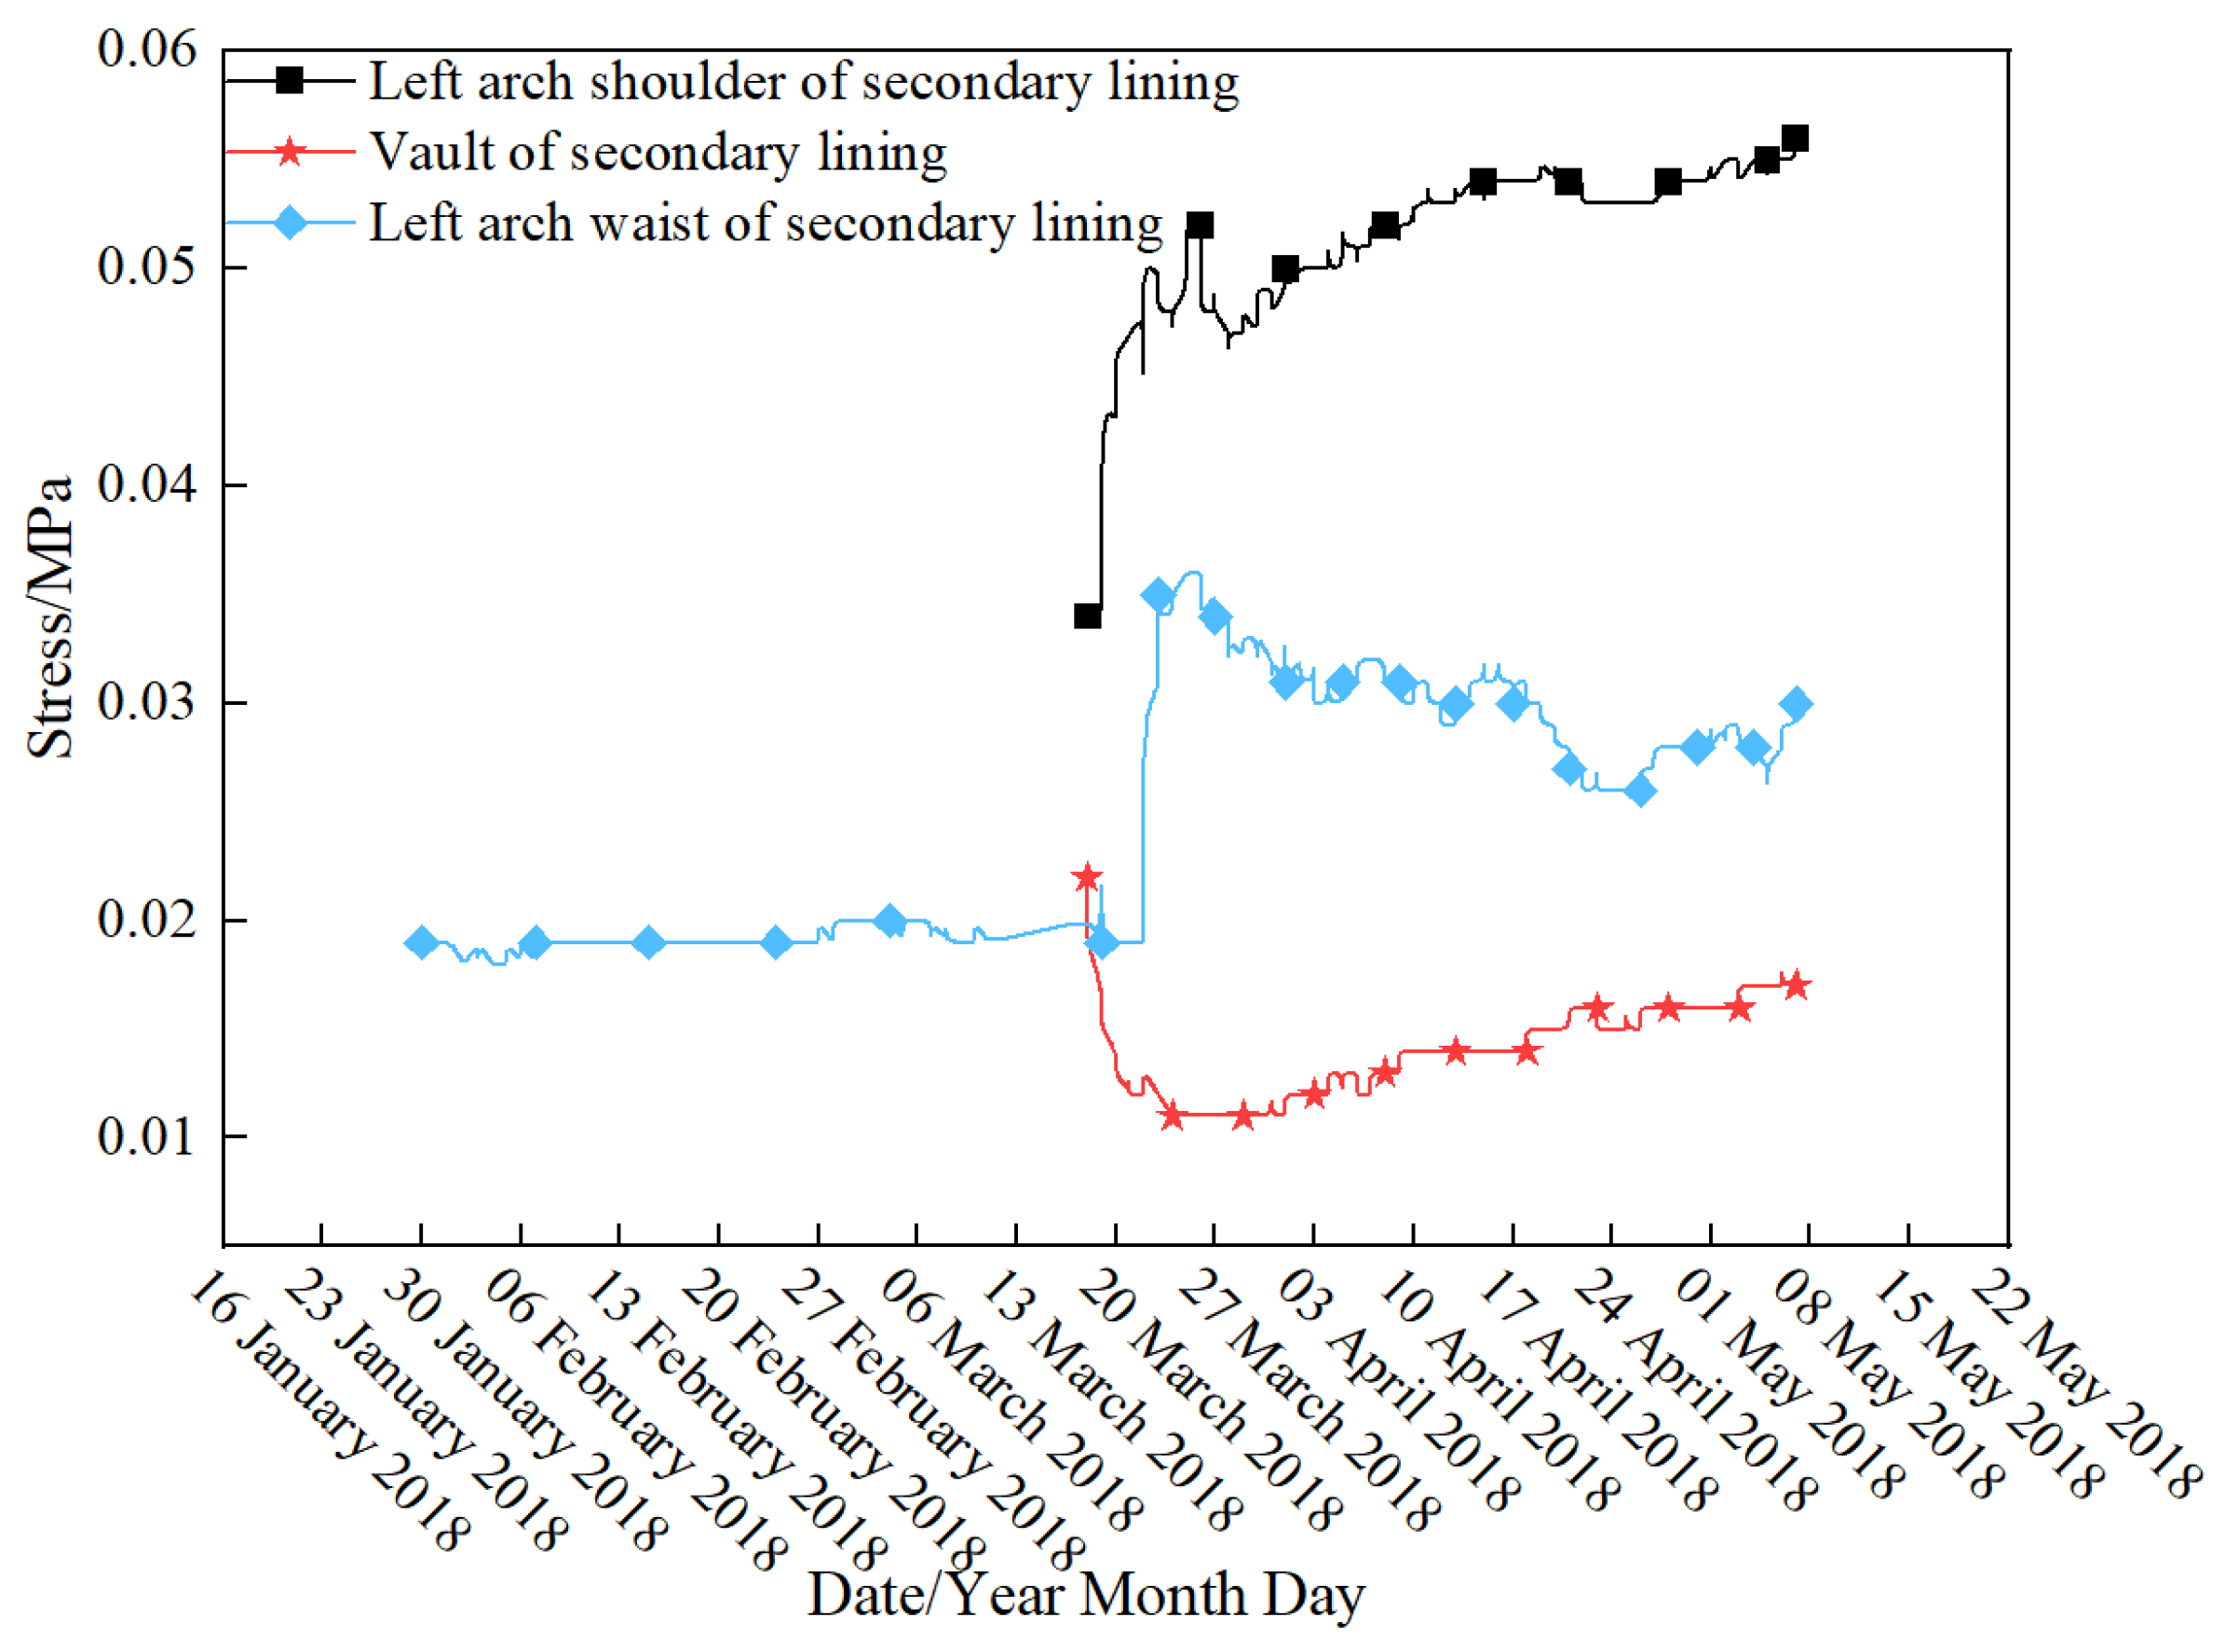
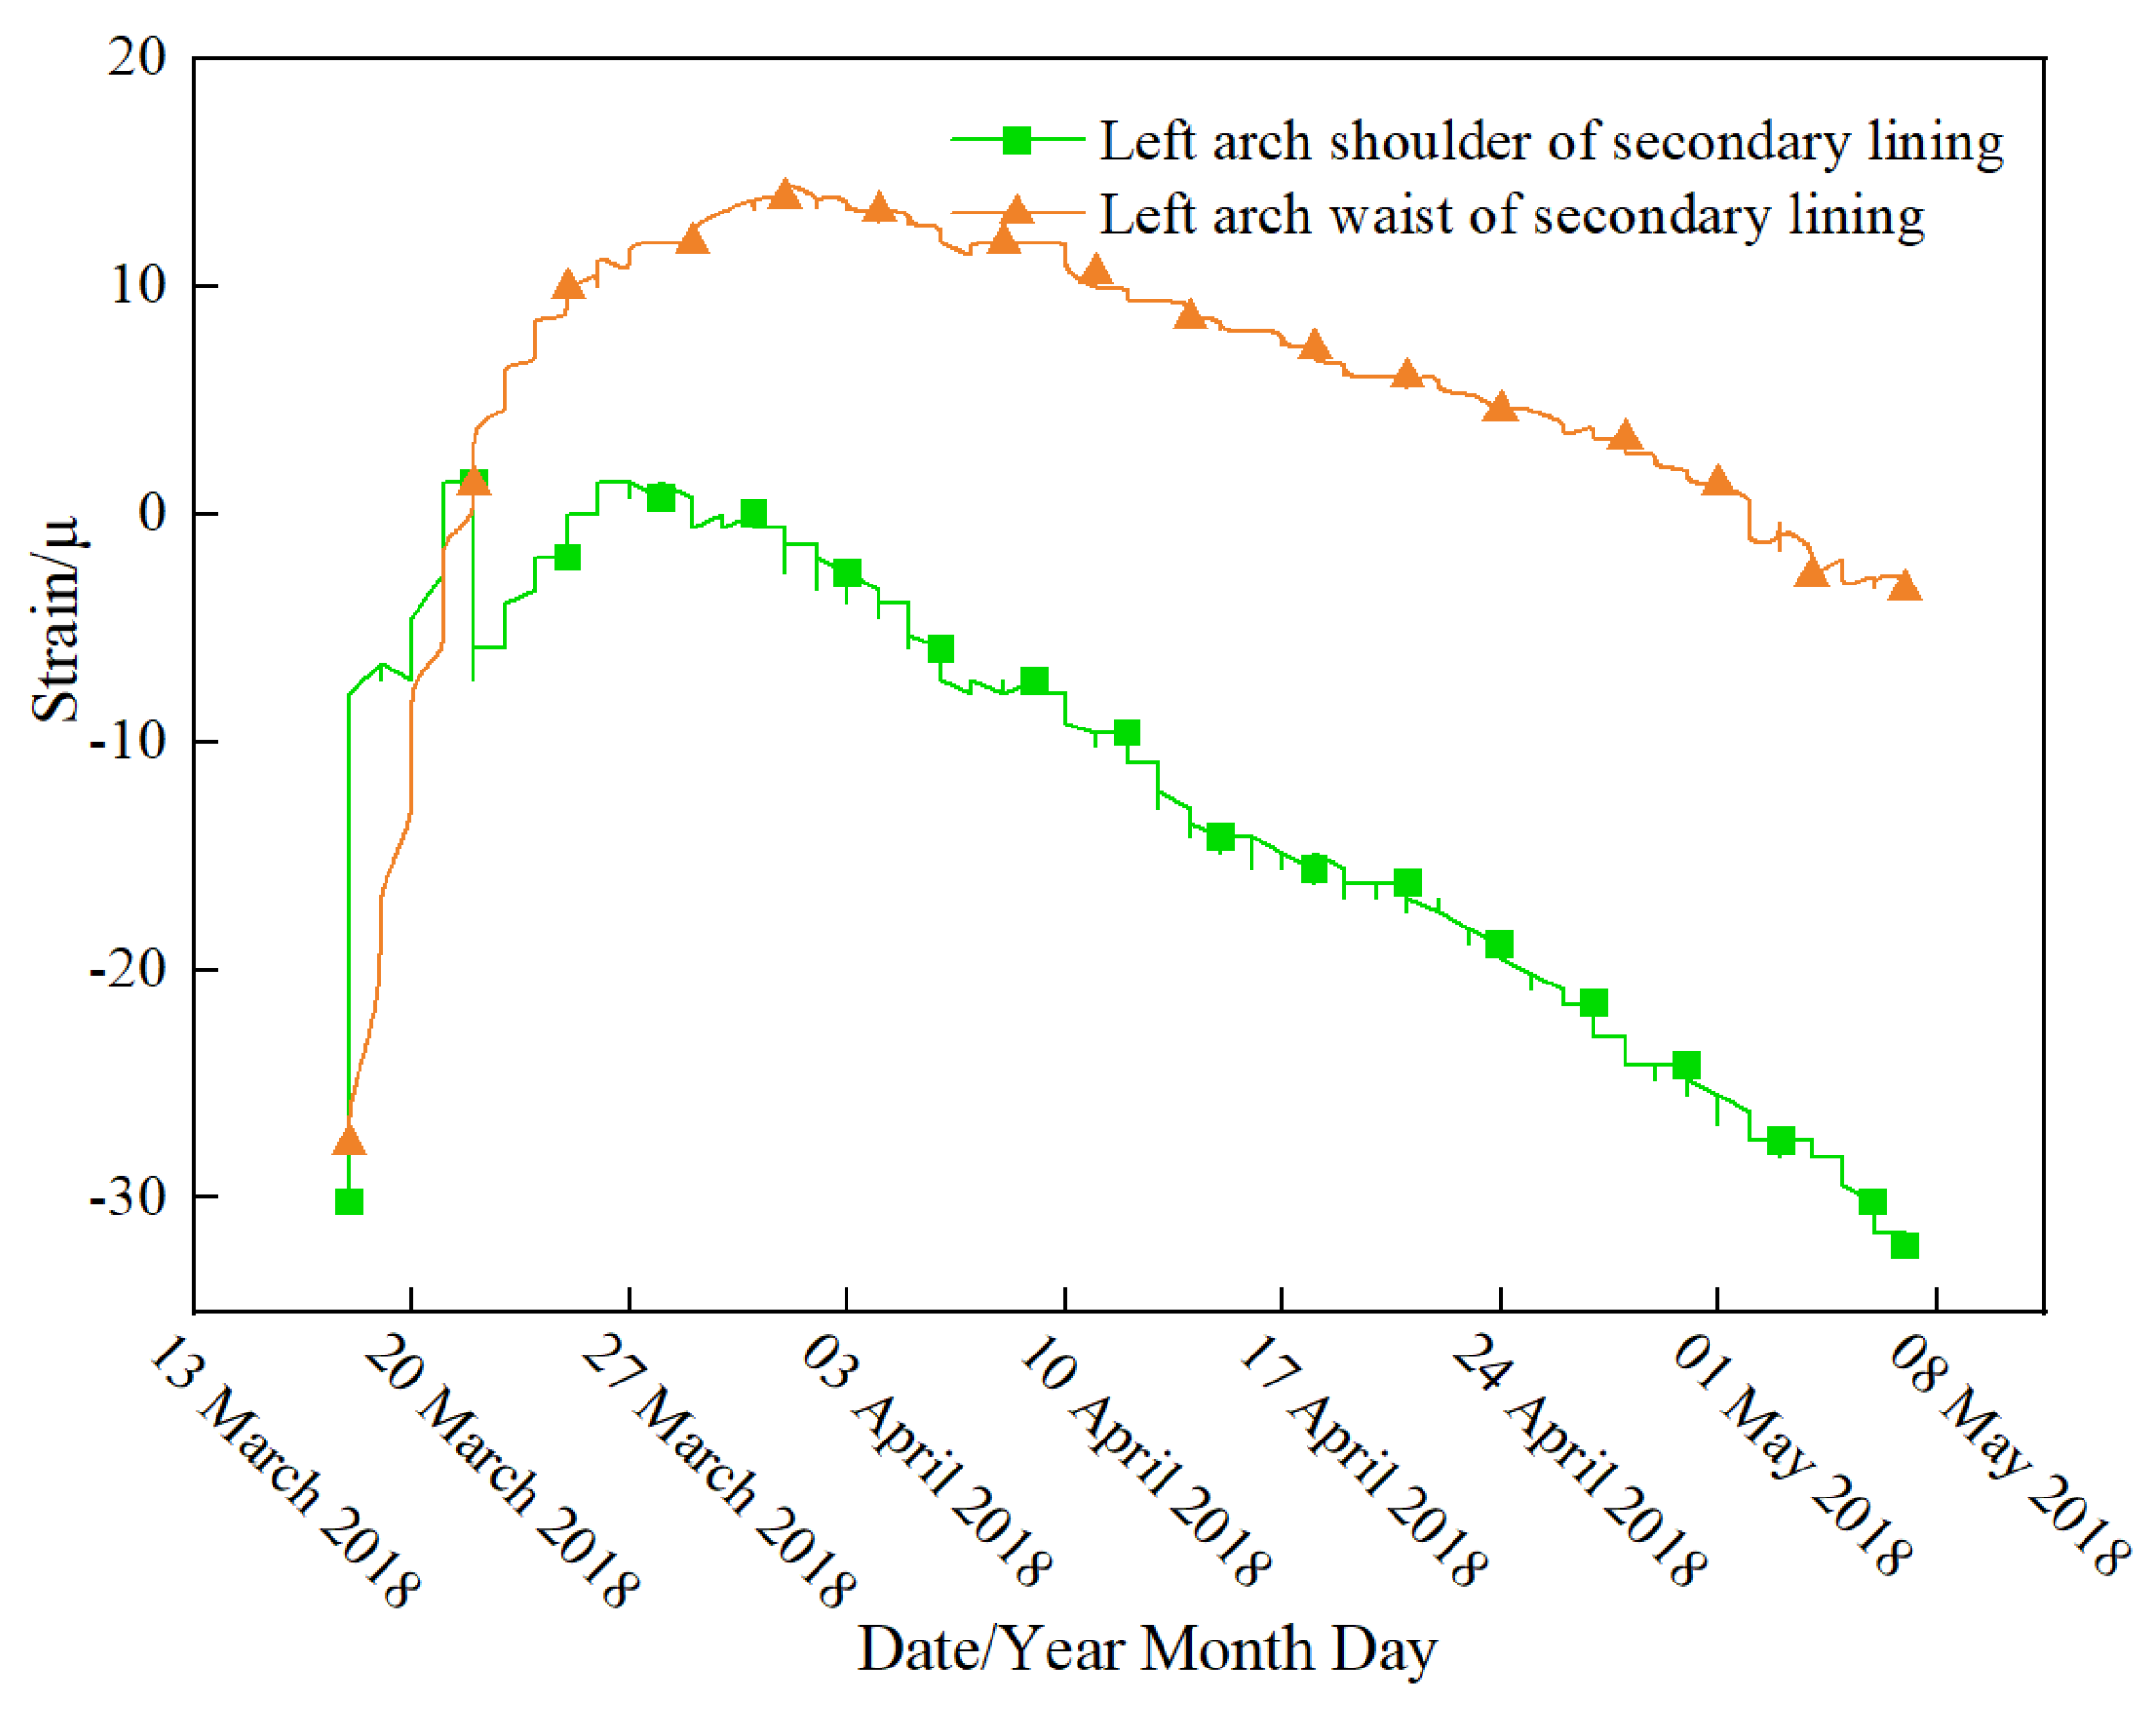
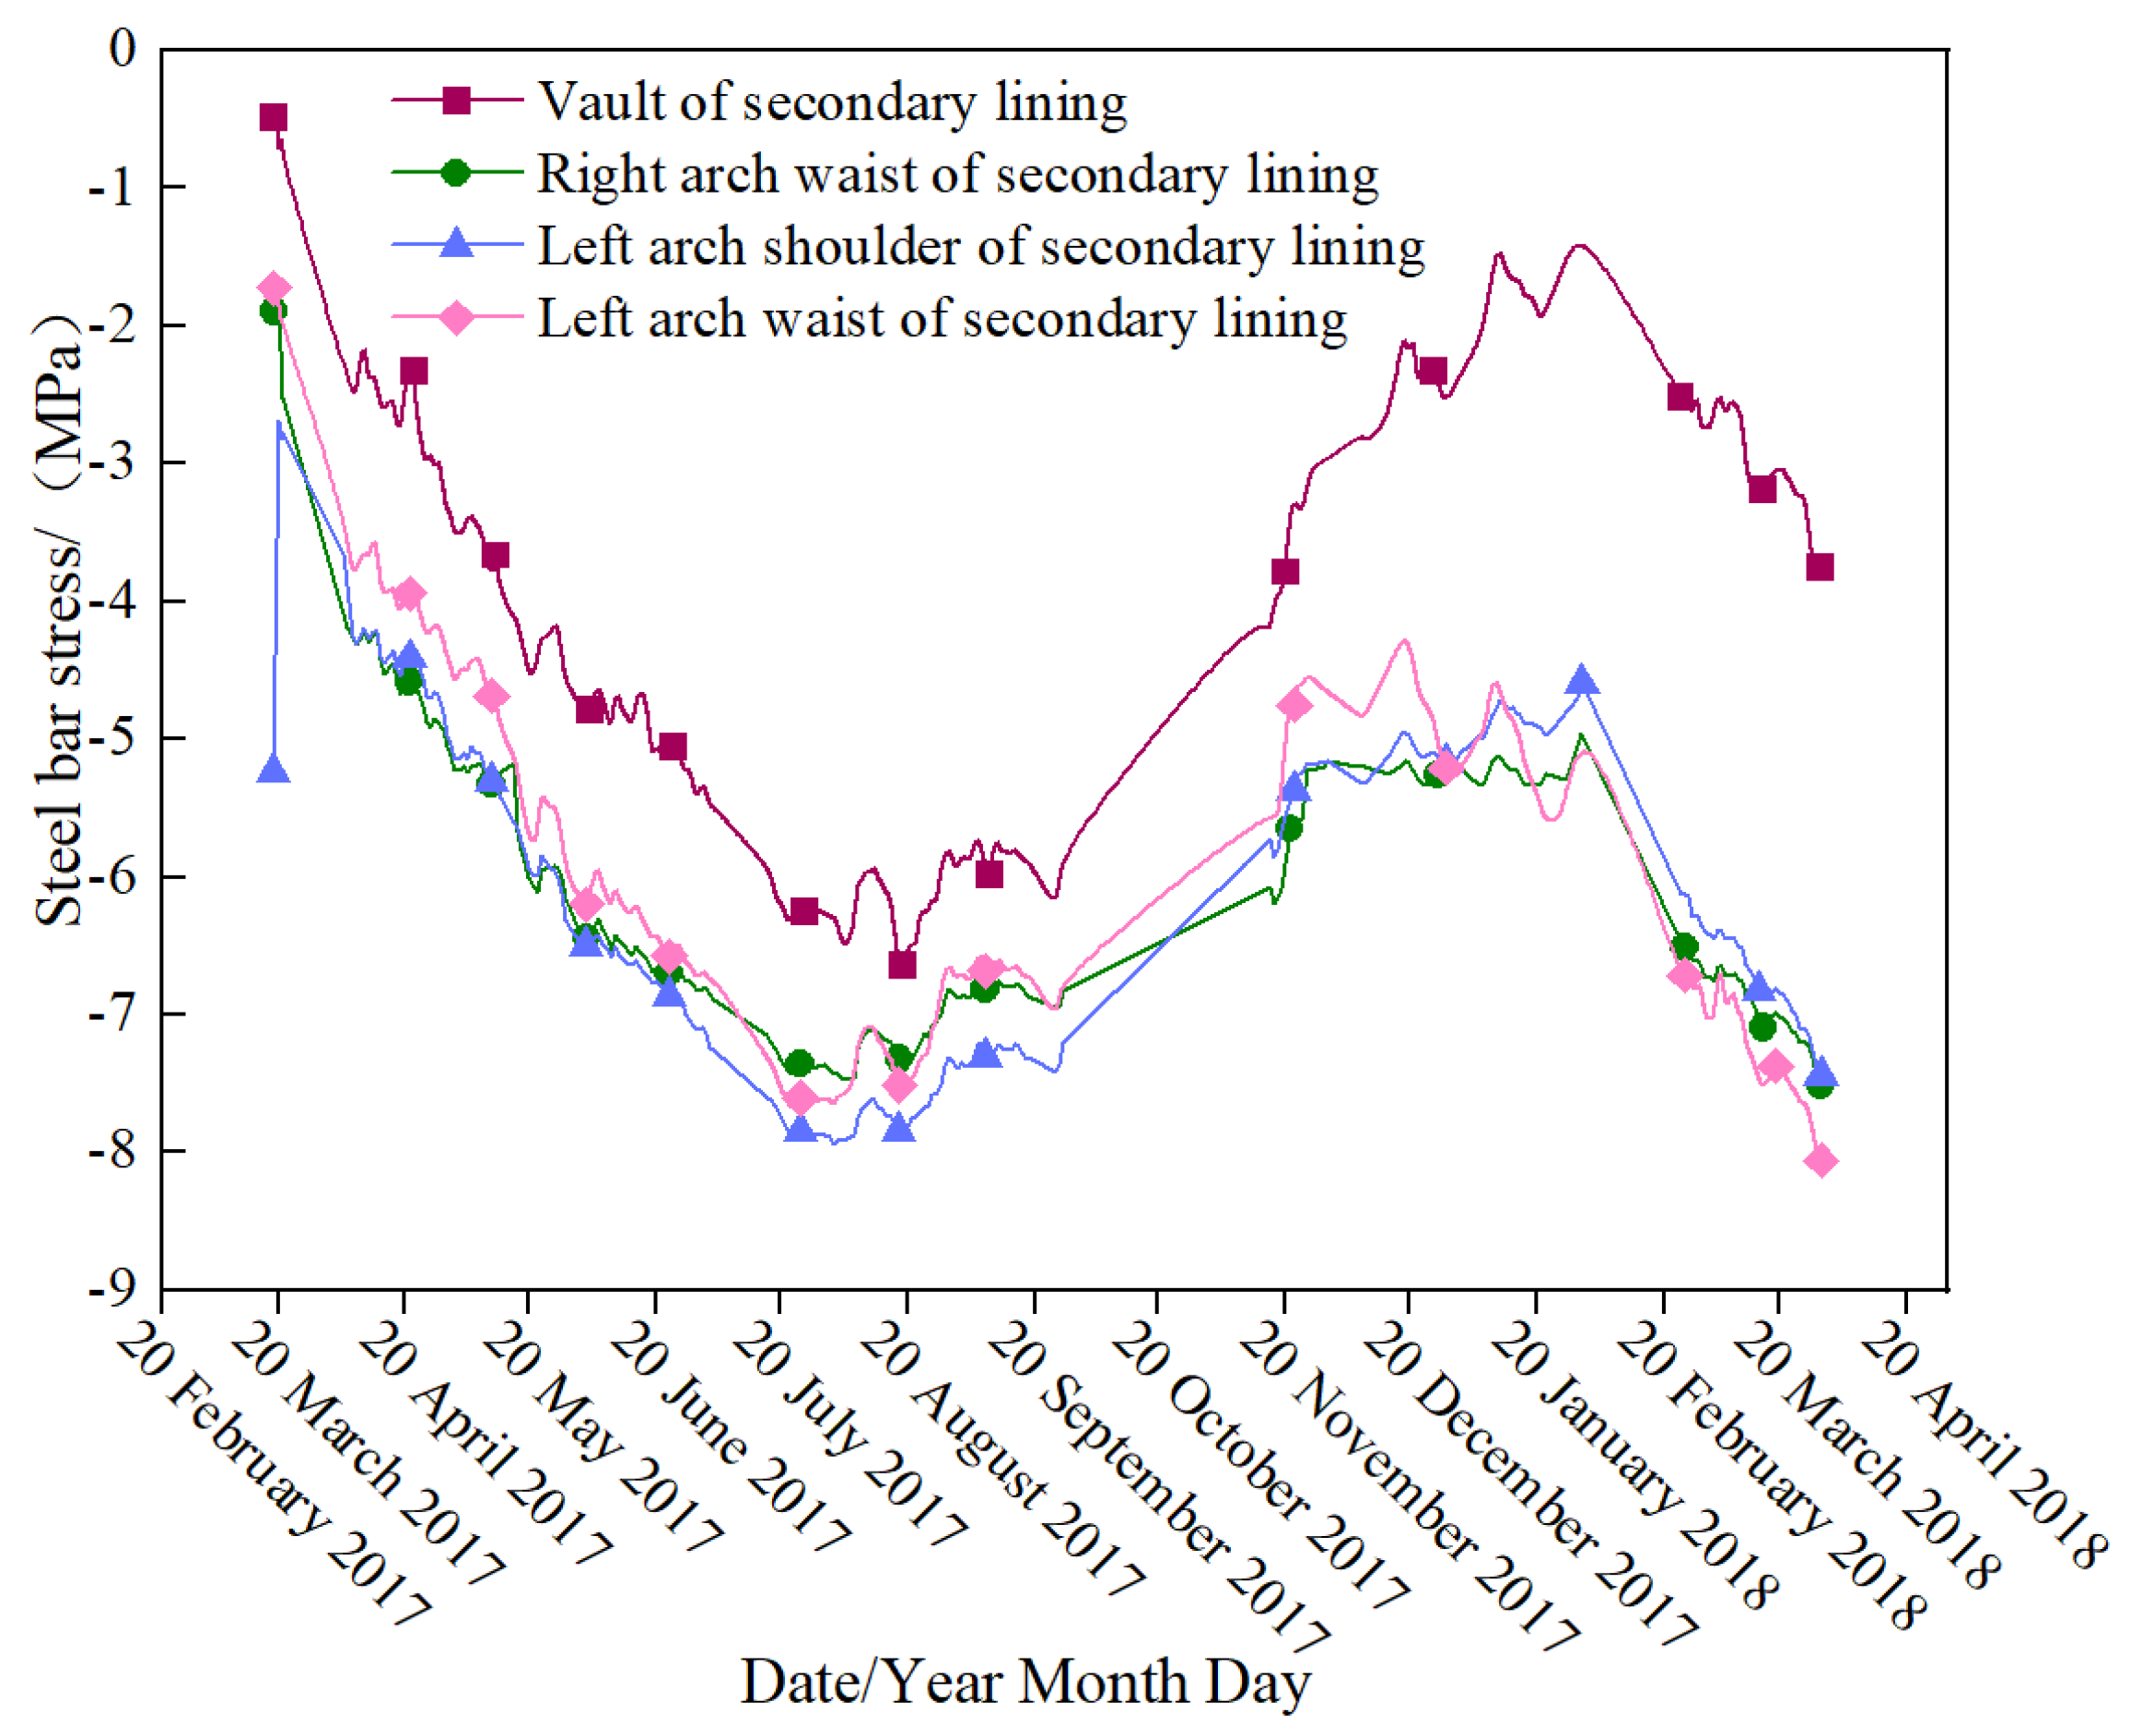
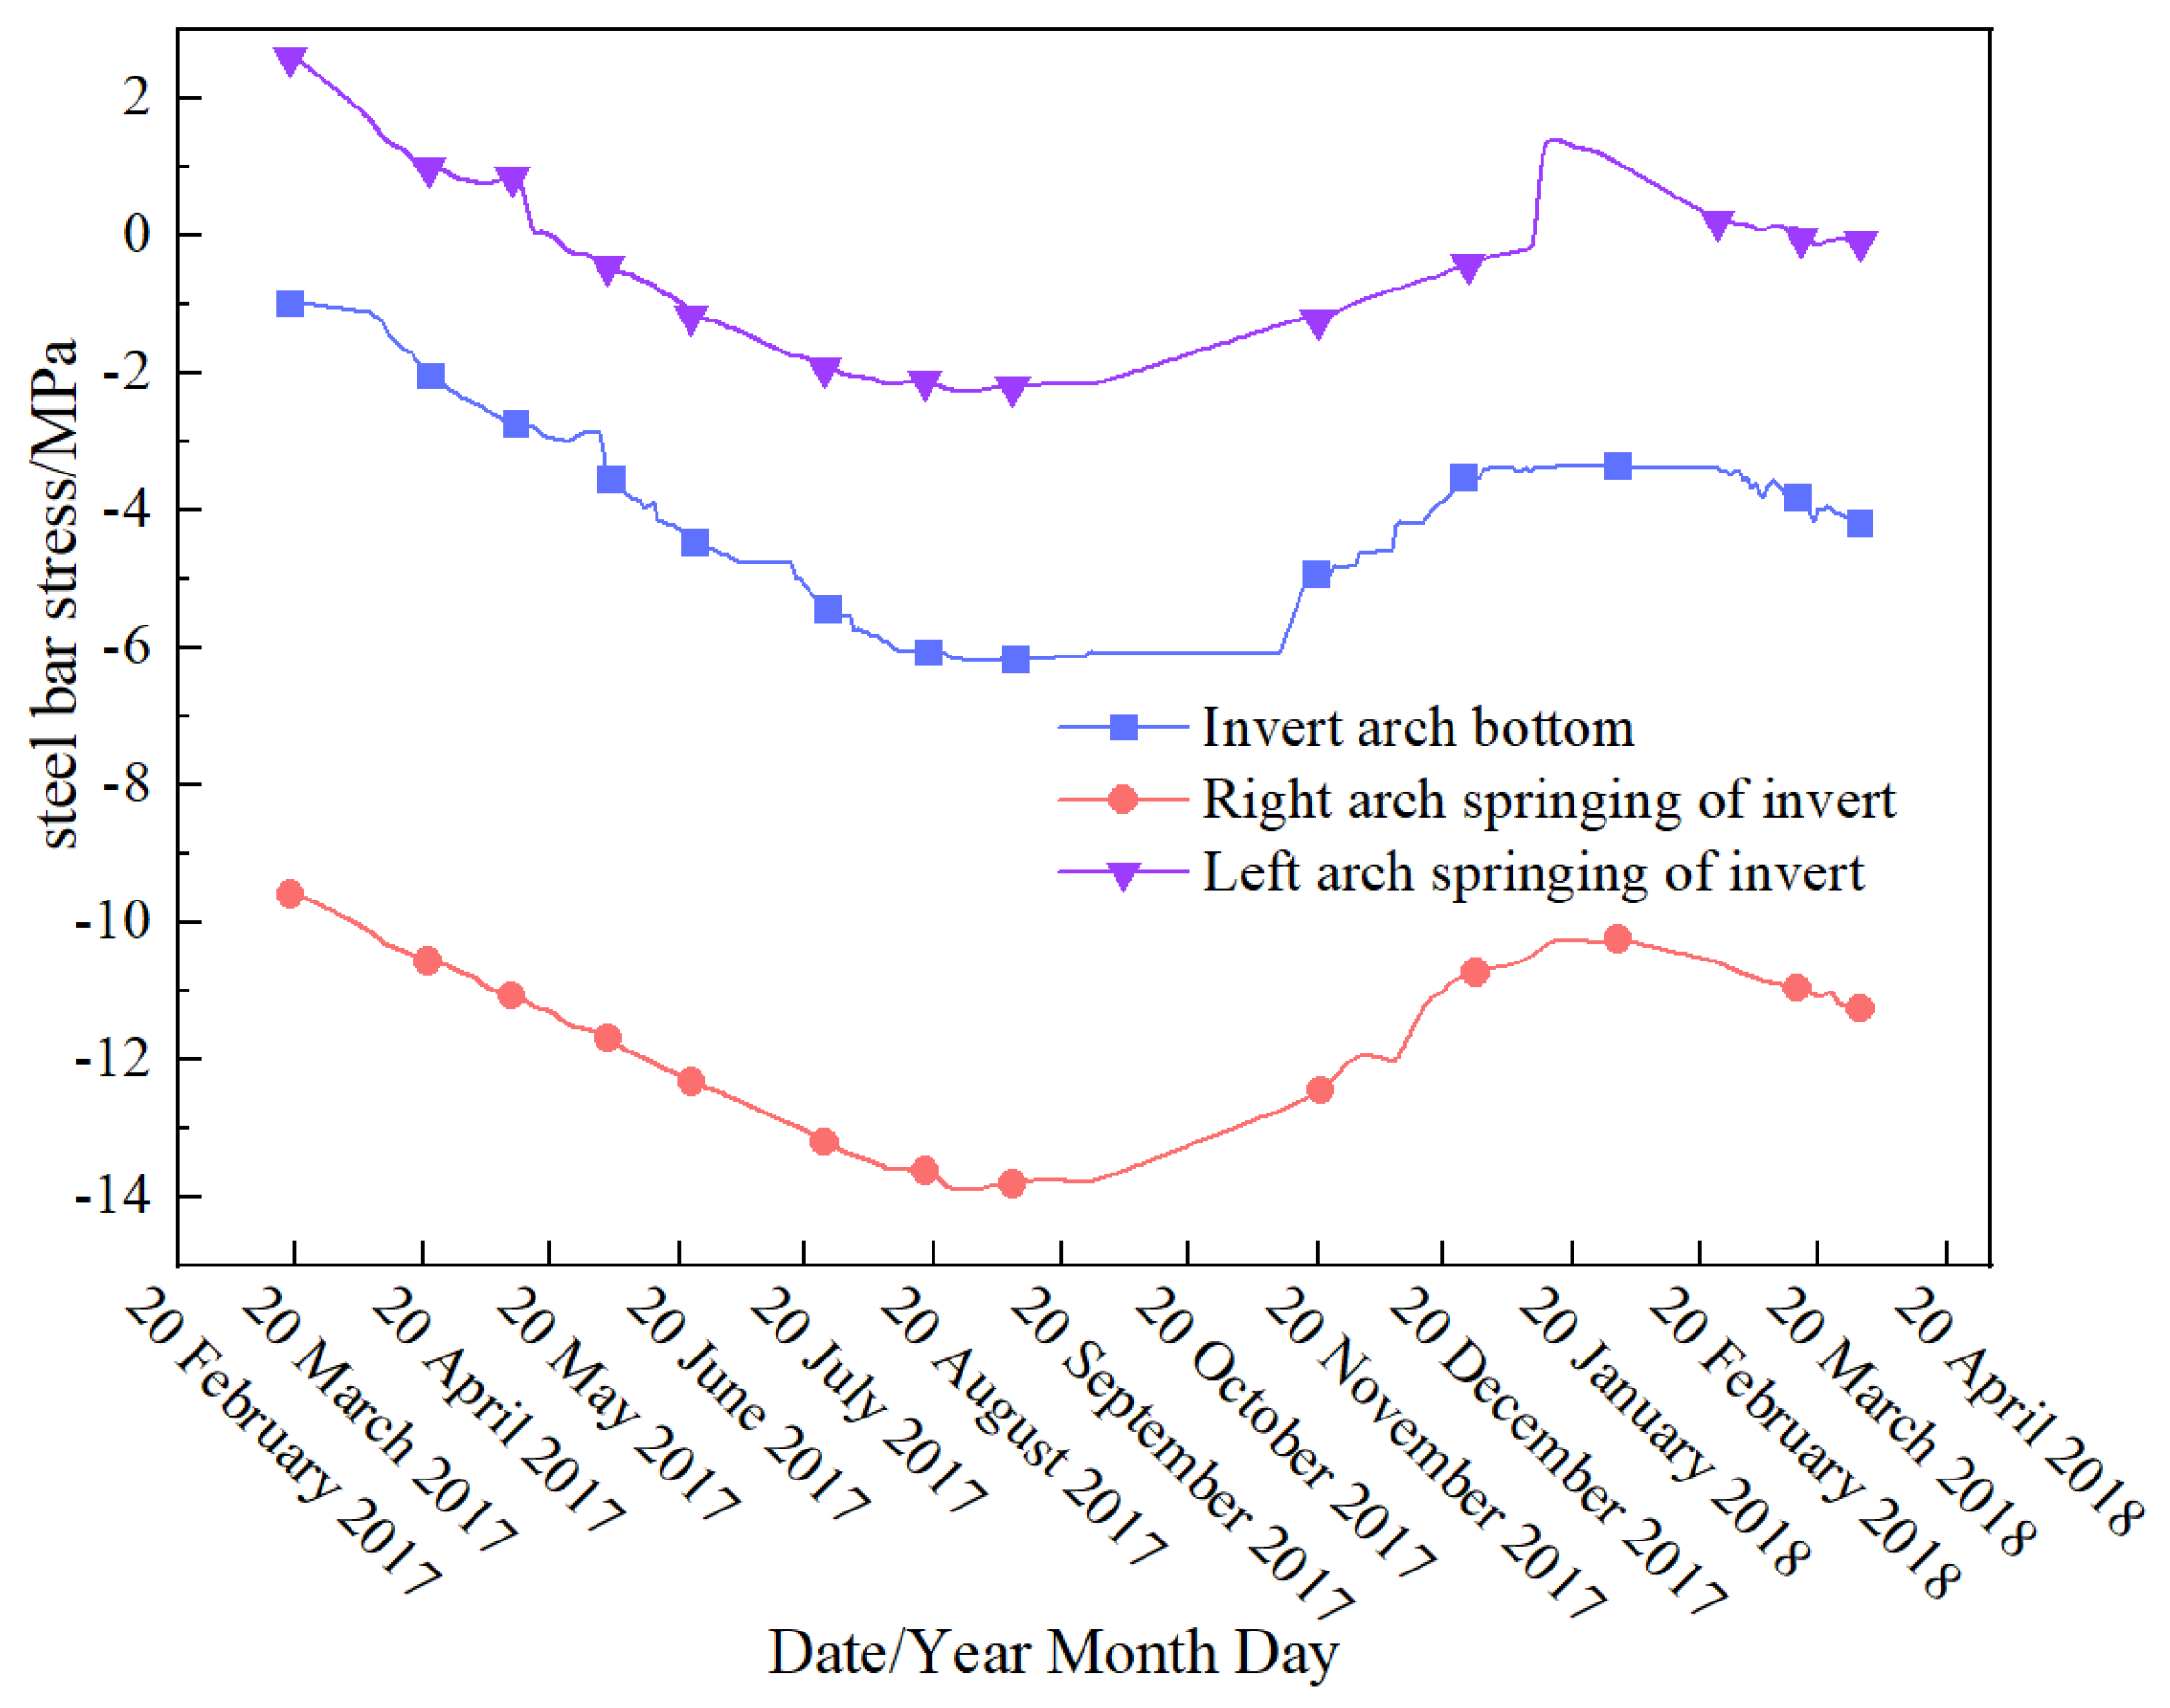
3.3. Mechanical Behavior and Deformation Characteristics of Secondary Lining
- Before 15 March in Figure 12: After concrete casting, when the secondary lining has not yet developed strength, the primary support bears all loads, and the contact pressure remains stable.
- 15–27 March in Figure 12: During the strength growth period, the development of concrete strength increases the lining stiffness, causing gradual load transfer to the secondary lining. The contact pressure increases rapidly.
- Adjustment and stabilization period: Due to the coupling effect of the surrounding rock rheological effect and lining stiffness, the contact pressure decreases temporarily and then slowly recovers, finally stabilizing approximately 20 days after formwork removal.
4. Discussion
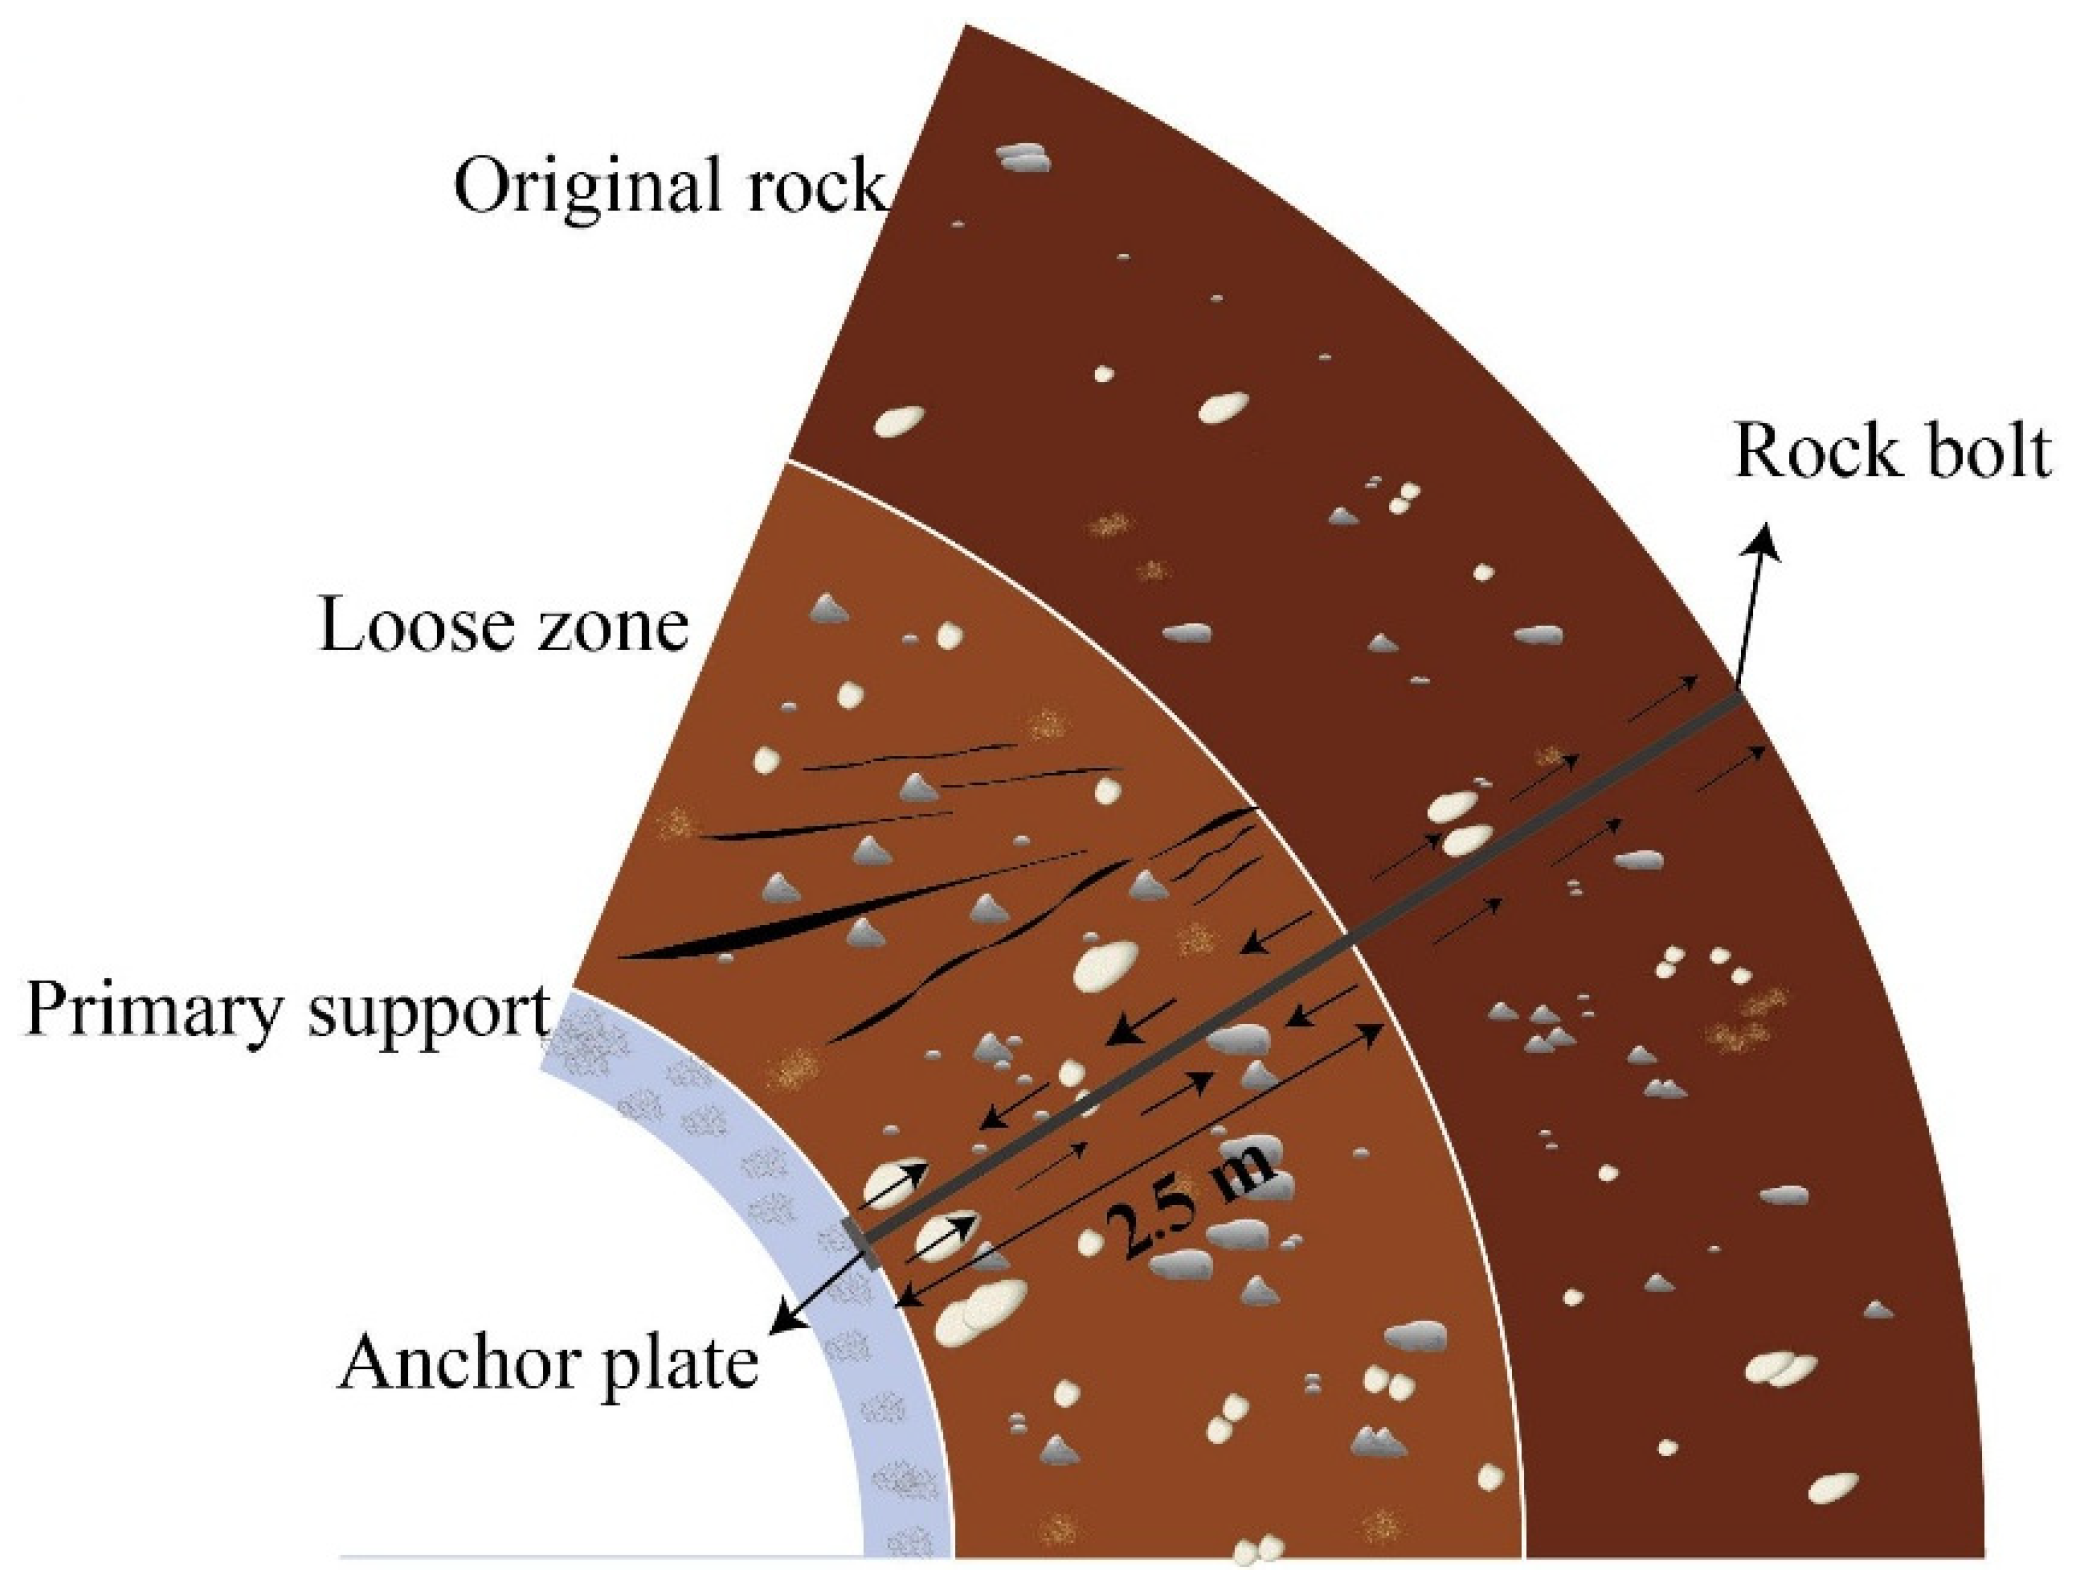
4.1. Influence of Loose Circle in Red-Bed Soft Rock on Anchor Rod Force
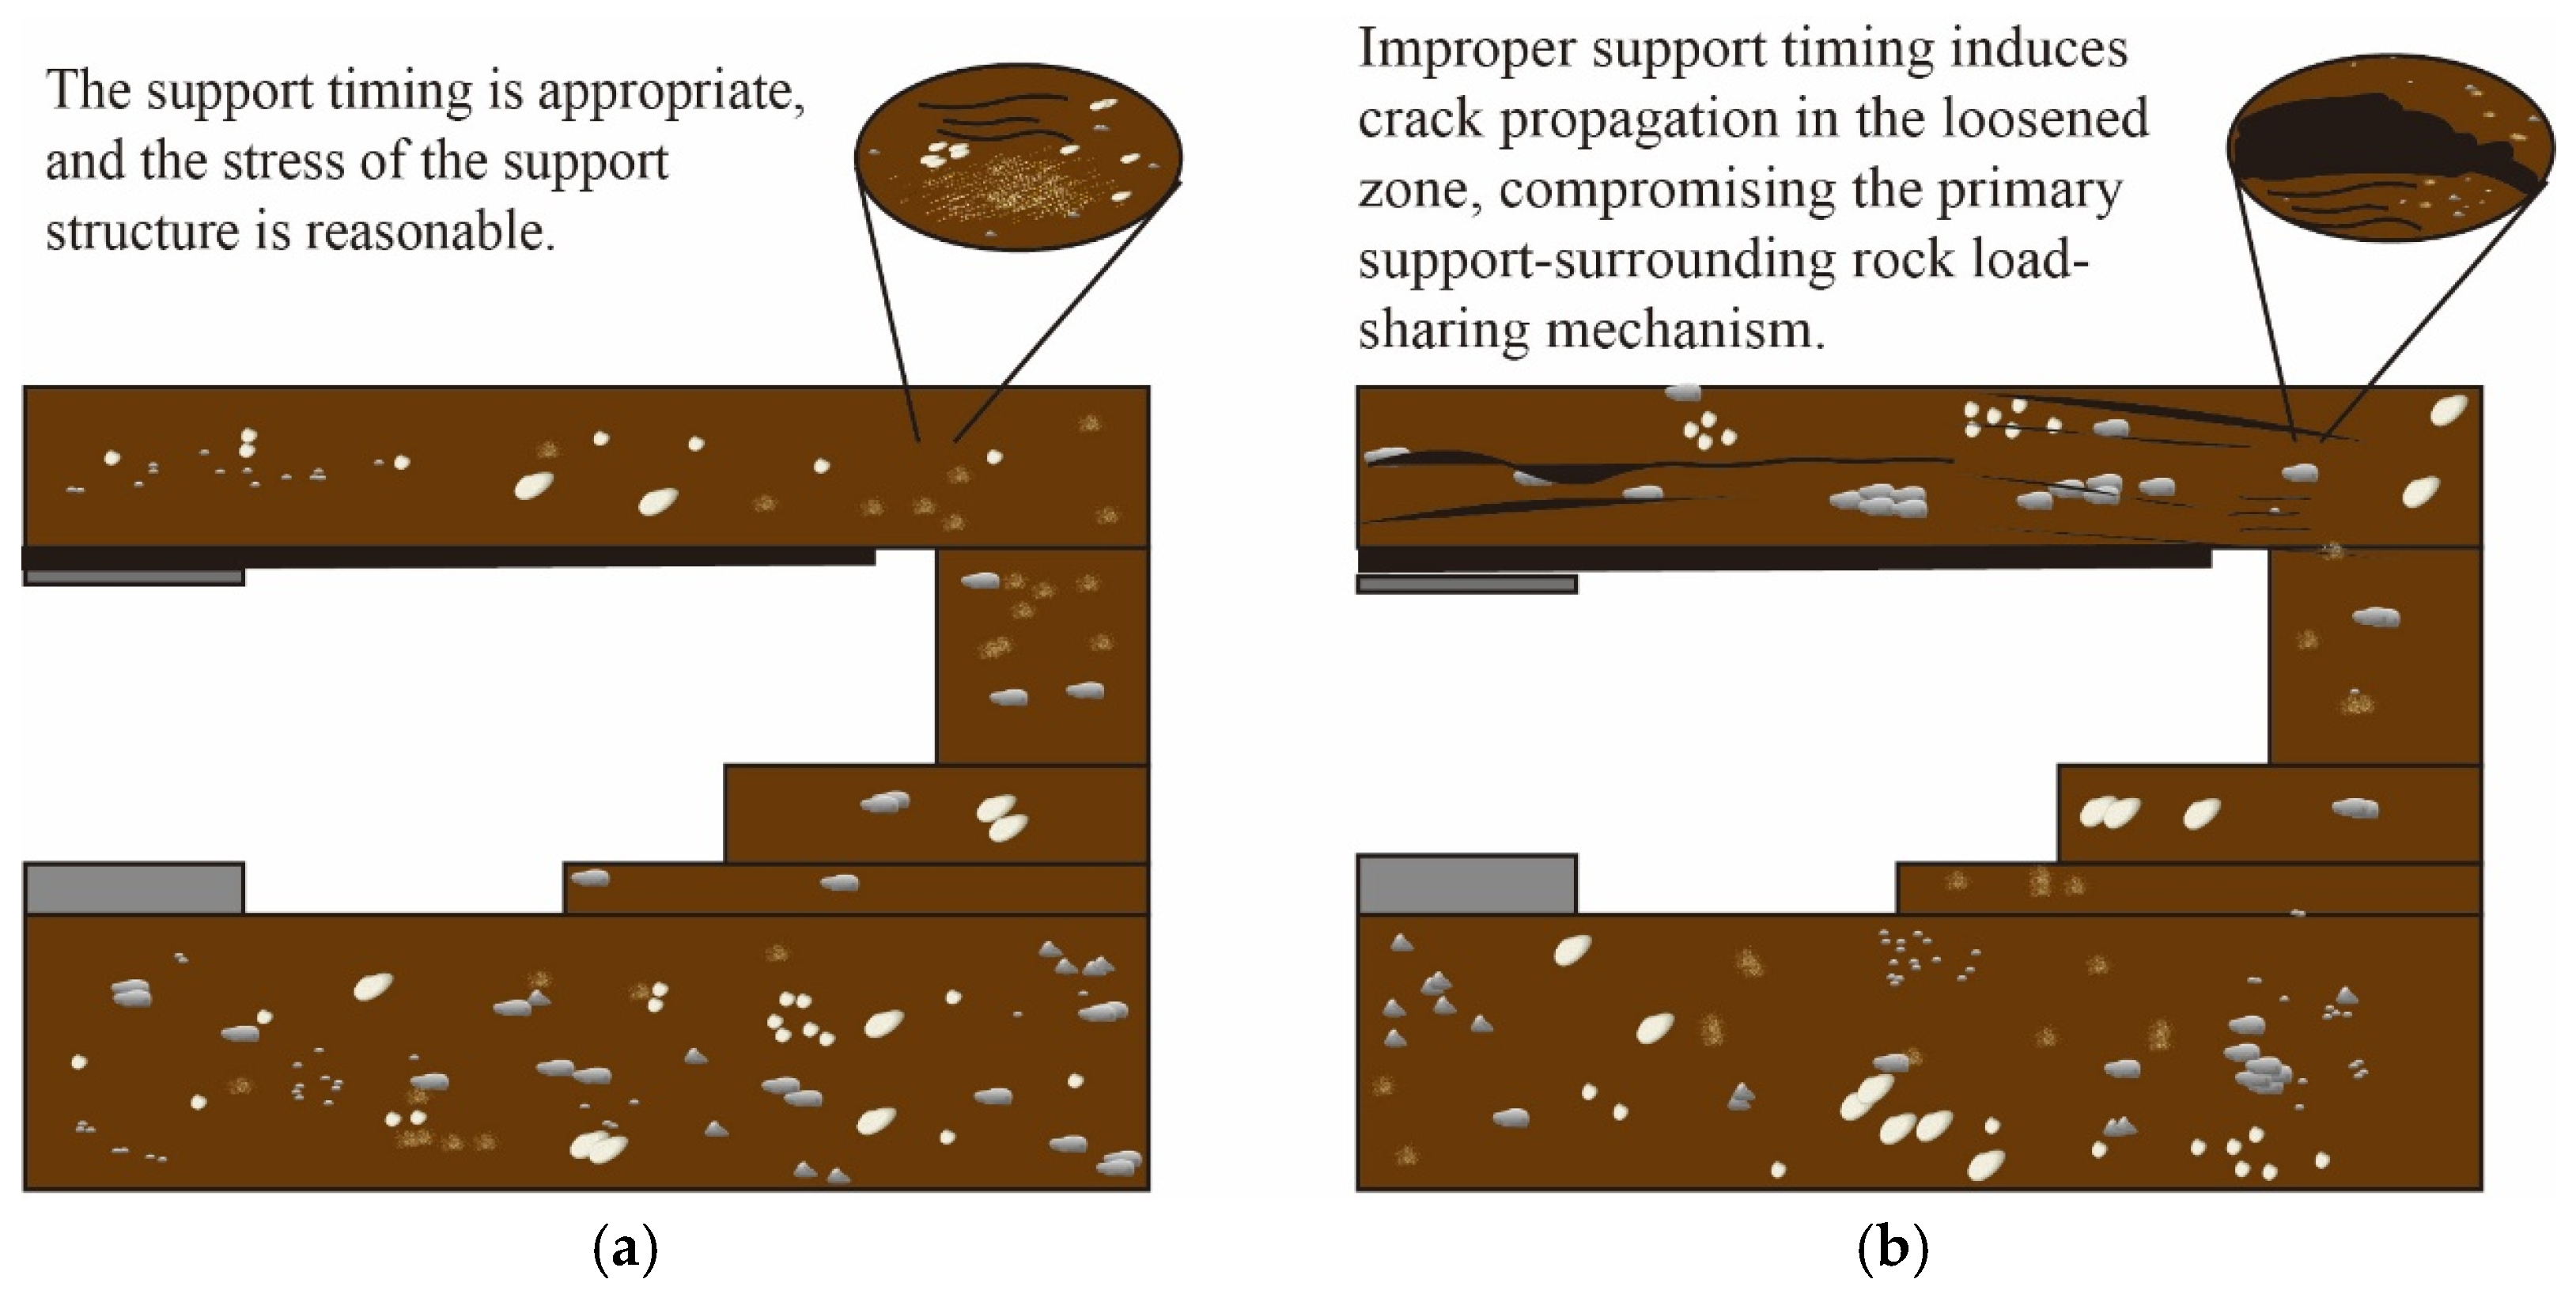
4.2. Influence of Support Timing in Red-Bed Soft Rock on Primary Support
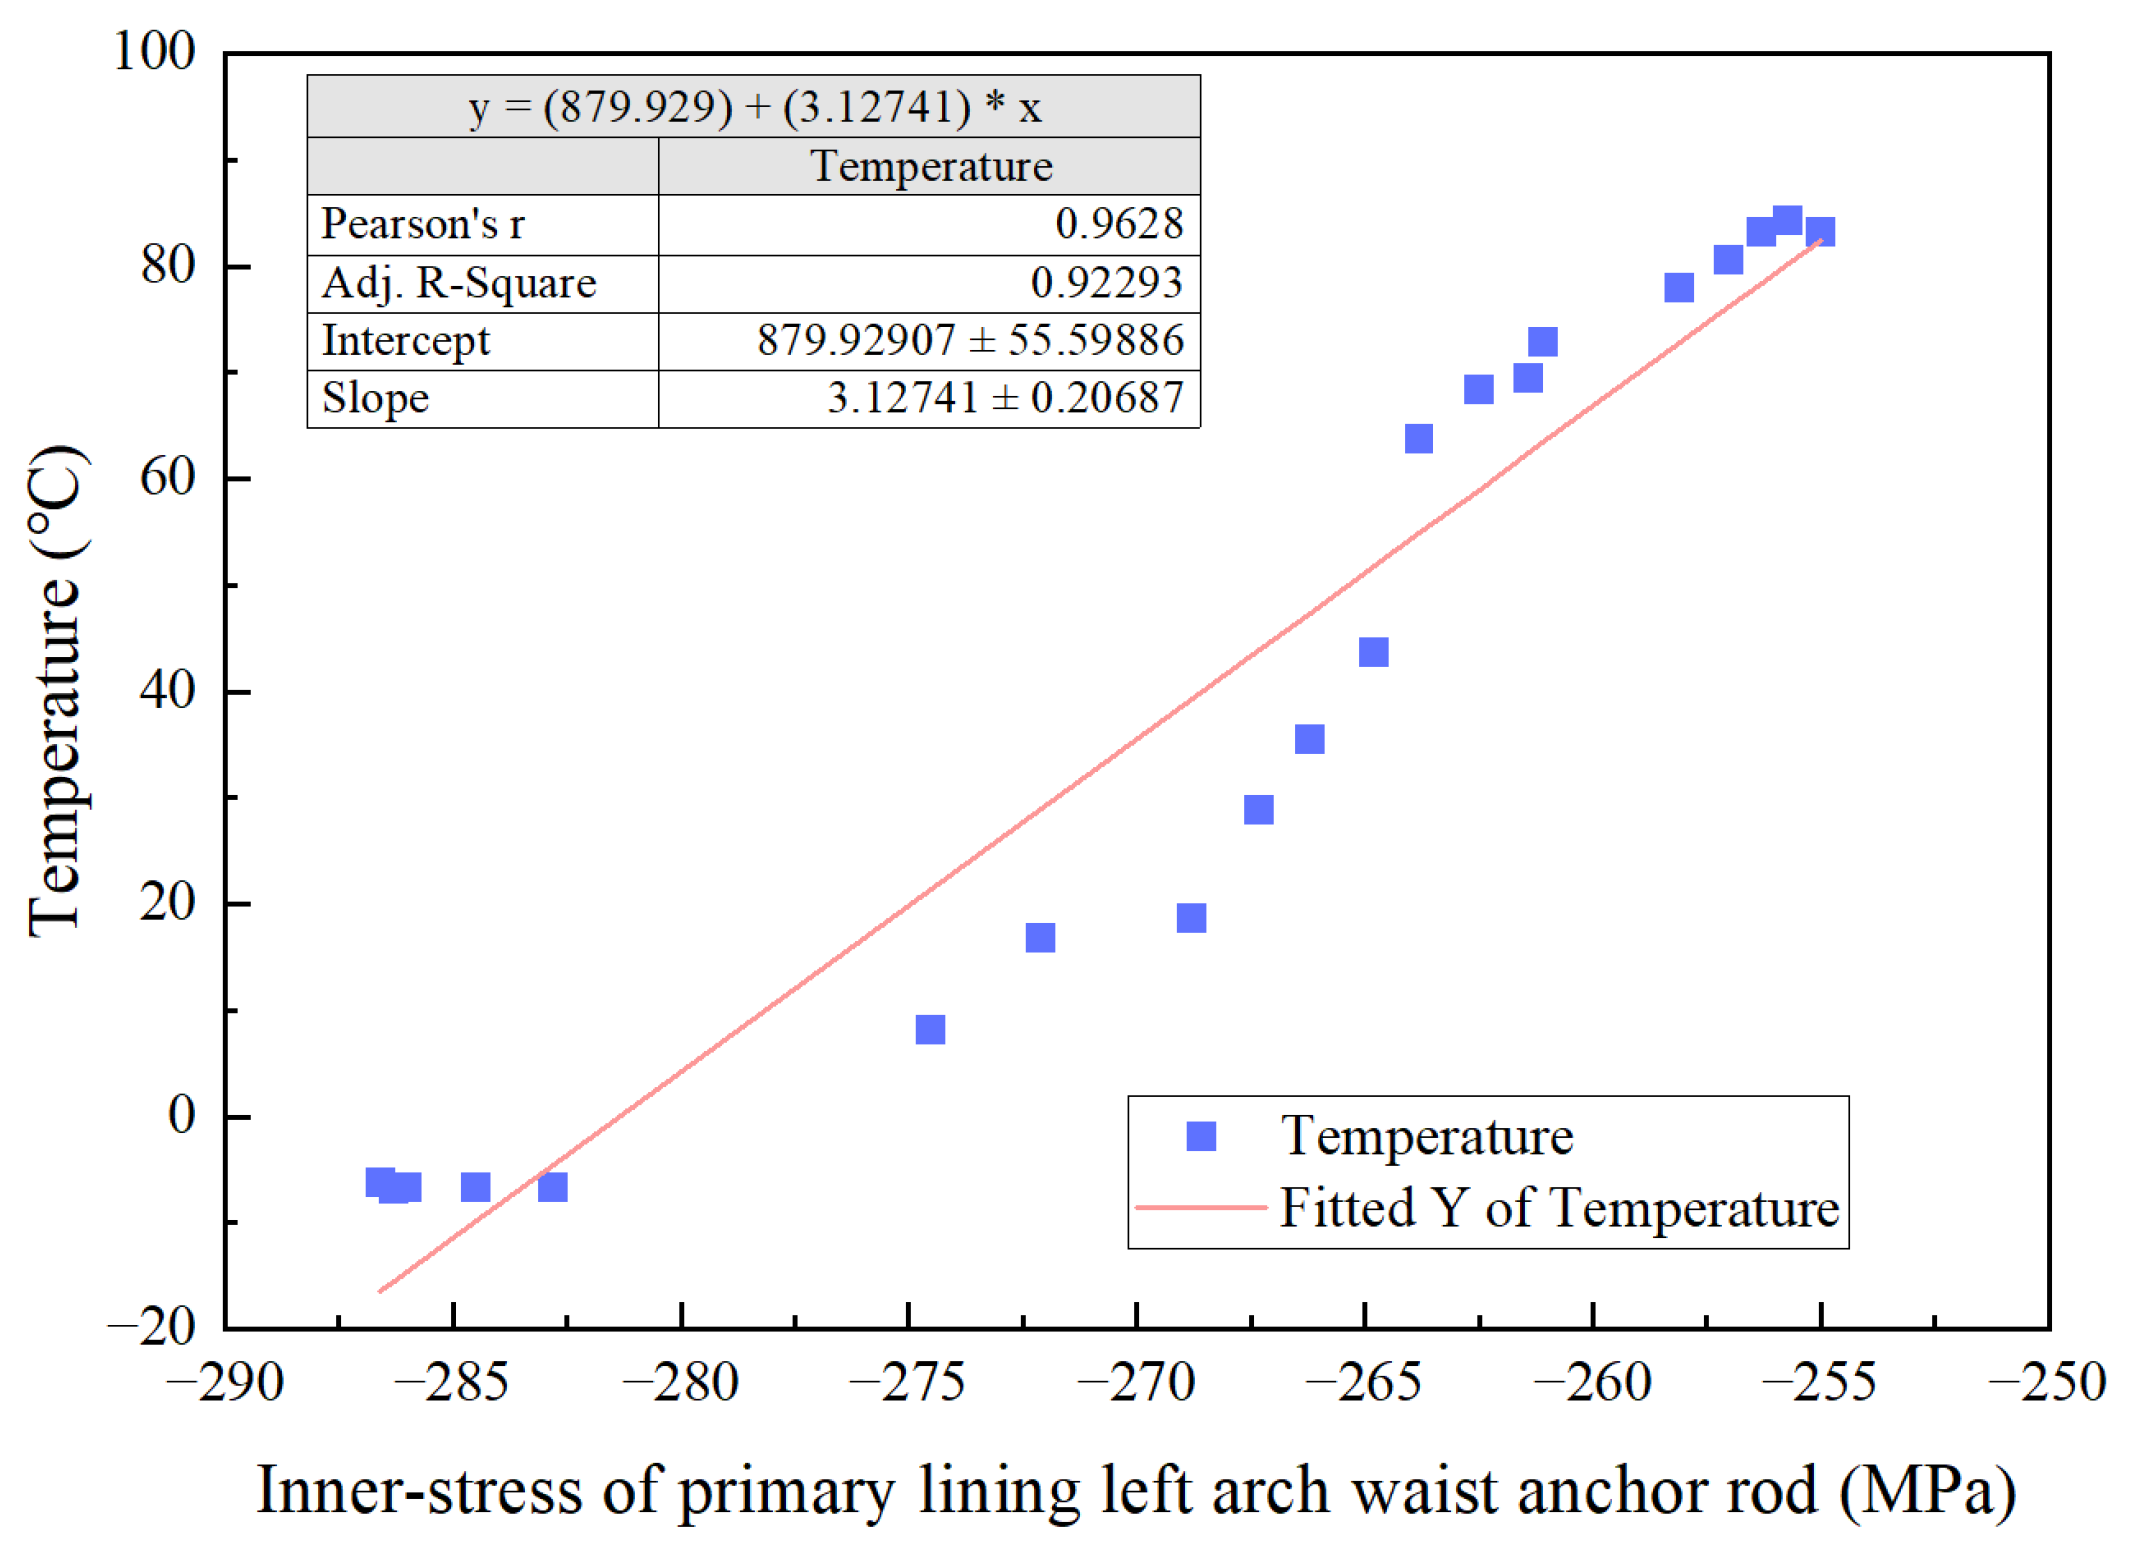
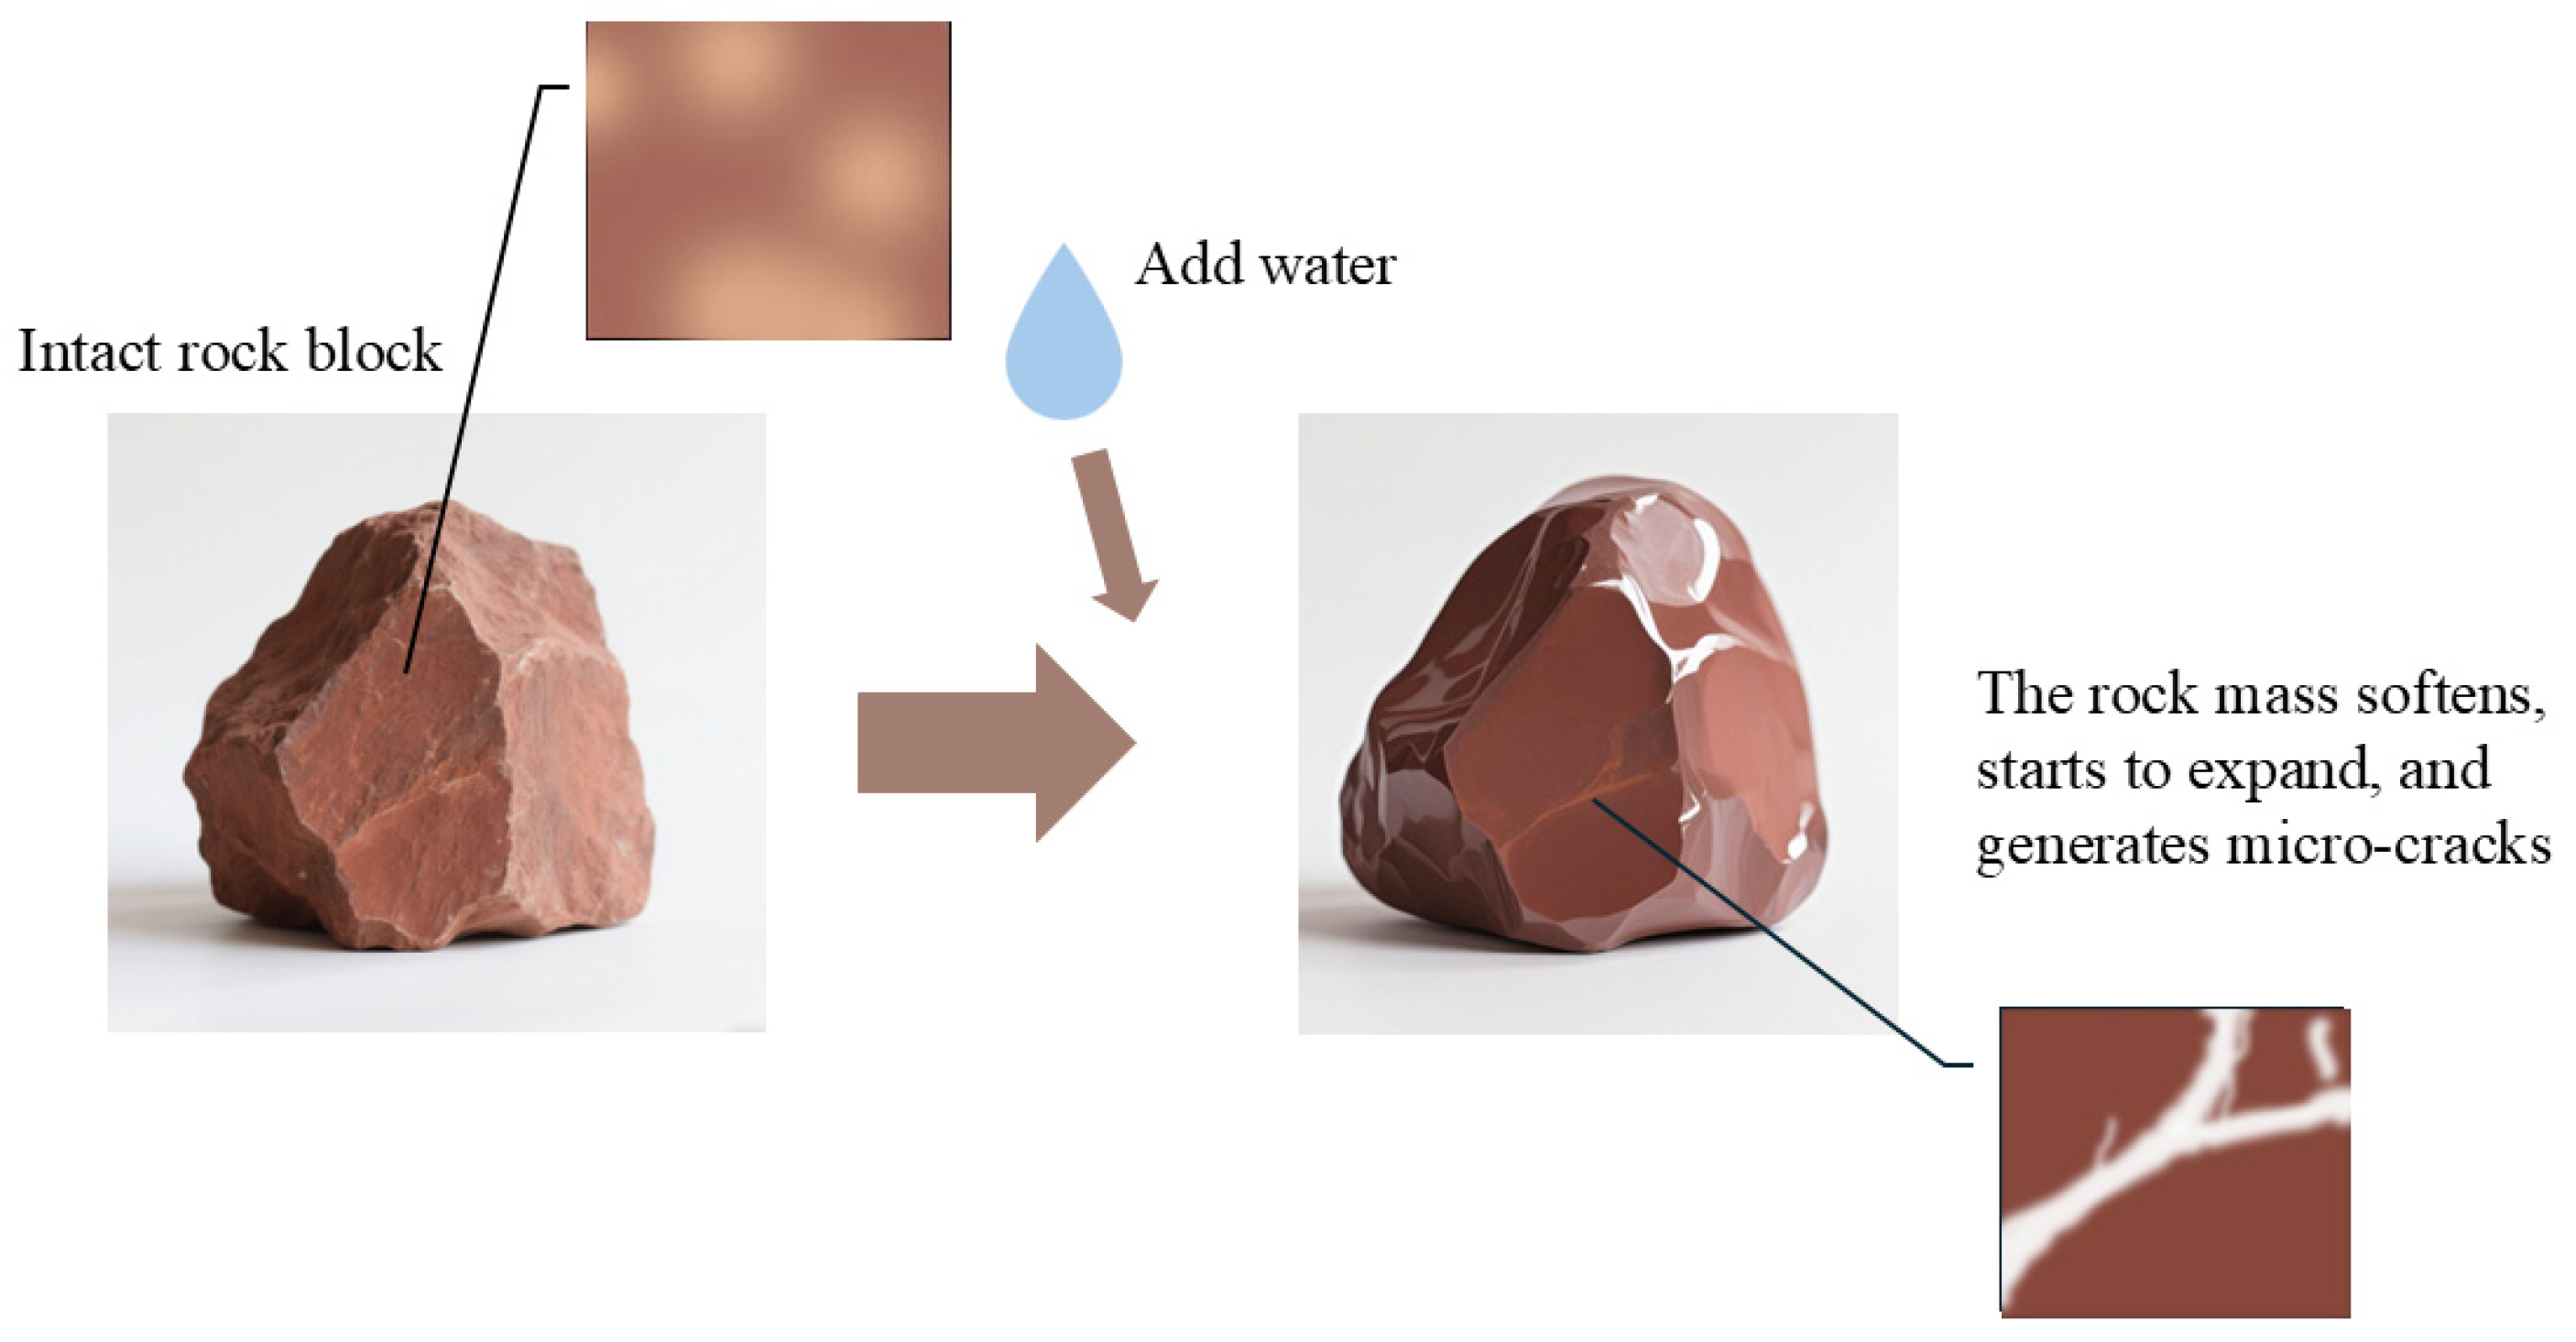
4.3. Influence of Lithology of Red-Bed Soft Rock on Support Structures
- The causes of the sudden increase in initial stress
- 2.
- The mechanism of subsequent pressure gradual change
- 3.
- The correlation between stratum characteristics and monitoring phenomena
4.4. The Limitations of This Study
5. Conclusions
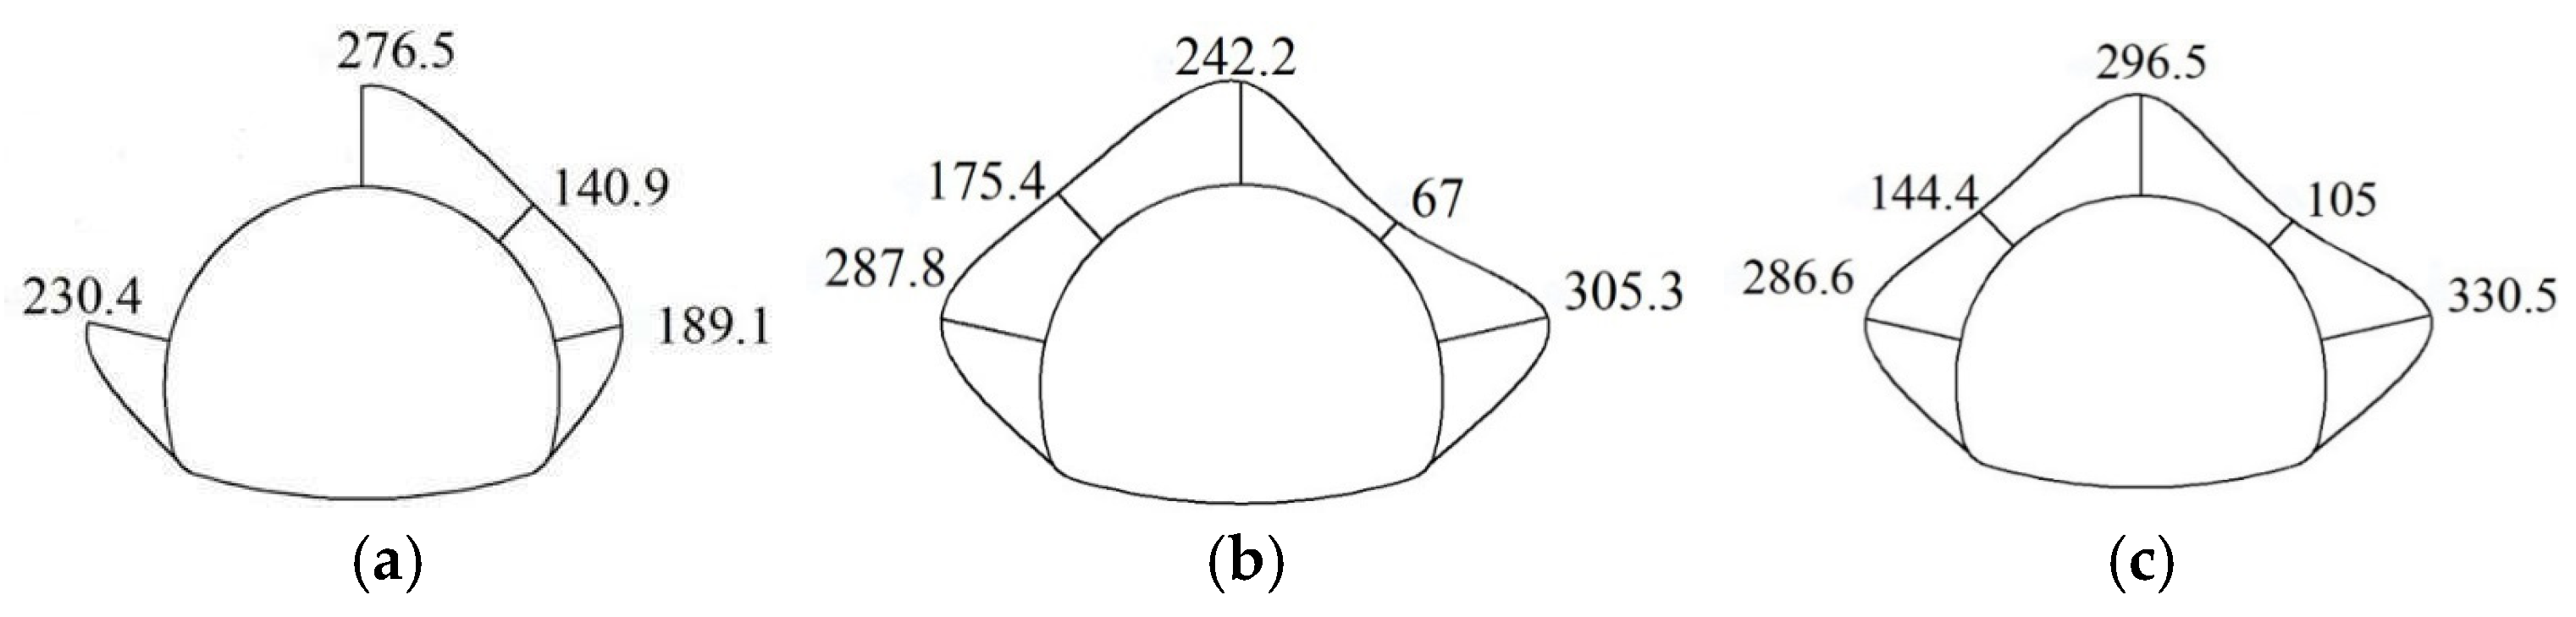
- Regarding the stress characteristics of rock bolts, the stress response was sensitive, with peak values appearing rapidly and a long stabilization period (exceeding 90 days). The axial stress ranged from 105 to 330.5 MPa (with an average of 233.2 MPa at the inner end), and the force distribution showed significant asymmetry and anisotropy. Stress concentration was prominent in the crown and haunch areas, corresponding to a surrounding rock loosened zone thickness of 2.5 m, reflecting the time-dependent effect of soft rock deformation.
- For the primary lining mechanism, steel arches and shotcrete exhibited significant synergistic effects. The former rapidly constrained early-stage deformation (compressive stress of steel arches ≤305.3 MPa), while the latter enhanced rock stability through triaxial stress. The support timing needed to balance the self-bearing capacity of the surrounding rock and support loads; steel arches outperformed lattice girders in displacement control but bore higher loads.
- As for the secondary lining characteristics, contact pressure peaked during formwork removal, with the measured safety margin exceeding that specified by codes. The pressure adjustment at the invert was complex, and localized stress concentration induced significant tensile stresses in the reinforcement, necessitating adequate tensile reinforcement. The rheological properties of the surrounding rock and geological anisotropy caused spatiotemporal heterogeneity in support stress, while the weakly cemented and water-sensitive nature of soft rock intensified the structure–surrounding rock coupling, requiring dynamic monitoring to optimize support parameters.
Author Contributions
Funding
Data Availability Statement
Acknowledgments
Conflicts of Interest
References
- Liu, X.W.; Chen, W.W.; Han, W.F. Experimental study on characteristic of Deformation of Red- bed Soft Tunnels Surrounding Rock. J. Glaciol. Geocryol. 2007, 29, 992–996. [Google Scholar]
- Wu, K.; Jin, B.; Hong, S.P. Analysis of macroscopic, microcosmic, and microscopic characteristics of red-bed soft rock in Central Yunnan and its mechanical response in construction. Phys. Fluids 2025, 36, 106607. [Google Scholar] [CrossRef]
- Yang, Y.; Shi, C.H.; Zheng, K.Y. Research on large deformation grading control technology for high stress red layered soft rock tunnels. Mod. Tunn. Technol. 2025, 61, 252–262. [Google Scholar]
- Yang, X.J.; Ming, W.; Zhang, W.R. Support on deformation failure of layered soft rock tunnel under asymmetric stress. Rock Mech. Rock Eng. 2022, 55, 7587–7609. [Google Scholar] [CrossRef]
- Zheng, K.Y.; Shi, C.H.; Yang, Y. Yielding support technology with a reserved deformable angle for squeezing soft rock tunnels in layered biased strata. Tunn. Constr. 2024, 44, 2058–2068. [Google Scholar]
- Shao, Z.S.; Li, X.; Zhao, N.N. Research on optimization of initial support for soft rock tunnel with high ground stress. J. Saf. Sci. Technol. 2021, 17, 99–105. [Google Scholar]
- Chen, J.; Ding, Y.H.; Liu, Y.F. Failure mechanism and structural safety assessment of the primary support structure of soft rock tunnel: A case study Period. Polytech. Civ. Eng. 2024, 68, 742–754. [Google Scholar] [CrossRef]
- Wu, G.J.; Chen, W.Z.; Tian, H.M. Numerical evaluation of a yielding tunnel lining support system used in limiting large deformation in squeezing rock. Environ. Earth Sci. 2018, 77, 439. [Google Scholar] [CrossRef]
- He, M.C.; Wang, B.; Tao, Z.G. Axial compression behavior of adaptive steel arch joint for large-deformation tunnels. China J. Highw. Transp. 2021, 34, 1–10. [Google Scholar]
- Chen, Y.L.; Teng, J.Y.; Bin Sadiq, R.A. Experimental Study of Bolt-Anchoring Mechanism for Bedded Rock Mass. Int. J. Geo Mech. 2020, 20, 04020019. [Google Scholar] [CrossRef]
- Wu, Q.L.; Wu, S.C.; Wang, H.X. Analytical Method for Optimal Design of Bolt Parameters in Circular Tunnel Under Non-axisymmetric Condition. J. Basic Sci. Eng. 2025, 33, 182–191. [Google Scholar]
- Jing, W.; Zhou, J.; Yuan, L. Deformation and failure mechanism of surrounding rock in deep soft rock tunnels considering rock rheology and different strength criteria. Rock Mech. Rock Eng. 2024, 57, 545–580. [Google Scholar] [CrossRef]
- Wang, W.; Li, X.M.; Sun, X.H. Numerical simulation study on the supporting effect of bolts in interbedded soft rock tunnel. Mod. Tunn. Technol. 2022, 59, 99–107. [Google Scholar]
- Ding, K.; Wang, L.G.; Ren, B. Study on optimization of initial support for a tunnel in the fracture zone based on the strength reduction method. Processes 2022, 10, 1558. [Google Scholar] [CrossRef]
- Li, S.; Fu, J.; Liu, G.R. Research on intrusion and large arch bulge in lining structure for highway’s mudstone tunnel. Front. Phys. 2024, 12, 1345581. [Google Scholar] [CrossRef]
- Xia, C.; Wu, Y.T.; Cui, G.J. A coupled tensor-DEM-FEM model for the whole process of internal fine-scale damage to surface damage in red-bed soft rocks in the Coastal Area of South China. J. Mar. Sci. Eng. 2023, 11, 1542. [Google Scholar] [CrossRef]
- Lei, S.X.; Zhao, W. Study on mechanism of circumferential yielding support for soft rock tunnel with large deformation. Rock Soil Mech. 2020, 41, 1039–1047. [Google Scholar]
- Fan, J.Y.; Guo, Z.B.; Qiao, X.B. Constant resistance and yielding support technology for large deformations of surrounding rocks in the minxian tunnel. Adv. Civ. Eng. 2020, 2020, 8850686. [Google Scholar] [CrossRef]
- Liu, X.W.; Chen, W.W.; Zhang, F.Y. Experimental study on rheological properties of neogene red-bed soft rock. J. Desert Res. 2012, 32, 1268–1274. [Google Scholar]
- Wu, Y.Z.; Wang, H.L.; Zhang, Y.J. Deterioration mechanism and statistical damage constitutive model of red-bed soft rock with different moisture content. Pure Appl. Geophys. 2025, 182, 189–208. [Google Scholar] [CrossRef]
- Liu, Z.; Liao, J.; Xia, C. Micro-meso-macroscale correlation mechanism of red-bed soft rocks failure within static water based on energy analysis. Acta Geotech. 2023, 18, 6457–6474. [Google Scholar] [CrossRef]
- Wang, Z.C.; Hu, M.G.; Lai, J.X. Reliability analysis method for tunnel structural design: Brief review and relevant prospects. Structures. 2023, 55, 1894–1905. [Google Scholar] [CrossRef]
- Huang, M.L.; Zhao, J.M.; Tan, Z.S. Analysis of the deformation and mechanical characteristics of the surrounding rock-lining structure of the Muzhailing tunnel. Mod. Tunn. Technol. 2016, 53, 89–99. [Google Scholar]
- Zhao, L.L.; Yang, W.B.; Pan, W.T. Study on model test and numerical simulation of layered soft rock tunnel construction with different large deformation grades. Chin. J. Rock Mech. Eng. 2024, 43, 454–467. [Google Scholar]
- Wang, Z.C.; Sun, W.F.; Yang, W.L. Study on response regularity of tunnel supporting structure characterized with soft-rock large deformation. J. Highway Transp. Res. Dev. 2022, 38, 91–99, 121. [Google Scholar]
- Zhou, J.; Yang, X.N.; Ma, M.J. A new method for calculating the load shared by the primary support of deep-buried rheological soft rock tunnels by considering the flexible primary support. Int. J. Appl. Mech. 2024, 16, 2450034. [Google Scholar] [CrossRef]
- Chen, X.B.; Wang, F.D.; Wu, M.L. An all-round monitoring method for tunnels deformation based on tilt inversion. J. Cent. South Univ. Sci. Technol. 2024, 55, 151–161. [Google Scholar]
- Kou, H.; Yang, W.B.; He, C. Model test of excavation and double primary support time for soft rock tunnel considering creep characteristics. Acta Geotech. 2024, 19, 2775–2803. [Google Scholar] [CrossRef]
- JTG C20-2011; Specification for Geotechnical Investigation of Highway Engineering. Industry Standard-Transportation: Beijing, China, 2011.
- Bossi, G.; Schenato, L.; Marcato, G. Structural health monitoring of a road tunnel intersecting a large and active landslide. Appl. Sci. 2017, 7, 1271. [Google Scholar] [CrossRef]
- Xie, Q.M.; Ma, W.; Yang, W.D. Design and implementation of SHM system for highway tunnels. China Saf. Sci. J. 2022, 32, 56–62. [Google Scholar]
- JTG 3370.1-2018; Specifications for Design of Highway Tunnels Section 1 Civil Engineering. Ministry of Transport: Beijing, China, 2018.
- Qian, R.; Deng, S.X.; Wang, M.Y.; Qiu, Y.Y. Range determination and deformation failure mechanism of loosening zone of surrounding rock in deep engineering. J. Tongji Univ. Nat. Sci. 2023, 51, 839–845. [Google Scholar]
- Chen, X.; He, C.; Xu, G.W.; Wang, B.; Ma, G.Y.; Du, J.M. Stabilisation time analysis method for deep tunnels considering rheological effects and lining influence. Tunn. Undergr. Space Technol. 2025, 155, 106170. [Google Scholar] [CrossRef]
- Guo, Y.C.; Zhao, F.X.; Yan, S.L.; Liu, J.Z. An experimental study of the triaxial expansion force of red-bed mudstone. Hydrogeol. Eng. Geol. 2022, 49, 87–93. [Google Scholar]
- Zhang, L.; Li, B.; Zhu, B.L.; Luo, B. Loading and unloading mechanical properties and energy evolution mechanism of Red-Bed mudstone. J. Southwest Jiaotong Univ. 2023, 58, 592–602. [Google Scholar]
- Wang, Z.S.; Song, J.T.; Qiu, E.X.; Peng, Z. Experimental study on anisotropic deformation behavior and microstructure evolution of Red-Bed mudstone. KSCE J. Civ. Eng. 2024, 28, 5480–5499. [Google Scholar] [CrossRef]


| Borehole Number | Lithology | P-Wave Velocity of Rock Mass (m/s) | P-Wave Velocity of Rock Block (m/s) | Integrity Coefficient Kv | Integrity | |
|---|---|---|---|---|---|---|
| Interval Value | Average Value | |||||
| ZK-SD-29 | Argillaceous sandstone | 1761~1923 | 1855 | 4047 | 0.21 | Highly fragmented |
| Glutenite | 2439~2924 | 2644 | 4047 | 0.43 | Moderately fragmented | |
| Conglomerate and glutenite | 2577~4274 | 3642 | 4047 | 0.70 | Moderately intact | |
| Strongly weathered glutenite | 1891~2007 | 1944 | 3148 | 0.38 | Moderately fragmented | |
| Moderately weathered glutenite | 1908~2119 | 2027 | 3148 | 0.41 | Moderately fragmented | |
| Slightly weathered glutenite | 2762~4273 | 3800 | 4200 | 0.82 | Intact | |
| Slightly weathered argillaceous sandstone | 3067~4166 | 3494 | 3938 | 0.79 | Intact | |
| SZK-SD-08 | Strongly weathered glutenite | 2604~3521 | 3001 | 1091 | 0.54 | Moderately fragmented |
| Slightly weathered glutenite | 2631~3521 | 3284 | 4091 | 0.61 | Moderately intact | |
| Comparison Parameters | Traditional Manual Monitoring | Online Health Monitoring |
|---|---|---|
| Timeliness | It is difficult to ensure data stability, especially in harsh weather conditions. | Real-time monitoring unaffected by weather, ensuring data stability even in harsh environments. |
| Continuity | Conduct regular inspections. | Conduct long-term uninterrupted 24 h online testing to reflect subtle change trends. |
| Accuracy | Both systematic errors and random errors are relatively large. | Basically, overcome errors caused by human subjectivity. |
| Quantifiable | Mainly based on observation, with difficulties in data quantification. | Monitor with scientific data, based on quantification, and provide massive data. |
| Convenience | Extremely tedious, requiring manual recording and then inputting into the computer. | Real-time access, backend operation, achieving automation, remote management, retrievability, and strong replicability. |
| Safety | Requires manual inspection, making it difficult to ensure human safety in harsh environments. | Safe and stable, with minimal subjective errors. |
| Economy | Each monitoring trip requires traveling to the project site, resulting in high costs for labor, travel, and significant investment for each monitoring session. | No need to travel to the project site after installation, with one-time investment for long-term use and strong economy. |
| Monitoring Items | Equipment Name | Specifications | Equipment Model | Monitoring Location | Quantity | Equipment Images |
|---|---|---|---|---|---|---|
| Surrounding rock pressure | Pressure cell | Dimension: ∅163 × 25 mm; Range: 0.8/2 MPa; Accuracy: 0.3% F.S.; Sensitivity: 0.1% F.S.; Operating temperature: −20~+80 °C; Temperature measurement accuracy: ±0.5 °C. | FS-TY08/20 (JMZX-5020Am) | 1.2 MPa arch crown | 1 | 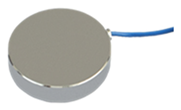 |
| 0.8 MPa arch shoulder | 2 | |||||
| 0.8 MPa arch waist | 2 | |||||
| 1.2 MPa arch springing | 2 | |||||
| 1.2 MPa middle of inverted arch | 1 | |||||
| Pressure between support and secondary lining | 1.2 MPa arch crown | 1 | ||||
| 0.8 MPa arch shoulder | 2 | |||||
| 0.8 MPa arch waist | 2 | |||||
| Internal and external forces of steel frame | Surface strain gauge | Dimension: 174 × 26 × 38 mm; Measurement range: ±3000 με (microstrain); Resolution: ≤0.2% of full scale (F.S.); Operating temperature: −20~+70 °C; Temperature measurement accuracy: ±0.5 °C. | FS-BM30 (JMZX-212AT) | Arch crown | 1 | 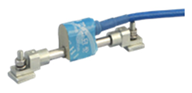 |
| Arch shoulder | 2 | |||||
| Arch waist | 2 | |||||
| Arch springing | 2 | |||||
| Middle of inverted arch | 1 | |||||
| Secondary lining stress | Rebar meter | Measurement range: 200 MPa; Resolution: 0.07% FS; Non-linearity: ≤1% FS; Operating temperature: −20~+70 °C; Temperature measurement accuracy: ±0.5 °C. | FS-B-LG10 (JMDL-3110A) | Arch crown | 1 | 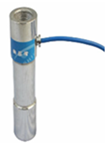 |
| Arch shoulder | 2 | |||||
| Arch waist | 2 | |||||
| Arch springing | 2 | |||||
| Middle of inverted arch | 1 | |||||
| Primary shotcrete strain | Embedded strain gauge | Dimension: 174 × 26 × 38 mm; Measurement range: ±3000 με (microstrain); Resolution: ≤0.2% of full scale (F.S.); Operating temperature: −20~+70 °C; Temperature measurement accuracy: ±0.5 °C. | FS-NM30 (JMZX-215AT) | Arch crown | 1 |  |
| Arch shoulder | 2 | |||||
| Arch waist | 2 | |||||
| Rock mass temperature and humidity | Thermohygrometer | Range: 0–100% Accuracy: ±2% within the range of 0–50% Operating environment: (−40 to +80) °C | YTDY0102 (TDR-3A) | Arch crown | 1 |  |
| Arch shoulder | 1 | |||||
| Arch waist | 1 |
| Parameter | Steel Sets | Lattice Girders | Difference |
|---|---|---|---|
| Peak Stress (MPa) | 178.6 (Crown) | 112.3 (Crown) | +59% |
| Deformation Rate (mm/day) | 0.85 (Pre-support) → 0.15 | 1.02 → 0.32 | −56% faster control |
| Stabilization Time (days) | 28 | 42 | −33% shorter |
| Load per Unit (kN/m) | 124.5 | 78.2 | +59% |
Disclaimer/Publisher’s Note: The statements, opinions and data contained in all publications are solely those of the individual author(s) and contributor(s) and not of MDPI and/or the editor(s). MDPI and/or the editor(s) disclaim responsibility for any injury to people or property resulting from any ideas, methods, instructions or products referred to in the content. |
© 2025 by the authors. Licensee MDPI, Basel, Switzerland. This article is an open access article distributed under the terms and conditions of the Creative Commons Attribution (CC BY) license (https://creativecommons.org/licenses/by/4.0/).
Share and Cite
Wu, J.; Han, Z.; Wang, Y.; Peng, F.; Cheng, G.; Jia, J. Stress-Deformation Mechanisms of Tunnel Support in Neogene Red-Bed Soft Rock: Insights from Wireless Remote Monitoring and Spatiotemporal Analysis. Buildings 2025, 15, 2366. https://doi.org/10.3390/buildings15132366
Wu J, Han Z, Wang Y, Peng F, Cheng G, Jia J. Stress-Deformation Mechanisms of Tunnel Support in Neogene Red-Bed Soft Rock: Insights from Wireless Remote Monitoring and Spatiotemporal Analysis. Buildings. 2025; 15(13):2366. https://doi.org/10.3390/buildings15132366
Chicago/Turabian StyleWu, Jin, Zhize Han, Yunxing Wang, Feng Peng, Geng Cheng, and Jiaxin Jia. 2025. "Stress-Deformation Mechanisms of Tunnel Support in Neogene Red-Bed Soft Rock: Insights from Wireless Remote Monitoring and Spatiotemporal Analysis" Buildings 15, no. 13: 2366. https://doi.org/10.3390/buildings15132366
APA StyleWu, J., Han, Z., Wang, Y., Peng, F., Cheng, G., & Jia, J. (2025). Stress-Deformation Mechanisms of Tunnel Support in Neogene Red-Bed Soft Rock: Insights from Wireless Remote Monitoring and Spatiotemporal Analysis. Buildings, 15(13), 2366. https://doi.org/10.3390/buildings15132366