Article

Porosity of Geopolymers Using Complementary Techniques of Image Analysis and Physical Adsorption of Gases

by
Carlos A. Rosas-Casarez
1,
Ramón Corral-Higuera
2,
Susana P. Arredondo-Rea
2,*,
José M. Gómez-Soberón
3,*,
Manuel J. Chinchillas-Chinchillas
1,
Margarita Rodríguez-Rodríguez
2,
Manuel J. Pellegrini-Cervantes
2 and
Jesús M. Bernal-Camacho
4
1
Departamento de Ingeniería y Tecnología, Universidad Autónoma de Occidente (UAdeO), Guasave 81048, Sinaloa, Mexico
2
Facultad de Ingeniería Mochis, Universidad Autónoma de Sinaloa (UAS), Los Mochis 81223, Sinaloa, Mexico
3
Escuela Politécnica Superior de Edificación de Barcelona, Universidad Politécnica de Cataluña, Gregorio Marañón 44-50, 08028 Barcelona, Spain
4
Facultad de Ingeniería y Tecnología de Mazatlán, Universidad Autónoma de Sinaloa (UAS), Mazatlán 82146, Sinaloa, Mexico
*
Authors to whom correspondence should be addressed.
Buildings 2025, 15(13), 2353; https://doi.org/10.3390/buildings15132353
Submission received: 2 June 2025 / Revised: 23 June 2025 / Accepted: 28 June 2025 / Published: 4 July 2025
(This article belongs to the Special Issue Advanced Composite Materials for Sustainable Construction)

Abstract

Previous research on geopolymers has not fully established their porosity and its influence on the matrix structure, as well as its relevance to mechanical and durability properties, supporting the potential of this material as a sustainable alternative to traditional construction materials. In this study, three geopolymer mortar (GM) mixtures were prepared: the first was obtained with fly ash (FA) without mechanical grinding (GM_FA), the second with FA that required crushing and sieving through a #200 sieve (GM_FA_200), and the third was a GM with FA that required crushing and sieving through a #325 sieve (GM_FA_325). The main objective was to evaluate the porosity of the geopolymeric paste and the interfacial transition zone (ITZ) between the aggregate and the geopolymerization products. Due to the susceptibility of this area to develop higher porosity, which leads to reduced mechanical properties and durability, it has become a significant focus of investigation in materials such as concrete and mortar. These analyses were carried out using physical adsorption of gases (PAG), and a methodology for image analysis of GM microporosity was implemented using micrographs obtained from a scanning electron microscope (SEM) and processed with the NI Vision Assistant 8.6 software (VA). The results from both image analysis and physical adsorption demonstrated that the GM_FA_325 matrix exhibited 19% less porosity compared to the GM_FA matrix. The results confirmed that GMs are predominantly mesoporous. It was observed that GM_FA_325 has the lowest total porosity, resulting in a denser and more compact microstructure, which is a key factor in its mechanical performance and potential applications as an eco-friendly construction material for coatings and precast elements such as blocks, panels, and similar products. In addition, image analysis using VA is highlighted as an efficient, cost-effective, and complementary technique to PAG, enabling robust results and resource optimization.

1. Introduction

The pollution generated by cement production is a global issue, contributing significantly to high levels of environmental contamination. The global production of cement is approximately 4.1 billion tons, accounting for 8% of global carbon dioxide (CO2) emissions [1,2,3]. Each year, there is a 0.3% increase in direct CO2 emissions caused by this industry, and it is estimated that these emissions will rise by 12 to 23% by 2050 [4,5]. Among the alternatives to reduce cement usage are the incorporation of additives, the development of new binders, the partial replacement of cement with supplementary cementitious materials (SCMs), and the use of geopolymers [6,7]. SCMs are by-products from industrial processes that contain high amounts of silicon and aluminum oxides. When subjected to grinding, they react with alkaline or alkaline-earth hydroxides in the presence of moisture, forming compounds with cementitious properties [8]. Some of the most commonly used SCMs include silica fume, blast furnace slag, and fly ash (FA) [9]. The latter is a by-product generated from coal combustion in power plants and heat production facilities, captured by electrostatic precipitators or filters before being released into the atmosphere [10,11].
Recently, there has been an increasing number of studies focused on the 100% utilization of FA as a binder, eliminating the need for cement and offering a viable and sustainable alternative for reducing cement consumption while repurposing industrial waste [12,13]. Geopolymers are inorganic polymeric materials with ceramic-like properties, synthesized at relatively low temperatures, typically below 100 °C. Their structure is composed of molecular networks that are based on minerals and connected through covalent bonding [14]. The high silicon and aluminum oxide content in FA facilitates the synthesis of these inorganic polymers, as their main components react with an alkaline medium, initiating the geopolymerization process and forming a three-dimensional hydrated aluminosilicate gel structure with various configurations within the material [15]. Some of the most notable properties of FA-based geopolymers include their significant resistance to abrasion, corrosion, salinity, wear, mechanical stress, and porosity [16,17,18,19].
The application of these materials in the construction industry requires specific conditions. For optimal use, FA should undergo prior grinding, be mixed gently and slowly with aggregates, use specific activators, and be cured under controlled conditions to ensure the proper formation of the aluminosilicate gel and acquire the desired properties [20,21]. Various studies have demonstrated that geopolymers possess adequate mechanical properties for use in construction [22,23,24]. However, most research has focused on synthesis methods, such as varying curing temperatures, aggregate-to-binder ratios, and alkaline solution molarity to enhance mechanical properties, aiming to establish geopolymers as viable substitutes for conventional concrete [25,26]. Another critical property for their application in construction is their microstructure and physical characteristics, such as porosity, which becomes increasingly important due to its relevance to durability, as this is closely related to the microstructure, particularly porosity, through ion conduction within the material’s pore system [27]. According to previous studies, the potential applications of geopolymer mortars require further in-depth investigation [28]. Compared to mechanical property studies, porosity and specific surface area analyses have been relatively less explored. Since these properties are directly linked to the mechanical performance of geopolymers, it is essential to conduct detailed studies to assess and define their microstructure and their potential applications, like eco-friendly construction materials.
Although there are studies specifically focused on porous geopolymers, such as developments related to geopolymer foams or materials with controlled porosity for thermal insulation or filtration applications [29,30].
The present work does not deal with materials intentionally designed to be porous, but rather with conventional geopolymer matrices. Nevertheless, the techniques applied in this study to characterize porosity and microstructure are suitable for any type of geopolymer, regardless of its degree of porosity, highlighting their versatility and broader applicability.
There are image analysis methods that allow for the indirect determination of the matrix microstructure using advanced software. These methods offer advantages such as being non-destructive, cost-effective, and highly precise [31]. Microstructure evaluation is performed by processing images and applying logical operations through software to images obtained from scanning electron microscopy (SEM) and backscattered electron (BSE) imaging. As a result, it is possible to quantify the total number of pores and reactive products [32].
Another widely used research technique is physical adsorption of gases (PAG), which allows for the determination of pore size distribution (including micropores, mesopores, and macropores), as well as specific surface area and other parameters [33,34,35,36].
In this study, FA-based geopolymer mortars were synthesized using sodium hydroxide (NaOH) at an 8 molar (8 M) concentration as an alkaline activator.
The main objective of this study is to evaluate the porosity of FA-based geopolymers by combining PAG and image analysis techniques using NI Vision Assistant 8.6 (VA). This dual methodology enables a complementary understanding of the material’s microstructural characteristics and pore distribution. Since image analysis has rarely been used as a comparative technique in this type of material, its implementation is proposed as a tool to visually and efficiently estimate the porosity level and identify pore types directly from SEM micrographs. Additionally, the study investigates the porosity within the interfacial transition zone (ITZ) between the geopolymeric paste and the fine aggregate, a region known for its mechanical weakness and high concentration of interconnected pores due to the wall effect.

2. Materials and Methods

2.1. Materials

The FA used was obtained from the José López Portillo coal-fired power plant, located in Coahuila, Mexico. Its chemical composition is presented in Table 1 [37]. The alkaline solution used was 98% sodium hydroxide (NaOH) from Sigma Aldrich, and the fine aggregate consisted of standardized silica sand, which meets the specifications of ASTM C33 [38].

2.2. Geopolymer Mortars

Three geopolymer mortar (GM) samples were prepared, with their design specifications shown in Table 2. The first GM was obtained using untreated FA (GM_FA), the second with FA that required crushing and sieving through a #200 sieve (GM_FA_200), and the third was a GM with FA that required crushing and sieving through a #325 sieve (GM_FA_325). The particle size was selected based on the fact that sieve #200 separates sand from fines, and it was used as an intermediate to provide comparative data between unground FA and the finer fraction passing through sieve #325, which defines the fineness of Portland cement. Additionally, the three FA particle sizes were primarily selected to evaluate their influence on the porosity of the resulting matrix.
FA was mixed with NaOH at an NaOH/FA ratio of 0.5. Subsequently, silica sand was added, and the mixture was kept under constant agitation for 10 min. The mixtures were then placed into cubic molds and subjected to a thermal treatment at 80 °C with 90% relative humidity (RH) for a curing period of 28 days.

2.3. SEM Analysis

The samples, measuring 2 cm × 2 cm, were identified and embedded in resin with a catalyst at a 7.5:1 ratio. After applying a vacuum to remove trapped air, they were cured at 40 °C for 12 h to achieve full hardening.
The polishing process was carried out using a series of silicon carbide and aluminum oxide sandpapers in the following order: P-220 (40 μm), P-400 (30 μm), 600-Al2O3 (20 μm), and 1000-Al2O3 (12 μm). The sample was then subjected to a final polishing on a glass base using Al2O3 and water. To verify polishing quality, the sample was vertically removed (90°), ensuring it left a uniform imprint on the glass surface. Finally, metallographic polishing was performed, which involved mechanical polishing under pressure, with the duration adjusted according to the material’s hardness (20–30 min for geopolymers). To ensure a conductive surface, the samples were coated with graphite and examined at 500X magnification.
The analysis was conducted using a JEOL JSM-6510 scanning electron microscope (SEM). Once the image was acquired in backscattered electron (BSE) mode, point mapping with energy dispersive spectroscopy (EDS) was performed to identify chemical elements, mainly Si and Fe. This step was crucial for constructing, distinguishing, and identifying different phases in the image processing, including the general matrix, aggregate, interfacial transition zone (ITZ), and porosity.
Microporosity analysis through image processing was conducted to evaluate the proportions of fine aggregate paste, geopolymerization product, unreacted material, and the overall porosity percentage in the geopolymers. Additionally, this method was used to analyze porosity within the ITZ between the fine aggregate and the geopolymer matrix.
For the microporosity image analysis of GM, a “mask” (a processed image that filters or highlights a specific area or object within the overall image) was created.
The selected micrographs for this process were those showing the connection between the aggregates and the geopolymer matrix. Figure 1 displays the three images used in this study, where the ITZ location in each of the three study matrices can be identified.
A filter was developed from these micrographs to define the separation between the aggregate and the paste.
The image analysis process of GM was performed using the VA software NI Vision Assistant 8.6 software by National Instruments, which executes logical and morphological operations that allow for segmentation and binarization of any image. This made it possible to analyze characteristics of interest such as shape, particle size, and area percentage. The threshold values applied for segmentation and subsequent binarization of the images in each case were based on grayscale histograms obtained from the VA software.
In the case of GMs, the literature does not provide clearly established procedures for determining experimental parameters due to the novelty of this study. Therefore, to quantify the total porosity and unreacted material of each study matrix (Figure 2), threshold values similar to those proposed in previous literature for cement-based concrete were employed. It is important to highlight that, although both techniques have limitations and a margin of error due to sample size and the reduced study area, they complement each other and exhibit consistent trends in the evaluated properties. This is supported by other studies on similar materials, particularly those that have used image analysis to assess ITZ properties [39,40].
In the original micrograph of the three study matrices, a threshold operation was applied within a defined range for bright elements (0 to 225), considering them as unreacted material. It is important to highlight that phases with a high iron content (an element present in FA, which is difficult to dissolve) appear brighter in BSE images compared to other phases in the geopolymer [41,42]. Meanwhile, for darker tones (ranging from 0 to 50), all areas within this range were considered as pores or voids, as reported in previous microscopy and image analysis studies applied to cementitious materials and geopolymers [43,44,45].
This procedure was initially proposed for cement concrete characteristics by Diamond in 2001 and later by Head and Buenfeld in 2006 [46,47]. Figure 2 illustrates this procedure, highlighting the geopolymerization products and porosity in the two images processed using VA.

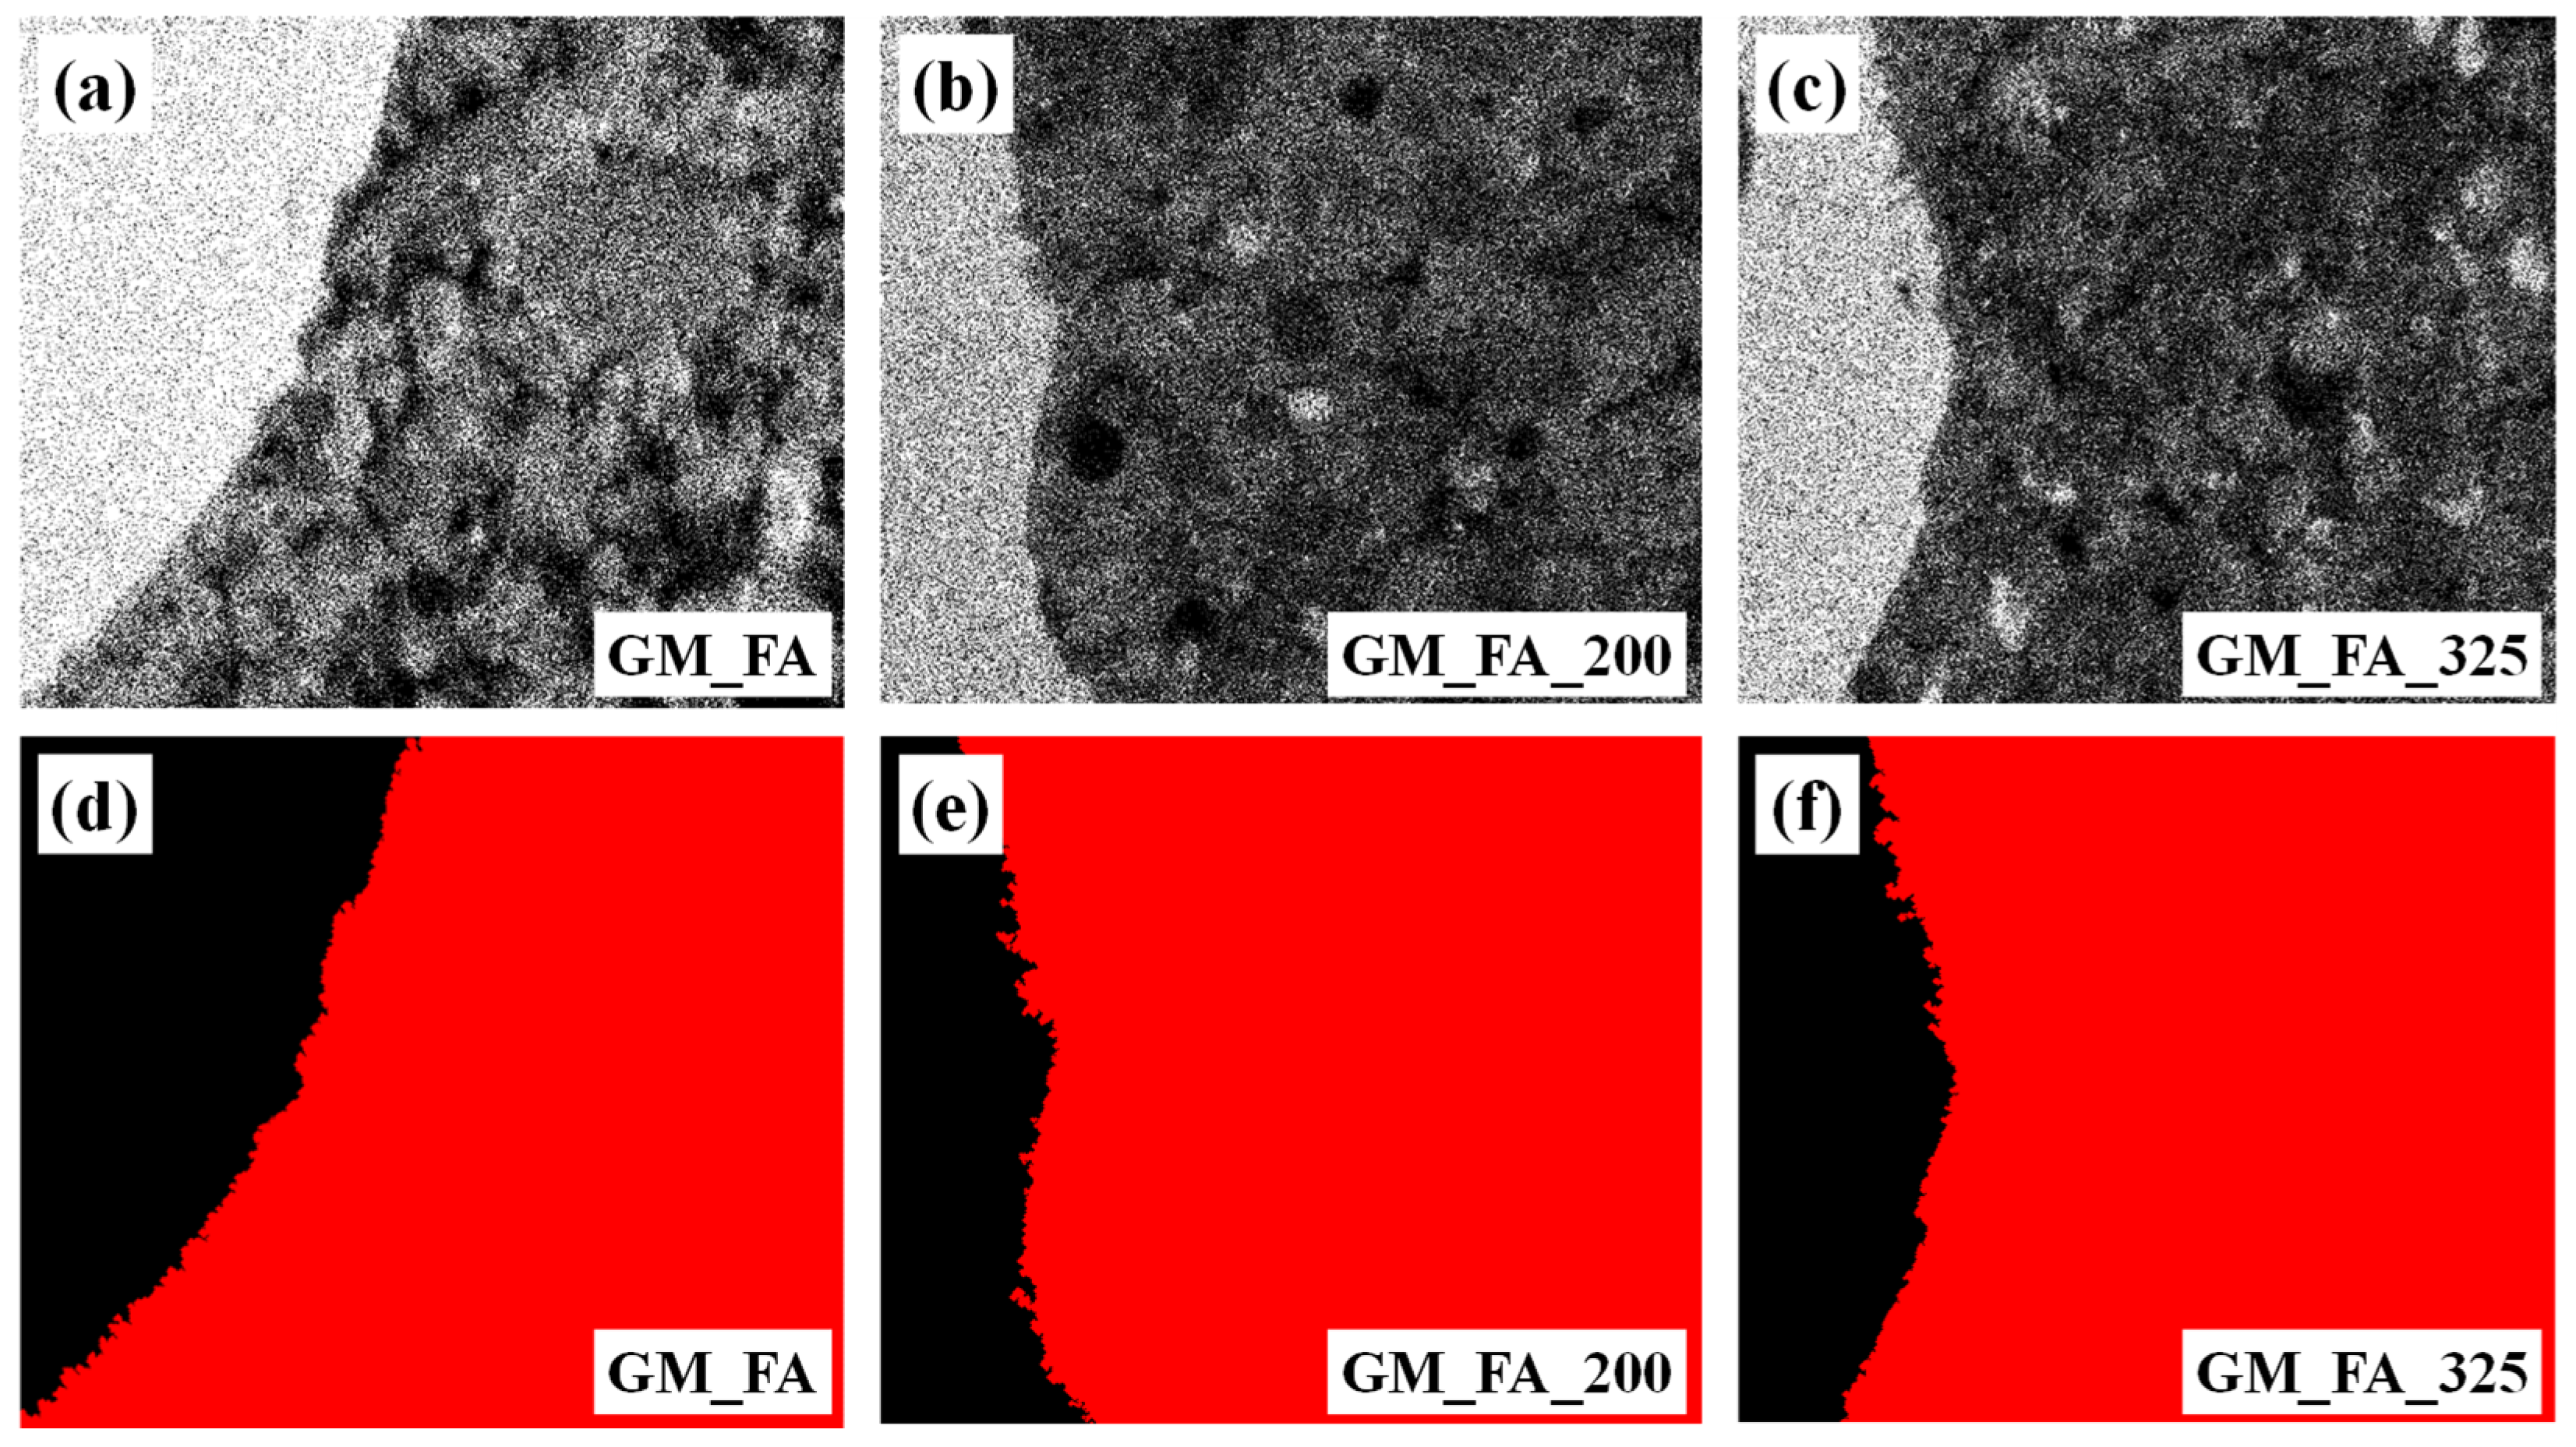
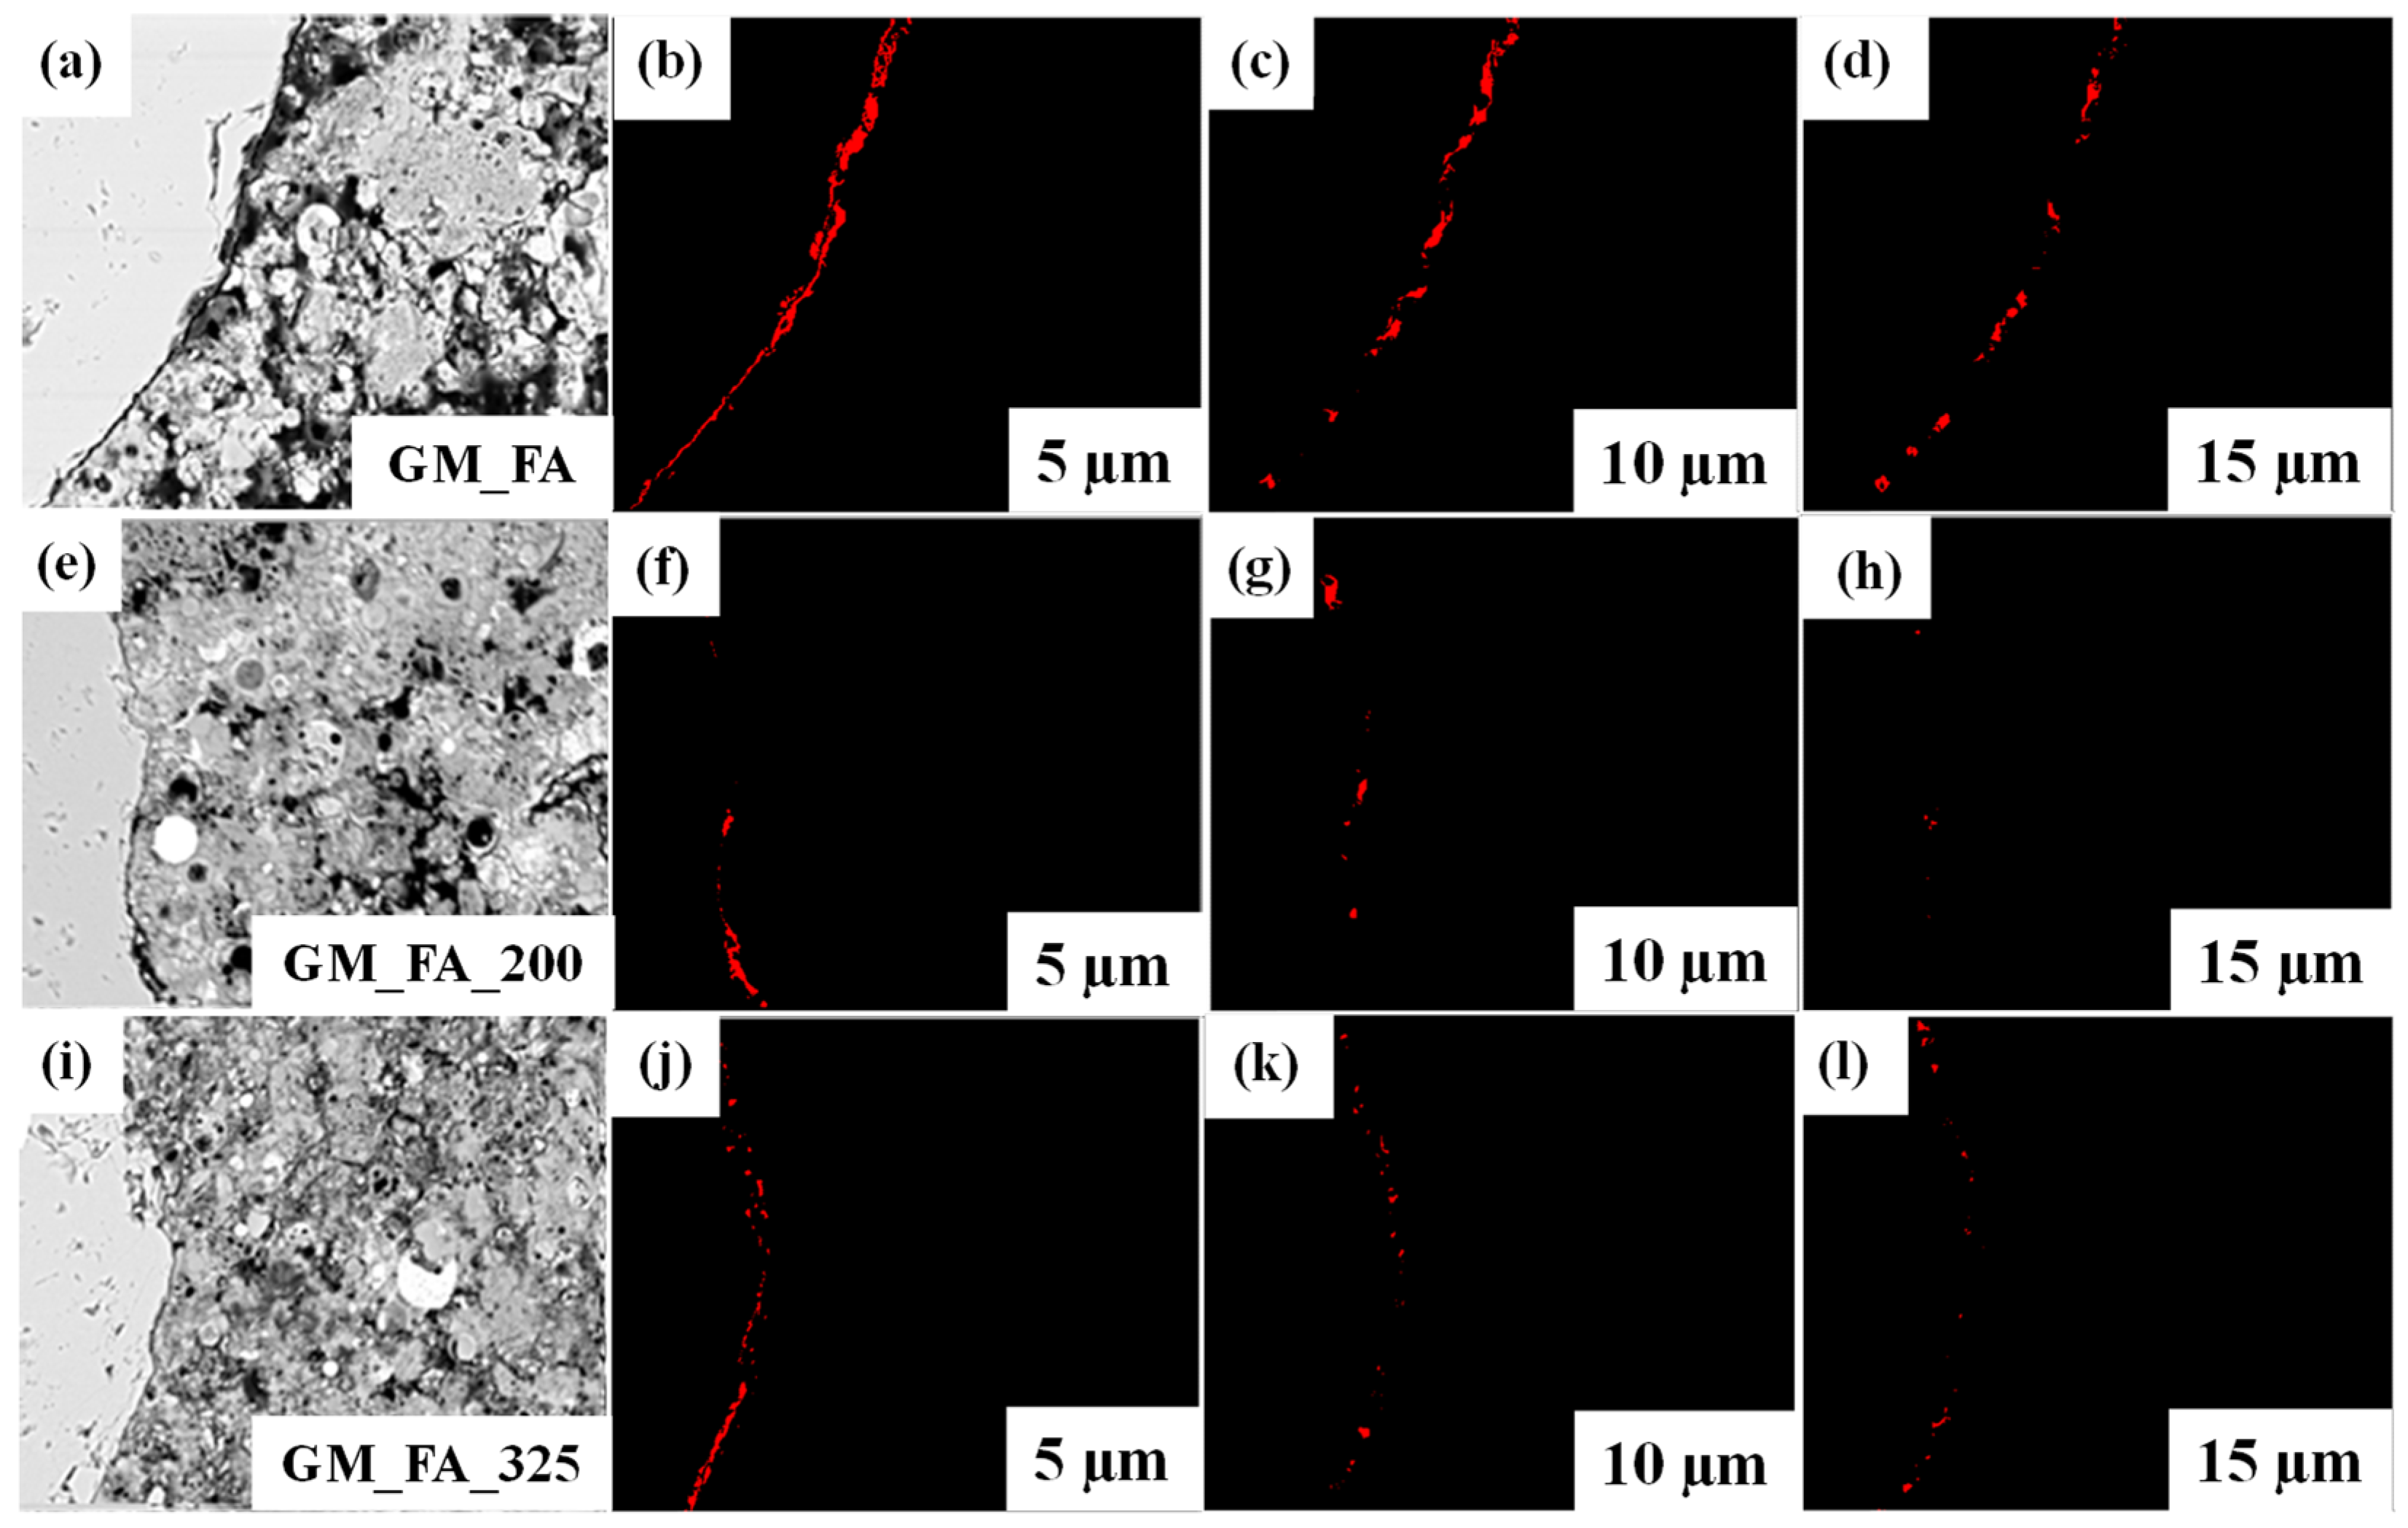
Determination of the Paste-Aggregate Mask

Once the image was acquired in BSE mode, elemental mapping was performed using energy dispersive spectroscopy (EDS). Additionally, the VA software was used to determine the grayscale range of each micrograph, with an intensity range set between 0 and 254. Based on the color histogram, a threshold limit was established in the grayscale scale, an operation known as “thresholding,” which has been previously applied in concrete analysis [48,49,50].
Subsequently, the VA software was also used to determine the ITZ in the micrographs by segmenting the image to “separate” the aggregate from the paste. This process was carried out through elemental silicon mapping to detect the fine aggregate and generate the aggregate mask. The conversion process is illustrated in Figure 3.
During the construction of the aggregate mask, micrograph calibration was performed by converting pixel units to microns. Once the images were calibrated, the next step was the “construction” of the boundary defining the ITZ between the fine aggregate and the geopolymer matrix. This was achieved by evaluating different thicknesses (5, 10, and 15 µm).
The procedure followed was established by Chinchillas et al. in 2019 [32], which employs software commands to dilate the aggregate mask and then superimpose the original binarized image (Figure 4). This procedure was conducted to determine ITZ porosity, unreacted material, and geopolymerization products at different ITZ thicknesses [51]. Figure 4 presents the porosity (red color) of the study matrices evaluated at various ITZ thicknesses (5, 10, and 15 µm).

2.4. Physical Adsorption of Gases

The equipment used for the gas adsorption test was an AUTOSORB-6 automatic volumetric PAG analyzer and an AUTOSORB DEGASSER, both from Quantachrome. The Brunauer, Emmett, and Teller (BET) gas adsorption method was used to determine the amount of gas adsorbed necessary to cover the accessible internal and external pore surfaces with a complete monolayer of adsorbate.

3. Results and Discussion
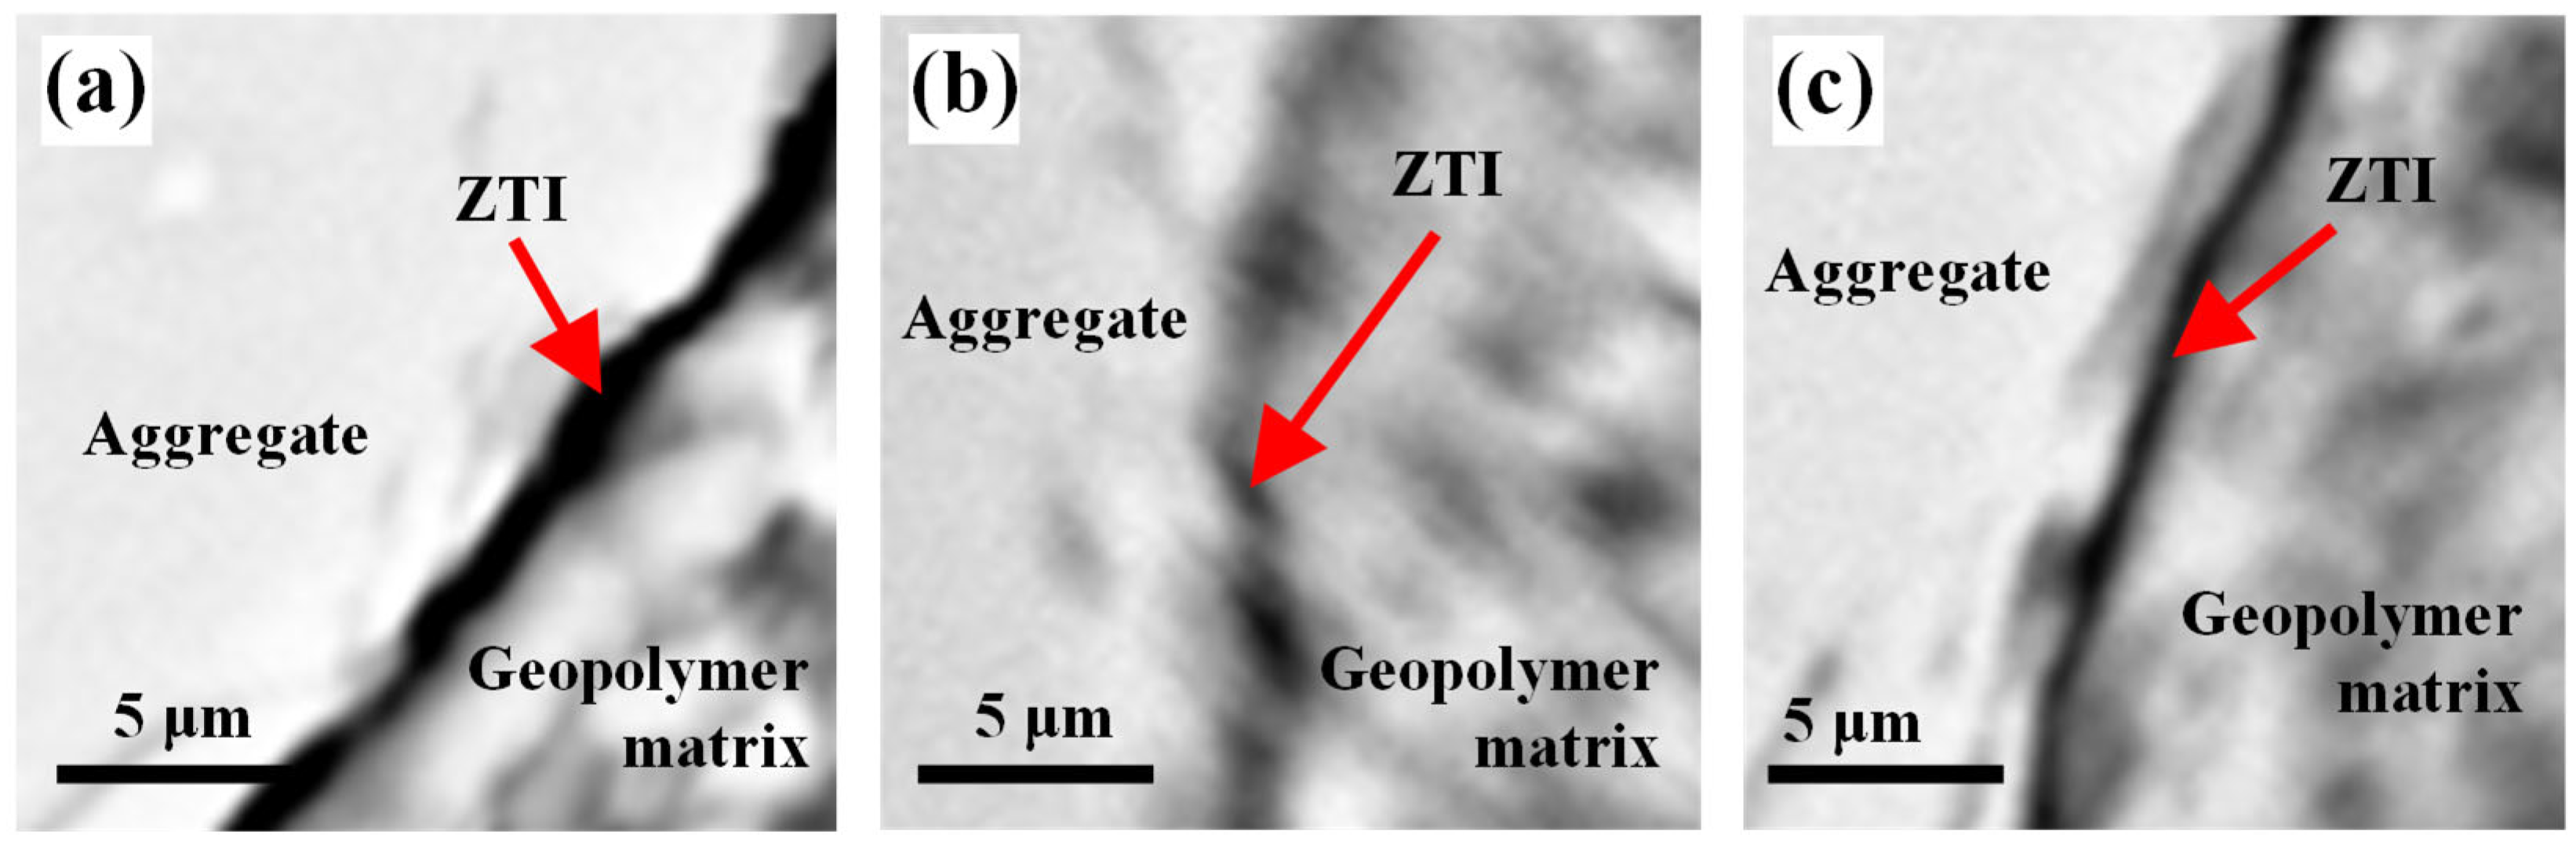
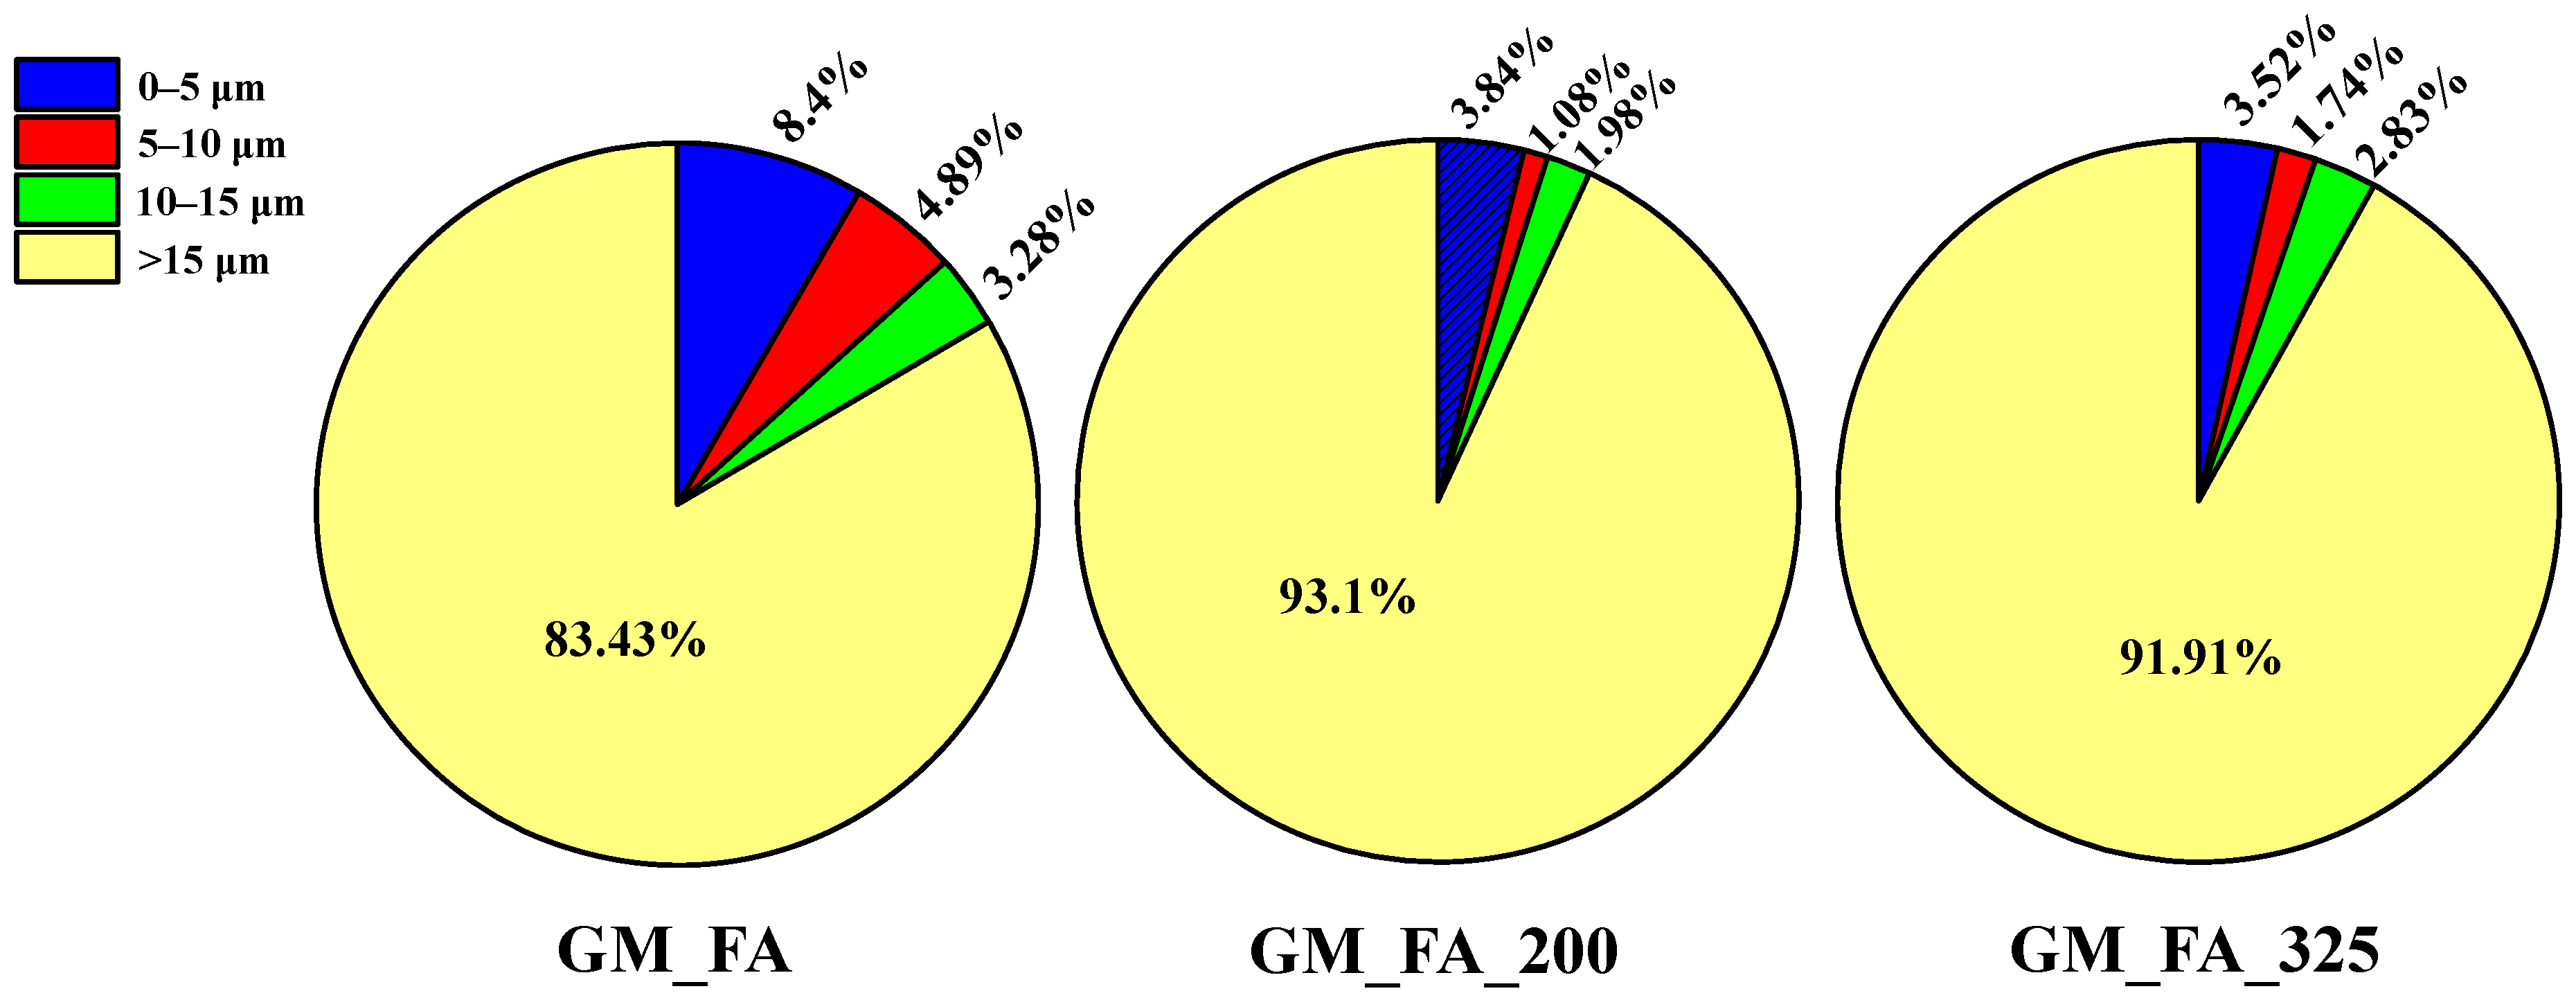
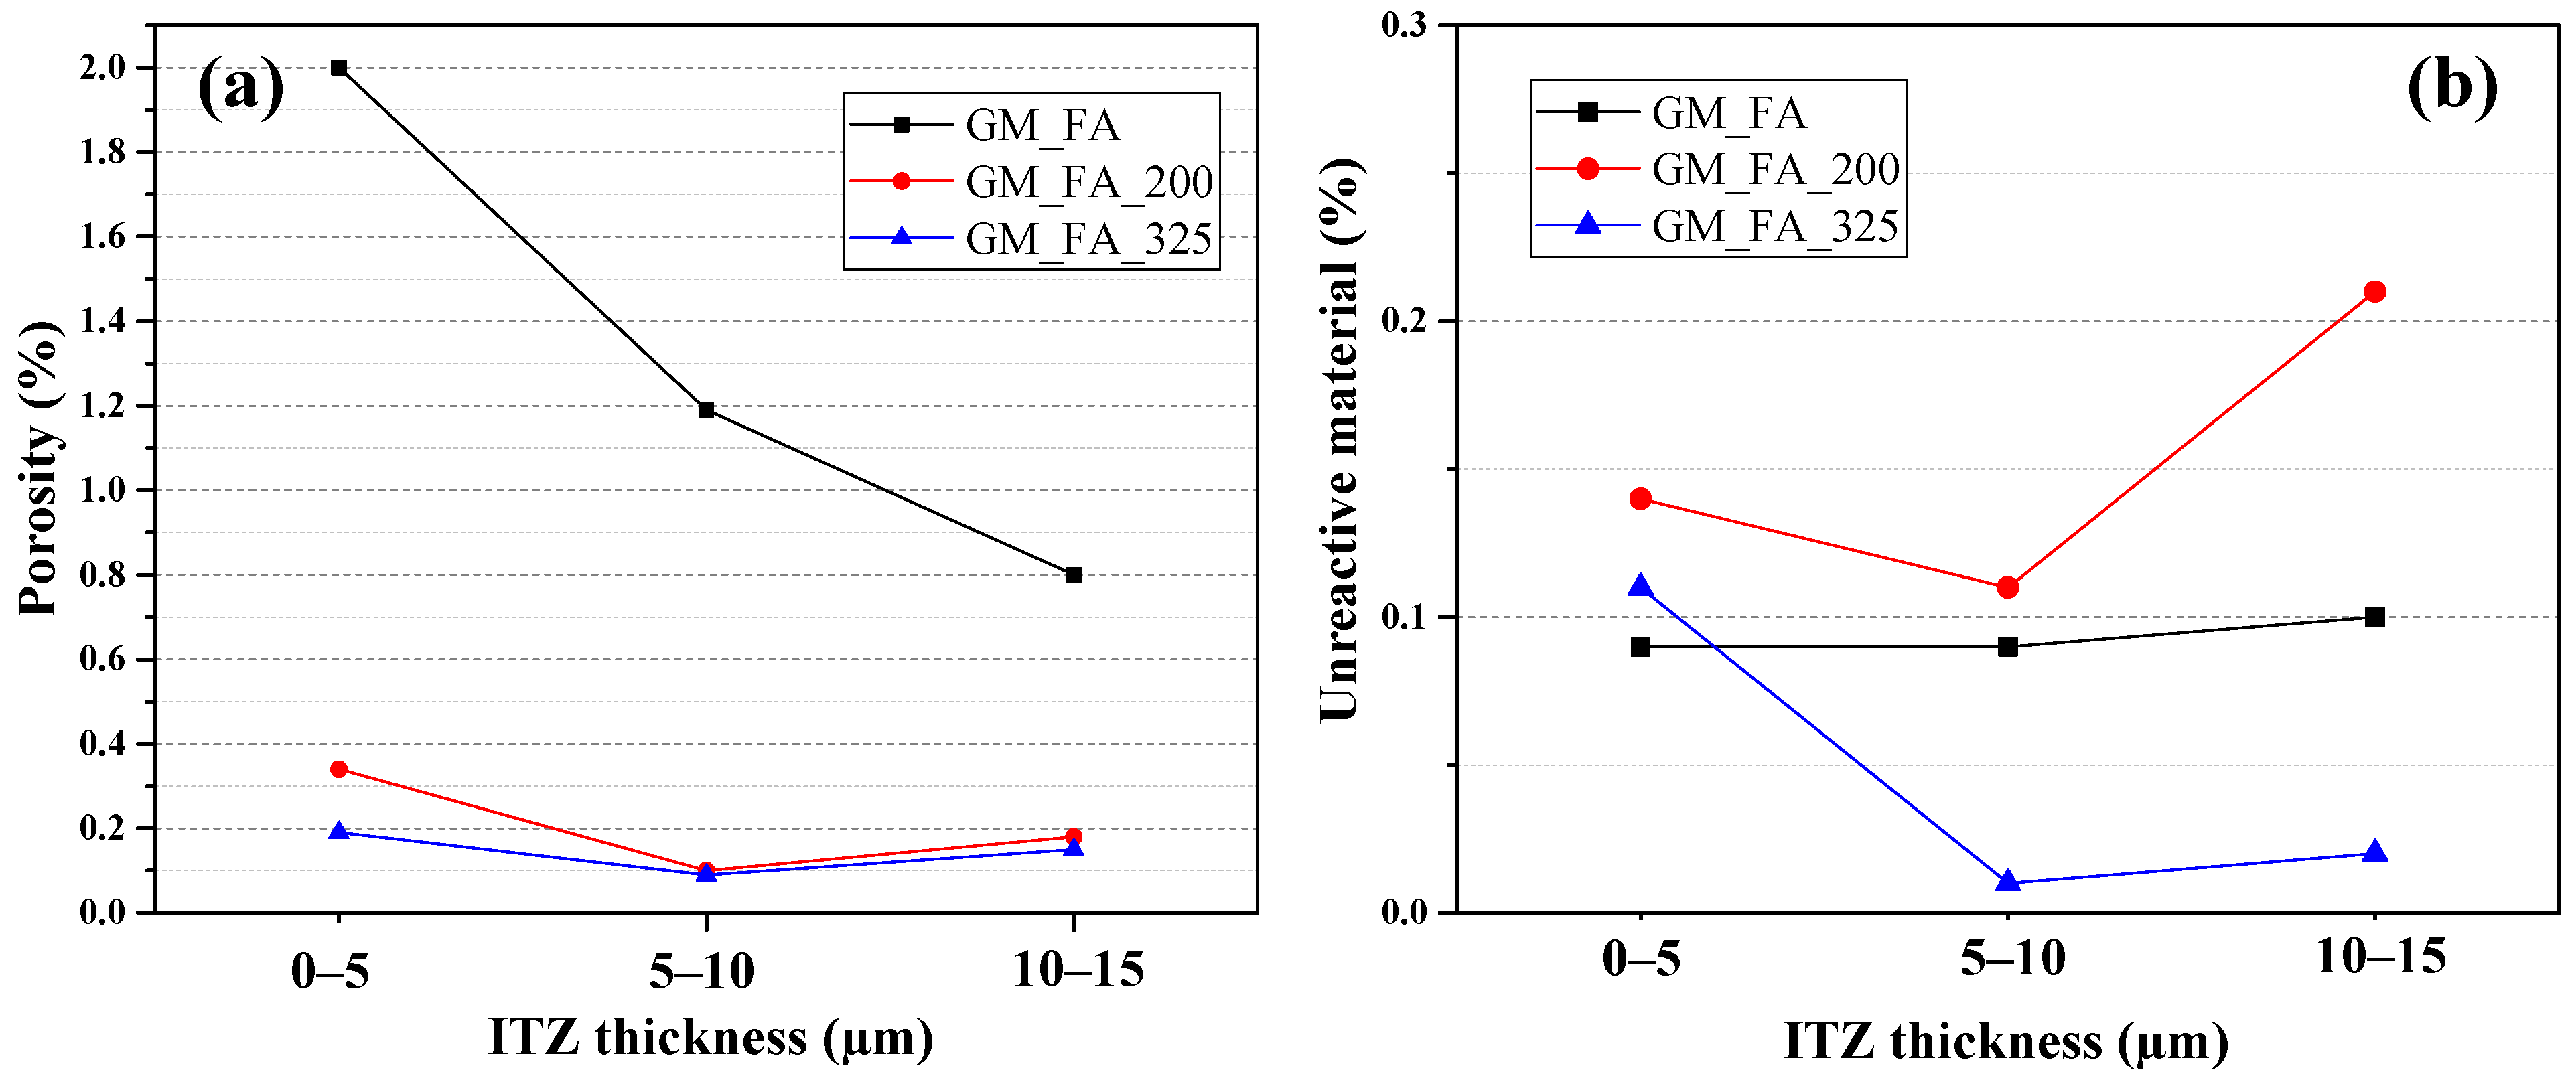
3.1. Image Analysis

Figure 5 presents magnified micrographs of the ITZ (aggregate/paste) in the studied geopolymers. In Figure 5a (GM_FA), a “void” zone with an average thickness of approximately 2.4 µm was identified. This represents the region of the geopolymer matrix most prone to being a source of mechanical vulnerability in the material [52,53,54].
The cracks identified in Figure 5b,c show a gradual decrease in ITZ thickness, resulting in an aggregate/paste separation with thicknesses around 1.5 µm in GM_FA_325. Additionally, the ITZ trajectory along the aggregate boundary in the studied areas exhibited a pattern that was neither “tortuous” nor entirely smooth in all three analyzed matrices.
To determine the different ITZ thicknesses, porosity percentages, unreacted material, and total geopolymerization products, these values were calculated based on the proportion of aggregate and paste present in the SEM micrograph. In these images, the geopolymerization products were obtained by subtracting the porosity and unreacted material from the paste [55].
Figure 6 presents the porosity percentages, unreacted material, and geopolymerization products of the different GM samples analyzed. It shows that the highest porosity percentage was observed in the GM_FA matrix (24.3%), compared to GM_FA_200, which reached 8.9%, and GM_FA_325, which had only 5.3%. This indicates a porosity variation range of up to 19%. This behavior is primarily attributed to the structure of the geopolymer matrix, which is significantly influenced by the FA particle size [37].
In a reactive component such as FA, smaller particle sizes result in a larger surface area and, consequently, higher reactivity with the alkaline activator. This, in turn, promotes the formation of a greater amount of sodium aluminosilicate hydrate (N–A–S–H) gel, which is a key indicator of the geopolymerization process and directly contributes to improved mechanical properties of GMs. This behavior has been previously studied and published, where the mechanical properties and their relationship with the material’s microstructure were evaluated, supporting the results obtained in this study [37].
Additionally, Figure 6 shows that GM_FA_325 had the lowest porosity percentage (5.3%) and the lowest percentage of unreacted material (2.3%). These characteristics are indicative of a higher degree of geopolymerization (92.4%), as its higher reactivity results from the increased specific surface area of the FA particles, which enhances the interaction with the alkaline activator. Consequently, GM_FA_325 exhibited a denser, more compact matrix with lower porosity and a more uniform microstructure compared to FA that had not undergone a prior grinding process [14,56,57].
Regarding GM_FA_200, its geopolymerization degree was 87.3%, showing a 5.1% difference compared to GM_FA_325. However, it exhibited a 15.5% improvement compared to GM_FA. Its constituent percentages were similar to those of GM_FA_325, with values of 87.3% and 92.4%, respectively. On the other hand, the percentage of unreacted material was reduced in all three studied matrices, with a difference of only 1.6% between the matrix with the least unreacted FA (GM_FA_325) and the one with the highest percentage of unreacted FA (GM_FA).
The porosity of the ITZ was determined by analyzing three hypothetical thicknesses. The study areas were defined by locating the theoretical boundary of the aggregate and considering hypothetical ITZ thicknesses of 0–5, 5–10, and 10–15 μm, measured perpendicularly to the aggregate boundary.
The results showed that GM_FA, GM_FA_200, and GM_FA_325 exhibited their highest porosity percentages at the narrowest ITZ thickness (0–5 μm), with values of 8.4%, 3.84%, and 3.52%, respectively, relative to the total porosity of each matrix (see Figure 7). This behavior is attributed to the formation of microcracks between the paste and the aggregate (see Figure 5) and the possible absorption of available water in the surrounding aggregate environment.
Additionally, in GM_FA, a decrease in porosity percentage was observed as the distance from the aggregate increased. Meanwhile, GM_FA_200 and GM_FA_325 showed similar values in the sections with greater ITZ thickness, with maximum variations between them not exceeding 1.1%.
Figure 8a,b presents the porosity and unreacted material percentages in the studied matrices for different theoretical ITZ thicknesses (5, 10, and 15 μm). These results allow us to determine the influence of the FA type used in each matrix.
To ensure comparability between the study matrices, the results presented in these figures must be normalized relative to the total paste content of each sample. This is necessary because each SEM micrograph is different, and therefore, their paste percentages vary.
The trend indicates that as the ITZ thickness decreases relative to the aggregate, the porosity percentage in the ITZ increases. The 5 μm thickness exhibits the highest porosity percentage, making this zone the weakest link in the entire matrix. This phenomenon is attributed to the so-called “wall effect”, which affects the separation thickness between the aggregate and the paste [58].
The GM_FA matrix shows the highest porosity and unreacted material percentage at 0–5 μm thickness compared to GM_FA_200 and GM_FA_325. Additionally, in all three analyzed matrices, the porosity percentage decreases as the ITZ thickness increases beyond the most critical zone (0–5 μm).
In this specific region (5 μm from the aggregate), microcracks develop, facilitating the formation of microporosity. This microporosity differs from that observed at thicknesses greater than 5 μm from the aggregate, where porosity is not exclusively associated with the “wall effect” of the ITZ and the aggregate. Instead, it results from the chemical reaction between FA and the alkaline activator.
Furthermore, GM_FA_200 and GM_FA_325 show low levels of unreacted FA (approximately 0.1% at 5, 10, and 15 μm thicknesses).
Figure 9a presents the porosity percentages of the matrices at different ITZ thicknesses (5, 10, and 15 μm) relative to the ITZ area created using the software. It shows that at a 5 μm ITZ thickness, the matrix with the highest porosity is GM_FA (45.75%), compared to GM_FA_200 (9.99%) and GM_FA_325 (5.42%). This result is attributable to GM_FA having lower reactivity due to its larger particle sizes [57].
In Figure 2a,d,g, continuous microporosity adjacent to the aggregate can be observed. Therefore, the higher porosity percentages in the ITZ at 5 μm thickness are due to factors such as the “wall effect,” aggregate distribution, and the reactivity maturity of the specimens [43,59]. Additionally, other factors like particle size, shape, and aggregate texture may also play a role.
At a 15 μm thickness from the aggregate, the matrix with the lowest porosity percentage is GM_FA_325 (5.34%), followed by GM_FA_200 (6.48%), while the highest porosity percentage in this range was found in GM_FA (22.34%).
These results demonstrate that microporosity and ITZ formation are most prominent within thicknesses of 0–2 μm and 0–5 μm, but not at greater thicknesses.
Figure 9b shows the percentages of unreacted material in the three matrices. It identifies GM_FA_200 as having the highest percentage of unreacted material across all three studied ITZ thicknesses relative to the aggregate, particularly at the 15 μm ITZ thickness. This result is influenced by the presence of a “sphere” of unreacted FA located at this thickness.
The matrices with the lowest percentages of unreacted material are GM_FA_325 and GM_FA_200, with variations of less than 3% [60].

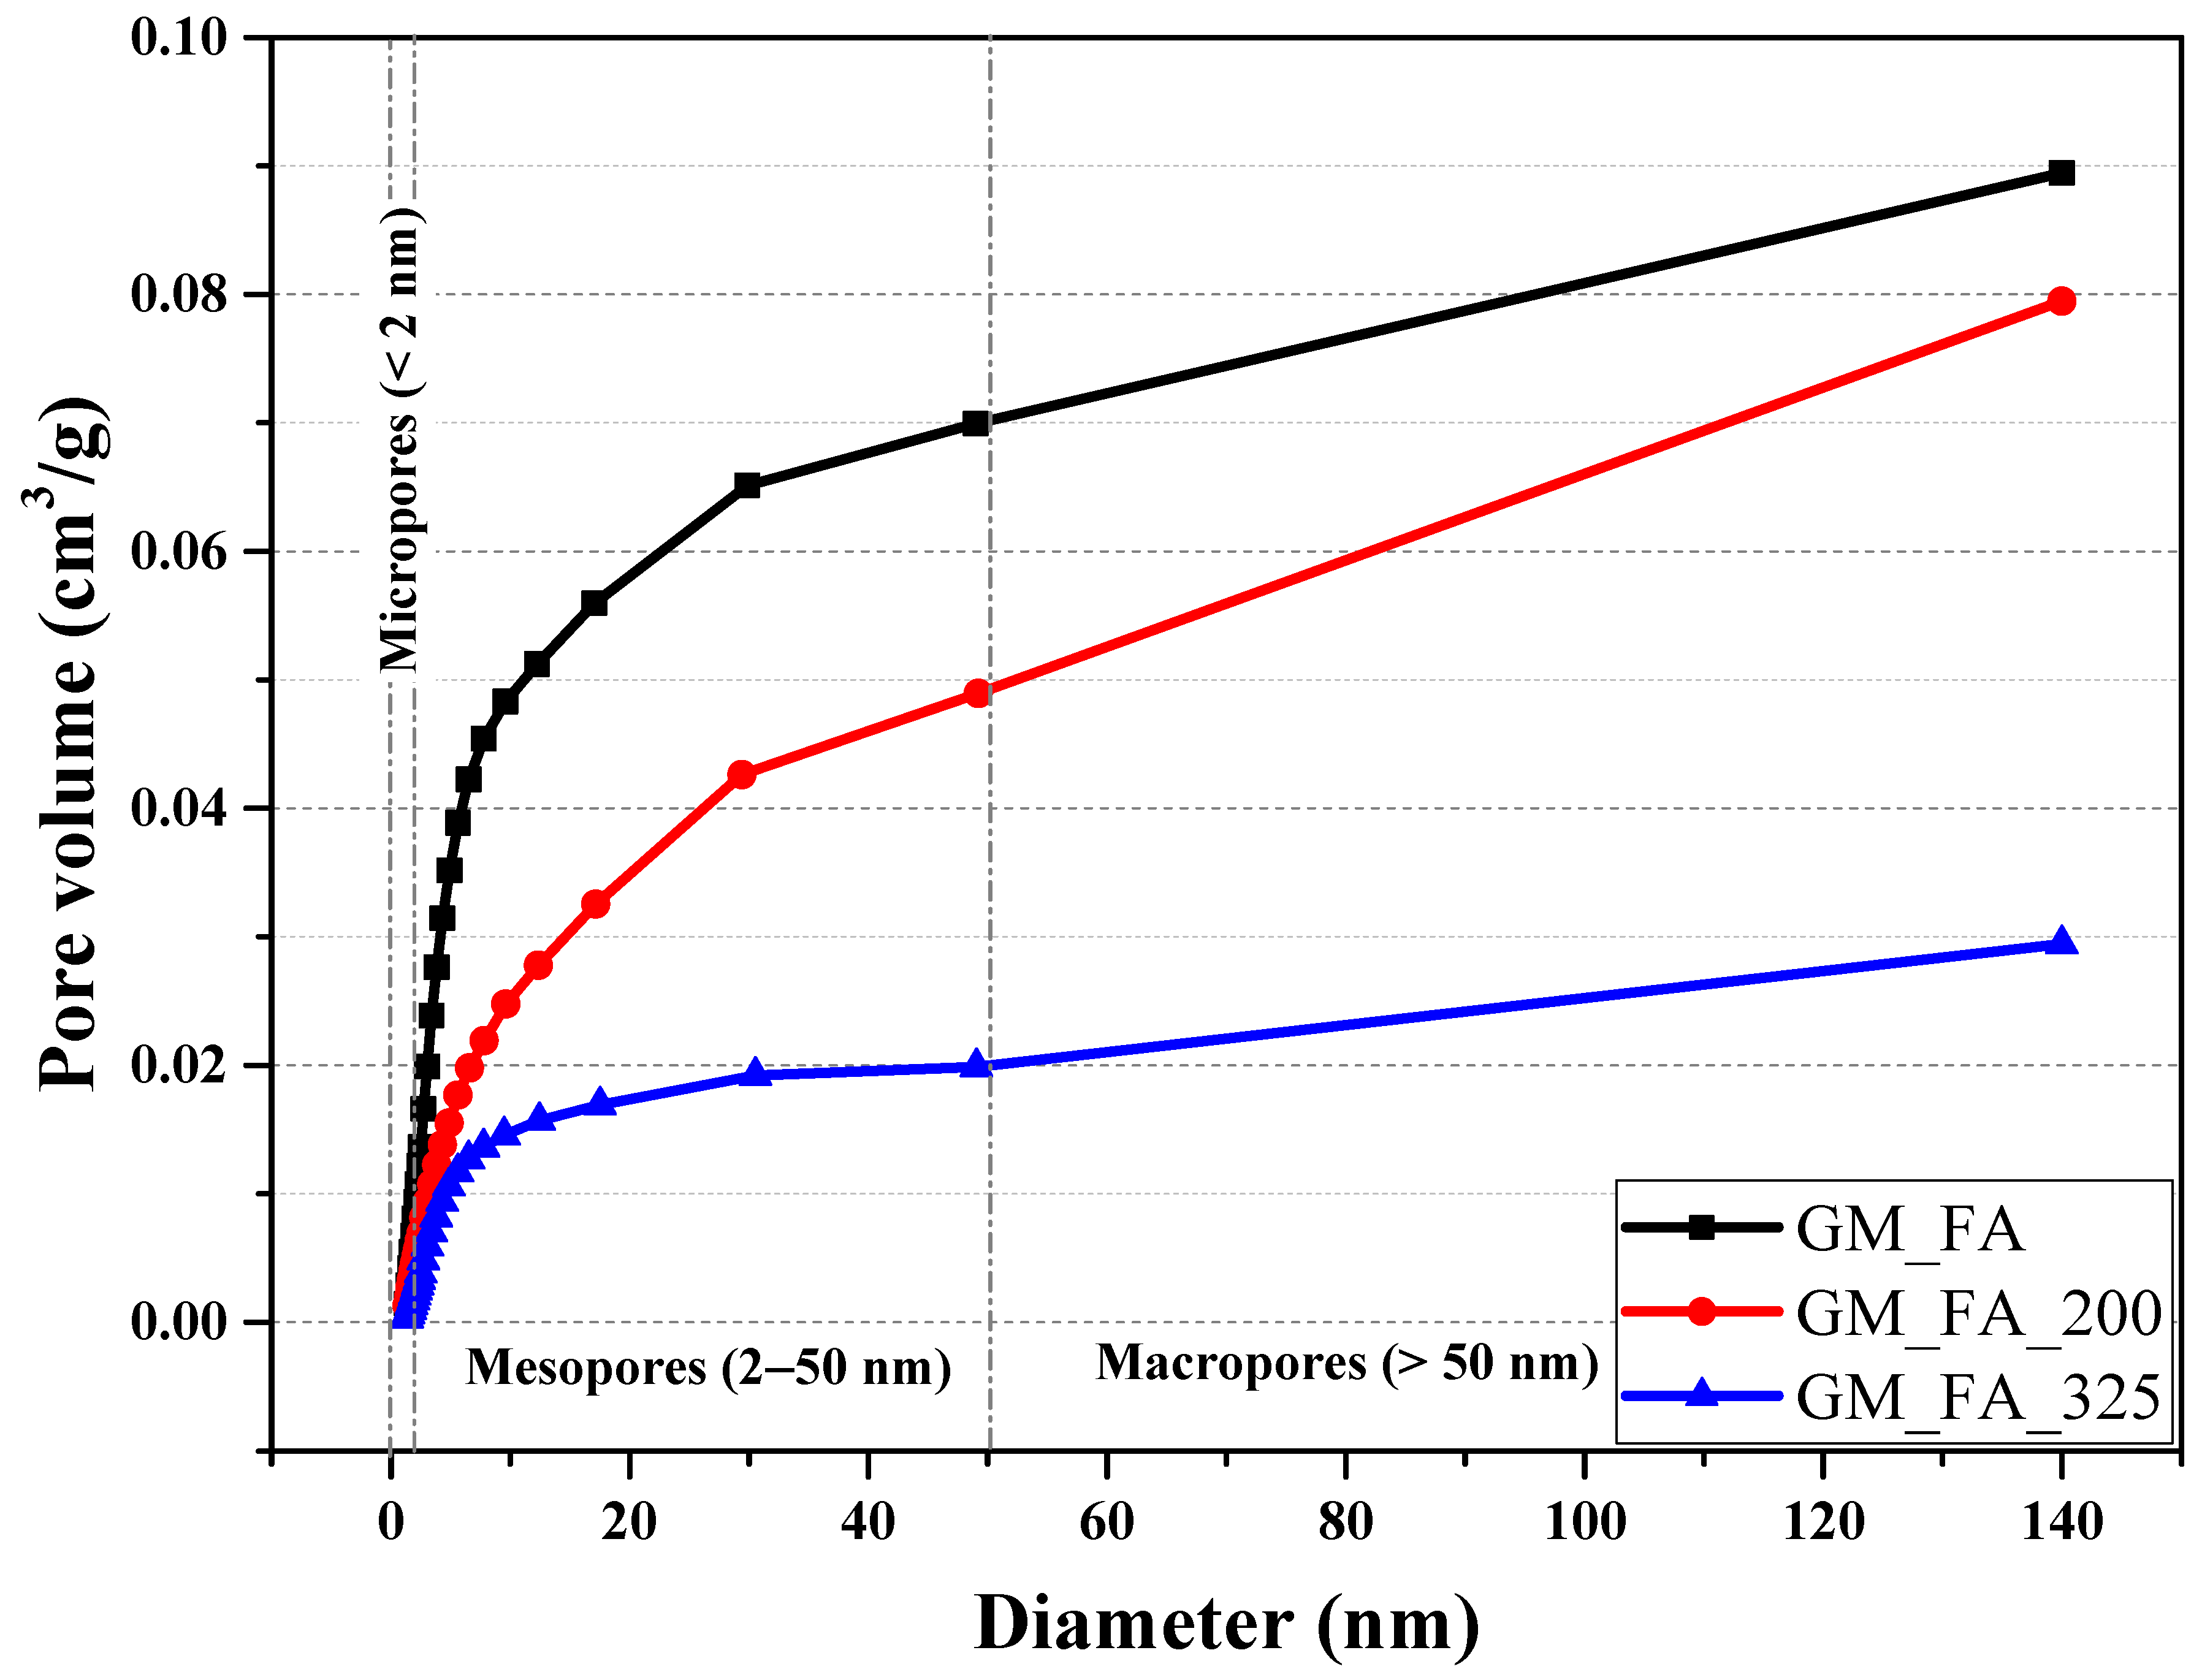
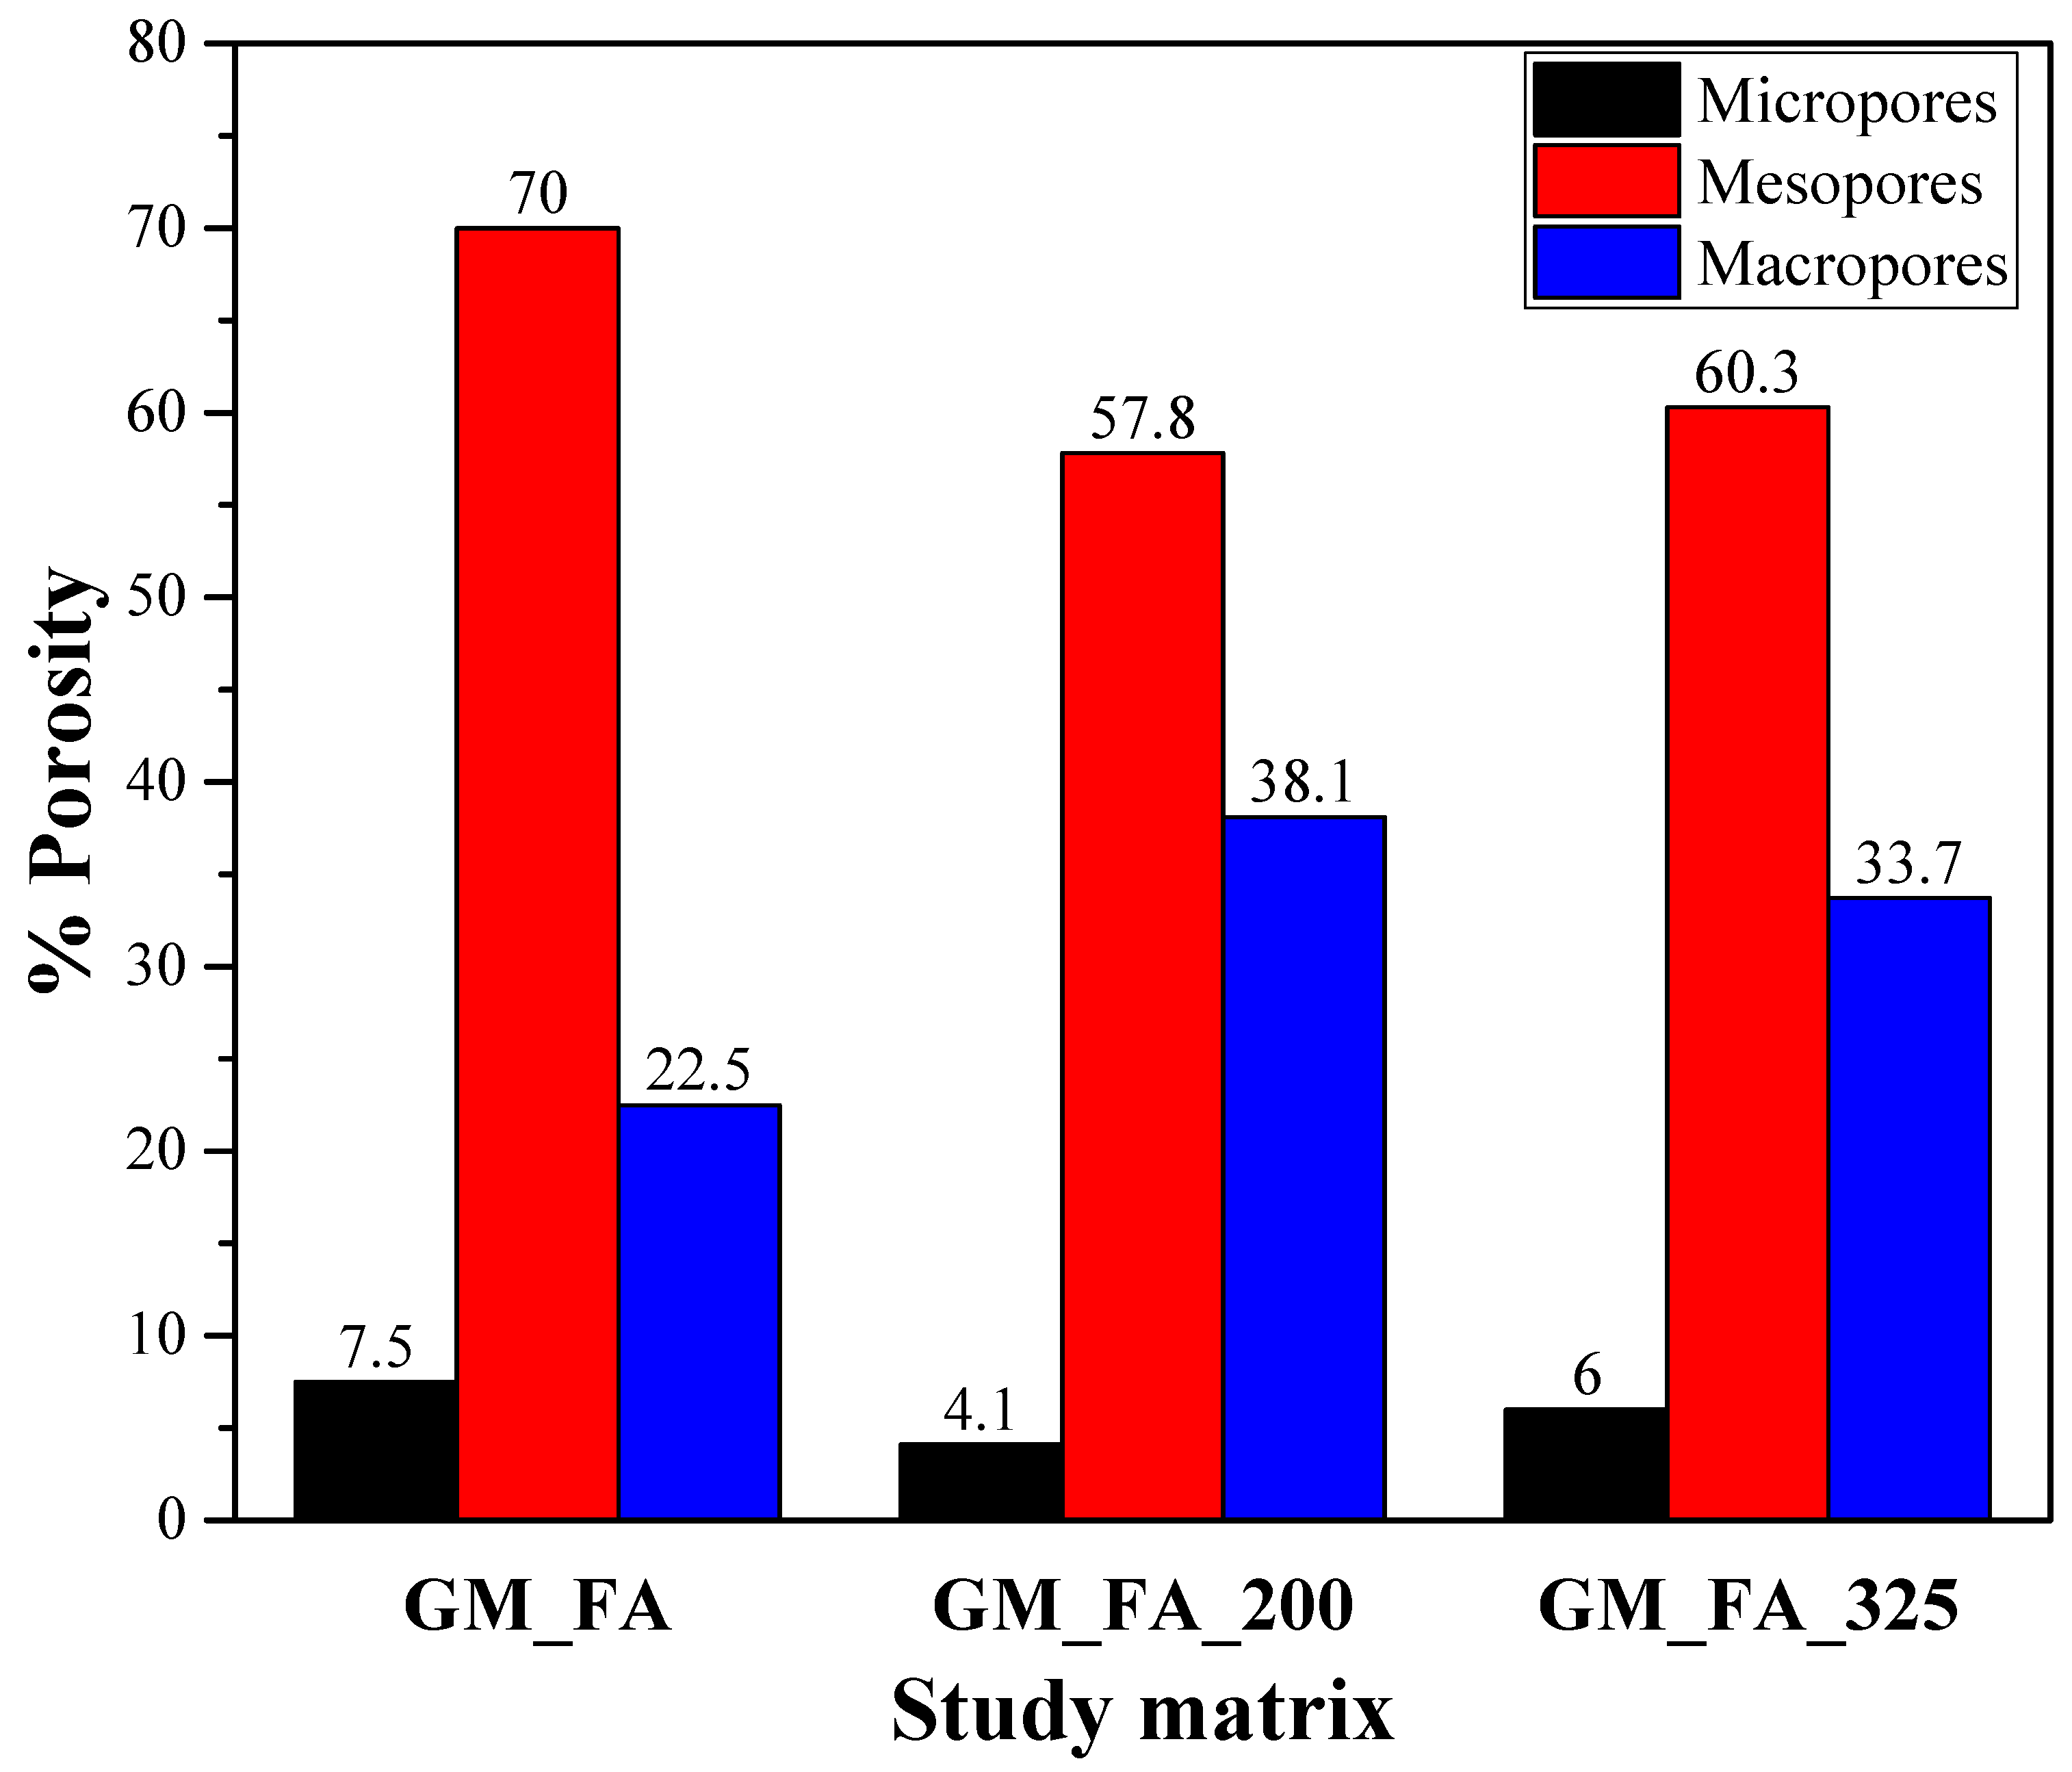
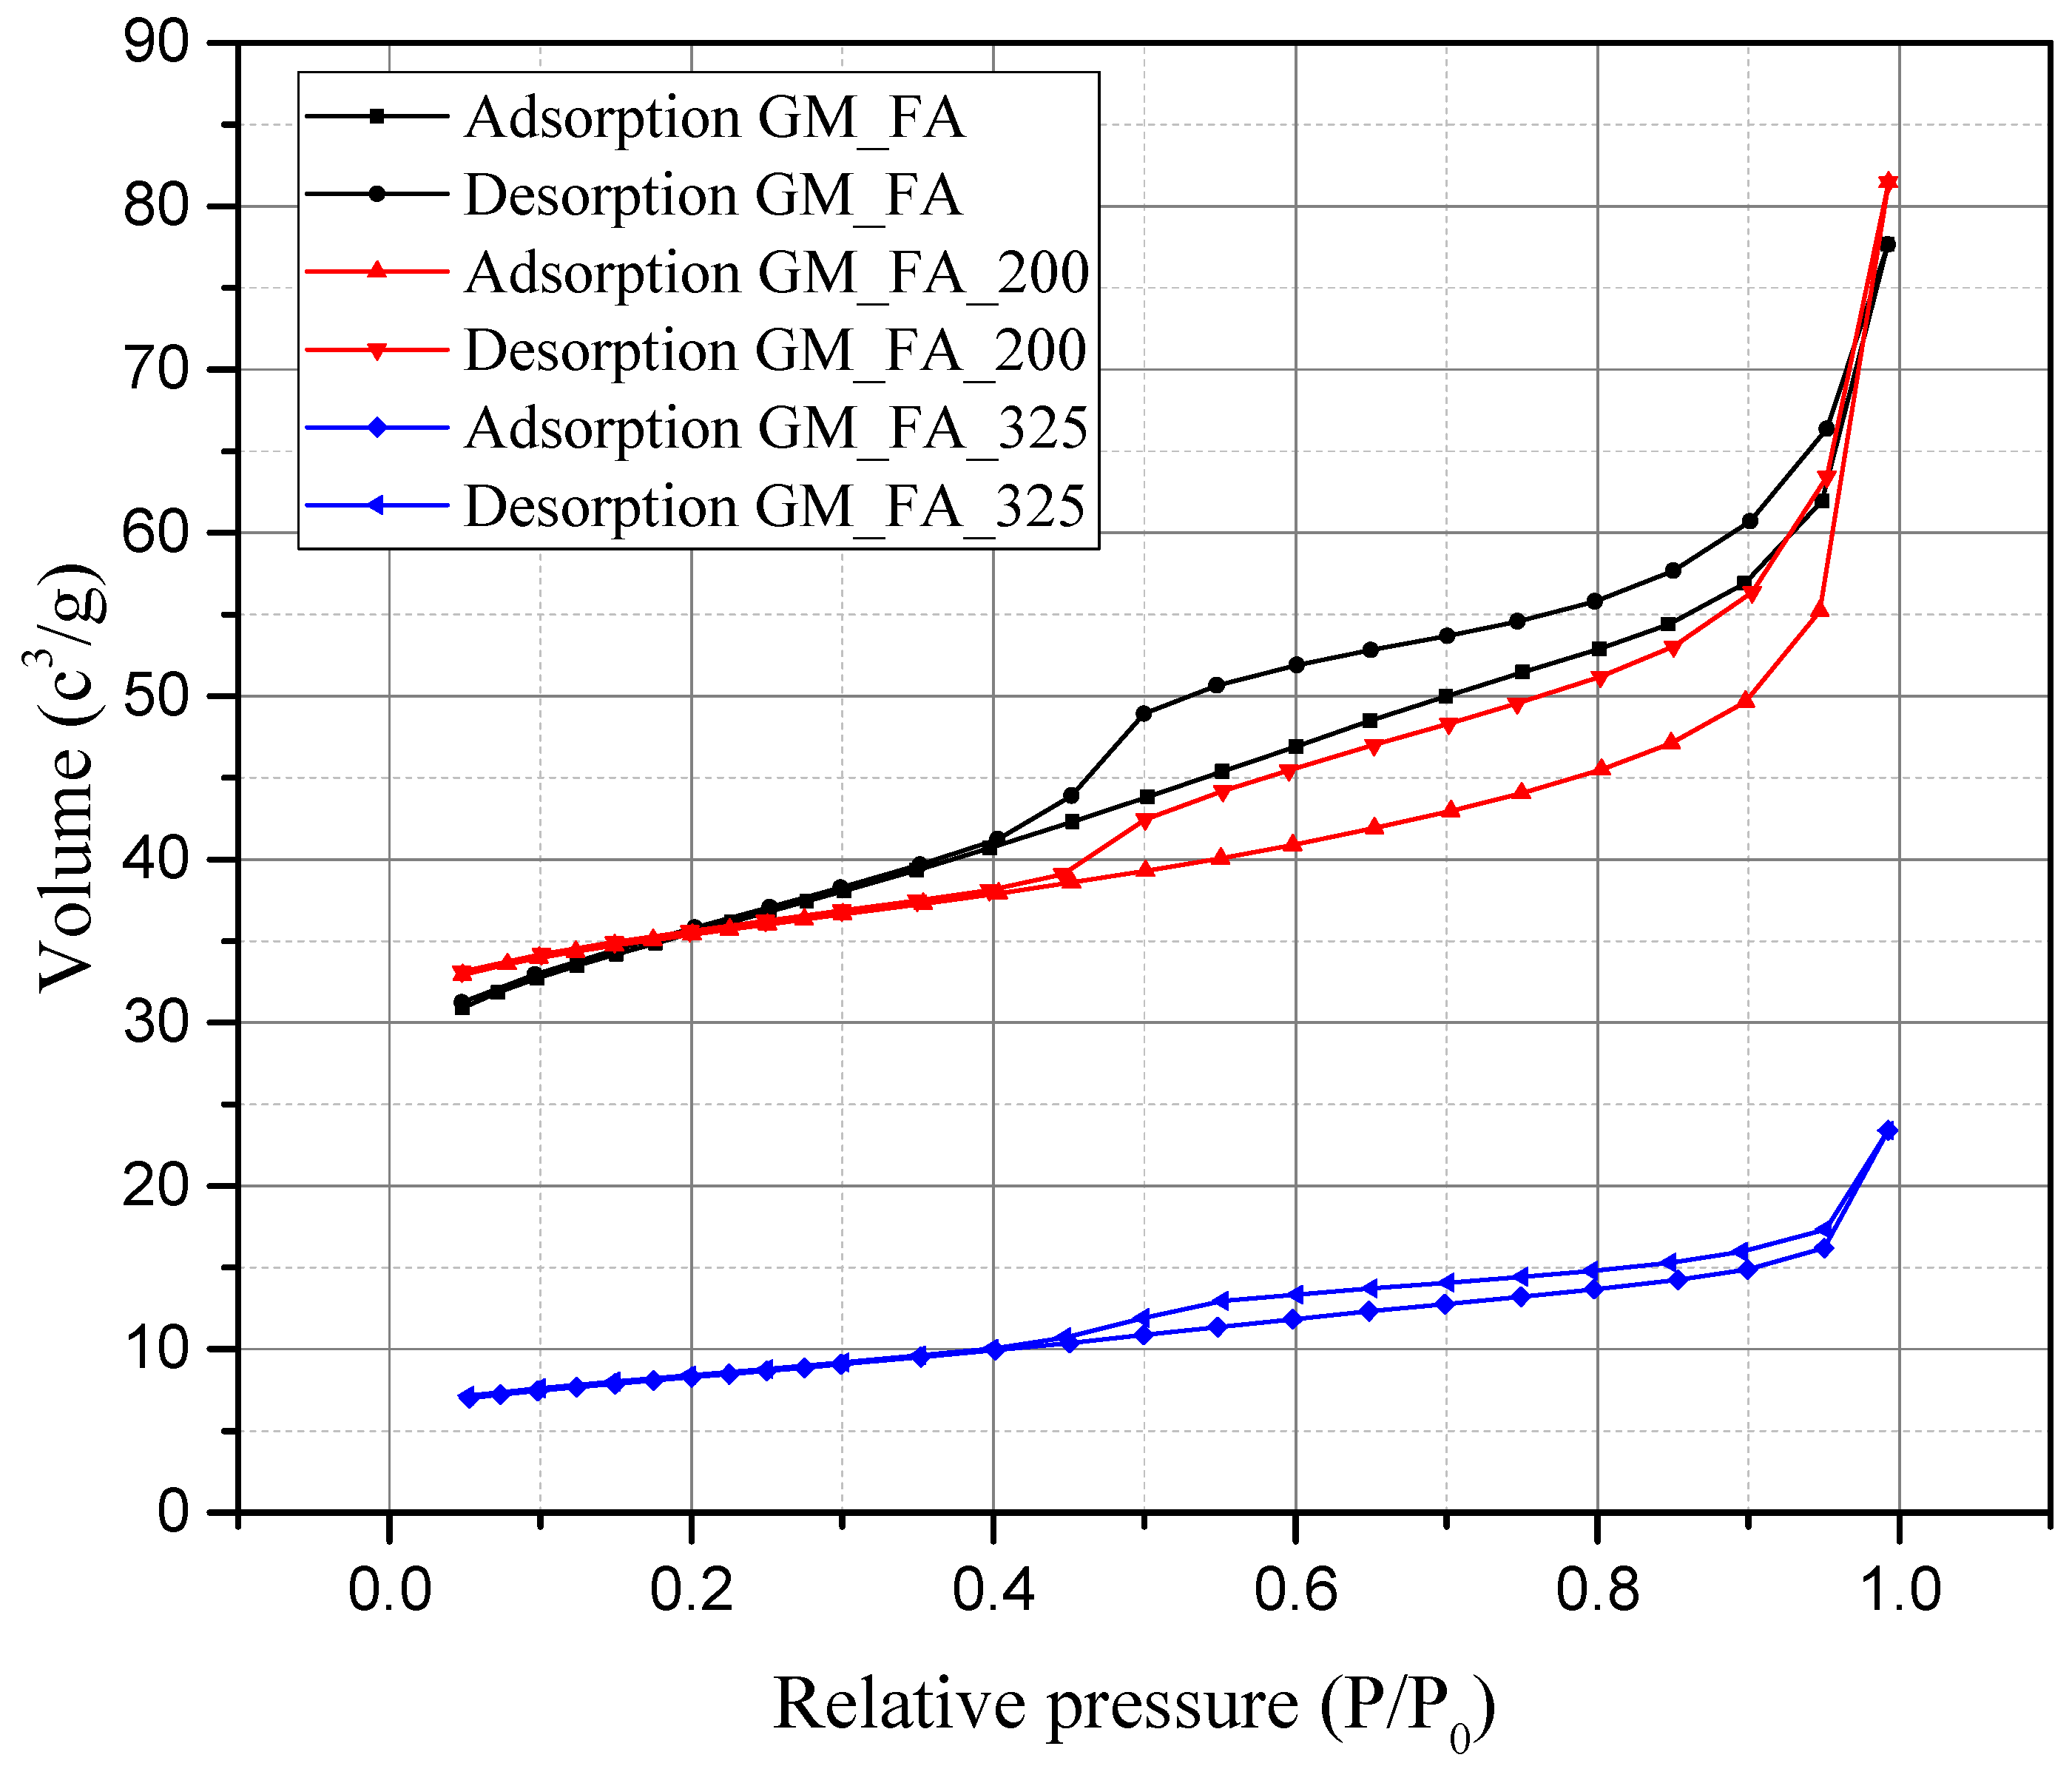
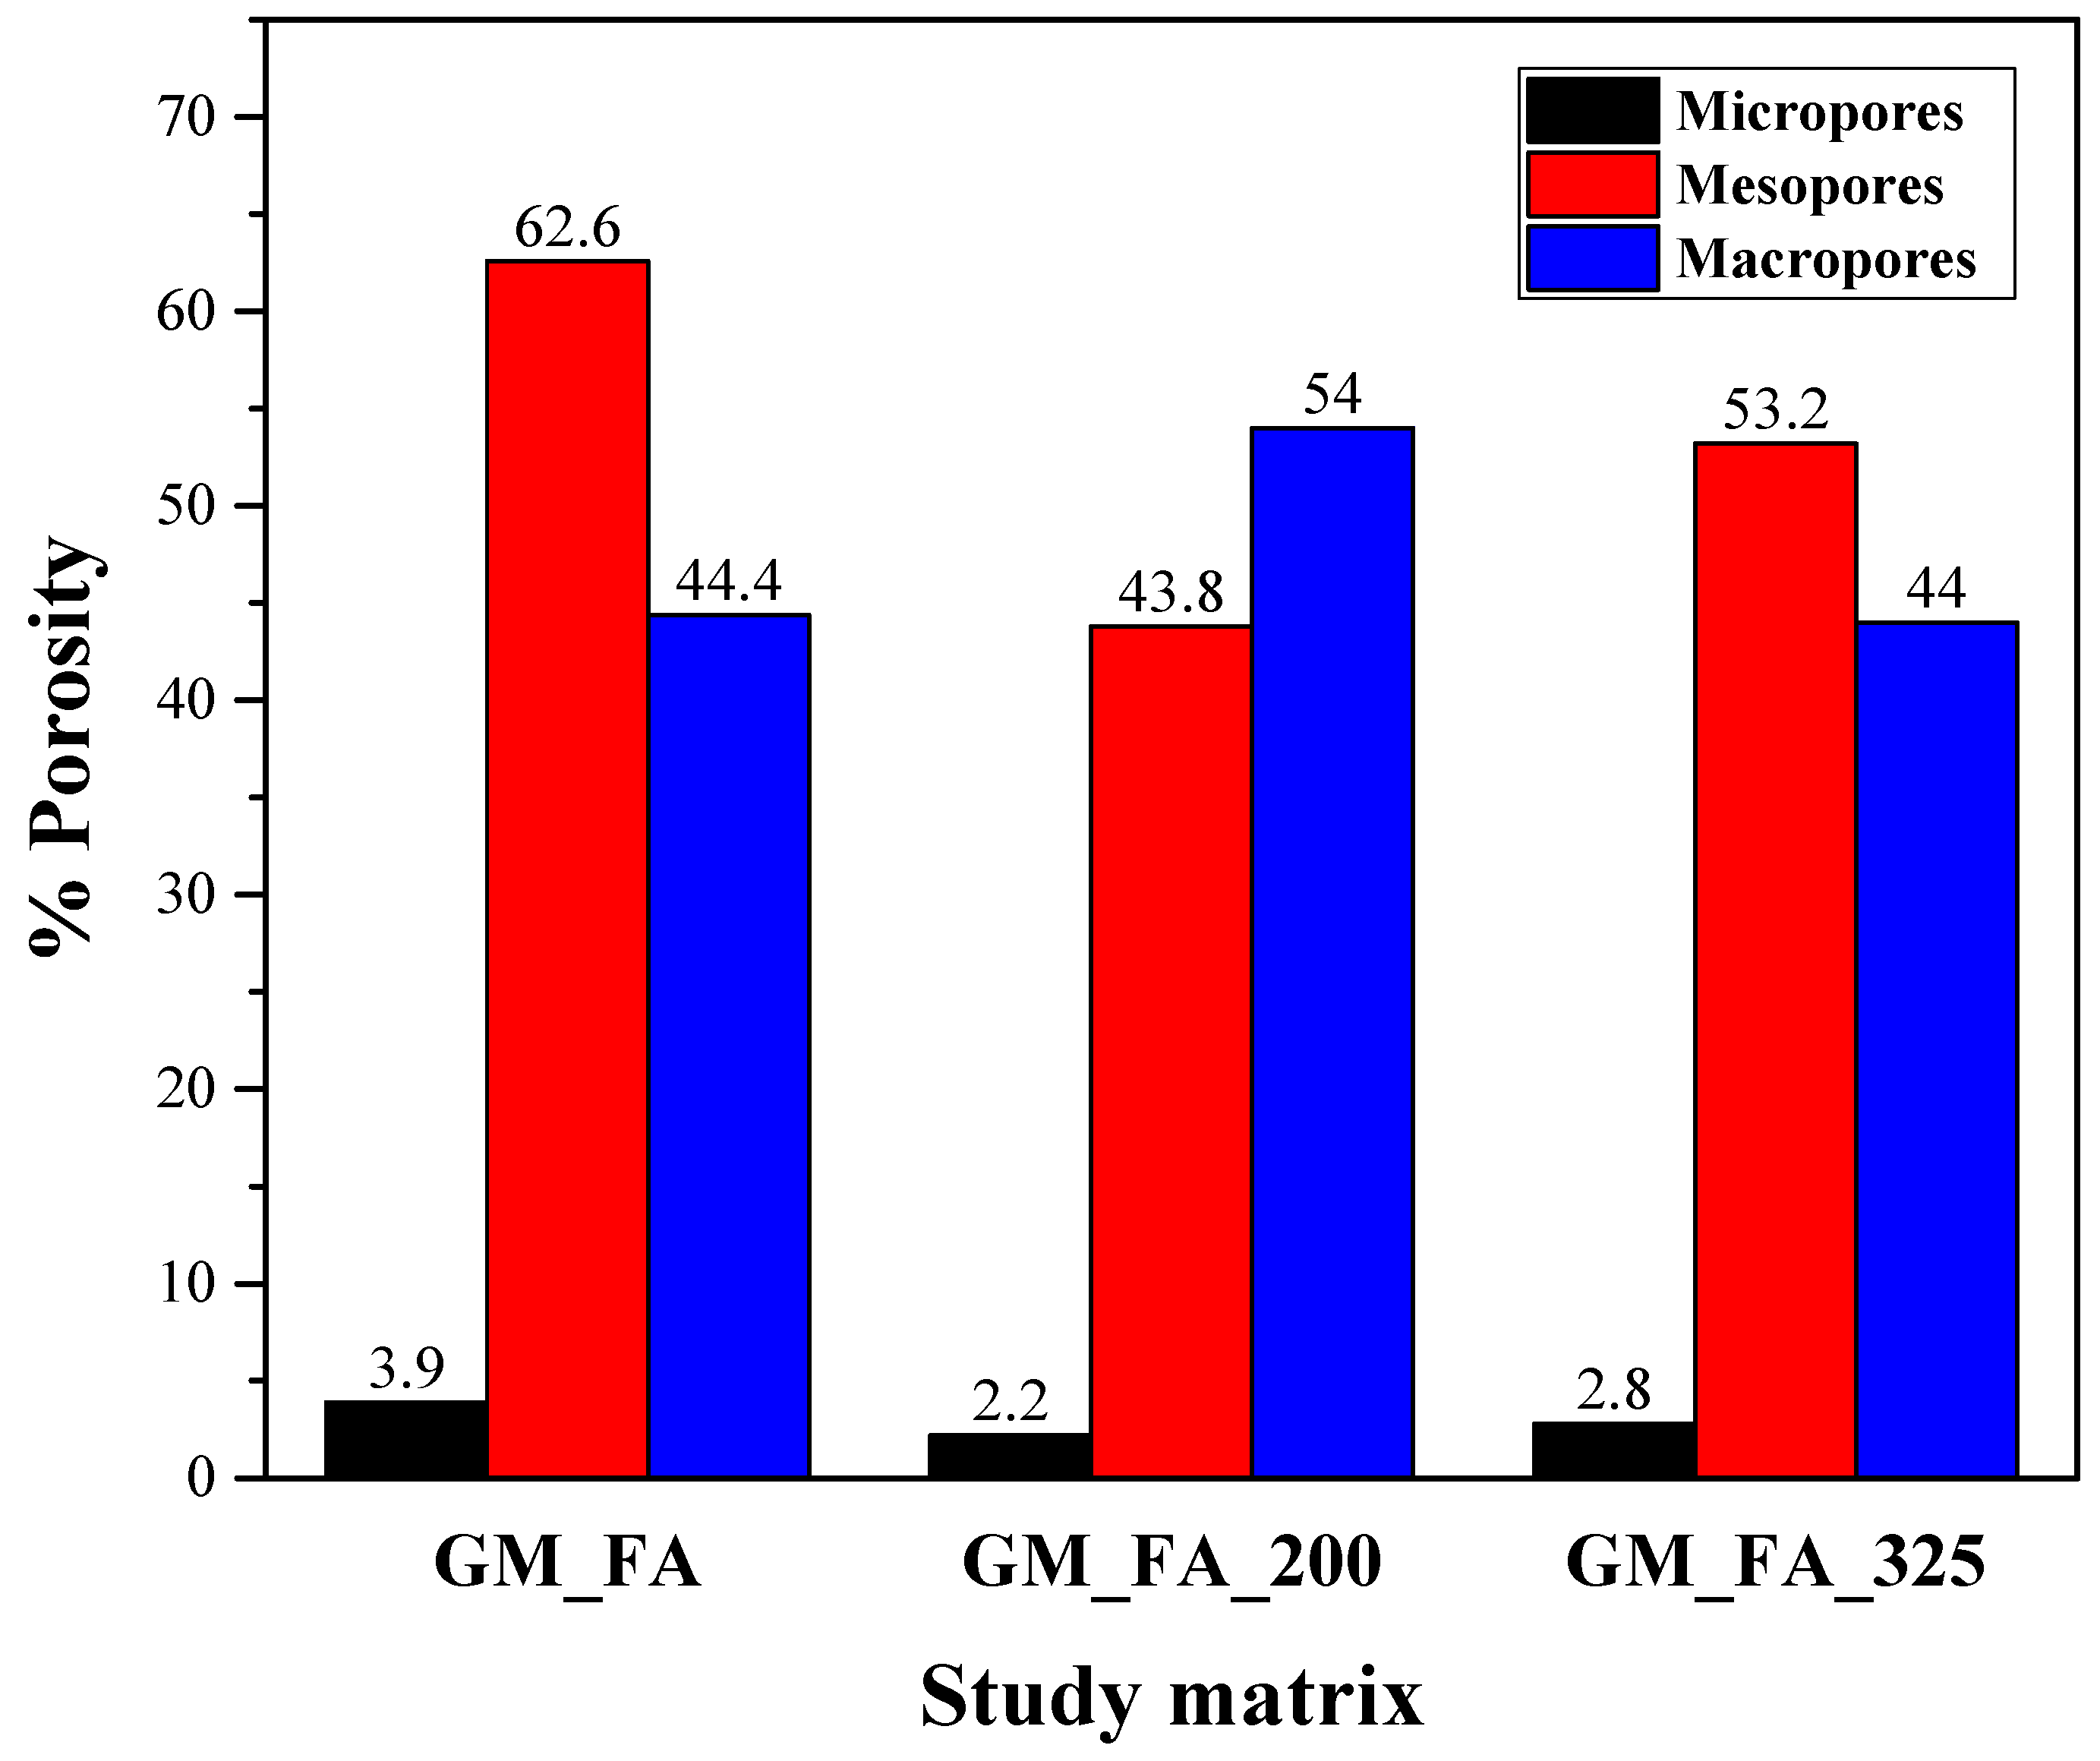
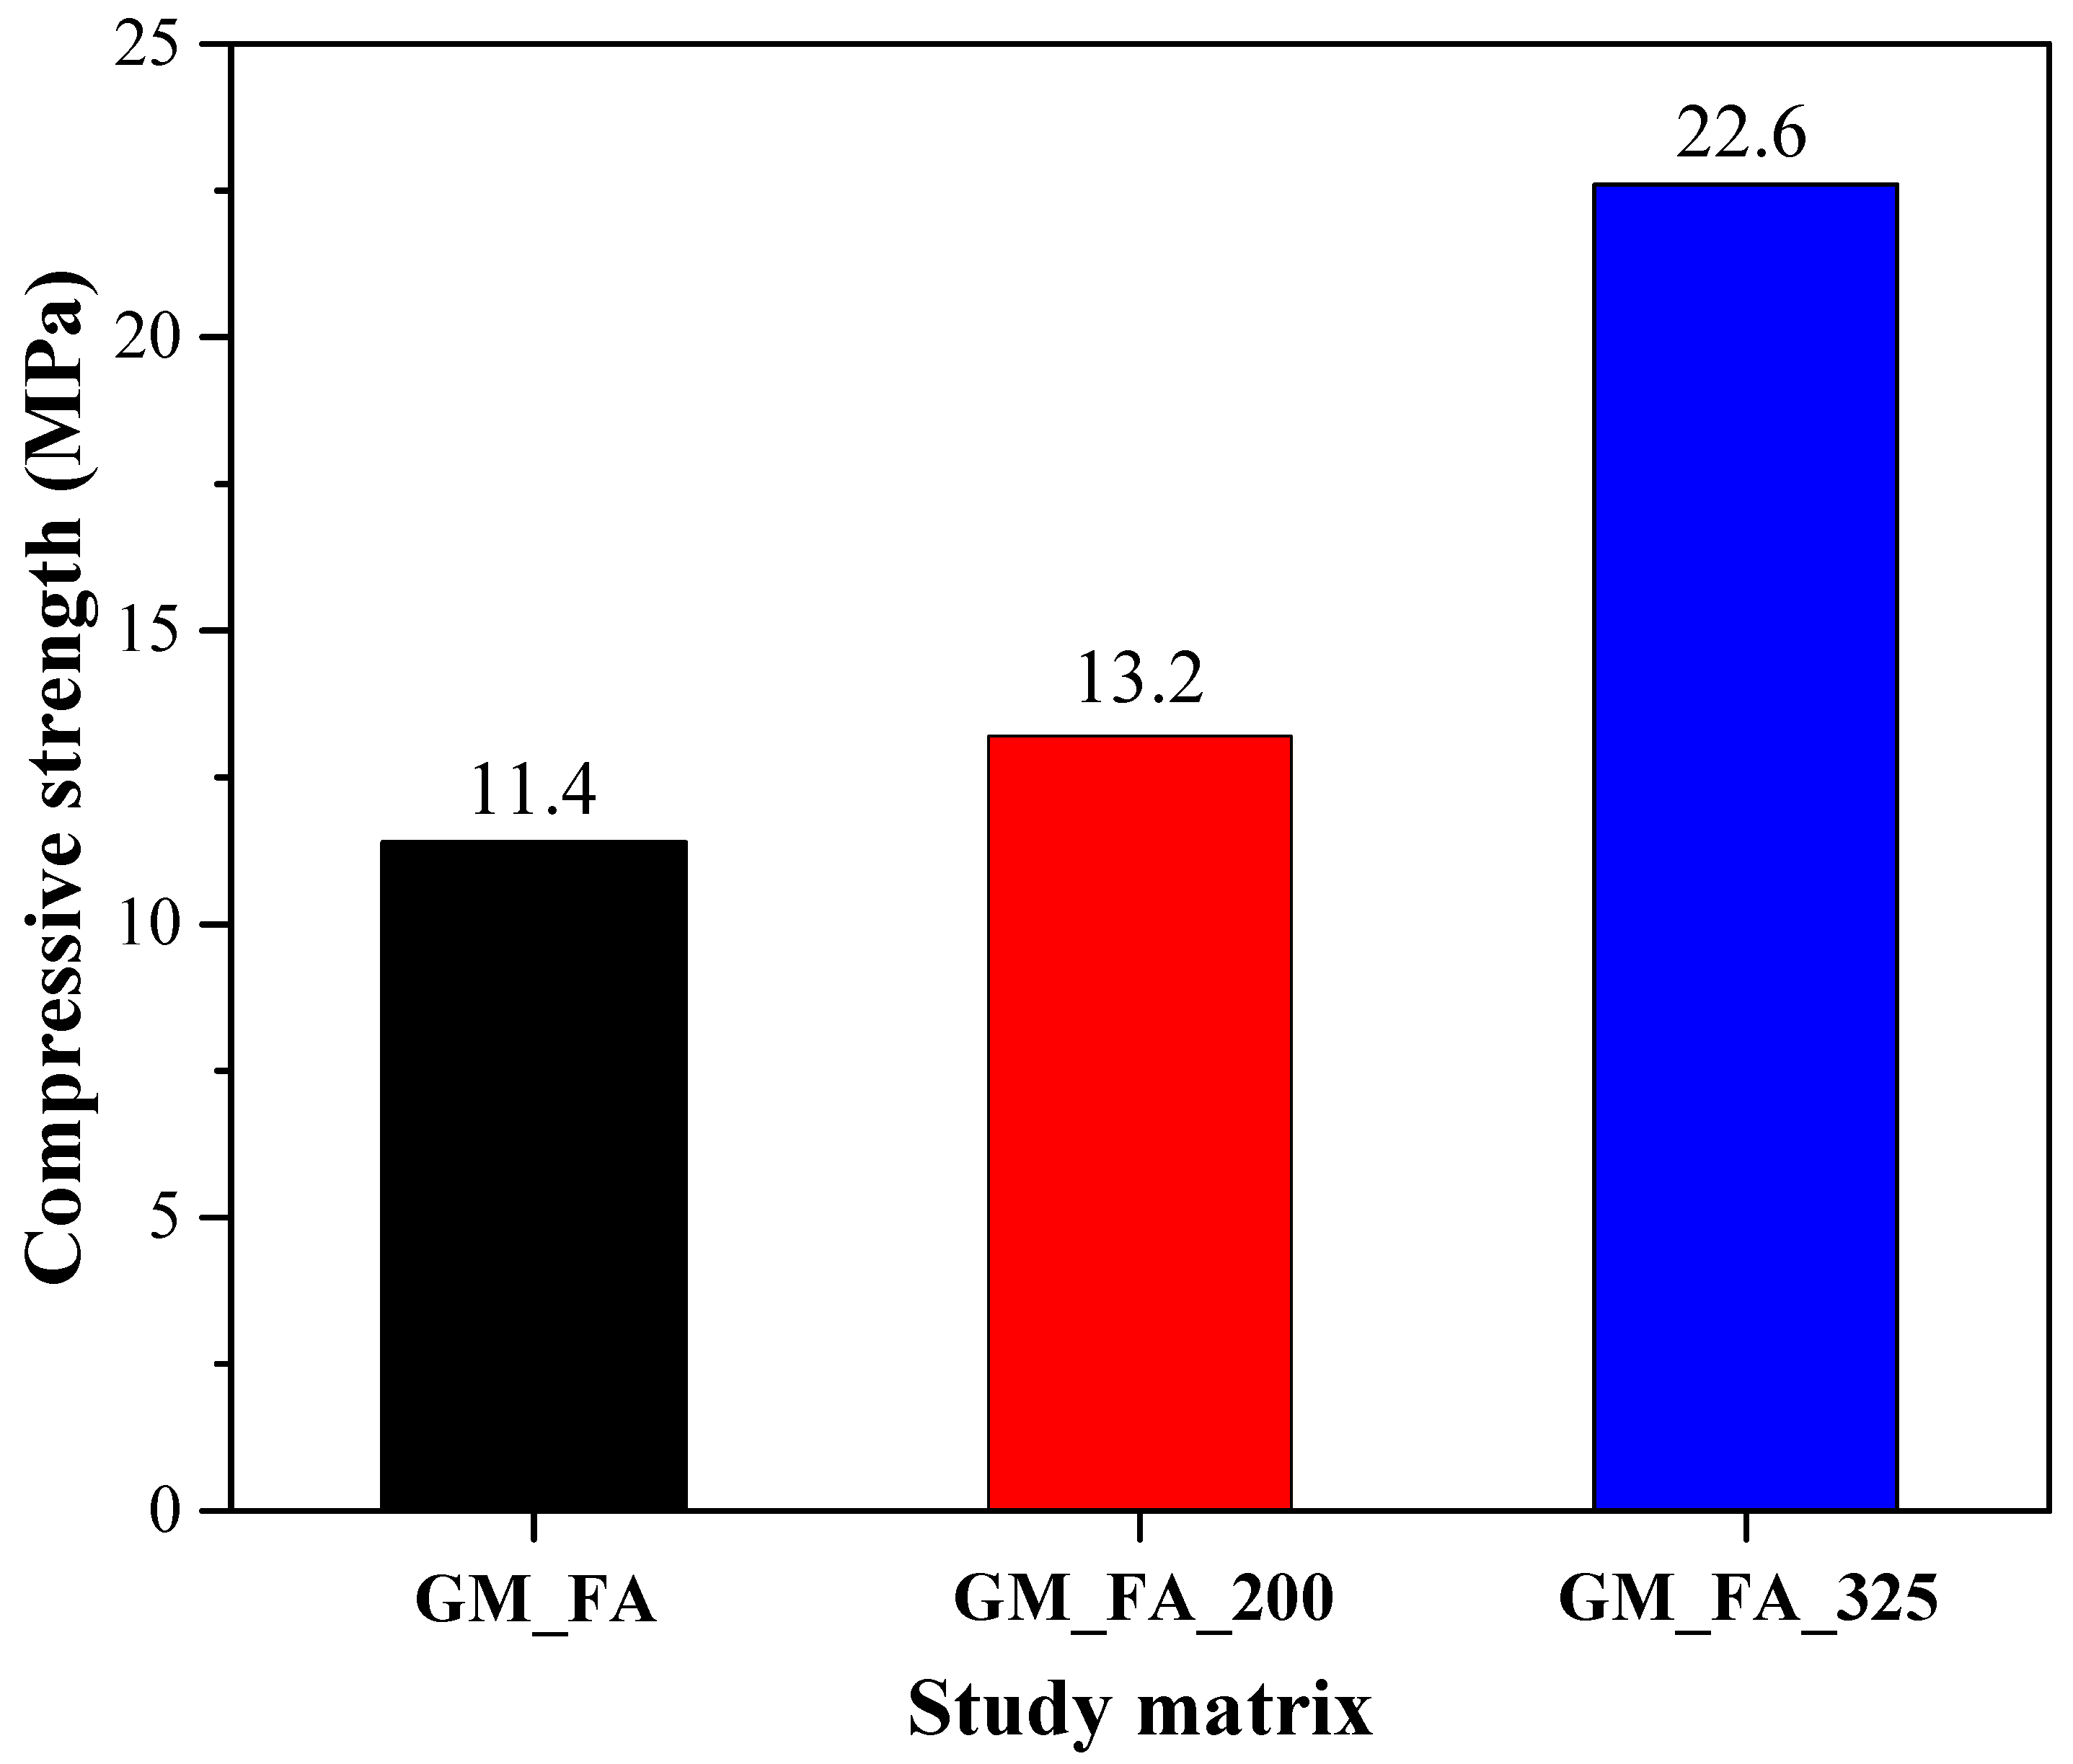
3.2. Physical Adsorption of Gases Analysis and Compressive Strength

A detailed analysis of the GMs was conducted to identify the types of pores present and their main characteristics. According to the IUPAC classification, pores are divided into three categories: micropores (<2 nm), mesopores (2–50 nm), and macropores (>50 nm), based on the distribution of the average pore width [61].
Figure 10 shows that the GMs exhibit similar pore diameter distribution curves across the three studied matrices. The highest pore volume and variability in pore diameters occur within the 2–50 nm range. In the case of the GM_FA matrix, a sudden change in the curve slope is observed within the 2–15 nm diameter range, which is related to an increase in mesoporous structures.
The final total porosity volume determined was similar in GM_FA and GM_FA_200, with values of 0.09 cm3/g and 0.08 cm3/g, respectively. However, GM_FA_325 exhibited a significant reduction in total porosity, with a value of 0.03 cm3/g, approximately one-third of the porosity found in the other mixtures.
This behavior is attributed to the mechanical grinding process applied to FA, which increases the specific surface area of the particles and enhances their reactivity with the alkaline activator. As a result, a higher concentration of N–A–S–H gel is generated, leading to the formation of a more compact, denser, and less porous microstructure compared to samples obtained with unprocessed FA.
This observation is consistent with recent studies documenting that a reduced particle size of fly ash significantly lowers porosity and cracking. As reported by Xiong et al. and Li et al., particle fineness exerts a direct influence on pore structure and mechanical strength, highlighting its relevance in optimizing geopolymer performance [62,63].
These findings highlight the critical role of FA preparation conditions in producing GMs with desirable final properties [64,65].
Figure 11 presents the percentages of pore volume in each type of matrix based on their theoretical diameter categories. The three analyzed matrices show that the majority of their pore diameters are concentrated in the mesopore range, with more than 60% of the total pore volume consisting of pores between 2 and 50 nm.
Notably, GM_FA reaches 70% mesopore volume, compared to GM_FA_200 (57.8%) and GM_FA_325 (60.3%). GM_FA_200 and GM_FA_325 exhibit similar values in the micropore and macropore diameter categories, with differences of less than 5%.
This behavior is clearly visualized in the figure and supports the predominant mesoporous classification across all matrices.
Figure 12 displays the different hysteresis patterns observed in the studied matrices, which are similar to those described by Boer [66]. The identified hysteresis corresponds to H3-type hysteresis, characterized by adsorption and desorption branches with sloped gradients at intermediate relative pressures. This indicates a porous structure with openings at both ends or slit-shaped pores, forming fissure-like pores [61,67,68].
The adsorption isotherms of the analyzed matrices exhibit a similar trend, classifying as type IV isotherms, which suggest a mesoporous nature [61]. These isotherms are characterized by concave curves at low relative pressures, followed by a sharp increase, attributed to the adherence of the first nitrogen gas (N2) layer. This type of isotherm is typical of cementitious solids and mesoporous/macroporous materials [69]. The figure allows for a visual identification of this behavior, highlighting the morphological similarity observed among the three evaluated matrices. The pore distribution in GMs shows irregularity and repetitive patterns at different scales, suggesting a complex porous structure [70,71,72].
Most GMs exhibit mesopores and macropores, with a steep increase in the isotherm near a relative pressure (P/P0) of 1, due to the presence of macropores [61]. The results indicate that GM porosity is primarily concentrated in mesopores and macropores, with GM_FA and GM_FA_325 predominantly composed of mesopores, whereas GM_FA_200 contains a higher proportion of macropores, with approximately 53.2% of its porosity concentrated in the P/P0 > 0.95 region.
These findings are presented in Figure 13, highlighting that the largest proportion of porosity in GMs is found in mesopores and macropores, with minimal presence of micropores. Specifically, GM_FA and GM_FA_325 are mainly composed of mesopores, whereas GM_FA_200 consists primarily of macropores, with around 53.2% of its total porosity in the P/P0 > 0.95 region [73]. The figure visually reinforces this distinction and contributes to a clearer understanding of the correlation between particle size, porosity, and pore types. This relationship is especially relevant given that an in-depth analysis of the pore system and distribution is crucial in this type of material, as ions are transported through this system, which affects and reduces the material’s durability, as well as its mechanical behavior and life cycle [74,75].
Figure 14 illustrates the compressive strength values for the different matrices (11.4 MPa for GM_FA, 13.2 MPa for GM_FA_200, and 22.6 MPa for GM_FA_325), revealing a clear correlation between finer fly ash particle size and improved mechanical performance. This variation is attributed to a higher degree of geopolymerization, resulting in a more compact matrix and reduced porosity in the finest sample [76].
In GM_FA_325, the increased specific surface area enhances the dissolution of aluminosilicates, which in turn promotes a more extensive and continuous formation of the N–A–S–H gel, a key factor in strength development [30]. Similar trends have been reported in other studies, where finer FA particles led to denser and more homogeneous microstructures with lower pore volumes and improved compressive strength [77].
The fact that the matrix with the lowest porosity also achieved the highest compressive strength confirms the strong interrelationship between microstructure and mechanical properties. It also highlights that optimizing the particle size during FA processing is a critical parameter for enhancing both compaction and the reaction degree of the alkaline-activated system [78].

4. Conclusions

This research demonstrates the potential of GMs as a viable and sustainable alternative building material. The analyses performed using statistical image analysis techniques with SEM micrographs and PAG porosimetry confirm relevant characteristics in GMs, such as porosity and a well-defined ITZ between the paste and the aggregate.
In addition, a correlation was observed through the results of both techniques, providing a degree of reliability for their use.
Among the analyzed matrices, GM_FA_325 exhibited the lowest porosity, which is attributed to a higher level of alkaline reaction due to its smaller FA particle size resulting from the grinding process. This phenomenon led to the formation of a more compact matrix and a significant reduction in macroporosity compared to the other studied matrices. The lower porosity observed was corroborated by both techniques employed: image analysis and PAG. This result highlights the potential of image analysis as a complementary and comparable tool to the PAG technique.
Altogether, these results reinforce the hypothesis that reduced porosity not only contributes to higher strength but also reflects a more advanced geopolymerization process.
Image analysis not only provides consistent data on porosity but also offers advantages such as reduced processing time and lower operational costs. Its integration as a complementary method enables more robust and reliable results, optimizing resources and enhancing data interpretation.
The PAG technique allowed the identification of GMs as predominantly mesoporous (2–50 nm), which has direct implications for their physical, chemical, and mechanical properties. This knowledge is fundamental for optimizing the design and application of geopolymeric materials, improving both their performance and sustainability.
This study demonstrates that FA-based geopolymers not only offer a more environmentally friendly solution but also possess competitive physical and chemical properties. However, to maximize their efficiency, further research is needed to explore the influence of parameters such as particle size, activation methods, and curing conditions on their final properties. Additionally, future studies may consider the use of complementary porosity characterization techniques to provide a broader understanding of pore structure and offer further support to image analysis as a reliable tool in geopolymer research.
Considering the characteristics observed in this material, it shows potential for applications as a coating for structural elements and opens the possibility of evaluating its use in prefabricated construction components and thermal insulation materials.

Author Contributions

Investigation and data curation, C.A.R.-C.; software, supervision, R.C.-H., S.P.A.-R., J.M.G.-S. and M.J.C.-C.; visualization, M.J.P.-C., J.M.B.-C. and M.R.-R.; writing—original draft, C.A.R.-C. and S.P.A.-R.; writing—review and editing, S.P.A.-R., J.M.G.-S. and R.C.-H. All authors have read and agreed to the published version of the manuscript. Data curation.

Funding

This research was funded by Fondo Sectorial de Investigación para la Educación SEP-CONACYT, grant number A1-S-15401 for which we are grateful of the current Secretaría de Ciencia, Humanidades, Tecnología e Innovación (SECIHTI) for its support and its doctoral and postdoctoral scholarship program.

Data Availability Statement

The original contributions presented in this study are included in the article. The data generated or analyzed during the study are available from the corresponding author upon reasonable request.

Acknowledgments

The Authors thank the Universidad Autónoma de Sinaloa, Universitat Politècnica de Catalunya, and the Scientific and Technological Centers of the University of Barcelona for their support and availability of resources and equipment.

Conflicts of Interest

The authors declare no conflicts of interest.

References

  1. Ige, O.E.; Von Kallon, D.V.; Desai, D. Carbon Emissions Mitigation Methods for Cement Industry Using a Systems Dynamics Model. Clean Technol. Environ. Policy 2024, 26, 579–597. [Google Scholar]
  2. Nilimaa, J. Smart Materials and Technologies for Sustainable Concrete Construction. Dev. Built Environ. 2023, 15, 100177. [Google Scholar] [CrossRef]
  3. Lehne, J.; Preston, F. Making Concrete Change. Innovation in Low-Carbon Cement and Concrete; Chatham House: London, UK, 2018; Volume 13. [Google Scholar]
  4. Mohamad, N.; Muthusamy, K.; Embong, R.; Kusbiantoro, A.; Hashim, M.H. Environmental Impact of Cement Production and Solutions: A Review. Mater. Today Proc. 2022, 48, 741–746. [Google Scholar] [CrossRef]
  5. Ige, O.E.; Olanrewaju, O.A.; Duffy, K.J.; Obiora, C. A Review of the Effectiveness of Life Cycle Assessment for Gauging Environmental Impacts from Cement Production. J. Clean. Prod. 2021, 324, 129213. [Google Scholar] [CrossRef]
  6. Onyenokporo, N.C. Supplementary Cementitious Materials as Sustainable Partial Replacement for Cement in the Building Industry. Int. J. Archit. Environ. Eng. 2022, 16, 74–84. [Google Scholar]
  7. Fantilli, A.P.; Jóźwiak-Niedźwiedzka, D. Supplementary Cementitious Materials in Concrete, Part I. Materials 2021, 14, 2291. [Google Scholar] [CrossRef]
  8. Assumptor, O.M.; Masika, E.; Thiong’o, K. Probing Optimal Blends of Pozzolans to Develop Supplementary Cementing Material Within Busia County, Kenya. J. Appl. Phys. 2020, 12, 59–69. [Google Scholar]
  9. Zhang, C.S.; Gu, X.S.; Gao, J.; Yang, Y.; Zhu, B.G. Preparation and Mechanical Performance of Supplementary Cementing Materials Cementitious by Electroplating Sludge. In Proceedings of the Key Engineering Materials; Trans Tech Publications: Bäch, Switzerland, 2020; Volume 837, pp. 133–138. [Google Scholar]
  10. Panesar, D.K.; Zhang, R. Performance Comparison of Cement Replacing Materials in Concrete: Limestone Fillers and Supplementary Cementing Materials–A Review. Constr. Build. Mater. 2020, 251, 118866. [Google Scholar] [CrossRef]
  11. Giergiczny, Z. Fly Ash and Slag. Cem. Concr. Res. 2019, 124, 105826. [Google Scholar] [CrossRef]
  12. Klima, K.M.; Schollbach, K.; Brouwers, H.J.H.; Yu, Q. Thermal and Fire Resistance of Class F Fly Ash Based Geopolymers—A Review. Constr. Build. Mater. 2022, 323, 126529. [Google Scholar] [CrossRef]
  13. Abdulrahman, H.; Muhamad, R.; Visintin, P.; Azim Shukri, A. Mechanical Properties and Bond Stress-Slip Behaviour of Fly Ash Geopolymer Concrete. Constr. Build. Mater. 2022, 327, 126909. [Google Scholar] [CrossRef]
  14. Xu, X.; Bao, S.; Guo, Z.; Tian, X. A Clean Approach to High-Strength Fly Ash-Based Geopolymers: Multi-Granular Screening with NaAlO2 Enhancement. J. Clean. Prod. 2024, 464, 142733. [Google Scholar] [CrossRef]
  15. John, S.K.; Nadir, Y.; Girija, K. Effect of Source Materials, Additives on the Mechanical Properties and Durability of Fly Ash and Fly Ash-Slag Geopolymer Mortar: A Review. Constr. Build. Mater. 2021, 280, 122443. [Google Scholar] [CrossRef]
  16. Li, X.; Bai, C.; Qiao, Y.; Wang, X.; Yang, K.; Colombo, P. Preparation, Properties and Applications of Fly Ash-Based Porous Geopolymers: A Review. J. Clean. Prod. 2022, 359, 132043. [Google Scholar] [CrossRef]
  17. Zhuang, X.Y.; Chen, L.; Komarneni, S.; Zhou, C.H.; Tong, D.S.; Yang, H.M.; Yu, W.H.; Wang, H. Fly Ash-Based Geopolymer: Clean Production, Properties and Applications. J. Clean. Prod. 2016, 125, 253–267. [Google Scholar] [CrossRef]
  18. Wattimena, O.K.; Antoni, A.; Hardjito, D. A Review on the Effect of Fly Ash Characteristics and Their Variations on the Synthesis of Fly Ash Based Geopolymer. AIP Conf. Proc. 2017, 1887, 020041. [Google Scholar]
  19. Komljenović, M.; Baščarević, Z.; Bradić, V. Mechanical and Microstructural Properties of Alkali-Activated Fly Ash Geopolymers. J. Hazard. Mater. 2010, 181, 35–42. [Google Scholar] [CrossRef]
  20. Ge, X.; Liu, Y.; Mao, Y.; Hu, X.; Shi, C. Characteristics of Fly Ash-Based Geopolymer Concrete in the Field for 4 Years. Constr. Build. Mater. 2023, 382, 131222. [Google Scholar] [CrossRef]
  21. Soutsos, M.; Boyle, A.P.; Vinai, R.; Hadjierakleous, A.; Barnett, S.J. Factors Influencing the Compressive Strength of Fly Ash Based Geopolymers. Constr. Build. Mater. 2016, 110, 355–368. [Google Scholar] [CrossRef]
  22. Mohammed, A.A.; Ahmed, H.U.; Mosavi, A. Survey of Mechanical Properties of Geopolymer Concrete: A Comprehensive Review and Data Analysis. Materials 2021, 14, 4690. [Google Scholar] [CrossRef]
  23. Nikoloutsopoulos, N.; Sotiropoulou, A.; Kakali, G.; Tsivilis, S. Physical and Mechanical Properties of Fly Ash Based Geopolymer Concrete Compared to Conventional Concrete. Buildings 2021, 11, 178. [Google Scholar] [CrossRef]
  24. Yu, G.; Jia, Y. Microstructure and Mechanical Properties of Fly Ash-Based Geopolymer Cementitious Composites. Minerals 2022, 12, 853. [Google Scholar] [CrossRef]
  25. Payakaniti, P.; Chuewangkam, N.; Yensano, R.; Pinitsoontorn, S.; Chindaprasirt, P. Changes in Compressive Strength, Microstructure and Magnetic Properties of a High-Calcium Fly Ash Geopolymer Subjected to High Temperatures. Constr. Build. Mater. 2020, 265, 120650. [Google Scholar] [CrossRef]
  26. Mortar, N.A.M.; Kamarudin, H.; Rafiza, R.A.; Meor, T.A.F.; Rosnita, M. Compressive Strength of Fly Ash Geopolymer Concrete by Varying Sodium Hydroxide Molarity and Aggregate to Binder Ratio. IOP Conf. Ser. Mater. Sci. Eng. 2020, 864, 012037. [Google Scholar] [CrossRef]
  27. Zeyad, A.M.; Johari, M.A.M.; Abutaleb, A.; Tayeh, B.A. The Effect of Steam Curing Regimes on the Chloride Resistance and Pore Size of High–Strength Green Concrete. Constr. Build. Mater. 2021, 280, 122409. [Google Scholar] [CrossRef]
  28. Luhar, I.; Luhar, S. A Comprehensive Review on Fly Ash-Based Geopolymer. J. Compos. Sci. 2022, 6, 219. [Google Scholar] [CrossRef]
  29. Aghajanian Sabbagh, A.; Cimentada Hernández, A.I.; Fayyaz, M.; Brand, A.S. Thomas García Emerging Material for Sustainable Construction. Constr. Build. Mater. 2014, 56, 113–127. [Google Scholar]
  30. Ziejewska, C.; Grela, A.; Hebda, M. Influence of Waste Glass Particle Size on the Physico-Mechanical Properties and Porosity of Foamed Geopolymer Composites Based on Coal Fly Ash. Materials 2023, 16, 2044. [Google Scholar] [CrossRef]
  31. Liu, R.; Chi, Y.; Chen, S.; Jiang, Q.; Meng, X.; Wu, K.; Li, S. Influence of Pore Structure Characteristics on the Mechanical and Durability Behavior of Pervious Concrete Material Based on Image Analysis. Int. J. Concr. Struct. Mater. 2020, 14, 29. [Google Scholar] [CrossRef]
  32. Chinchillas-Chinchillas, M.J.; Rosas-Casarez, C.A.; Arredondo-Rea, S.P.; Gómez-Soberón, J.M.; Corral-Higuera, R. SEM Image Analysis in Permeable Recycled Concretes with Silica Fume. A Quantitative Comparison of Porosity and the ITZ. Materials 2019, 12, 2201. [Google Scholar] [CrossRef]
  33. Zarębska, K.; Szczurowski, J.; Gazda-Grzywacz, M.; Wróbel, W.; Bator, J.; Baran, P. Geopolymer Building Materials Based on Fly Ash in Terms of Removing SO2, CO2, and Water Vapor. Energies 2023, 16, 5188. [Google Scholar] [CrossRef]
  34. Gunasekara, C.; Law, D.W.; Setunge, S. Long Term Permeation Properties of Different Fly Ash Geopolymer Concretes. Constr. Build. Mater. 2016, 124, 352–362. [Google Scholar] [CrossRef]
  35. Zhang, P.; Han, X.; Guo, J.; Zhang, H. Fractal Characteristics of Geopolymer Mortar Containing Municipal Solid Waste Incineration Fly Ash and Its Correlations to Pore Structure and Strength. Fractal Fract. 2022, 6, 676. [Google Scholar] [CrossRef]
  36. Benavente, D.; Such-Basañez, I.; Fernandez-Cortes, A.; Pla, C.; Cazorla-Amoros, D.; Cañaveras, J.C.; Sanchez-Moral, S. Comparative Analysis of Water Condensate Porosity Using Mercury Intrusion Porosimetry and Nitrogen and Water Adsorption Techniques in Porous Building Stones. Constr. Build. Mater. 2021, 288, 123131. [Google Scholar] [CrossRef]
  37. Rosas-Casarez, C.A.; Arredondo-Rea, S.P.; Cruz-Enríquez, A.; Corral-Higuera, R.; Pellegrini-Cervantes, M.d.J.; Gómez-Soberón, J.M.; Medina-Serna, T.d.J. Influence of Size Reduction of Fly Ash Particles by Grinding on the Chemical Properties of Geopolymers. Appl. Sci. 2018, 8, 365. [Google Scholar] [CrossRef]
  38. ASTM C33; ASTM C33 Standard Specifications for Concrete Aggregates. ASTM: West Conshohocken, PA, USA, 2003.
  39. Aghajanian Sabbagh, A.; Cimentada Hernández, A.I.; Fayyaz, M.; Brand, A.S.; Thomas García, C. ITZ Microanalysis of Cement-Based Building Materials with Incorporation of Siderurgical Aggregates. J. Build. Eng. 2023, 67, 106008. [Google Scholar] [CrossRef]
  40. Waris, M.I.; Plevris, V.; Mir, J.; Chairman, N.; Ahmad, A. An Alternative Approach for Measuring the Mechanical Properties of Hybrid Concrete through Image Processing and Machine Learning. Constr. Build. Mater. 2022, 328, 126899. [Google Scholar] [CrossRef]
  41. Lloyd, R.R.; Provis, J.L.; Van Deventer, J.S.J. Microscopy and Microanalysis of Inorganic Polymer Cements. 1: Remnant Fly Ash Particles. J. Mater. Sci. 2009, 44, 608–619. [Google Scholar] [CrossRef]
  42. Zailani, W.W.A.; Abdullah, M.M.A.; Arshad, M.F.; Burduhos-Nergis, D.D.; Tahir, M.F.M. Effect of Iron Oxide (Fe2O3) on the Properties of Fly Ash Based Geopolymer. IOP Conf. Ser. Mater. Sci. Eng. 2020, 877, 012017. [Google Scholar] [CrossRef]
  43. Lyu, K.; She, W.; Chang, H.; Gu, Y. Effect of Fine Aggregate Size on the Overlapping of Interfacial Transition Zone (ITZ) in Mortars. Constr. Build. Mater. 2020, 248, 118559. [Google Scholar] [CrossRef]
  44. Gualtieri, M.L.; Cavallini, A.; Romagnoli, M. Interactive Powder Mixture Concept for the Preparation of Geopolymers with Fine Porosity. J. Eur. Ceram. Soc. 2016, 36, 2641–2646. [Google Scholar] [CrossRef]
  45. Masi, G.; Rickard, W.D.A.; Vickers, L.; Bignozzi, M.C.; Van Riessen, A. A Comparison between Different Foaming Methods for the Synthesis of Light Weight Geopolymers. Ceram. Int. 2014, 40, 13891–13902. [Google Scholar] [CrossRef]
  46. Diamond, S. Considerations in Image Analysis as Applied to Investigations of the ITZ in Concrete. Cem. Concr. Compos. 2001, 23, 171–178. [Google Scholar] [CrossRef]
  47. Head, M.K.; Buenfeld, N.R. Measurement of Aggregate Interfacial Porosity in Complex, Multi-Phase Aggregate Concrete: Binary Mask Production Using Backscattered Electron, and Energy Dispersive X-Ray Images. Cem. Concr. Res. 2006, 36, 337–345. [Google Scholar] [CrossRef]
  48. Kapadia, H.; Soneji, N.; Rotti, A.; Patel, P.V.; Patel, J.B. Monitoring and Analysis of Surface Cracks in Concrete Using Convolutional Neural Network. In Proceedings of the International Conference on Structural Engineering and Construction Management; Springer: Berlin/Heidelberg, Germany, 2022; pp. 1215–1228. [Google Scholar]
  49. Yang, S.; Braham, A. R-Curves Characterisation Analysis for Asphalt Concrete. Int. J. Pavement Eng. 2018, 19, 99–108. [Google Scholar] [CrossRef]
  50. Diamond, S.; Huang, J. The ITZ in Concrete–a Different View Based on Image Analysis and SEM Observations. Cem. Concr. Compos. 2001, 23, 179–188. [Google Scholar] [CrossRef]
  51. Alanazi, H. Study of the Interfacial Transition Zone Characteristics of Geopolymer and Conventional Concretes. Gels 2022, 8, 105. [Google Scholar] [CrossRef]
  52. Golewski, G.L. Evaluation of Morphology and Size of Cracks of the Interfacial Transition Zone (ITZ) in Concrete Containing Fly Ash (FA). J. Hazard. Mater. 2018, 357, 298–304. [Google Scholar] [CrossRef]
  53. Ren, X.; Zhang, L. Experimental Study of Interfacial Transition Zones between Geopolymer Binder and Recycled Aggregate. Constr. Build. Mater. 2018, 167, 749–756. [Google Scholar] [CrossRef]
  54. Singh, B.; Rahman, M.R.; Paswan, R.; Bhattacharyya, S.K. Effect of Activator Concentration on the Strength, ITZ and Drying Shrinkage of Fly Ash/Slag Geopolymer Concrete. Constr. Build. Mater. 2016, 118, 171–179. [Google Scholar] [CrossRef]
  55. Aughenbaugh, K.L.; Stutzman, P.; Juenger, M.C.G. Assessment of the Glassy Phase Reactivity in Fly Ashes Used for Geopolymer Cements. Geopolym. Bind. Syst. 2013, 1566, 11–20. [Google Scholar]
  56. Sun, Q.; Zhao, S.; Zhao, X.; Song, Y.; Ban, X.; Zhang, N. Influence of Different Grinding Degrees of Fly Ash on Properties and Reaction Degrees of Geopolymers. PLoS ONE 2023, 18, e0282927. [Google Scholar] [CrossRef] [PubMed]
  57. Debnath, K.; Das, D.; Rout, P.K. Effect of Mechanical Milling of Fly Ash Powder on Compressive Strength of Geopolymer. Mater. Today Proc. 2022, 68, 242–249. [Google Scholar] [CrossRef]
  58. Peng, H.; Cui, C.; Cai, C.S.; Liu, Y.; Liu, Z. Microstructure and Microhardness Property of the Interface between a Metakaolin/GGBFS-Based Geopolymer Paste and Granite Aggregate. Constr. Build. Mater. 2019, 221, 263–273. [Google Scholar] [CrossRef]
  59. Rangaraju, P.R.; Olek, J.; Diamond, S. An Investigation into the Influence of Inter-Aggregate Spacing and the Extent of the ITZ on Properties of Portland Cement Concretes. Cem. Concr. Res. 2010, 40, 1601–1608. [Google Scholar] [CrossRef]
  60. Luo, Z.; Li, W.; Wang, K.; Castel, A.; Shah, S.P. Comparison on the Properties of ITZs in Fly Ash-Based Geopolymer and Portland Cement Concretes with Equivalent Flowability. Cem. Concr. Res. 2021, 143, 106392. [Google Scholar] [CrossRef]
  61. Sing, K.S.W. Reporting Physisorption Data for Gas/Solid Systems with Special Reference to the Determination of Surface Area and Porosity (Recommendations 1984). Pure Appl. Chem. 1985, 57, 603–619. [Google Scholar] [CrossRef]
  62. Xiong, L.; Wan, Z.; Zhang, Y.; Wang, F.; Wang, J.; Kang, Y. Fly Ash Particle Size Effect on Pore Structure and Strength of Fly Ash Foamed Geopolymer. Adv. Polym. Technol. 2019, 2019, 1098027. [Google Scholar] [CrossRef]
  63. Li, Y.; Dong, Y.; El-Naggar, M.R.; Wang, F.; Zhao, Y. The Influence of Particle Size and Calcium Content on Performance Characteristics of Metakaolin-and Fly-Ash-Based Geopolymer Gels. Gels 2024, 10, 639. [Google Scholar] [CrossRef]
  64. Su, L.; Fu, G.; Liang, B.; Sun, Q.; Zhang, X. Mechanical Properties and Microstructure Evaluation of Fly Ash-Slag Geopolymer Foaming Materials. Ceram. Int. 2022, 48, 18224–18237. [Google Scholar] [CrossRef]
  65. Chen, K.; Lin, W.-T.; Liu, W. Effect of NaOH Concentration on Properties and Microstructure of a Novel Reactive Ultra-Fine Fly Ash Geopolymer. Adv. Powder Technol. 2021, 32, 2929–2939. [Google Scholar] [CrossRef]
  66. De Boer, J.H. The Structure and Properties of Porous Materials; Butterworths: London, UK, 1958. [Google Scholar]
  67. Keluo, C.; Zhang, T.; Xiaohui, C.; Yingjie, H.E.; Liang, X. Model Construction of Micro-Pores in Shale: A Case Study of Silurian Longmaxi Formation Shale in Dianqianbei Area, SW China. Pet. Explor. Dev. 2018, 45, 412–421. [Google Scholar]
  68. Martín Martínez, J.M. Generalidades Sobre Adsorción Física de Gases y Vapores En Carbones. In Adsorción Física de Gases y Vapores por Carbones; Universidad de Alicante: Alicante, Spain, 1990; p. 42. [Google Scholar]
  69. Seifi, S.; Levacher, D.; Razakamanantsoa, A.; Sebaibi, N. Microstructure of Dry Mortars without Cement: Specific Surface Area, Pore Size and Volume Distribution Analysis. Appl. Sci. 2023, 13, 5616. [Google Scholar] [CrossRef]
  70. Zhang, S.; Tang, S.; Tang, D.; Huang, W.; Pan, Z. Determining Fractal Dimensions of Coal Pores by FHH Model: Problems and Effects. J. Nat. Gas Sci. Eng. 2014, 21, 929–939. [Google Scholar] [CrossRef]
  71. Xu, L.; Zhang, J.; Ding, J.; Liu, T.; Shi, G.; Li, X.; Dang, W.; Cheng, Y.; Guo, R. Pore Structure and Fractal Characteristics of Different Shale Lithofacies in the Dalong Formation in the Western Area of the Lower Yangtze Platform. Minerals 2020, 10, 72. [Google Scholar] [CrossRef]
  72. Friesen, W.I.; Mikula, R.J. Fractal Dimensions of Coal Particles. J. Colloid Interface Sci. 1987, 120, 263–271. [Google Scholar] [CrossRef]
  73. Zhang, L.; Lu, S.; Xiao, D.; Gu, M. Characterization of Full Pore Size Distribution and Its Significance to Macroscopic Physical Parameters in Tight Glutenites. J. Nat. Gas Sci. Eng. 2017, 38, 434–449. [Google Scholar] [CrossRef]
  74. Gaurav, G.; Kandpal, S.C.; Mishra, D.; Kotoky, N. A Comprehensive Review on Fly Ash-Based Geopolymer: A Pathway for Sustainable Future. J. Sustain. Cem. Mater. 2024, 13, 100–144. [Google Scholar] [CrossRef]
  75. Pradhan, P.; Dwibedy, S.; Pradhan, M.; Panda, S.; Panigrahi, S.K. Durability Characteristics of Geopolymer Concrete-Progress and Perspectives. J. Build. Eng. 2022, 59, 105100. [Google Scholar] [CrossRef]
  76. Aziz, I.H.A.; Abdullah, M.M.A.B.; Razak, R.A.; Yahya, Z.; Salleh, M.A.A.M.; Chaiprapa, J.; Rojviriya, C.; Vizureanu, P.; Sandu, A.V.; Tahir, M.F. Mechanical Performance, Microstructure, and Porosity Evolution of Fly Ash Geopolymer after Ten Years of Curing Age. Materials 2023, 16, 1096. [Google Scholar] [CrossRef]
  77. Sharma, P.K.; Singh, J.P.; Kumar, A. Effect of Particle Size on Physical and Mechanical Properties of Fly Ash Based Geopolymers. Trans. Indian Inst. Met. 2019, 72, 1323–1337. [Google Scholar] [CrossRef]
  78. Jaya, N.A.; Yun-Ming, L.; Cheng-Yong, H.; Abdullah, M.M.A.B.; Hussin, K. Correlation between Pore Structure, Compressive Strength and Thermal Conductivity of Porous Metakaolin Geopolymer. Constr. Build. Mater. 2020, 247, 118641. [Google Scholar] [CrossRef]
Figure 1. BSE micrograph at 500X magnification selected for mask creation: (a) GM_FA, (b) GM_FA_200, and (c) GM_FA_325.
Buildings 15 02353 g001
Figure 2. (a) Micrograph of GM_FA, (b) porosity in GM_FA, (c) unreacted material in GM_FA, (d) micrograph of GM_FA_200, (e) porosity in GM_FA_200, (f) unreacted material in GM_FA_200, (g) micrograph of GM_FA_325, (h) porosity in GM_FA_325 and (i) unreacted material in GM_FA_325. Note: Red color in (b,e,h) represent porosity; red areas in (c,f,i) correspond to unreacted material.
Buildings 15 02353 g002
Figure 3. Process for obtaining the paste-aggregate mask: (ac) Elemental silicon analysis and (df) paste (red color)-aggregate mask (black color).
Buildings 15 02353 g003
Figure 4. Evaluation of porosity in GM at different ITZ thicknesses: (ad) Porosity in GM_FA; (eh) porosity in GM_FA_200 and (il) porosity in GM_FA_325.
Buildings 15 02353 g004
Figure 5. Identification of ITZ thicknesses and transition path: (a) GM_FA, (b) GM_FA_200, and (c) GM_FA_325.
Buildings 15 02353 g005
Figure 6. Total porosity, unreacted material, and degree of geopolymerization in the different geopolymer studied.
Buildings 15 02353 g006
Figure 7. Porosity percentages for different analyzed ITZ thicknesses in relation to the total porosity of the geopolymer matrix.
Buildings 15 02353 g007
Figure 8. (a) Porosity percentages in each ITZ relative to the total paste area and (b) unreacted material in the ITZ relative to the total paste area.
Buildings 15 02353 g008
Figure 9. (a) Porosity percentage in the ITZ relative to its area and (b) unreacted products in the ITZ relative to its area.
Buildings 15 02353 g009
Figure 10. Cumulative volume in relation to the average pore width.
Buildings 15 02353 g010
Figure 11. Porosity distribution of GMs based on pore size: micropores (<2 nm), mesopores (2–50 nm), and macropores (>50 nm).
Buildings 15 02353 g011
Figure 12. Typical isotherms of GM_FA, GM_FA_200, and GM_FA_325.
Buildings 15 02353 g012
Figure 13. Porosity distribution as a function of pore types and relative pressure: micropores (0–0.1 P/P0), mesopores (0.1–0.95 P/P0), and macropores (0.95–1 P/P0).
Buildings 15 02353 g013
Figure 14. Compressive strength of GMs at 28 days.
Buildings 15 02353 g014
Table 1. Chemical composition of FA.
CompositionSiO2Al2O3Fe2O3CaOMgOK2ONa2OSO3TiO2LOI *
% by weight56.926.245.564.250.721.210.3460.711.212.47
* Loss on ignition.
Table 2. Description of GM mixtures.
DesignationSieve Grinding MethodNaOHNaOH/FA RatioSilica SandThermal TreatmentCuring Time
GM_FA--8 M0.4Present80 °C, 24 h, 90% RH28 days
GM_FA_200#200Mechanical8 M0.4Present80 °C, 24 h, 90% RH28 days
GM_FA_325#325Mechanical8 M0.4Present80 °C, 24 h, 90% RH28 days
Disclaimer/Publisher’s Note: The statements, opinions and data contained in all publications are solely those of the individual author(s) and contributor(s) and not of MDPI and/or the editor(s). MDPI and/or the editor(s) disclaim responsibility for any injury to people or property resulting from any ideas, methods, instructions or products referred to in the content.

