
Modulus of Elasticity and Mechanical Properties Assessment of Historical Masonry Elements After Elevated Temperature: Experimental Study and Numerical Analysis


Abstract
1. Introduction
2. Materials and Methods
2.1. Hydraulic Lime-Based Mortar, Brick, and Masonry Prisms
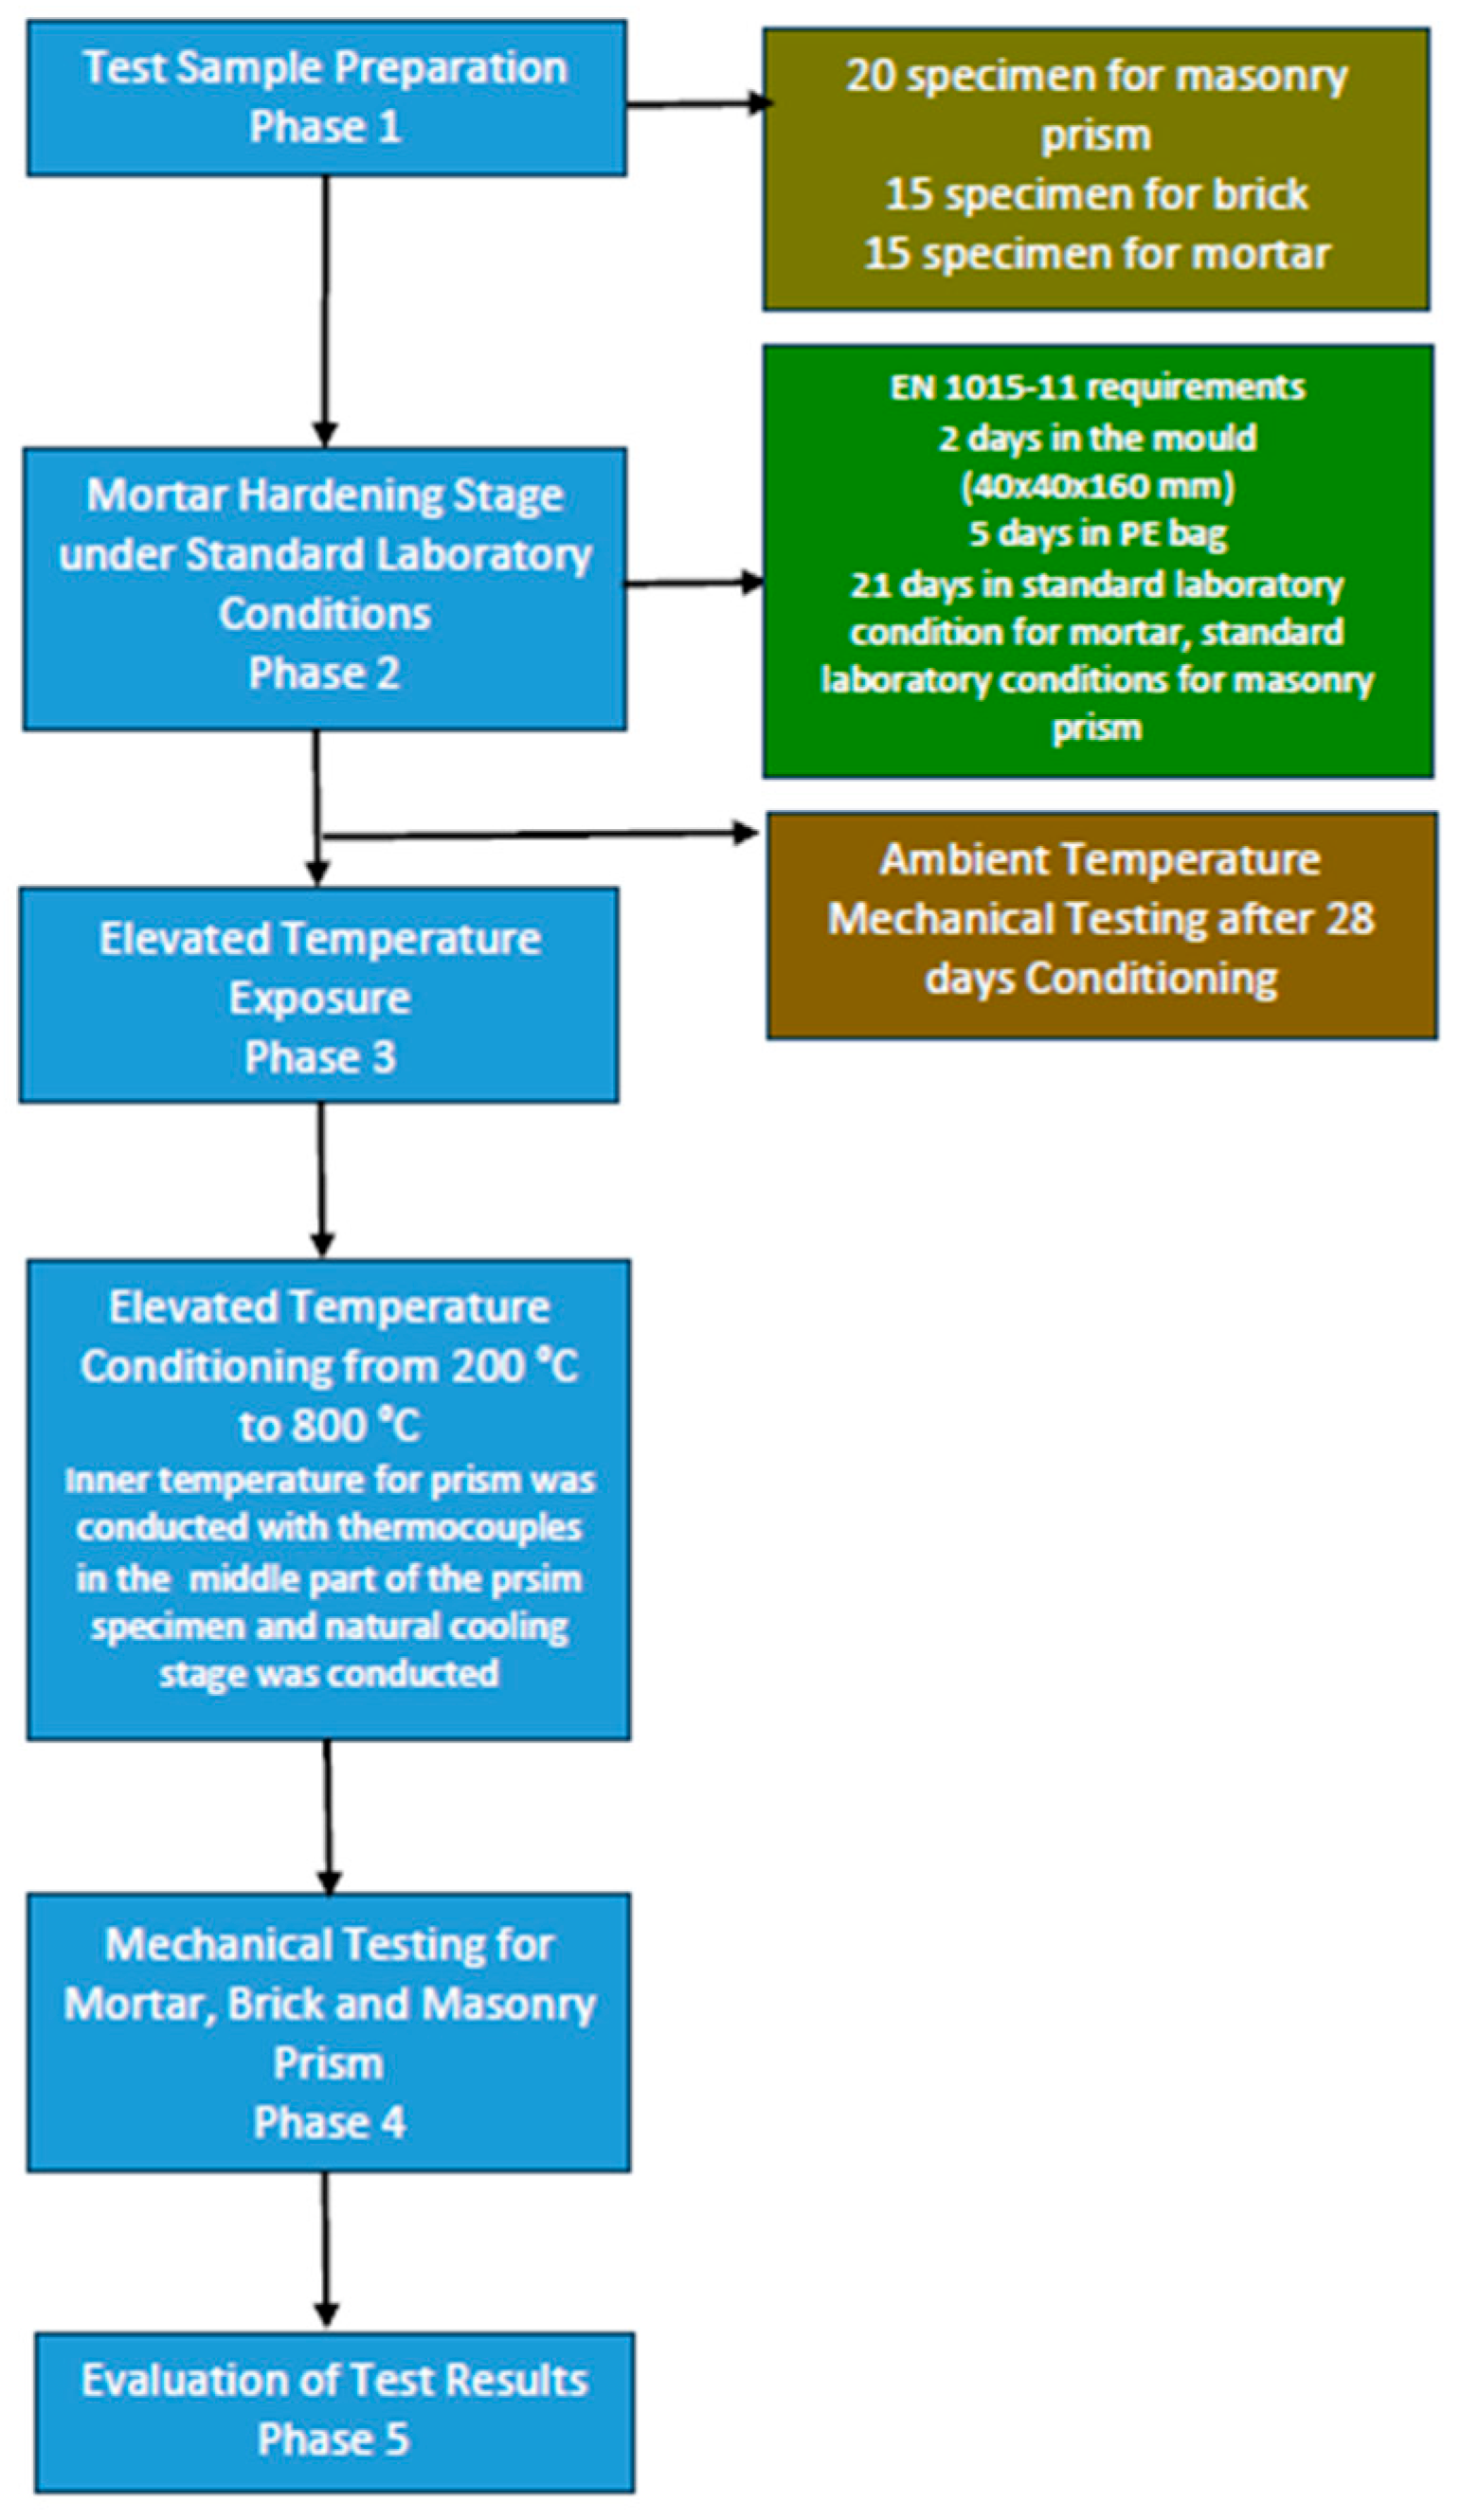
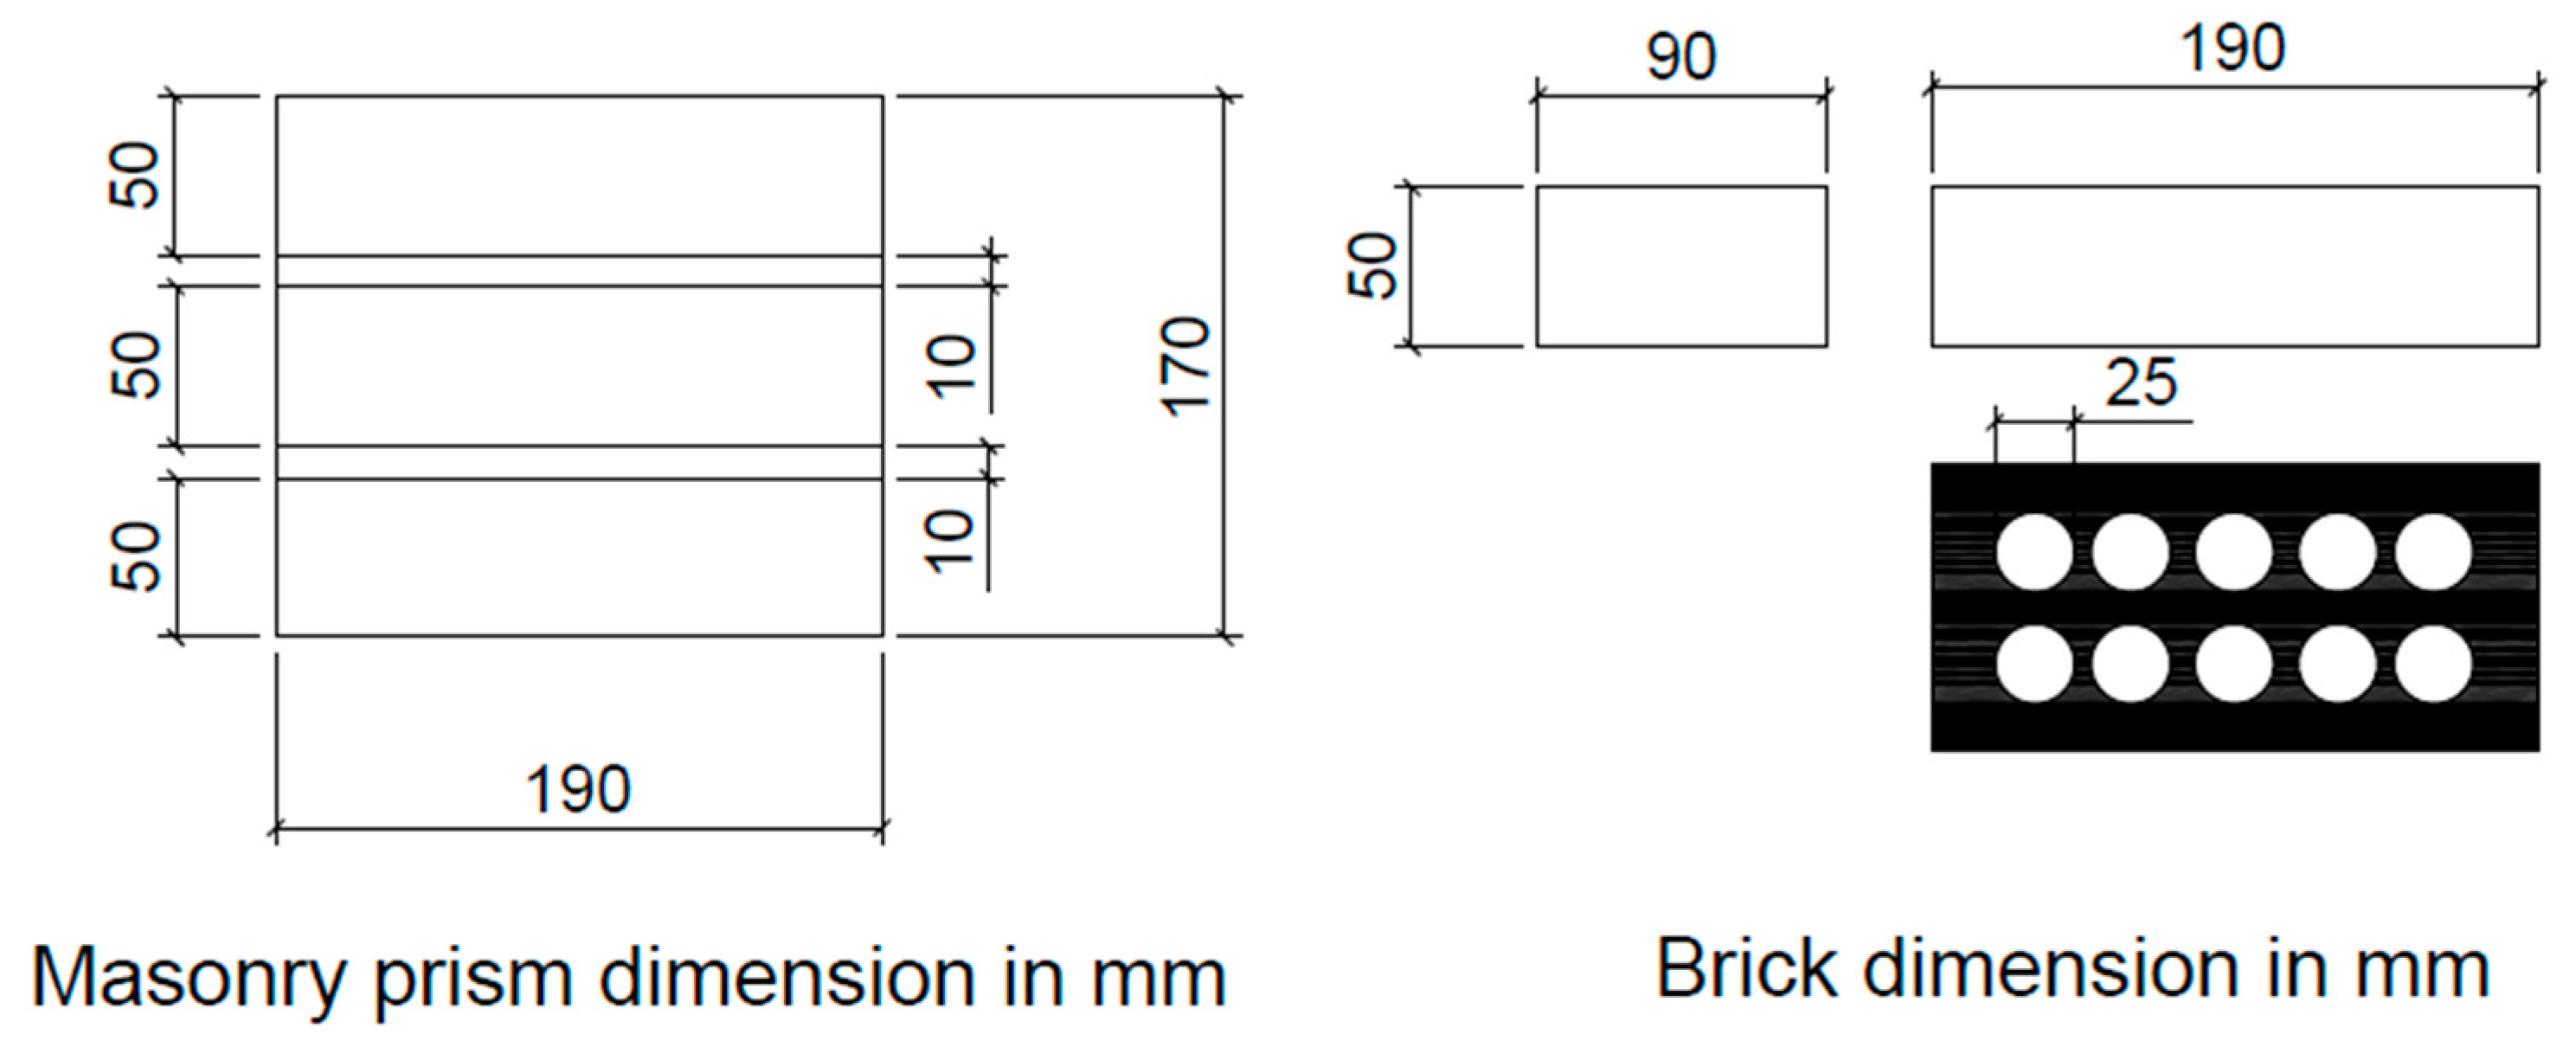
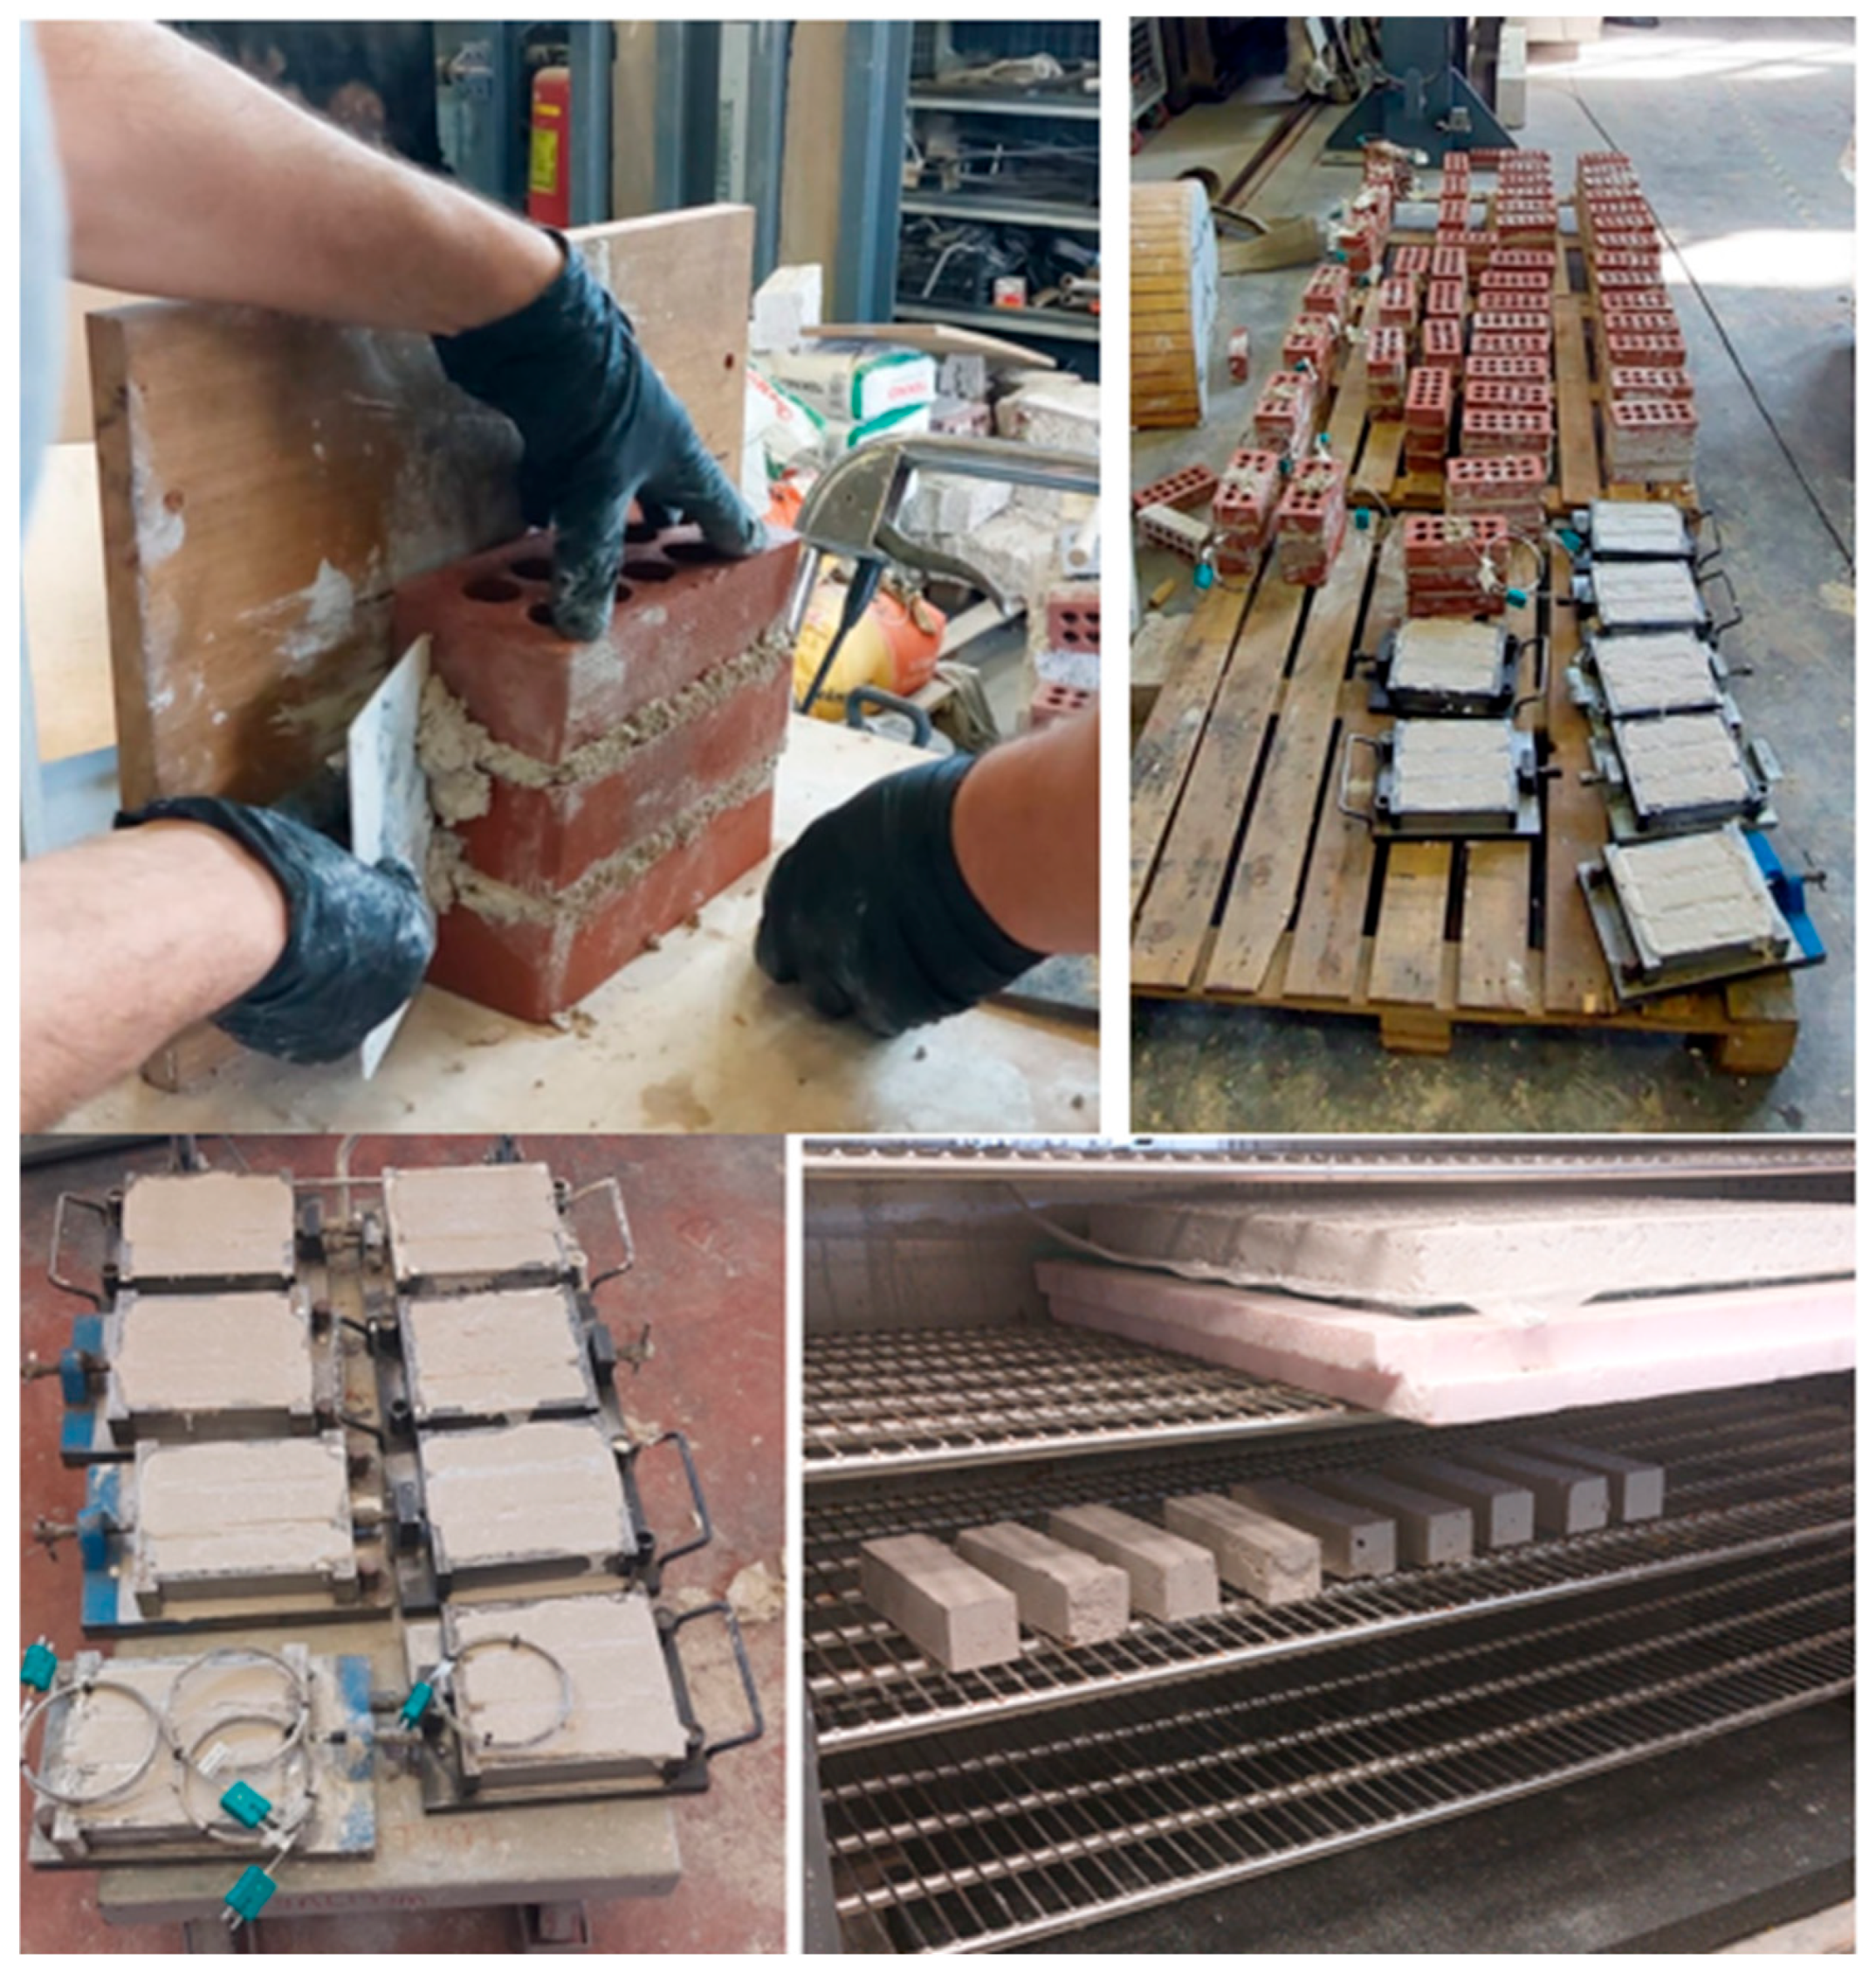
2.2. Preparation of Specimens
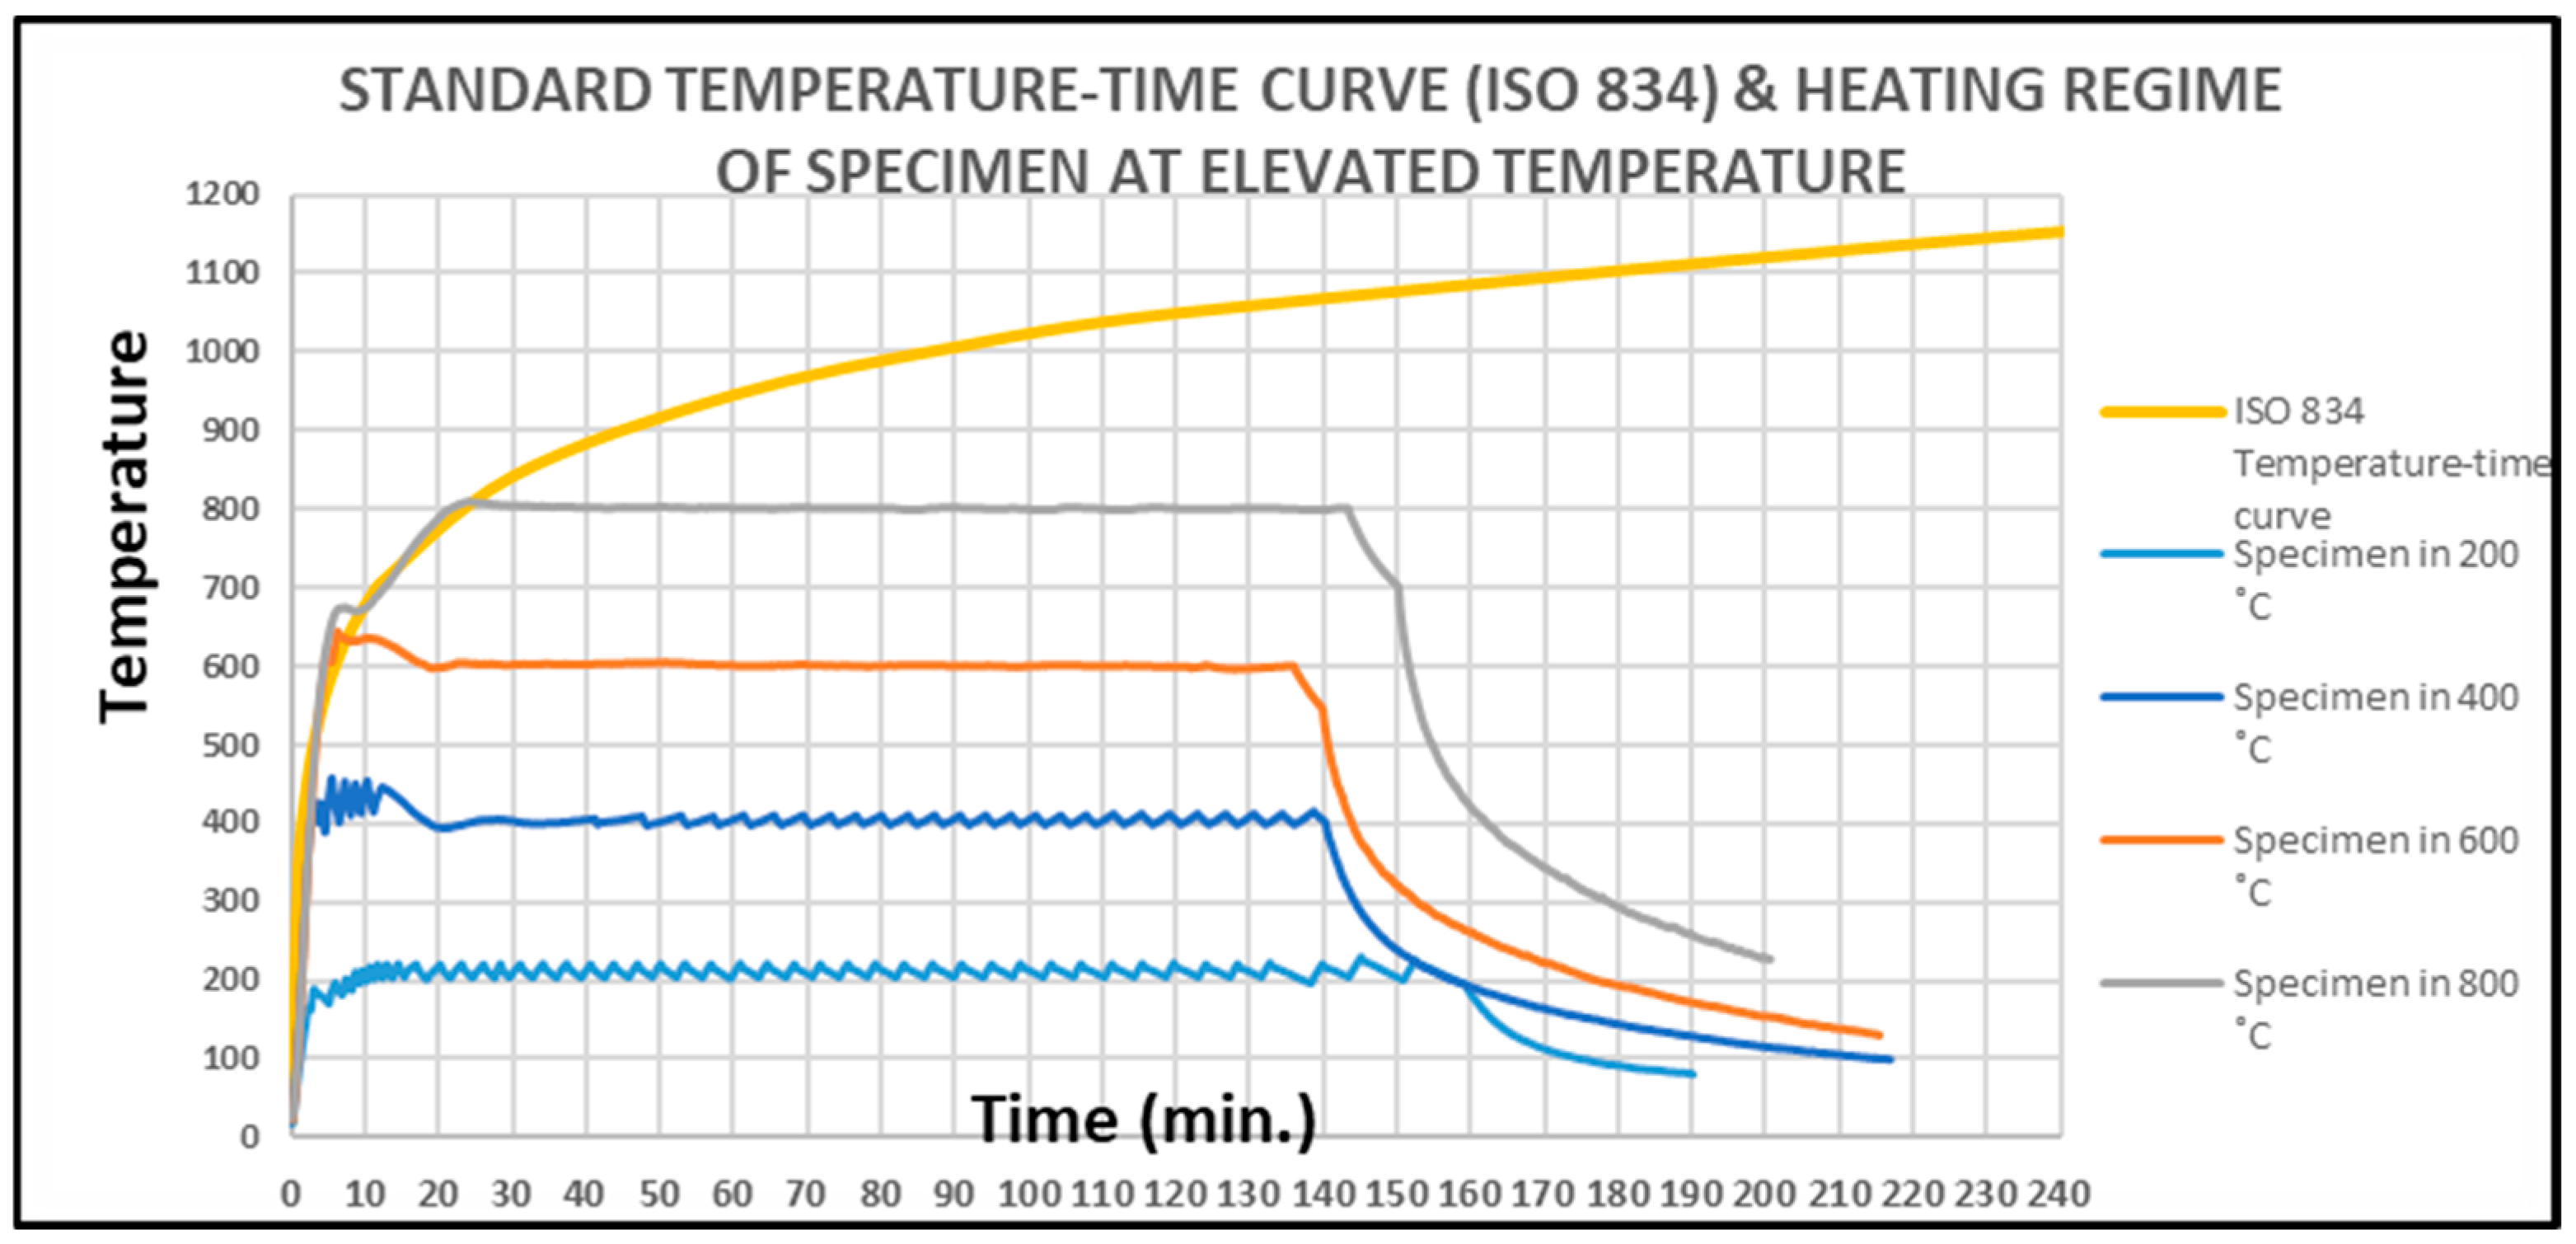
3. Elevated Temperature Tests (ETTs)
4. Mechanical Tests After ETTs
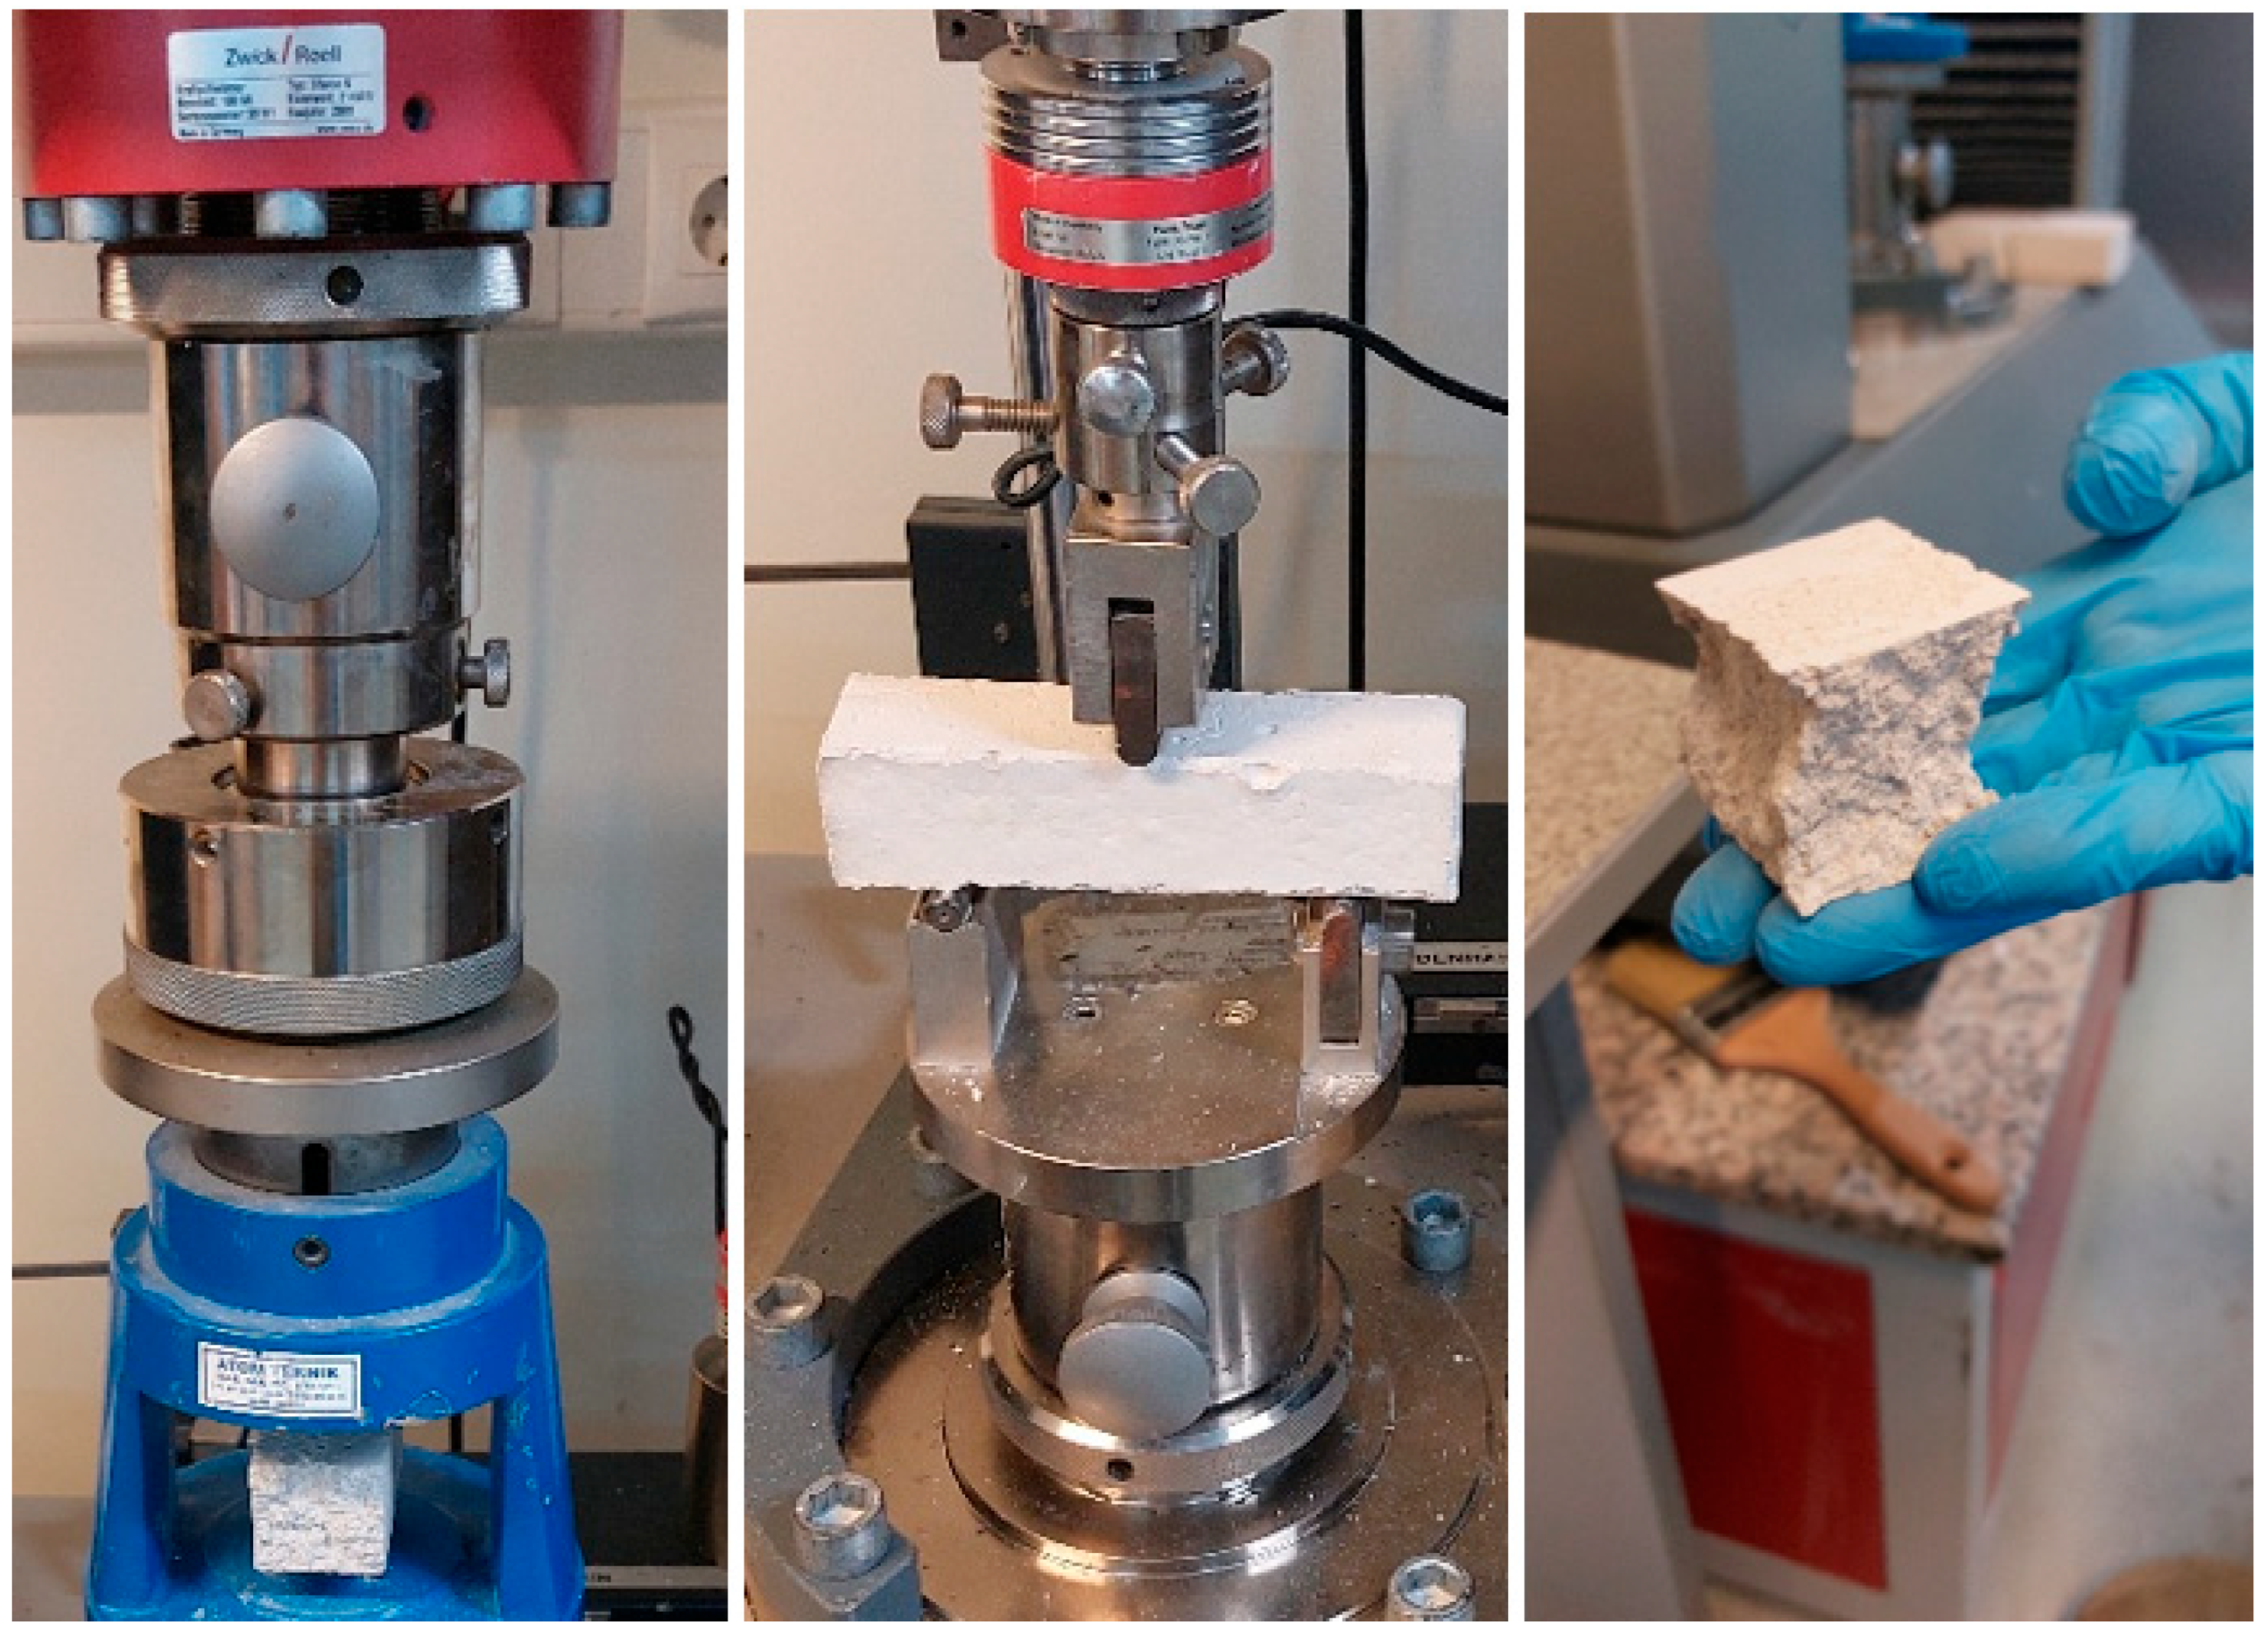
4.1. Mortar
4.2. Brick
4.3. Masonry Prism
5. Finite Element Modeling for Thermal Properties Validation
- amor is the percentage area of mortar joint, in %;
- aunit is the percentage area of units, in %;
- λdesign,mor is the design equivalent thermal conductivity of the mortar joint (W/(m·K));
- λdesign,unit is the designed thermal conductivity of the units in W/(m·K).
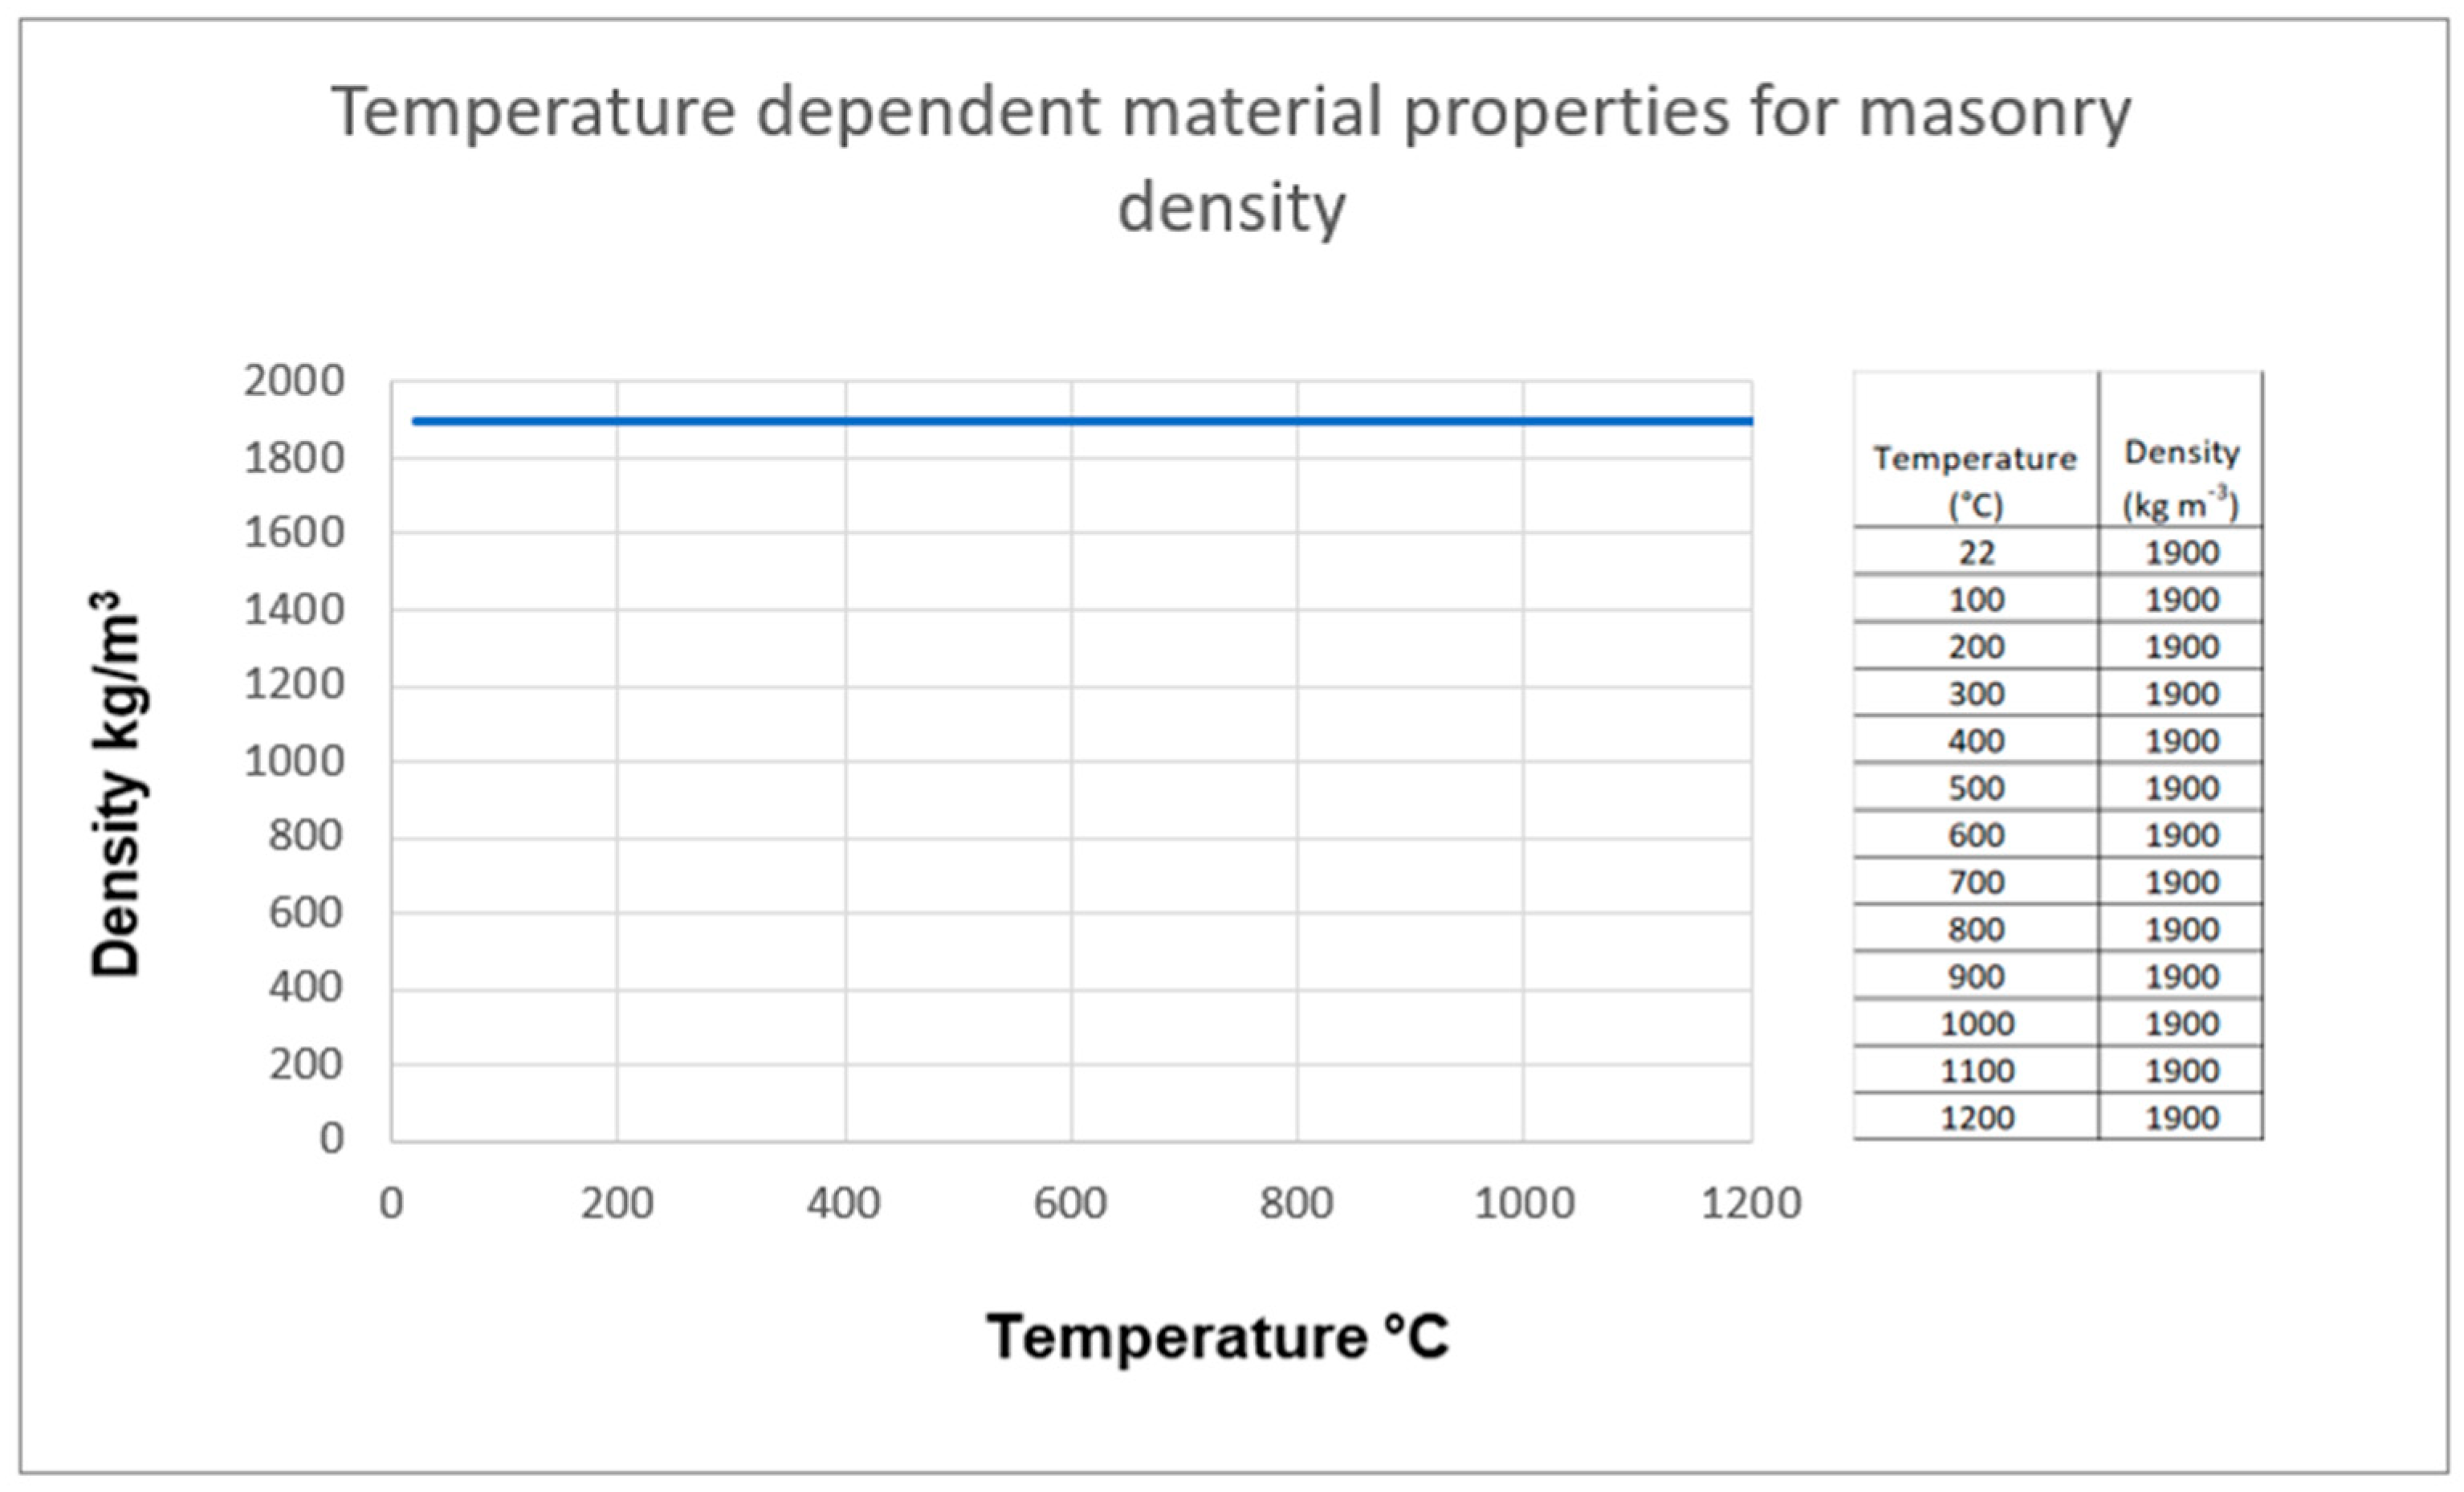
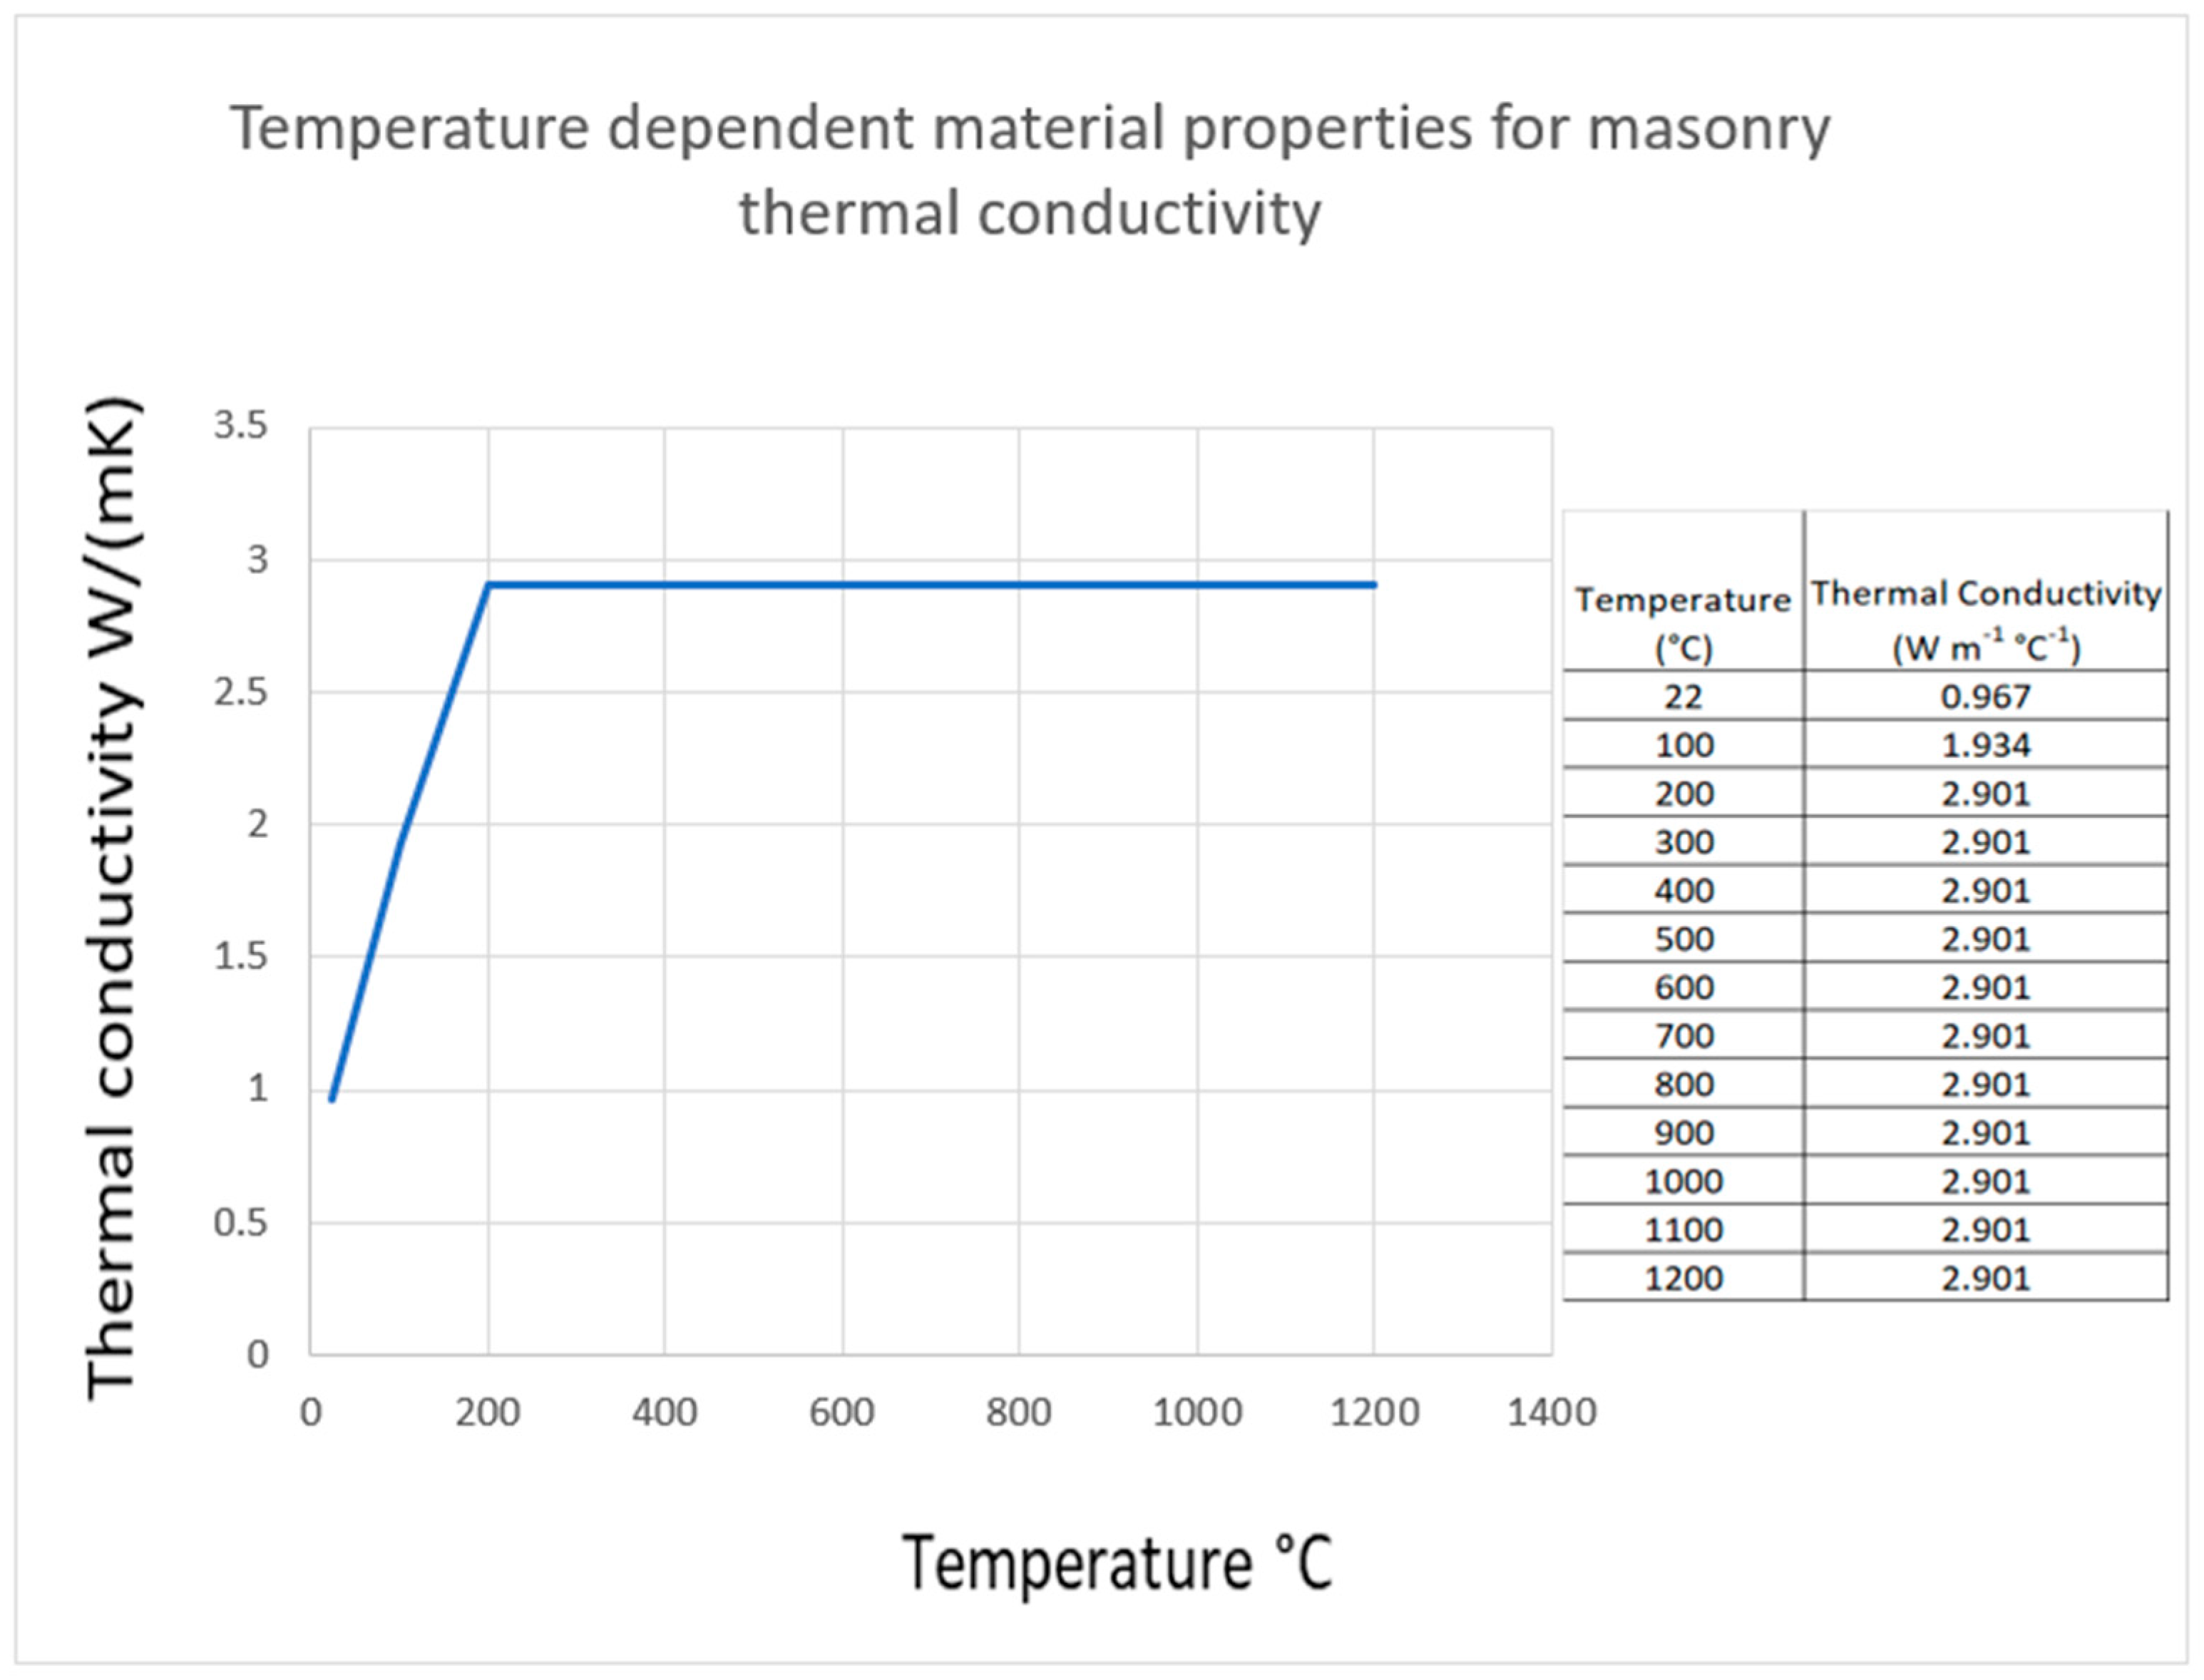
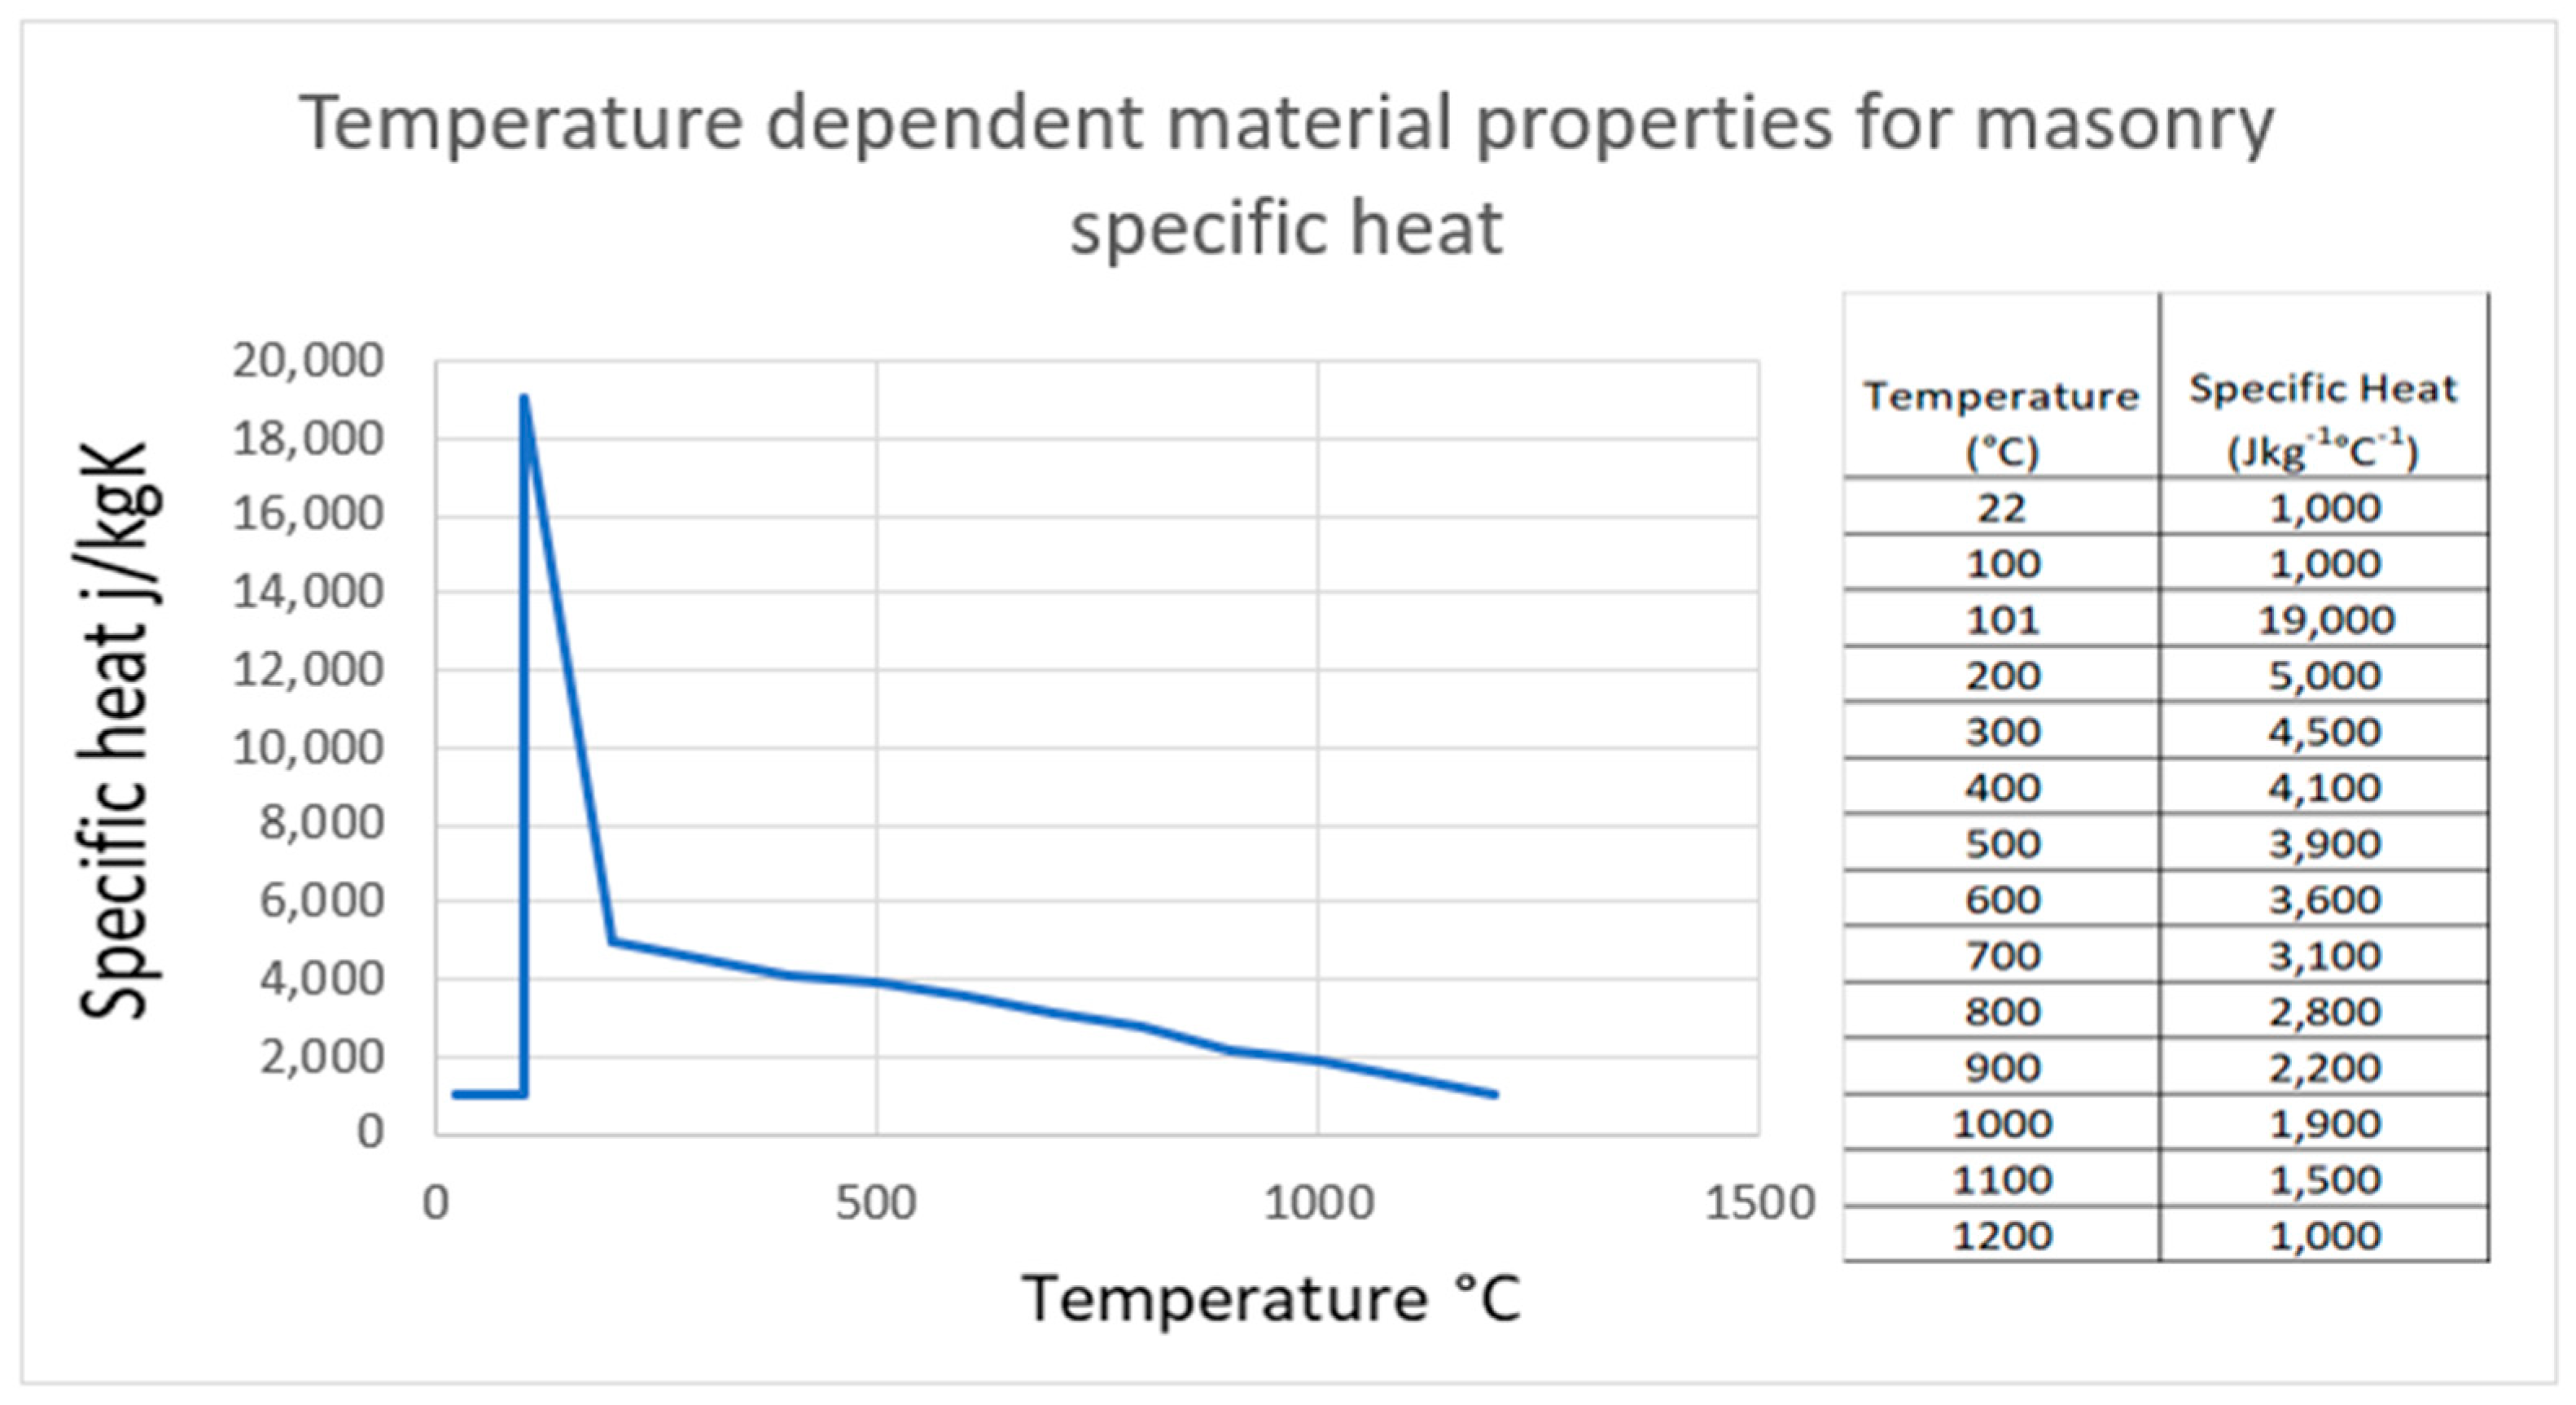
5.1. Elevated Temperature Material Properties
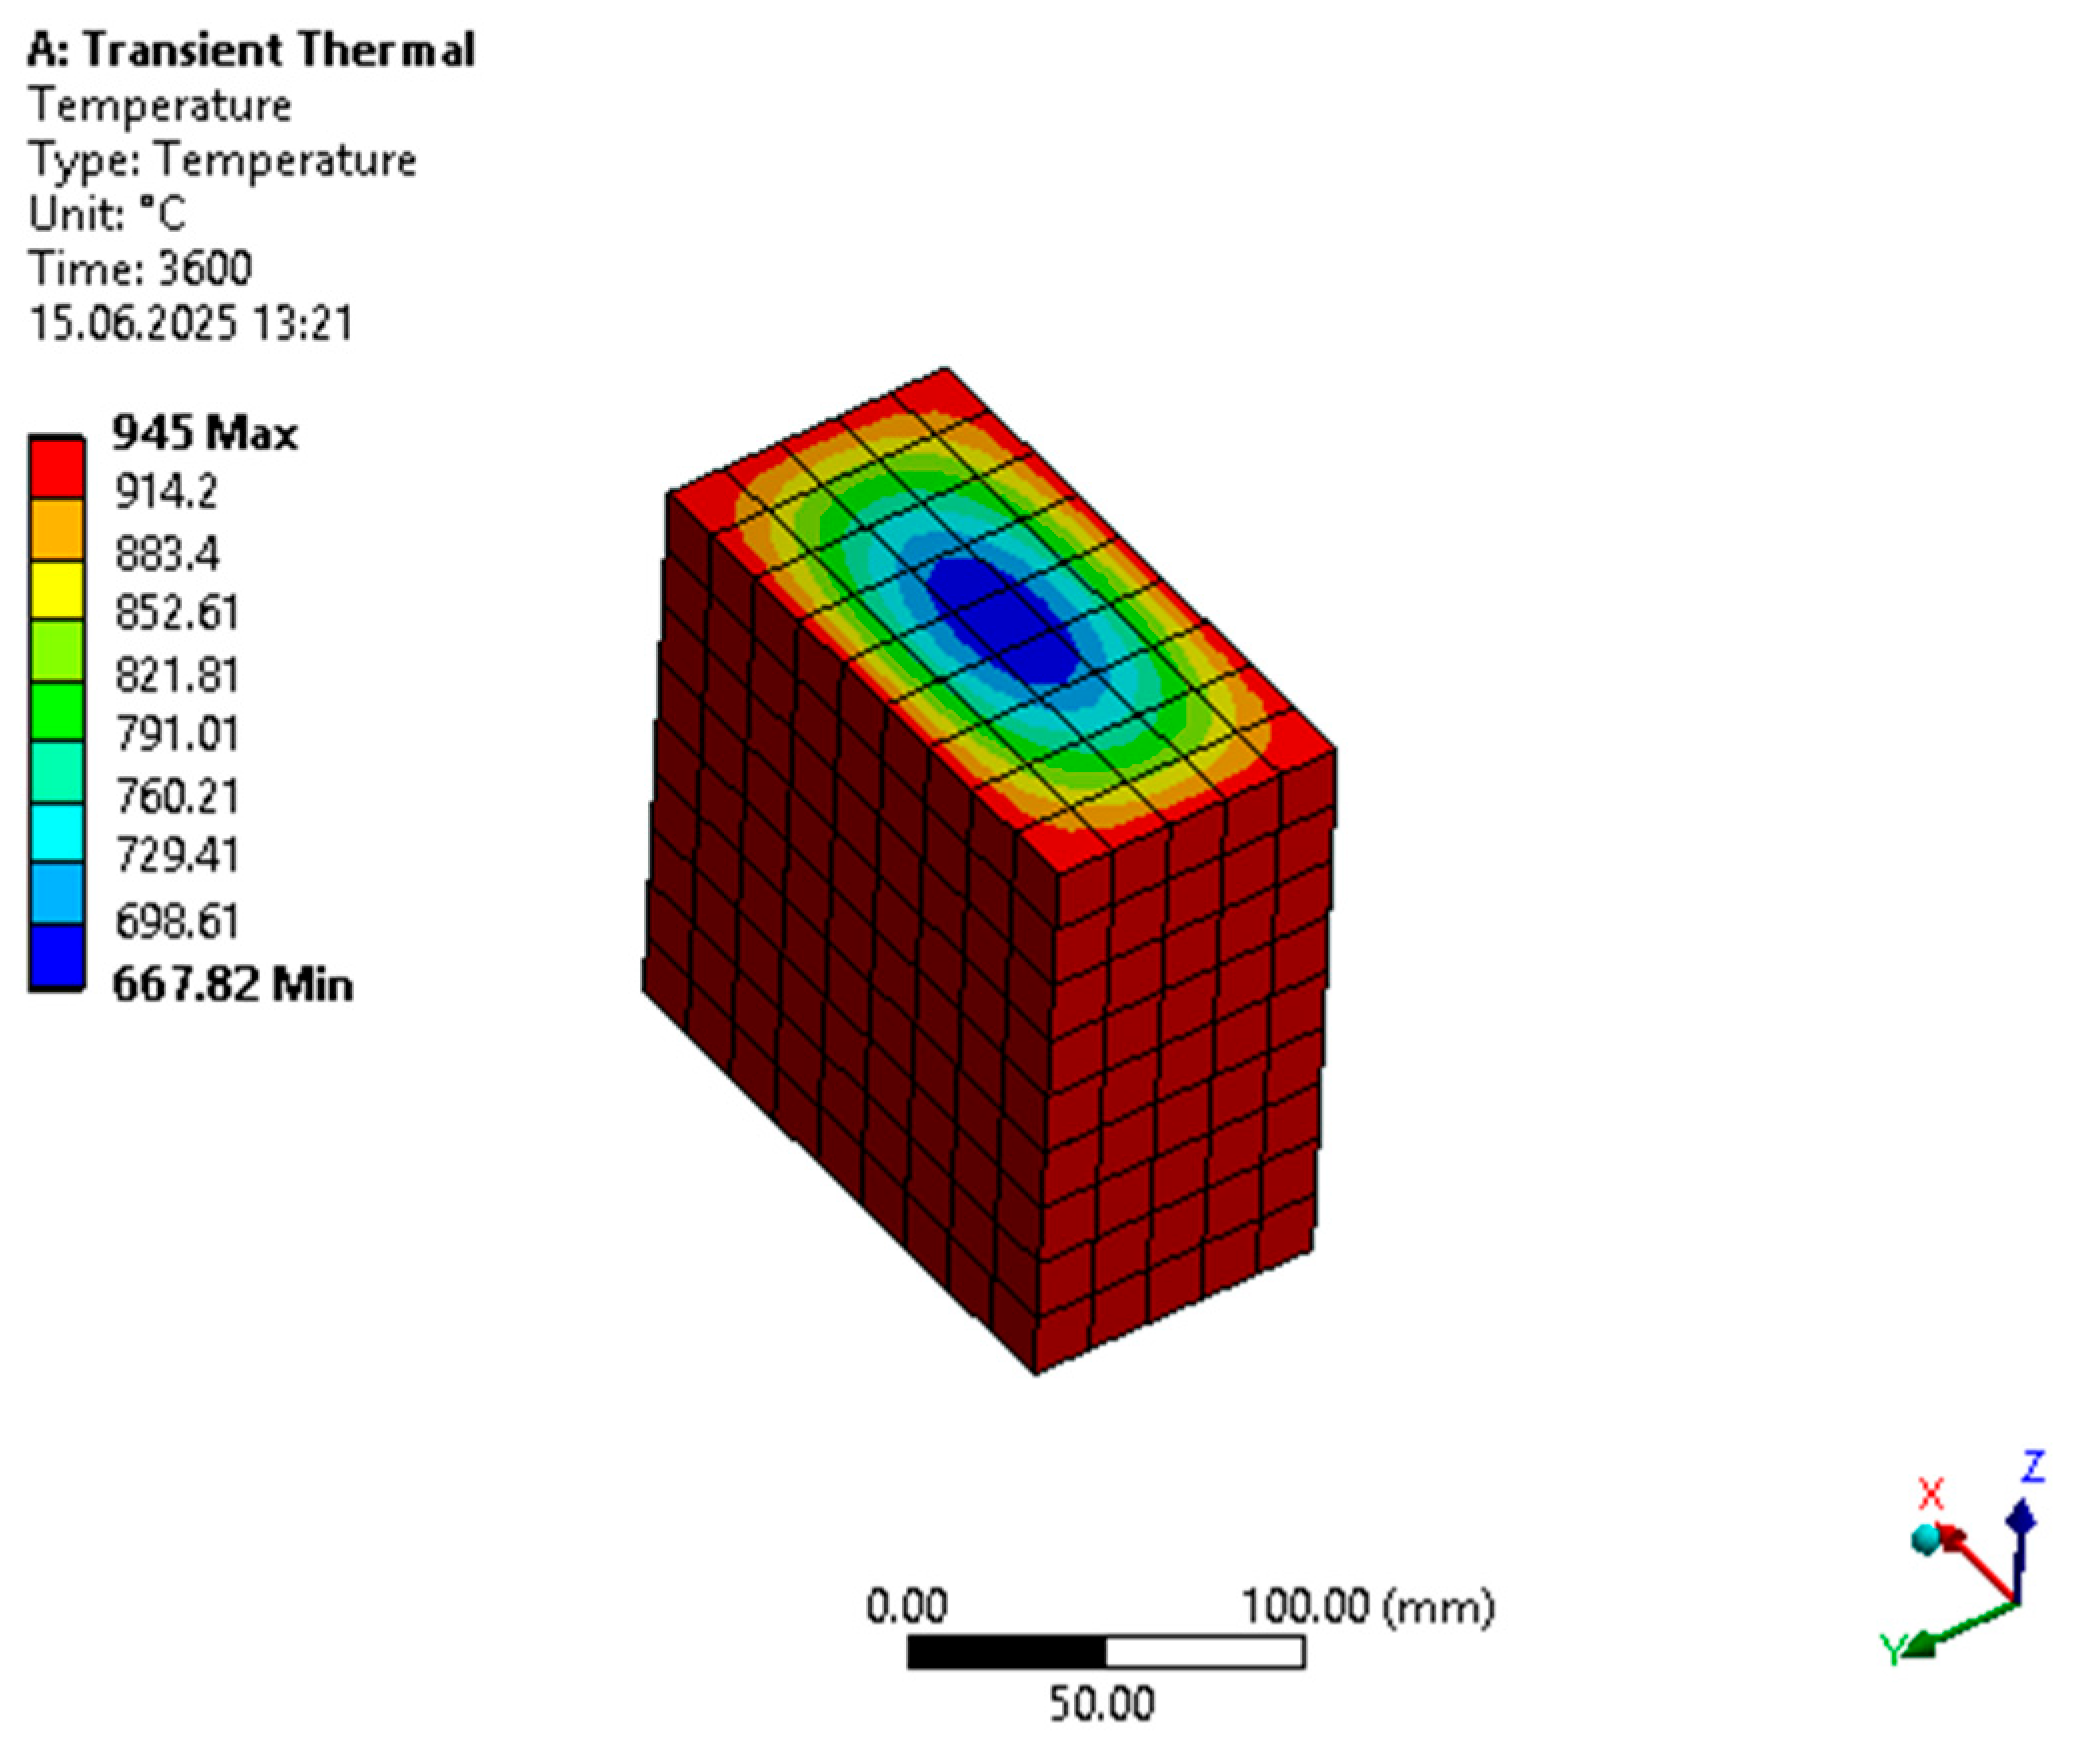
5.2. Transient Thermal Finite Element Analysis (FEA) with ISO 834 Temperature–Time Curve
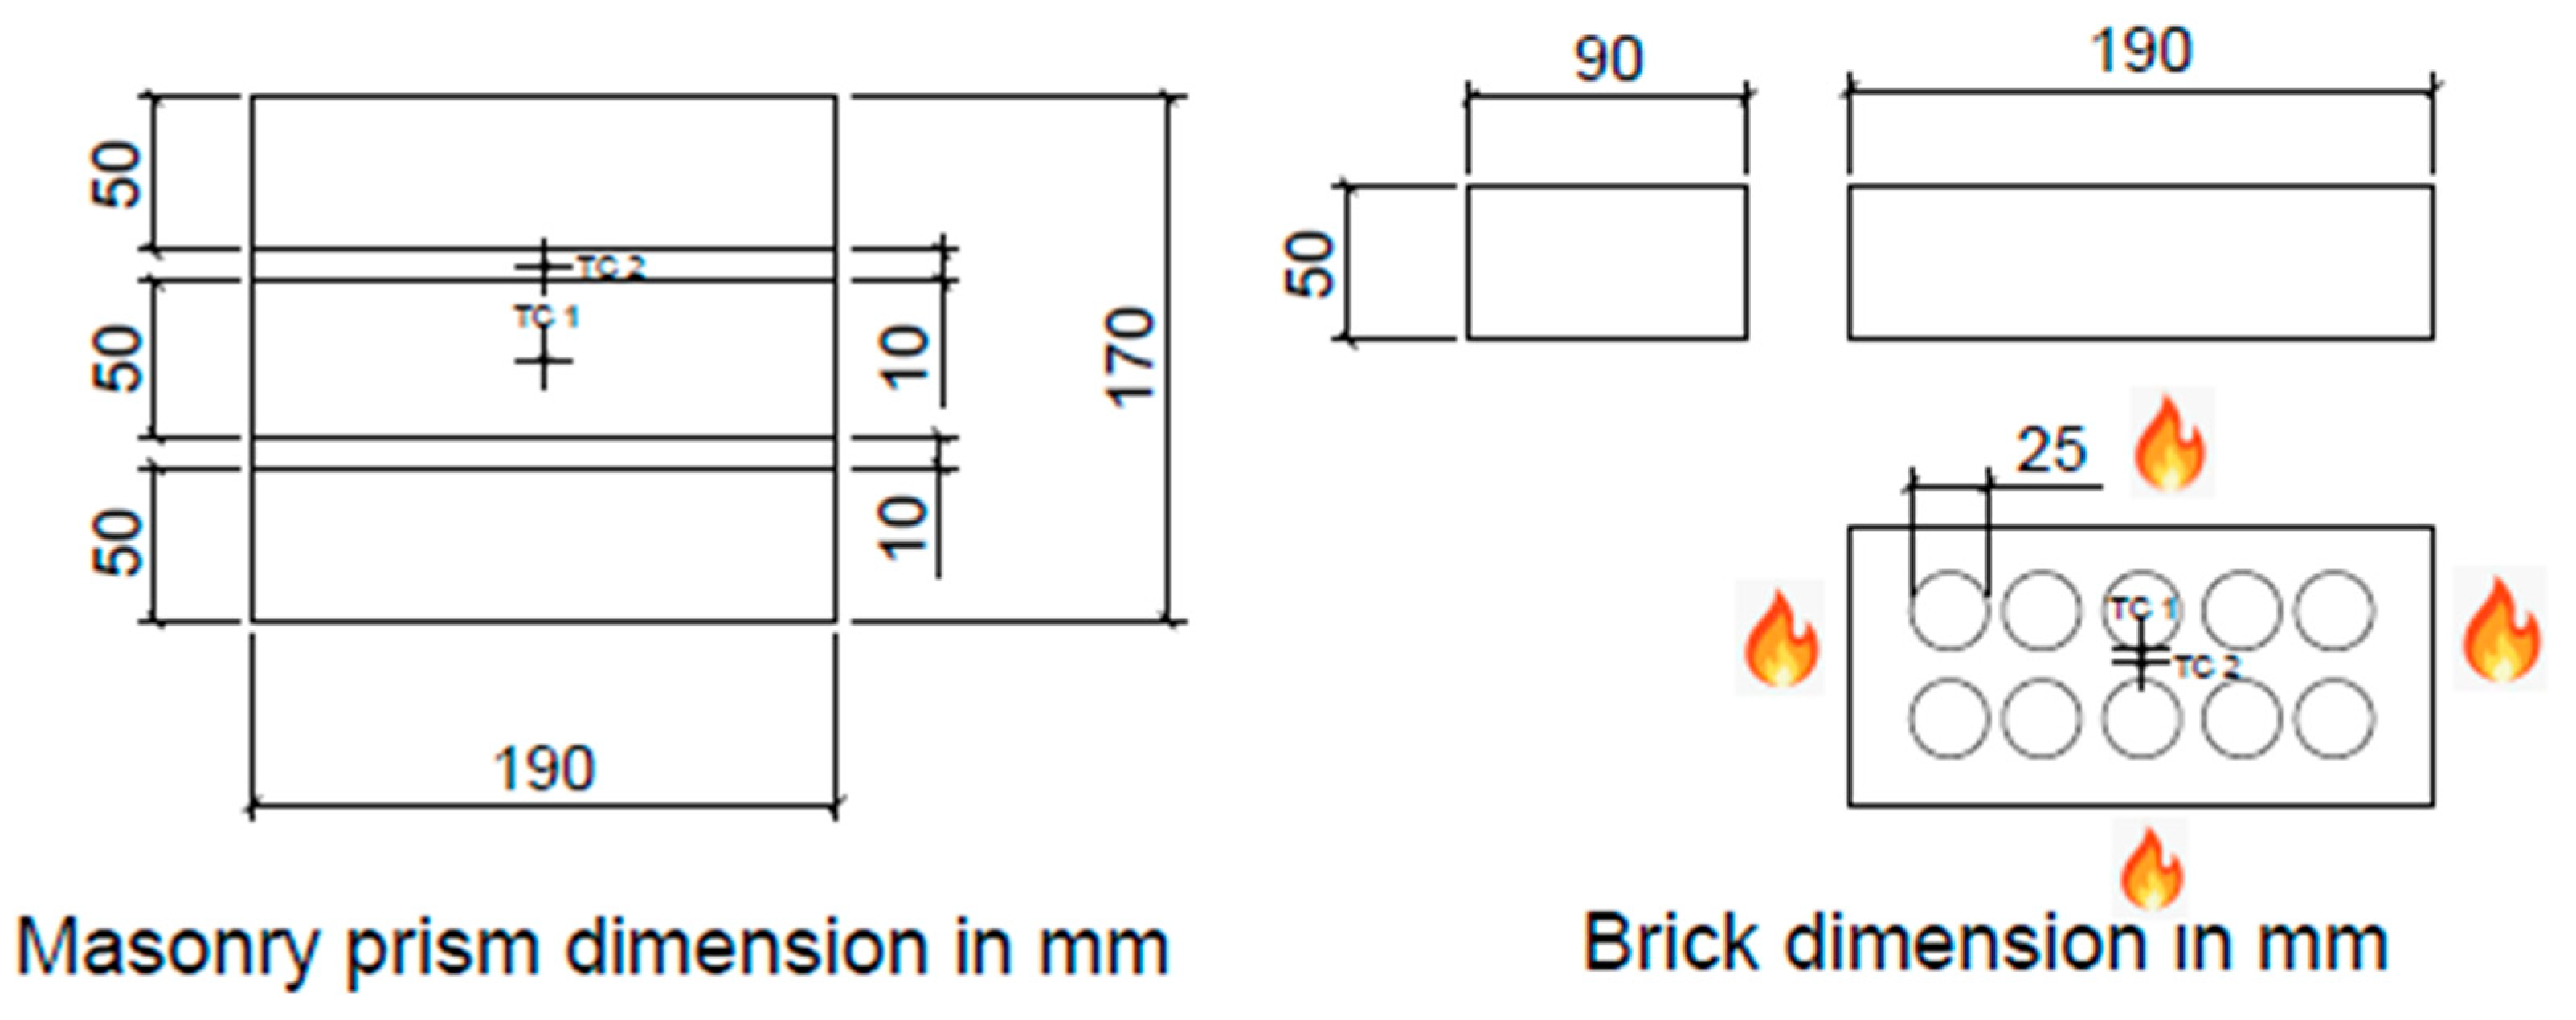
5.3. Fire Testing for Masonry Prism with ISO 834 Temperature–Time Curve
5.4. Comparison with Test and FEA Transient Thermal Analysis Results
6. Results and Discussion
6.1. Mortar
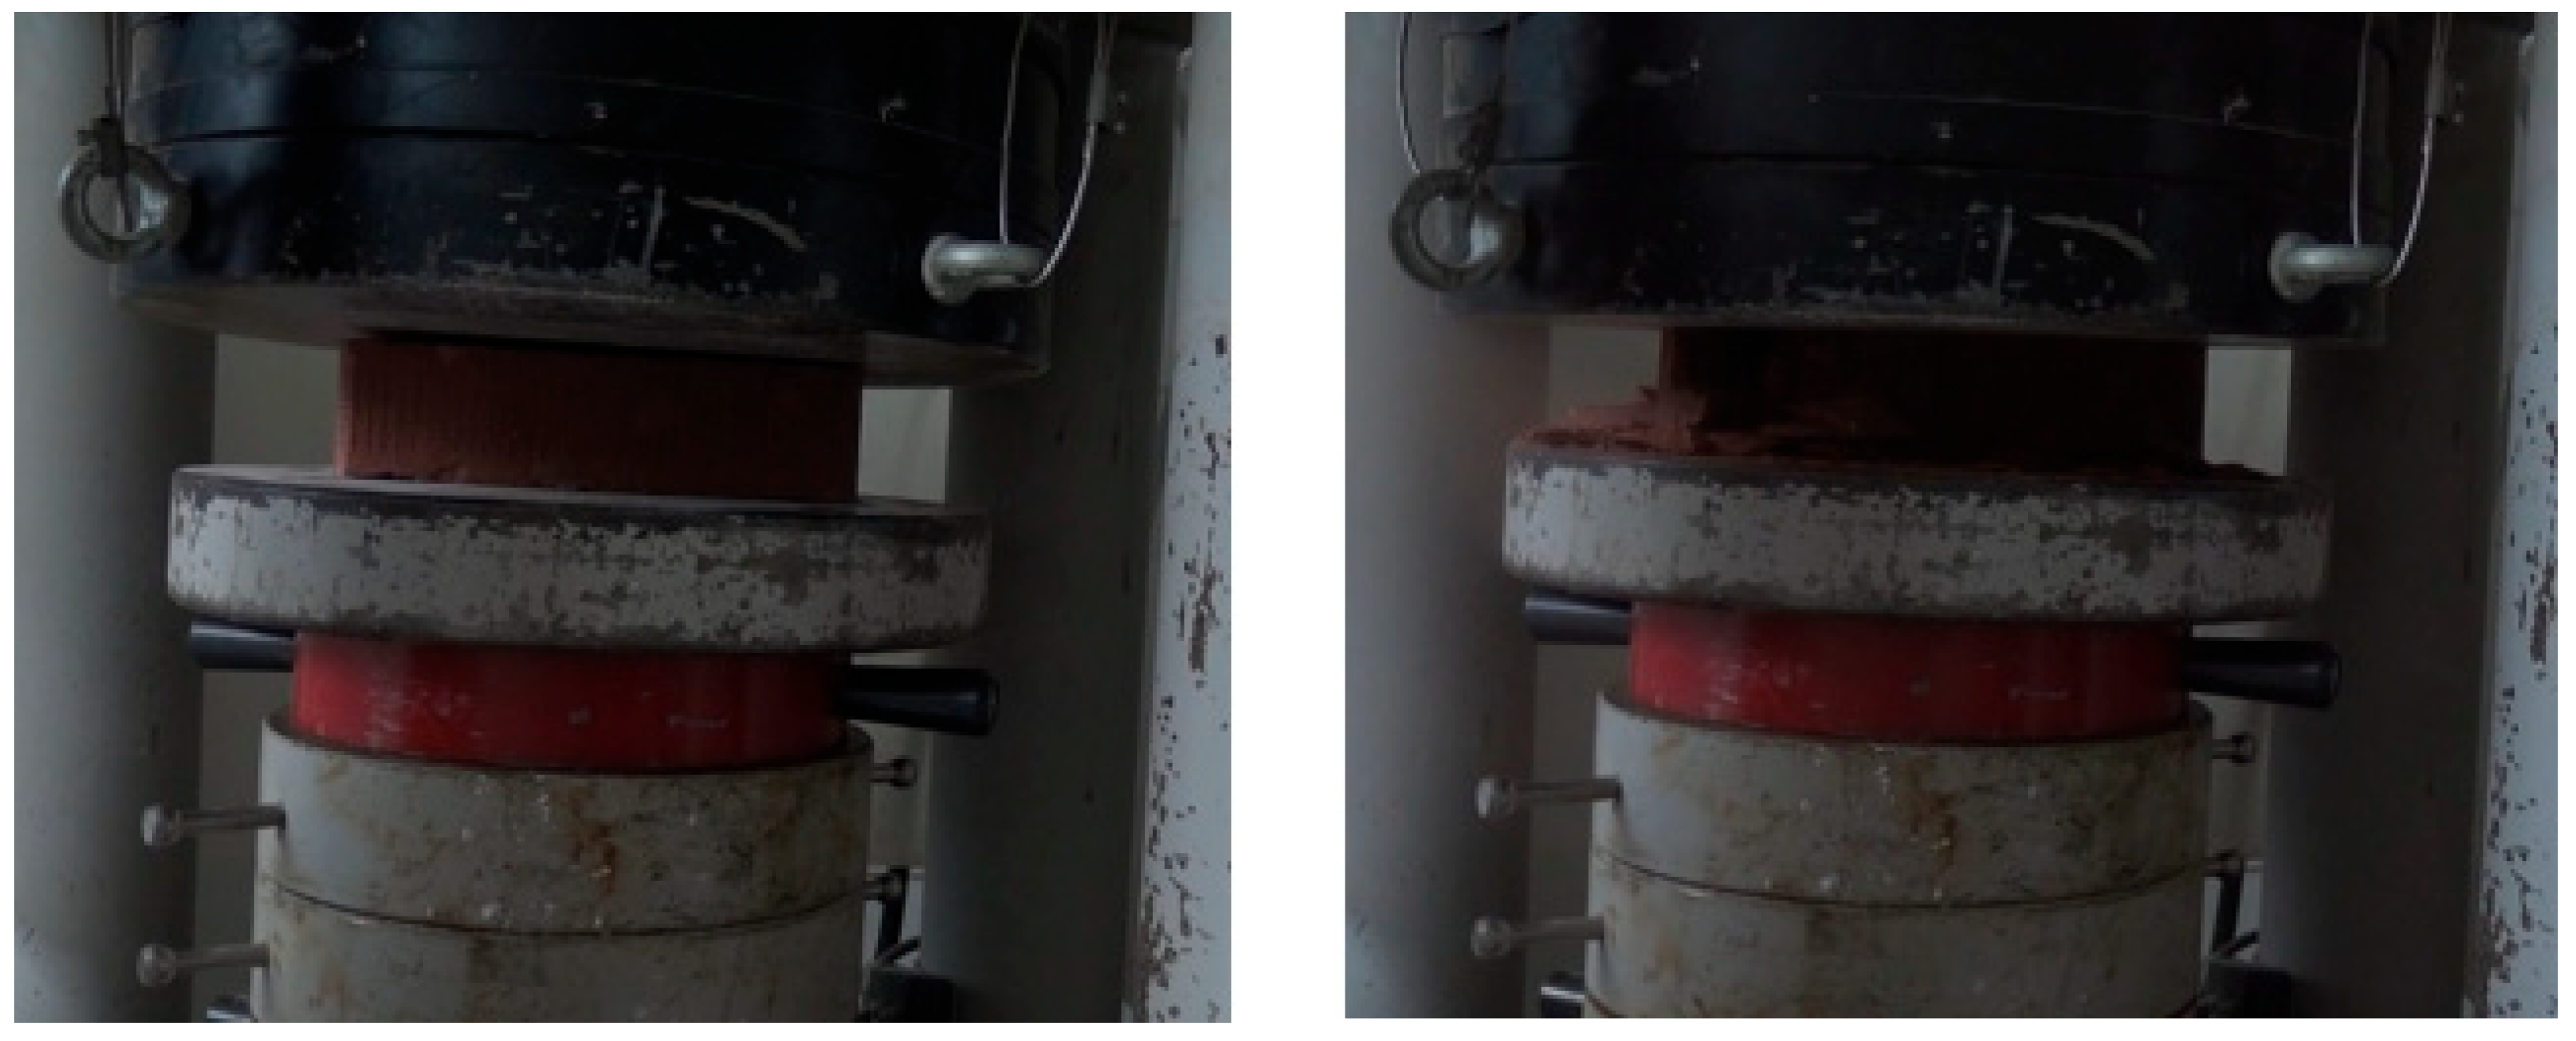
6.2. Brick
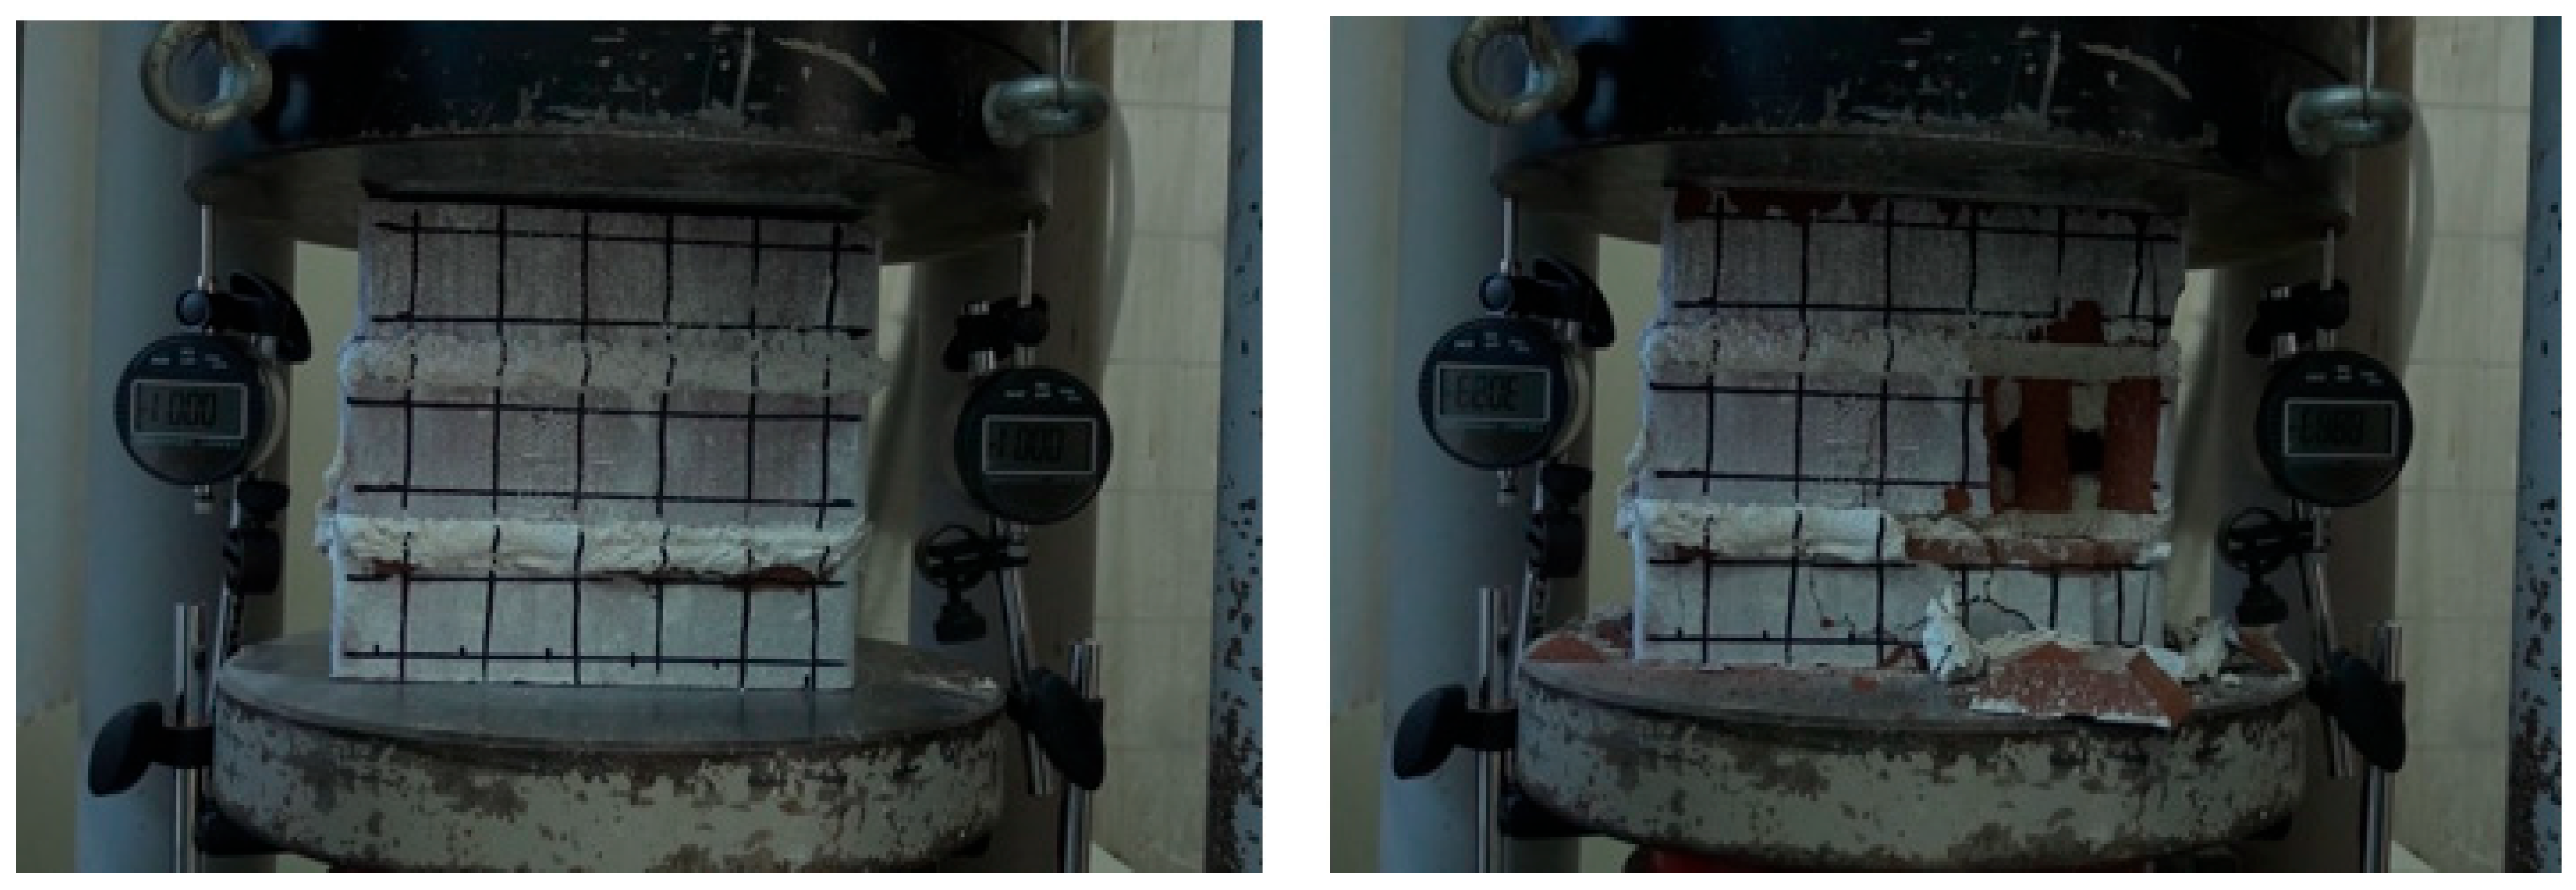
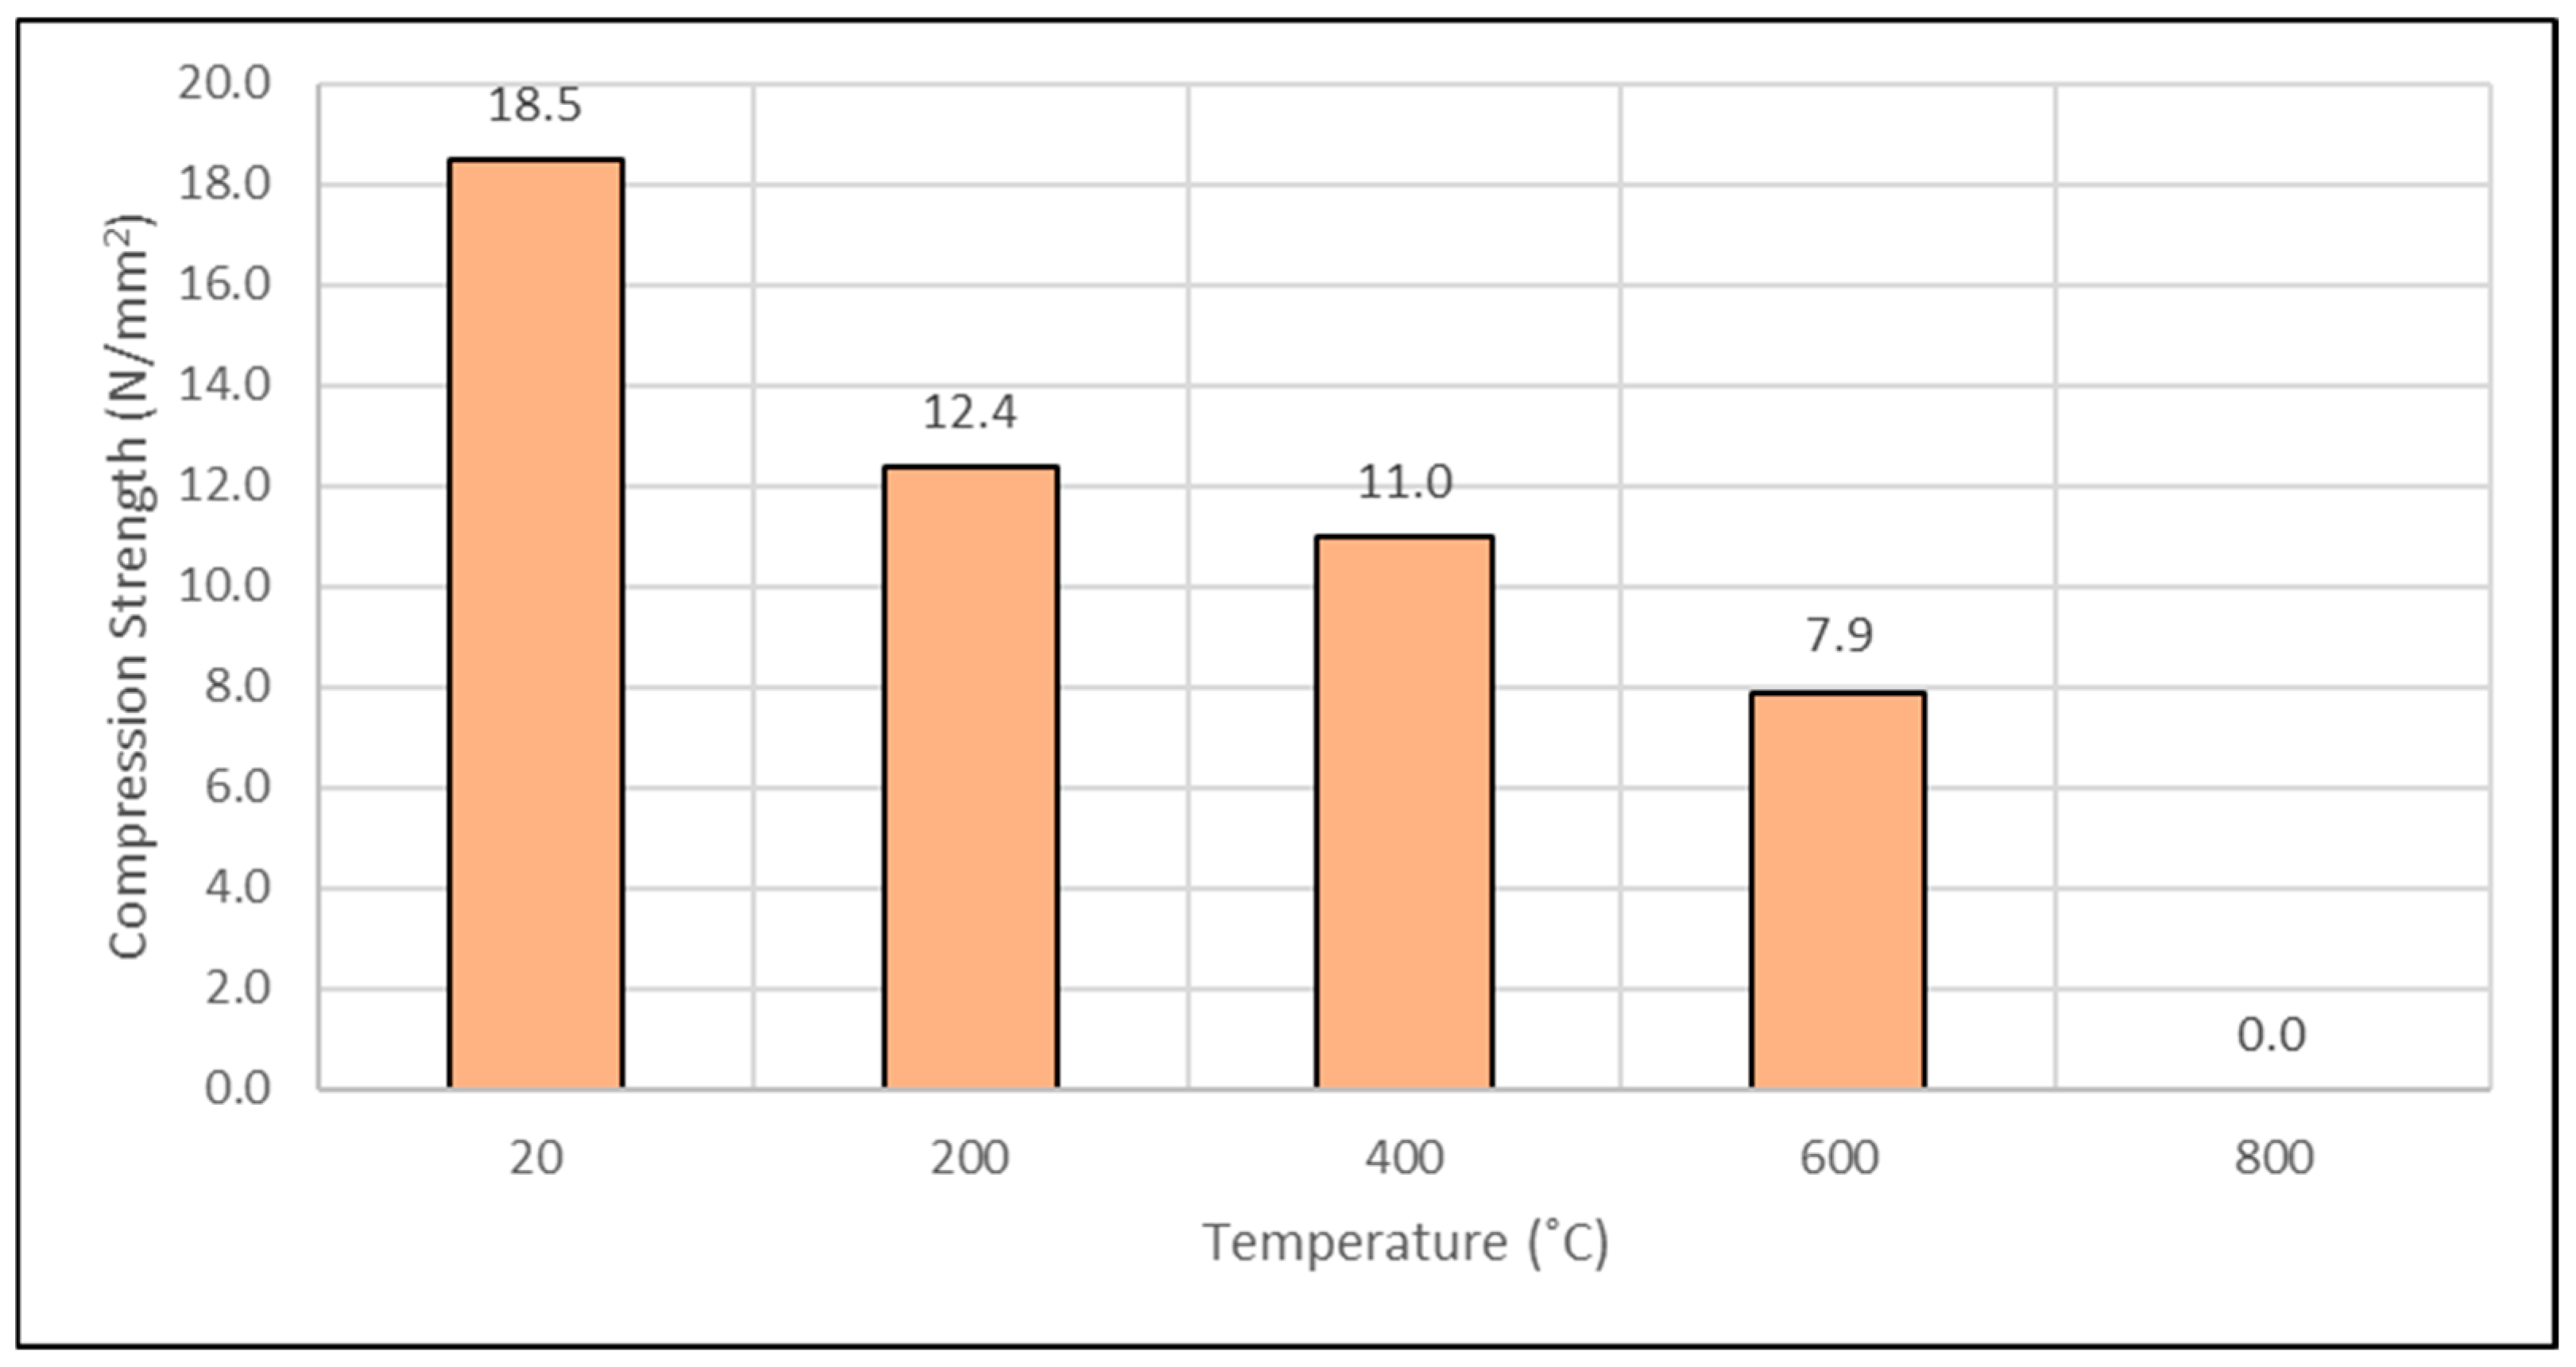
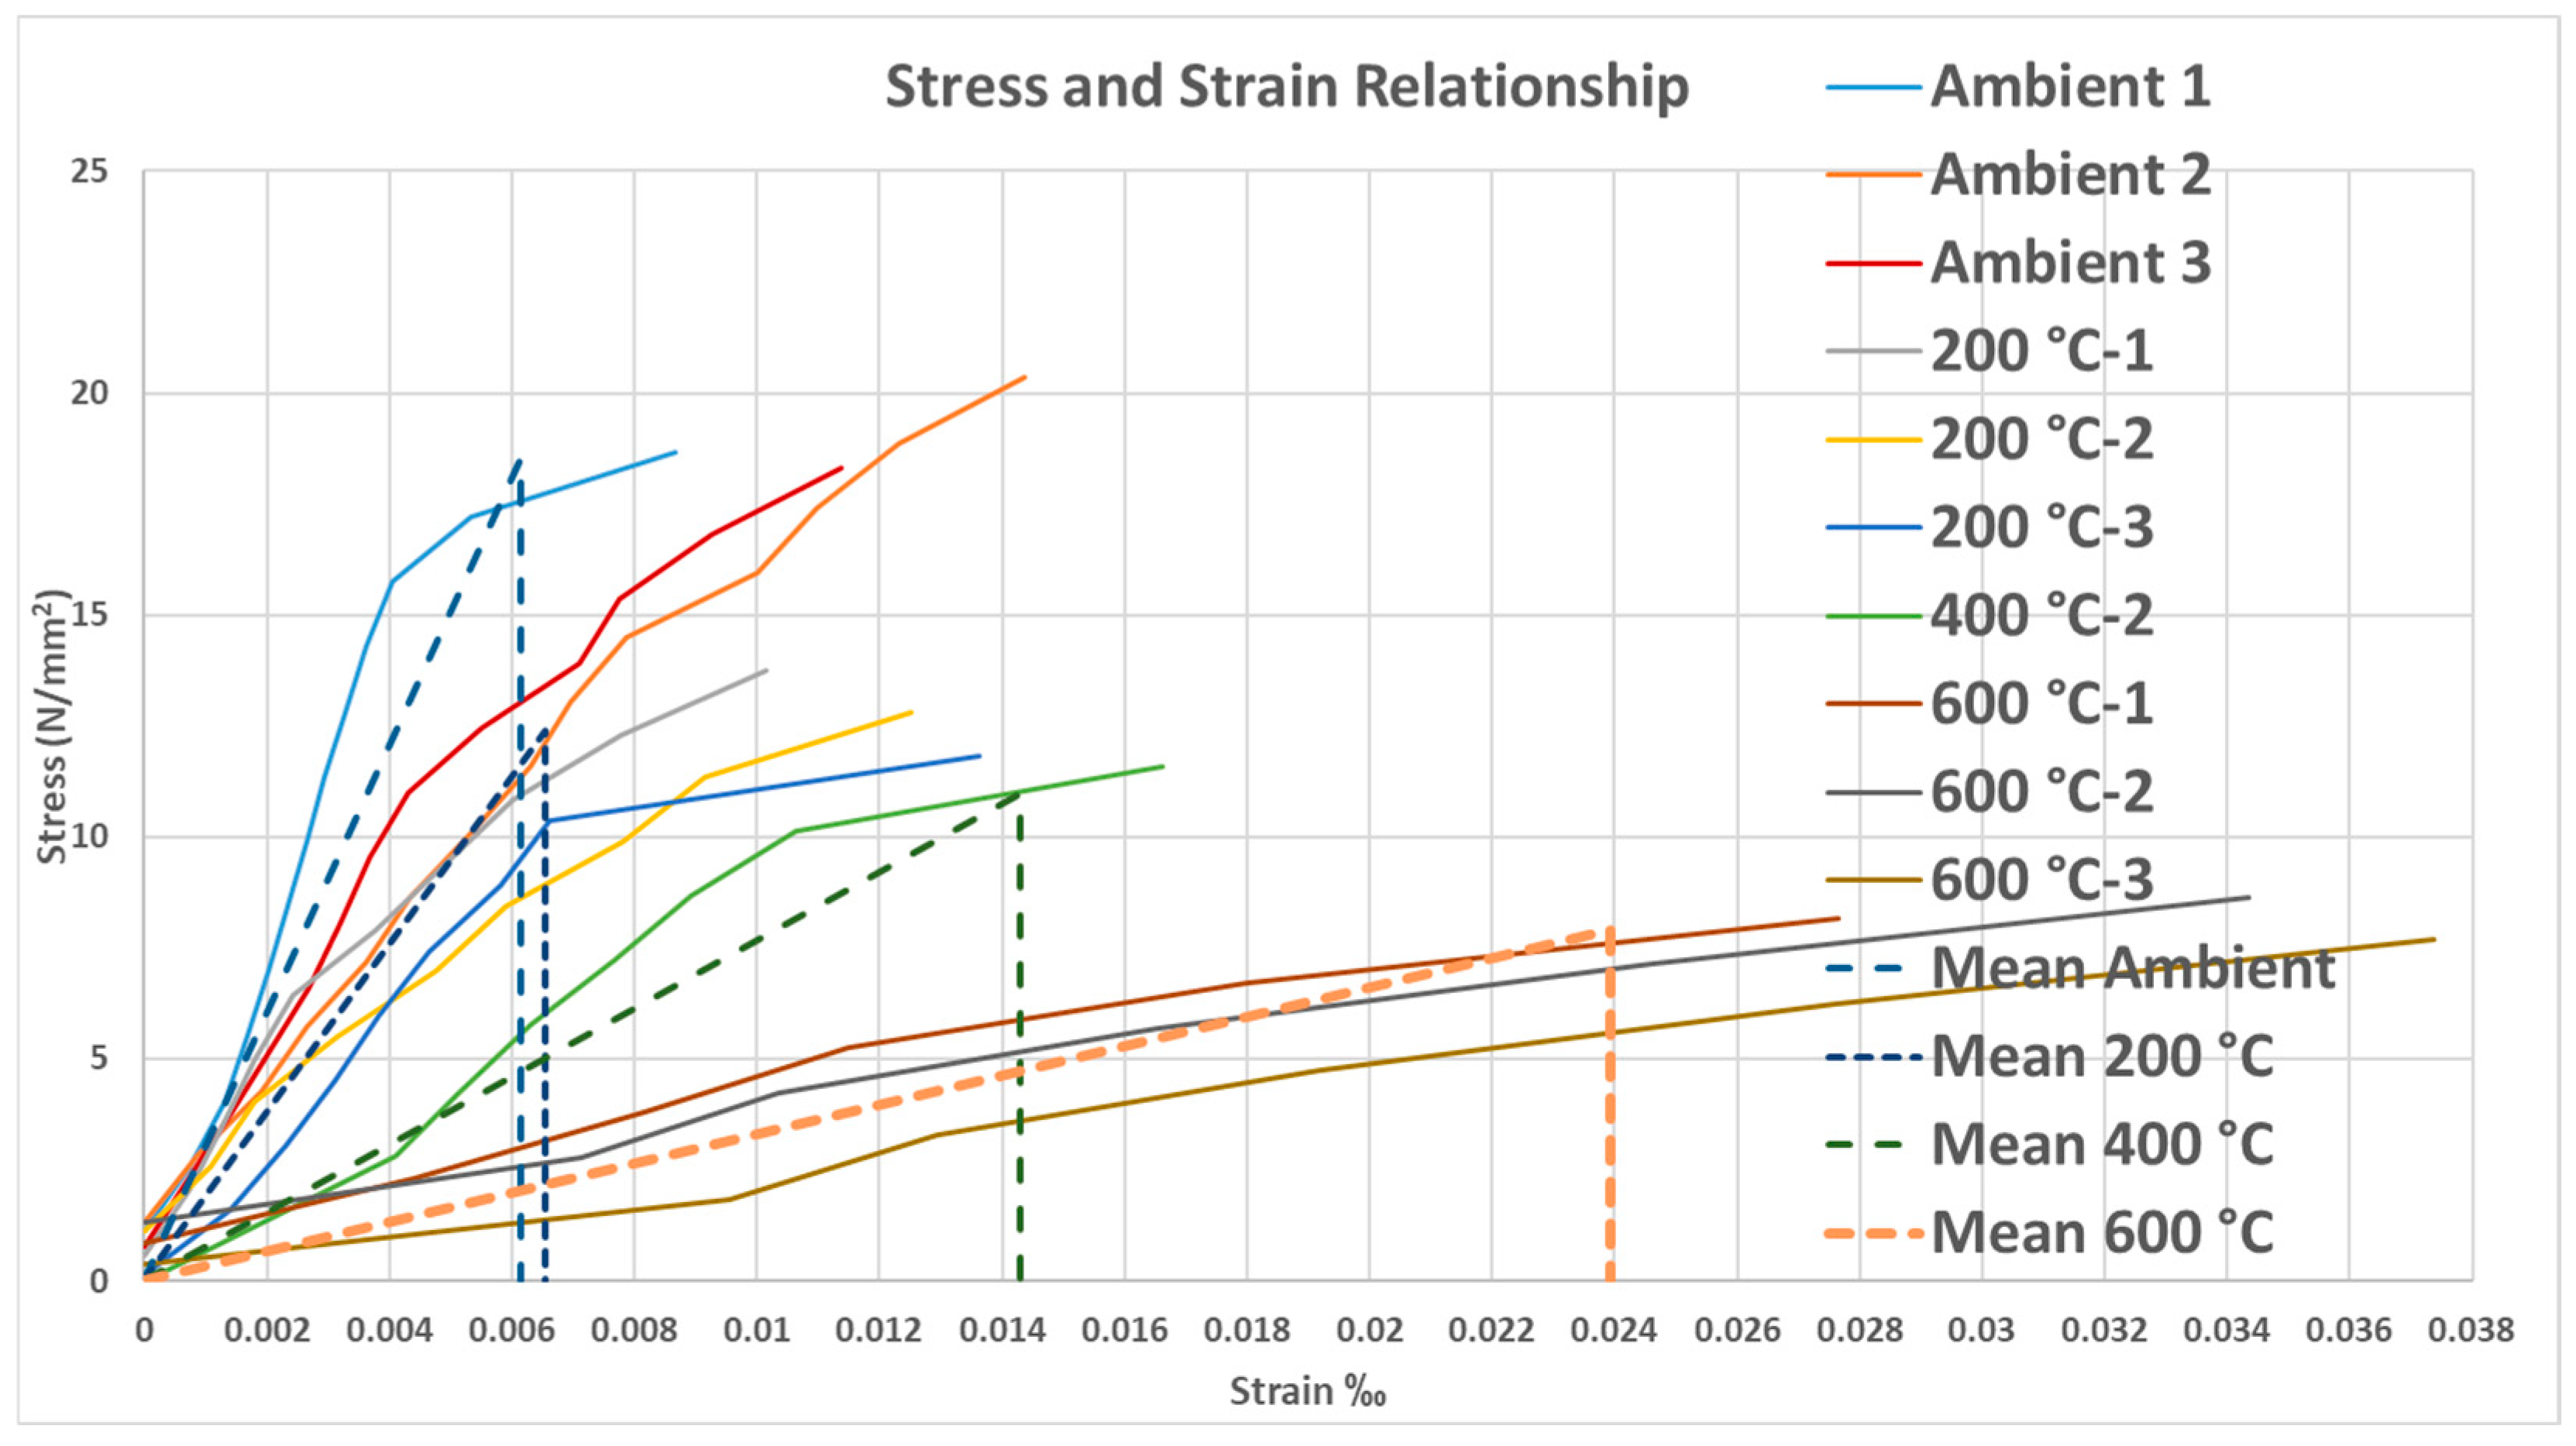
6.3. Masonry Prism
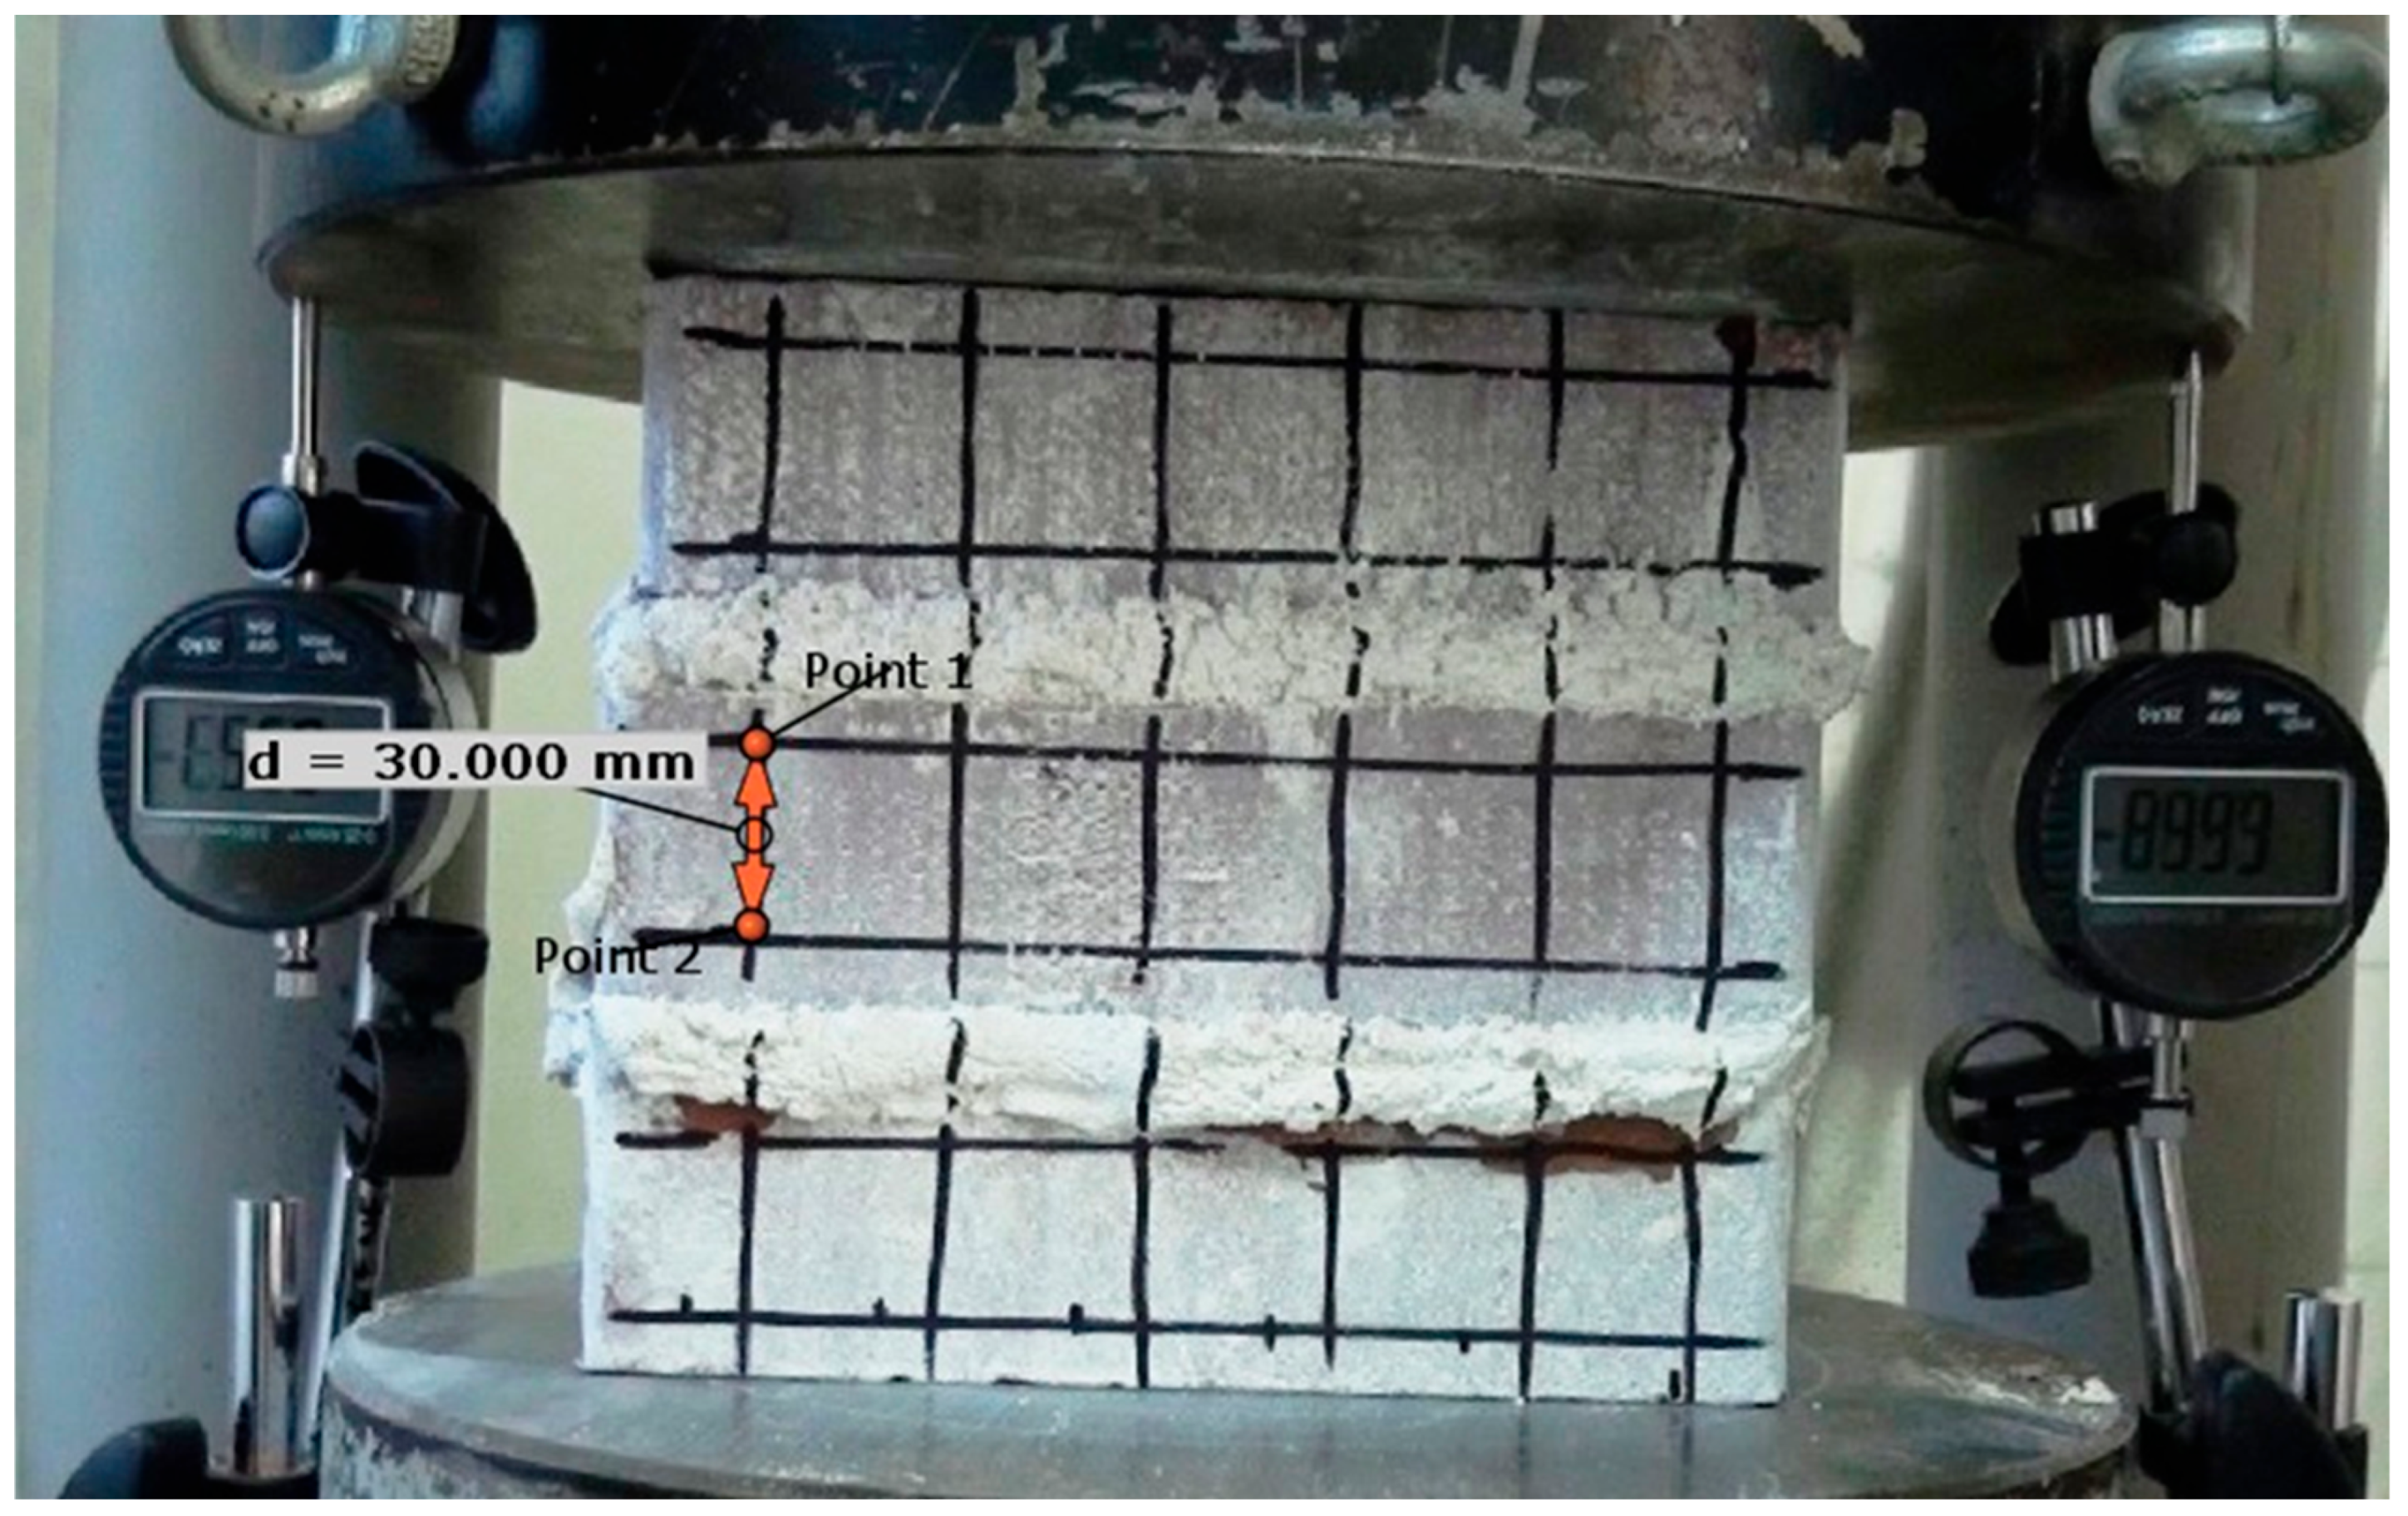
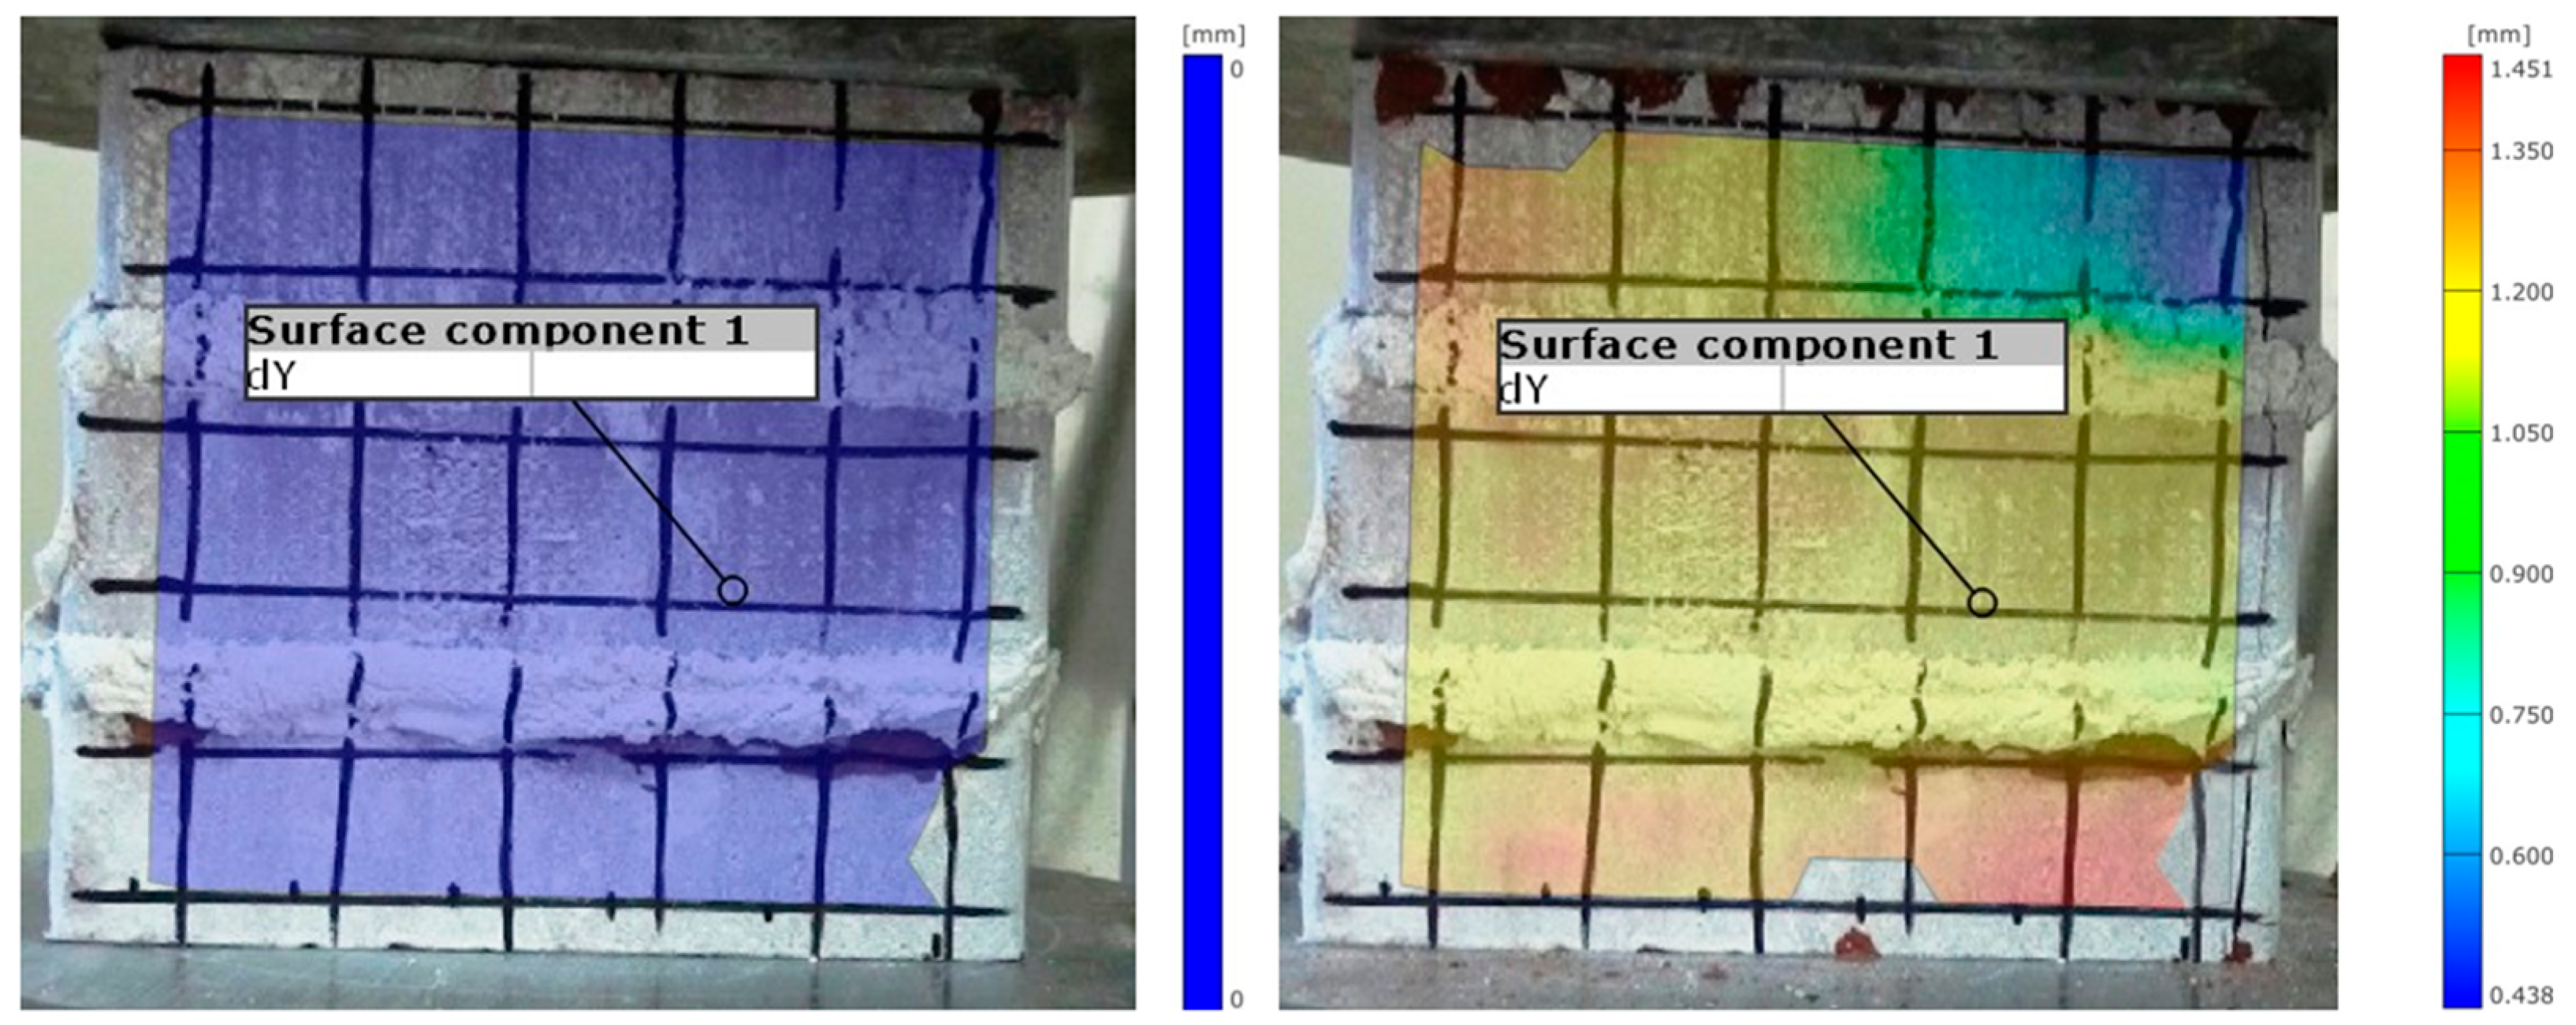
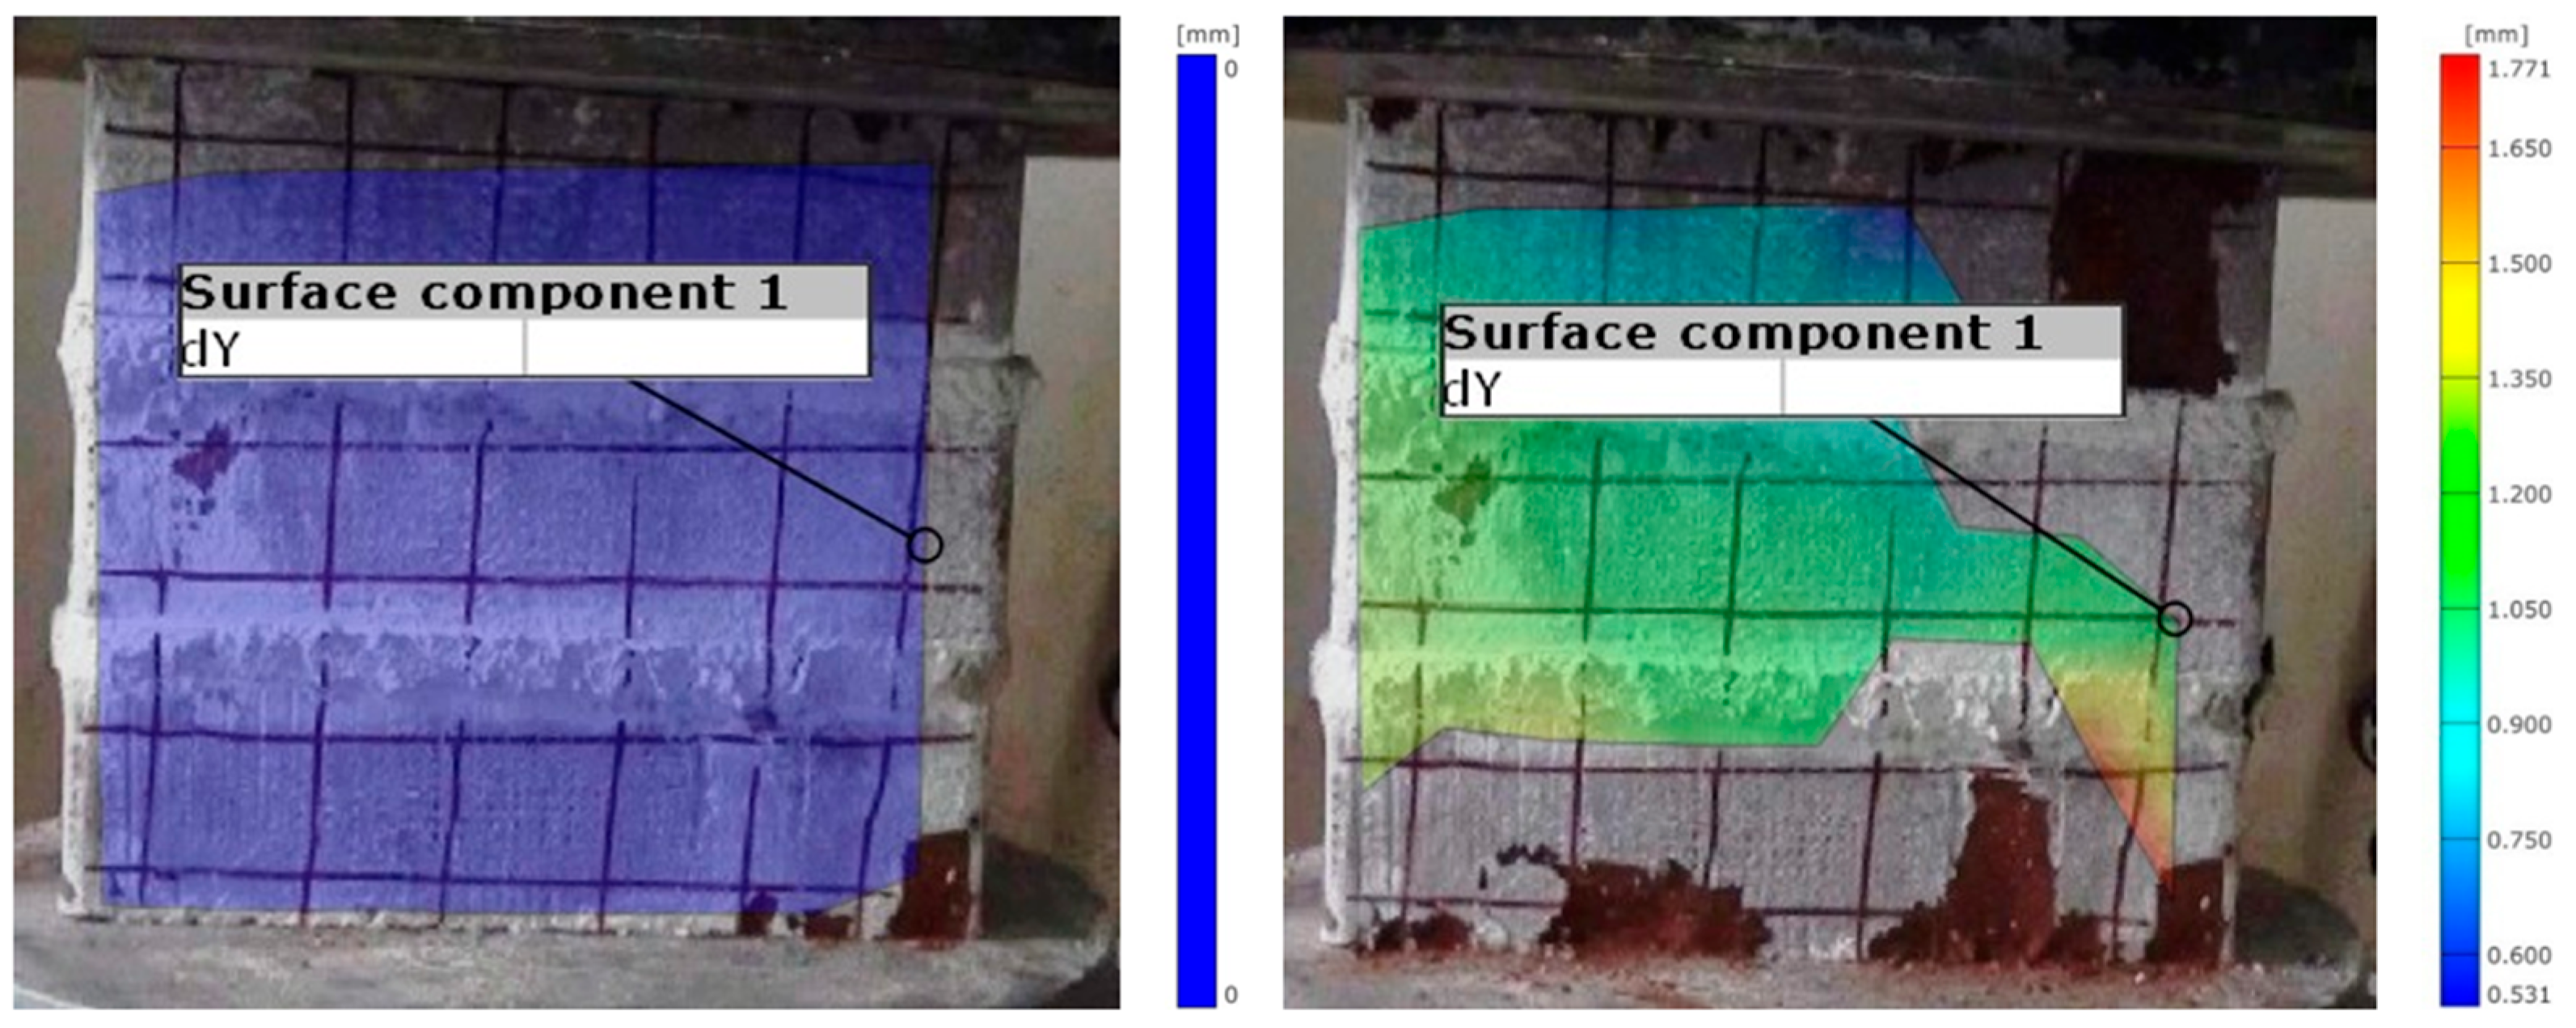
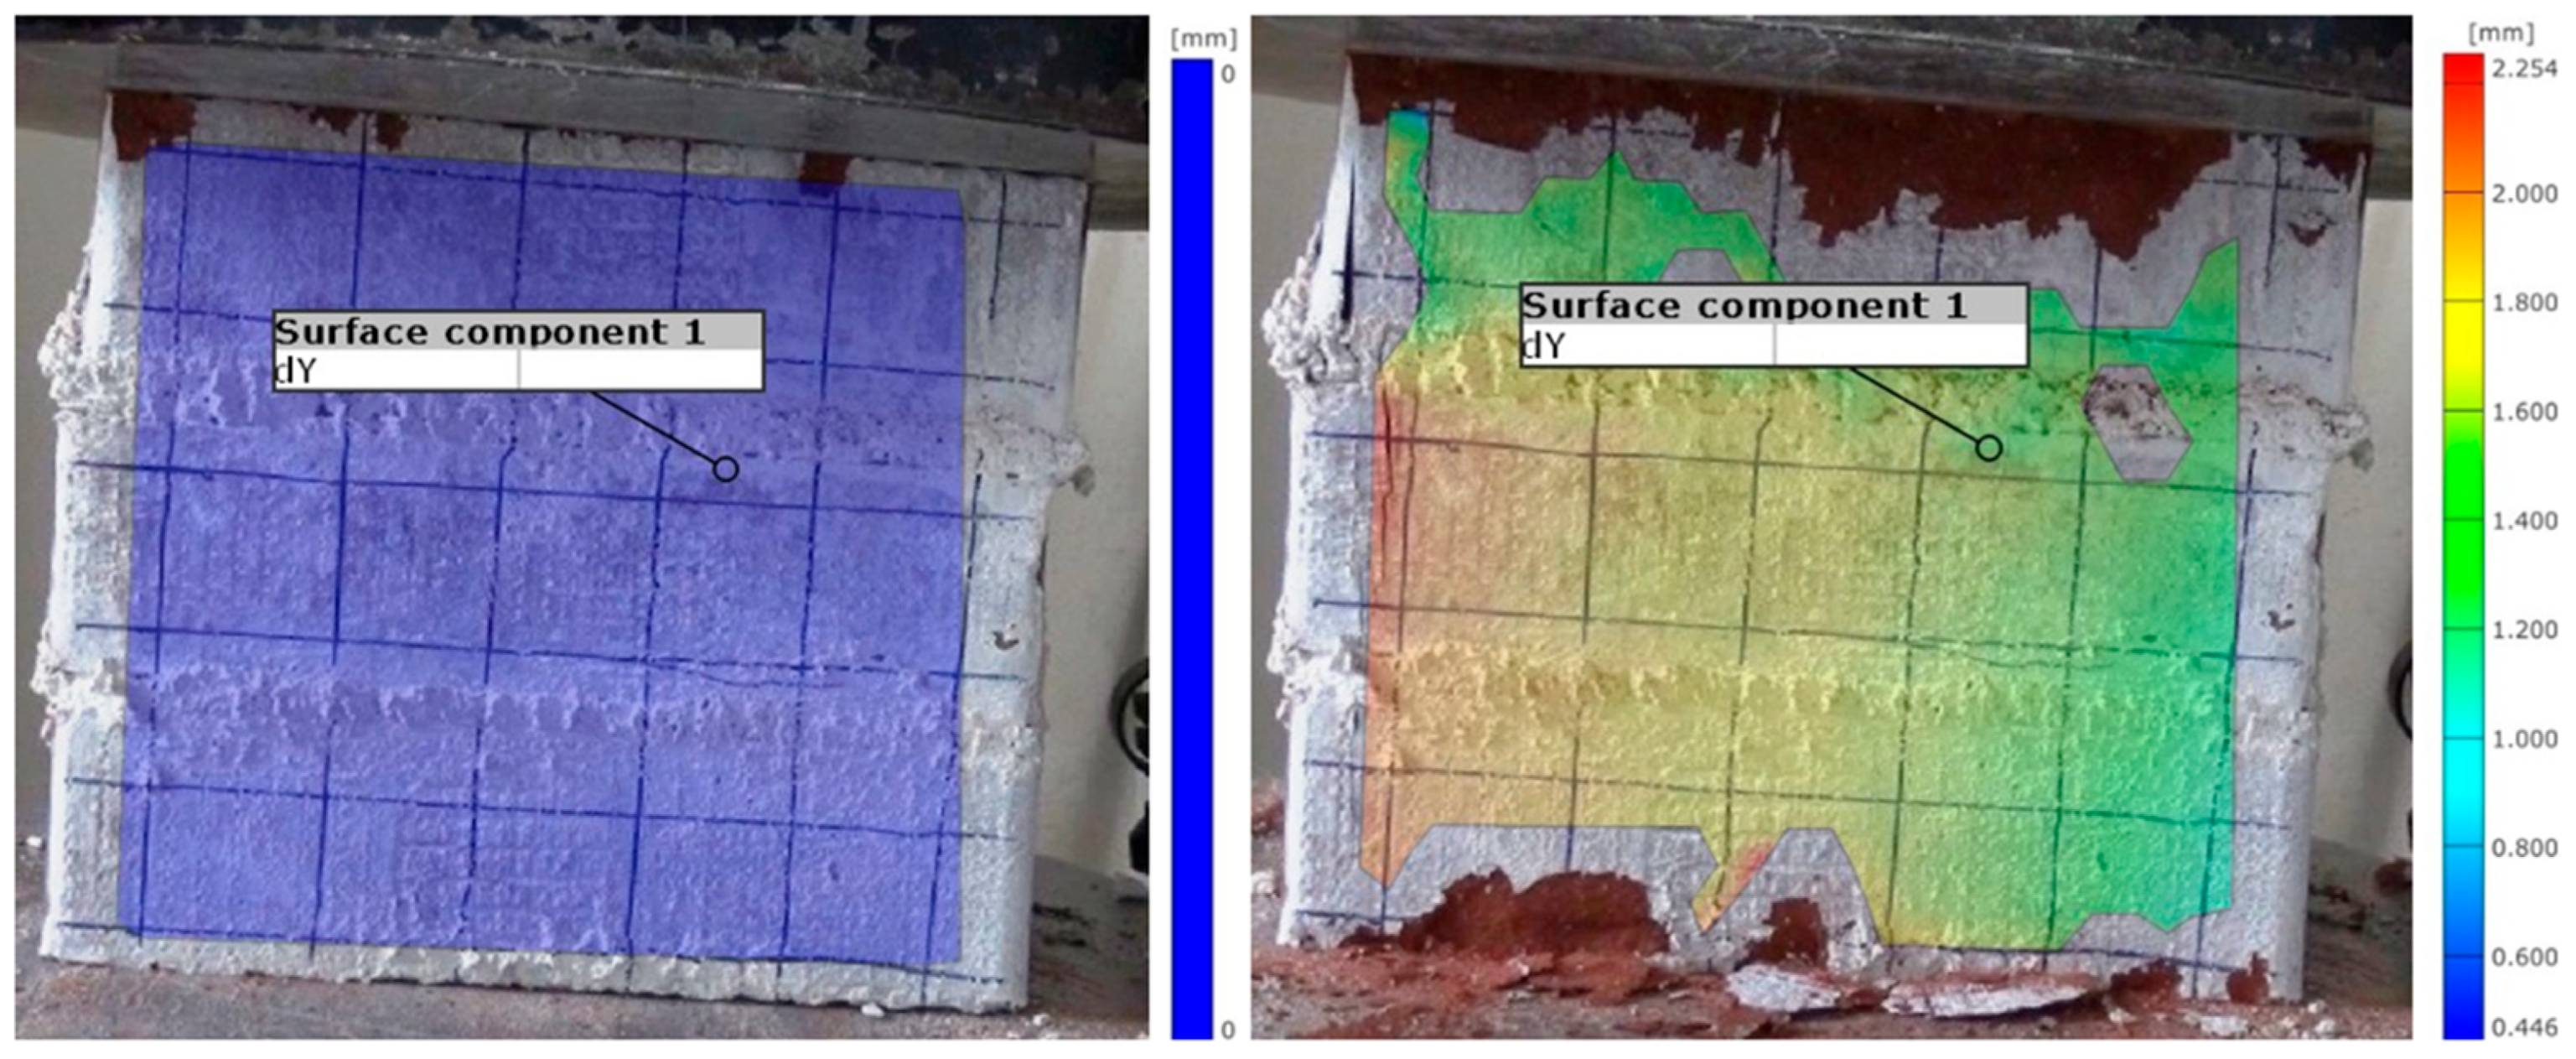
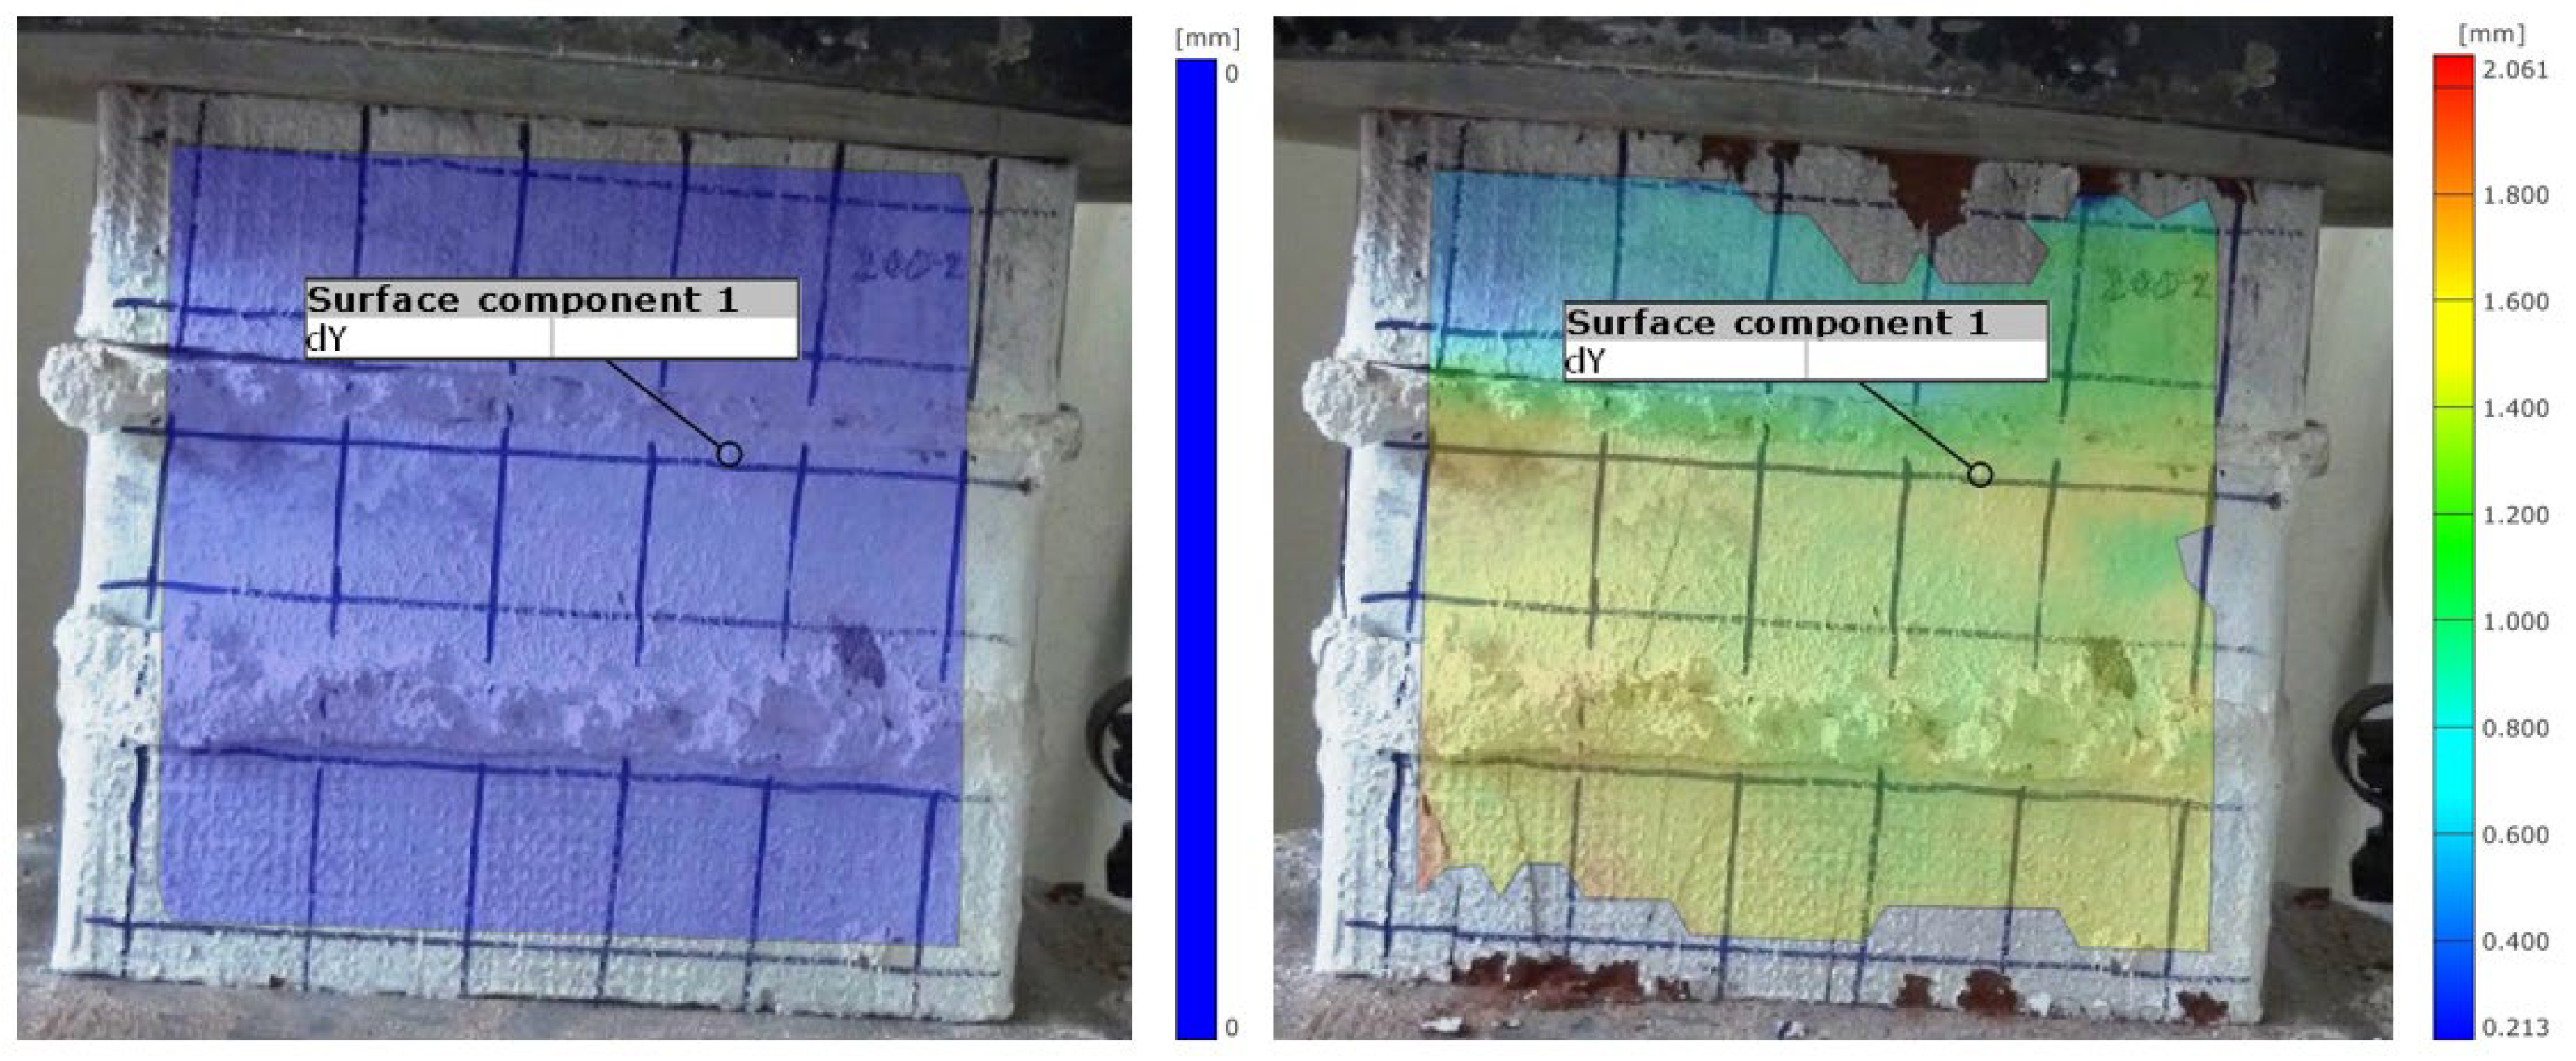
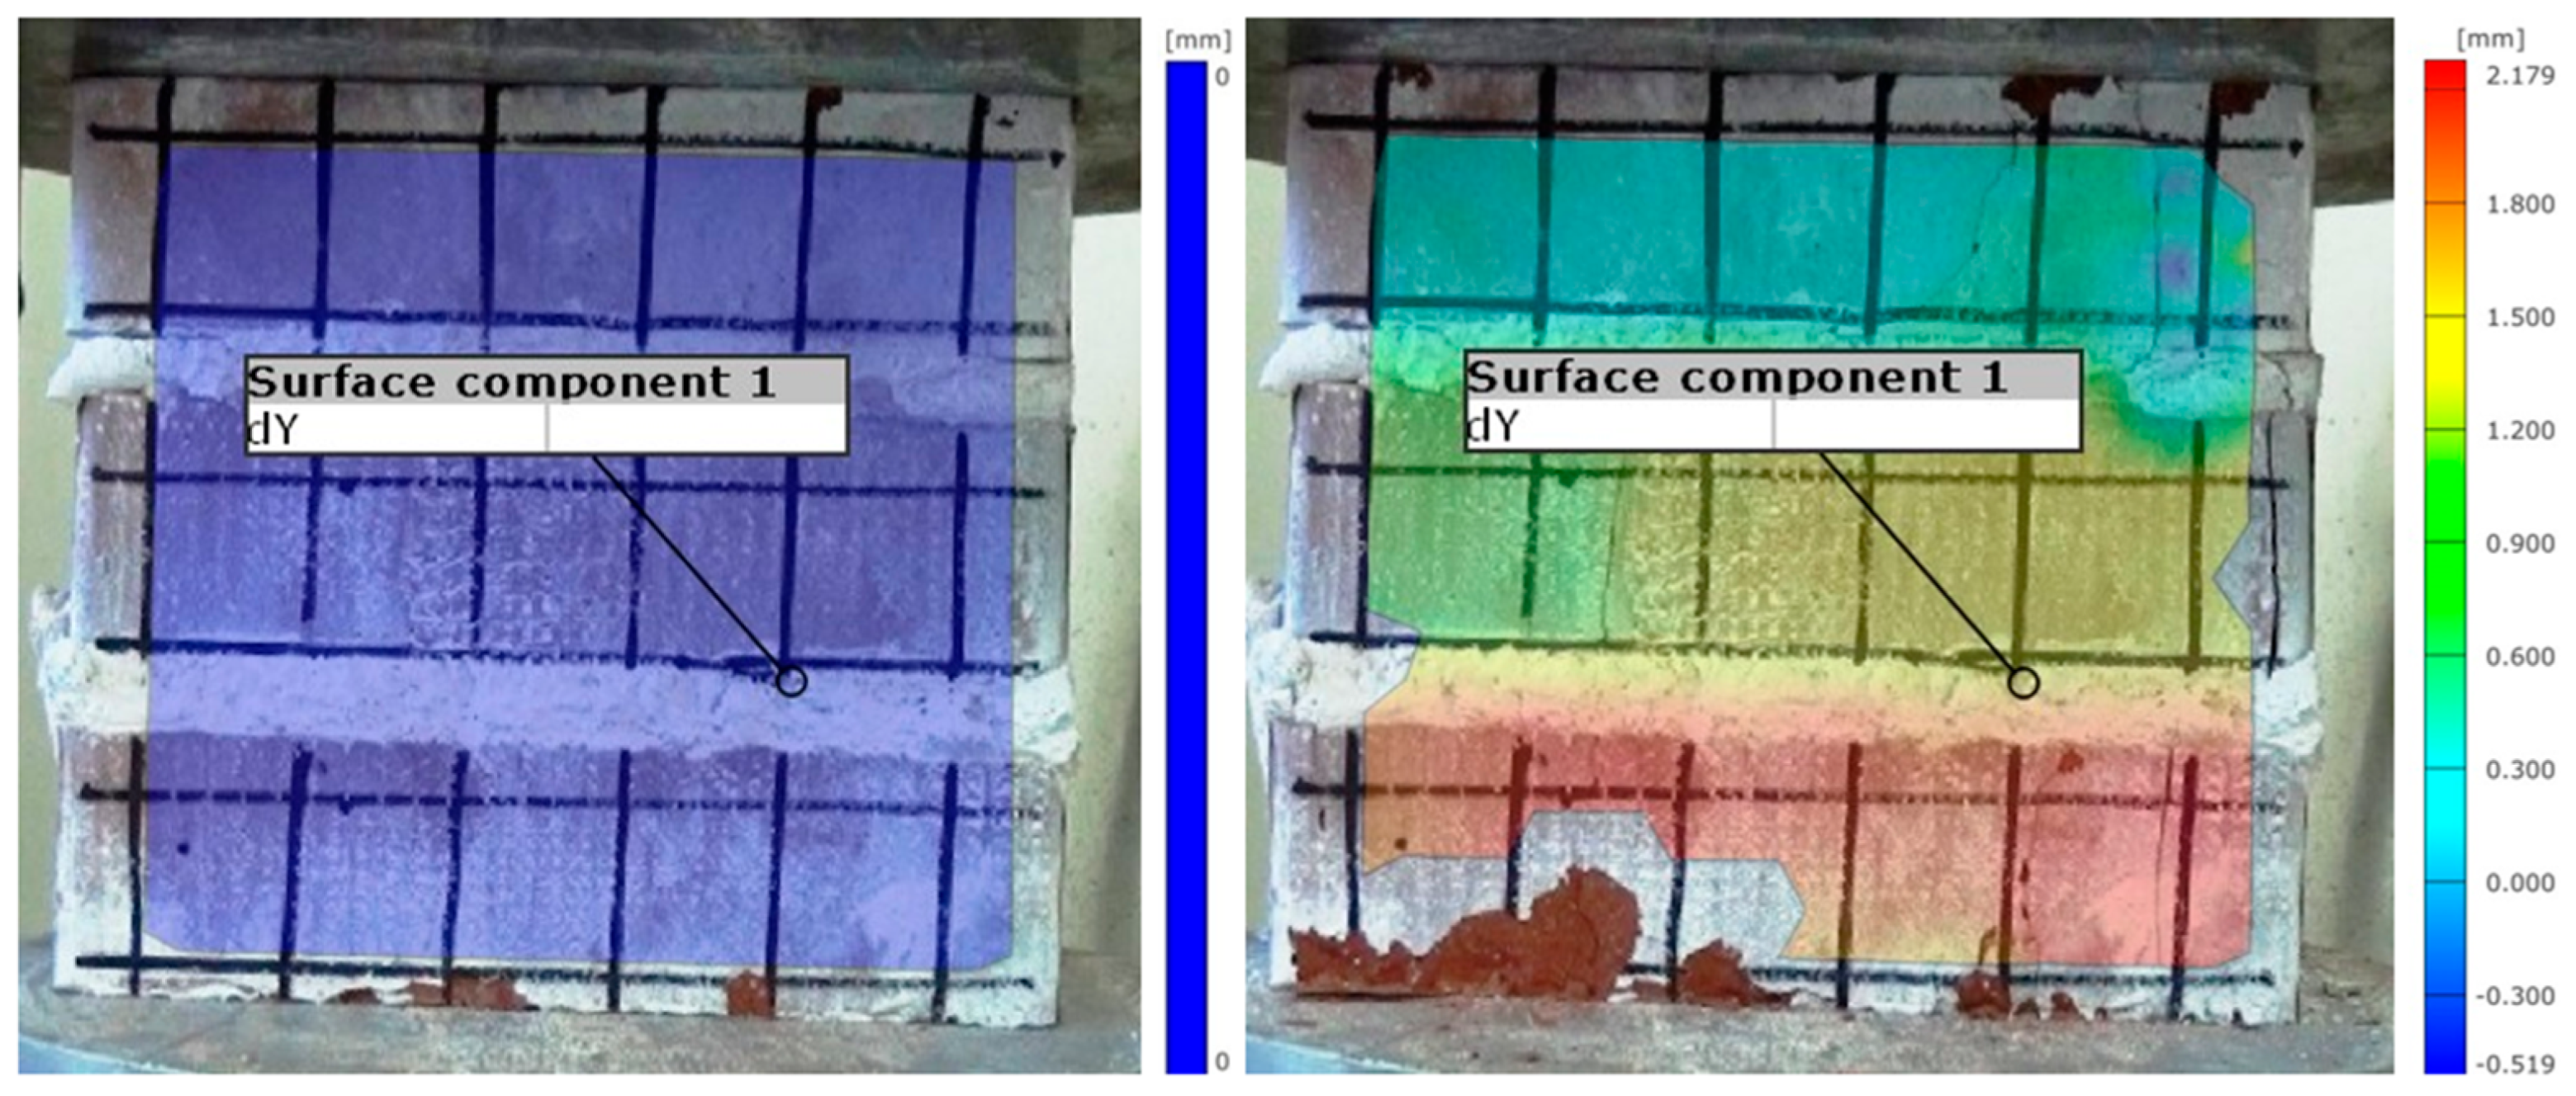
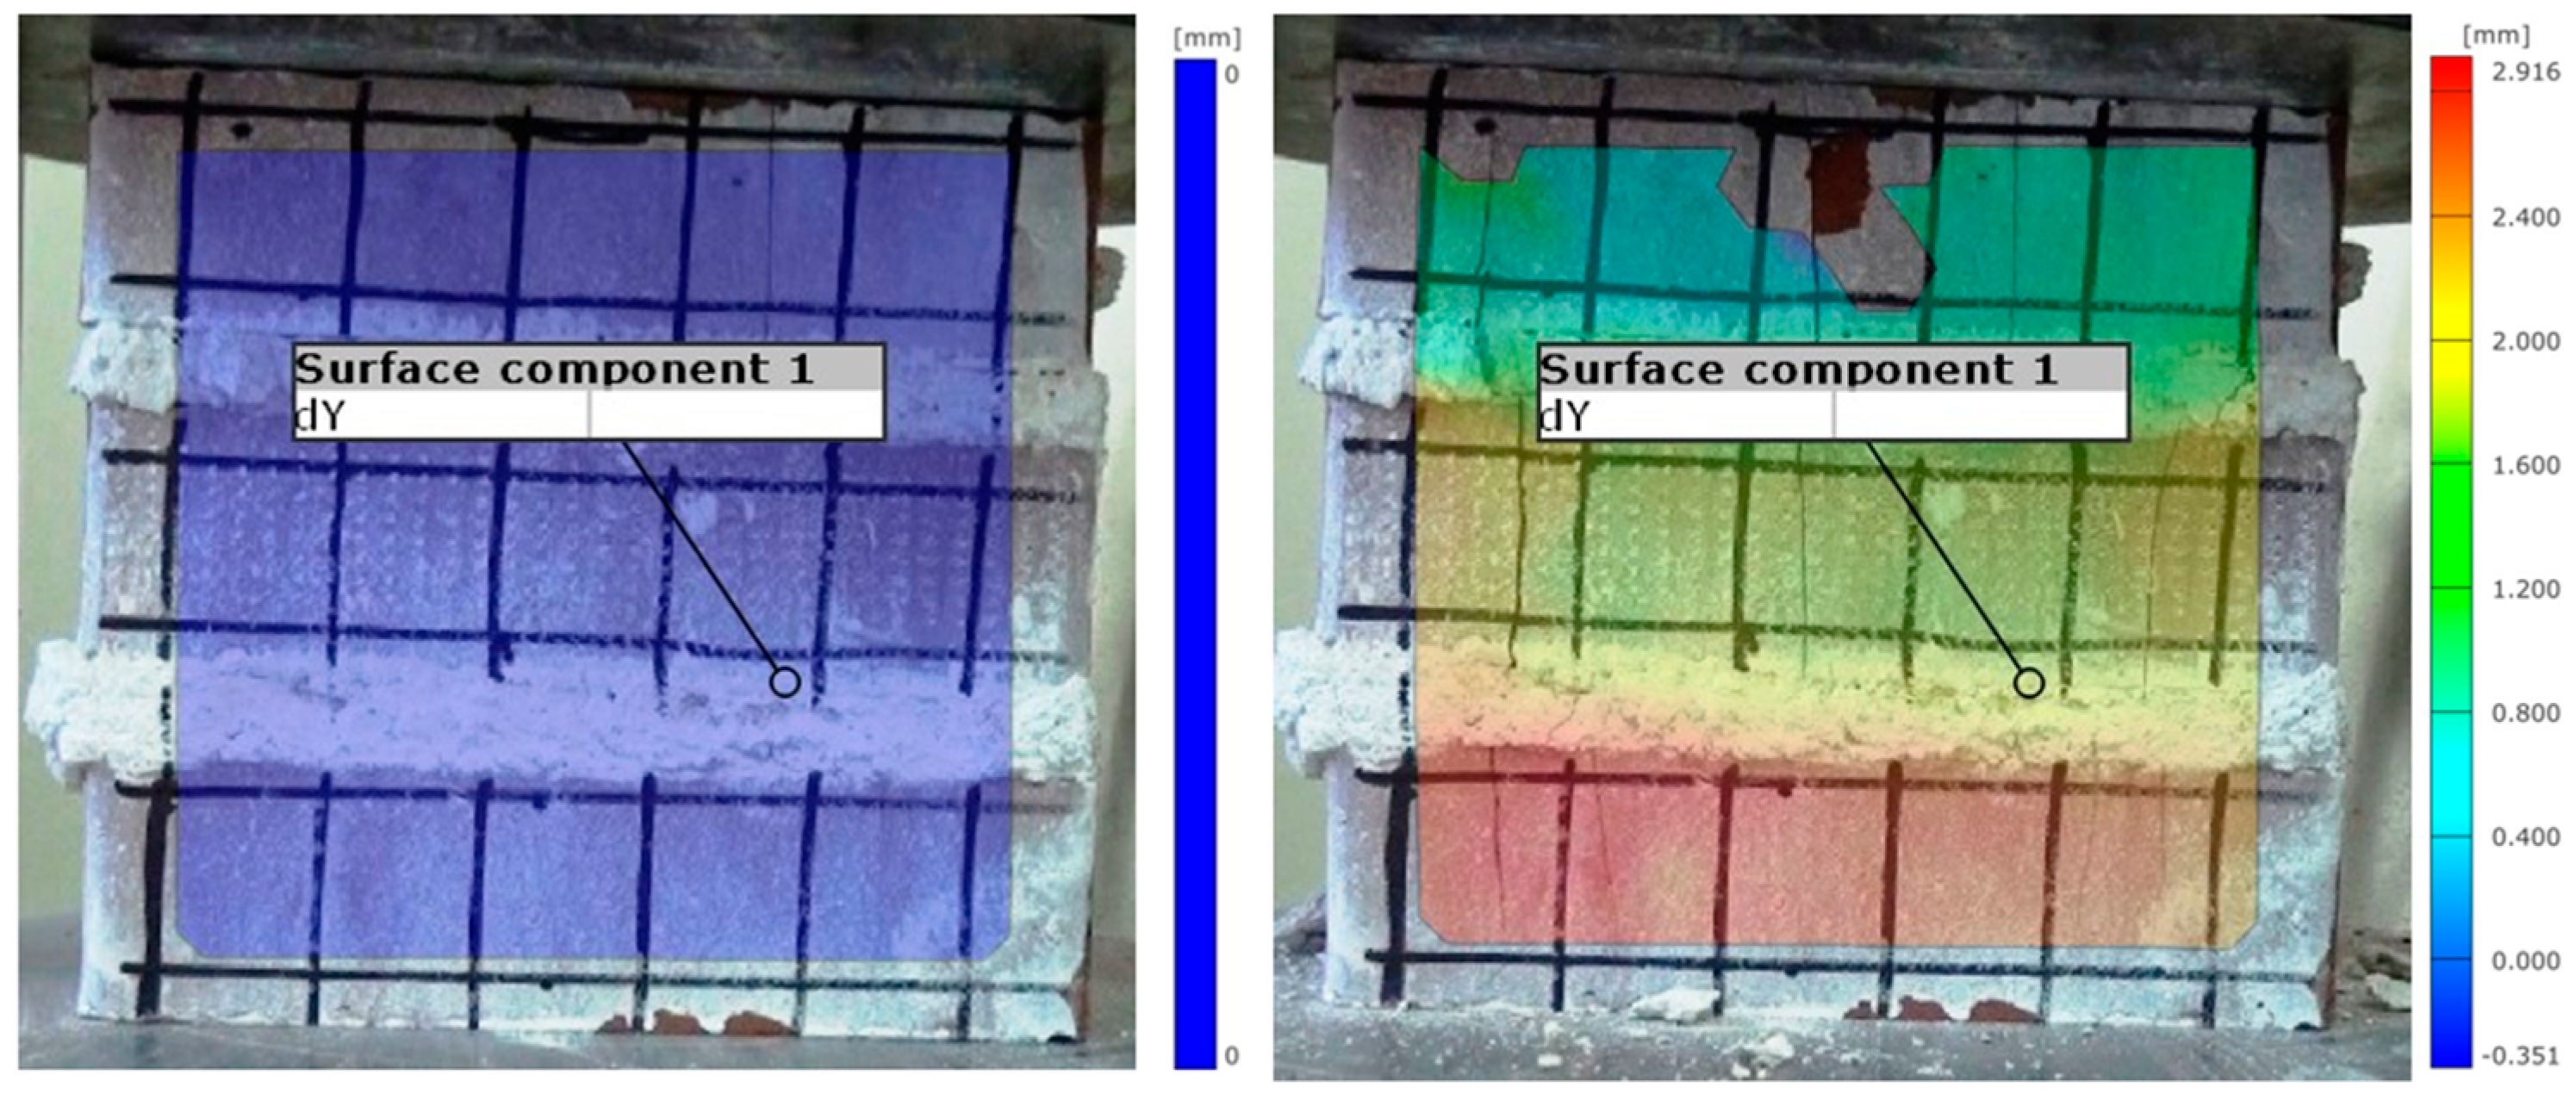
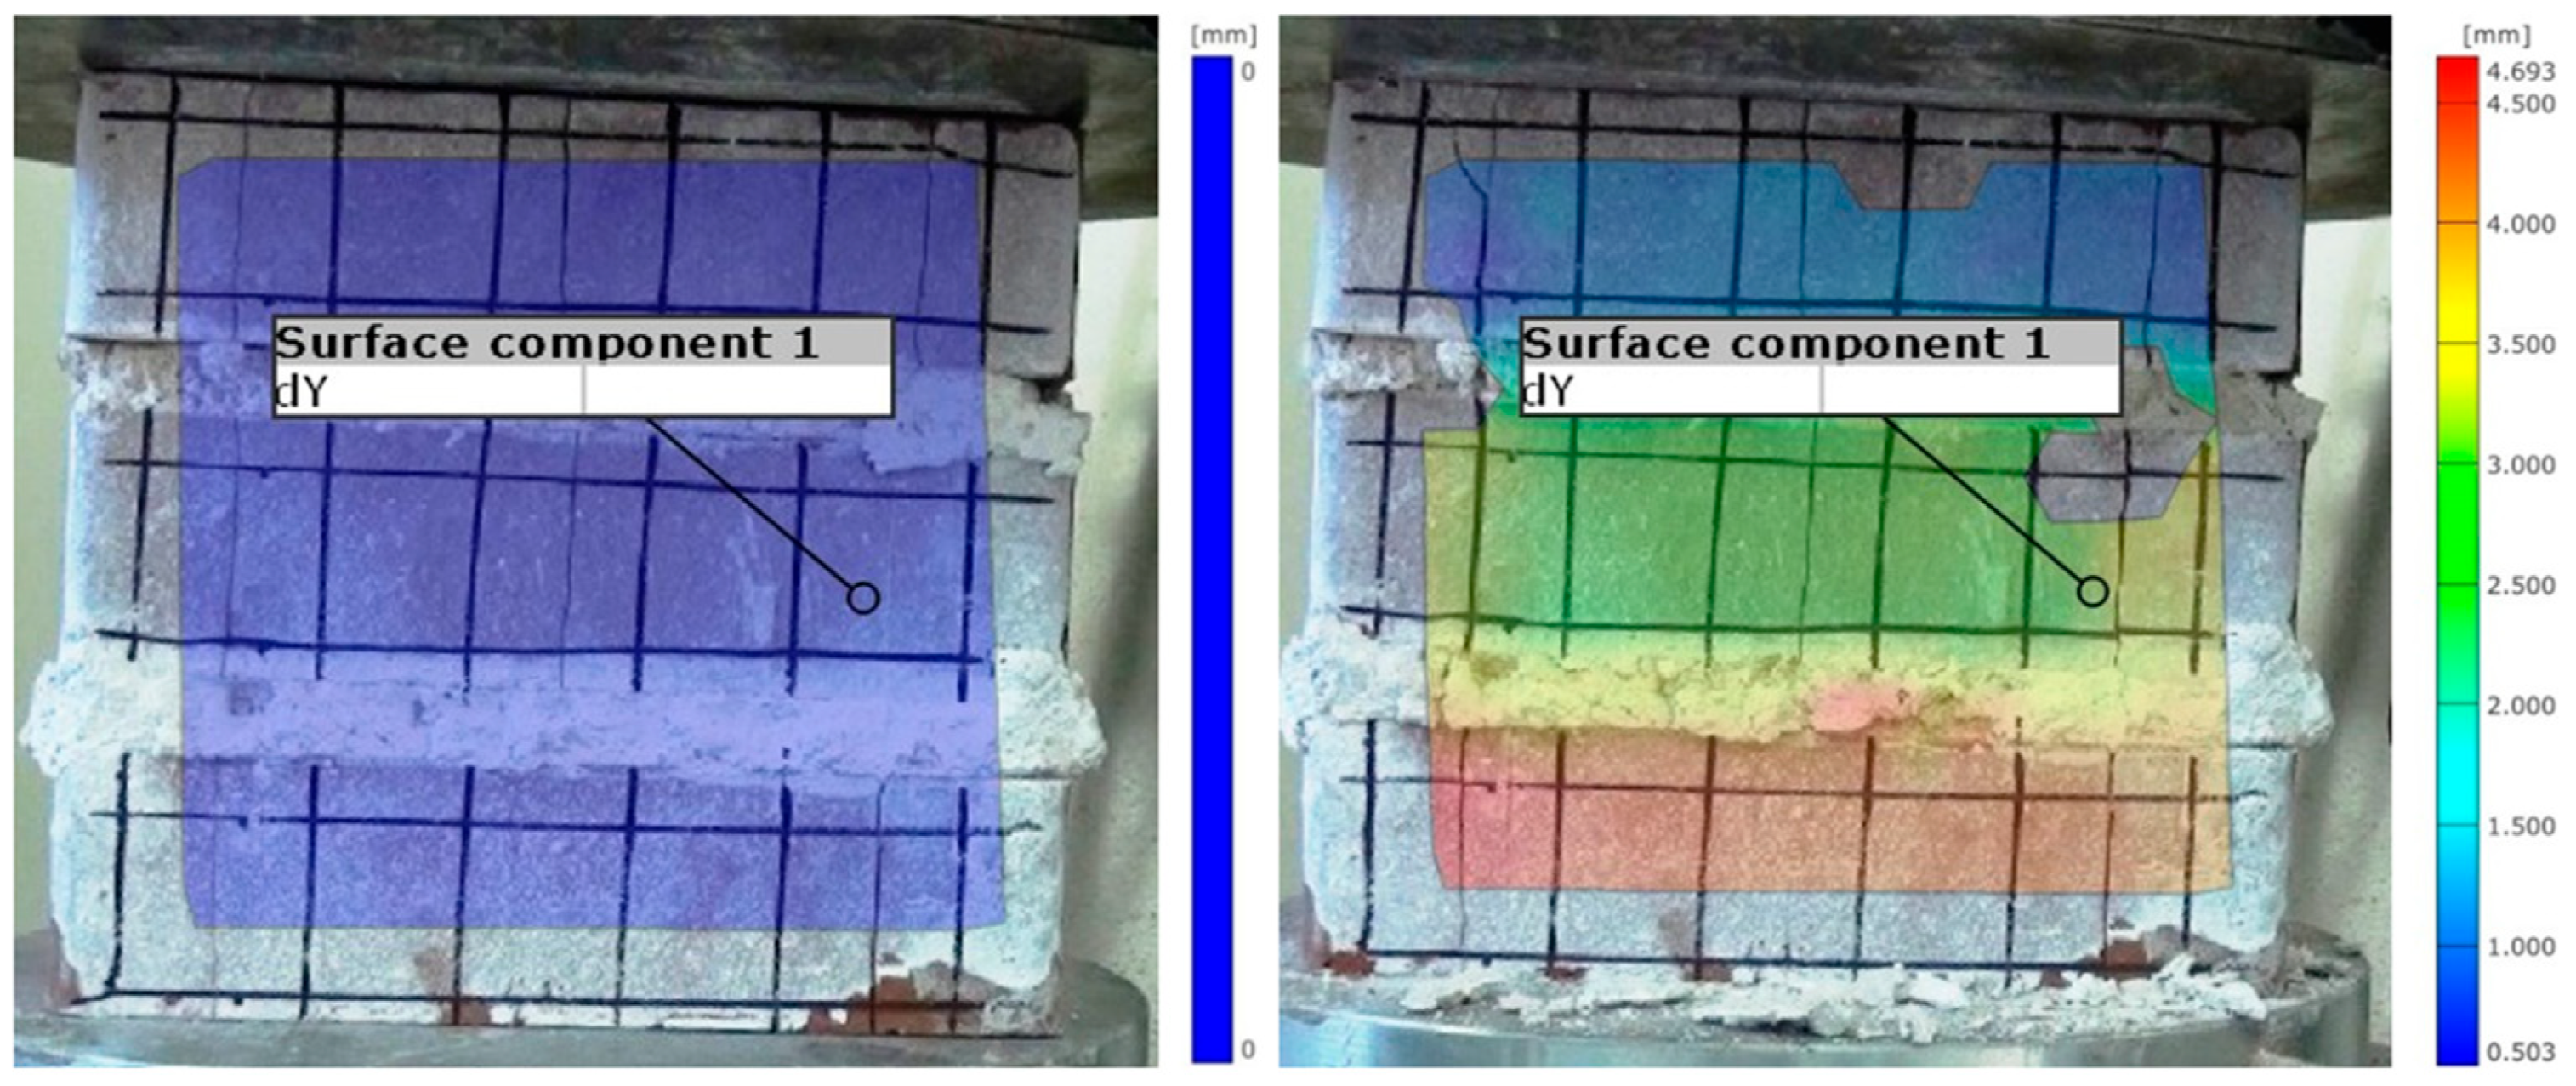
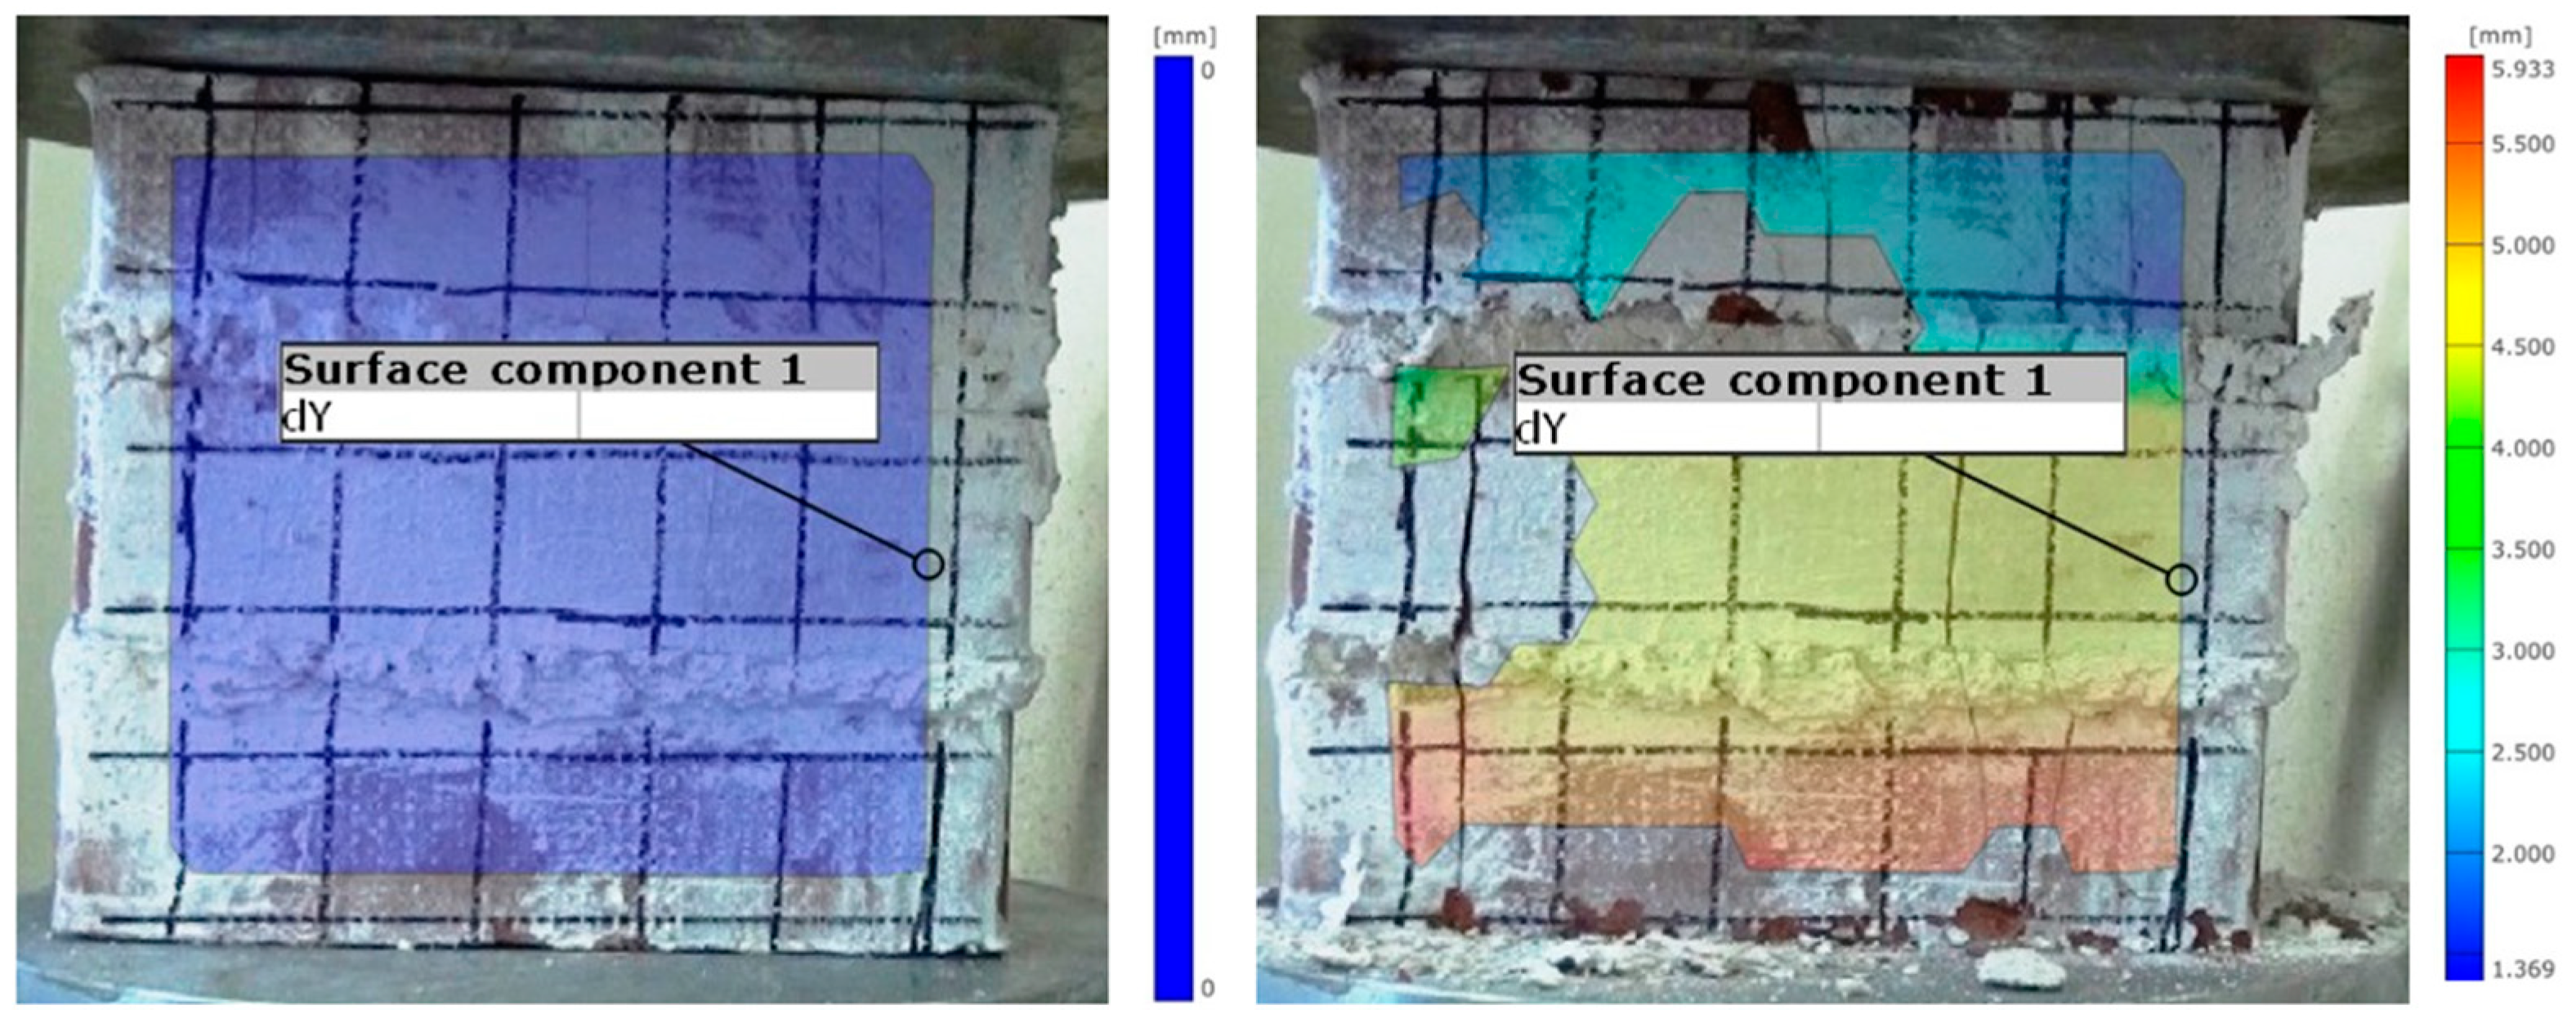
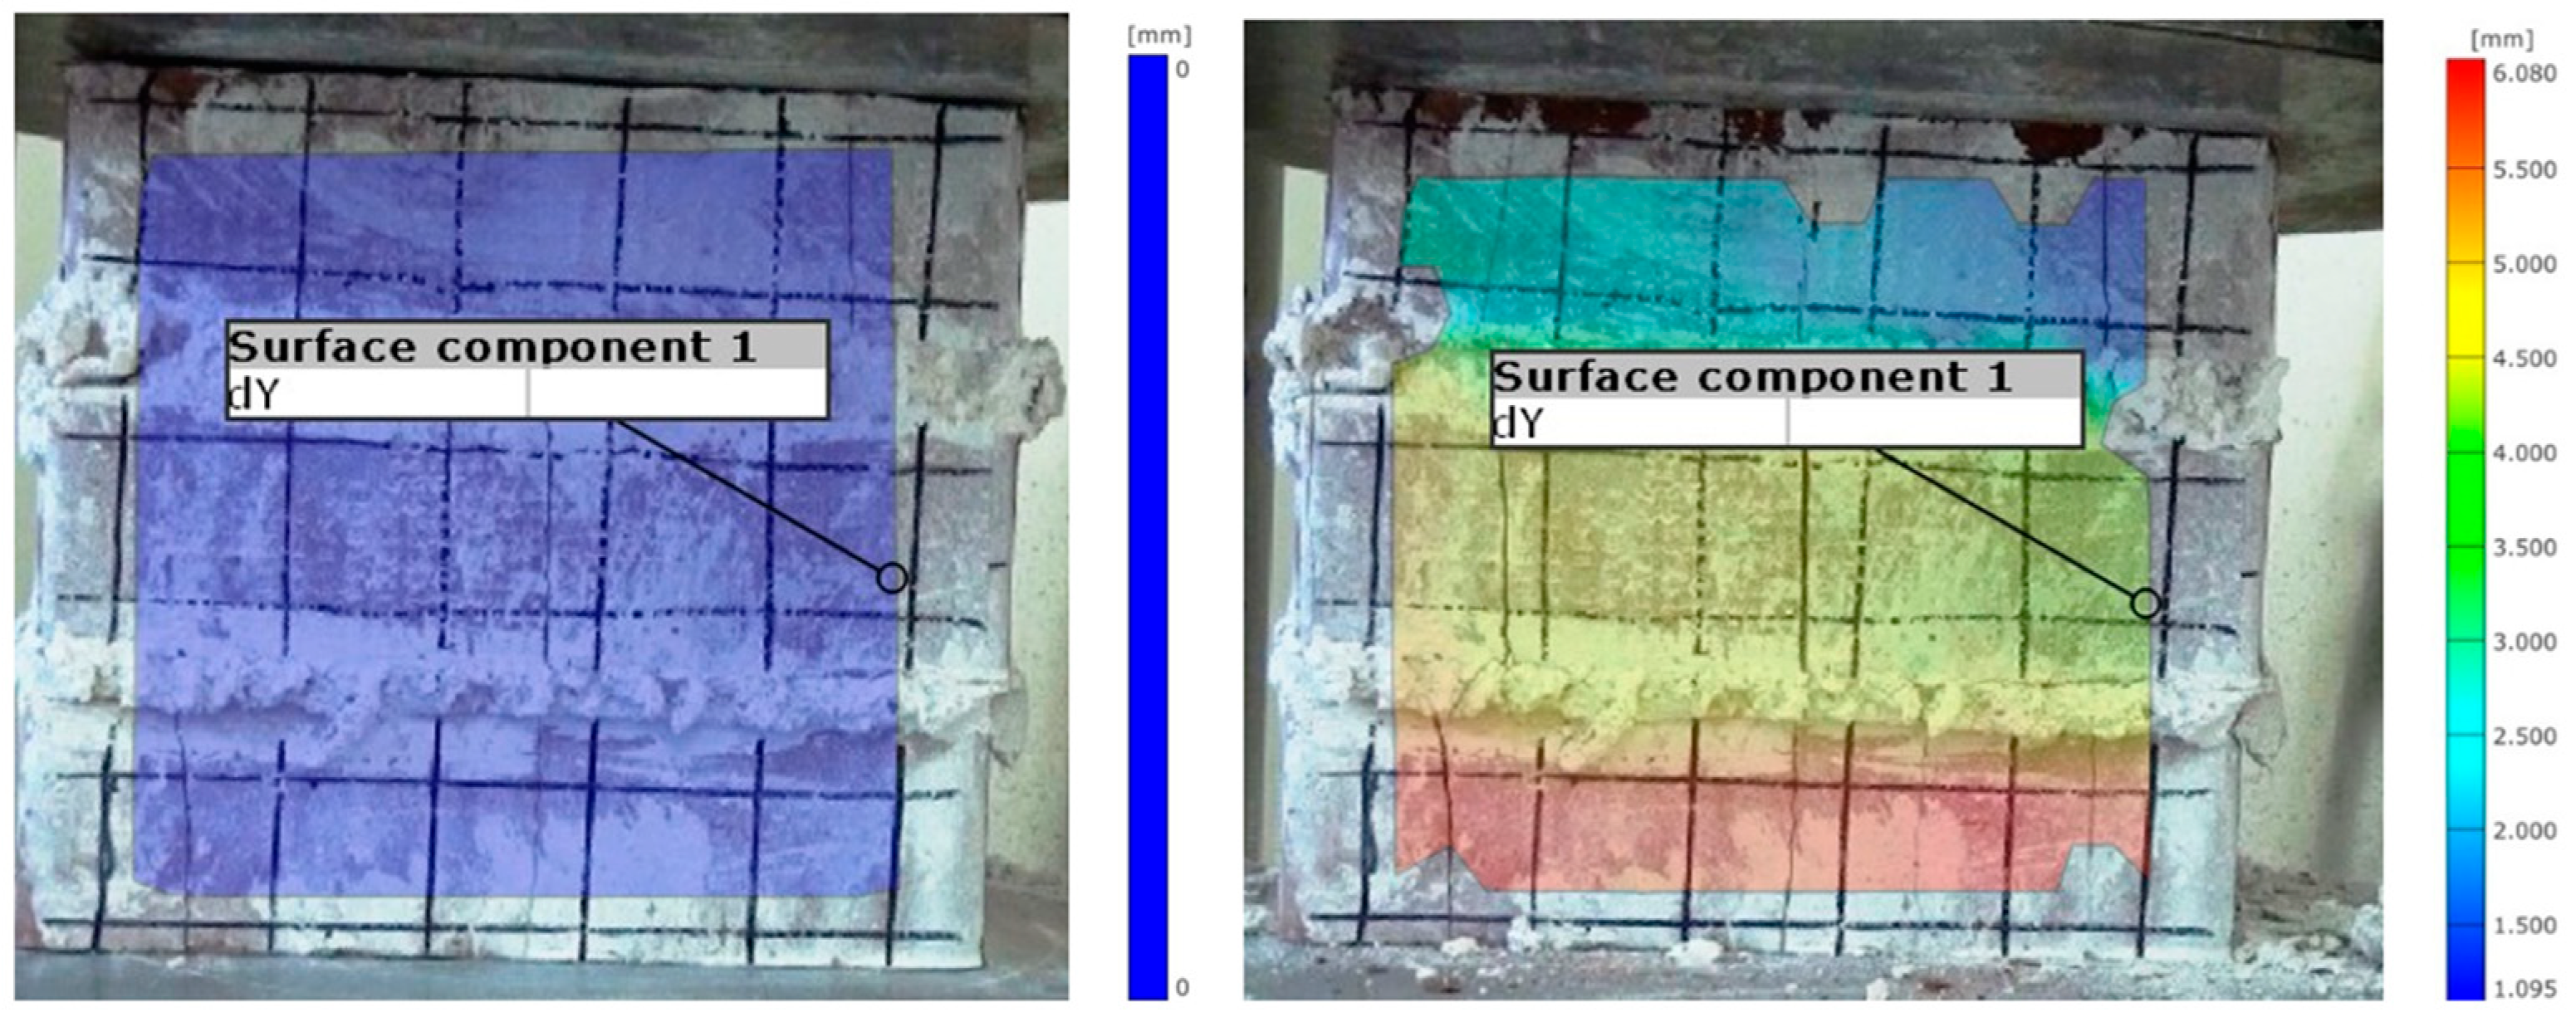
6.4. Digital Image Correlation (DIC) Comparison with Test Results
7. Conclusions
- The flexural strength lime-based mortar reduced to approximately 50% of the ambient value at 200 °C. Subsequently, from 200 °C onwards, there was a gradual decrease of approximately 30% until reaching 600 °C, resulting in zero as a final flexural strength due to total cracking at the 800 °C level. The compressive strength at 200 °C decreased to 80% of the compressive strength observed at ambient temperature. By the time it reached 600 °C, the compression strength had diminished to 5.09 N/mm2, representing 30% of the strength recorded at ambient temperature. However, above 600 °C, the specimens completely collapsed. Despite the decline in strength, the compressive strength at 600 °C (5.09 MPa) still retained considerable strength. Therefore, it can be inferred that this aligns with class M5, according to TBDY 2018 [34], EN 1015-11 [21], and EC6 [30].
- Similarly, trends over different temperature ranges were observed in the compressive strength analysis of brick units. Initially, up to 200 °C, the compressive strength decreased 20% and remained almost constant up to 600 °C. However, after 600 °C, brick units started to crack compared with ambient temperature conditions.
- Masonry prism stress–strain relationships can be used for calculations of masonry walls with lime-based M15 mortar, which are lacking in EN 1996-1-2 [30].
- DIC measurements and readings from testing displacement measurements were compatible with each other under the compression of the masonry prism. The accuracy level of the validation between the DIC and test results was satisfactory and can be used in the compression test displacement measurements.
- Transient thermal coefficient temperature-dependent material properties as per EC6 [33] and EN 1996-1-2 [30] can also be used for a masonry wall density of 1900 kg/m3, which is given for only a density of 900–1200 kg/m3 masonry walls that can be used for the transient thermal analysis of bricks with M15 lime-based mortar. In future studies, temperature-dependent material properties can be used as input data for loading condition numerical analysis and can be validated by actual testing in masonry structures. Validated transient thermal coefficients can be used for thermo-mechanical analysis (coupled analysis) for structural analysis during fire as a future study direction.
Author Contributions
Funding
Data Availability Statement
Acknowledgments
Conflicts of Interest
References
- Leal, D.F.; Munaiar Neto, J.; Maluk, C. Thermal performance of solid concrete masonry blocks with different compressive strengths. J. Build. Eng. 2024, 89, 109133. [Google Scholar] [CrossRef]
- Nguyen, T.-D.; Meftah, F. Fire resistance of clay hollow brick masonry walls: Numerical analysis using a simplified homogenized nonlinear thermal elastic model. Fire Saf. J. 2014, 66, 35–45. [Google Scholar] [CrossRef]
- Andreini, M.; Sassu, M. Simple tests and mechanical model for masonry materials at high temperatures. Mater. Res. Appl. 2011, 875–877, 1544. [Google Scholar] [CrossRef]
- Prieler, R.; Ortner, B.; Kitzmüller, P.; Thumser, S.; Schwabegger, G.; Hochenauer, C. Thermo-mechanical analysis of masonry brick walls with embedded test specimen under fire exposure. Fire Technol. 2024, 61, 875–926. [Google Scholar] [CrossRef]
- Yang, F.; Tchekwagep, J.J.K.; Wang, S.; Huang, S.; Cheng, X. The effect of extensive heat exposure on the mechanical properties of polymer-modified sulfoaluminate cement repair mortar. Case Stud. Constr. Mater. 2024, 20, e03348. [Google Scholar] [CrossRef]
- Bošnjak, J.; Gambarelli, S.; Sharma, A.; Mešković, A. Experimental and numerical studies on masonry after exposure to elevated temperatures. Constr. Build. Mater. 2020, 230, 116926. [Google Scholar] [CrossRef]
- Bamonte, P.; Gambarova, P.G. Compressive and Tensile Strength of Cement-Lime Mortars at High Temperature. Materials 2018, 11, 2518. [Google Scholar] [CrossRef]
- Singh, S.; Munjal, P. Bond strength and compressive stress-strain characteristics of brick masonry. J. Build. Eng. 2017, 9, 10–16. [Google Scholar] [CrossRef]
- Darmayadi, D.; Satyarno, I. Finite element modeling of masonry wall with mortar 1pc: 4 lime: 10 sand under lateral force. In Proceedings of the 4th International Conference on Sustainable Civil Engineering Structures and Construction Materials (SCESCM), Yogyakarta, Indonesia, 5–7 September 2018; MATEC Web of Conferences, London, UK. 2019; Volume 258, p. 05019. [Google Scholar] [CrossRef]
- Thamboo, J.A.; Dhanasekar, M. Correlation between the performance of solid masonry prisms and wallettes under compression. J. Build. Eng. 2019, 22, 429–438. [Google Scholar] [CrossRef]
- Ramirez, R.; Ghiassi, B.; Pineda, P.; Lourenço, P.B. Hygro-Thermo-Mechanical Analysis of Brick Masonry Walls Subjected to Environmental Actions. Appl. Sci. 2023, 13, 4514. [Google Scholar] [CrossRef]
- Estevan, L.; Torres, B.; Varona, F.B.; Baeza, F.J.; Ivorra, S. Shear strengthening of masonry walls with textile reinforced mortars (TRM) under high temperature exposure. J. Build. Eng. 2023, 63, 105511. [Google Scholar] [CrossRef]
- Cree, D.; Pliya, P. Limestone derived eggshell powder as a partial replacement of Portland cement for sustainable cement mortar production. J. Build. Eng. 2019, 26, 100852. [Google Scholar] [CrossRef]
- Tian, P.; Yang, W.; Lu, J.; Wu, X.; Wang, Z. Study on the shear properties of masonry pagoda mortar and its influencing factors. Case Stud. Constr. Mater. 2024, 20, e02981. [Google Scholar] [CrossRef]
- Parent, T.; Brocato, M.; Colas, A.-S.; Domede, N.; Garnier, D.; Lacarrière, L.B.; Meftah, F.; Mouatt, L.; Nougayrede, P.; Taforel, P. Before/after fire structural analysis of Notre-Dame de Paris cathedral: Comparison between a continuum, a discrete and a macro-element approach. J. Cult. Herit. 2024, 65, 135–144. [Google Scholar] [CrossRef]
- Soleymani, A.; Najafgholipour, M.A.; Johari, A. An experimental study on the mechanical properties of solid clay brick masonry with traditional mortars. J. Build. Eng. 2022, 58, 105057. [Google Scholar] [CrossRef]
- Liu, B.; Collier, J.; Sarhosis, V. Digital image correlation based crack monitoring on masonry arch bridges. Eng. Fail. Analysis 2025, 169, 109185. [Google Scholar] [CrossRef]
- Cakir, F.; Aydin, M.R.; Acar, V.; Aksar, B.; Akkaya, H.C. An experimental study on RC beams shear-strengthened with Intraply Hybrid U-Jackets Composites monitored by digital image correlation (DIC). Compos. Struct. 2023, 323, 117503. [Google Scholar] [CrossRef]
- ISO 834-1:2014; Fire Resistance Tests. Elements of Building Construction Specific Requirements for the Assessment of Fire Protection to Structural Steel Elements. European Standards: Brussels, Belgium, 2014.
- EN 998-2: 2011; Specification for Mortar for Masonry—Part 2: Masonry Mortar. European Standards: Brussels, Belgium, 2011.
- EN 1015-11; Methods of Test for Mortar for Masonry—Part 11: Determination of Flexural and Compressive Strength of Hardened Mortar. European Standards: Brussels, Belgium, 2019.
- ASTM C1314-21; Standard Test Method for Compressive Strength of Masonry Prisms. ASTM International: West Conshohocken, PA, USA, 2021.
- EN 772-1; Methods of Test for Masonry Units—Part 1: Determination of Compressive Strength. European Standards: Brussels, Belgium, 2015.
- Cakir, F. Assessment of Structural Integrity and Seismic Retrofit of Masonry Bridges Using Micropiles. Master’s Thesis, Illinois Institute of Technology, Chicago, IL, USA, 2011. [Google Scholar]
- Sánchez, I.B. Strengthening of Arched Masonry Structures with Composite Materials. Ph.D. Dissertation, University of Minho, Julho, Portugal, 2007. [Google Scholar]
- EN 1745; Masonry and Masonry Products—Methods for Determining Thermal Properties. European Standards: Brussels, Belgium, 2020.
- EN 1363-1:2020; Fire Resistance Tests General Requirements. European Standards: Brussels, Belgium, 2020.
- EN ISO10456; Building Materials and Products—Hygrothermal Properties—Tabulated Design Values and Procedures for Determining Declared and Design Thermal Values. European Standards: Brussels, Belgium, 2009.
- TS 825; Thermal Insulation Requirements for Buildings. Turkish Standards Institution: Ankara, Turkey, 2024.
- EN 1996-1-2; Eurocode 6—Design of Masonry Structures—Part 1-2: General Rules—Structural Fire Design. European Standards: Brussels, Belgium, 2024.
- Pachta, V.; Triantafyllaki, S.; Stefanidou, M. Performance of lime-based mortars at elevated temperatures. Constr. Build. Mater. 2018, 189, 576–584. [Google Scholar] [CrossRef]
- Pachta, V.; Stefanidou, M. Evaluation of the behaviour of lime and cement based mortars exposed at elevated temperatures. In Proceedings of the 12th International Conference on Structural Analysis of Historical Constructions, Barcelona, Spain, 16–18 September 2020. [Google Scholar] [CrossRef]
- EN 1996-1-1; Eurocode 6—Design of Masonry Structures—Part 1-1: General Rules for Reinforced and Unreinforced Masonry Structures. European Standards: Brussels, Belgium, 2020.
- TBDY 2018; Turkey Building Earthquake Regulation. Disaster and Emergency Management Presidency: Ankara, Turkey, 2018.
- Hossain, M.A.; Totoev, Y.Z.; Masia, M.J. Prediction of Joint Opening for Semi-interlocking Masonry at Large In-Plane Displacement Using MATLAB Image Analysis. In Lecture Notes in Civil Engineering, Proceedings of the 18th International Brick and Block Masonry Conference. IB2MaC 2024, Birmingham, UK, 21–24 July 2024; Milani, G., Ghiassi, B., Eds.; Springer: Cham, Switzerland, 2024; Volume 613. [Google Scholar] [CrossRef]
- Belliazzi, S.; Fabbrocino, F.; Lignola, G.P.; Prota, A. Advantages of using DIC for capturing mechanical shear sliding behaviour of the FRCM strengtened masonry. Structures 2024, 68, 107056. [Google Scholar] [CrossRef]
- Wilson, R.; Acikgoz, S.; Pulatsu, B. The Time-Dependent Behaviour of Clay Brick and Lime Mortar: An Experimental Investigation Using 2D Digital Image Correlation (DIC) and Acoustic Emission (AE) Monitoring. In Lecture Notes in Civil Engineering. IB2MaC 2024, Birmingham, UK, 21–24 July 2024; Milani, G., Ghiassi, B., Eds.; Springer: Cham, Switzerland, 2025; Volume 613. [Google Scholar] [CrossRef]
- Bello, I.; Martínez-Abella, F.; Wardeh, G.; González-Fonteboa, B. Complete stress-strain analysis of masonry prisms under compressive loading-unloading cycles through digital image correlation. Eng. Struct. 2024, 298, 117088. [Google Scholar] [CrossRef]
- Kumar, S.L.; Aravind, H.B.; Hossiney, N. Digital image correlation (DIC) for measuring strain in brick masonry specimen using Ncorr open source 2D MATLAB program. Results Eng. 2019, 4, 100061. [Google Scholar] [CrossRef]
- Zeiss. Inspect 2025; Correlate Trial Version 2D; Zeiss: Oberkochen, Germany, 2025. [Google Scholar]


| General Information | |
|---|---|
| Material Structure | Special blend with natural hydraulic lime base and adjusted gradients |
| Cement Content (%) | 0% |
| Appearance | Off-white and white coffee |
| Sheff Life | 12 months in dry place in unopened packaging. |
| Package | 20 kg kraft bag |
| Application Information | |
| Implementation Process | Min. 30 min at 20 °C |
| Application Ground Temperature | (+5 °C)–(+35 °C) |
| Grain Size | 0–8 mm |
| Application Thickness | Each storey 1–5 cm |
| Performance Information | |
| Flexural Strength | 4.0 N/mm2 |
| Compressive Strength (EN 1015-11) [21] | 15–20 N/mm2 (M15 Class) |
| Elastic Modulus | 7000 N/mm2 |
| Water Vapor Permeability (EN 1745) [26] | μ < 35 |
| Capillary Water Absorption (EN 1015-18) | 0.2 kg m−2 h−0.5 |
| Bond Strength | >0.15 N/mm2 |
| Reaction to Fire | A1 |
| Test Sample No | Ambient N/mm2 | 200 °C N/mm2 | 400 °C N/mm2 | 600 °C N/mm2 | 800 °C N/mm2 |
|---|---|---|---|---|---|
| No:1 | 15.73 | 10.45 | 12.03 | 5.64 | 0.00 |
| No:2 | 15.31 | 14.16 | 11.78 | 5.76 | 0.00 |
| No:3 | 14.35 | 11.82 | 12.44 | 4.47 | 0.00 |
| No:4 | 15.19 | 11.17 | 11.96 | 4.60 | 0.00 |
| No:5 | 15.23 | 14.76 | 12.89 | 4.96 | 0.00 |
| No:6 | 15.50 | 11.91 | 13.00 | 5.11 | 0.00 |
| Average | 15.22 | 12.38 | 12.35 | 5.09 | 0.00 |
| Test Sample No | Ambient N/mm2 | 200 °C N/mm2 | 400 °C N/mm2 | 600 °C N/mm2 | 800 °C N/mm2 |
|---|---|---|---|---|---|
| No:1 | 4.73 | 2.40 | 1.05 | 1.42 | 0.00 |
| No:2 | 4.84 | 2.70 | 0.97 | 0.88 | 0.00 |
| No:3 | 4.31 | 2.19 | 1.06 | 1.09 | 0.00 |
| Average | 4.63 | 2.43 | 1.03 | 1.13 | 0.00 |
| Test Sample No | Ambient N/mm2 | 200 °C N/mm2 | 400 °C N/mm2 | 600 °C N/mm2 | 800 °C N/mm2 |
|---|---|---|---|---|---|
| No:1 | 45.39 | 36.88 | 32.73 | 32.90 | 0.00 |
| No:2 | 42.66 | 35.19 | 32.80 | - | 0.00 |
| No:3 | 42.97 | 36.94 | 32.64 | - | 0.00 |
| Average | 43.68 | 36.34 | 32.76 | 32.90 | 0.00 |
| Test Sample No | Ambient N/mm2 | 200 °C N/mm2 | 400 °C N/mm2 | 600 °C N/mm2 | 800 °C N/mm2 |
|---|---|---|---|---|---|
| No:1 | 18.30 | 13.75 | 11.05 | 8.17 | - |
| No:2 | 18.67 | 12.82 | 11.60 | 8.62 | - |
| No:3 | 20.34 | 11.82 | 8.04 | 7.68 | - |
| Average | 19.10 | 12.80 | 11.32 | 8.16 | - |
| Temperature | K | fb N/mm2 | fm N/mm2 | fkcalculated N/mm2 | fktest N/mm2 |
|---|---|---|---|---|---|
| Ambient | 0.55 | 43.7 | 15.22 | 17.51 | 18.50 |
| 200 °C | 0.55 | 36.3 | 12.38 | 14.47 | 12.40 |
| 400 °C | 0.55 | 32.8 | 12.35 | 13.45 | 11.00 |
| 600 °C | 0.55 | 32.0 | 5.09 | 10.34 | 7.90 |
| 800 °C | 0.55 | - | - | - | - |
| Test Sample No | Ambient N/mm2 | 200 °C N/mm2 | 400 °C N/mm2 | 600 °C N/mm2 | 800 °C N/mm2 |
|---|---|---|---|---|---|
| No:1 | 3068 | 2441 | - | 538 | 83 |
| No:2 | 2725 | 2096 | 911 | 388 | 167 |
| No:3 | 2440 | 1405 | - | 263 | 0 |
| Average | 3047 | 1980 | 911 | 337 | 125 |
| Temperature | Ambient Temp. Mean | 200 °C | 400 °C | 600 °C | 800 °C |
|---|---|---|---|---|---|
| Mean Stress (Mpa) | 18.5 | 12.4 | 11.0 | 7.9 | - |
| Mean Elastic Strain (mm/mm) (EC6) | 0.0021 | 0.0022 | 0.0065 | 0.0083 | - |
| Mean Ultimate Strain (mm/mm) | 0.0061 | 0.0065 | 0.0143 | 0.0239 | - |
| Specimen | Digital Image Correlation (mm) | Test Results (mm) | Error (%) |
|---|---|---|---|
| Ambient Temperature 1 | 1.451 | 1.475 | 7.7 |
| Ambient Temperature 2 | 1.771 | 1.932 | 8.3 |
| Ambient Temperature 3 | 2.254 | 2.442 | 1.6 |
| 200 °C-1 | 1.649 | 1.728 | 4.5 |
| 200 °C-2 | 2.061 | 2.127 | 3.1 |
| 200 °C-3 | 2.179 | 2.317 | 6.0 |
| 400 °C-2 | 2.916 | 2.825 | 3.2 |
| 600 °C-1 | 4.693 | 4.700 | 0.2 |
| 600 °C-2 | 5.933 | 5.842 | 1.6 |
| 600 °C-3 | 6.080 | 6.353 | 4.3 |
Disclaimer/Publisher’s Note: The statements, opinions and data contained in all publications are solely those of the individual author(s) and contributor(s) and not of MDPI and/or the editor(s). MDPI and/or the editor(s) disclaim responsibility for any injury to people or property resulting from any ideas, methods, instructions or products referred to in the content. |
© 2025 by the authors. Licensee MDPI, Basel, Switzerland. This article is an open access article distributed under the terms and conditions of the Creative Commons Attribution (CC BY) license (https://creativecommons.org/licenses/by/4.0/).
Share and Cite
Kara, A.F.; Cakir, F.; Calis, M. Modulus of Elasticity and Mechanical Properties Assessment of Historical Masonry Elements After Elevated Temperature: Experimental Study and Numerical Analysis. Buildings 2025, 15, 2324. https://doi.org/10.3390/buildings15132324
Kara AF, Cakir F, Calis M. Modulus of Elasticity and Mechanical Properties Assessment of Historical Masonry Elements After Elevated Temperature: Experimental Study and Numerical Analysis. Buildings. 2025; 15(13):2324. https://doi.org/10.3390/buildings15132324
Chicago/Turabian StyleKara, Ahmet Fazıl, Ferit Cakir, and Metehan Calis. 2025. "Modulus of Elasticity and Mechanical Properties Assessment of Historical Masonry Elements After Elevated Temperature: Experimental Study and Numerical Analysis" Buildings 15, no. 13: 2324. https://doi.org/10.3390/buildings15132324
APA StyleKara, A. F., Cakir, F., & Calis, M. (2025). Modulus of Elasticity and Mechanical Properties Assessment of Historical Masonry Elements After Elevated Temperature: Experimental Study and Numerical Analysis. Buildings, 15(13), 2324. https://doi.org/10.3390/buildings15132324