Article

Multi-Indicator Environmental Impact Assessment of Recycled Aggregate Concrete Based on Life Cycle Analysis

1
School of Architectural Engineering, Shenyang University, Shenyang 110044, China
2
Northeast Center for Geological Science and Technology Innovation, Shenyang 110044, China
3
Key Laboratory of Environmental and Geotechnical Engineering of Liaoning Province, Shenyang 110044, China
*
Author to whom correspondence should be addressed.
Buildings 2025, 15(13), 2301; https://doi.org/10.3390/buildings15132301
Submission received: 4 June 2025 / Revised: 18 June 2025 / Accepted: 25 June 2025 / Published: 30 June 2025
(This article belongs to the Section Building Materials, and Repair & Renovation)

Abstract

With the ongoing acceleration in urban development, the volume of construction and demolition waste continues to rise, while the availability of natural aggregates is steadily declining. Utilizing recycled aggregates in concrete has become a vital approach to fostering sustainability within the construction sector. This research develops a life cycle-based environmental impact evaluation model for recycled aggregate concrete, applying the Life Cycle Assessment (LCA) framework. Through the eFootprint platform, a quantitative evaluation is carried out for C30-grade concrete containing varying levels of recycled aggregate replacement. Four replacement ratios of recycled coarse aggregate (30%, 50%, 70%, and 100%) were evaluated. The assessment includes six key environmental indicators: Global Warming Potential (GWP), Primary Energy Demand (PED), Abiotic Depletion Potential (ADP), Acidification Potential (AP), Eutrophication Potential (EP), and Respiratory Inorganics (RI). The findings reveal that higher substitution rates of recycled aggregate lead to noticeable reductions in RI, EP, and AP, indicating improved environmental performance. Conversely, slight increases are observed in GWP and PED, especially under long transport distances. Analysis of contributing factors and sensitivity indicates that cement manufacturing is the principal driver of these increases, contributing over 80% of the total GWP, PED, and ADP impacts, with aggregate transport as the next major contributor. This study offers methodological insights into the environmental evaluation of recycled aggregate concrete and supports the green design and development of low-carbon strategies in construction.

1. Introduction

With the accelerating pace in urbanization, the scale of construction activities continues to expand, leading to increasingly severe issues of resource depletion and environmental pollution [1]. As the most widely used building material, concrete relies heavily on the extraction of natural aggregates and the calcination of cement clinker, making it one of the major contributors to carbon emissions and resource exhaustion in the construction sector [2,3]. According to statistics, China generates over 3 billion tons of construction and demolition waste annually, accounting for more than 40% of total municipal solid waste [4]. However, the resource utilization rate remains below 10%, significantly lower than the average of nearly 90% achieved in developed regions such as the European Union. The traditional disposal method, primarily landfill, is no longer compatible with the goals of ecological civilization and the national “dual carbon” strategy [5]. Therefore, promoting the recycling of construction waste and accelerating the development of green building materials has become an urgent priority for achieving sustainable development [6,7].
Life Cycle Assessment (LCA) is a systematic methodology for evaluating resource consumption and environmental impacts throughout the entire life cycle of a product or process [8,9,10]. It has been widely applied in the environmental analysis of the construction materials industry [11,12]. Internationally, the integration of LCA with green building practices began relatively early [13,14,15,16]. Lawrence et al. [17] highlighted that the BREEAM framework adopts LCA as one of its core assessment tools, covering all stages of a building’s life cycle, including site selection, design, construction, and operation, while employing a weighting mechanism to quantify environmental burdens. Similarly, Japan’s CASBEE system evaluates environmental performance based on the ratio of environmental load to building quality, emphasizing a systemized scoring approach within the LCA framework [18]. Guggemos et al. [19] compared the environmental impacts of office buildings with concrete and steel structures, revealing that the former entails higher energy consumption during the construction phase. In China, efforts have also been made to localize the LCA methodology [20,21]. For example, Gong Zhiqi et al. [22] developed an LCA model tailored to the assessment of building materials and analyzed the environmental loads associated with the production, use, and recycling of common materials such as cement, steel, and PVC.
In recent years, recycled concrete has attracted increasing attention as a green building material due to its potential to partially or fully replace natural aggregates with recycled aggregates derived from construction and demolition waste [23,24]. Dilbas et al. [25] reported that the use of ball-milled recycled aggregates significantly enhanced the strength of recycled concrete by up to 1.54 times. Marinković et al. [26] compared the environmental impacts of recycled aggregate concrete and conventional concrete, concluding that although both exhibit comparable strength, there is a notable difference in resource consumption. They further found that the environmental impact of recycled aggregate concrete can be higher, depending on the mode and distance of aggregate transportation. Park et al. [27] evaluated the environmental implications of dry and wet processing methods for recycled aggregate production, showing that the wet process performed worse across multiple indicators and recommending process optimization to maximize environmental benefits. In China, researchers such as Xiao Jianzhuang [28] have demonstrated through case studies that recycled concrete buildings can reduce carbon emissions by approximately 1.75% compared to conventional buildings, primarily by avoiding the need to transport and landfill construction waste. Nevertheless, a systematic, region-specific, and empirical understanding of the multi-indicator environmental impacts of recycled aggregates under varying replacement ratios and treatment methods remains lacking. Moreover, most existing LCA studies rely heavily on standard databases and theoretical models, with limited integration of real-world engineering data. As a result, current research often fails to capture the localized environmental impact characteristics of recycled concrete.
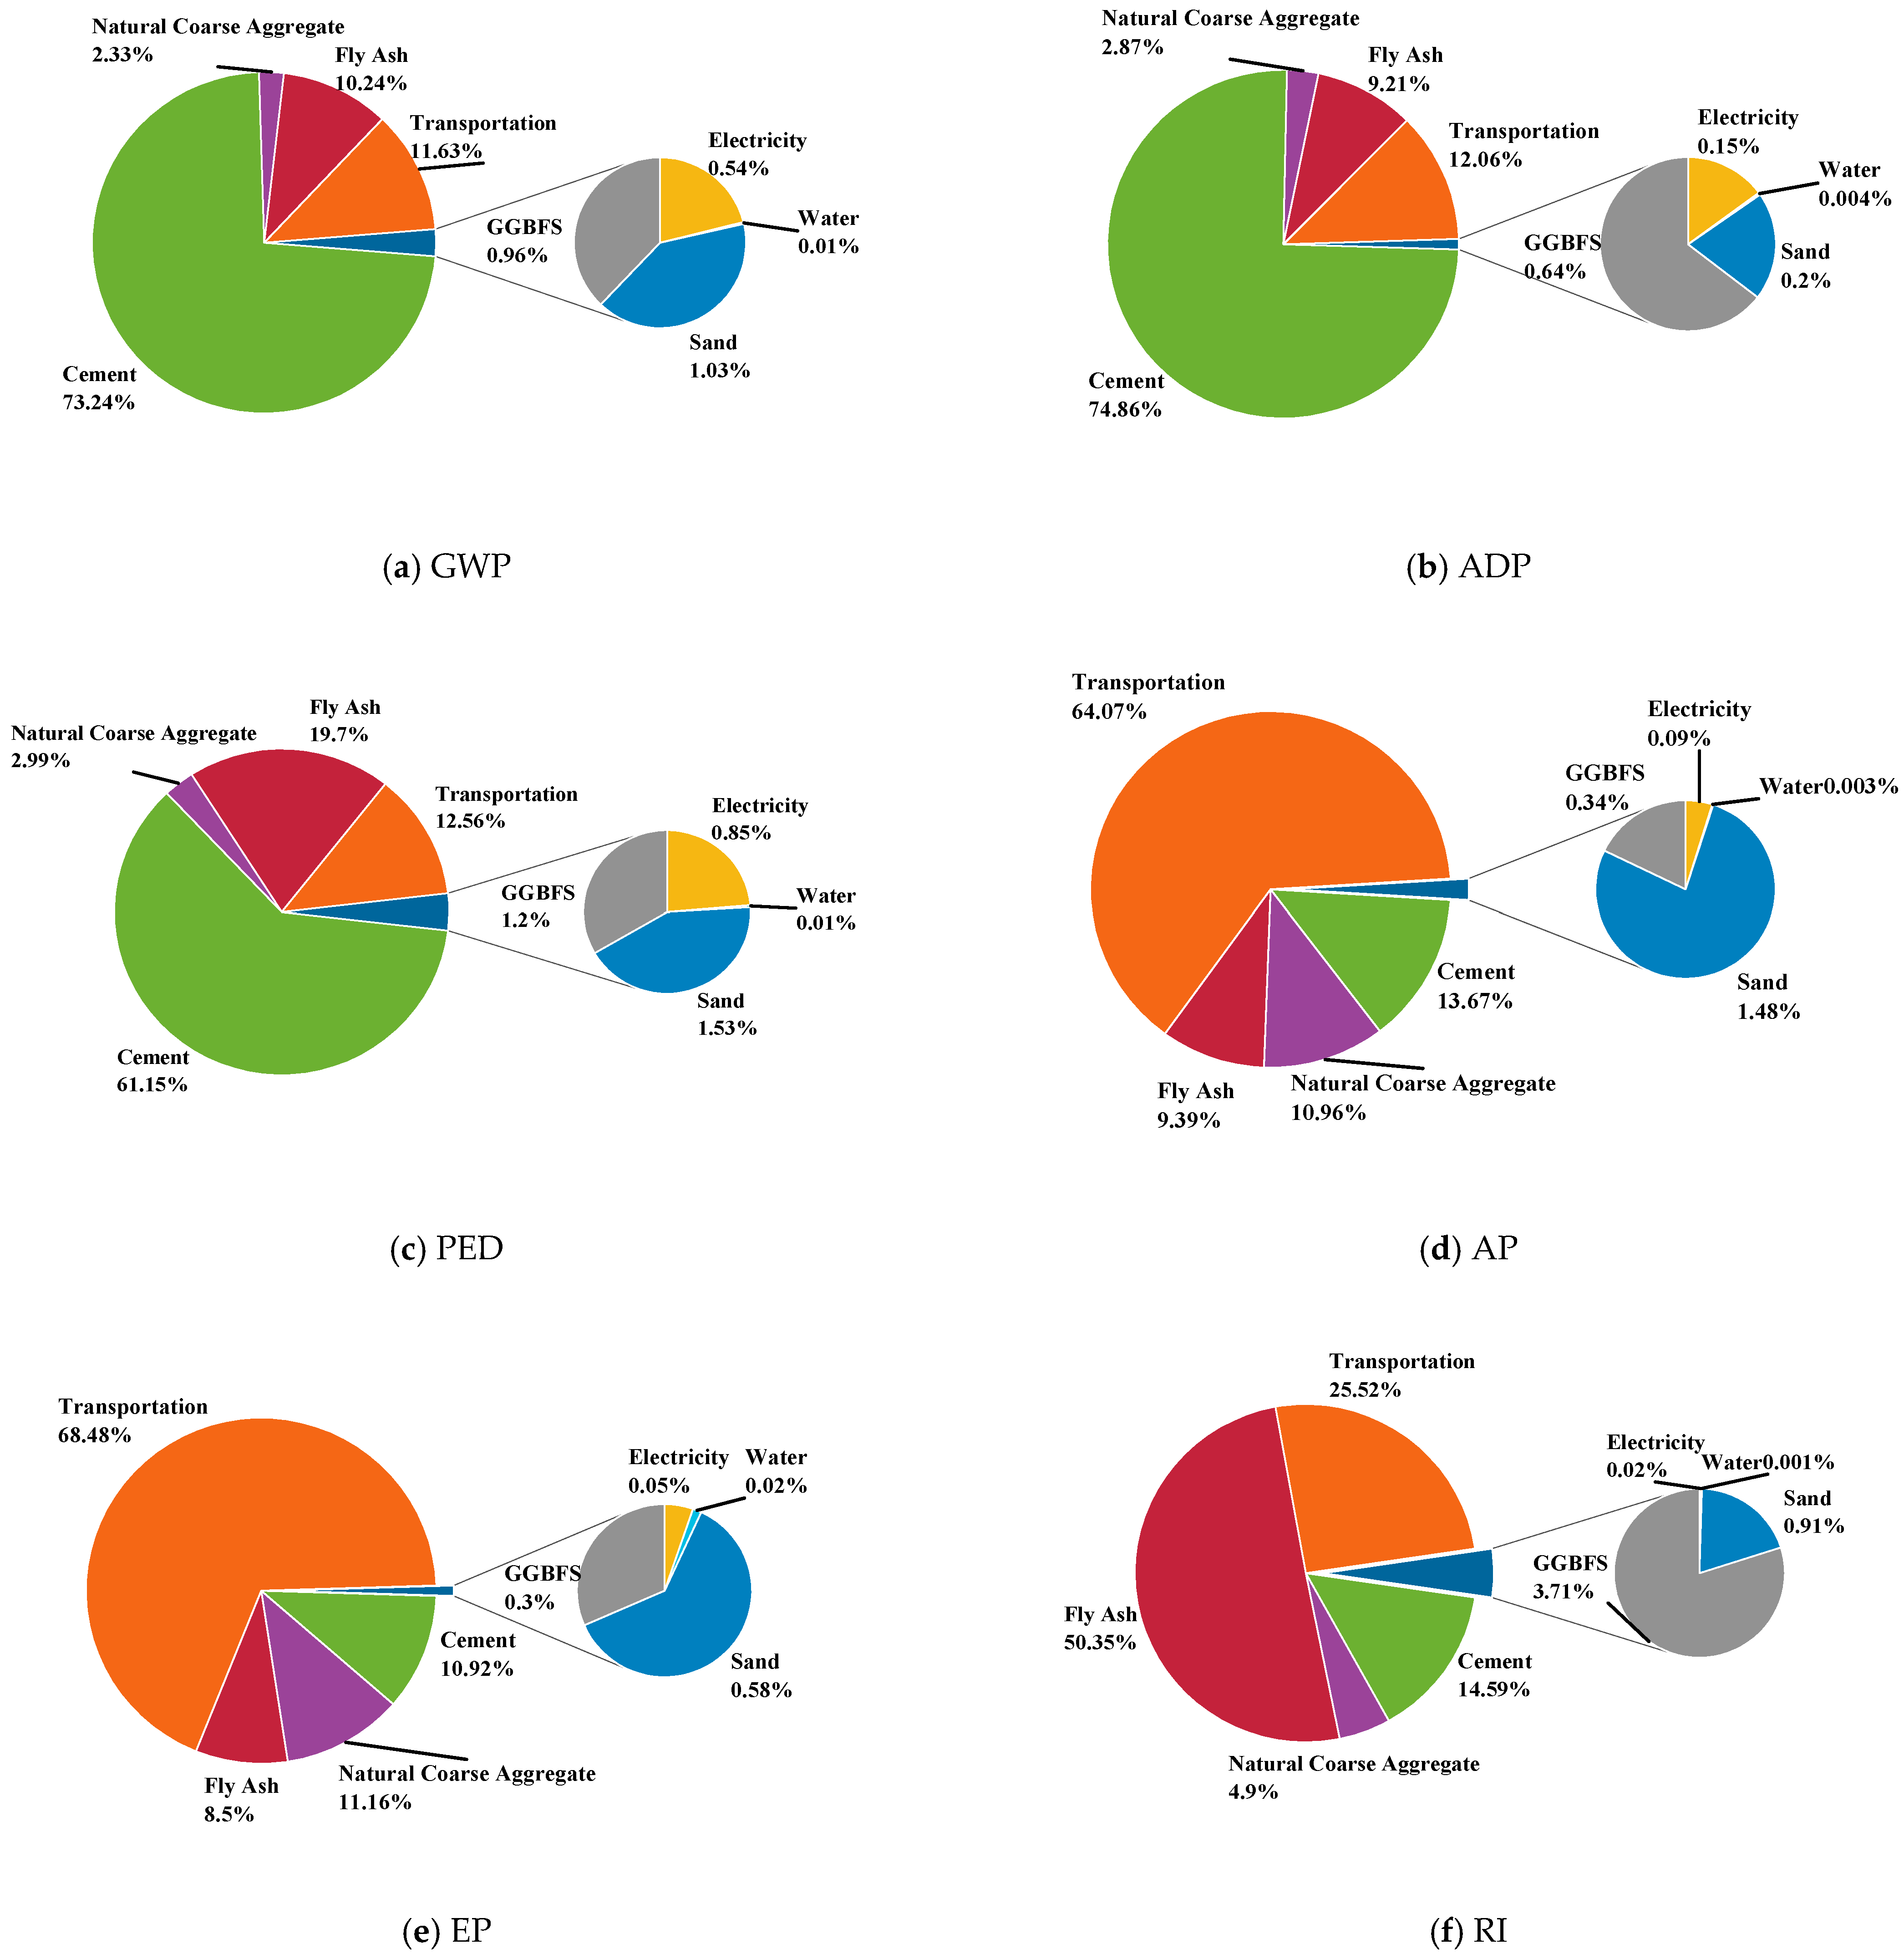
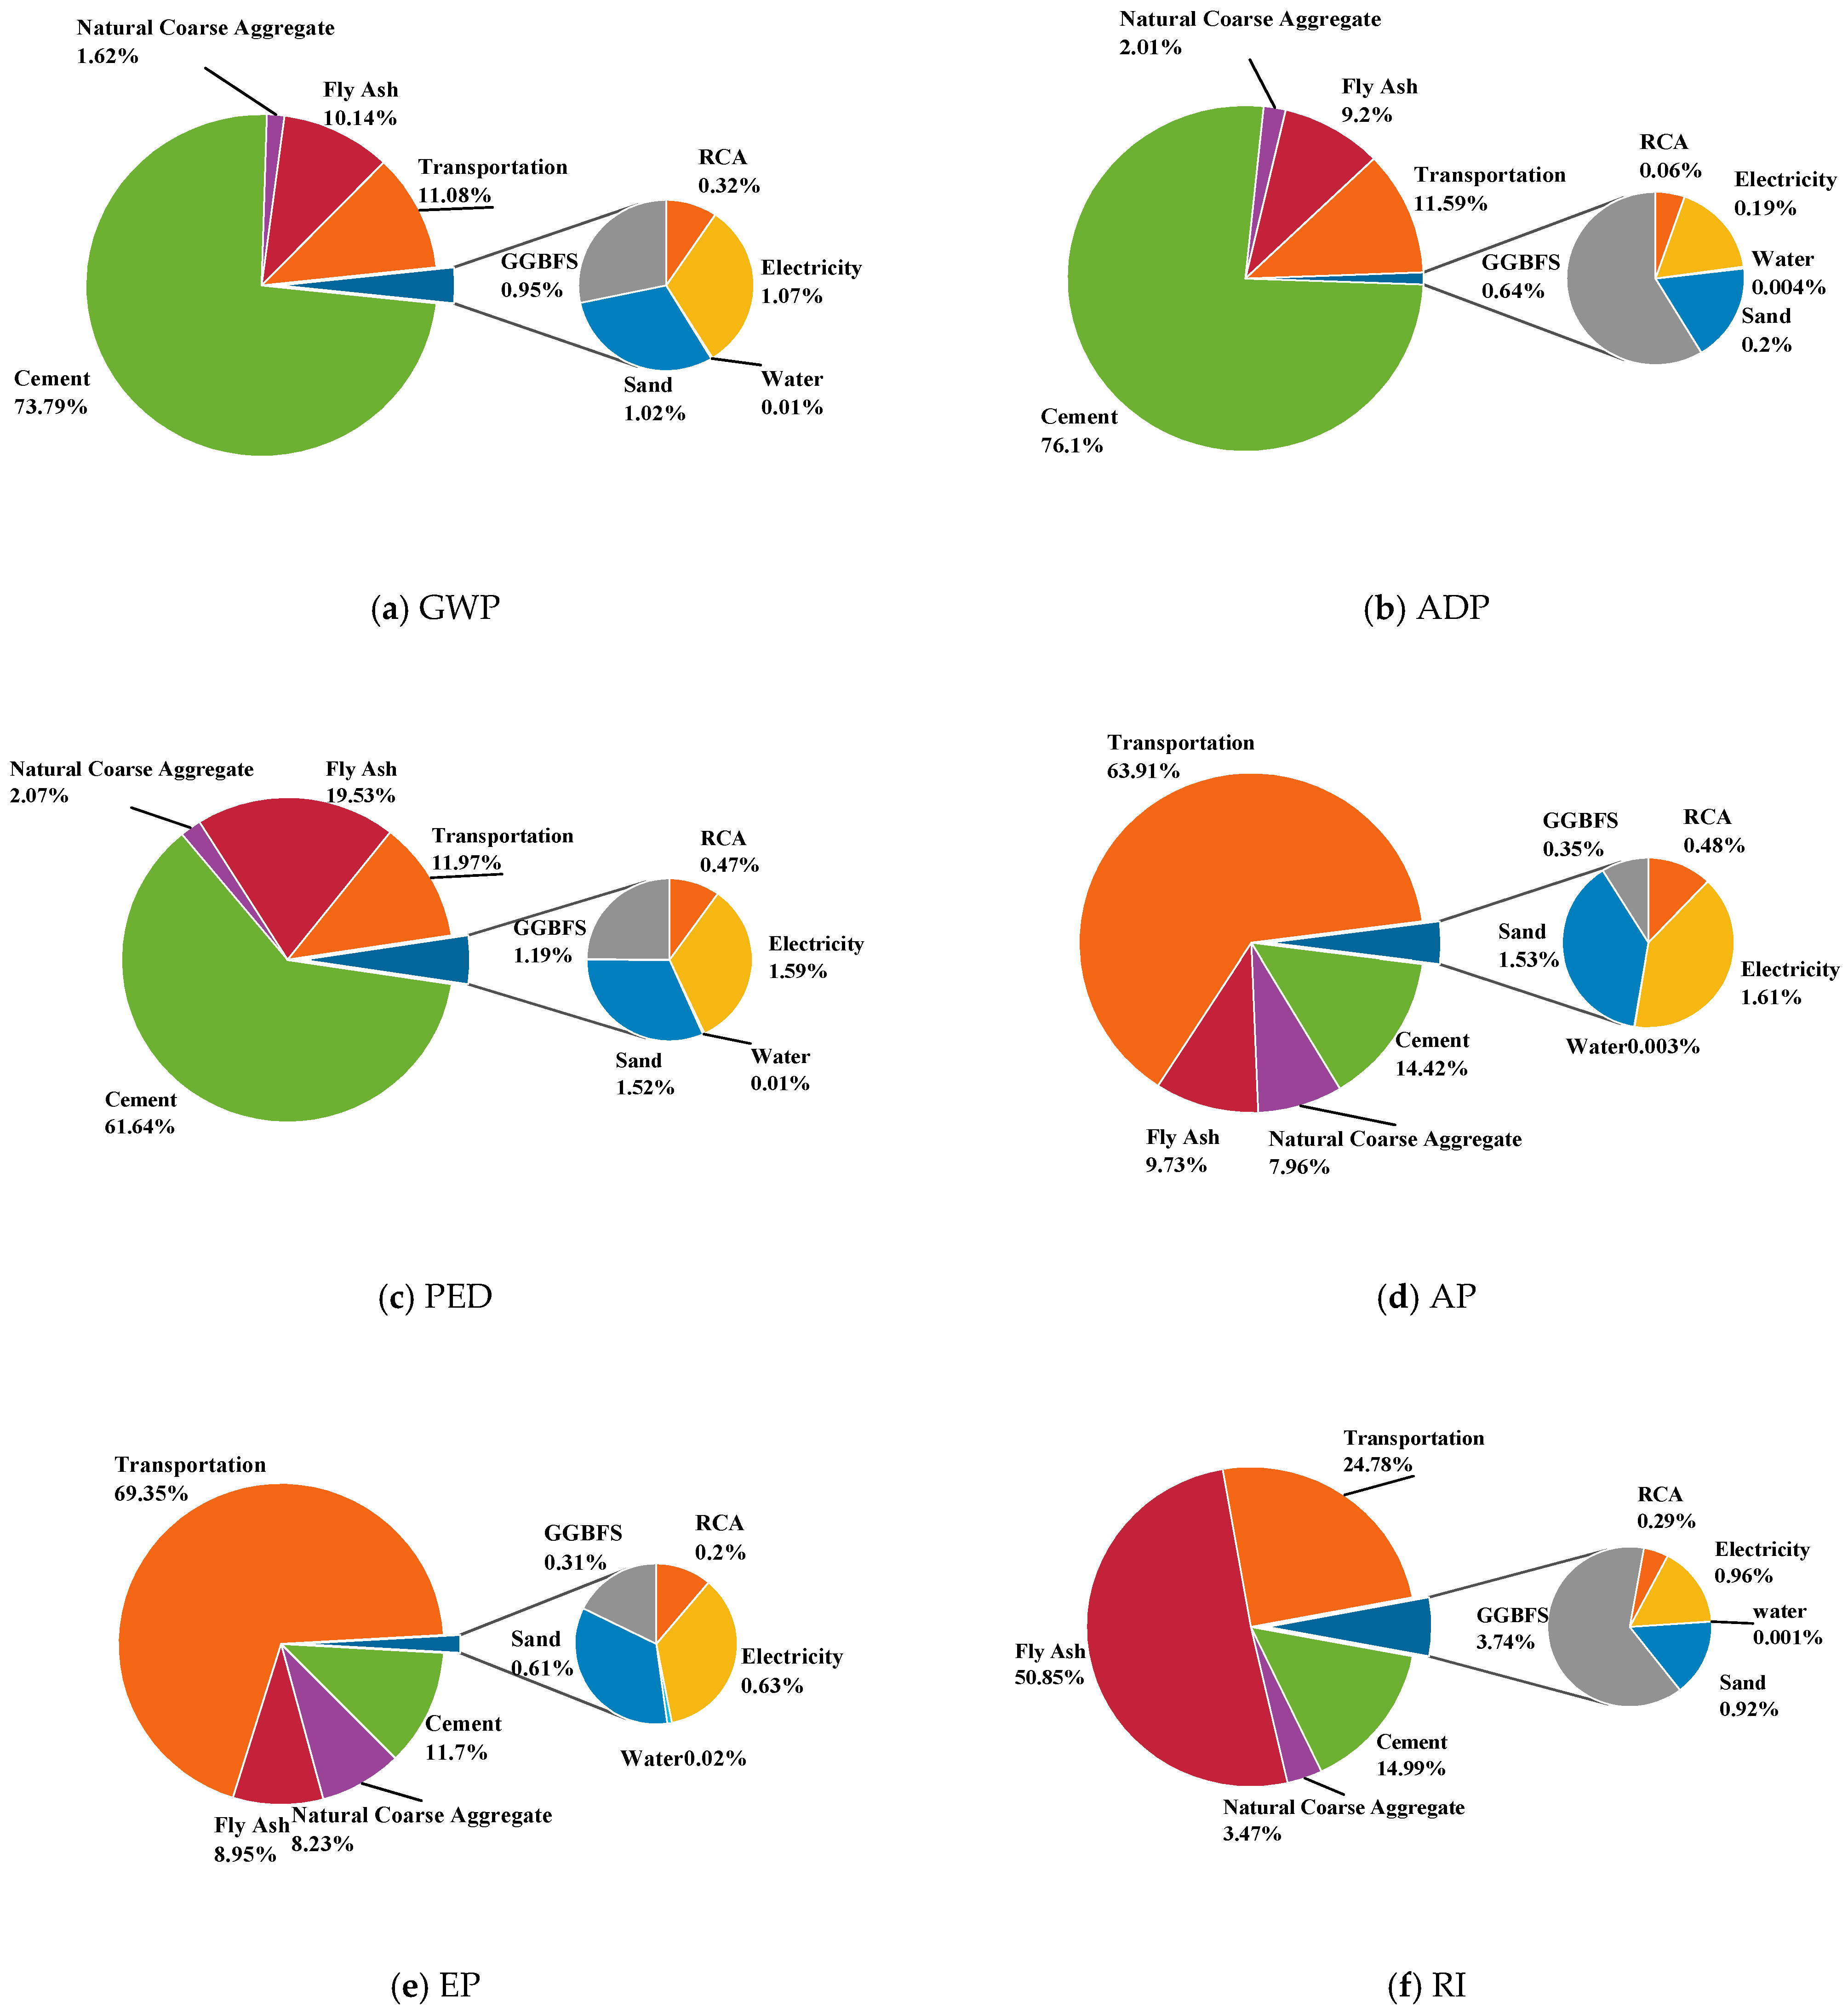
To address these concerns, this study investigates the environmental impacts of recycled aggregates and recycled aggregate concrete using the Life Cycle Assessment (LCA) approach. An integrated evaluation framework was constructed based on field survey data and implemented through the eFootprint platform, encompassing the entire production chain from raw material sourcing to concrete manufacturing. By designing multiple scenarios with different replacement levels of recycled aggregates, this work conducts a comprehensive analysis of variations in six key environmental indicators: Global Warming Potential (GWP), Abiotic Depletion Potential (ADP), Primary Energy Demand (PED), Acidification Potential (AP), Eutrophication Potential (EP), and Respiratory Inorganics (RI). The results are intended to offer a theoretical foundation and empirical data to guide the green design of recycled concrete, promote efficient resource utilization, and support the development of sustainable solutions for construction and demolition waste management.
The novelty of this study lies in the following features:
  • Use of a six-indicator LCA framework beyond conventional GWP-only studies;
  • Incorporation of field-based life cycle inventory data tailored to the Chinese context;
  • Identification of a transport distance threshold affecting environmental benefits;
  • Contribution analysis revealing cement and transport as dominant impact sources.

2. Goal and Scope Definition

Life Cycle Assessment (LCA) is a widely adopted methodology for assessing the environmental performance of construction materials. To ensure a structured and comparable analysis, it is essential to clearly define the research objectives, functional unit, and system boundaries before initiating the modeling process. The environmental footprint of recycled concrete spans several interconnected stages—including the treatment of construction waste, the production of recycled aggregates, and concrete manufacturing—each influenced by diverse and complex factors. Therefore, a comprehensive evaluation within a unified framework is vital for accurately capturing the associated environmental burdens. This study adopts the LCA approach to quantitatively evaluate the environmental impacts of recycled aggregates and recycled aggregate concrete across their entire life cycle.

2.1. Goal Definition

In Life Cycle Assessment (LCA), a clearly defined research goal is fundamental for establishing the system boundary, determining the functional unit, and facilitating subsequent analysis. Given the complexity of the production process of recycled concrete—which involves multiple stages and a wide range of influencing factors—a scientifically formulated goal supports the development of a coherent model structure, standardizes data collection procedures, and ensures that the results are both applicable and interpretable.
To improve modeling efficiency and enhance analytical quality, this study adopts a set of assumptions based on the cut-off criteria recommended in the ISO standards:
  • Materials accounting for less than 1% of the total mass and factors contributing less than 5% to the environmental impact are excluded from the system.
  • The environmental burdens associated with fixed assets or indirect elements—such as buildings, roads, equipment, and worker lifestyles—are considered negligible.
  • The upstream environmental impacts associated with industrial by-products such as fly ash and slag are excluded from this analysis.
  • All concrete is assumed to operate under non-aggressive (non-corrosive) environmental conditions to eliminate variations caused by durability performance.
  • The depreciation of production equipment is not considered in the assessment.

2.2. Scope Definition

2.2.1. Scope of Recycled Aggregate Assessment

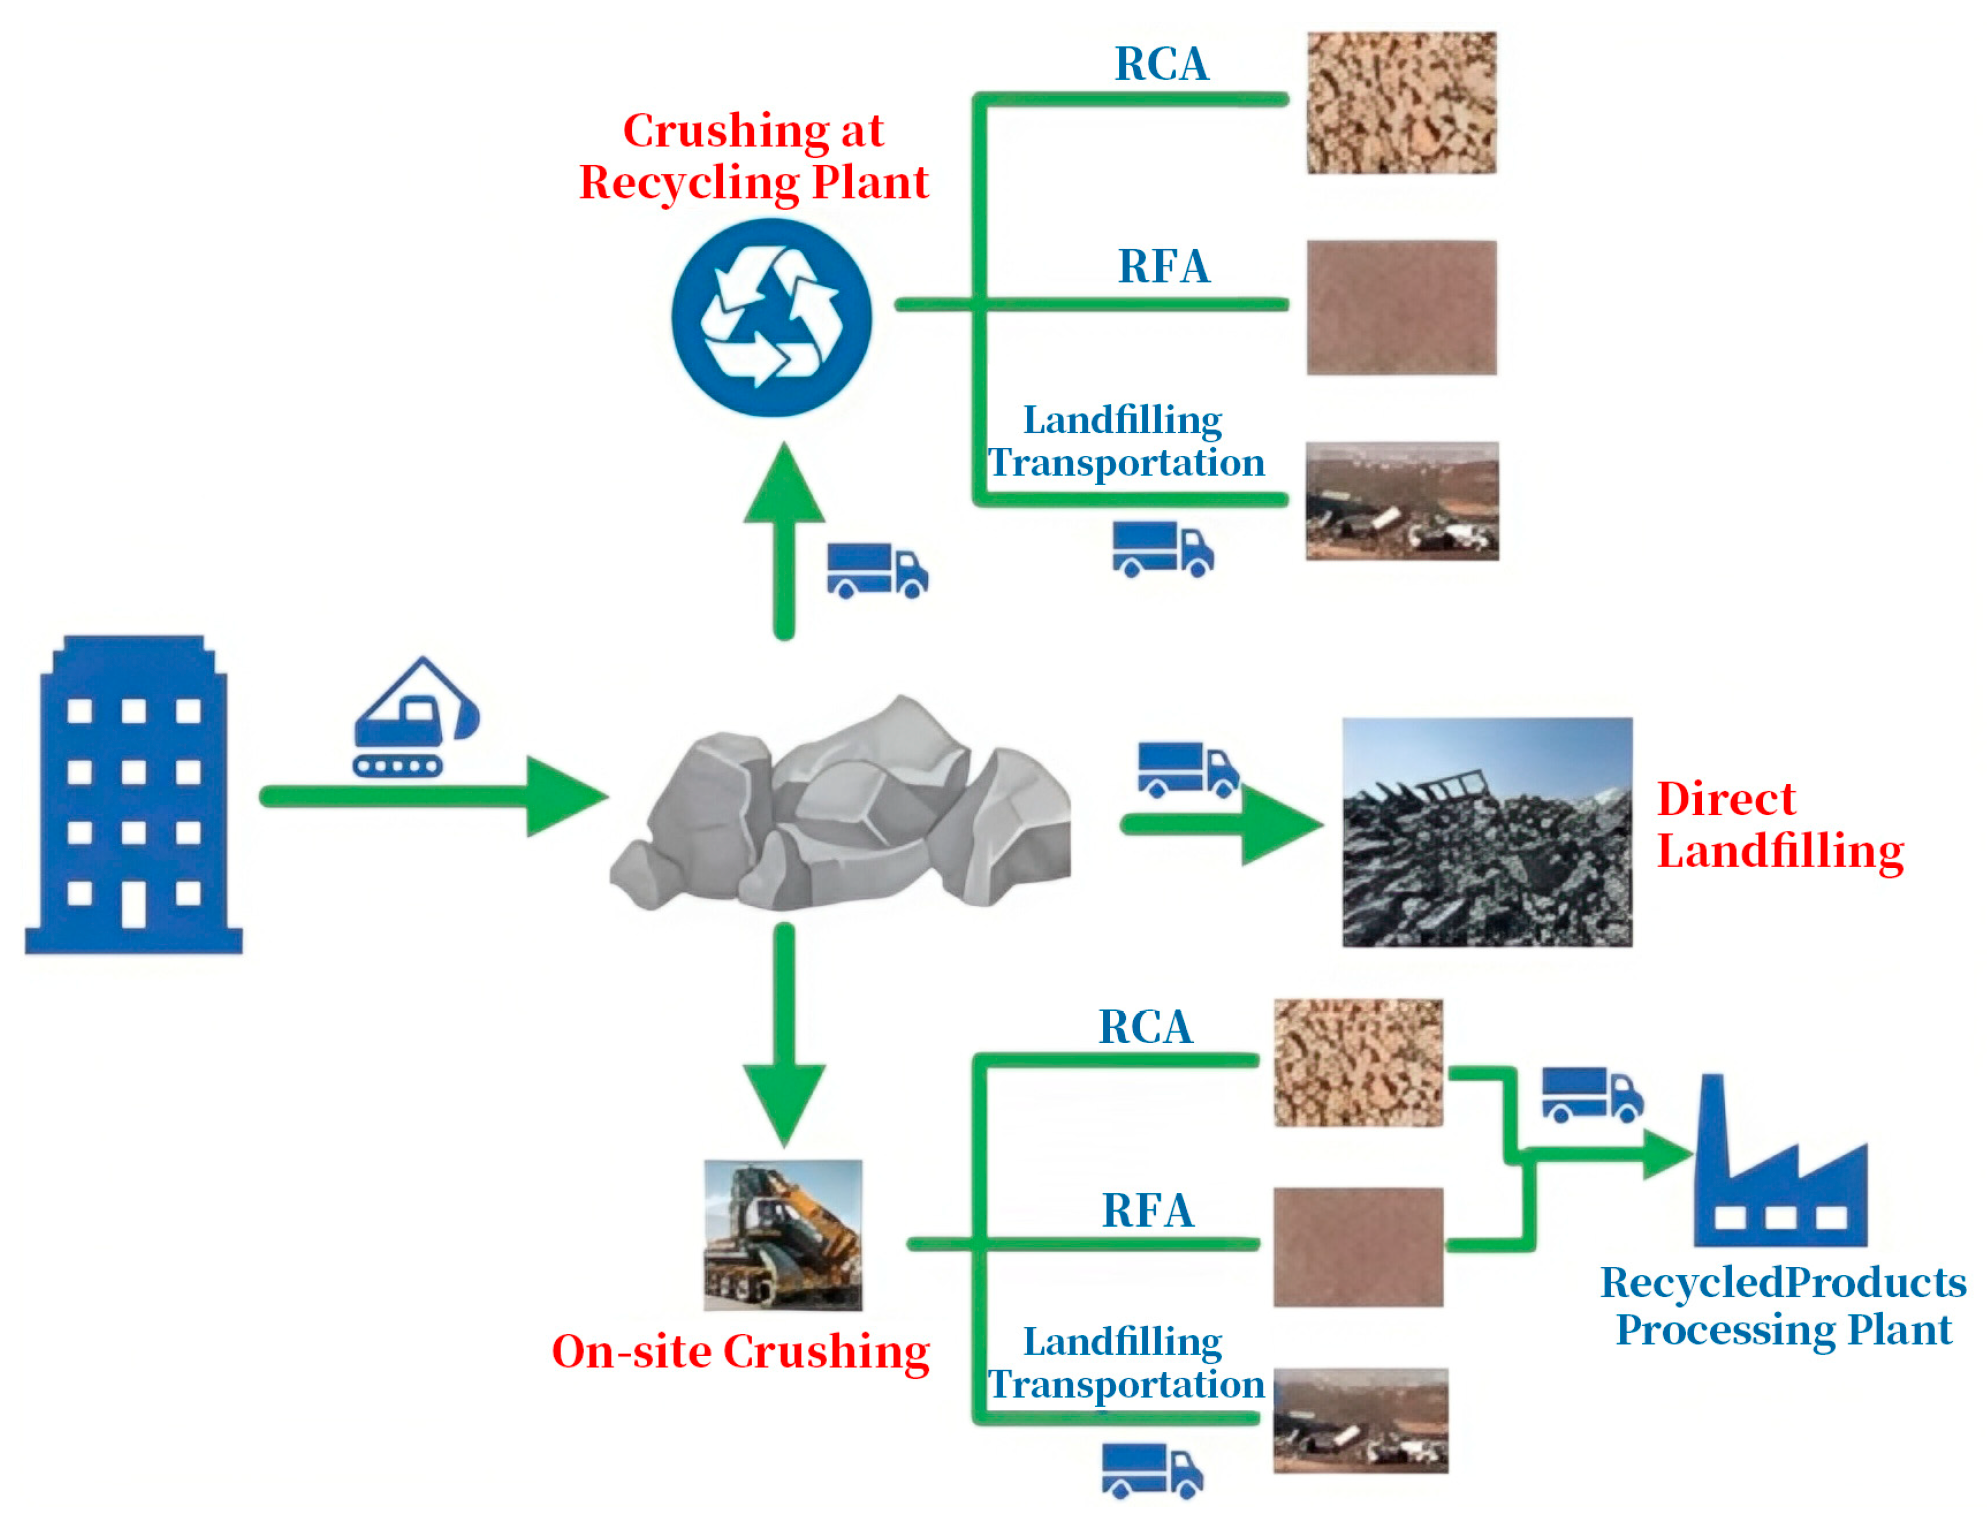
To systematically evaluate the environmental benefits of converting construction waste into recycled aggregates, it is essential to clarify the resource consumption and pollutant emission pathways associated with different disposal methods. This section delineates the assessment scope into two alternative pathways: direct landfilling of construction waste and its recycling. The landfilling pathway primarily encompasses three stages: waste generation, transportation, and final disposal in landfills. In contrast to the former, the recycling pathway encompasses waste generation, transportation, recycled aggregate production, and the landfill disposal of residual materials. The recycling route is further divided into two technological approaches—stationary and mobile recycled aggregate production—based on the processing method employed.
The recycled aggregate data used in this study were obtained from the Zhongcheng Mineral Shenyang Urban Solid Waste Recycling and Green Environmental Industrial Park, located in Shenbei New District, Shenyang, Liaoning Province (as shown in Figure 1). The facility covers an area of approximately 63,800 square meters and has an annual processing capacity of 1 million tons of construction waste, operating 250 days per year. The relevant production lines have been officially commissioned and are currently in operation, making the facility well suited to meet the representativeness and completeness requirements of life cycle assessment studies.
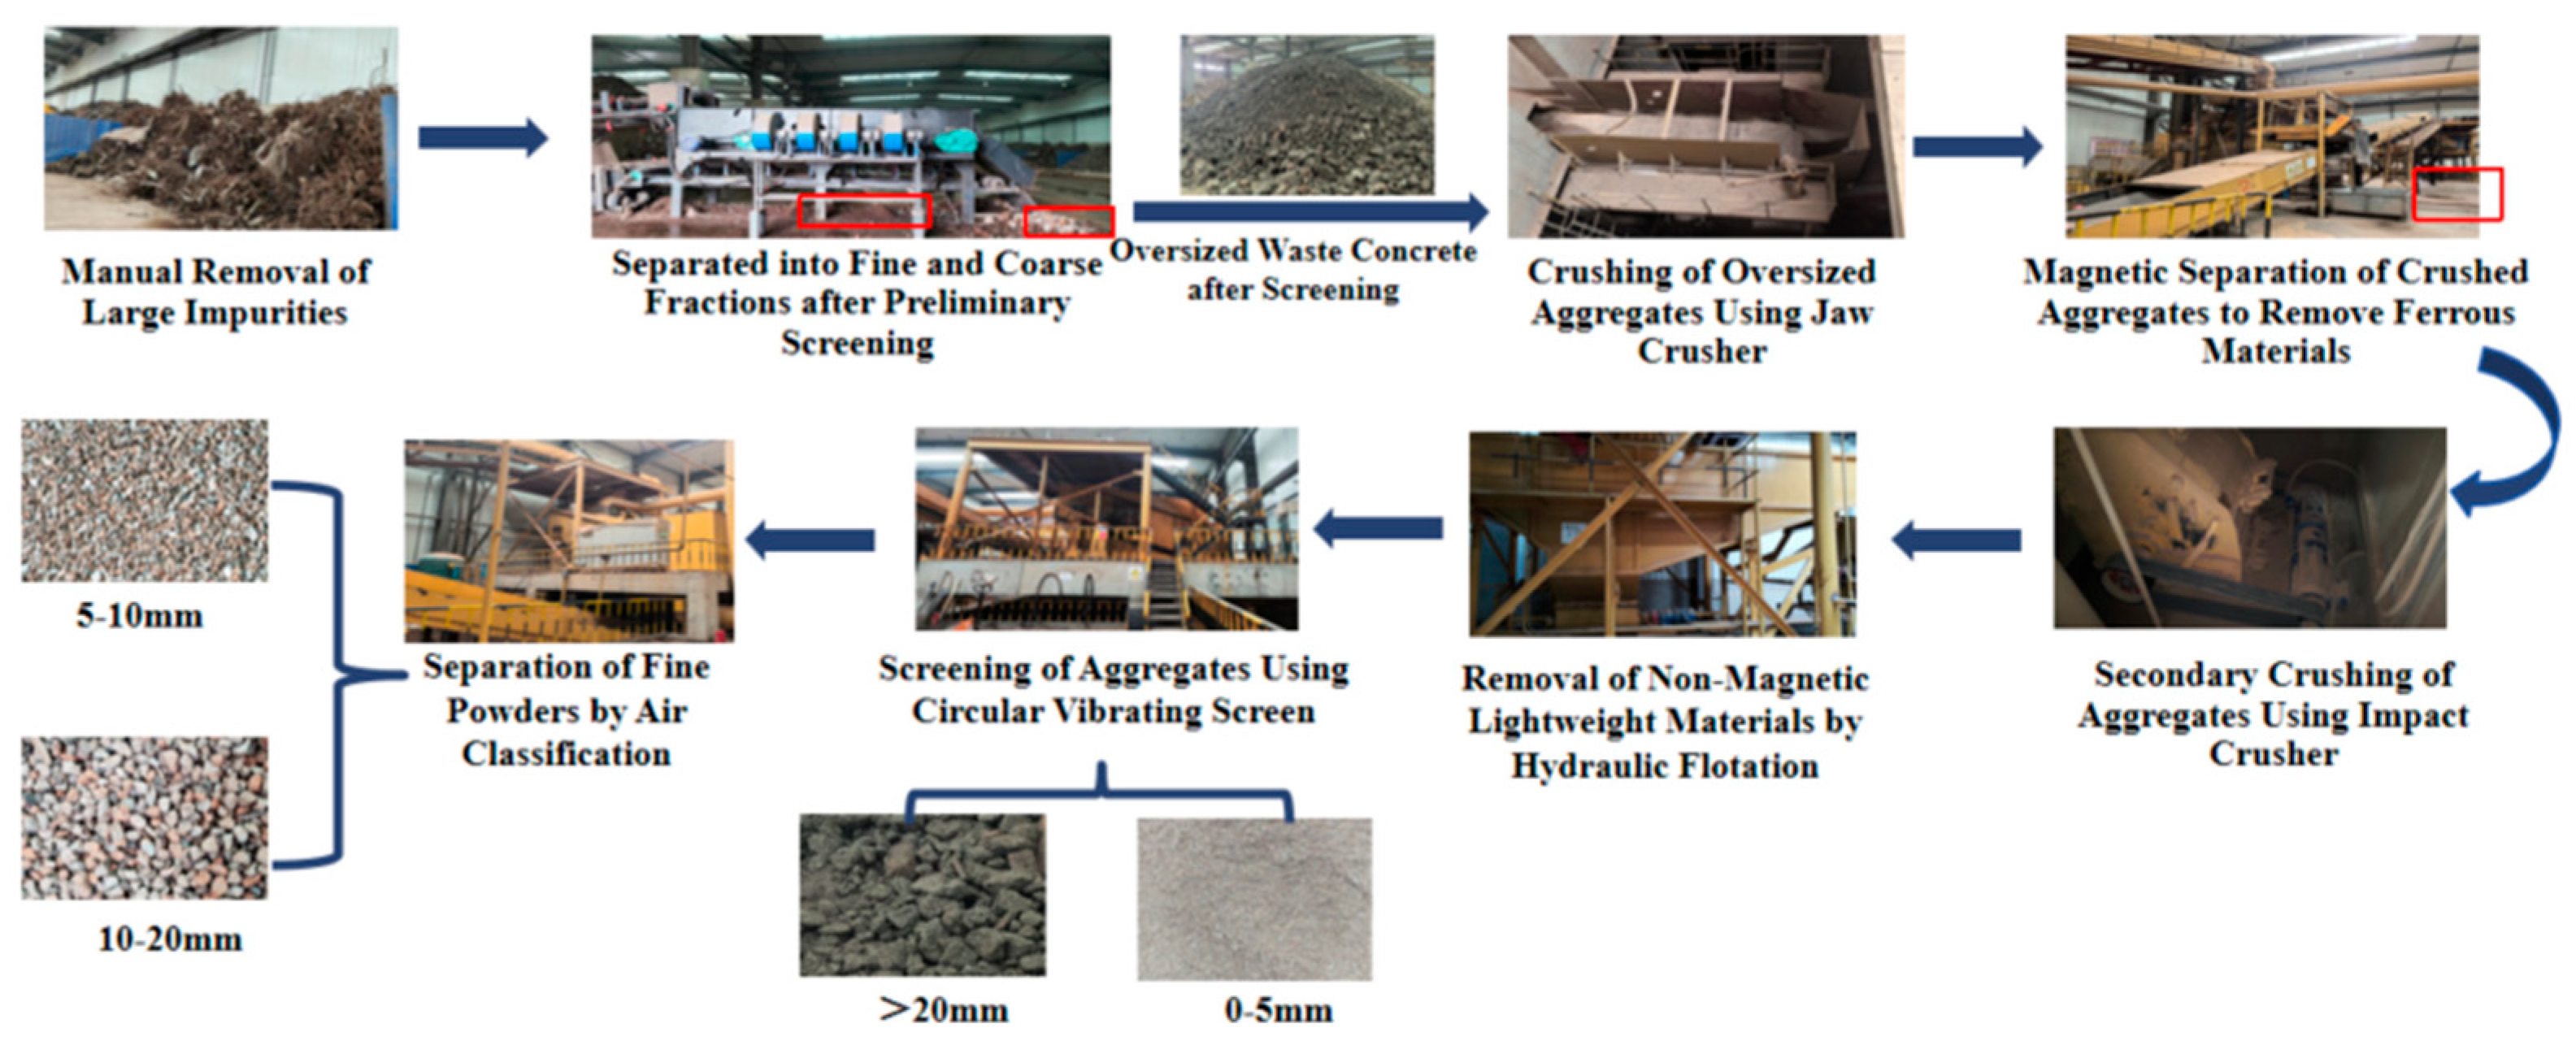
Field investigations at the aggregate processing facility revealed that the primary raw materials consist of construction and demolition waste originating from building demolitions in Shenyang and its surrounding areas. Most of these structures were built during the 1970s and 1980s and are predominantly brick–concrete constructions. The production process follows a standardized procedure to ensure the stability and representativeness of the recycled aggregate quality. Prior to entering the recycled aggregate processing system, the construction waste undergoes a series of physical sorting, crushing, and screening operations. As illustrated in Figure 2, the overall process can be divided into several major stages. The red rectangles in the images indicate the coarse, fine, or crushed aggregates corresponding to each processing step.
During the construction waste treatment process, multiple sequential operations are required to ensure the effective separation and purification for producing high-quality recycled aggregates. In the early stage of processing, sizable contaminants like plastics and wood are manually extracted. The remaining waste is conveyed via a vibrating feeder to the primary screening system, where it is sorted into coarse and fine particles according to size. The coarse fraction undergoes initial crushing through a jaw crusher, followed by magnetic separation to remove ferrous impurities such as steel bars and wires. Subsequently, the aggregates undergo secondary crushing in an impact crusher to refine the particle size distribution and improve aggregate uniformity.
To further remove lightweight non-metallic contaminants, the system incorporates a hydraulic flotation unit that separates low-density components such as foam and plastic fragments. After this process, the aggregates are conveyed to a circular vibrating screen, where they are classified into four size ranges: >20 mm, 10–20 mm, 5–10 mm, and 0–5 mm. Finally, the fine aggregates are subjected to air separation to eliminate residual fine particles and lightweight impurities, significantly enhancing their cleanliness and reusability.
While enabling the recycling of construction waste, this process flow also introduces new considerations in terms of energy consumption and carbon emissions. It provides reliable and accurate data to support subsequent life cycle environmental impact assessments. Based on the field investigation, the system boundary for the life cycle assessment of recycled aggregates is defined as shown in Figure 3.

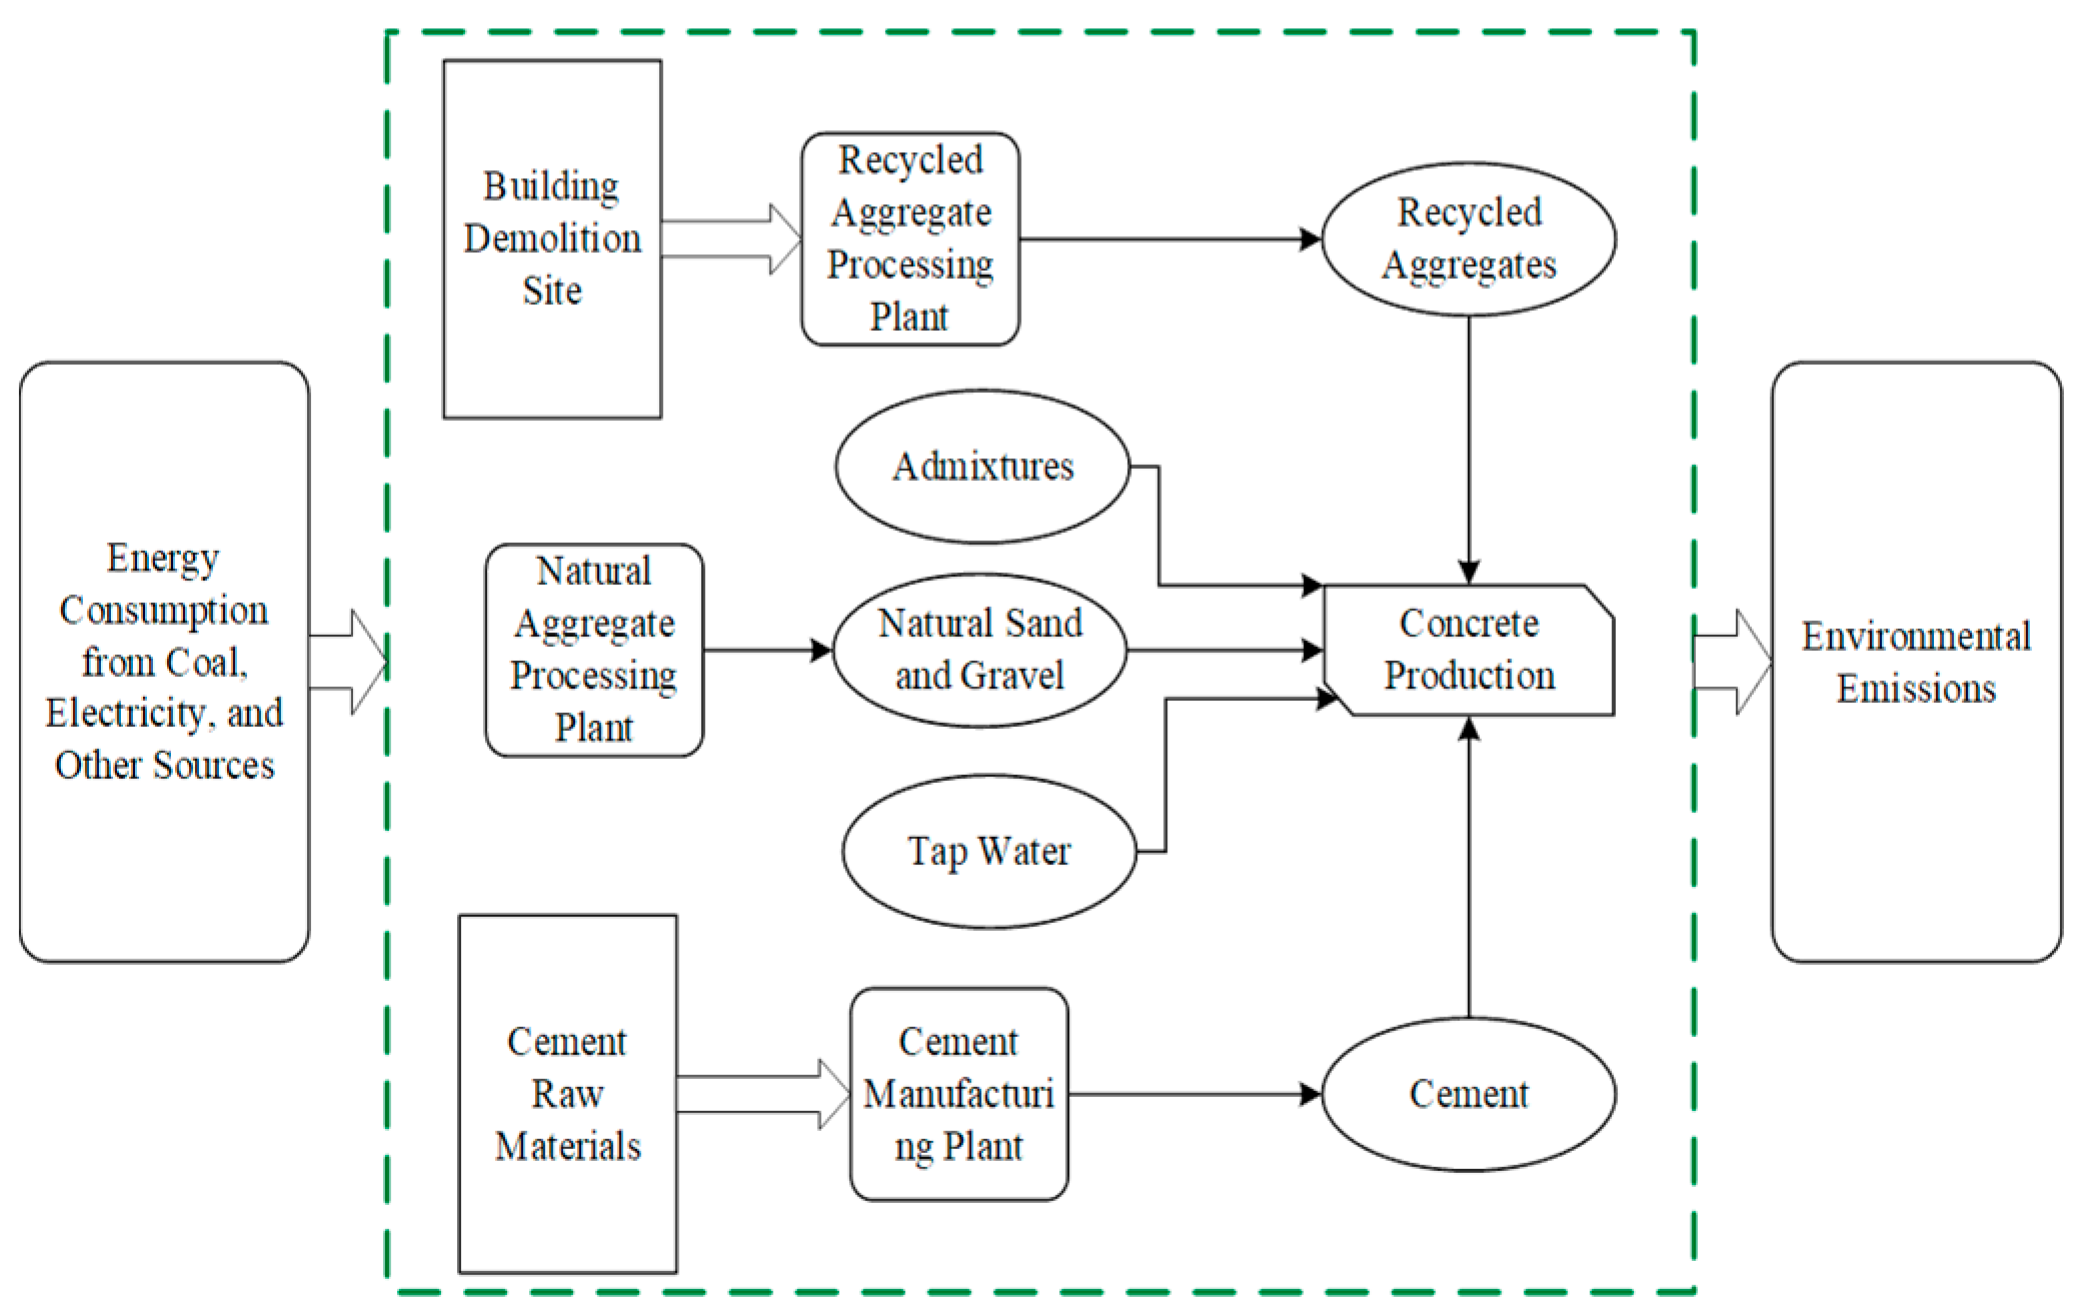
2.2.2. Scope of Recycled Aggregate Concrete Assessment

This study’s life cycle assessment of recycled aggregate concrete focuses on three key stages: raw material production, transportation, and the mixing and preparation of the final concrete product. The concrete mixture primarily comprises natural sand and gravel, recycled coarse aggregate, water, cement, supplementary cementitious materials, and a small proportion of chemical admixtures. Based on the assumptions outlined in Section 2.1 and aligned with the defined research objectives and scope, the system boundary for the life cycle analysis was established. A visual representation of this boundary is provided in Figure 4.
In this study, the concrete strength grade is specified as C30, and a life cycle analysis is conducted on recycled aggregate concrete by varying the replacement ratios of recycled aggregates. The concrete mix proportions are adapted from the research findings of Xiao Jianzhuang et al. [29], and the detailed mix design is presented in Table 1.

2.3. Definition of the Functional Unit

In accordance with the ISO 14040 series standards, this study adopts the Life Cycle Assessment (LCA) methodology to quantitatively evaluate the environmental impacts of recycled aggregates and their application in recycled concrete [30]. To ensure consistency and comparability of the assessment results, two types of functional units are defined respectively:
  • Functional Unit for Recycled Aggregates: The production of 1 ton of recycled coarse aggregate is selected as the functional unit. Based on a yield rate of 70%, approximately 1.43 tons of construction waste is required to produce 1 ton of recycled aggregate.
  • Functional Unit for Recycled Aggregate Concrete: One cubic meter of C30-grade concrete is defined as the functional unit.

2.4. Application of the eFootprint Platform

In this study, the eFootprint software platform was employed to model the Life Cycle Inventory (LCI) data and perform environmental impact characterization for recycled aggregates and recycled concrete. The platform complies with the ISO 14044 [31] international standard for Life Cycle Assessment (LCA) and supports the use of multiple mainstream characterization methods and databases. The environmental impact assessment adopted the CML 2002 midpoint method, which is widely applied in the LCA of building materials. Six environmental impact categories were selected: Global Warming Potential (GWP), Abiotic Depletion Potential (ADP), Primary Energy Demand (PED), Acidification Potential (AP), Eutrophication Potential (EP), and Respiratory Inorganics (RI). These indicators align with the core requirements of EN 15804 [32] for environmental product declarations (EPD) of building materials and are recognized for their scientific robustness and engineering applicability.
Raw material consumption, energy use, and emission data were normalized based on the functional units of 1 ton of recycled aggregate and 1 m3 of C30 recycled concrete, respectively, and input into the modeling module of the platform. Under consistent system boundaries, impact categories, and database settings, environmental impact models were constructed for different scenarios. The platform utilizes CLCD 0.9 (Chinese Life Cycle Database) as the background database to ensure regional representativeness of the assessment results. 
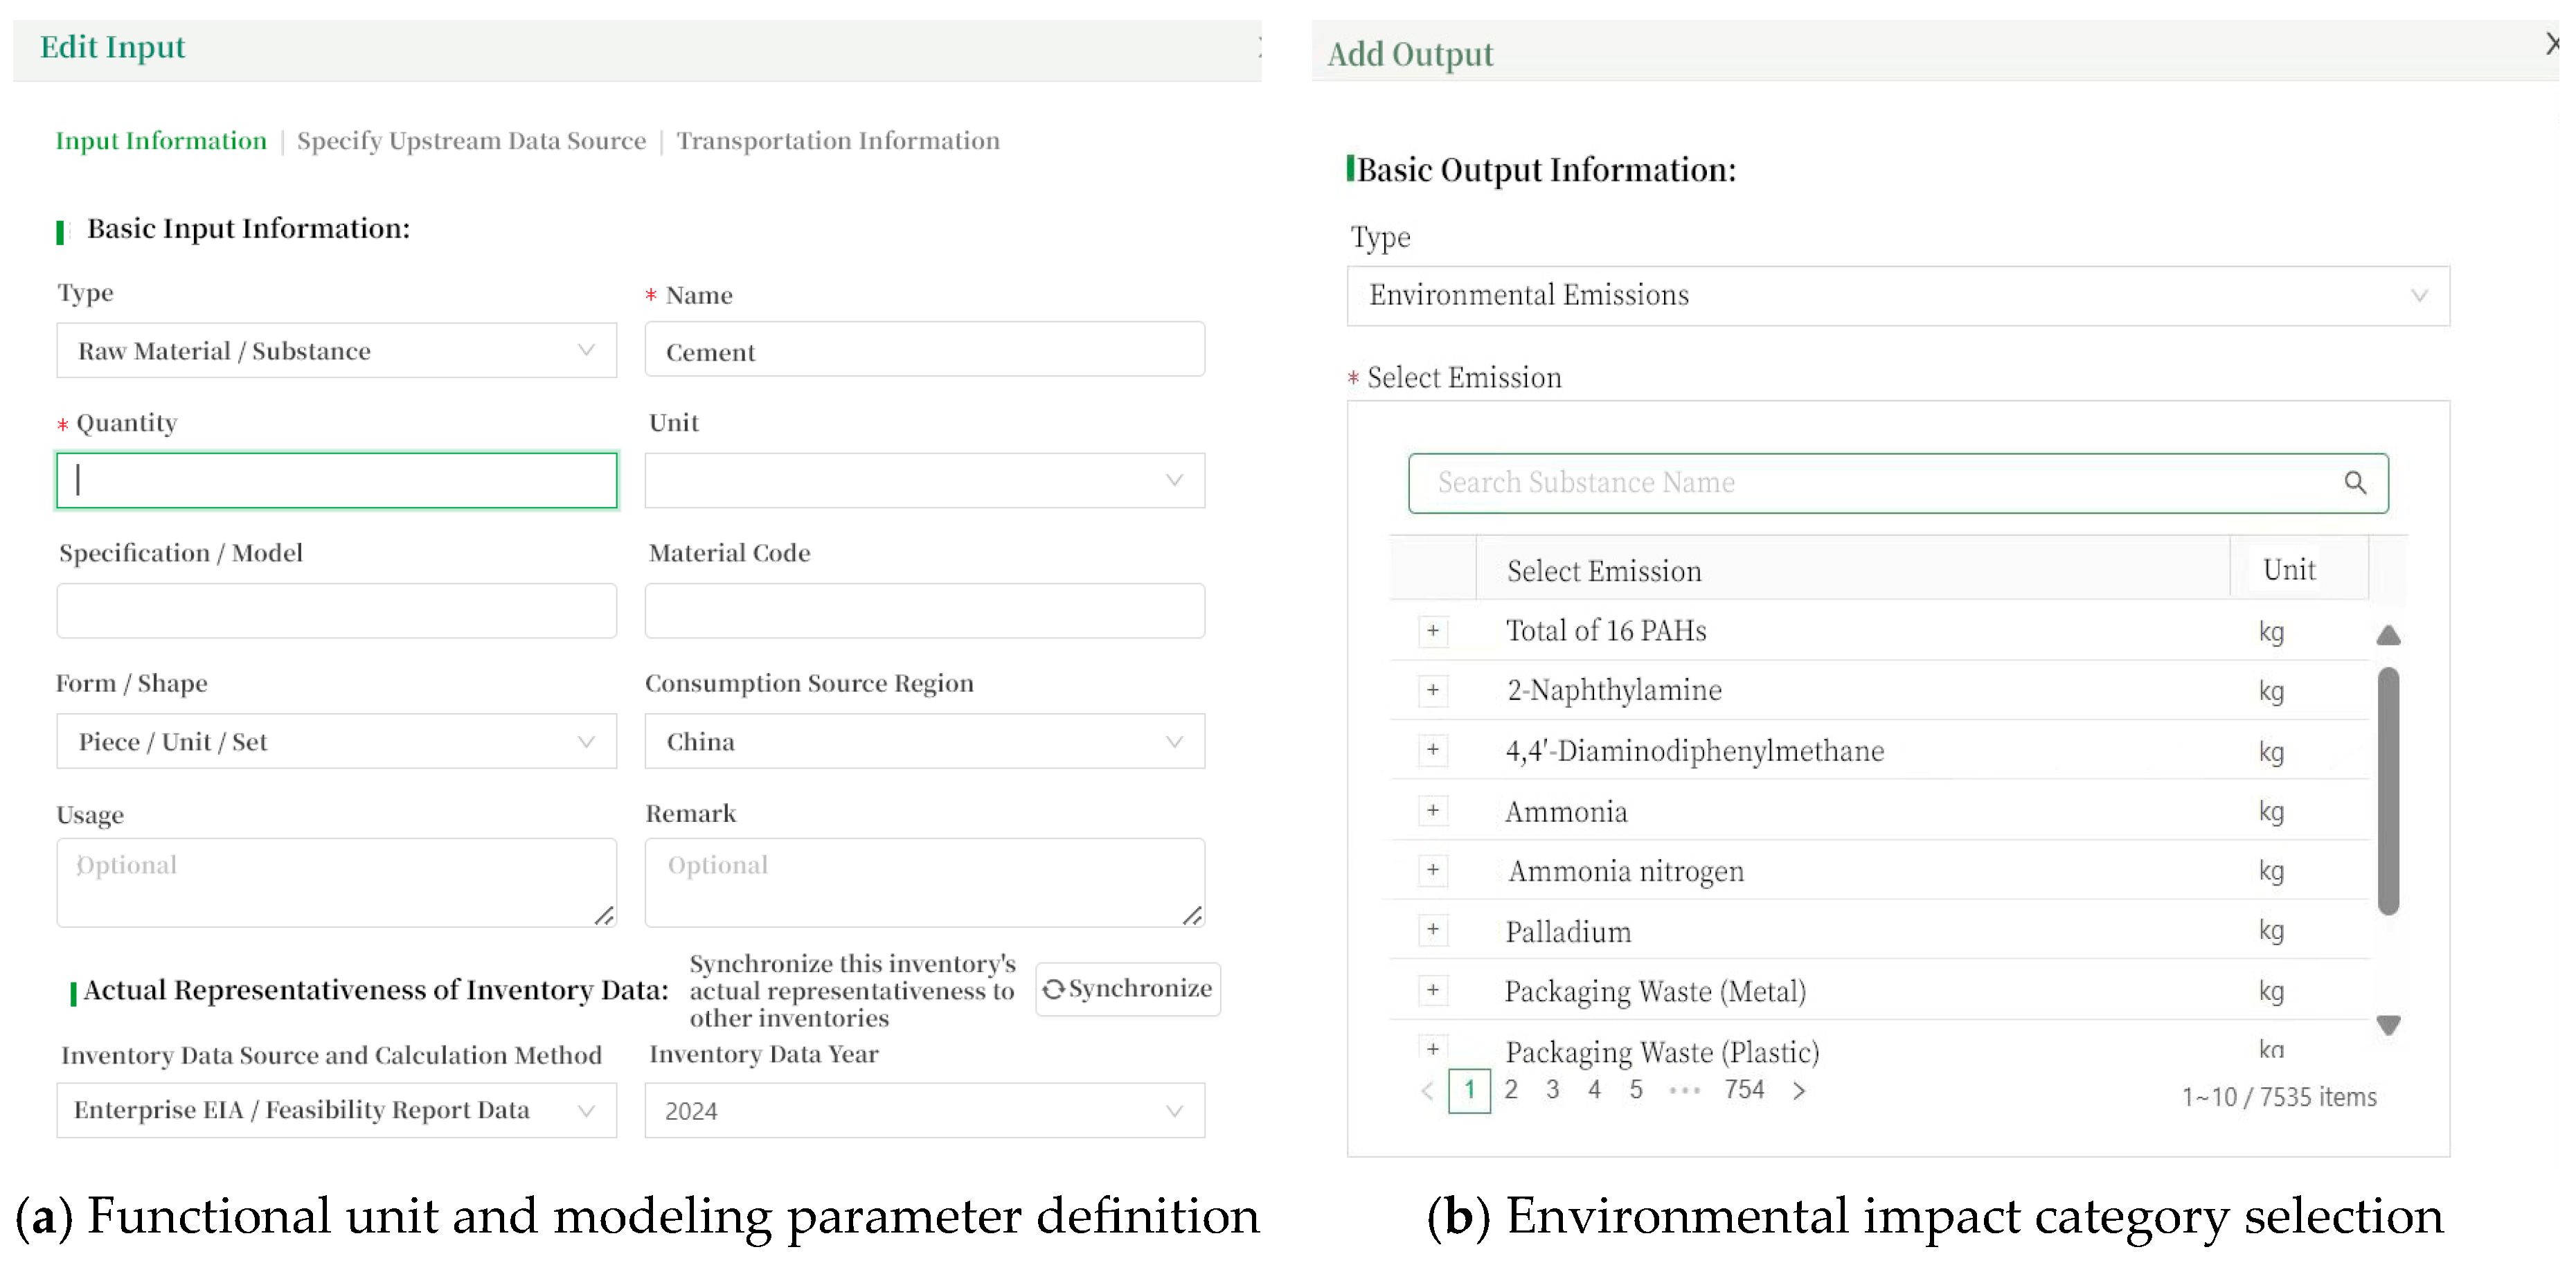
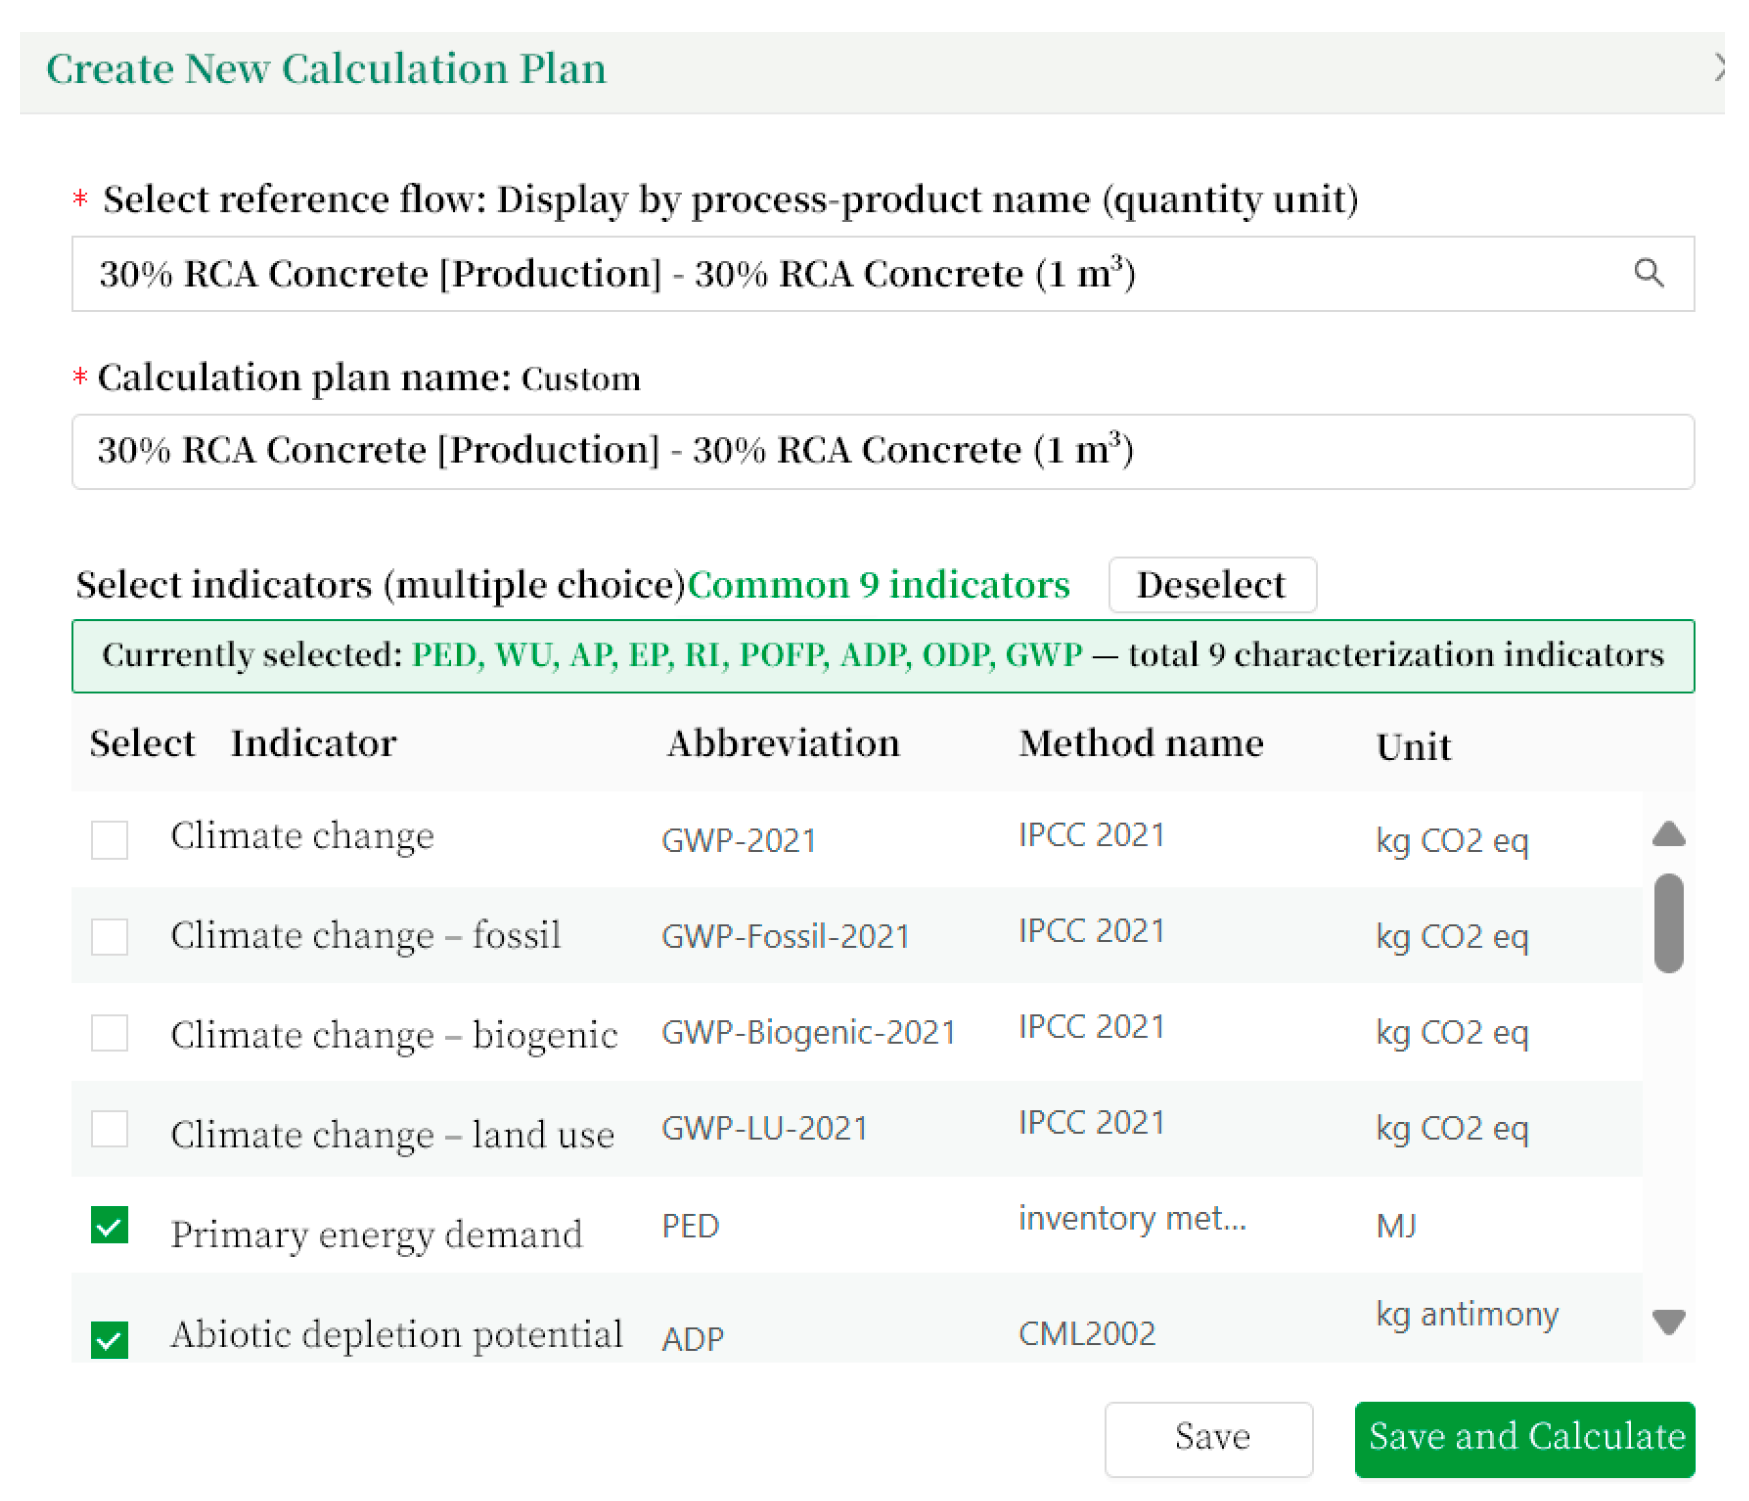
Figure 5 presents the interface for selecting functional units and environmental indicators within the platform.
In addition, the uncertainty analysis module of the platform was applied to conduct ±10% perturbation tests on key parameters (e.g., cement content and transport distance) to assess their sensitivity to environmental outcomes and to identify major contributing factors. These insights serve as a basis for future environmental optimization strategies. The platform generates both quantitative results and visual outputs, as shown in Figure 6.

3. Life Cycle Inventory

3.1. Life Cycle Inventory of Recycled Aggregates

To comprehensively assess the environmental impacts associated with the recycling of construction waste into recycled aggregates, this section establishes a life cycle inventory based on field investigation data. The inventory is structured according to three key stages: the production stage, the transportation stage, and the landfilling stage. For all stages, the functional unit is defined as the production of 1 ton of recycled aggregate.

3.1.1. Production Stage of Recycled Aggregates

The production stage primarily includes the reception of construction waste, pre-treatment, crushing and screening processes, and the output of finished recycled aggregates. Electricity consumption constitutes the main source of energy use during the recycled aggregate production process. This study selects typical stationary and mobile recycled aggregate production lines in Liaoning Province as data sources. The functional unit is defined as the quantity of input materials required to produce 1 ton of recycled coarse aggregate, and energy use and pollutant emissions are calculated accordingly.
According to field investigation data, for stationary recycled aggregate production plants, approximately 1.43 tons of construction waste is required per ton of recycled aggregate produced, with an average electricity consumption of around 2.38 kWh. The rated power specifications of the main equipment at the surveyed facility are shown in Table 2.
For mobile recycled aggregate production, three typical configurations of mobile crushing equipment—rated at 100 t/h, 150 t/h, and 200 t/h—were selected for assessment. Based on equipment specifications and unit output, the average electricity consumption was calculated to be approximately 1.53 kWh per ton. Additionally, diesel consumption during the pre-treatment stage was estimated at 0.12–0.14 L per ton, as summarized in Table 3. By organizing and analyzing the survey data, the environmental inventory for the production stage under different mobile production capacities was established, as summarized in Table 4.

3.1.2. Transportation Stage of Recycled Aggregates

The life cycle inventory for the construction waste transportation stage is primarily influenced by the transportation mode and hauling distance. Since construction waste is predominantly generated within urban areas, field investigations revealed that road transportation is the most commonly adopted method, typically using 10-ton heavy-duty diesel trucks. To ensure comparability among different treatment scenarios, the transportation distance from construction sites to landfills and to stationary recycled aggregate production plants are both set at 30 km. The residual non-recyclable waste generated during the recycling process is assumed to be transported 10 km from the recycling facility to the landfill. For mobile crushing operations, which are usually conducted on-site, the recycled aggregate must be transported to downstream users. Therefore, a transport distance of 10 km is assumed for this stage.
Based on the parameters above, the environmental impact inventory for the transportation stage is summarized in Table 5.

3.1.3. Landfilling Phase of Recycled Aggregates

In the landfilling phase, the disposal of construction waste primarily relies on diesel-powered machinery, with a minor contribution from electricity consumption. According to relevant literature, the disposal of 1 ton of construction waste typically consumes approximately 26 MJ of diesel and 7.4 MJ of electricity [33]. Since most construction waste consists of inert materials that generally do not generate leachate and pose low risks of heavy metal release [34], this study considers only the environmental impacts associated with land occupation during the landfill stage. Previous research has shown that direct landfilling or stockpiling of waste occupies approximately 0.24 m2 per ton of waste [35].
Based on these data, the environmental impact inventory for the landfill phase was calculated and is presented in Table 6.
Further consolidation of the environmental impact inventories under different treatment scenarios (see Table 7) reveals that although direct landfilling consumes slightly less raw coal and natural gas compared to recycling-oriented approaches, it results in significantly higher values for all environmental emission indicators.

3.2. Life Cycle Inventory of Recycled Aggregate Concrete

Expanding on the life cycle inventory of recycled aggregates, this section delves into the environmental impacts arising from their practical use in concrete production. The life cycle of recycled aggregate concrete mainly includes several critical processes: procurement of raw materials (including both natural and recycled aggregates, cement, and water), transportation of these materials, and centralized mixing followed by casting.

3.2.1. Production Stage of Recycled Aggregate Concrete

The production phase of recycled aggregate concrete encompasses the acquisition and processing of all required raw materials, including aggregates, water, cement, mineral admixtures, and chemical additives:
  • Aggregates: Natural aggregates are produced through quarrying, crushing, and screening, processes that typically involve high energy consumption. In contrast, recycled aggregates are obtained from construction and demolition waste through a series of steps such as pre-treatment, crushing, grading, and impurity removal. Due to the high water absorption and inconsistent quality of recycled fine aggregates, this study focuses solely on the environmental impacts of substituting natural coarse aggregates with recycled coarse aggregates. The environmental impact inventory for the different types of aggregates during the production phase is detailed in Table 8.
  • Water: Water used for concrete mixing and curing is sourced from municipal tap water.
  • Cement: For the analysis, P·O 42.5 ordinary Portland cement is selected. Its life cycle includes the extraction and transport of limestone, clay, and gypsum, along with clinker production and cement grinding. On average, producing 1 ton of cement consumes approximately 1.3 tons of limestone, 0.3 tons of clay, and 50 kg of gypsum. The electricity consumption is around 105 kWh. Detailed raw material consumption is presented in Table 9.
In terms of environmental emissions, P·O 42.5 cement emits approximately 890–920 kg of CO2 per ton, 0.25–0.36 kg/t of SO2, and 1.43–1.57 kg/t of NOx, with unit energy consumption ranging from 130–143 kg/t. The detailed emission inventory for different cement types is provided in Table 10.

3.2.2. Transportation Stage of Recycled Aggregate Concrete

The transportation processes in the life cycle of recycled aggregate concrete are divided into four stages: transporting construction waste to the recycled aggregate processing plant, transporting recycled aggregates to the concrete batching plant, transporting natural sand and gravel to the batching plant, and transporting cement to the batching plant. The transportation modes and average distances were determined based on field survey data from operating enterprises, and were supplemented and validated through relevant literature [42,43,44]. Based on this, and considering the functional unit and geographical characteristics of the study area, an environmental impact inventory was developed for the transportation stage of major raw materials, as presented in Table 11.

3.2.3. Use Stage of Recycled Aggregate Concrete

In China, on-site concrete mixing has been largely prohibited, with ready-mixed concrete becoming the standard in construction. The production of recycled aggregate concrete relies primarily on electricity, with an average consumption of approximately 1.75 kWh per ton. During the construction stage, concrete is typically cast using fixed formwork systems. Due to the complexity of construction materials, it is difficult to isolate the environmental impacts of recycled aggregate concrete from those of conventional concrete [45]. Based on field investigations and literature review, the construction stage is not separately included in the assessment, and its environmental burden is assumed to be equivalent to that of conventional concrete.

4. Interpretation of Life Cycle Results

Building upon the constructed life cycle inventories, this section presents the environmental impact assessment of recycled aggregates and recycled aggregate concrete by applying characterization models to convert and compare key indicators. The analysis quantitatively evaluates environmental impacts across different treatment stages and pathways, focusing on critical impact categories such as energy consumption and acidification potential.
The analysis of recycled aggregates concentrates on the environmental differences between landfilling and resource recovery of construction waste. For recycled aggregate concrete, the trends in environmental impact under varying replacement ratios are assessed. Further, normalization and contribution analyses are conducted to identify dominant influencing factors and clarify the relative advantages of resource recovery in multidimensional environmental terms.

4.1. Environmental Impacts of Recycled Aggregates

4.1.1. Characterization Results

To quantify the environmental impacts of various construction waste treatment pathways, this study applies characterization factors from the ISO 14040 series. The environmental impacts of three alternatives—direct landfilling, stationary recycled aggregate production, and mobile recycled aggregate production—were characterized across six typical environmental impact categories. The results are summarized in Table 12.
The results indicate that regardless of the recycling method, both stationary and mobile recycled aggregate systems outperform direct landfilling in all six impact categories (GWP, ADP, PED, AP, EP, RI). Notably, the mobile system demonstrates the most significant improvements, reducing GWP and ADP by 82.27% and 74.51%, respectively, compared to landfilling—highlighting its superior environmental performance. In contrast, the stationary system exhibits slightly higher impacts due to transportation and higher energy consumption, yet offers benefits in centralized quality control and reduced landfill pressure.

4.1.2. Normalization Results

To improve the comparability of different environmental impact categories, the characterized results were further normalized. The normalization covers the three treatment options—landfilling, stationary recycling, and mobile recycling—and the outcomes are shown in Table 13.
The normalization results further confirm that mobile recycling systems perform best across all environmental categories. Particularly in GWP, PED, and RI, the normalized values are significantly lower than those of the other two approaches. Stationary recycling ranks second, while landfilling results in the highest overall environmental burden.
From the perspective of individual impact categories, GWP emerges as the most significant contributor, accounting for more than 40% of the overall environmental burden in all assessed scenarios. This is followed by AP, PED, RI, EP, and ADP. These results highlight that greenhouse gas emissions, acidifying emissions, and energy consumption are the primary environmental challenges associated with construction and demolition waste management.

4.2. Environmental Impacts of Recycled Aggregate Concrete

4.2.1. Characterization

To systematically assess the environmental impacts of recycled aggregate concrete under different replacement ratios of recycled aggregates, this study follows ISO standards and uses the eFootprint platform to convert inventory data into six typical impact categories, covering key dimensions such as resource use, energy consumption, and environmental emissions, including ADP, PED, RI, EP, GWP, and AP.
The characterization results for each environmental indicator are shown in Figure 7, and different replacement ratios exhibit varying trends across the indicators. ADP decreases progressively with the increase in recycled aggregate replacement ratio, with a maximum reduction of 2.21% at 100% replacement, reflecting the positive effect of replacing natural aggregates in terms of resource conservation. PED shows a slight increase (maximum rise of 2.53%), mainly due to the relatively high electricity consumption during recycled aggregate processing. RI is effectively reduced by the use of recycled aggregates; the RI value decreases with higher replacement ratios, with a maximum reduction of 5.60%. EP declines due to reduced vehicle exhaust emissions, with a reduction of up to 20.90% at full replacement. GWP slightly Increases (maximum about 3.57%), which is closely related to the coal-dominated energy structure in Northeast China and the increased cement demand caused by the use of recycled aggregates. AP generally decreases with increasing replacement ratio, with a maximum reduction of 17.95%.

4.2.2. Contribution Analysis

To further investigate the environmental impacts across different stages of the recycled aggregate concrete life cycle, this study modeled the commonly used 30% replacement ratio concrete using the eFootprint platform. This replacement level was selected as a representative scenario based on its common use in engineering practice and frequent reference in relevant studies. The results are presented in Figure 8.
The findings indicate that, for the GWP, PED, and ADP indicators, the cement production stage accounts for 86.39%, 82.17%, and 88.62% of the total impact, respectively—each exceeding 80%—making it the dominant source of environmental burden. This is mainly due to the substantial emissions of pollutants and greenhouse gases during the clinker calcination process. The aggregate transportation stage is a secondary contributor, accounting for approximately 7% to 9%. Other stages such as cement transportation, aggregate transportation, and recycled aggregate production have relatively minor contributions; however, for certain indicators, long-distance transport and associated diesel consumption still represent a notable environmental load.

4.2.3. Influence of Transport Distance on Multi-Indicator Environmental Impacts

As demonstrated in the previous analysis, the transportation stage is the second most significant environmental contributor in concrete production, following cement. To further explore this impact, we conducted an in-depth analysis of how varying transportation distances influence multiple environmental impact categories during the production of recycled aggregate concrete. As shown in Figure 9, increases in transportation distance generally lead to a rise across all six environmental impact categories during the production of recycled aggregate concrete.
Notably, both GWP and PED increase sharply with longer transportation distances. When the distance exceeds 60 km, their values surpass those of conventional concrete regardless of the replacement ratio. However, for indicators such as ADP, AP, EP, and RI, recycled concrete maintains a clear environmental advantage as long as the transportation distance remains below 60 km. These advantages become more pronounced with higher replacement ratios. Beyond 60 km, however, the environmental burdens increase significantly and may even exceed those of natural aggregate concrete.
These findings confirm that transportation is the second most critical factor after cement and underscore the importance of regional supply planning and local sourcing strategies to fully realize the environmental benefits of recycled aggregates.

4.2.4. Sensitivity Analysis

Sensitivity analysis is used to evaluate how variations in inventory data influence the environmental impact results. It is an important approach for identifying key influencing factors and optimizing environmental pathways. This study conducted a comparative analysis between conventional concrete (i.e., 100% natural aggregate) and recycled aggregate concrete. The results are presented in Figure 10 and Figure 11.
For ordinary concrete, the sensitivity of cement production exceeds 60% in the GWP, PED, and ADP categories, while the transportation stage contributes more than 11%, making them the primary influencing factors. In terms of AP and EP, the sensitivity of the transportation stage exceeds 60%, followed by cement and natural coarse aggregate production. These results indicate that high cement usage intensity and diesel emissions from long-distance transportation are the main sources of environmental impact in ordinary concrete.
For recycled aggregate concrete, the overall sensitivity trends are similar to those of ordinary concrete, but the sensitivity values are generally slightly lower. In the GWP, PED, and ADP categories, cement and transportation remain the dominant contributors. However, due to the use of construction waste as raw material, the sensitivity of recycled aggregates to ADP is significantly lower than that of natural aggregates, demonstrating the advantage of resource recycling in reducing resource depletion. In the AP and EP indicators, the transportation stage remains the most sensitive, with sensitivity values exceeding 60%, though slightly lower than those of ordinary concrete. For the RI category, fly ash shows the highest sensitivity (50.85%), followed by transportation (24.78%), indicating that the choice of supplementary materials and transportation optimization play a crucial role in air pollution mitigation.

5. Conclusions

This study conducted a comprehensive life cycle assessment of recycled aggregate concrete using six environmental indicators and field-survey-based inventory data. The results indicate that under specific transport distances and replacement rates, recycled aggregate concrete can deliver significant environmental benefits. The main conclusions are as follows:
  • Compared with conventional landfill disposal, the use of recycled aggregates significantly reduces environmental impacts across most categories. In optimized fixed-plant scenarios, GWP can be reduced by up to 82.27%.
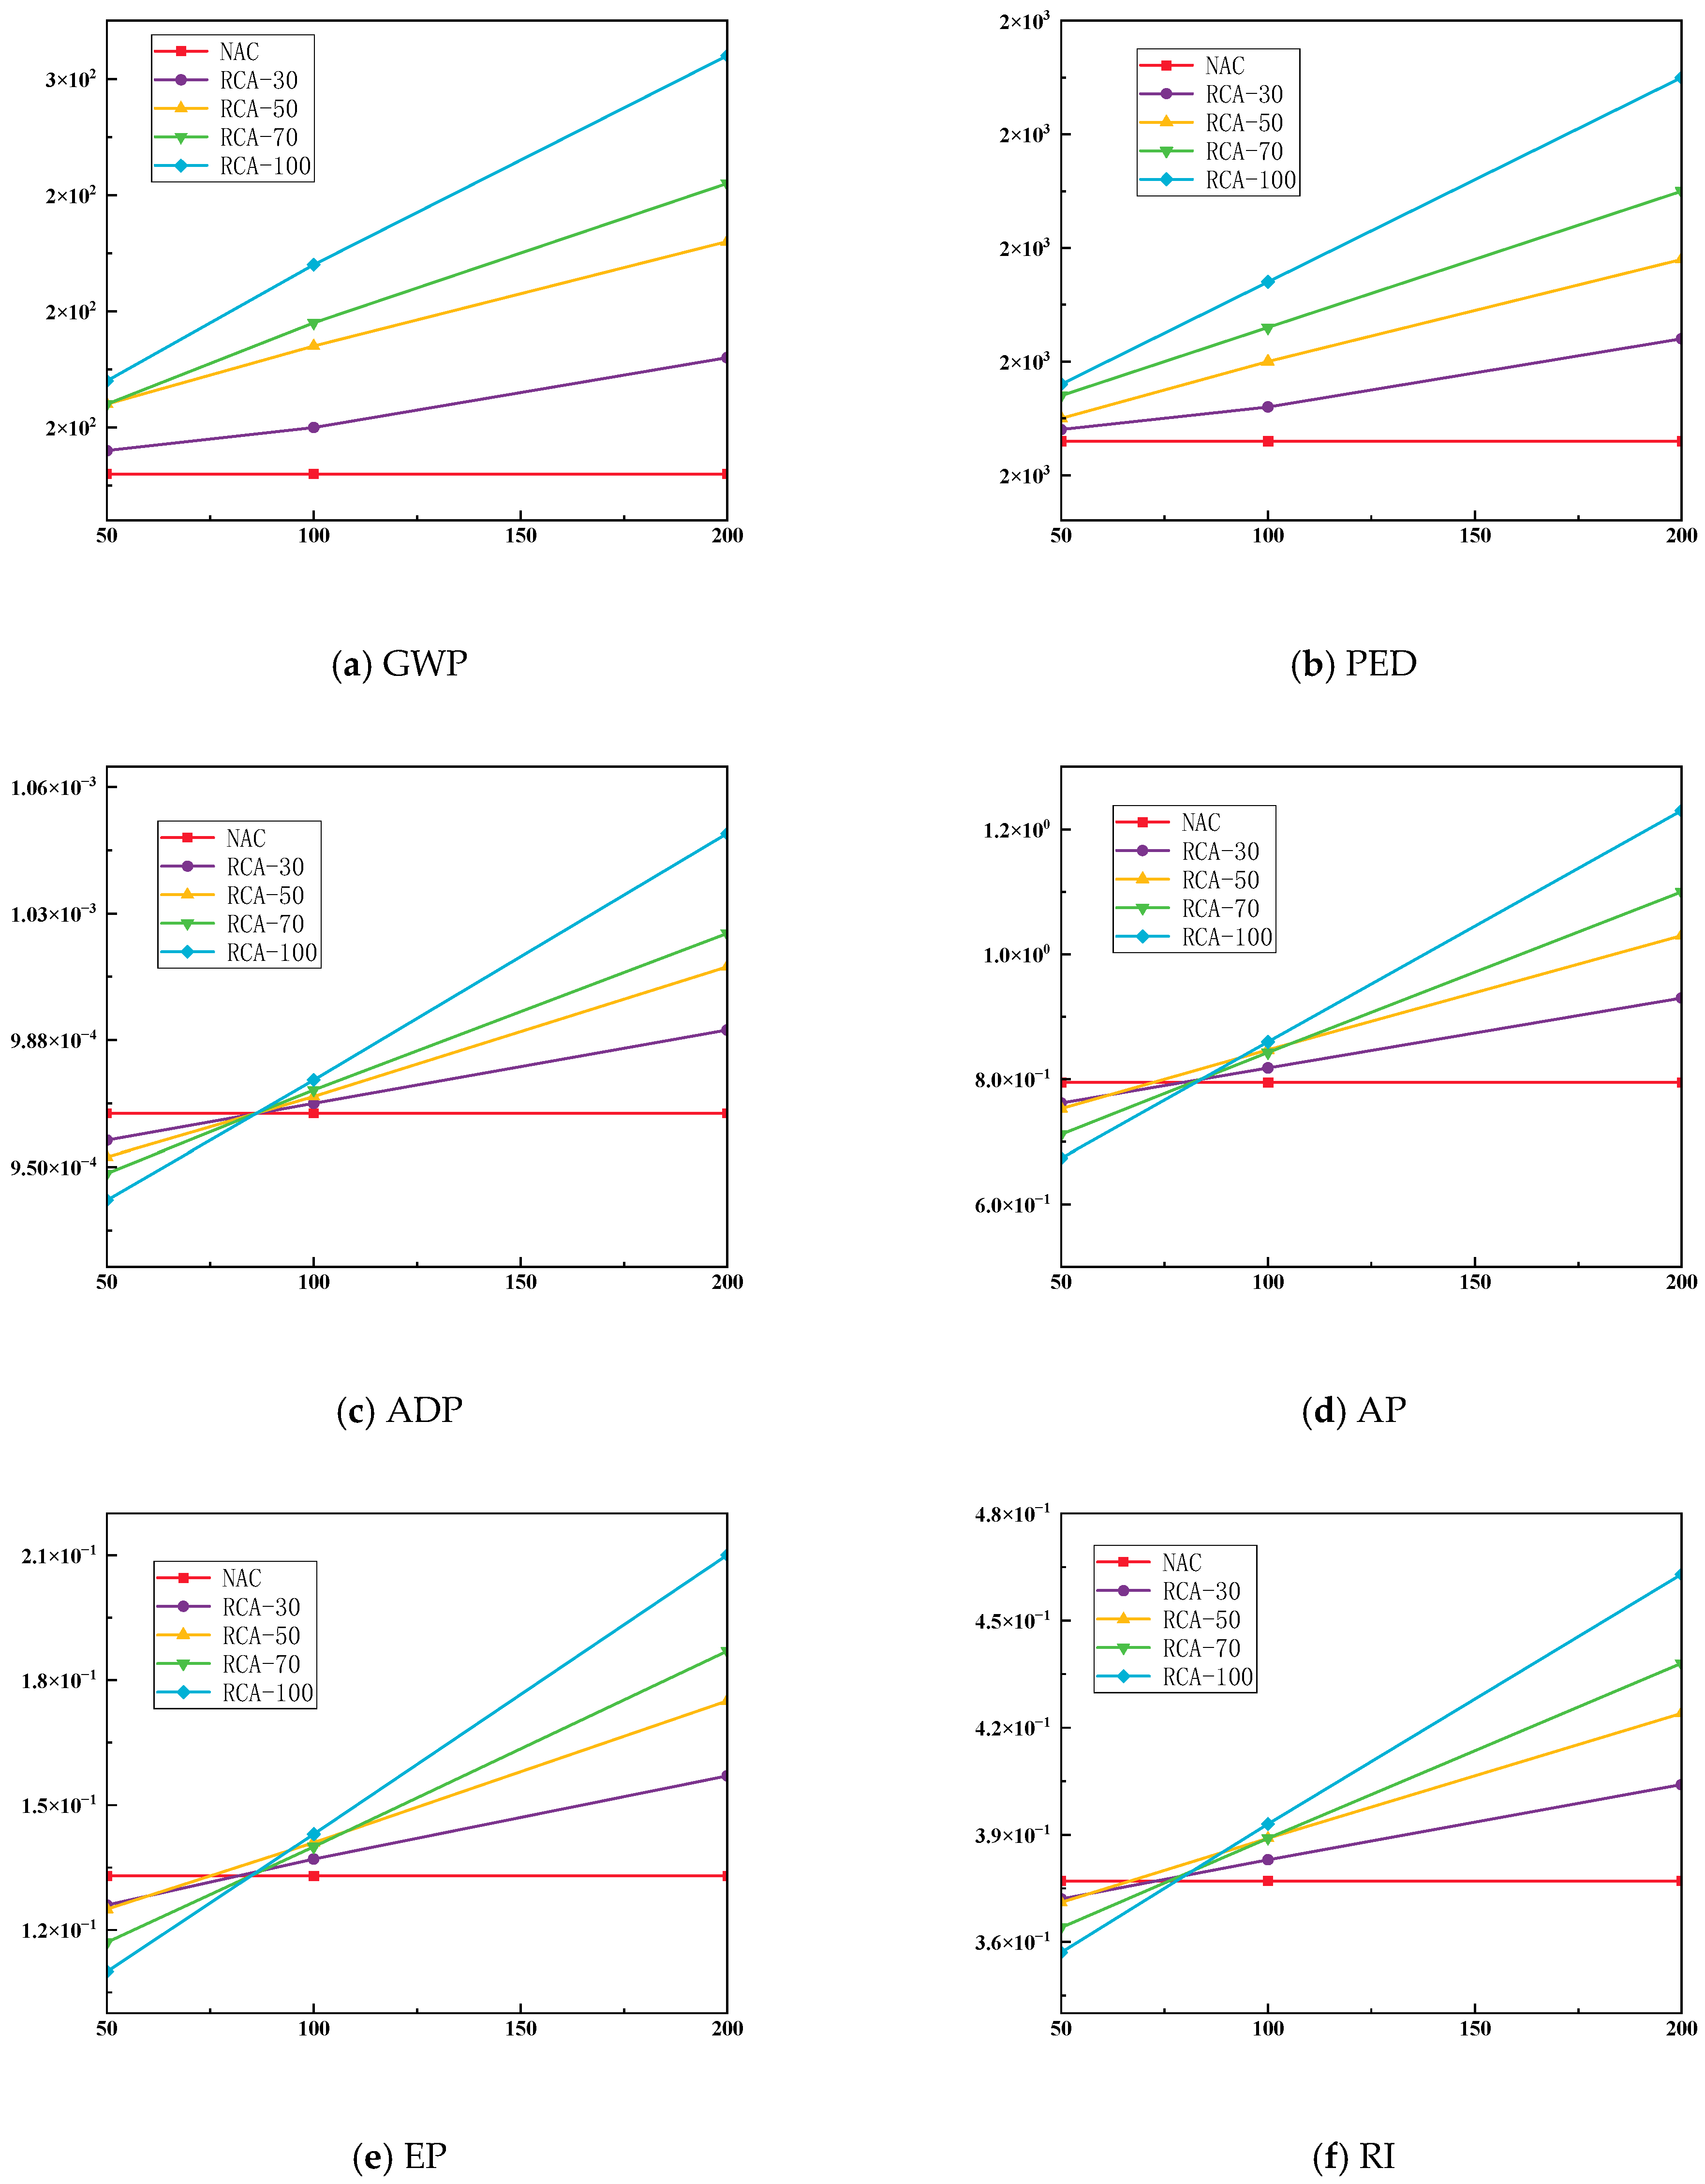
  • The environmental performance of RAC is highly sensitive to transportation distance. When the transport distance exceeds 60 km, both GWP and PED of RAC surpass those of conventional concrete, indicating a loss of environmental advantage.
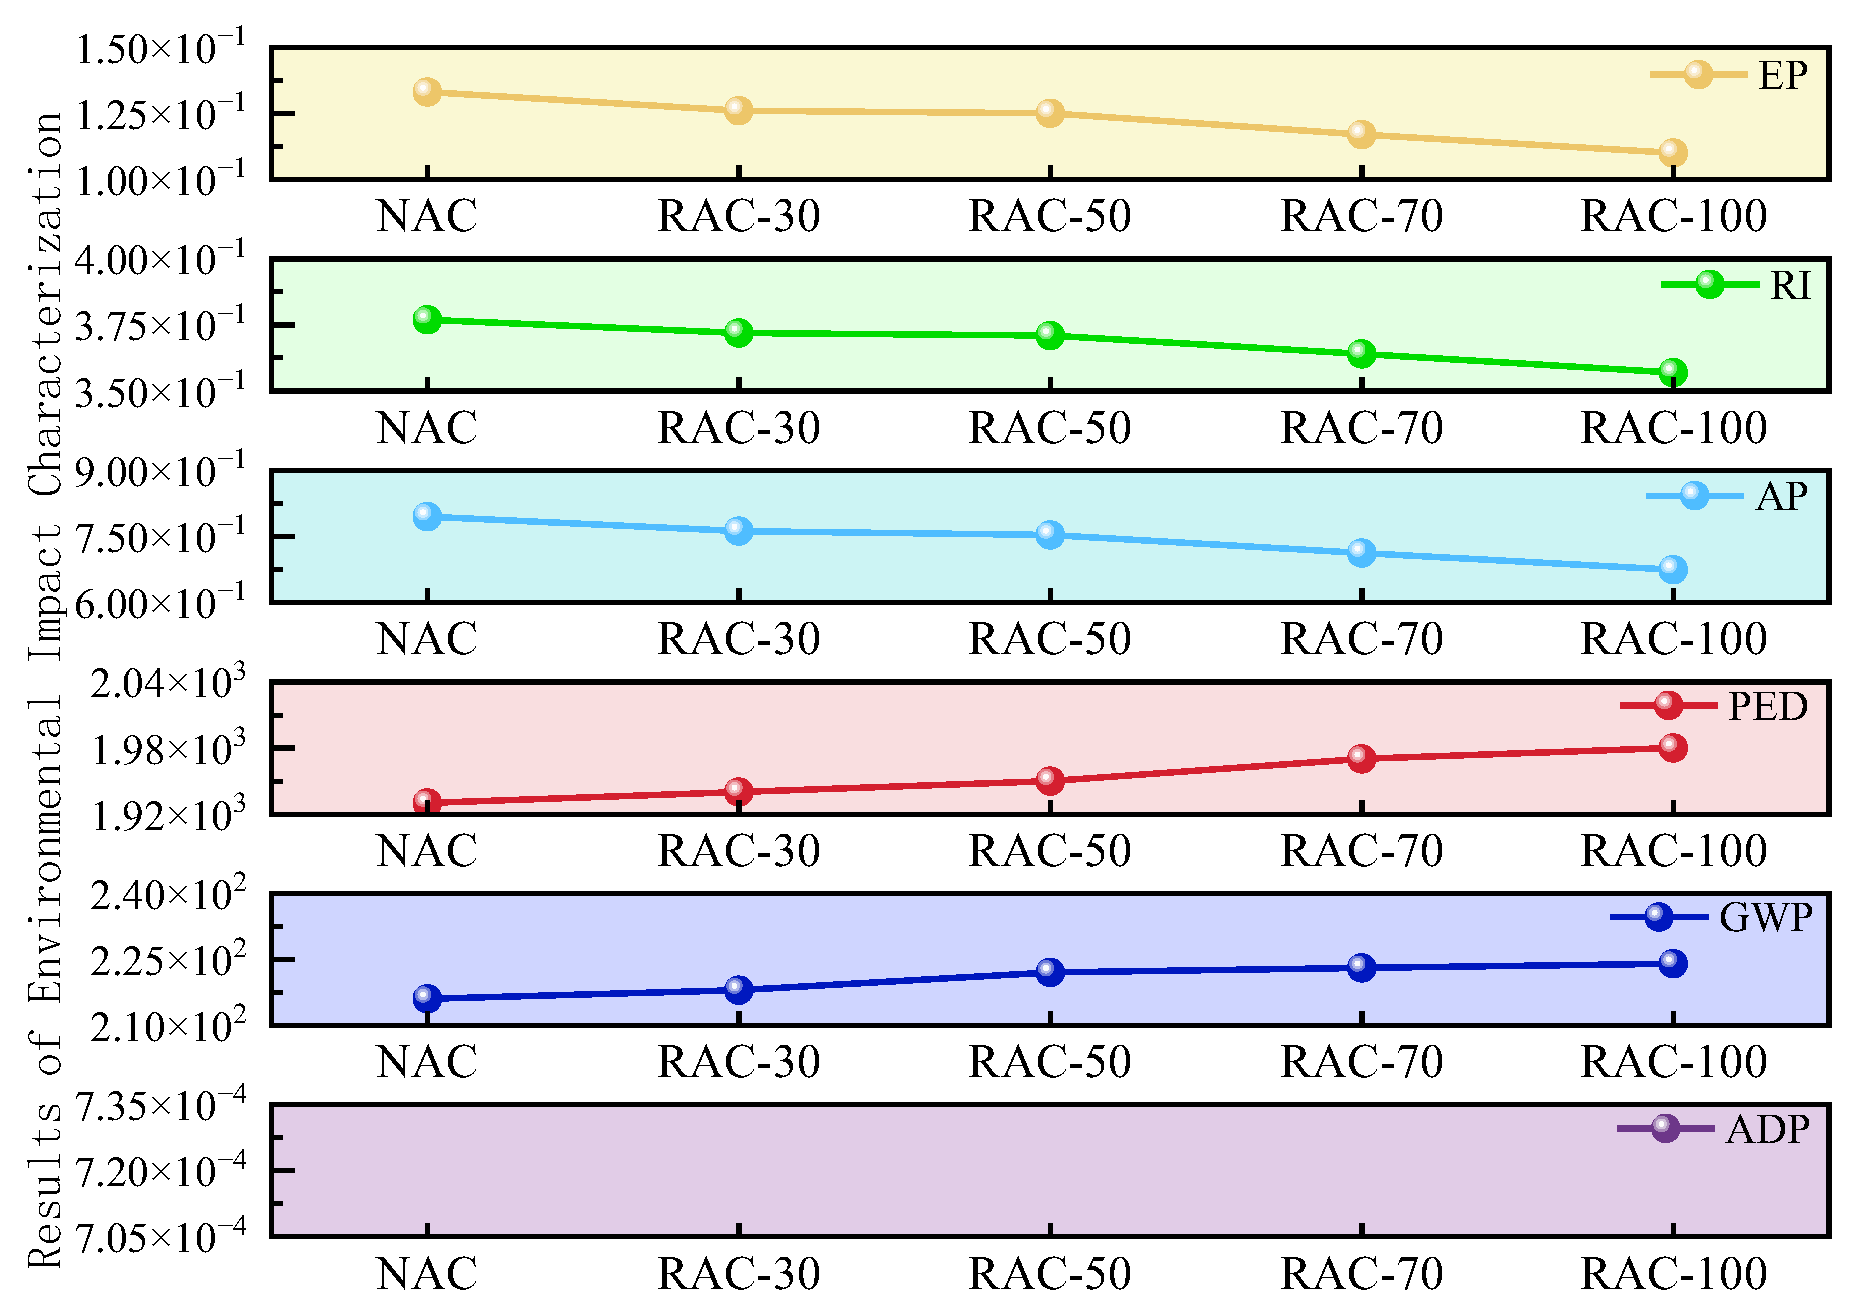
  • There are evident trade-offs among different environmental indicators. Although higher replacement rates may increase GWP and PED due to greater energy consumption during processing, they concurrently reduce ADP, AP, EP, and RI. This underscores the importance of adopting a multi-indicator evaluation approach in environmental decision-making.
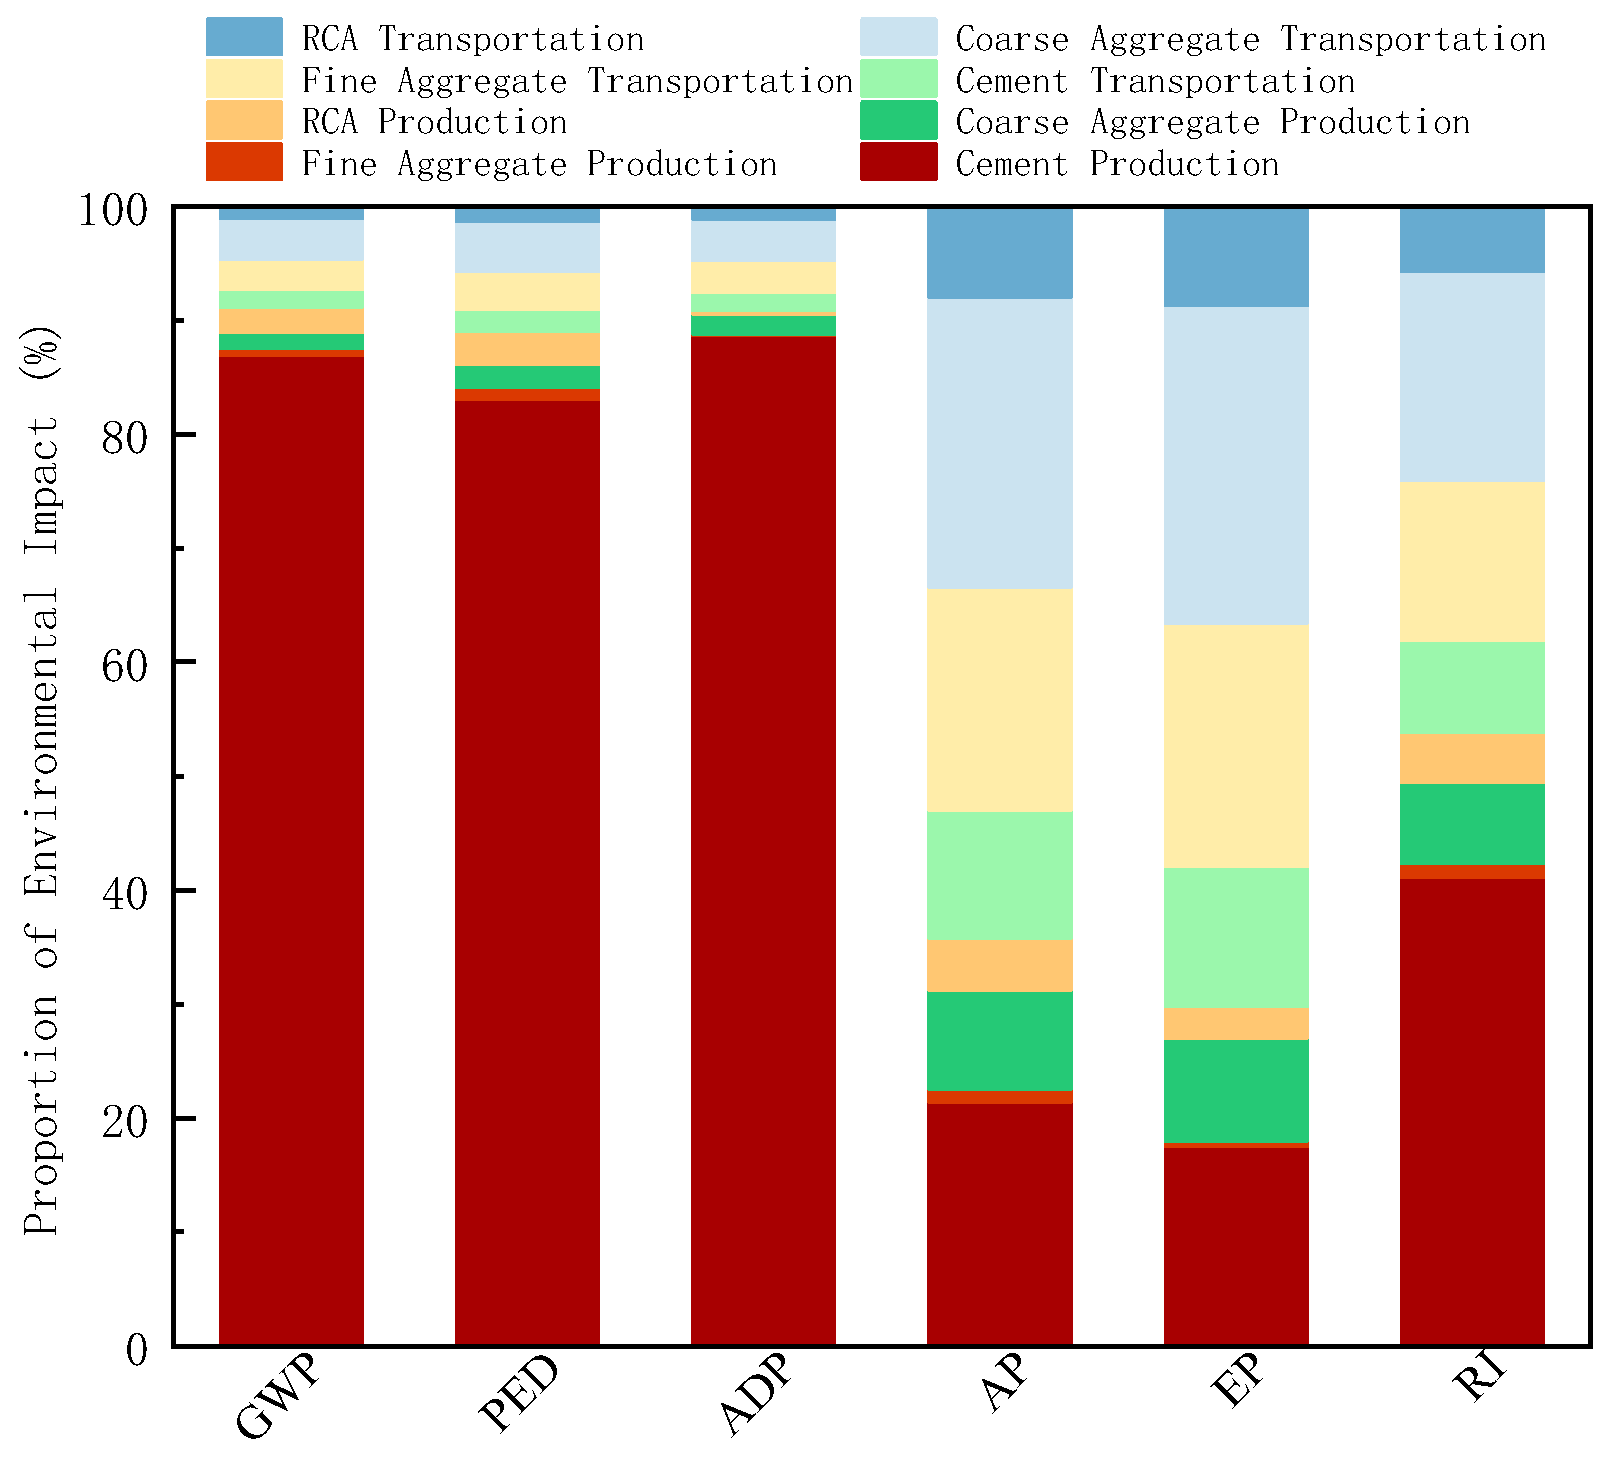
  • Sensitivity and contribution analyses reveal that cement production and transportation are the dominant contributors to most impact categories. Therefore, optimizing material transport routes and reducing transport distances are critical to maximizing environmental benefits.
  • This study integrates field-survey-based life cycle inventory data and utilizes the China-specific CLCD 0.9 database within the eFootprint platform. This enhances the regional representativeness and reproducibility of the results, distinguishing this work from conventional LCA studies that rely solely on international databases or single-indicator assessments.
The findings of this study offer quantitative evidence to support green construction policies and certification frameworks. Environmental indicators such as GWP and ADP are core components of life cycle-based assessments in rating systems like LEED v4 and BREEAM New Construction. The identification of key environmental hotspots—namely, cement production and transport distance—and the proposed 60 km transport threshold, provides actionable criteria for sustainable material sourcing and Environmental Product Declarations (EPDs). These insights can assist in shaping local green building standards and procurement strategies.
In conclusion, recycled aggregate concrete demonstrates substantial environmental advantages when applied under appropriate logistical conditions and with careful consideration of trade-offs across multiple impact categories. The methods and results presented in this study contribute a practical, data-driven foundation for advancing low-carbon strategies and the responsible use of recycled materials in the construction sector.

Author Contributions

Conceptualization, X.W. and H.Z.; methodology, H.Z.; software, H.Z. and P.R.; validation, X.W., H.Z. and L.Y.; formal analysis, H.Z.; investigation, H.Z.; resources, X.W.; data curation, H.Z.; writing—original draft preparation, H.Z.; writing—review and editing, X.W.; visualization, H.Z.; supervision, H.Z.; project administration, X.W.; funding acquisition, X.W. All authors have read and agreed to the published version of the manuscript.

Funding

This research was funded by the funding project of Northeast Geological S&T Innovation Center of China Geological Survey (grant number QCJJ2023-56) and the Scientific Research Project of the Liaoning Provincial Department of Education (LJKMZ20221823).

Data Availability Statement

All data used in the study are shown in the manuscript.

Conflicts of Interest

The authors declare no conflicts of interest.

References

  1. Guo, Z.; Shi, H.; Zhang, P.; Chi, Y.; Feng, A. Material Metabolism and Lifecycle Impact Assessment towards Sustainable Resource Management: A Case Study of the Highway Infrastructural System in Shandong Peninsula, China. J. Clean. Prod. 2017, 153, 195–208. [Google Scholar] [CrossRef]
  2. Anne, M.Y.; Chand, J. Geo-Polymer Concrete- a Concrete for Sustainable Environment. IOP Conf. Ser. Earth Environ. Sci. 2023, 1110, 012049. [Google Scholar] [CrossRef]
  3. Jørgensen, B.N.; Ma, Z. Towards Energy Efficient Buildings by Digital Transformation of the Building Lifecycle. Energy Inform. 2024, 7, 81. [Google Scholar] [CrossRef]
  4. Chatterjee, B.; Mazumder, D. Role of Stage-Separation in the Ubiquitous Development of Anaerobic Digestion of Organic Fraction of Municipal Solid Waste: A Critical Review. Renew. Sustain. Energy Rev. 2019, 104, 439–469. [Google Scholar] [CrossRef]
  5. Tian, H.; Cui, Y.; Dong, J. Research on Policy Instruments for Promoting Green Lifestyle in China—A Multi-Dimensional Analysis Based on Current Policy Texts. Front. Environ. Sci. 2024, 12, 1405537. [Google Scholar] [CrossRef]
  6. Wang, H.; Chiang, P.-C.; Cai, Y.; Li, C.; Wang, X.; Chen, T.-L.; Wei, S.; Huang, Q. Application of Wall and Insulation Materials on Green Building: A Review. Sustainability 2018, 10, 3331. [Google Scholar] [CrossRef]
  7. Ibrahim, M.I.M. Estimating the Sustainability Returns of Recycling Construction Waste from Building Projects. Sustain. Cities Soc. 2016, 23, 78–93. [Google Scholar] [CrossRef]
  8. Petrakli, F.; Gkika, A.; Bonou, A.; Karayannis, P.; Koumoulos, E.P.; Semitekolos, D.; Trompeta, A.-F.; Rocha, N.; Santos, R.M.; Simmonds, G.; et al. End-of-Life Recycling Options of (Nano)Enhanced CFRP Composite Prototypes Waste-A Life Cycle Perspective. Polymers 2020, 12, 2129. [Google Scholar] [CrossRef]
  9. Vieira, D.R.; Calmon, J.L.; Coelho, F.Z. Life Cycle Assessment (LCA) Applied to the Manufacturing of Common and Ecological Concrete: A Review. Constr. Build. Mater. 2016, 124, 656–666. [Google Scholar] [CrossRef]
  10. Negishi, K.; Tiruta-Barna, L.; Schiopu, N.; Lebert, A.; Chevalier, J. An Operational Methodology for Applying Dynamic Life Cycle Assessment to Buildings. Build. Environ. 2018, 144, 611–621. [Google Scholar] [CrossRef]
  11. Kua, H.W.; Maghimai, M. Steel-versus-Concrete Debate Revisited: Global Warming Potential and Embodied Energy Analyses Based on Attributional and Consequential Life Cycle Perspectives. J. Ind. Ecol. 2016, 21, 82–100. [Google Scholar] [CrossRef]
  12. Biswas, W.K.; Alhorr, Y.; Lawania, K.K.; Sarker, P.K.; Elsarrag, E. Life Cycle Assessment for Environmental Product Declaration of Concrete in the Gulf States. Sustain. Cities Soc. 2017, 35, 36–46. [Google Scholar] [CrossRef]
  13. Abdelaal, F.; Guo, B.H.W. Stakeholders’ Perspectives on BIM and LCA for Green Buildings. J. Build. Eng. 2022, 48, 103931. [Google Scholar] [CrossRef]
  14. Dsilva, J.; Zarmukhambetova, S.; Locke, J. Assessment of Building Materials in the Construction Sector: A Case Study Using Life Cycle Assessment Approach to Achieve the Circular Economy. Heliyon 2023, 9, e20404. [Google Scholar] [CrossRef] [PubMed]
  15. Wiloso, E.I.; Nazir, N.; Hanafi, J.; Siregar, K.; Harsono, S.S.; Setiawan, A.A.R.; Muryanto; Romli, M.; Utama, N.A.; Shantiko, B.; et al. Life Cycle Assessment Research and Application in Indonesia. Int. J. Life Cycle Assess. 2018, 24, 386–396. [Google Scholar] [CrossRef]
  16. Obrecht, T.P.; Röck, M.; Hoxha, E.; Passer, A. BIM and LCA Integration: A Systematic Literature Review. Sustainability 2020, 12, 5534. [Google Scholar] [CrossRef]
  17. LAWRENCE, D.P. PROFILE: Integrating Sustainability and Environmental Impact Assessment. Environ. Manag. 1997, 21, 23–42. [Google Scholar] [CrossRef] [PubMed]
  18. An Overview of Sound Environmental Aspect of Japan’s Comprehensive Assessment System for Building Environmental Efficiency (CASBEE) Certifications, The Journal of the Acoustical Society of America—X-MOL. Available online: https://www.x-mol.com/paper/1526641784150315013?adv (accessed on 27 May 2025).
  19. Guggemos, A.A.; Horvath, A. Comparison of Environmental Effects of Steel- and Concrete-Framed Buildings. J. Infrastruct. Syst. 2005, 11, 93–101. [Google Scholar] [CrossRef]
  20. Zhang, Y.; Wang, Q.; Zhang, J.; Xu, Y.; Tian, S.; Yang, S.; Xu, Y.; Zhang, H.; Yuan, X.; Ma, Q.; et al. Study on Carbon Footprint Evaluation and Carbon Reduction Path of Cross-Basin Water Transfer Project—A Case Study of the Yellow River East Diversion Project in China. Environ. Impact Assess. Rev. 2024, 106, 107509. [Google Scholar] [CrossRef]
  21. Huang, M.; Dong, Q.; Ni, F.; Wang, L. LCA and LCCA Based Multi-Objective Optimization of Pavement Maintenance. J. Clean. Prod. 2021, 283, 124583. [Google Scholar] [CrossRef]
  22. Gong, Z. Quantitative Evaluation of the Physical Environmental Conditions in the Life Cycle of Building Materials. Master’s Thesis, Tsinghua University, Beijing, China, 2005. [Google Scholar]
  23. Gebremariam, A.T.; Vahidi, A.; Di Maio, F.; Moreno-Juez, J.; Vegas-Ramiro, I.; Łagosz, A.; Mróz, R.; Rem, P. Comprehensive Study on the Most Sustainable Concrete Design Made of Recycled Concrete, Glass and Mineral Wool from C&D Wastes. Constr. Build. Mater. 2021, 273, 121697. [Google Scholar] [CrossRef]
  24. Lu, L. Optimal Replacement Ratio of Recycled Concrete Aggregate Balancing Mechanical Performance with Sustainability: A Review. Buildings 2024, 14, 2204. [Google Scholar] [CrossRef]
  25. Dilbas, H.; Çakır, Ö.; Atiş, C.D. Experimental Investigation on Properties of Recycled Aggregate Concrete with Optimized Ball Milling Method. Constr. Build. Mater. 2019, 212, 716–726. [Google Scholar] [CrossRef]
  26. Marinković, S.; Radonjanin, V.; Malešev, M.; Ignjatović, I. Comparative Environmental Assessment of Natural and Recycled Aggregate Concrete. Waste Manag. 2010, 30, 2255–2264. [Google Scholar] [CrossRef]
  27. Park, W.-J.; Kim, T.; Roh, S.; Kim, R. Analysis of Life Cycle Environmental Impact of Recycled Aggregate. Appl. Sci. 2019, 9, 1021. [Google Scholar] [CrossRef]
  28. Xiao, J.; Guan, X.; Wang, D.; Wang, J. Study on Carbon Emission Factors of Recycled Concrete. J. Archit. Civ. Eng. 2023, 40, 1–11. [Google Scholar] [CrossRef]
  29. Xiao, J.; Li, A.; Ding, T. Life Cycle CO₂ Emission Assessment of Recycled Concrete. J. Southeast Univ. (Nat. Sci. Ed.) 2016, 46, 1088–1092. [Google Scholar]
  30. ISO 14040:2006; Overview of Life Cycle Assessment ISO 14040. Environmental Herald: Surrey, UK, 1998; pp. 32–34.
  31. ISO 14044:2006; Environmental Management—Life Cycle Assessment—Requirements and Guidelines. ISO: Geneva, Switzerland, 2006.
  32. EN 15804:2012; Sustainability of Construction Works—Environmental Product Declarations—Core Rules for the Product Category of Construction Products. European Committee for Standardization (CEN): Brussels, Belgium, 2012.
  33. Arena, U.; Mastellone, M.L.; Perugini, F. The Environmental Performance of Alternative Solid Waste Management Options: A Life Cycle Assessment Study. Chem. Eng. J. 2003, 96, 207–222. [Google Scholar] [CrossRef]
  34. Cui, S.; Du, X.; Lan, M.; Yan, J. Study on Heavy Metal Leaching in Waste Concrete. Concrete 2011, 16–17, 20. [Google Scholar]
  35. Gong, Z.; Ding, R.; Chen, B. Comparative Study on Environmental Impact of Waste Concrete Treatment Methods. J. Eng. Manag. 2011, 25, 266–270. [Google Scholar]
  36. GHG Protocol. Chinese Life Cycle Database (CLCD). Available online: https://ghgprotocol.org/Third-Party-Databases/CLCD (accessed on 10 June 2025).
  37. Qian, H.; Zhao, Y.; Qin, F.; Song, G. Life-Cycle Environmental Burdens of Ethylene Production in the Context of China’s Chemical Feedstock Transition from Naphtha to Coal and Shale Gas By-Product of Ethane. Environ. Impact Assess. Rev. 2023, 101, 107152. [Google Scholar] [CrossRef]
  38. Gu, L. Study on Environmental Impacts of China’s Construction Industry Based on Life Cycle Assessment. Ph.D. Thesis, Tsinghua University, Beijing, China, 2011. [Google Scholar]
  39. Sun, P. Development of LCEC Evaluation Model for Environmental Impact of Recycled Concrete. Master’s Thesis, Zhejiang University, Hangzhou, China, 2013. [Google Scholar]
  40. Zhang, Y. Comprehensive Environmental Impact Assessment of Fly Ash Concrete Based on Life Cycle. Ph.D. Thesis, Beijing Jiaotong University, Beijing, China, 2017. [Google Scholar]
  41. Wang, S. Study on Life Cycle Environmental Impact Assessment of Ready-Mixed Concrete. Master’s Thesis, Tsinghua University, Beijing, China, 2011. [Google Scholar]
  42. Estanqueiro, B.; Silvestre, J.D.; Brito, J.D.; Pinheiro, M.D. Environmental Life Cycle Assessment of Coarse Natural and Recy-cled Aggregates for Concrete. Eur. J. Environ. Civ. Eng. 2016, 22, 429–449. [Google Scholar] [CrossRef]
  43. Dias, A.B.; Pacheco, J.N.; Silvestre, J.D.; Martins, I.M.; Brito, J. de Environmental and Economic Life Cycle Assessment of Recycled Coarse Aggregates: A Portuguese Case Study. Materials 2021, 14, 5452. [Google Scholar] [CrossRef] [PubMed]
  44. Kim, T.; Tae, S.; Chae, C. Analysis of Environmental Impact for Concrete Using LCA by Varying the Recycling Components, the Compressive Strength and the Admixture Material Mixing. Sustainability 2016, 8, 389. [Google Scholar] [CrossRef]
  45. Patrisia, Y.; Law, D.W.; Gunasekara, C.; Setunge, S. Assessment of Waste-Integrated Concrete Products: A Cradle-to-Cradle Perspective. Int. J. Life Cycle Assess. 2025, 30, 834–861. [Google Scholar] [CrossRef]
Figure 1. Geographical location of the surveyed enterprise.
Buildings 15 02301 g001
Figure 2. Overall process flow diagram for construction waste treatment.
Buildings 15 02301 g002
Figure 3. System boundary diagram for different treatment pathways.
Buildings 15 02301 g003
Figure 4. System boundary diagram of the life cycle of recycled concrete.
Buildings 15 02301 g004
Figure 5. Interface of the eFootprint platform for selecting functional units and environmental impact categories: (a) functional unit and modeling parameter definition; (b) environmental impact category selection.
Buildings 15 02301 g005
Figure 6. Output interface of the eFootprint platform showing quantitative results and visual outputs.
Buildings 15 02301 g006
Figure 7. Characterization results for different environmental impact types.
Buildings 15 02301 g007
Figure 8. Analysis of the contribution of recycled concrete.
Buildings 15 02301 g008
Figure 9. Characterization results for various transportation distances.
Buildings 15 02301 g009
Figure 10. Sensitivity analysis of inventory data for conventional concrete.
Buildings 15 02301 g010
Figure 11. Sensitivity analysis of inventory data for recycled concrete.
Buildings 15 02301 g011
Table 1. Recycled concrete proportions.
No.Replacement Ratio (%)Material Quantities (kg)
Recycled Coarse AggregateNatural Coarse AggregateSandCementWaterGGBFSFly AshAdmixture
NAC00103079323117871535.15
RAC-303030972179323517871535.2
RAC-505051551579324017871535.27
RAC-707072130979324517871535.35
RAC-1001001030079325117871535.44
Table 2. Main equipment power table.
No.Equipment NameQuantity (units)Power (kW)
1Grizzly Feeder137
2Jaw Crusher1160
3Magnetic Separator33
4Screening Machine15.7
5Flotation Unit124.1
6Impact Crusher2280
7Air Separator35.5
8Dust Collector416.25
9Circular Vibrating Screen430
Total Installed Power 997.3
Table 3. Installed power of mobile crushing plants with different production capacities.
Production CapacityEquipmentQuantity (units)Power (kW)Total Power (kW)
100 t/hFeeder14.8190.3
Impact Crusher1160
Belt Conveyor17.5
Magnetic Separator13
Vibrating Screen115
150 t/hFeeder111175.5
Impact Crusher1132
Belt Conveyors218.5
Magnetic Separator13
Vibrating Screen122
200 t/hFeeder115306
Impact Crusher1250
Circular Vibrating Screen130
Table 4. Environmental impact inventory for the production phase of recycled aggregates.
Environmental CategoryEnvironmental IndicatorStationary ModeMobile Mode
Energy ConsumptionRaw Coal (kg)1.79 × 1001.15 × 100
Crude Oil (kg)7.35 × 10−34.73 × 10−3
Natural Gas (m3)3.97 × 10−42.56 × 10−4
Environmental EmissionsCO2 (kg)4.24 × 10−22.72 × 10−2
SO2 (kg)8.00 × 10−35.14 × 10−3
NOx (kg)7.57 × 10−34.87 × 10−3
CO (kg)4.81 × 10−43.09 × 10−4
CH4 (kg)7.81 × 10−35.02 × 10−3
Particulate Matter (kg)1.74 × 10−41.12 × 10−4
Table 5. Environmental impact inventory during the transportation phase.
Environmental CategoryEnvironmental IndicatorDirect LandfillingStationary ModeMobile Mode
Energy ConsumptionRaw Coal (kg)1.21 × 10−11.34 × 10−11.22 × 10⁻²
Crude Oil (kg)1.64 × 1001.81 × 1001.65 × 10−1
Natural Gas (m3)4.38 × 10−24.81 × 10−24.39 × 10⁻³
Environmental EmissionsCO2 (kg)6.91 × 1007.60 × 1006.92 × 10−1
SO2 (kg)8.49 × 10−39.35 × 10−38.51 × 10⁻⁴
NOx (kg)2.08 × 10−12.29 × 10−12.09 × 10⁻²
CO (kg)4.85 × 10−25.33 × 10−24.86 × 10⁻³
CH4 (kg)2.44 × 10−22.69 × 10−22.45 × 10⁻³
Particulate Matter (kg)1.28 × 10−51.41 × 10−51.28 × 10⁻⁶
Table 6. Environmental impact inventory of the landfill phase.
Environmental CategoryEnvironmental IndicatorDirect Land-FillingStationary ModeMobile Mode
Energy ConsumptionRaw Coal (kg)2.24 × 1006.74 × 10−16.74 × 10⁻¹
Crude Oil (kg)1.15 × 1003.46 × 10−13.46 × 10⁻¹
Natural Gas (m3)5.58 × 10−41.68 × 10−41.68 × 10⁻⁴
Environmental EmissionsCO2 (kg)3.11 × 1009.34 × 10−19.34 × 10⁻¹
SO2 (kg)1.30 × 10−23.90 × 10−33.90 × 10⁻³
NOx (kg)5.78 × 10−21.74 × 10−21.74 × 10⁻²
CO (kg)2.46 × 10−27.39 × 10−37.39 × 10⁻³
CH4 (kg)9.92 × 10−32.98 × 10−32.98 × 10⁻³
Particulate Matter (kg)6.92 × 10−32.08 × 10−32.08 × 10⁻³
Land Use0.340.100.10
Table 7. Environmental impact inventory of construction waste under different treatment scenarios.
Direct Landfilling Stationary ModeMobile Mode
Resource InputsRaw Coal (kg)2.36 × 1002.60 × 1001.84 × 100
Crude Oil (kg)2.79 × 1002.16 × 1005.16 × 10−1
Natural Gas (m3)4.43 × 10−24.87 × 10−24.81 × 10⁻³
Environmental EmissionsCO2 (kg)1.00 × 1018.58 × 1001.65 × 100
SO2 (kg)2.14 × 10−22.12 × 10−29.89 × 10⁻³
NOx (kg)2.66 × 10−12.54 × 10−14.31 × 10⁻²
CO (kg)7.31 × 10−26.12 × 10−21.26 × 10⁻²
CH4 (kg)3.43 × 10−23.76 × 10−21.04 × 10⁻²
Particulate Matter (kg)6.94 × 10−32.27 × 10−32.20 × 10⁻³
Table 8. Environmental impact inventory of different aggregates.
Environmental CategoryEnvironmental IndicatorNatural AggregateRecycled Aggregate
Resource InputsRaw Coal (kg)1.35 × 1002.60 × 100
Crude Oil (kg)1.81 × 1002.16 × 100
Natural Gas (m3)3.64 × 10−24.87 × 10−2
Mineral Resources (kg)1.18 × 10³-
Environmental EmissionsCO2 (kg)6.92 × 1008.58 × 100
SO2 (kg)1.37 × 10−22.12 × 10−2
NOx (kg)1.96 × 10−12.54 × 10−1
CO (kg)4.97 × 10−26.12 × 10−2
CH4 (kg)2.56 × 10−23.76 × 10−2
Particulate Matter (kg)2.75 × 10−32.27 × 10−3
Table 9. Raw material consumption for cement production.
CategoryItemQuantityDataset Reference
Resource UseLimestone1.3 t[36]
Clay0.3 t[36]
Gypsum50 kg[36]
Energy UseElectricity105 kWh[37]
Table 10. Inventory of environmental emissions for different cement types.
Cement TypeEnergy Use (kg/t)CO2 (kg/t)CO (kg/t)SO2 (kg/t)NOx (kg/t)Source
P·O 32.5926780.201.09[38]
P·O 42.51438900.030.361.57[39]
P·O 42.5R136.4981.50.031.01[40]
P·O 42.51309200.360.251.43[41]
P·I 52.514910420.390.281.61[41]
Table 11. Transportation routes and distances for major raw materials.
Material TransportedOriginDestinationDistance (km)Mode of TransportMaterial TransportedOrigin
Construction wasteDemolition siteRecycled aggregate plant50Diesel truck (18 t)Construction wasteDemolition site
LimestoneQuarry siteCement plant100Diesel truck (18 t)LimestoneQuarry site
ClayQuarry siteCement plant100Diesel truck (18 t)ClayQuarry site
GypsumQuarry siteCement plant100Diesel truck (18 t)GypsumQuarry site
Recycled aggregateRecycled aggregate plantConcrete batching plant
Concrete batching plant
50Diesel truck (10 t)Recycled aggregateRecycled aggregate plant
SandQuarry site100Diesel truck (18 t)SandQuarry site
Gravel (stone)Quarry site100Diesel truck (18 t)Gravel (stone)Quarry site
CementCement plant50Bulk cement tanker (diesel)CementCement plant
Table 12. Characterization results for different treatments.
Treatment TypeDirect LandfillingStationary RecyclingMobile Recycling
GWP1.10 × 1019.63 × 1001.95 × 100
ADP7.59 × 10−76.20 × 10−71.94 × 10−7
PED5.20 × 1004.81 × 1002.36 × 100
AP2.08 × 10−11.99 × 10−14.01 × 10−2
EP3.46 × 10−23.30 × 10−25.60 × 10−3
RI3.66 × 10−23.43 × 10−26.60 × 10−3
Table 13. Normalized results for different aggregates.
Treatment TypeDirect LandfillingStationary RecyclingMobile Recycling
GWP1.59 × 10−111.72 × 10−114.67 × 10⁻¹²
ADP1.68 × 10−181.34 × 10−183.18 × 10⁻¹⁹
PED7.85 × 10−126.50 × 10−121.84 × 10⁻¹²
AP9.93 × 10−129.52 × 10−121.90 × 10⁻¹²
EP1.66 × 10−121.59 × 10−122.69 × 10⁻¹³
RI1.78 × 10−121.65 × 10−123.23 × 10⁻¹³
Disclaimer/Publisher’s Note: The statements, opinions and data contained in all publications are solely those of the individual author(s) and contributor(s) and not of MDPI and/or the editor(s). MDPI and/or the editor(s) disclaim responsibility for any injury to people or property resulting from any ideas, methods, instructions or products referred to in the content.

