
A Study of Carbon Emission Quota for Construction Period of Dredging Projects: Case Studies in Guangzhou, Shenzhen, and Malé


Abstract
1. Introduction
- (1)
- The establishment of a carbon emission calculation model during the construction period of dredging projects;
- (2)
- The compilation of carbon emission estimation quotas during the construction period of dredging projects; and
- (3)
- Case analysis and validation of quota effectiveness.
2. Calculation Model
2.1. Carbon Emission Factors for Dredging Projects
2.1.1. Fuel Energy
2.1.2. Electricity
2.2. Model for Direct Carbon Emissions
2.2.1. Model for Dredgers
2.2.2. Model for Auxiliary Equipment
2.3. Model for Indirect Carbon Emissions
2.3.1. Model for Equipment
2.3.2. Model for Management Activities
3. Carbon Emission Measurement Quota
3.1. The Content of the Quota
3.1.1. Description of the Quota
3.1.2. Content of the Carbon Emission Quota
3.1.3. Appendix to the Quota
3.2. Compilation of Direct Carbon Emission Quota
3.2.1. Quota for Dredgers
3.2.2. Quota for Auxiliary Equipment
3.2.3. The Effect of Changes in Working Conditions on Quota
3.3. Compilation of Indirect Carbon Emission Quota
3.3.1. Quota for the Mobilization of Construction Equipment
3.3.2. Managing Carbon Emission Quota for Management Activities
4. Case Studies and Quota Validation
- (1)
- The Shenzhen–Zhongshan Cross-River Passage main project (China), representing a large-scale offshore channel dredging project;
- (2)
- The Thilafushi Island reclamation project in Malé (Maldives), representing a nearshore land reclamation dredging project; and
- (3)
- The second phase of the southern section of the Guangzhou Port maintenance project (China), representing a routine inland port channel maintenance dredging operation.
4.1. Projects Overview
4.2. Data Sources
4.3. Calculation and Verification Analysis of Each Case
4.3.1. Shenzhen Project
- (1)
- Calculation results of carbon emissions during construction period.
- (2)
- Actual emission verification.
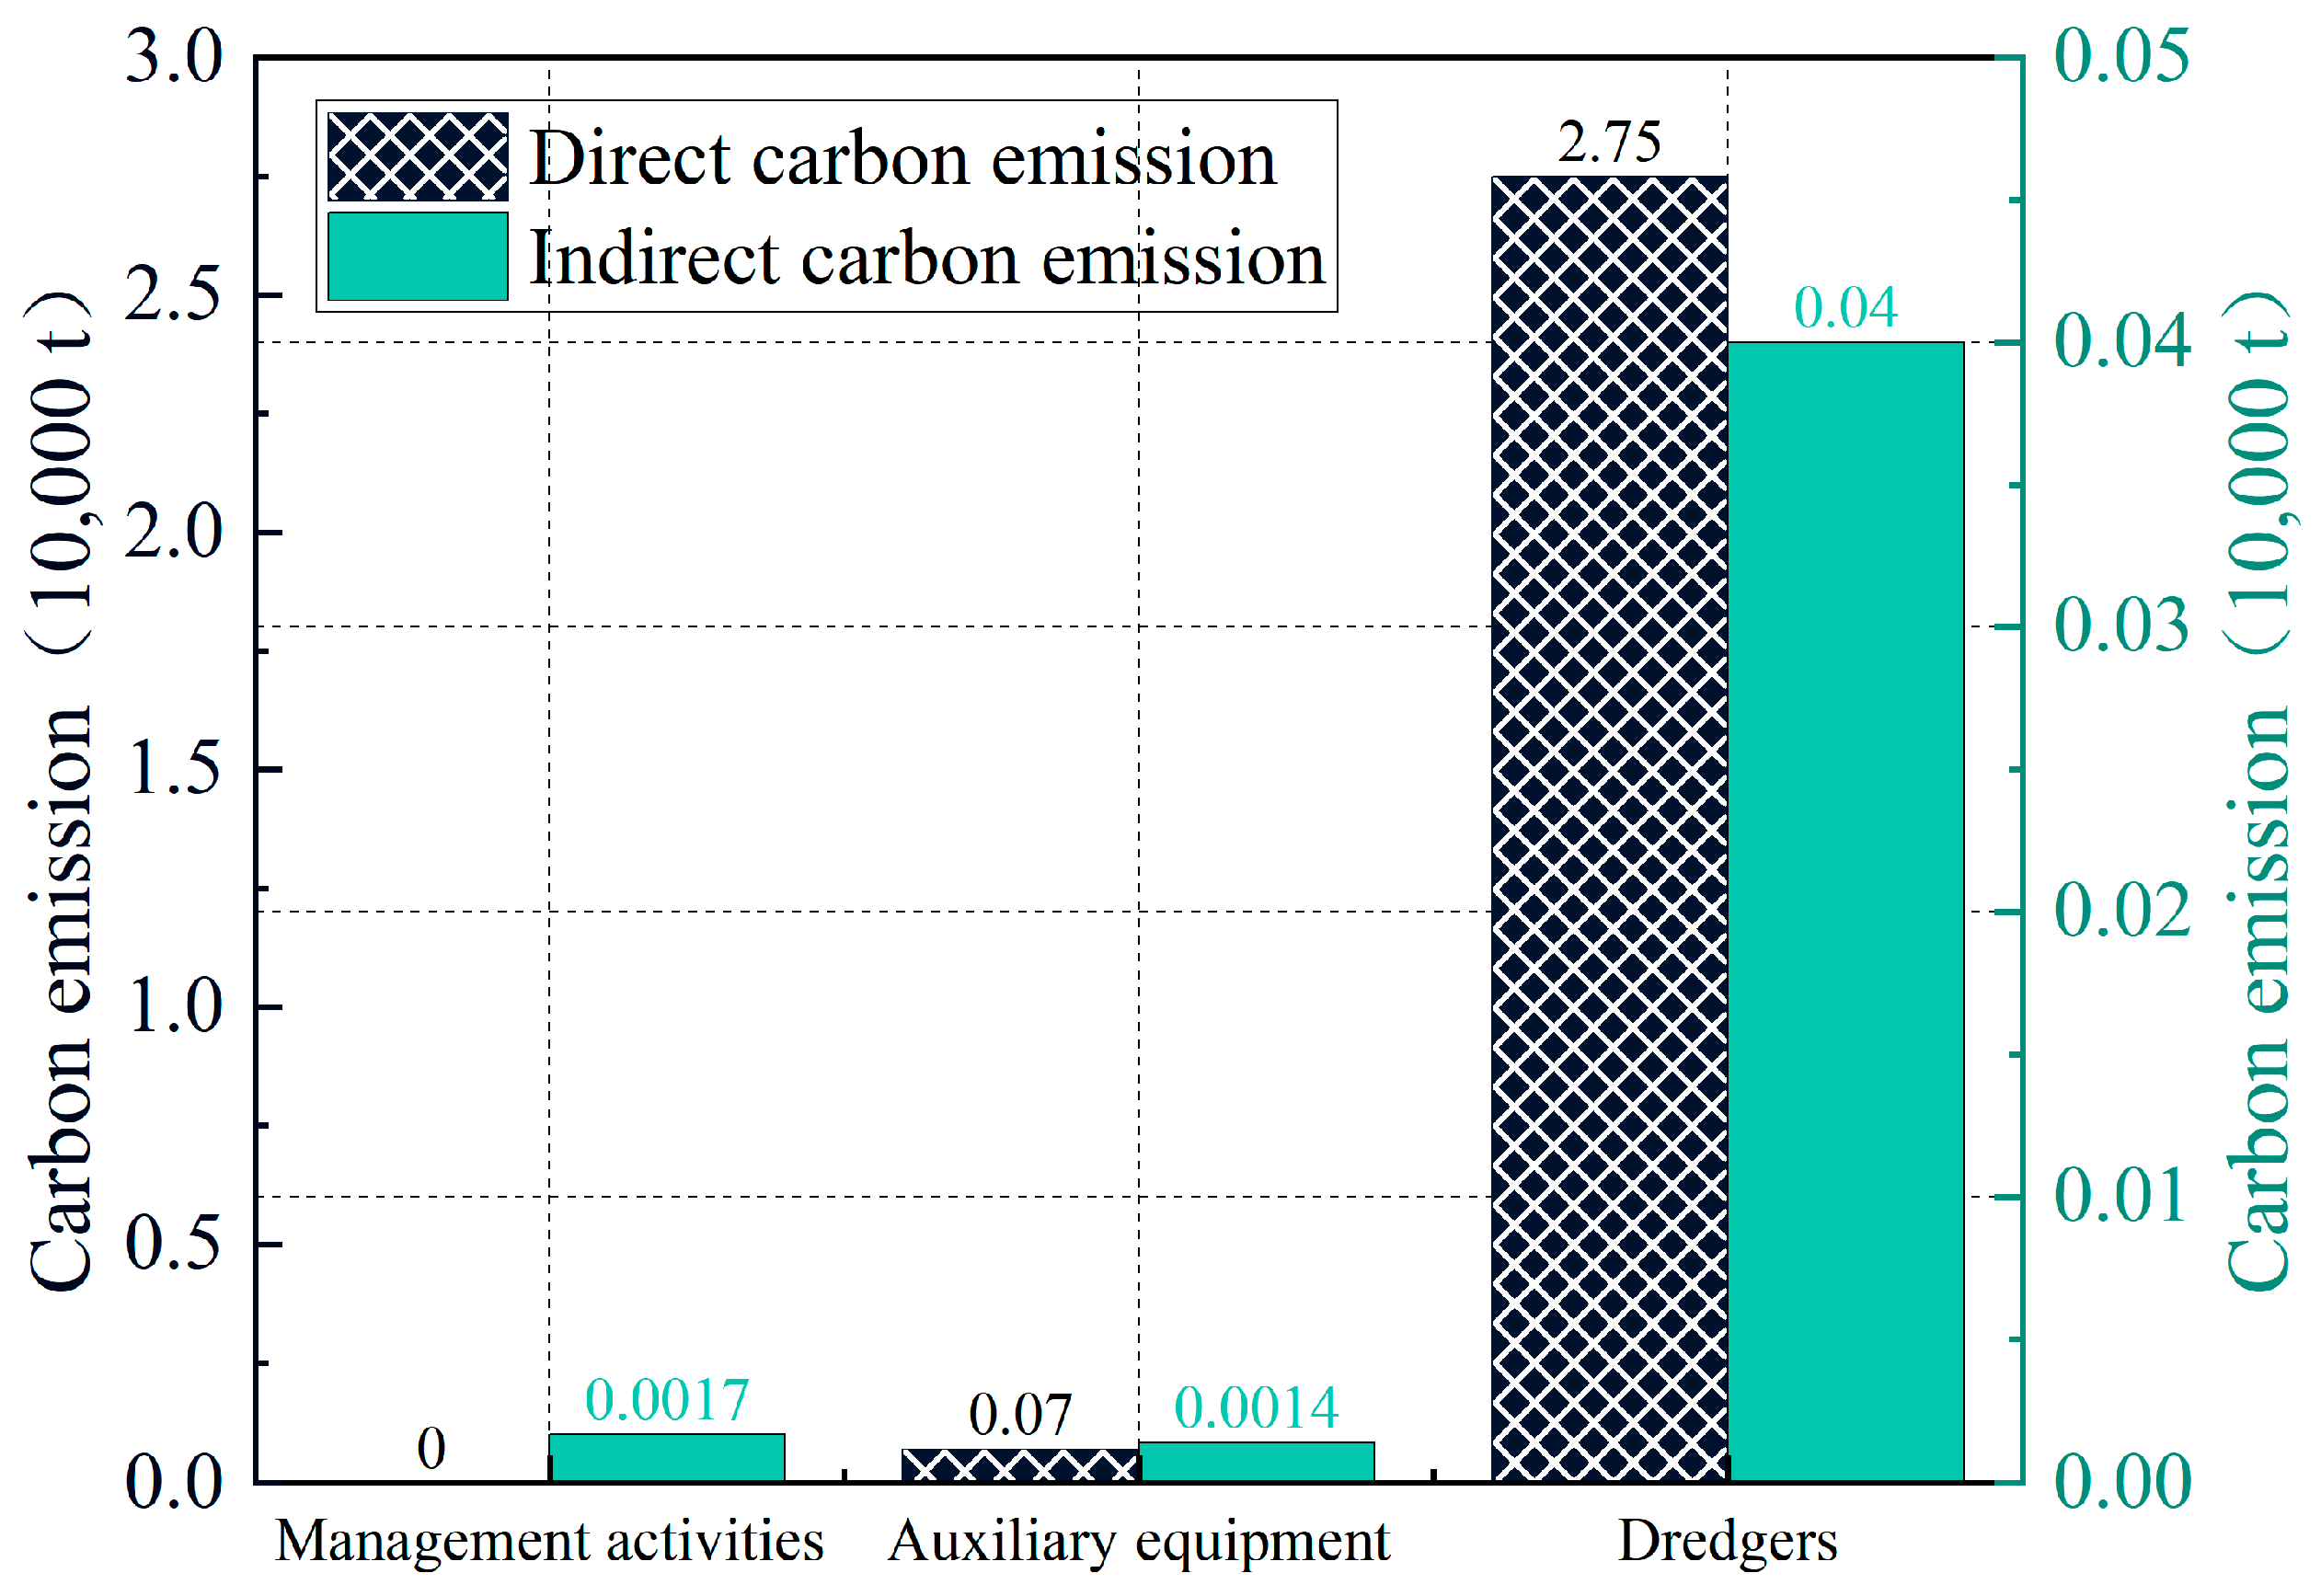
4.3.2. Malé Project
- (1)
- Calculation results of carbon emissions during construction period.
- (2)
- Actual emission verification.
4.3.3. Guangzhou Project
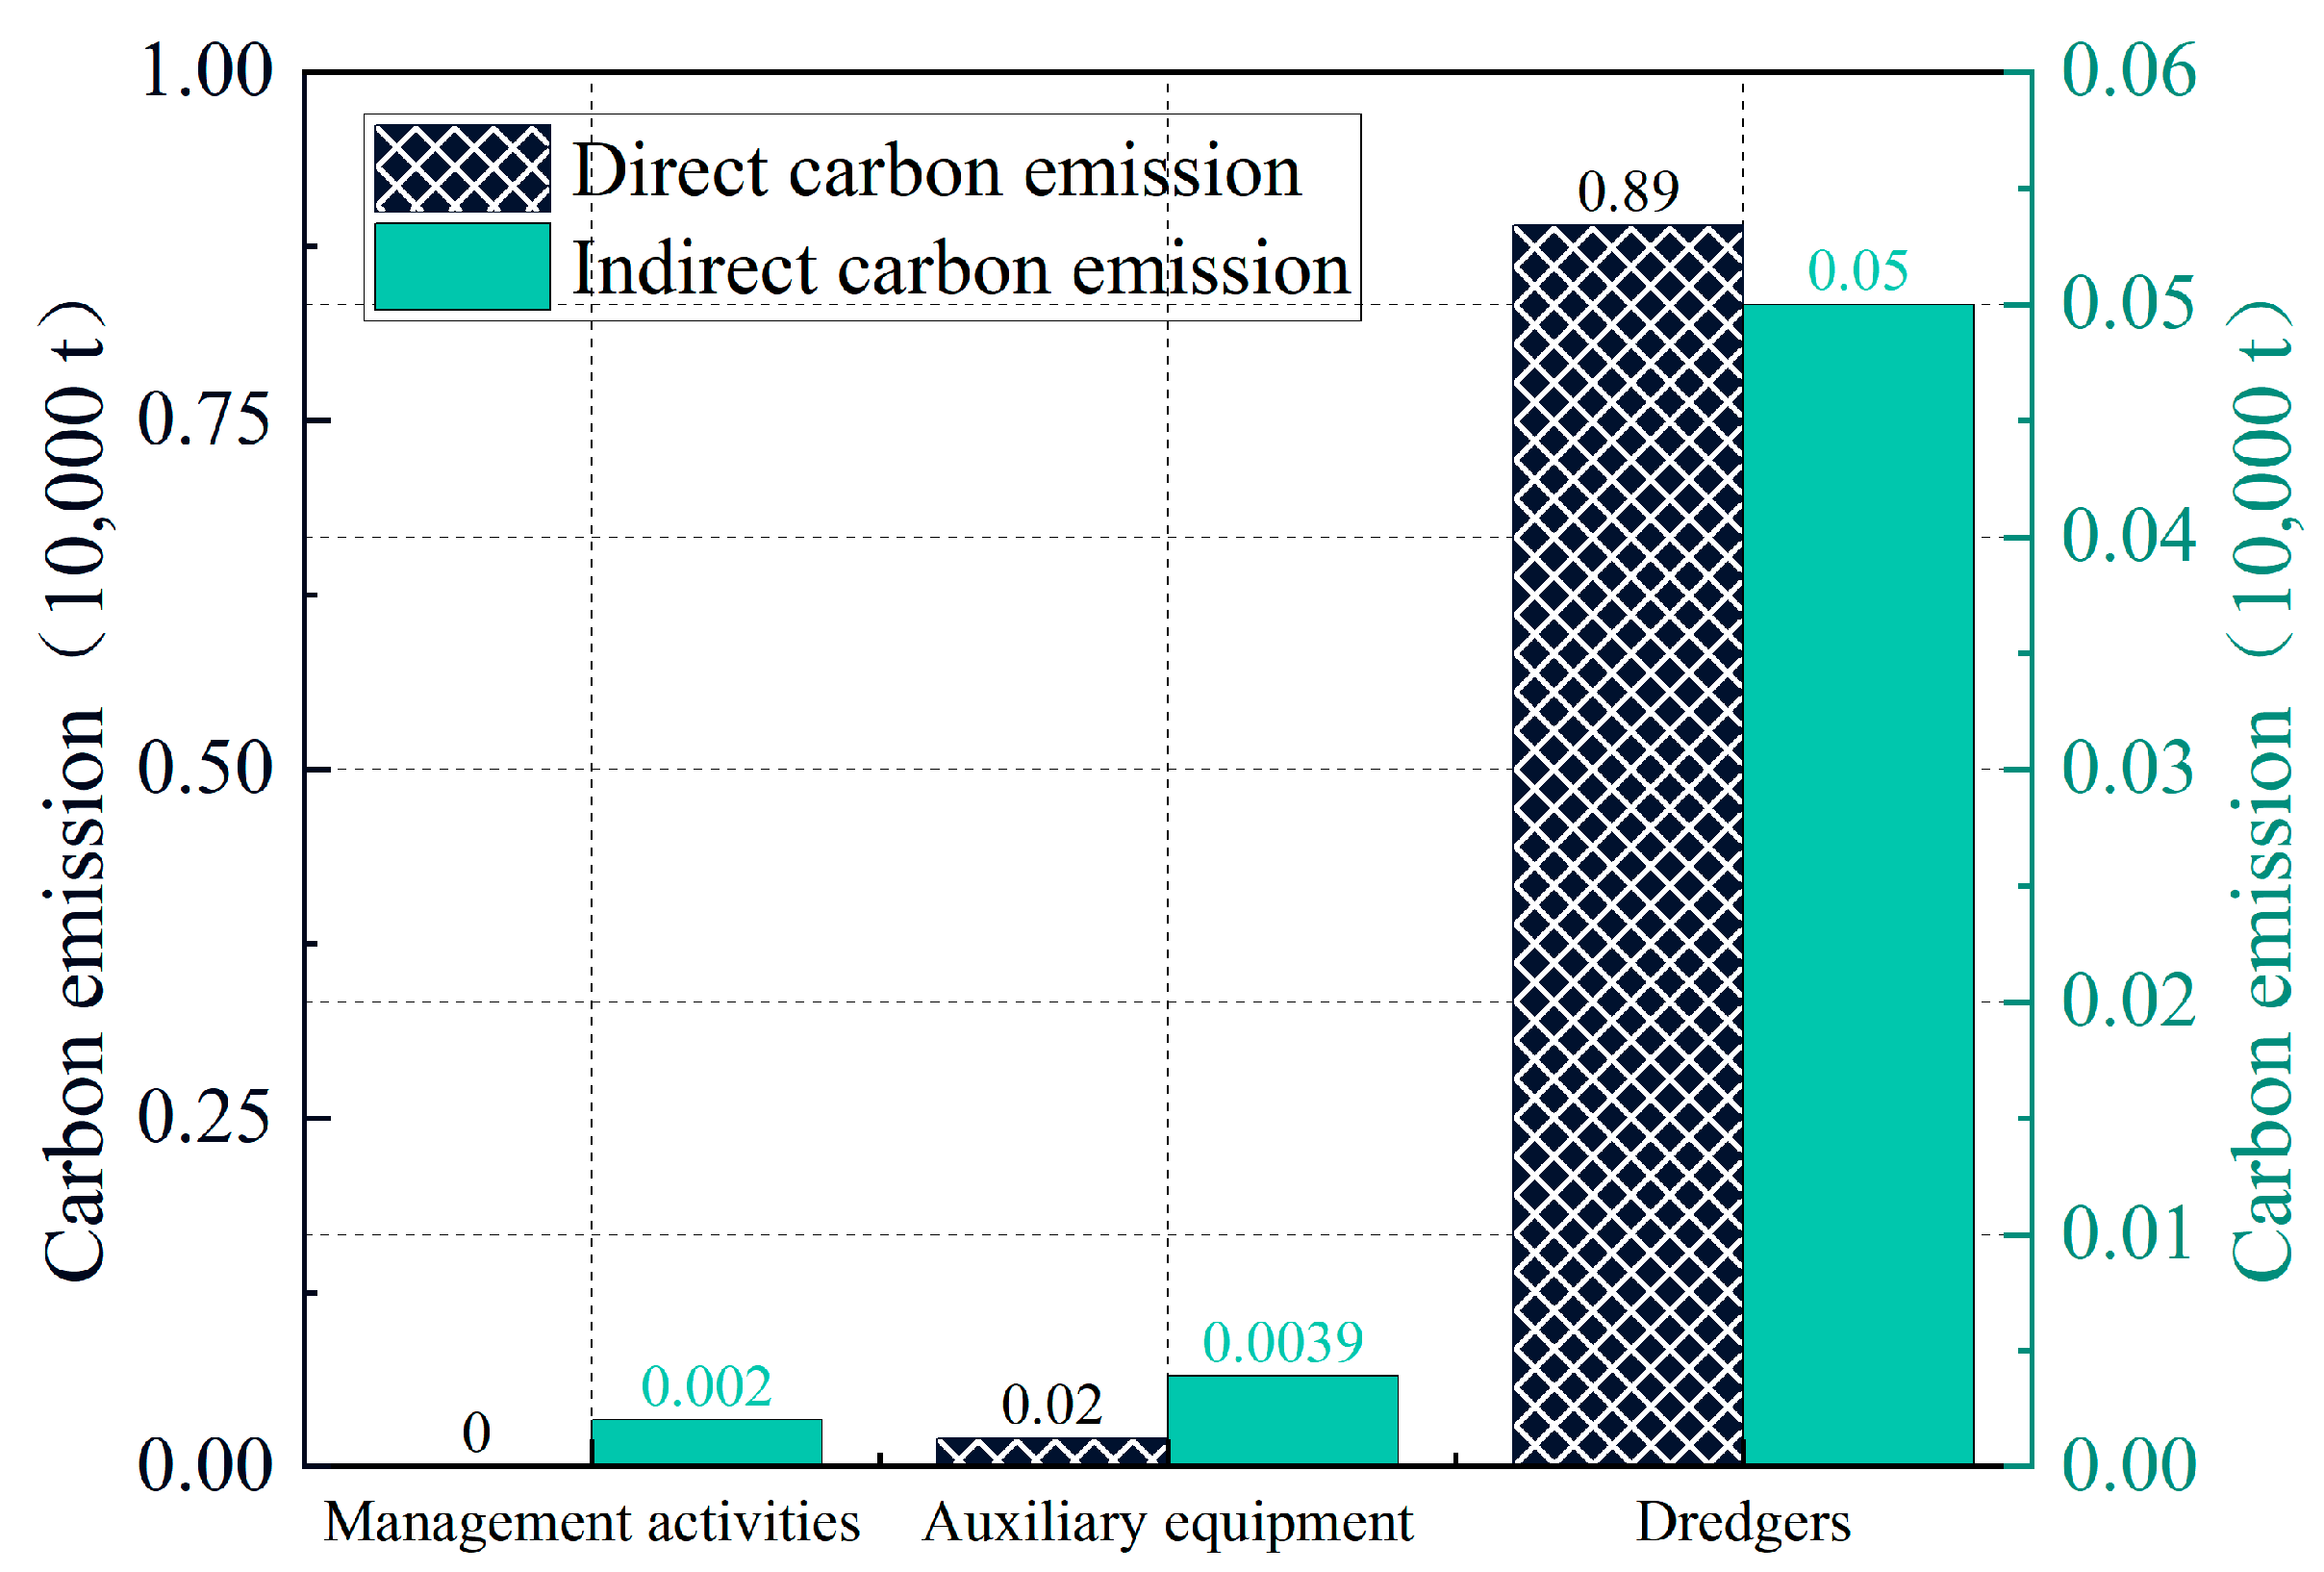
- (1)
- Calculation results of carbon emissions during construction period.
- (2)
- Actual emission verification.
4.4. The Result Calculated by Quotas
4.5. Validation of Actual Emissions
5. Conclusions
- (1)
- The results of this study show that different types of dredging vessels emit varying amounts of carbon dioxide during the construction period even when operating under the same dredging soil types and working conditions.
- (2)
- The carbon dioxide emissions of the same dredging vessel exhibit significant variations when operating across different geotechnical soil types and working conditions.
- (3)
- The carbon emission quotas for self-propelled dredgers during the construction period are significantly higher than those for non-self-propelled dredgers. For self-propelled dredgers, carbon emissions increase with larger cabin capacities, while for towing vessels, emissions increase with the power rating of the tugboats.
- (4)
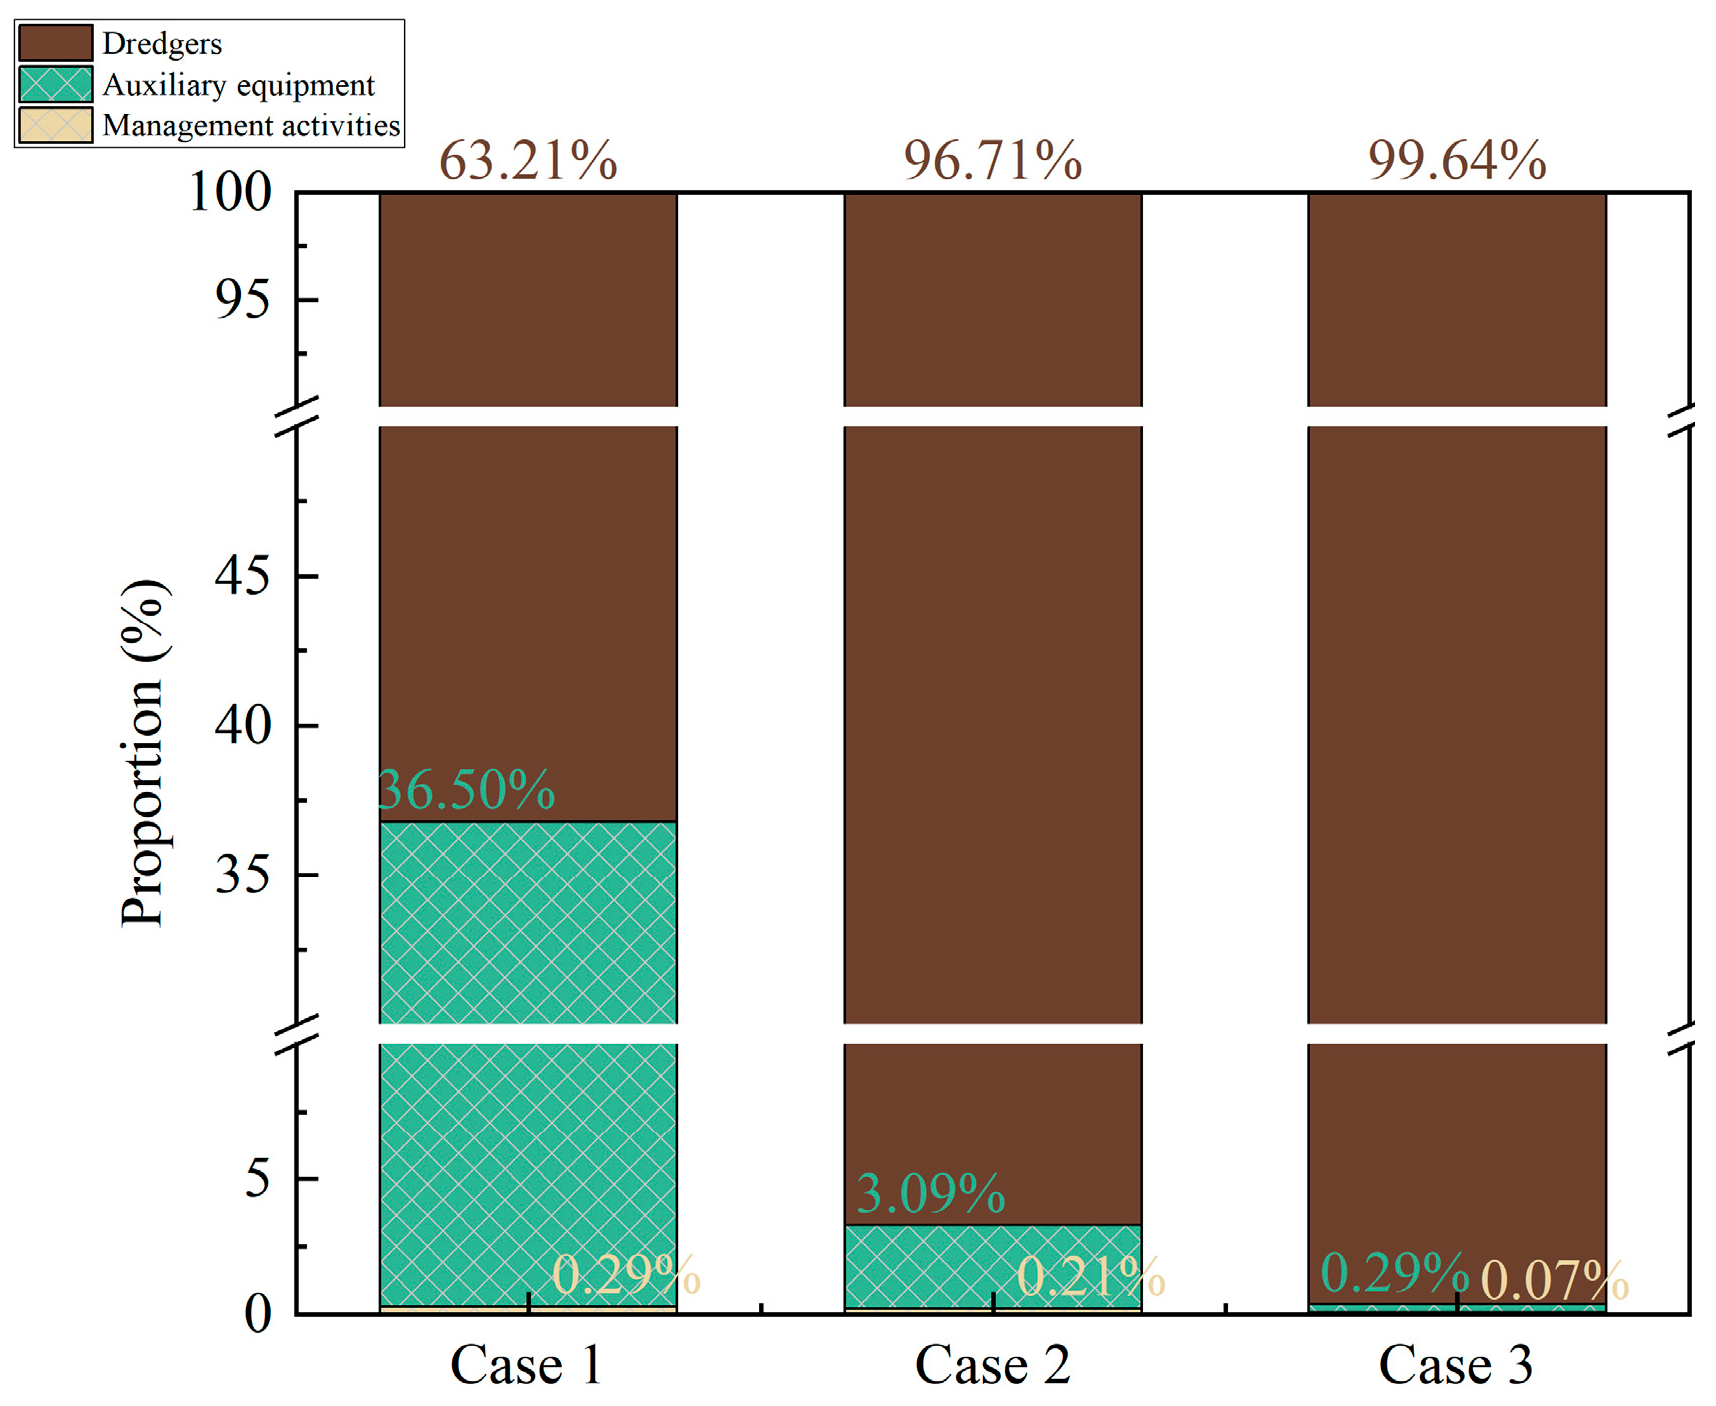
- Dredging construction activities generate substantial carbon emissions, which are predominantly direct emissions resulting from fuel combustion during production activities. Unlike housing and municipal engineering projects where material production and transportation dominate carbon emissions, direct emissions account for approximately 97% of total emissions during dredging construction, while indirect emissions from equipment deployment and management activities account for about 3%. The emissions from electricity consumption during management activities represent only a minor portion, approximately 0.3%.
- (5)
- The carbon emissions during the construction period of dredging projects primarily originate from fuel consumption of construction activities. Construction enterprises should strengthen the planning, management, and control of vessel operations during the construction phase. Prior to construction, comprehensive analysis of project conditions and soil characteristics should be conducted to facilitate reasonable equipment configuration and selection. Construction schemes and equipment combinations with optimal schedules, lower costs, and minimized carbon emissions should be adopted based on multi-scheme comparisons. During construction, vessel idling and standby periods should be strictly controlled, vessel utilization should be maximized, and overall operational efficiency should be improved to reduce unnecessary fuel consumption and associated emissions.
- (6)
- Based on the established quota system and analysis results, several practical emission reduction strategies are further proposed to guide carbon management in dredging projects. These include (i) optimizing equipment configuration and scheduling based on project-specific geotechnical and operational conditions; (ii) adopting advanced energy-efficient dredging equipment and low-emission engines to enhance fuel utilization; (iii) minimizing over-excavation and unnecessary dredging distances through strict control of workloads; and (iv) implementing intelligent construction management systems for real-time monitoring and dynamic scheduling of vessel operations. These measures can provide valuable technical references for achieving both effective project execution and carbon reduction targets.
Author Contributions
Funding
Data Availability Statement
Conflicts of Interest
References
- China Association of Building Energy Efficiency. 2022 Research Report of China on Buildings Energy Consumption and Carbon Emissions; China Association of Building Energy Efficiency: Beijing, China, 2023. [Google Scholar]
- Fang, Y.; Lu, X.; Li, H. A random forest-based model for the prediction of construction-stage carbon emissions at the early design stag. J. Clean. Prod. 2021, 328, 12965. [Google Scholar] [CrossRef]
- Jiang, B.; Li, H.; Dong, L.; Wang, Y.; Tao, Y. Cradle-to-site carbon emissions assessment of prefabricated rebar cages for high-rise buildings in China. J. Sustain. 2018, 11, 42. [Google Scholar] [CrossRef]
- Wang, X.; Duan, Z.; Wu, L.; Yang, L. Estimation of carbon dioxide emission in highway construction: A case study in southwest region of China. J. Clean. Prod. 2015, 103, 705–714. [Google Scholar] [CrossRef]
- Teng, Y.; Li, K.; Pan, W. Reducing building life cycle carbon emissions through prefabrication: Evidence from and gaps in empirical studies. J. Build. Environ. 2018, 132, 125–136. [Google Scholar] [CrossRef]
- Li, L.; Chen, K. Quantitative assessment of carbon dioxide emissions in construction projects: A case study in Shenzhen. J. Clean. Prod. 2017, 141, 394–408. [Google Scholar] [CrossRef]
- Bonamente, E.; Cotana, F. Carbon and energy footprints of prefabricated industrial buildings: A systematic life cycle assessment analysis. Energies 2015, 8, 12685–12701. [Google Scholar] [CrossRef]
- Sandanayake, M.; Zhang, G.; Setunge, S. Environmental emissions at foundation construction stage of buildings–Two case studies. J. Build. Environ. 2016, 95, 189–198. [Google Scholar] [CrossRef]
- Tumminia, G.; Guarino, F.; Longo, S.; Marco, F.; Maurizio, C.; Vincenzo, A. Life cycle energy performances and environmental impacts of a prefabricated building module. J. Renew. Sustain. Energy Rev. 2018, 92, 272–283. [Google Scholar] [CrossRef]
- Kim, S.W.; Eom, J.O. Ship carbon intensity indicator assessment via just-in-time arrival algorithm based on real-time data: Case study of Pusan New International Port. Sustainability 2023, 15, 13875. [Google Scholar] [CrossRef]
- Castellano, J.; Castellano, D.; Ribera, A.; Ciurana, J. Developing a simplified methodology to calculate CO2/m2 emissions per year in the use phase of newly-built, single-family houses. Energy Build. 2015, 109, 90–107. [Google Scholar] [CrossRef]
- Jun, H.; Lim, N.; Kim, M. BIM-based carbon dioxide emission quantity assessment method in Korea. J. Asian Archit. Build. Eng. 2015, 14, 569–576. [Google Scholar] [CrossRef]
- Cho, S.H.; Chae, C.U. A study on life cycle CO2 emissions of low-carbon buildings in South Korea. Sustainability 2016, 8, 579. [Google Scholar] [CrossRef]
- Wang, K.; Gu, L.; Lu, C.; Cao, Y.; Wang, Y.; Ren, J. Reconstruction of the carbon emission allowance measurement system of ‘pricing method’. J. Eng. Manag. 2023, 37, 42–47. [Google Scholar]
- Zhang, C.; Yang, Y.; Wang, N. Port governance and sustainable development: The impact of port smartization on port carbon emission efficiency. Ocean Coast. Manag. 2024, 259, 107485. [Google Scholar] [CrossRef]
- Li, Z.; Huang, H.; Zhang, J. Research on carbon emission measurement and quota in building construction stage. J. Brick Tile 2023, 8, 99–101. [Google Scholar]
- Chen, J. An example of carbon emission quota preparation for shield construction. J. Constr. Technol. Dev. 2017, 44, 142–143. [Google Scholar]
- China Ministry of Housing and Urban-Rural Development. Building Carbon Emission Calculation Standard; S. China Construction Industry Press: Beijing, China, 2019. [Google Scholar]
- Standardization Administration of China. General Rules for Calculation of Comprehensive Energy Consumption; S. China Standard Press: Beijing, China, 2008. [Google Scholar]
- China Ministry of Ecology and Environment. Greenhouse Gas Emission Accounting Methodology and Reporting Guidelines for Enterprises Power Generation Facilities (2022 Revision); R. Ministry of Ecology and Environment: Beijing, China, 2022. [Google Scholar]
- China Ministry of Ecology and Environment. Notice on the Work Related to the Management of Greenhouse Gas Emission Reporting for Enterprises in the Power Generation Sector in 2023-2025; R. Ministry of Ecology and Environment: Beijing, China, 2022. [Google Scholar]
- China Water Transportation Engineering Cost Quota Center. Budget Quota for Dredging Project; S. People’s Transportation Press: Beijing, China, 2019. [Google Scholar]
- China’s Ministry of Transport. Cost Quota of Ship Work-Shift for Dredging Project; S. People’s Transportation Press: Beijing, China, 2019. [Google Scholar]


| SN. | Quota Project Table Name | Quota Number | Ship Type and Specification | Dredged Soil and Rock Classification | Working Condition | Quota Project Quantity | Carbon Emission Benchmark | Over-Excavation Depth Benchmark | Excess Haul Distance Benchmark | Additional Turning Head Benchmark | Bow Blowing Benchmark | Bow Jet Benchmark | Deployment Method | Deployment Mileage | Startup Deployment and Completion Integration |
|---|---|---|---|---|---|---|---|---|---|---|---|---|---|---|---|
| 1 | Carbon Emission Quota for Trailing Suction Hopper Dredger (TSHD) Construction | √ | √ | √ | √ | √ | √ | √ | √ | √ | √ | √ | |||
| 2 | Carbon Emission Quota for Cutter Suction Dredger (CSD) Construction | √ | √ | √ | √ | √ | √ | √ | √ | ||||||
| 3 | Carbon Emission Quota for Clamshell Dredger Construction | √ | √ | √ | √ | √ | √ | √ | √ | ||||||
| 4 | Carbon Emission Quota for Bucket Dredger Construction | √ | √ | √ | √ | √ | √ | √ | √ | ||||||
| 5 | Carbon Emission Quota for Blow Dredger Construction | √ | √ | √ | √ | √ | √ | √ | √ | ||||||
| 6 | Carbon Emission Quota for Dredger Deployment | √ | √ | √ | √ | √ | √ | ||||||||
| 7 | Carbon Emission Quota for Dredger Startup Deployment and Completion Integration | √ | √ | √ | √ | √ | √ | ||||||||
| 8 | Carbon Emission Quota for Shipbuilding | ||||||||||||||
| 9 | Carbon Emission Quota for Management Activities |
| SN. | Appendix Table Name | Ship Type and Specification | Machine Shift | Working Condition | Carbon Emission Factor per Machine Shift | Carbon Emission Factor for Idle Machine Shift | Working Condition Elevation Adjustment | Carbon Emission Factor Adjustment Value |
|---|---|---|---|---|---|---|---|---|
| 1 | Carbon Emission Factor for Construction Vessels | √ | √ | √ | √ | √ | ||
| 2 | Adjustment Value for Carbon Emission Factor of Construction Vessels | √ | √ | √ | √ | √ |
| Quota Number | Geotechnical Classification | Basic Quota | Over-Excavation Depth Quota | Excess Haul Distance Quota | Additional Turning Head Quota | Additional Bow Blowing Quota | Additional Bow Jet Quota |
|---|---|---|---|---|---|---|---|
| 10001 | 1 | 0.715 | 0.014 | 0.111 | 0.103 | 0.863 | — |
| 10002 | 2 | 0.894 | 0.018 | 0.111 | 0.103 | 1.205 | — |
| 10003 | 3 | 1.026 | 0.021 | 0.111 | 0.103 | — | — |
| 10004 | 4 | 1.199 | 0.024 | 0.116 | 0.107 | — | — |
| 10005 | 5 | 1.323 | 0.026 | 0.116 | 0.107 | 1.085 | — |
| 10006 | 6 | 0.859 | 0.017 | 0.1 | 0.092 | 1.162 | 0.623 |
| 10007 | 7 | 1.02 | 0.02 | 0.1 | 0.092 | 1.238 | 0.7 |
| 10008 | 8 | 1.289 | 0.026 | 0.1 | 0.092 | 1.462 | 0.777 |
| 10009 | 9 | 1.493 | 0.03 | 0.111 | 0.103 | 1.547 | — |
| 10010 | 10 | 1.552 | 0.031 | 0.111 | 0.103 | — |
| Quota Number | Dredged Soil and Rock Classification | Quota Project Quantity (10,000 m3) | Fuel Consumption (kg) | |||||
|---|---|---|---|---|---|---|---|---|
| Benchmark | Over-Excavation Depth | Excess Haul Distance | Additional Turning Head | Additional Bow Blowing | Additional Bow Jet | |||
| PX100001 | 1 | 1 | 4681.11 | 91.66 | 726.72 | 674.34 | 5650.06 | |
| PX100002 | 2 | 1 | 5853.02 | 117.85 | 726.72 | 674.34 | 7889.14 | |
| PX100003 | 3 | 1 | 6717.22 | 137.49 | 726.72 | 674.34 | ||
| PX100004 | 4 | 1 | 7849.85 | 157.13 | 759.45 | 700.53 | ||
| PX100005 | 5 | 1 | 8661.68 | 170.22 | 759.45 | 700.53 | 7103.50 | |
| PX100006 | 6 | 1 | 5623.87 | 111.30 | 654.70 | 602.32 | 7607.61 | 4078.78 |
| PX100007 | 7 | 1 | 6677.94 | 130.94 | 654.70 | 602.32 | 8105.19 | 4582.90 |
| PX100008 | 8 | 1 | 8439.08 | 170.22 | 654.70 | 602.32 | 9571.71 | 5087.02 |
| PX100009 | 9 | 1 | 9774.67 | 196.41 | 726.72 | 674.34 | 10,128.21 | |
| PX100010 | 10 | 1 | 10,160.94 | 202.96 | 726.72 | 674.34 | ||
| Quota Number | Dredged Soil and Rock Classification | Quota Project Quantity (10,000 m3) | Benchmark (kg CO2) | |||||
|---|---|---|---|---|---|---|---|---|
| Carbon Emission | Over-Excavation Depth (kg CO2) | Excess Haul Distance (kg CO2) | Additional Turning Head (kg CO2) | Additional Bow Blowing (kg CO2) | Additional Bow Jet (kg CO2) | |||
| PX100001 | 1 | 1 | 14,510.30 | 284.12 | 2252.65 | 2090.30 | 17,513.83 | |
| PX100002 | 2 | 1 | 18,142.95 | 365.29 | 2252.65 | 2090.30 | 24,454.43 | |
| PX100003 | 3 | 1 | 20,821.78 | 426.18 | 2252.65 | 2090.30 | ||
| PX100004 | 4 | 1 | 24,332.66 | 487.06 | 2354.12 | 2171.47 | ||
| PX100005 | 5 | 1 | 26,849.13 | 527.65 | 2354.12 | 2171.47 | 22,019.13 | |
| PX100006 | 6 | 1 | 17,432.66 | 345.00 | 2029.41 | 1867.06 | 23,581.78 | 12,643.24 |
| PX100007 | 7 | 1 | 20,700.01 | 405.88 | 2029.41 | 1867.06 | 25,124.13 | 14,205.89 |
| PX100008 | 8 | 1 | 26,159.13 | 527.65 | 2029.41 | 1867.06 | 29,670.02 | 15,768.54 |
| PX100009 | 9 | 1 | 30,299.13 | 608.82 | 2252.65 | 2090.30 | 31,395.02 | |
| PX100010 | 10 | 1 | 31,496.49 | 629.12 | 2252.65 | 2090.30 | ||
| SN | Quota Number | Ship Type and Specification | Machine Shift | Working Condition | Carbon Emission Factor per Machine Shift (kg CO2) | Carbon Emission Factor for Idle Machine Shift (kg CO2) |
|---|---|---|---|---|---|---|
| 1 | PX201001 | 5000 m3 | 1 | IV | 20,294.13 | 2029.41 |
| 2 | PX201002 | 10,000 m3 | 1 | IV | 40,768.04 | 4076.80 |
| 3 | PX201003 | 12,000 m3 | 1 | IV | 45,736.96 | 4573.70 |
| 4 | PX201004 | 13,000 m3 | 1 | IV | 48,222.97 | 4822.30 |
| SN | Quota Number | Ship Type and Specification | Sub-Item | Quota Project Quantity | Carbon Emission Benchmark (kg CO2) |
|---|---|---|---|---|---|
| 1 | PXQT1001 | 5000 m3 | Preparation | 1 time | 60,882.39 |
| 2 | PXQT1002 | 5000 m3 | Finishing | 1 time | 60,882.39 |
| 3 | PXQT1003 | 10,000 m3 | Preparation | 1 time | 122,304.13 |
| 4 | PXQT1004 | 10,000 m3 | Finishing | 1 time | 122,304.13 |
| 5 | PXQT1005 | 12,000 m3 | Preparation | 1 time | 137,210.88 |
| 6 | PXQT1006 | 12,000 m3 | Finishing | 1 time | 137,210.88 |
| 7 | PXQT1007 | 13,000 m3 | Preparation | 1 time | 144,668.90 |
| 8 | PXQT1008 | 13,000 m3 | Finishing | 1 time | 144,668.90 |
| SN | Quota Number | Ship Type and Specification | Machine Shift | Working Condition | Carbon Emission Factor per Machine Shift (kg CO2) | Carbon Emission Factor for Idle Machine Shift (kg CO2) |
|---|---|---|---|---|---|---|
| 1 | TL201001 | 200 kW | 1 | IV | 973.32 | 97.33 |
| 2 | TL201002 | 440 kW | 1 | IV | 2138.83 | 213.88 |
| 3 | TL201003 | 970 kW | 1 | IV | 4714.73 | 471.47 |
| 4 | TL201004 | 1440 kW | 1 | IV | 6999.26 | 699.93 |
| 5 | TL201005 | 1940 kW | 1 | IV | 9429.47 | 942.95 |
| 6 | TL201006 | 2940 kW | 1 | IV | 14,289.89 | 1428.99 |
| 7 | TL201007 | 3860 kW | 1 | IV | 18,762.85 | 1876.28 |
| 8 | TL201008 | 5380 kW | 1 | IV | 26,149.58 | 2614.96 |
| SN | Quota Number | Ship Type and Specification | Machine Shift | Working Condition | Working Condition Elevation Adjustment | Carbon Emission Factor Adjustment Value (kg CO2) |
|---|---|---|---|---|---|---|
| 1 | PX201001 | 5000 m3 | 1 | IV | increasing in level I–III and decreasing in level V–VII | 1456.89 |
| 2 | PX201002 | 10,000 m3 | 1 | IV | increasing in level I–III and decreasing in level V–VII | 2678.19 |
| 3 | PX201003 | 15,000 m3 | 1 | IV | increasing in level I–III and decreasing in level V–VII | 3003.67 |
| 4 | PX201004 | 20,000 m3 | 1 | IV | increasing in level I–III and decreasing in level V–VII | 3167.95 |
| SN | Quota Number | Ship Type and Specification | Deployment Method | Round-Trip Deployment Mileage | Carbon Emission Factor Adjustment Value (kg CO2) |
|---|---|---|---|---|---|
| 1 | PXDQ1001 | 5000 m3 | Self-propelled | 100 nautical miles | 73,515.40 |
| 2 | PXDQ1002 | 10,000 m3 | Self-propelled | 100 nautical miles | 99,212.16 |
| 3 | PXDQ1003 | 12,000 m3 | Self-propelled | 100 nautical miles | 105,257.90 |
| 4 | PXDQ1004 | 13,000 m3 | Self-propelled | 100 nautical miles | 111,303.64 |
| SN | Quota Number | Electricity Consumption (MWh) | Carbon Emission Factor (tCO2/MWh) | Carbon Emission Quota (kg CO2) |
|---|---|---|---|---|
| 1 | GL00001 | 100 | 0.581 | 58,100.00 |
| SN | Ships Type | Shenzhen Project | Malé Project | Guangzhou Project | |||
|---|---|---|---|---|---|---|---|
| Quantity | Self-Owned | Quantity | Self-Owned | Quantity | Self-Owned | ||
| 1 | Trailing Suction Hopper Dredger | 7 | 6 | 1 | 1 | 3 | 3 |
| 2 | Cutter Suction Dredger | 1 | 1 | ||||
| 3 | Clamshell Dredger | 44 | 2 | ||||
| 4 | Mud Barge | 149 | |||||
| 5 | Tugboat | 1 | 1 | 1 | 1 | ||
| 6 | Anchor Boat | 6 | 1 | 1 | |||
| 7 | Transportation Vessels | 2 | |||||
| Total | 210 | 11 | 2 | 1 | 4 | 4 | |
| SN | Item | Direct Carbon Emissions (10,000 t CO2) | Indirect Carbon Emissions (10,000 t CO2) | Total Carbon Emissions (10,000 t CO2) | Proportion |
|---|---|---|---|---|---|
| 1 | Dredging Vessels | 27.49 | 0.35 | 27.85 | 63.21% |
| 2 | Auxiliary Equipment | 15.84 | 0.24 | 16.08 | 36.50% |
| 3 | Management Activities | / | 0.13 | 0.13 | 0.29% |
| Total | 43.33 | 0.72 | 44.05 | ||
| Proportion | 98.37% | 1.63% | |||
| SN | Ships Type | Fuel Combustion Carbon Emissions (t CO2) | Quota-Based Direct Carbon Emission Calculation (t CO2) | Difference Value | Difference Percentage |
|---|---|---|---|---|---|
| 1 | Suction hopper | 182,598.35 | 182,983.22 | −384.87 | −0.21% |
| 2 | Cutter suction hopper | 14,379.84 | 14,625.55 | −245.71 | −1.68% |
| 3 | Grab dredgers | 20,188.97 | 21,196.99 | −1008.02 | −4.76% |
| 4 | Tugboats | 1719.44 | 1733.37 | −13.94 | −0.80% |
| Total | 218,886.59 | 220,539.13 | −1652.53 | −0.75% | |
| SN | Item | Direct Carbon Emissions (10,000 t CO2) | Indirect Carbon Emissions (10,000 t CO2) | Total Carbon Emissions (10,000 t CO2) | Proportion |
|---|---|---|---|---|---|
| 1 | Dredging Vessels | 2.75 | 0.037 | 2.78 | 97.31% |
| 2 | Auxiliary Equipment | 0.07 | 0.0014 | 0.0752 | 2.63% |
| 3 | Management Activities | 0.0017 | 0.0017 | 0.06% | |
| Total | 2.82 | 0.04 | 2.86 | ||
| Proportion | 98.61% | 1.39% | |||
| SN | Ships Type | Fuel Combustion Carbon Emissions (t CO2) | Quota-Based Direct Carbon Emission Calculation (t CO2) | Difference Value | Difference Percentage |
|---|---|---|---|---|---|
| 1 | Trailing Suction Hopper Dredger | 26,130.98 | 27,471.13 | −1340.15 | −4.88% |
| 2 | Anchor Boat | 695.46 | 737.80 | −42.34 | −5.74% |
| Total | 26,826.44 | 28,208.93 | −1382.49 | −4.90% | |
| SN | Item | Direct Carbon Emissions (10,000 t CO2) | Indirect Carbon Emissions (10,000 t CO2) | Total Carbon Emissions (10,000 t CO2) | Proportion |
|---|---|---|---|---|---|
| 1 | Dredging Vessels | 0.89 | 0.05 | 0.94 | 96.97% |
| 2 | Auxiliary Equipment | 0.02 | 0.004 | 0.03 | 2.83% |
| 3 | Management Activities | 0.002 | 0.002 | 0.19% | |
| Total | 0.91 | 0.06 | 0.97 | ||
| Proportion | 93.82% | 6.18% | |||
| SN | Ships Type | Fuel Combustion Carbon Emissions (t CO2) | Quota-Based Direct Carbon Emission Calculation (t CO2) | Difference Value | Difference Percentage |
|---|---|---|---|---|---|
| 1 | Trailing Suction Hopper Dredger | 8566.06 | 8897.63 | −331.57 | −3.73% |
| 2 | Anchor Boat | 234.59 | 236.49 | −1.90 | −0.80% |
| Total | 8800.65 | 9134.12 | −333.47 | −3.65% | |
| SN | Project Title | Direct Carbon Emissions (10,000 t CO2) | Indirect Carbon Emissions (10,000 t CO2) | Total Carbon Emissions (10,000 t CO2) |
|---|---|---|---|---|
| 1 | Shenzhen | 433.3 | 07.2 | 440.5 |
| 2 | Malé | 28.2 | 00.4 | 28.6 |
| 3 | Guangzhou | 9.1 | 00.6 | 9.7 |
| Total | 470.7 | 08.2 | 478.9 | |
| SN | Project | Soil Type | Maximum Transport Distance | Carbon Emissions per 10,000 m3 of Project Volume (t CO2) | Monthly Average Carbon Emissions (t CO2) | ||||
|---|---|---|---|---|---|---|---|---|---|
| Direct Emissions | Indirect Emissions | Total | Direct Emissions | Indirect Emissions | Total | ||||
| 1 | Shenzhen | 1, 3, 6, 11, 12 | 110 km | 120.47 | 2.00 | 122.47 | 7222.29 | 119.76 | 7342.05 |
| 2 | Malé | 6, 7 | 10 km | 55.10 | 0.78 | 55.88 | 4029.85 | 56.94 | 4086.79 |
| 3 | Guangzhou | 1, 6 | 91 km | 40.89 | 2.57 | 43.46 | 3044.71 | 200.68 | 3245.39 |
| Average | 72.15 | 1.78 | 73.94 | 4765.62 | 125.79 | 4891.41 | |||
| Sn | Project | Number of Owned Vessels | Fuel Combustion Carbon Emissions (t CO2) | Quota-Based Direct Carbon Emission Calculation (t CO2) | Difference | Difference Percentage |
|---|---|---|---|---|---|---|
| 1 | Shenzhen | 10 | 218,886.59 | 220,539.13 | −1652.53 | −0.75% |
| 2 | Malé | 2 | 26,826.44 | 28,208.93 | −1382.49 | −4.90% |
| 3 | Guangzhou Port | 4 | 8800.65 | 9134.12 | −333.47 | −3.65% |
| Total | 16.00 | 254,513.69 | 257,882.17 | −3368.49 | −1.32% | |
Disclaimer/Publisher’s Note: The statements, opinions and data contained in all publications are solely those of the individual author(s) and contributor(s) and not of MDPI and/or the editor(s). MDPI and/or the editor(s) disclaim responsibility for any injury to people or property resulting from any ideas, methods, instructions or products referred to in the content. |
© 2025 by the authors. Licensee MDPI, Basel, Switzerland. This article is an open access article distributed under the terms and conditions of the Creative Commons Attribution (CC BY) license (https://creativecommons.org/licenses/by/4.0/).
Share and Cite
Liang, S.; Chen, W.; Li, L.; Liu, F. A Study of Carbon Emission Quota for Construction Period of Dredging Projects: Case Studies in Guangzhou, Shenzhen, and Malé. Buildings 2025, 15, 2293. https://doi.org/10.3390/buildings15132293
Liang S, Chen W, Li L, Liu F. A Study of Carbon Emission Quota for Construction Period of Dredging Projects: Case Studies in Guangzhou, Shenzhen, and Malé. Buildings. 2025; 15(13):2293. https://doi.org/10.3390/buildings15132293
Chicago/Turabian StyleLiang, Siming, Wei Chen, Lijuan Li, and Feng Liu. 2025. "A Study of Carbon Emission Quota for Construction Period of Dredging Projects: Case Studies in Guangzhou, Shenzhen, and Malé" Buildings 15, no. 13: 2293. https://doi.org/10.3390/buildings15132293
APA StyleLiang, S., Chen, W., Li, L., & Liu, F. (2025). A Study of Carbon Emission Quota for Construction Period of Dredging Projects: Case Studies in Guangzhou, Shenzhen, and Malé. Buildings, 15(13), 2293. https://doi.org/10.3390/buildings15132293