Article

Deep Learning-Based Systems for Evaluating and Enhancing Child-Friendliness of Urban Streets—A Case of Shanghai Urban Street

1
College of Architecture and Urban Planning, Tongji University, Shanghai 200092, China
2
Key Laboratory of Shanghai Urban Renewal and Space Optimization Technology, Shanghai 200092, China
3
College of Arts & Media, Tongji University, Shanghai 200092, China
*
Authors to whom correspondence should be addressed.
These authors contributed equally to this work.
Buildings 2025, 15(13), 2291; https://doi.org/10.3390/buildings15132291
Submission received: 4 June 2025 / Revised: 24 June 2025 / Accepted: 26 June 2025 / Published: 29 June 2025
(This article belongs to the Section Architectural Design, Urban Science, and Real Estate)

Abstract

In the context of rapid urbanization, urban streets have become critical spatial environments for children’s daily activities, directly influencing their mobility safety, behavioral development, and the spatial equity of cities. However, conventional assessment methods largely rely on subjective surveys and qualitative analyses, lacking objectivity and scalability. To address these limitations, this study takes urban streets in Shanghai as a case study and integrates deep learning technologies to propose a generalizable methodology for developing a child-friendliness evaluation and enhancement system that incorporates multi-source data and perceptual indicators for urban streets. The system extracts spatial features of streets based on urban street environmental information, and incorporates evaluation inputs from intergenerational user groups, including children and their caregivers. A neural network model is trained to enable automated, multidimensional assessment of child-friendliness and to generate context-sensitive and adaptable strategies. The findings reveal significant perceptual differences between user groups: children place greater emphasis on playfulness and interactivity, while caregivers prioritize safety and comfort. This validates the necessity and effectiveness of adopting an intergenerational collaborative perspective for comprehensive child-friendliness evaluation. By overcoming the limitations of traditional approaches in terms of accuracy and efficiency, this research expands the methodological repertoire of child-friendly urban studies and provides data-driven support for the intelligent design and inclusive governance of urban streets.

1. Introduction

As the concept of “Child-Friendly Cities” continues to gain global momentum, the quality of environments that support children’s survival and development in urban spaces has become a critical metric for evaluating the level of urban governance and the effectiveness of public services [1]. Among these urban spaces, streets—as the most fundamental and ubiquitous units of public space—serve as primary venues for children’s mobility, recreation, and social interaction. The quality of street environments directly impacts children’s sense of safety, belonging, and participation [2]. However, under a long-standing planning paradigm that prioritizes vehicular movement and efficiency, children’s mobility needs and spatial rights are often marginalized [3]. Urban streets are frequently characterized by excessive scale, complex traffic flows, insufficient public amenities, and poor visual permeability, which together create potential safety hazards and social barriers for children, making such environments inadequate for supporting their healthy development [4].
Recent years have seen a growing body of research on the child-friendliness of urban streets. However, current methodologies primarily focus on constructing evaluation indicator systems, conducting field surveys, collecting expert ratings or public questionnaires, and applying tools such as fuzzy comprehensive evaluation and analytic hierarchy process (AHP) to derive composite scores for street environments [5]. While these approaches have laid a preliminary theoretical and technical foundation for child-friendly urban development, they suffer from several significant limitations. First, the evaluation process is heavily reliant on manual effort; data collection and processing are time-consuming and labor-intensive, making it difficult to meet the demands of rapid urban transformation and dynamic governance [6]. Second, the construction of indicator systems is often subjective, with weight assignments lacking empirical justification and limited comparability across different regions [7]. Third, most studies concentrate solely on children’s needs, overlooking the intergenerational dynamics present in street spaces. In reality, children are embedded within complex social relationships involving caregivers, family members, and other pedestrians, whose perceptions and behaviors significantly influence how street environments are experienced and evaluated [8].
Meanwhile, advancements in artificial intelligence (AI), particularly deep learning, offer new solutions to address these limitations [9]. As a subfield of machine learning, deep learning excels at automatically extracting features from large volumes of raw data, enabling the identification of complex spatial patterns and semantic attributes. This capability allows researchers to bypass traditional manual indicator design, thereby improving both the efficiency and accuracy of evaluations [10]. In urban research, deep learning models have already demonstrated strong performance and generalizability in tasks such as street view image interpretation, architectural style recognition, and traffic flow prediction [11]. Integrating deep learning into child-friendly assessment systems for urban streets holds the potential to develop scalable, automated models that minimize human intervention while enhancing evaluation quality and operational feasibility.
Against this backdrop, this study pursues two primary objectives. First, it aims to develop a deep learning-based system for evaluating and enhancing the child-friendliness of urban streets. By integrating environmental data of streets, and subjective ratings, the system leverages neural network models to enable automated perception of child-friendliness and to generate context-sensitive and adaptable strategies. Second, the study introduces an intergenerational collaborative perceptual perspective, incorporating behavioral characteristics and subjective perceptions from key demographic groups—including children, caregivers, urban planners, and policy-makers—into the evaluation process. This approach enables a comparative analysis of group-specific concerns and enhances the adaptability and inclusiveness of the evaluation outcomes in both social behavior and spatial design practices.
The structure of this study is as follows: Section 2 reviews existing literature on child-friendly urban streets and the application of deep learning in urban perception; Section 3 presents the overall framework of the evaluation and enhancement system; Section 4 details the processes of data acquisition, model development, and training methodology; Section 5 outlines an empirical study conducted in selected urban neighborhoods; Section 6 explores optimization strategies derived from the system; Section 7 summarizes the key findings and outlines directions for future research.

2. Literature Review

2.1. Research on Child-Friendliness of Urban Streets

With the global diffusion of the Child-Friendly Cities (CFC) initiative, urban planning paradigms have gradually shifted from an “adult-centered” model to one that emphasizes “child inclusivity” [1]. As critical spaces for children’s daily mobility and social interaction, urban streets have increasingly drawn scholarly attention [4]. Current research on the child-friendliness of urban streets generally falls into three key domains:
(1)
The Relationship Between Physical Spatial Attributes and Children’s Behavior
This line of inquiry primarily employs quantitative methods to examine how specific spatial characteristics of streets affect children’s mobility patterns and perceived safety. Commonly used spatial indicators include the Walkability Index, which integrates street network density, intersection density, land-use mix, and residential density to assess the supportiveness of the street environment for child pedestrian activity [12]; Traffic Safety Score, which evaluates potential hazards based on factors such as speed limits, traffic signalization, and lane separation [13]; Green View Index (GVI) and Visual Openness, often derived from street-view imagery, which are used to quantify vegetation coverage and spatial transparency and have been shown to be closely associated with children’s psychological comfort and sense of belonging [5,14]; Infrastructure Adequacy, including sidewalk width, availability of rest facilities, and air quality, which contributes to a more comprehensive evaluation framework [15]. These metrics lay the foundation for quantifying the child-friendliness of streets and support the refinement of policy-making and spatial design interventions [16].
(2)
Children’s Subjective Perception and Preferences
Recent studies increasingly emphasize children’s subjective experiences and aesthetic preferences in street environments. Data collection methods often include surveys, interviews, cognitive mapping, and behavioral observation [7,17]. Wang et al. [18] found that children tend to prefer soft infrastructure, natural elements, and visual diversity, with heightened sensitivity to playfulness and safety—particularly in high-density urban settings. With advances in technology, researchers have begun incorporating tools such as eye-tracking and emotion recognition to enhance the objectivity of perception studies. For example, Sheng et al. [19] used wearable devices to record children’s physiological responses to different street environments, revealing that vegetation density and spatial scale significantly affect emotional states. Yin et al. [20] employed multimodal data to show that children place greater emphasis on familiarity and the presence of recreational facilities. Overall, this strand of research provides a child-centered perspective, enriching urban street design with psychological and perceptual dimensions that are difficult to quantify, and contributing to the development of “soft indicators” for child-friendly streets.
(3)
Institutional Mechanisms and Spatial Governance
Beyond physical design, another research focus concerns the role of policies, institutional frameworks, and community participation in shaping child-friendly streets [21]. Schepers et al. [22] argue for the sustained empowerment of children throughout the project lifecycle, while Cordero-Vinueza et al. [23] stress the importance of incorporating child-related agendas into urban planning processes. Practices vary across countries: Germany and the Netherlands advocate for speed-reducing traffic measures, such as 30 km/h speed limits, speed bumps, and widened sidewalks [24]; the United States and Japan emphasize multifunctional streets and community co-governance models; in China, pilot initiatives have been implemented under the concepts of “15 min living circles” and “child-friendly communities”, with cities like Shenzhen and Chengdu developing integrated approaches that combine neighborhood revitalization with child-centered spatial interventions [25].
In summary, existing research on child-friendly streets has evolved into a multidimensional framework encompassing physical environment, subjective perception, and institutional design. While this provides a solid foundation for subsequent studies and practices, several challenges persist: inconsistent spatial indicator systems, high technical thresholds for collecting perceptual data, and the lack of standardized assessment mechanisms. These gaps highlight the urgent need for a data-driven, multi-perspective evaluation framework capable of supporting the broader implementation of child-friendly street initiatives.

2.2. Application of Deep Learning in Urban Studies

With continuous advancements in artificial intelligence, deep learning has emerged as a powerful tool in urban spatial research [26]. Its strong capabilities in nonlinear modeling and automatic feature extraction make it particularly well-suited for analyzing complex and heterogeneous urban street data—such as street-view imagery, road structures, pedestrian behavior, and environmental perception—thus driving a transition from static spatial description to dynamic and intelligent urban cognition [27]. In recent years, researchers have developed a variety of deep learning models targeting street scene recognition, spatial perception, and functional modeling, contributing to a methodological shift in urban environment analysis [28].
(1)
Automated Recognition and Semantic Interpretation of Urban Street Scenes
Convolutional Neural Networks (CNNs) have been widely applied to the semantic segmentation and feature extraction of street-view images, enabling the identification of detailed elements such as greenery, buildings, sidewalks, and traffic infrastructure [29]. Utilizing large-scale street-view datasets such as Google Street View and Mapillary, researchers have employed models like DeepLabV3+ to automatically calculate indicators such as greenery coverage, visual accessibility, and street vitality, thereby constructing a quantifiable system for assessing urban visual quality [30]. Some studies have specifically applied these methods to the evaluation of child-friendly spaces [14,31]. For example, Yang et al. [32], through empirical urban research, found that current street designs are predominantly adult-centric, lacking safety features and perceptual elements suitable for children, which in turn diminishes their willingness to travel independently.
(2)
Perceptual Dimension Modeling and Multimodal Fusion Analysis
Modeling perceptual dimensions and integrating multimodal data represent another significant direction for deep learning in urban studies. Rather than relying solely on image structures, researchers have introduced subjective evaluative dimensions such as restorative perception, visual aesthetics, and color psychology to explore the emotional meanings embedded in urban space [33]. Moreover, with the development of multimodal neural networks, heterogeneous data sources—such as street-view images, social media texts, and geospatial coordinates—can now be jointly analyzed. This enables the combined identification of urban functional zones, resident sentiment, and social perception [34,35,36]. These techniques are particularly useful in modeling the complex “preference–perception–spatial response” mechanisms involved in friendliness assessments, helping to reveal perceptual heterogeneity across different demographic groups [37].
(3)
Topological Modeling of Spatial Structure and Behavioral Patterns
In terms of spatial structure and behavior modeling, Graph Neural Networks (GNNs) have been employed to analyze the topological characteristics of urban road networks and pedestrian movement data. These models effectively capture the functional connectivity and circulation efficiency among streets [38]. This structure-based deep modeling approach overcomes the limitations of traditional two-dimensional mapping and image analysis, offering insights into children’s street-use behaviors from the perspectives of route choice and spatial accessibility. The integration of multi-task learning and transfer learning further enhances the generalizability of these models, making them applicable across diverse urban contexts—even in data-scarce cities [39,40]. Yao et al. [41] incorporated expert knowledge into automated scoring systems through adversarial learning, improving both local adaptability and evaluation reliability.
In summary, the application of deep learning in urban spatial studies presents three major advantages: (1) enhanced processing efficiency for both image and structural data, reducing reliance on subjective input; (2) support for joint modeling of visual, semantic, structural, and behavioral dimensions; (3) transferability, interpretability, and scalability to various urban scenarios. These technological capabilities provide a robust foundation for the accurate evaluation and intelligent enhancement of child-friendliness in urban street environments.

2.3. Research Gaps

As research on child-friendly urban streets continues to advance, significant progress has been made in evaluating physical environments, exploring subjective perceptions, and constructing institutional mechanisms. These efforts have gradually shaped a multidimensional and interdisciplinary theoretical framework [42]. However, a review of existing literature reveals three prominent research gaps:
(1) Reliance on conventional assessment methods limits scalability and real-time responsiveness. Current studies primarily adopt traditional techniques such as questionnaires, field observations, and expert evaluations for data collection and analysis. While these methods offer certain advantages in explanatory power and contextual adaptability, they are often constrained by high costs, long cycles, and strong subjectivity. Consequently, they fall short in capturing the dynamic and large-scale variations in urban street environments in real time.
(2) Indicator systems lack objective quantification, hindering standardization. Most existing evaluation frameworks are developed based on expert judgment or case-specific approaches, leading to the selection and weighting of indicators that often overemphasize physical attributes or safety factors. These frameworks tend to overlook deeper insights into children’s behavioral patterns and psychological preferences. Moreover, due to the absence of a unified evaluation logic across different studies or urban contexts, the comparability and generalizability of results remain limited.
(3) Evaluation perspectives remain centered on a single user group, with insufficient consideration of intergenerational interaction and behavioral co-participation. Most current assessments focus exclusively on the child as an individual user, emphasizing spatial perception and usage preferences from a child-centric standpoint. This approach neglects the practical reality that children’s use of streets is highly dependent on the presence and participation of caregivers. The spatial preferences and behavioral guidance of parents, urban planners, or policy-makers play a critical role in determining whether children engage with street environments.
In response to these limitations, this study proposes a comprehensive evaluation and enhancement system for child-friendly urban streets. The goal is to promote a systematic shift in street-space design from an “adult-centric” model to one that supports “all-age inclusivity”. On one hand, a deep learning-based model is introduced to establish an automated recognition and semantic analysis workflow using street-view imagery. By incorporating multidimensional indicators—such as visual accessibility, greenery distribution, street vitality, and traffic safety—the system aims to create a scalable and transferable image-driven evaluation framework. On the other hand, adopting a multi-actor collaborative perspective, the system integrates the spatial needs and behavioral patterns of multi-stakeholder groups. Through the development of a multilayered, perception-aware fusion model, the proposed framework enhances behavioral realism and contextual adaptability in child-friendliness assessments.

3. Methodology

This study proposes a generalizable framework for developing an urban street child-friendliness evaluation and enhancement system that integrates multi-source data and perceptual indicators, using Shanghai’s urban streets as a case study and incorporating deep learning techniques (Figure 1). To comprehensively assess child-friendliness in urban street environments, a multi-stakeholder research approach is employed. In addition to children as the primary user group, the study involves four other generational stakeholder groups: caregivers (including parents, grandparents, nannies, and teachers), experts (in urban planning and child-friendly environments), governmental departments (such as the Women’s Federation, subdistrict offices, and neighborhood committees), and the general public (including nearby residents, local business owners, and passersby) [43].
The development of the child-friendliness evaluation system relies on two types of critical data: (1) spatial features of urban streets related to child-friendliness, and (2) evaluation scores provided by children and other generational stakeholders regarding the child-friendliness of specific street segments. Similarly, the construction of the enhancement system requires (1) spatial features of urban streets associated with child-friendliness, and (2) improvement demands expressed by children and other generational groups for each street segment.
All spatial features related to child-friendliness used in this study were collected from seven administrative districts in Shanghai: Changning, Hongkou, Huangpu, Jing’an, Putuo, Xuhui, and Yangpu. As one of the most representative cities in China, Shanghai offers a consistent urban fabric and data comparability across districts [44]. The selected streets encompass a variety of neighborhood types and are characterized by high child pedestrian activity or proximity to child-centric destinations, such as residential communities, schools, parks, shopping malls, entertainment venues, cultural districts, and pedestrian streets.
Additionally, urban streets are segmented using intersections as dividing nodes in this study, where the segment between two intersections is defined as a single urban street. Each street segment typically comprises seven types of elements: sidewalks, non-motorized lanes, motorized lanes, building frontages, landscape greenery, activity spaces, and service facilities. Moreover, even the two sides of the same street often differ in spatial characteristics—such asymmetry can influence stakeholders’ perceptions and improvement demands. Therefore, spatial features and evaluation data are recorded separately for each side of every street segment. As a result, each street segment yields two distinct data samples for model training to ensure data accuracy and reliability.
Finally, in this study, the child-friendliness ratings and improvement needs for each street, as assessed by multi-generational groups, were calculated and statistically analyzed based on the respective decision weights assigned to each stakeholder group. The weight allocation in this study was applied to the number of surveyed individuals from different groups per street. This approach was adopted primarily because it is applicable not only to the calculation of the final child-friendliness scores for urban streets but also to the statistical analysis of child-friendly improvement needs.
To examine the impact of equal versus weighted sample sizes across stakeholder groups on the final child-friendliness scores and improvement needs, we conducted a comparative experiment in the North Bund area of Hongkou District, Shanghai. In this experiment, 50 diverse stakeholders were surveyed per street.
Experiment 1 (Equal Sample Sizes): The same number of participants was surveyed for each stakeholder group. The final child-friendliness score was calculated by first averaging the ratings within each group and then applying weighted summation.
Experiment 2 (Weighted Sample Sizes): The number of participants per group was determined by their decision weights. The final score was derived by directly averaging all individual ratings.
The results showed minimal differences in the final child-friendliness scores between the two experiments. However, significant discrepancies emerged in the statistical outcomes for improvement needs. Further analysis revealed that this divergence was primarily due to Experiment 1 not accounting for decision weight proportions during statistical aggregation, whereas Experiment 2 inherently incorporated these weights through the differential sample sizes.

3.1. Design of Urban Street Spatial Features

Field investigations involving children and other generational stakeholders revealed differing priorities regarding child-friendly street features. Children tend to value playability and interactivity, such as the presence of activity spaces, play facilities, landscape design, and diversity of functional buildings. In contrast, other generational stakeholders emphasize safety and comfort, including traffic volume, sidewalk cleanliness, availability of resting facilities, and presence of surveillance systems. This study engaged 10 experts in child-friendly urban design to analyze street characteristics related to child-friendliness. Building upon existing research and field investigations, we systematically identified 50 key features that contribute to child-friendly urban streets. Given that deep learning models can automatically extract relevant patterns from raw data, no manual feature selection is necessary. All 50 features are retained and categorized under the seven primary street elements, as shown in Table 1.

3.2. Design of Child-Friendliness Evaluation Indicators

This study employs a multi-stakeholder evaluation approach to assess the child-friendliness of each urban street segment. The final assessment integrates input from five key stakeholder groups: children, caregivers, experts, government departments, and the general public. To quantify these groups’ perceptions, a five-point Likert scale is used to rate the child-friendliness of urban streets [45], where 1 indicates very poor and 5 indicates excellent.
The different decision weights of various entities affect the final scoring of child-friendliness in urban streets. This study employed the Analytic Hierarchy Process (AHP) to determine the decision weights for each stakeholder group, beginning with the establishment of their relative decision-making importance. This study invited 20 experts in the fields of child-friendliness and urban studies to score the relative importance of decisions between each entity. A score of 1 indicates that entity A is equally important to entity B, 3 or 1/3 indicates that entity A is slightly more important or less important than entity B, 5 or 1/5 indicates a moderate level of importance or unimportance, 7 or 1/7 indicates a strong level of importance or unimportance, and 9 or 1/9 indicates an extreme level of importance or unimportance. The scores of 2 or 1/2, 4 or 1/4, 6 or 1/6, and 8 or 1/8 are intermediate values between two adjacent judgments. By statistically analyzing these 20 scores, the most consistent importance ranking was filtered out, and the final judgment matrix of decision importance for each entity was determined through discussion (Table 2).
Among the five groups, children—the primary users in this study—are assigned the highest decision weight. Although definitions of childhood vary across countries, the literature and field research indicate that children aged 7 to 12 show a significant demand for independent pedestrian spaces in their daily lives. They possess basic logical reasoning skills, are capable of completing questionnaires, and demonstrate a degree of cognitive autonomy [46]. Therefore, this age group is selected as the primary target population in this study. Caregivers are assigned a decision weight comparable to that of children. As previous studies suggest, children’s travel time, mode, and destinations are typically determined by their caregivers [21]. Interviews also reveal that caregivers are more likely to extend children’s outdoor activity time in areas with higher levels of child-friendliness. Experts and government officials serve more advisory roles; thus, their decision weights are similar to each other but lower than those of children and caregivers. The general public plays a supplementary role, and their weight is the lowest.
Based on the constructed judgment matrix table of decision importance among different entities (Table 2), this study ultimately determines the decision weights of each entity through the Analytic Hierarchy Process (AHP) algorithm (Appendix A). First, the sum of all values in each column of the judgment matrix table is calculated (Equation (1) in Appendix A), and then the ratio of each value in the columns to the sum of all values in that column is calculated to obtain matrix C (Equation (2) in Appendix A). Next, the average of all values in each row of matrix C is taken to obtain the weight matrix W (Equation (3) in Appendix A). Finally, a consistency check is performed on the weight matrix W (Equations (4)–(7) in Appendix A). The consistency ratio (CR) of this weight matrix is 0.00118781, which is less than 0.1, indicating that it passes the consistency test. Ultimately, this study determines that the decision weights of children and child caregivers account for approximately 30%, the decision weights of government departments and experts account for about 16%, and the decision weights of the general public account for about 8%.
The previous text mentioned that this study conducts separate statistics on the child-friendliness scores for both sides of each urban street, and the weight distribution is applied to the number of surveys conducted among different entities on each street. Therefore, for one side of a given street segment, 15 children (aged 7–12), 15 caregivers, and 4 members of the general public are randomly selected for in-person questionnaire surveys. Each respondent rates the child-friendliness of that particular street side using the 5-point Likert scale. Since experts and government officials are typically unavailable for on-site surveys, an offline evaluation method is adopted. Photographs or videos of the street segment are provided to 8 experts and 8 government representatives, who then score the segment remotely using the same 5-point scale.
Once the evaluation scores from different stakeholder groups are collected for a given side of a street segment, the mean score is calculated and rounded to the nearest integer to serve as the final child-friendliness score for that side. In total, this study surveyed 701 urban street segments, generating 1402 data samples (both sides counted separately). The distribution of samples across different rating levels is shown in Table 3.

3.3. Design of Child-Friendliness Improvement Needs

Based on the child-friendly features of urban streets summarized above, as well as common issues associated with child-unfriendly streets, this study initially proposed a set of improvement strategies. Ten experts in the field of child-friendly urban design were invited to evaluate these strategies in terms of cost-effectiveness, feasibility, and universality. According to the consensus of the most consistent expert evaluations, 18 improvement measures were retained in the questionnaire, allowing for multiple selections (Table 4). It is important to note that the improvement measures proposed in this study serve as context-sensitive and adaptable strategies for enhancing child-friendliness on urban streets and are not tailored solutions. For streets with particularly low child-friendliness scores, context-specific interventions are required, taking into account their unique spatial characteristics as well as economic, social, geographical, and cultural factors.
The need-for-improvement data for each side of a street segment were recorded separately. For one side of a street, surveys were conducted with 15 randomly selected children aged 7–12, 15 caregivers, and 4 members of the general public who were observed using that space. Their selections among the proposed improvement strategies were collected. For 8 experts and 8 government officials, offline surveys were again used, in which they were shown photos or videos of the street and asked to select the improvement measures they deemed necessary.
As mentioned earlier, children and adults often differ in their priorities when evaluating child-friendliness. To account for this, the responses of the 15 children were analyzed separately from the 35 respondents representing other age groups (caregivers, public, experts, and government officials). Improvement measures selected by the majority of children (>7) and the majority of the other respondents (>17) were retained. Measures selected by both groups were excluded from duplication, and the distinct, aggregated selections were recorded as the need-for-improvement data for that particular side of the street.
In total, the study collected 1402 samples across 701 street segments. The frequency of each improvement needed in the dataset is summarized in Table 4.

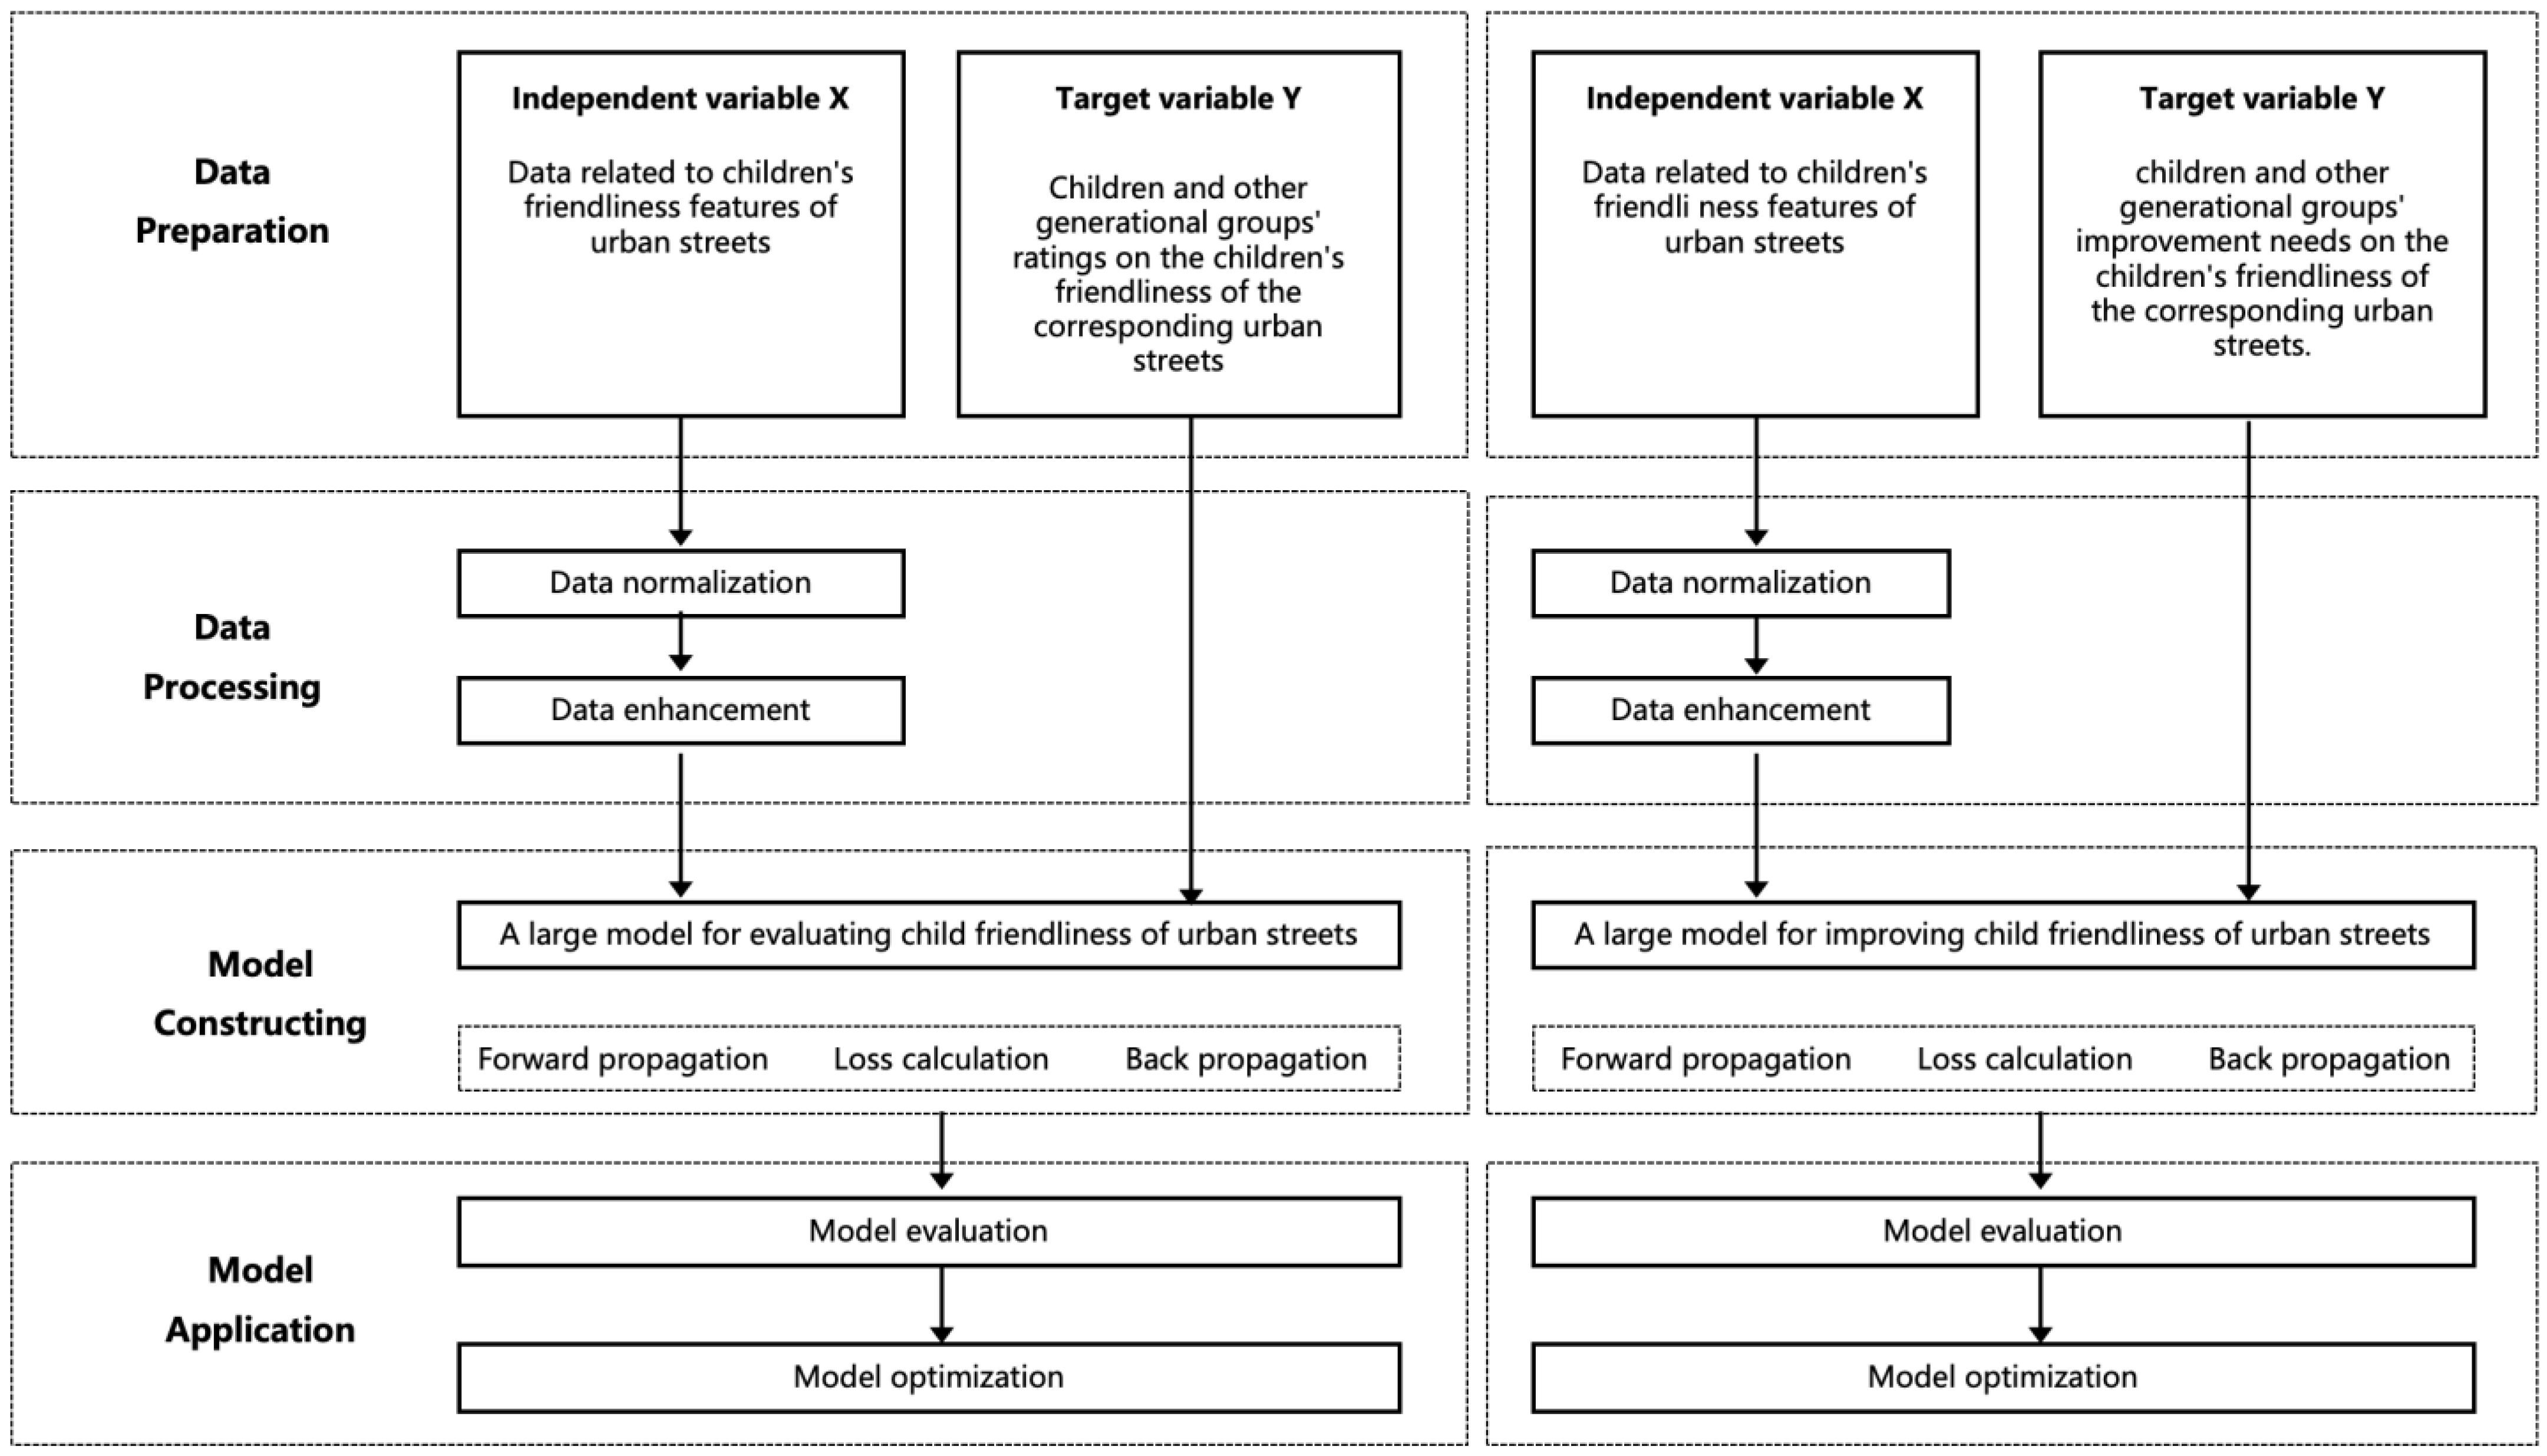
3.4. Framework Design and Evaluation Workflow

This study develops two deep learning models: a Child-Friendliness Evaluation Model and a Child-Friendliness Enhancement Model for urban streets. Both models take urban street spatial feature data as input. The target output of the evaluation model is the child-friendliness ratings provided by children and other stakeholder groups, while the output of the enhancement model is the improvement needs identified by the same groups. These models aim to enable automated, data-driven predictions of street-level child-friendliness and corresponding improvement strategies.
In terms of model structure design, since all the feature data of the urban streets in this paper are manually collected quantifiable data, rather than non-quantifiable data such as text, images, or videos, this paper only employs an Artificial Neural Network (ANN) as the core framework for model training. The ANN consists of fully connected layers that map input features to predicted outputs.
For the evaluation model, the task is formulated as a single-label multiclass classification problem. The Cross-Entropy Loss function is used to compute the error between the predicted and actual child-friendliness ratings. The model is trained using backpropagation and the Adam optimizer (Adaptive Moment Estimation) to iteratively update weights and minimize the loss, thereby improving predictive accuracy.
The enhancement model is framed as a multi-label multiclass classification problem, where each label (i.e., improvement measure) is treated as an independent binary classification task. This model uses the BCE with Logits Loss function to calculate the total loss across all labels.
To improve the models’ stability and generalization, the study applies data augmentation techniques to expand the training dataset and reduce overfitting to specific feature distributions. Additionally, since the spatial features of urban streets are measured in heterogeneous units, dimensionless normalization is employed to eliminate scale disparities among different feature types.
The preprocessed dataset is divided into a training set, validation set, and test set. The training set is used for model learning, the validation set monitors performance across epochs, and the test set evaluates the final model performance using metrics such as accuracy, precision, and recall, ensuring external generalization capability.

4. Automated Evaluation and Enhancement Models

4.1. Data Collection and Preprocessing

The distribution of sample sizes across different rating levels in the evaluation model (Table 3), as well as the number of selections for each improvement measure in the enhancement model (Table 4), is significantly imbalanced. This class imbalance may lead to a bias in deep learning model training, where the model becomes more adept at recognizing classes with a larger number of samples while underperforming on underrepresented categories. Such an imbalance can also make the model overly sensitive to variations in input data, thereby undermining its generalization ability and robustness. To address this issue and ensure the model can learn equitably across various child-perception rating categories, this study adopts data augmentation techniques to expand and optimize the training dataset.
Additionally, the measurement units of spatial features in the sample dataset are not entirely consistent. As a result, the raw numerical ranges vary widely across features. Feeding such data into deep models may lead to poor convergence, with large-scale features disproportionately influencing the distance calculations, thereby diminishing the importance of smaller-scale features. Since the intra-feature variation is relatively small, with no significant outliers and most data falling within fixed bounds, the study employs Min–Max Normalization to perform dimensionless scaling. This transformation maps all feature values to a standardized [0, 1] range, ensuring that all features contribute equally to the learning process. The maximum and minimum values for the Min–Max normalization method are selected from the entire dataset and uniformly applied to the training set, validation set, and test set.
After normalization, the sample data can undergo data augmentation. In this study, the evaluation model dataset is a single-label dataset. The model employs a Generative Adversarial Network (GAN) to learn the features and distribution of the original data, and directly generates simulated data for a specific label using the trained generator (Appendix B). The enhancement model dataset, however, is a multi-label dataset. While this model can also use a GAN to generate simulated data for specific label combinations, the algorithm differs slightly (Appendix C).
Following data augmentation, the sample size for the evaluation model expands to 5900 instances, with class distributions becoming more balanced across rating levels (Table 5). The dataset for the enhancement model was expanded to 4134 samples. However, given the multi-label nature of the model and the numerous sample categories, this study strived to minimize disparities in the selection frequency of improvement measures. All measures were maintained within a controlled range of 1000 to 1500 selections each (Table 6).
These datasets qualify as medium scale in size. To optimize model performance and enable a fair evaluation, the dataset is split into training, validation, and test sets, maintaining a consistent class ratio across all subsets. Specifically, the training set enables the model to fully learn patterns and features within the data. The validation set serves dual purposes of hyperparameter tuning and overfitting prevention during training. The test set exclusively evaluates the model’s generalization capability to ensure robust predictive performance on unseen data.

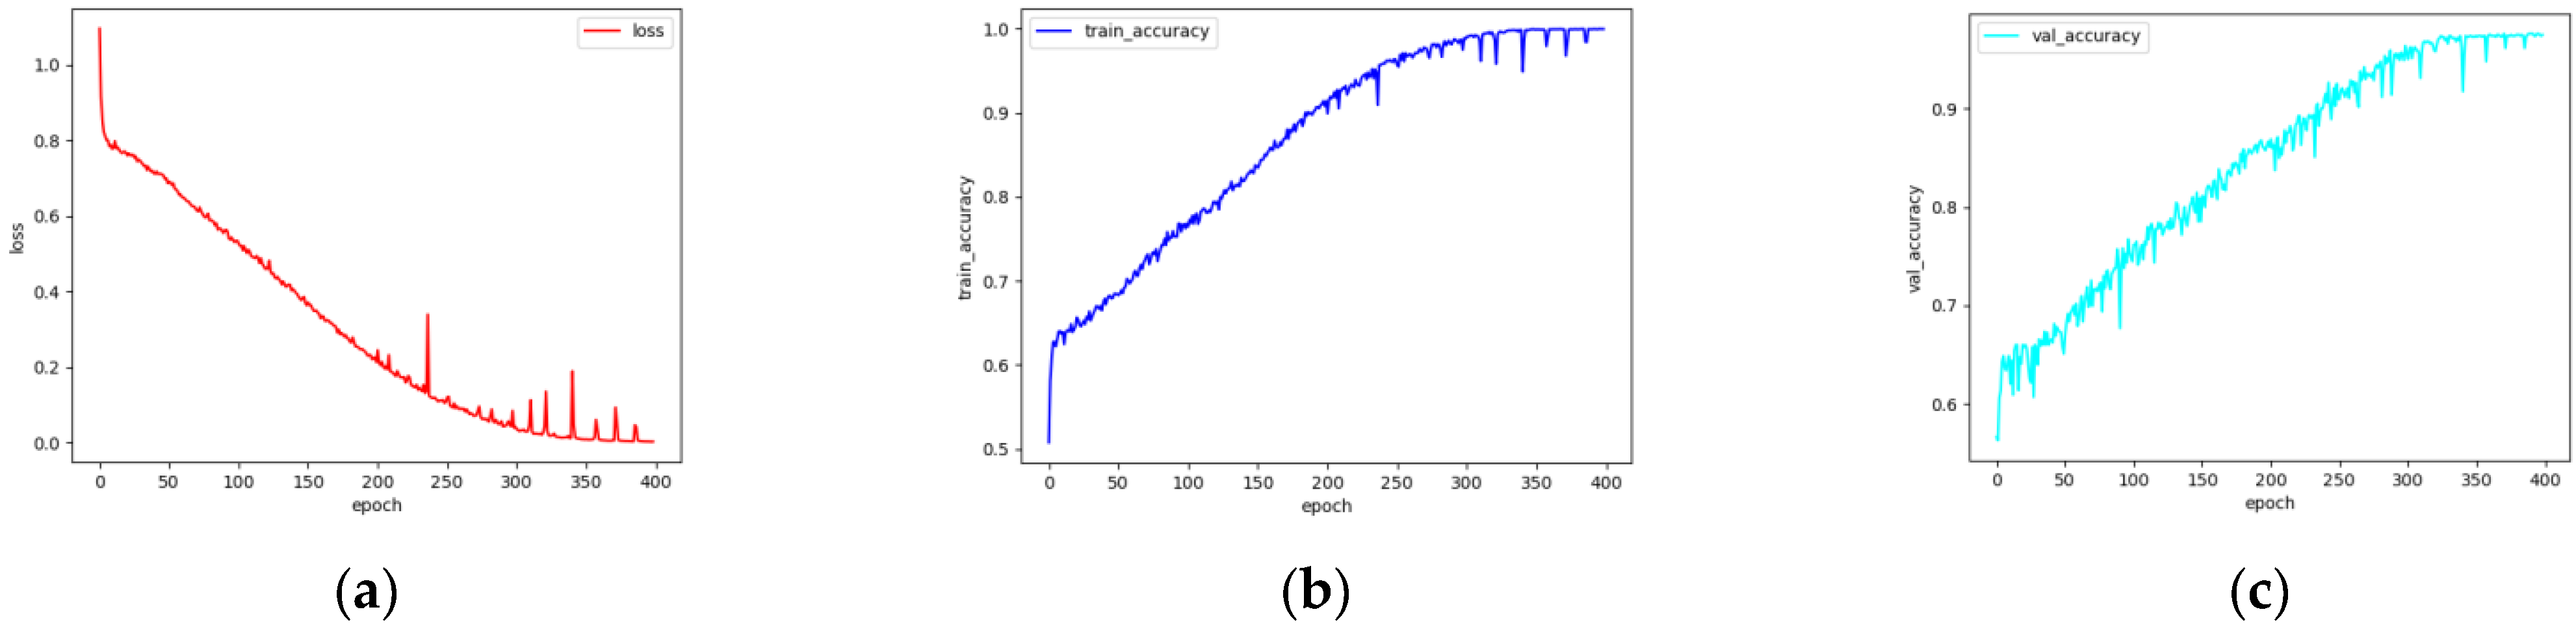
4.2. Design and Performance Evaluation of the Evaluation Model

For the evaluation model of the single-label multi-classification task, this paper first uses the StratifiedShuffleSplit algorithm to divide the dataset of 5900 samples into an 80% temporary dataset and a 20% test set. Then, the Stratified K-Fold algorithm (with the n_splits parameter set to 5) is applied to the temporary dataset to further divide it into an 80% training set and a 20% validation set, thereby completing 5-fold cross-validation of the model. During each dataset division, it is necessary to ensure that the distribution proportions of different categories of data remain consistent across the datasets.
As a single-label 5-class classification model, the evaluation model aims to predict the child-friendliness score (1–5 points) of urban streets by inputting relevant data (Appendix D). To ensure that the urban street child-friendliness evaluation model can quickly converge and achieve high accuracy on the validation set, this study, through repeated experimentation, designed the model’s network architecture and training parameters as follows.
For the network architecture, the model consists of four hidden layers. The first hidden layer receives urban street sample data, followed by a sigmoid activation function. The input size of this layer is 50, and the output size is 128. The second hidden layer takes the output from the first hidden layer, also followed by a sigmoid activation function, with an input size of 128 and an output size of 256. The third hidden layer processes the output from the second hidden layer, again using a sigmoid activation function, with an input size of 256 and an output size of 512. The fourth hidden layer takes the output from the third hidden layer and produces the final result, with an input size of 512 and an output size of 5. Since Cross-Entropy Loss function in the torch module package (version 2.5.0) in Python (version 3.11.5)includes a built-in softmax activation function, no additional activation function is needed for the fourth hidden layer.
As for the initial hyperparameters for training, this study sets the batch size to 32, the optimizer to Adam, the learning rate to 0.001, the loss function to Cross-Entropy Loss, and the total number of training epochs for each cross-validation to 400. After each epoch, the model parameters are saved, and performance is evaluated on the validation set to monitor the model’s convergence and generalization ability. Once training is completed, the model with the best overall performance on the training and validation sets is tested on the test set to assess its generalization ability, ensuring it maintains strong predictive performance on unseen data. The final validated model can then be applied to evaluate the child-friendliness of unknown urban streets.
The training and validation results are shown in Figure 2. On the training set, both the loss and accuracy curves stabilized after around 300 epochs, indicating model convergence. While the accuracy curve on the validation set exhibited more fluctuations, it still followed a general upward trend and closely tracked the training set performance. After 5-fold cross-validation training, the model’s average loss on the training set dropped to a minimum of 0.00248, while its average accuracy on the training and validation sets reached peaks of 99.97% and 97.62%, respectively. These results demonstrate the model’s strong learning capacity and generalization ability.
On the test set, this study selected the model with the best overall performance on the training and validation sets for performance evaluation. In addition to calculating the overall classification accuracy, the study also assessed recall and precision for each of the five score levels, to provide a more comprehensive understanding of the model’s generalization. As shown in Table 7, the model achieved an overall accuracy of 97.40%, confirming its robustness. In terms of per-class performance, the model performed particularly well for ratings of 1, 2, and 5, while performance was relatively lower for ratings of 3 and 4.
Specifically, for streets rated as 1, the recall was 100% and the precision reached 99.49%. For streets rated as 2, the recall was 99.42% and precision was 98.28%. These results indicate that the model is exceptionally accurate in identifying low-scoring streets, with a negligible false positive rate. Thus, the model is well-suited to detect urban spaces that are less child-friendly, providing a scientifically sound basis for subsequent improvement recommendations.
It is worth noting that the model showed relatively weaker performance for ratings of 3 and 4, with slightly lower recall and precision scores. Several attempts were made to improve classification in these categories, including dropout regularization, L2 regularization, increasing the number of training epochs, and adjusting the learning rate and batch size. However, these techniques did not yield significant improvements. This suggests that the issue may stem from the intrinsic characteristics of the dataset, particularly the lack of clear feature differentiation between samples rated as 3 and 4, which makes them harder to distinguish.
Nonetheless, given that the primary objective of this study is to accurately detect streets with lower child-friendliness scores, the model’s excellent performance in classifying ratings 1 and 2 is of greater practical importance. As such, the relative underperformance in mid-range scores has a limited impact on the model’s real-world applicability and can be considered negligible in this context.

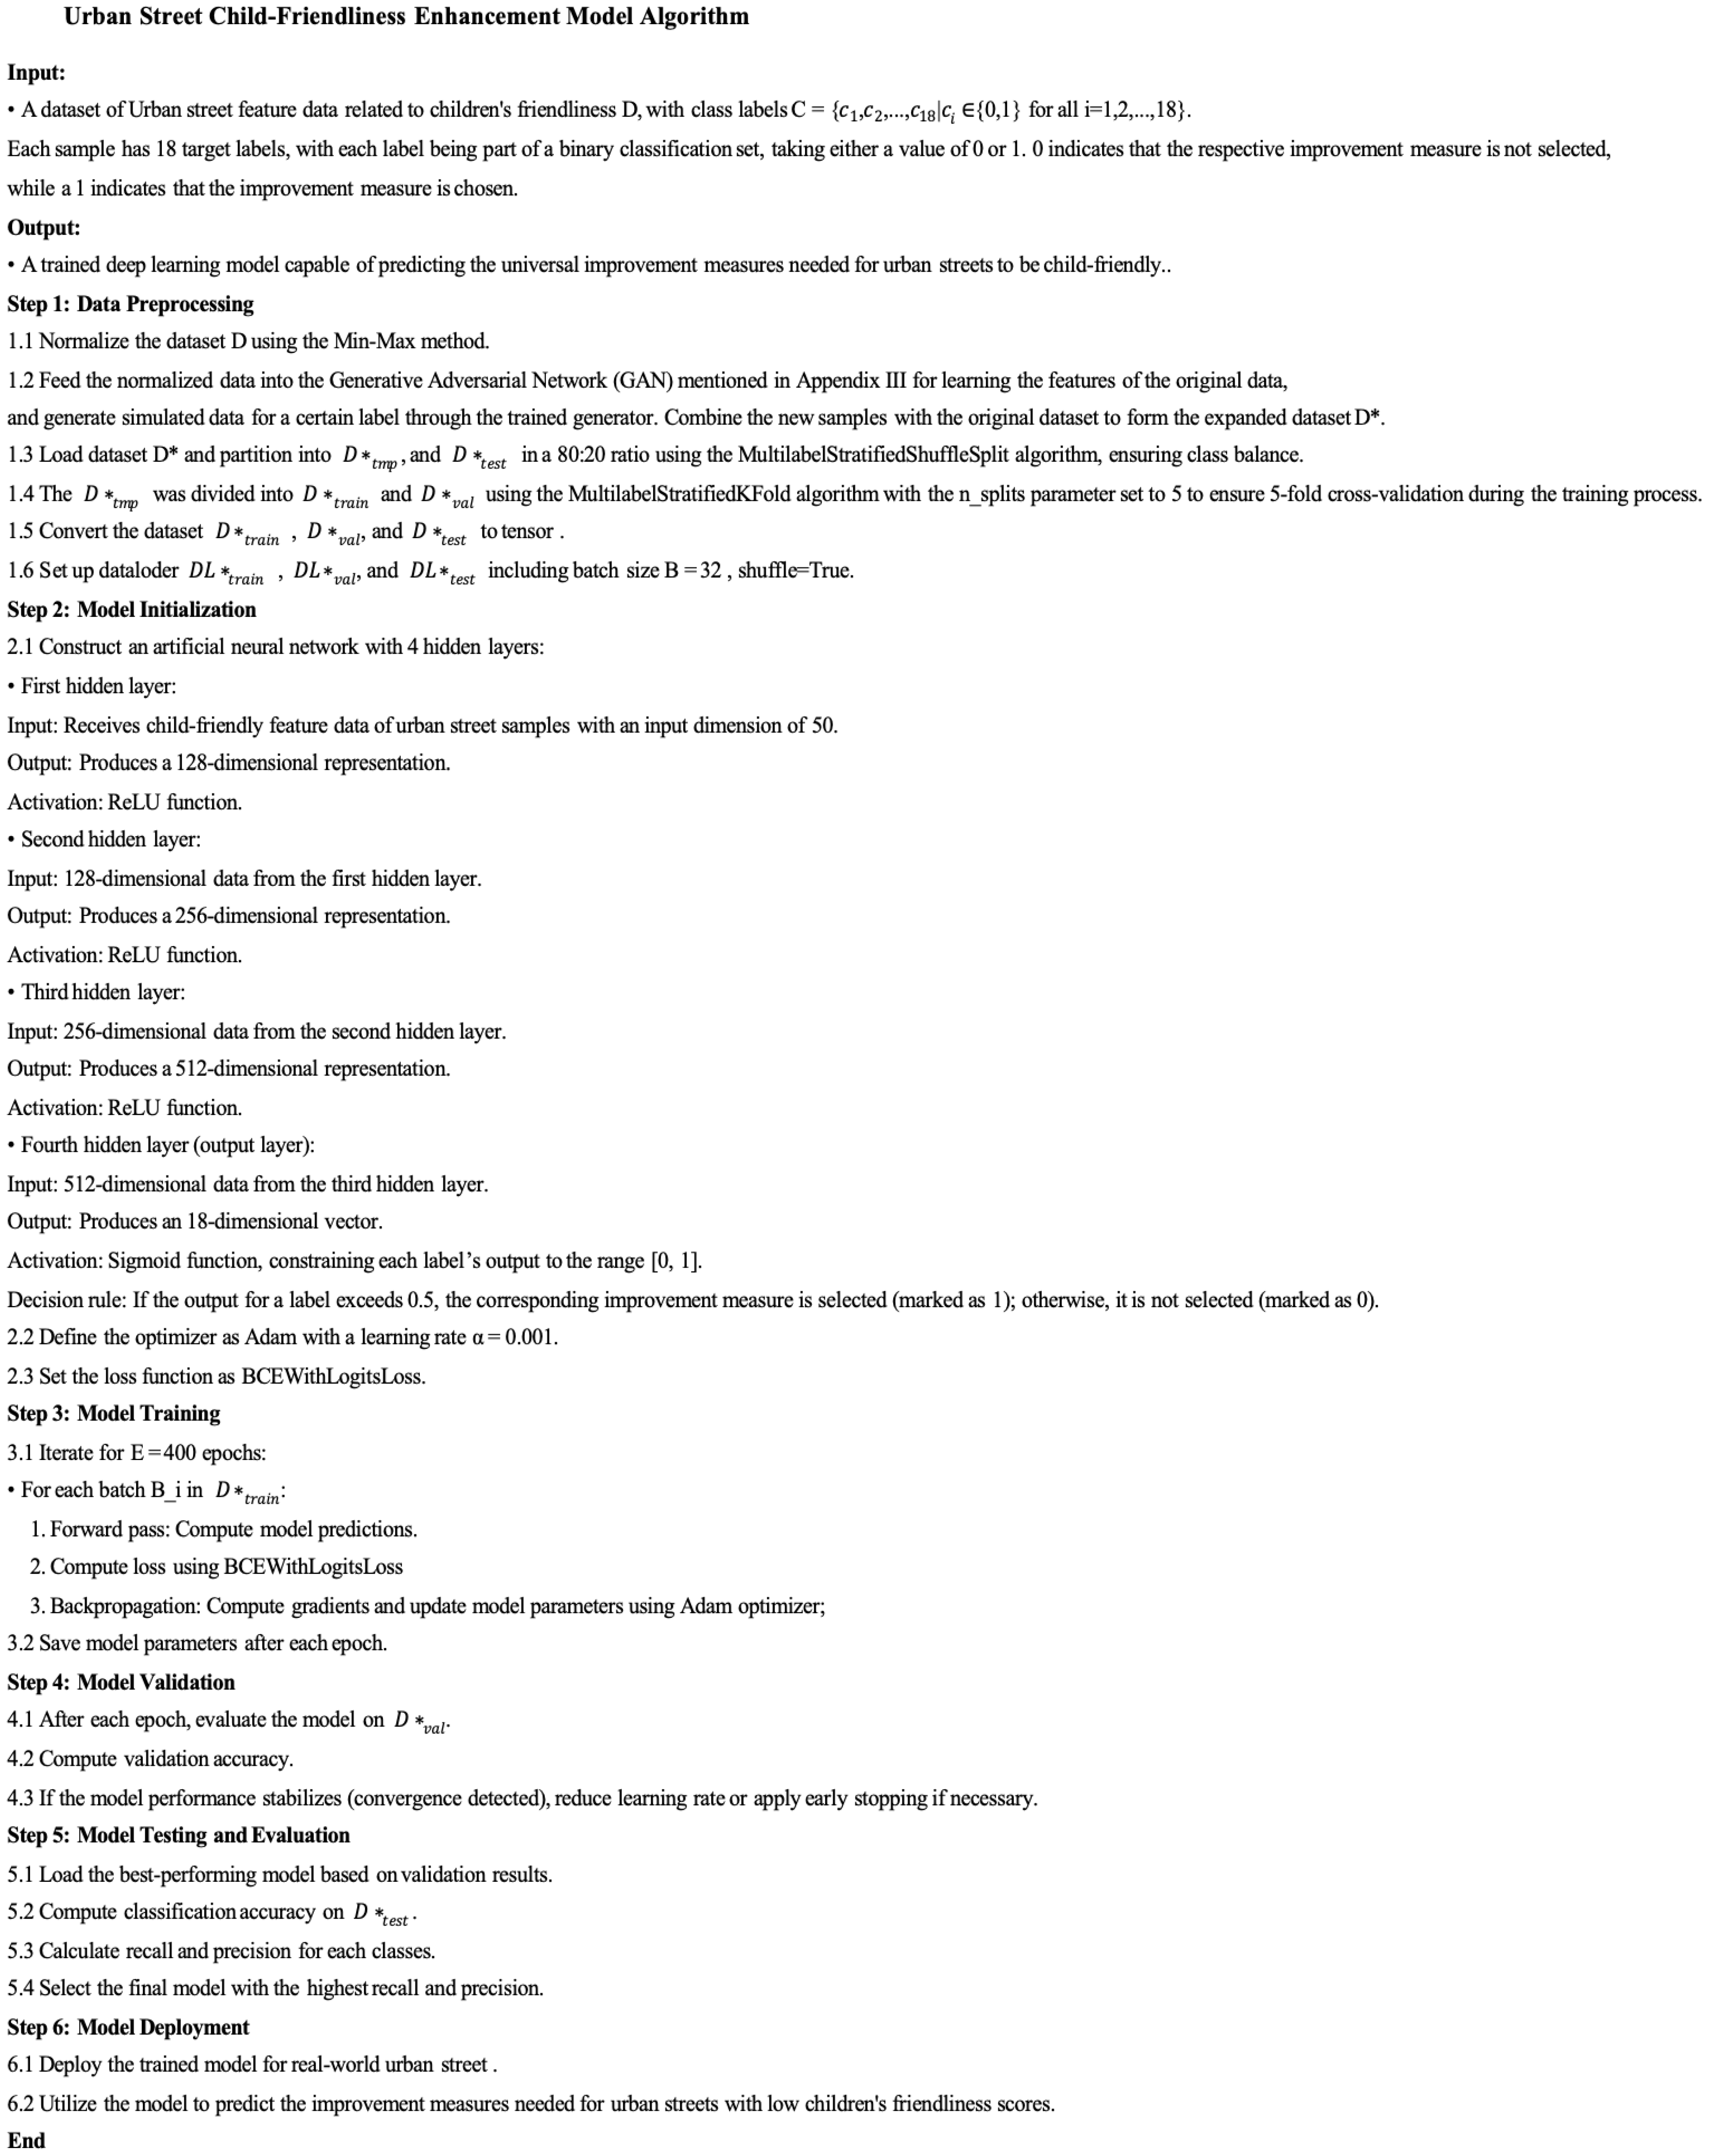
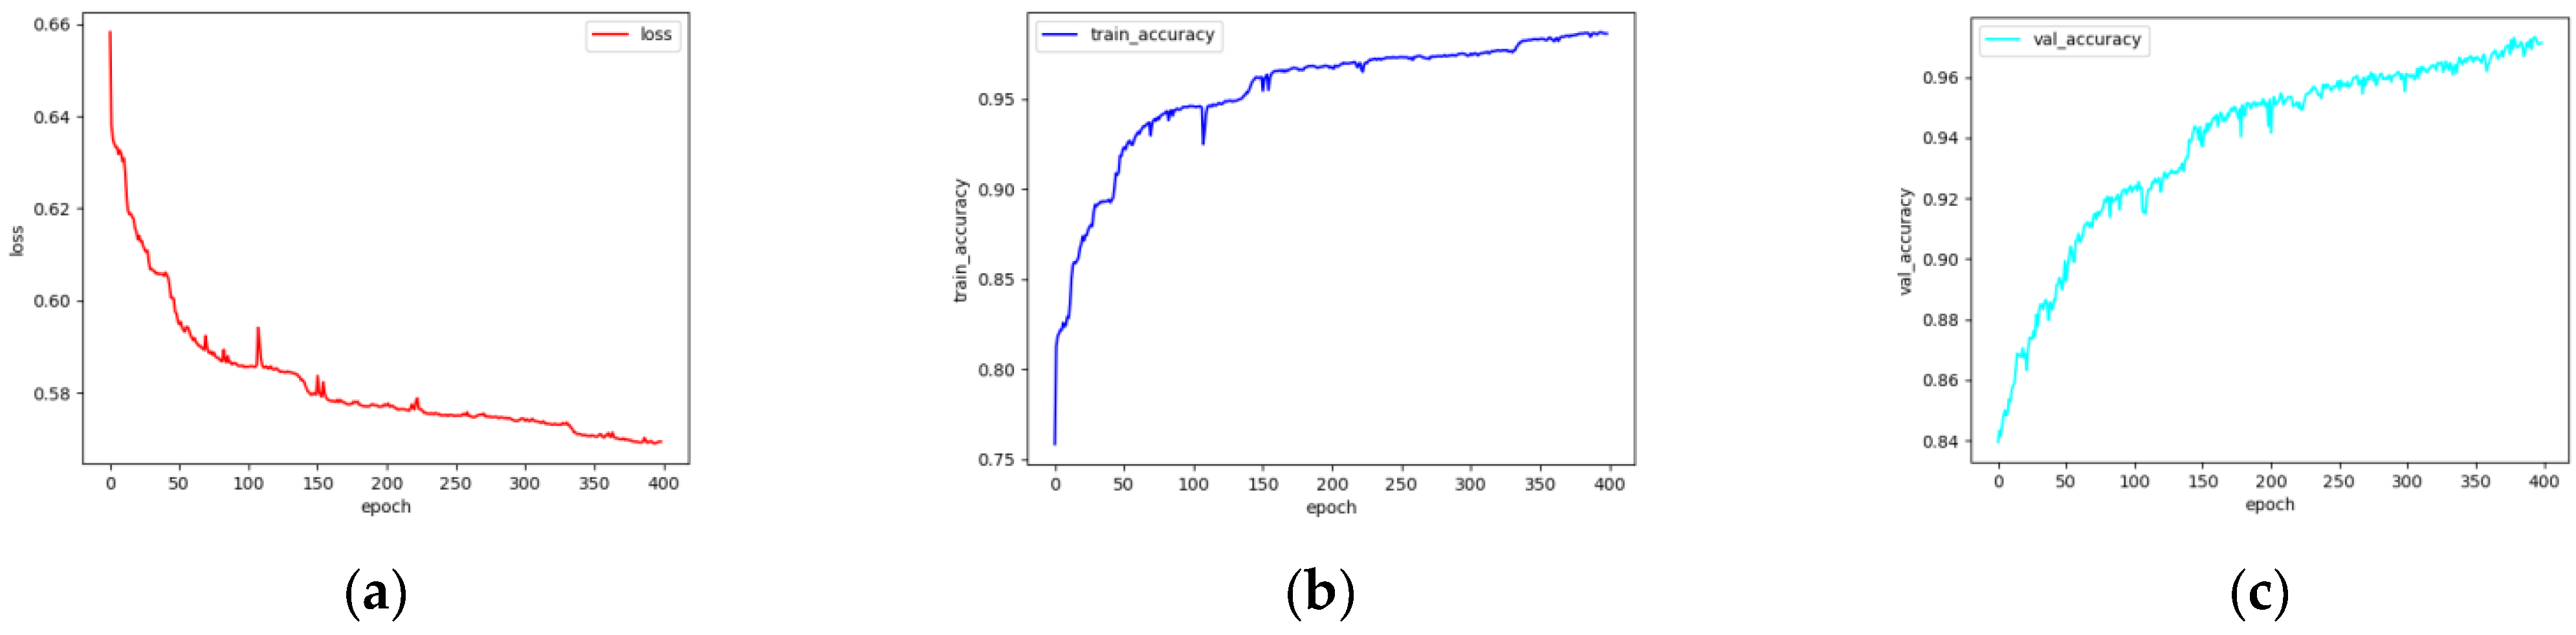
4.3. Design and Performance Evaluation of the Enhancement Model

For the enhancement model of the multi-label task, this study first uses the MultilabelStratifiedShuffleSplit algorithm to divide the dataset of 4134 samples into an 80% temporary dataset and a 20% test set. Then, the MultilabelStratifiedKFold algorithm (with the n_splits parameter set to 5) is applied to the temporary dataset to further divide it into an 80% training set and a 20% validation set, thereby completing 5-fold cross-validation of the model. During each dataset division, it is necessary to ensure that the distribution proportions of different categories of data remain consistent across the datasets.
The enhancement model serves as a multi-label 18-class classification model, aiming to predict universal improvement measures for urban street child-friendliness based on input data related to child-friendly urban streets (Appendix E). To ensure rapid convergence and high accuracy on the validation set, this study, through repeated experimentation, designed the model’s network architecture and training parameters as follows.
For the network architecture, the model consists of four hidden layers. The first hidden layer receives urban street sample data, followed by a ReLU activation function. This layer has an input size of 50 and an output size of 128. The second hidden layer takes the output from the first hidden layer, also followed by a ReLU activation function, with an input size of 128 and an output size of 256. The third hidden layer processes the output from the second hidden layer, again using a ReLU activation function, with an input size of 256 and an output size of 512. The fourth hidden layer takes the output from the third hidden layer, applies a sigmoid function, and produces the final results, ensuring outputs are constrained within [0, 1]. If the output for a particular label exceeds 0.5, the corresponding improvement measure is selected and marked as 1; otherwise, it is unselected and marked as 0. This layer has an input size of 512 and an output size of 18.
For the initial training hyperparameters, this study sets the batch size to 32, the optimizer to Adam, the learning rate to 0.001, the loss function to BCE With Logits Loss, and the total number of training epochs for each cross-validation to 400. After each epoch, the model parameters are saved, and performance is evaluated on the validation set to monitor the model’s convergence and generalization ability. Once training is completed, the model with the best overall performance on the training and validation sets is tested on the test set to assess its generalization capability, ensuring robust predictive performance on unseen data. The final validated model can then be applied to urban streets with low child-friendliness scores to predict the necessary improvement measures.
The training and validation results are presented in Figure 3. On the training set, both the loss and accuracy curves stabilized after approximately 150 epochs, indicating convergence. The validation accuracy curve exhibited more fluctuations compared to the training curve, but both followed a similar upward trend, demonstrating consistency in performance. After 5-fold cross-validation training, the model achieved a minimum average loss value per sample (each containing loss values for 18 labels) of 0.56904 on the training set, while reaching peak average label-level accuracy (accuracy per label per sample) of 98.70% and 97.32% on the training and validation sets, respectively. These results confirm that the model exhibits strong learning capacity and generalization ability.
On the test set, this study selected the model with the best overall performance on the training and validation sets for performance evaluation. In addition to reporting overall label-level accuracy, the study computed the recall and precision for each of the 18 enhancement measures to provide a more comprehensive evaluation of generalization performance. As shown in Table 8, the model achieved an overall accuracy of 97.28%, demonstrating high robustness. Furthermore, both recall and precision exceeded 90% for all enhancement measures, indicating the model’s ability to accurately identify relevant improvement strategies for different urban street contexts.
However, it is important to note that the predicted enhancement measures are general-purpose recommendations, serving as guidelines for improving street-level child-friendliness. When applying the model to specific urban streets, these recommendations should be further refined and contextualized based on local spatial features and environmental conditions, to formulate tailored intervention strategies.

5. Practical Application

To demonstrate the application of the urban street child-friendliness assessment and enhancement system in unobserved urban streets of Shanghai, this study selected the Siping Subdistrict in Yangpu District, Shanghai, as a representative case study. This area was not included in the training, validation, or test sets, making it a suitable candidate to assess real-world generalizability.
A total of 49 urban streets within the Siping Subdistrict were delineated. Based on the requirements of the evaluation system, child-friendliness-related features were collected separately for both sides of each street, resulting in 98 samples. Each sample was assigned a unique identifier for reference (Figure 4).
The real-world application of the automated evaluation and enhancement system in the Siping Subdistrict follows these steps: the collected feature data for each urban street sample were normalized using Min–Max normalization, following the min and max values established during model development. The normalized data were then input into the child-friendliness evaluation system, which employed the deep learning-based evaluation model to generate a child-friendliness score for each sample. This resulted in the creation of a child-friendliness evaluation matrix for the urban streets in the Siping Subdistrict (Table 9), allowing for a precise visualization of how child-friendliness is distributed across the area’s streets.
The primary objective of the evaluation system is to identify streets with lower scores—specifically those rated 1 or 2, which indicate poor child-friendliness. The samples corresponding to these low scores were again normalized using Min–Max normalization and then fed into the enhancement system. This system used the trained enhancement model to predict a set of general-purpose improvement measures that could address the deficiencies in child-friendliness (Table 10). These recommendations serve as a reference framework for future street-level improvements. However, street-specific interventions must be tailored to the unique spatial and environmental characteristics of each location.
Analysis of the low-scoring streets in the Siping Subdistrict revealed several recurring issues, including poor walkability, traffic safety hazards, lack of engaging public spaces, and insufficient spatial interactivity. Most streets exhibited inadequate pedestrian environments, such as narrow or damaged sidewalks, illegal parking by motorized and non-motorized vehicles, and sidewalk congestion. Some streets, such as 173b and 142a, faced heightened traffic safety risks due to heavy traffic volumes, excessive vehicle speeds, and the absence of physical separation between pedestrian and vehicular flows.
Other streets, such as 031b and 181a, suffered from monotonous urban design, characterized by a lack of visual diversity, homogeneous building functions, or absence of landscaping, thereby failing to attract children’s interest or encourage them to linger. Streets like 021b, 051b, 084b, and 111b lacked interactive or exploratory activity spaces, reducing children’s engagement to mere passage rather than meaningful interaction.
In response to these challenges, the enhancement mechanism proposed targeted interventions: for poor walkability, suggestions included sidewalk repairs, obstacle removal, regulation of illegal parking, addition of shade trees or canopies, installation of accessible infrastructure, and implementation of child-friendly navigational signage. For traffic safety issues, recommendations involved constructing physical barriers between sidewalks and traffic lanes, installing speed-calming devices, and improving pedestrian crossings. To address the lack of engaging environments, the system proposed introducing interactive landscaping, diversifying plant species, and incorporating child-oriented play facilities. To enhance spatial interactivity, proposed actions included creating street-edge activity zones and installing interactive public amenities.
It is important to emphasize that the enhancement system serves as a guiding tool rather than a prescriptive solution. Specific improvement strategies must consider the unique context of each street. For instance, street 111b was found to suffer from multiple issues, including poor walkability, lack of visual interest, and low interactivity. The enhancement system suggested improvements such as removing sidewalk obstacles, repairing pavement, adding greenery, creating activity zones, and providing guardian-friendly amenities.
However, some recommendations require contextual adaptation. For example, the lack of shading on 111b leads to discomfort during summer walks. Since the sidewalk is narrow, planting shade trees could further restrict movement. In this case, installing retractable shading devices on adjacent buildings would be a more viable solution. Similarly, to address limited space for playful or interactive features, instead of large installations, enhancements such as interactive public art, educational display windows, and colorful building facades may offer creative and context-sensitive ways to boost engagement and interactivity.

6. Discussion

Field investigations and model-based evaluations reveal both convergences and divergences among different stakeholders regarding the assessment of child-friendliness in urban streets. Children prioritize spatial experiences that are engaging and interactive; caregivers are more concerned with safety and comfort; while planners and policy-makers focus on the operational feasibility of improving children’s well-being through spatial structure, resource allocation, and traffic governance mechanisms.
Safety is the most fundamental and indispensable prerequisite for designing child-friendly streets. Due to their limited cognitive and response capabilities, children often struggle to effectively assess risks in complex urban traffic environments [47]. Their demand for spatial safety tends to manifest in specific and intuitive elements—for example, the presence of physical barriers separating pedestrians from vehicles, absence of sight-blocking obstacles, and clearly demarcated pedestrian–vehicle pathways. Caregivers, in contrast, emphasize the “controllability” of space, including whether they can maintain visual contact with the child, whether there is sufficient space for avoidance and maneuvering, and whether the environment contains unpredictable traffic behaviors such as illegal driving or red-light violations. Urban planners and policy-makers must address safety from a systems governance perspective, by coordinating traffic management and spatial design through interventions such as speed-reduction zones, improved intersection visibility, and vehicle flow diversion. This study leverages image recognition models to extract potential risk factors embedded in street views and establishes a quantifiable Child Safety Index, supporting municipal authorities in prioritizing interventions on high-risk segments and advancing a “child-centered” traffic governance framework.
Comfort serves as a crucial psychological and physiological basis for children’s willingness to linger and engage in street spaces. Children exhibit lower tolerance for environmental discomfort; extreme temperatures, intense sunlight, or poorly scaled spatial layouts may quickly lead to fatigue, reducing their duration of outdoor activity [48]. Elements such as “is there shade”, “is the ground easy to walk on”, or “are there places to sit” significantly influence children’s sense of closeness to street environments [49]. Caregivers also have practical concerns regarding comfort—for instance, whether strollers can move smoothly, whether seating is of appropriate height, or whether there are shelters to protect from wind and rain. In the language of urban planning, enhancing comfort entails integrating children into the infrastructure adaptation system, promoting a shift from streets designed primarily for commuting adults toward livable neighborhoods that accommodate diverse user needs. Through image-based analysis, this study quantitatively identifies key visual features that influence comfort—such as greenery density, shading devices, and spatial scale—and thereby supports the development of more targeted street enhancement models.
Playfulness functions as a motivating factor that stimulates children’s desire to participate in and explore urban spaces. Driven by natural curiosity, children often engage with the street in a playful, exploratory manner. Their perception of what is “fun” stems from interactive installations, whimsical graphics, vibrant colors, and even hidden nooks that invite discovery [50]. Playfulness not only enhances children’s sense of belonging in the city but also serves as a vital catalyst for their autonomous activity and physical development. However, in current street design practices, playful elements are frequently treated as non-essential or superficial—reduced to cartoon-themed decorations or temporary installations without systemic planning or continuity [51]. Our findings reveal that street segments with high playfulness scores typically feature a more diverse visual language, open spatial boundaries, and complex facility configurations—attributes that correspond with areas of high child activity. Thus, playfulness should not be viewed as an optional enhancement, but rather as a core component of urban street design, marking a fundamental shift from streets as mere “corridors” to streets as dynamic “scenes”.
Interactivity reflects the street’s central role in children’s socialization processes. Beyond individual physical activity, the street serves as a medium through which children engage with others, learn social norms, develop cooperative skills, and build a sense of collective identity [25]. A well-designed interactive street should provide opportunities for peer interaction and neighborhood engagement, while also encouraging intergenerational community participation. Our field study indicates that streets equipped with shared facilities for group use, ample social spaces, and frequent community events tend to elicit higher levels of child participation and longer dwell times. In contrast, areas that rely solely on enclosed playgrounds or static green spaces often fail to fully support children’s social agency within the urban fabric. From a governance standpoint, fostering interactivity requires institutional design and community co-management, such as organizing family-friendly activities, establishing micro-spaces within neighborhoods, and institutionalizing child participation through platforms like Children’s Councils [52]. Using the street behavior recognition and path aggregation algorithms developed in this study, we can accurately identify high-frequency interaction zones and behavioral voids, thereby providing a robust data foundation for improving social connectivity and enhancing the quality of children’s street-based social environments.

7. Conclusions

This study takes urban streets in Shanghai as an example, aiming to propose a universal method for constructing an intelligent assessment and enhancement system for child-friendliness of urban streets. By deconstructing the street environment into four core dimensions—safety, comfort, playfulness, and interactivity—and incorporating intergenerational differences in spatial perception, a multi-layer neural network model was constructed. This model enables the automatic identification and comprehensive scoring of key visual elements in street scenes, effectively capturing the lived experiences of children in urban street spaces.
Building on this foundation, the study further outlines a pathway for translating assessment outcomes into policy-making and urban practice. First, at the institutional level, it advocates for the standardization and legal integration of child-friendliness indicators, using evaluation results as critical references for street renewal and resource allocation. Second, from a governance perspective, a collaborative structure involving children, caregivers, communities, and governments should be established to facilitate children’s participation in spatial decision-making. Mechanisms such as “Children’s Planning Councils” and “Co-Creation of Child Spaces” are proposed to institutionalize the expression of children’s voices in urban design. Additionally, the study recommends the establishment of dedicated funding streams and pilot street projects to support multi-scalar, multi-regional experimental interventions that explore the adaptability of strategies across diverse urban contexts. On the technological front, the system should be integrated with urban big data platforms to construct visualized friendliness maps and behavioral feedback mechanisms, thereby supporting refined urban governance and public engagement. Finally, the study calls for a fundamental transformation of streets—from mere transit corridors into multifunctional public realms that integrate mobility, rest, social interaction, and play, placing children at the center of urban spatial reform.
The key contributions of this study are as follows: (1) This study pioneers the development of a deep learning-based system for evaluating and enhancing the child-friendliness of urban streets. Through feature extraction of streets and perceptual label training, the system enables automatic recognition and dimensional scoring of key spatial elements within streets. This provides a scalable and transferable technical approach to smart perception of child-friendly urban environments. (2) This study introduces an intergenerational collaborative perspective by systematically integrating the heterogeneous spatial behaviors and subjective perceptions of children, caregivers, urban planners, and policy-makers. It reveals distinct emphases across stakeholder groups in relation to safety, comfort, playfulness, and interactivity. This enriches the understanding of “diverse users” in child-friendly space research and enhances the assessment system’s applicability to real-world social behaviors and spatial practices.
Nonetheless, several limitations remain. First, this study uses urban streets in Shanghai as an example with the aim of proposing a general method for constructing an intelligent assessment and enhancement system for child-friendliness of urban streets. This method can be extended to different city types and cultural contexts in the future to build automated assessment systems for children’s perception of street walking spaces in various cities. Additionally, the time span of the samples surveyed in this study is limited. Considering the temporal variations in street perception, the method can also be extended to urban streets in different seasons. Second, while the deep learning model achieves high evaluation accuracy, its black-box nature limits interpretability, potentially hindering transparency in policy communication and public engagement. Third, the current model focuses mainly on school-age children’s spatial perceptions and lacks targeted recognition of the distinct needs of preschoolers and adolescents.
Future research could be advanced in three key directions: (1) Data Expansion—broaden the scale and geographic diversity of the dataset by incorporating varied city types and cultural contexts; (2) Model Interpretability—enhance model transparency through rule-based reasoning and visual analytics to strengthen its utility for policy guidance; (3) Age-Specific Modeling—develop fine-grained sub-models for different age groups, integrating dynamic behavioral data and emotional responses to enable more precise modeling of children’s spatial adaptability.

Author Contributions

Conceptualization, X.M. (Xudong Miao); methodology, X.M. (Xudong Miao); software, X.M. (Xudong Miao); validation, X.M. (Xudong Miao); formal analysis, X.M. (Xudong Miao) and S.J.; investigation, X.M. (Xudong Miao), S.J., J.Y., X.M.(Xinyue Miao), and J.Q.; resources, H.T., X.M. (Xudong Miao), S.J., J.Y., X.M. (Xinyue Miao), and J.Q.; data curation, X.M. (Xudong Miao); writing—original draft preparation, X.M. (Xudong Miao) and S.J.; writing—review and editing, X.M. (Xudong Miao) and S.J.; visualization, X.M. (Xudong Miao); supervision, H.T.; project administration, H.T.; funding acquisition, H.T. All authors have read and agreed to the published version of the manuscript.

Funding

This research was funded by the National Natural Science Foundation of China, grant number 52378034.

Institutional Review Board Statement

The study was conducted in accordance with the Declaration of Helsinki, and approved by the Institutional Review Board of the College of Architecture and Urban Planning, Tongji University, authorization number: 2024092301.

Informed Consent Statement

Informed consent was obtained from all subjects involved in the study.

Data Availability Statement

Data are contained within the article.

Acknowledgments

The authors would like to thank the children and other stakeholder groups who participated in this course for their support of this work, and gratefully acknowledge the editor and reviewers for the insightful comments and suggestions on the earlier version of this paper.

Conflicts of Interest

The authors declare no conflict of interest.

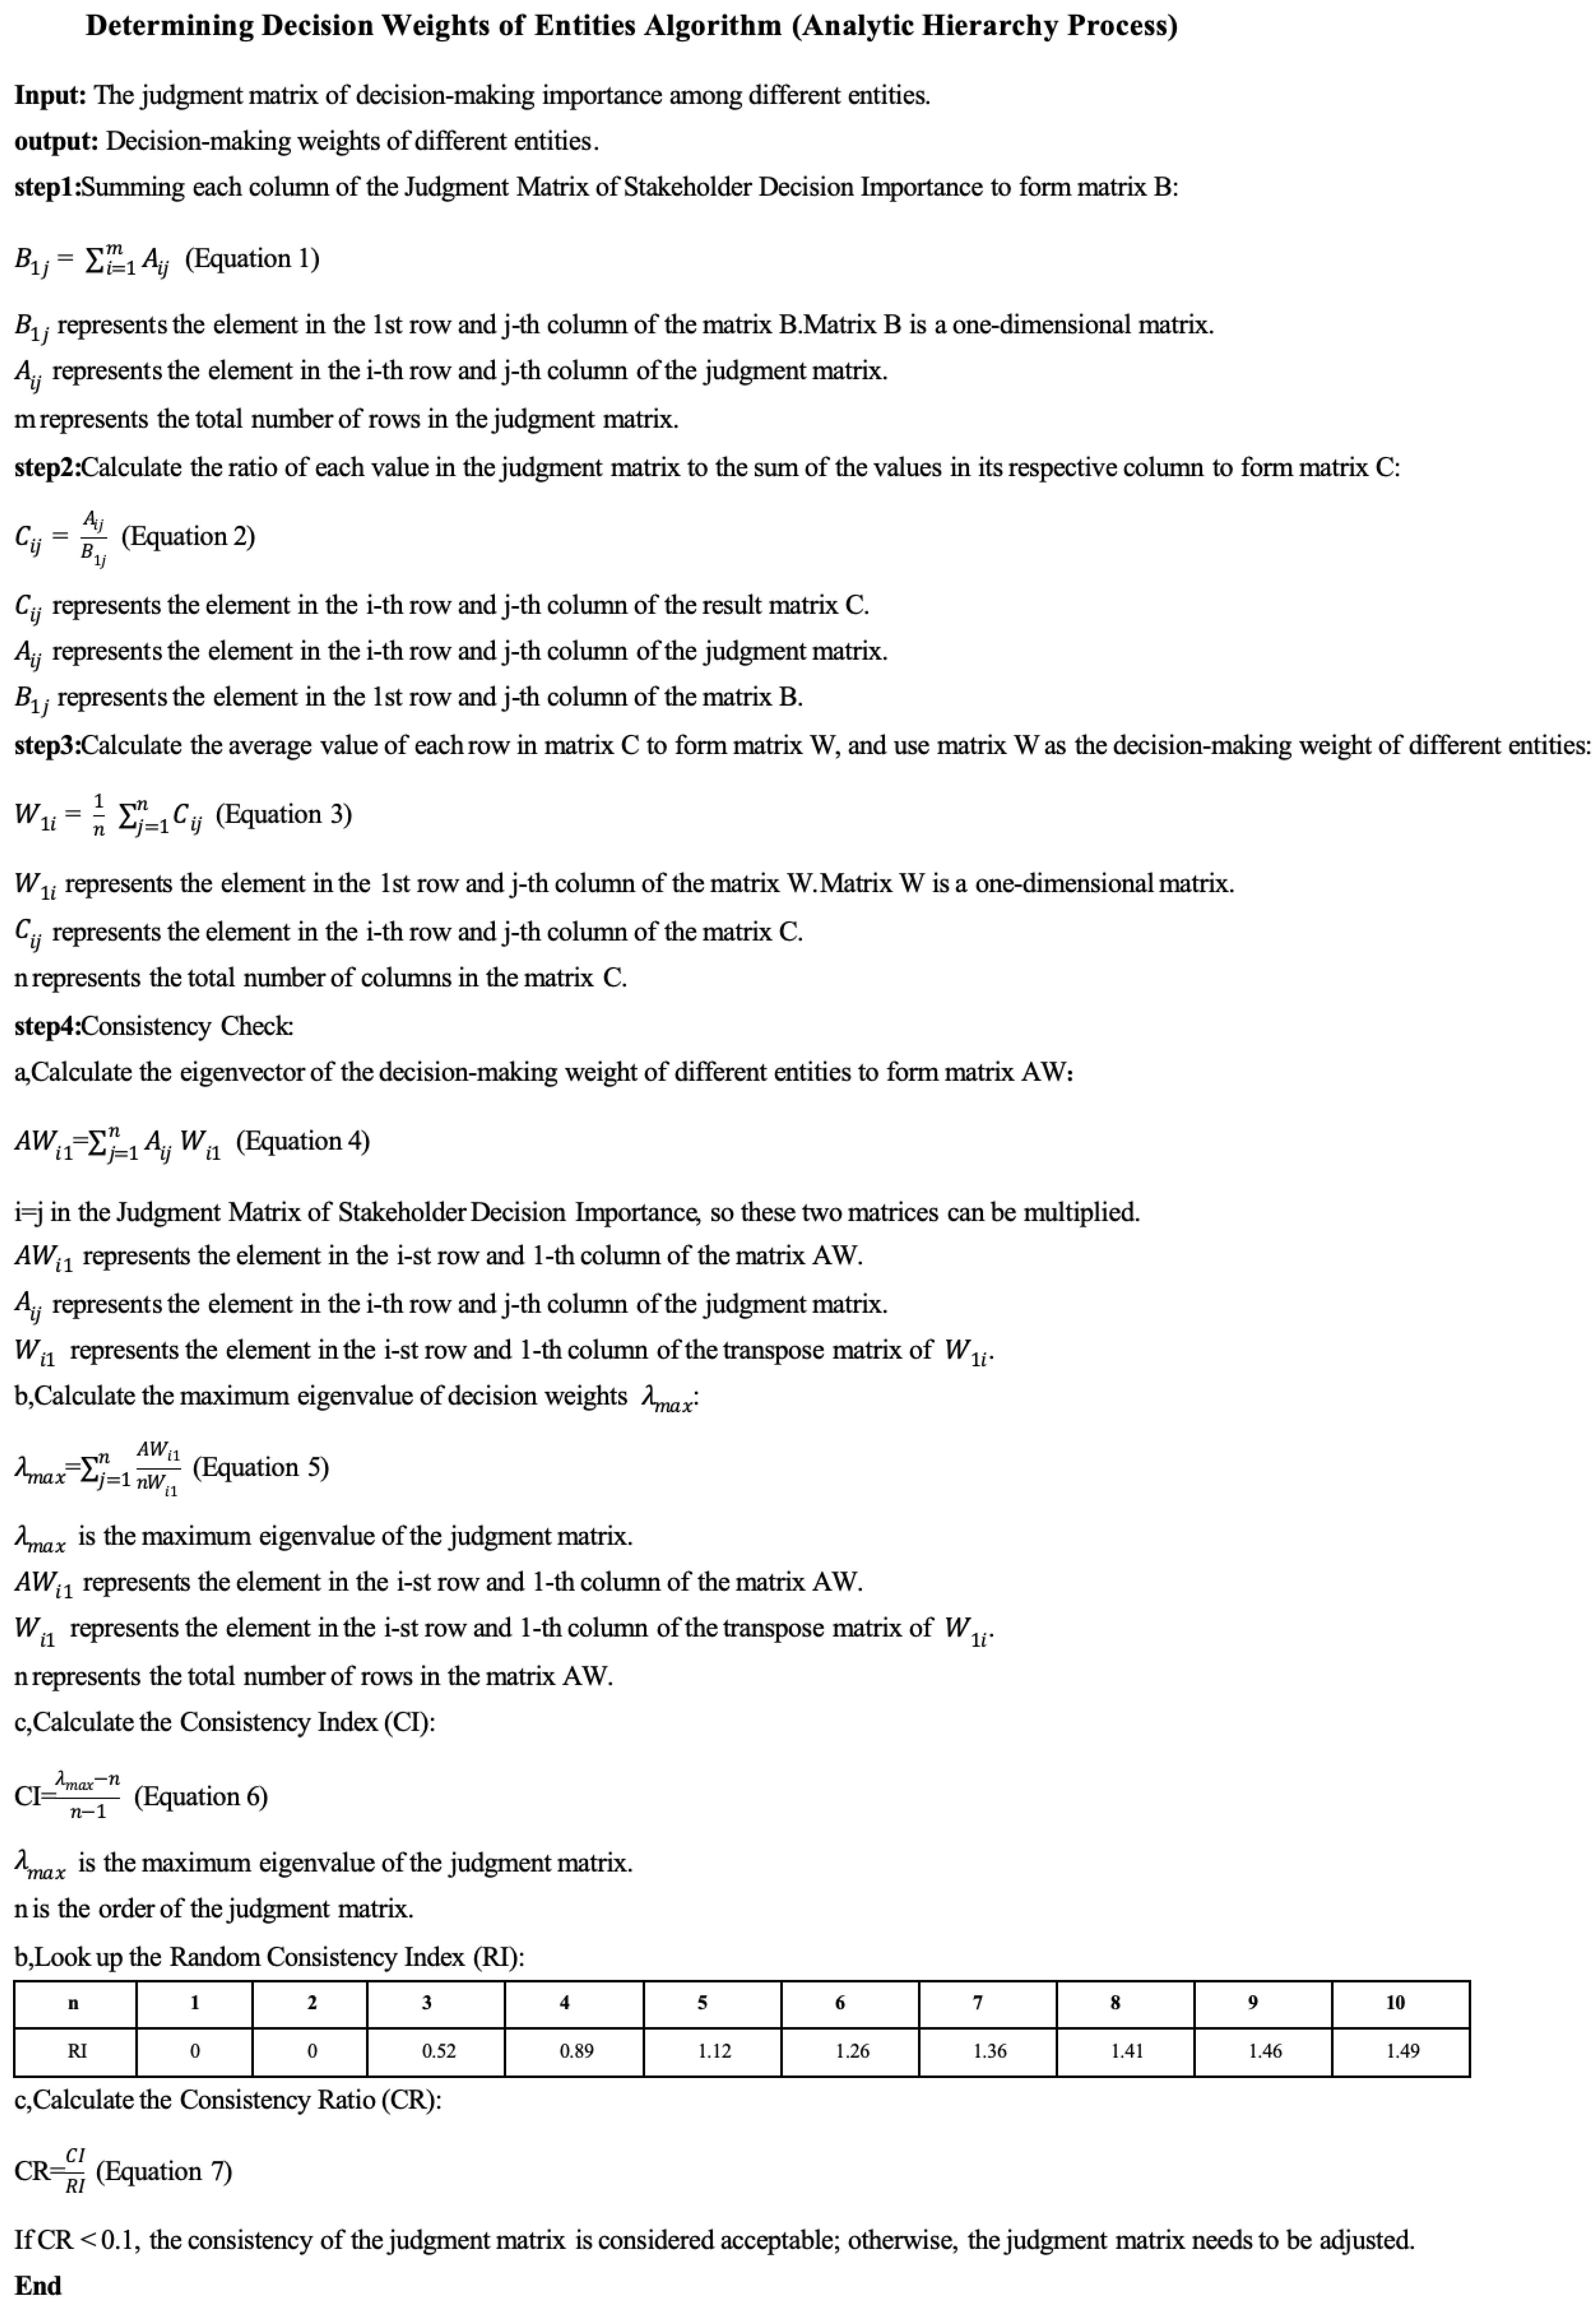
Appendix A. Determining Decision Weights of Entities Algorithm (Analytic Hierarchy Process)

Buildings 15 02291 i0a1

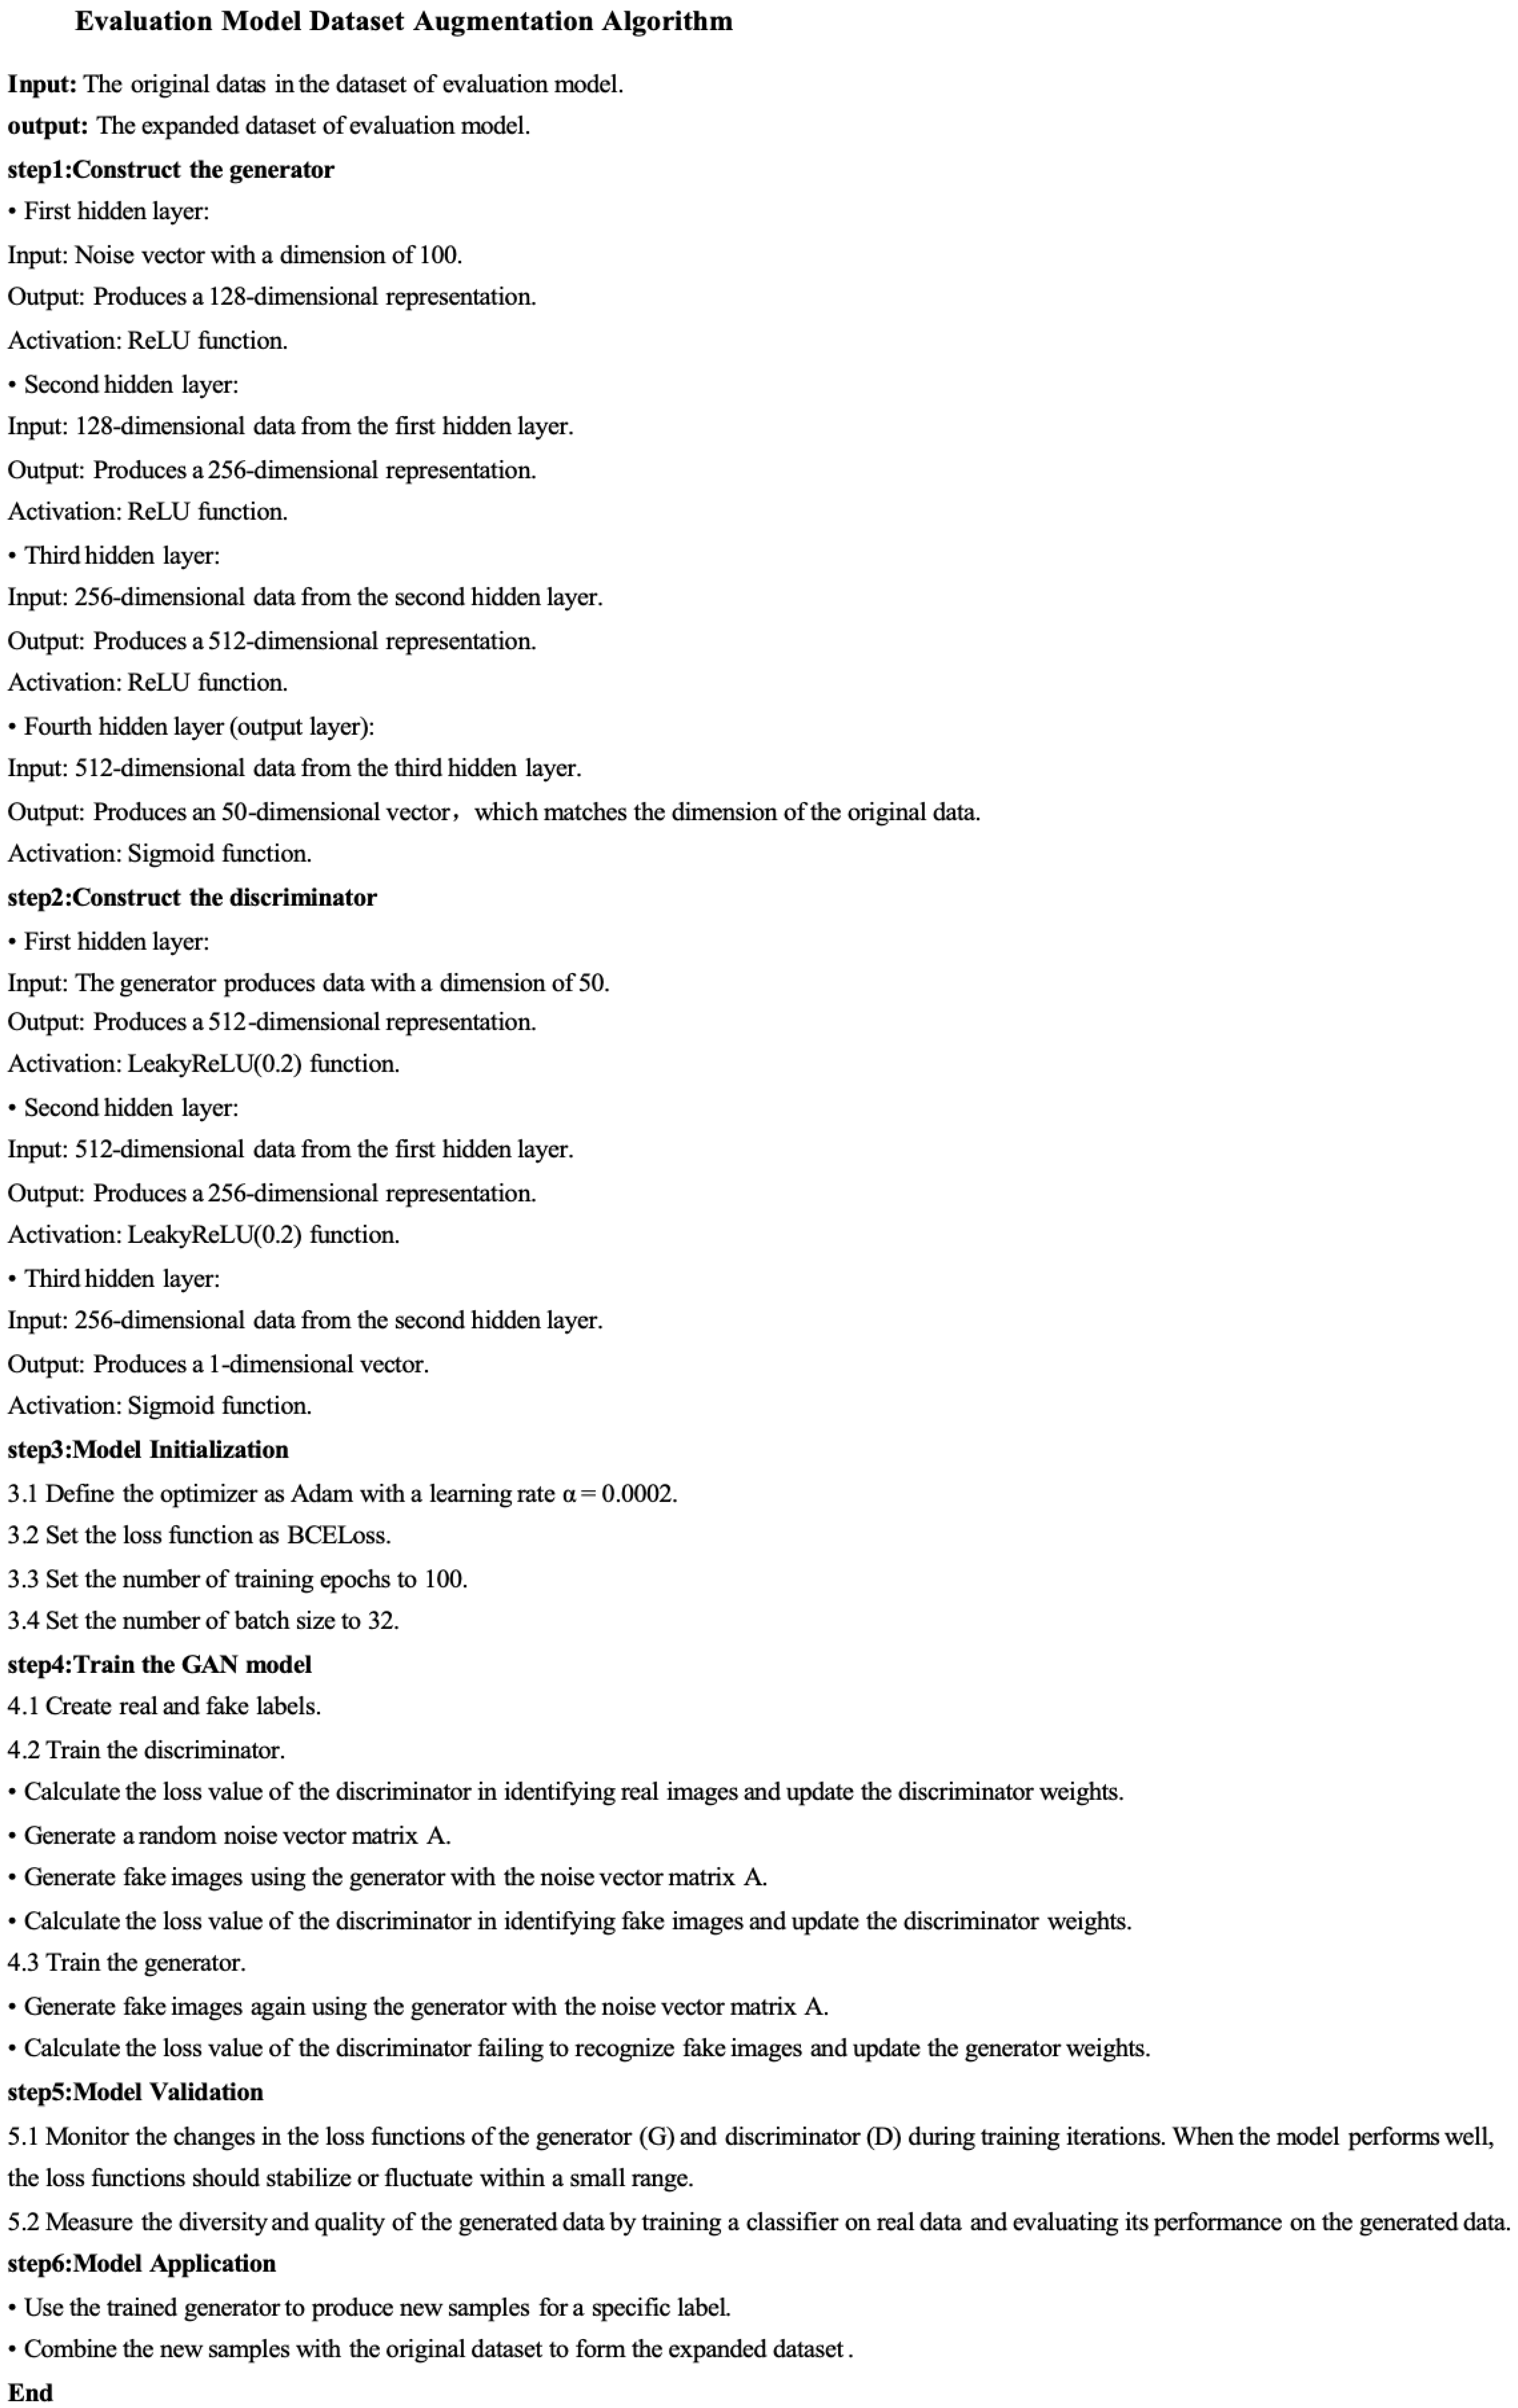
Appendix B. Evaluation Model Dataset Augmentation Algorithm

Buildings 15 02291 i0a2

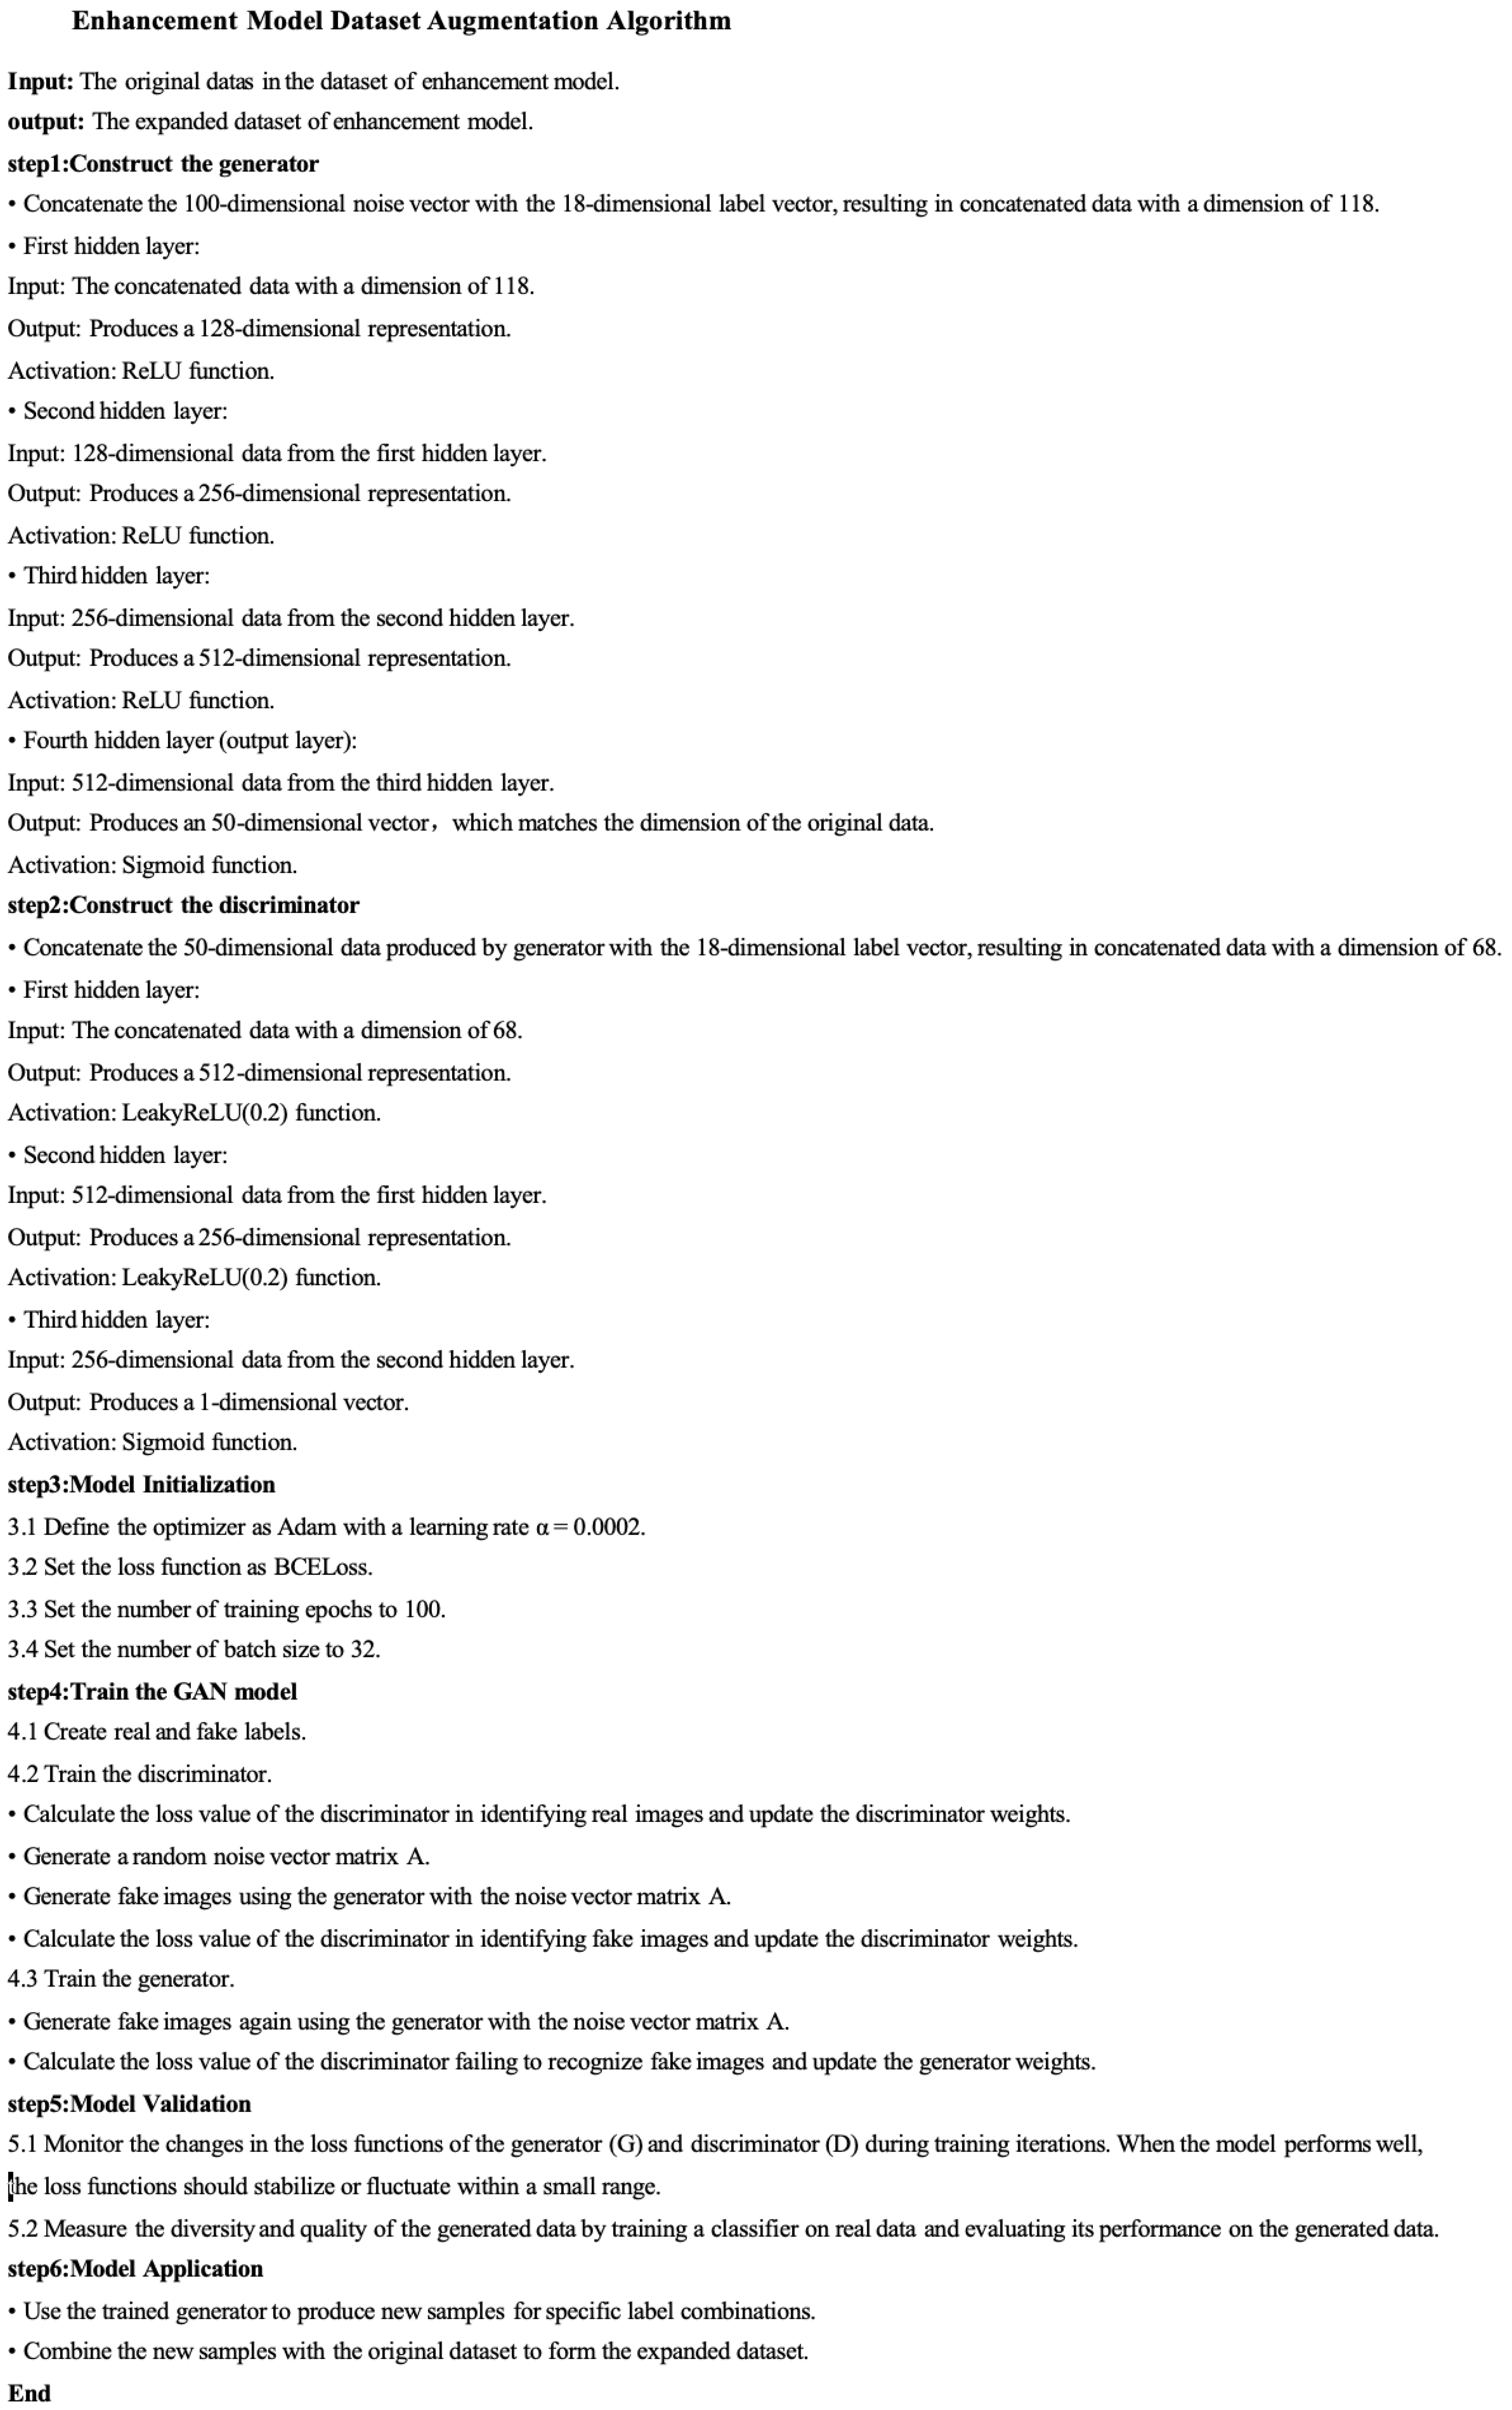
Appendix C. Enhancement Model Dataset Augmentation Algorithm

Buildings 15 02291 i0a3

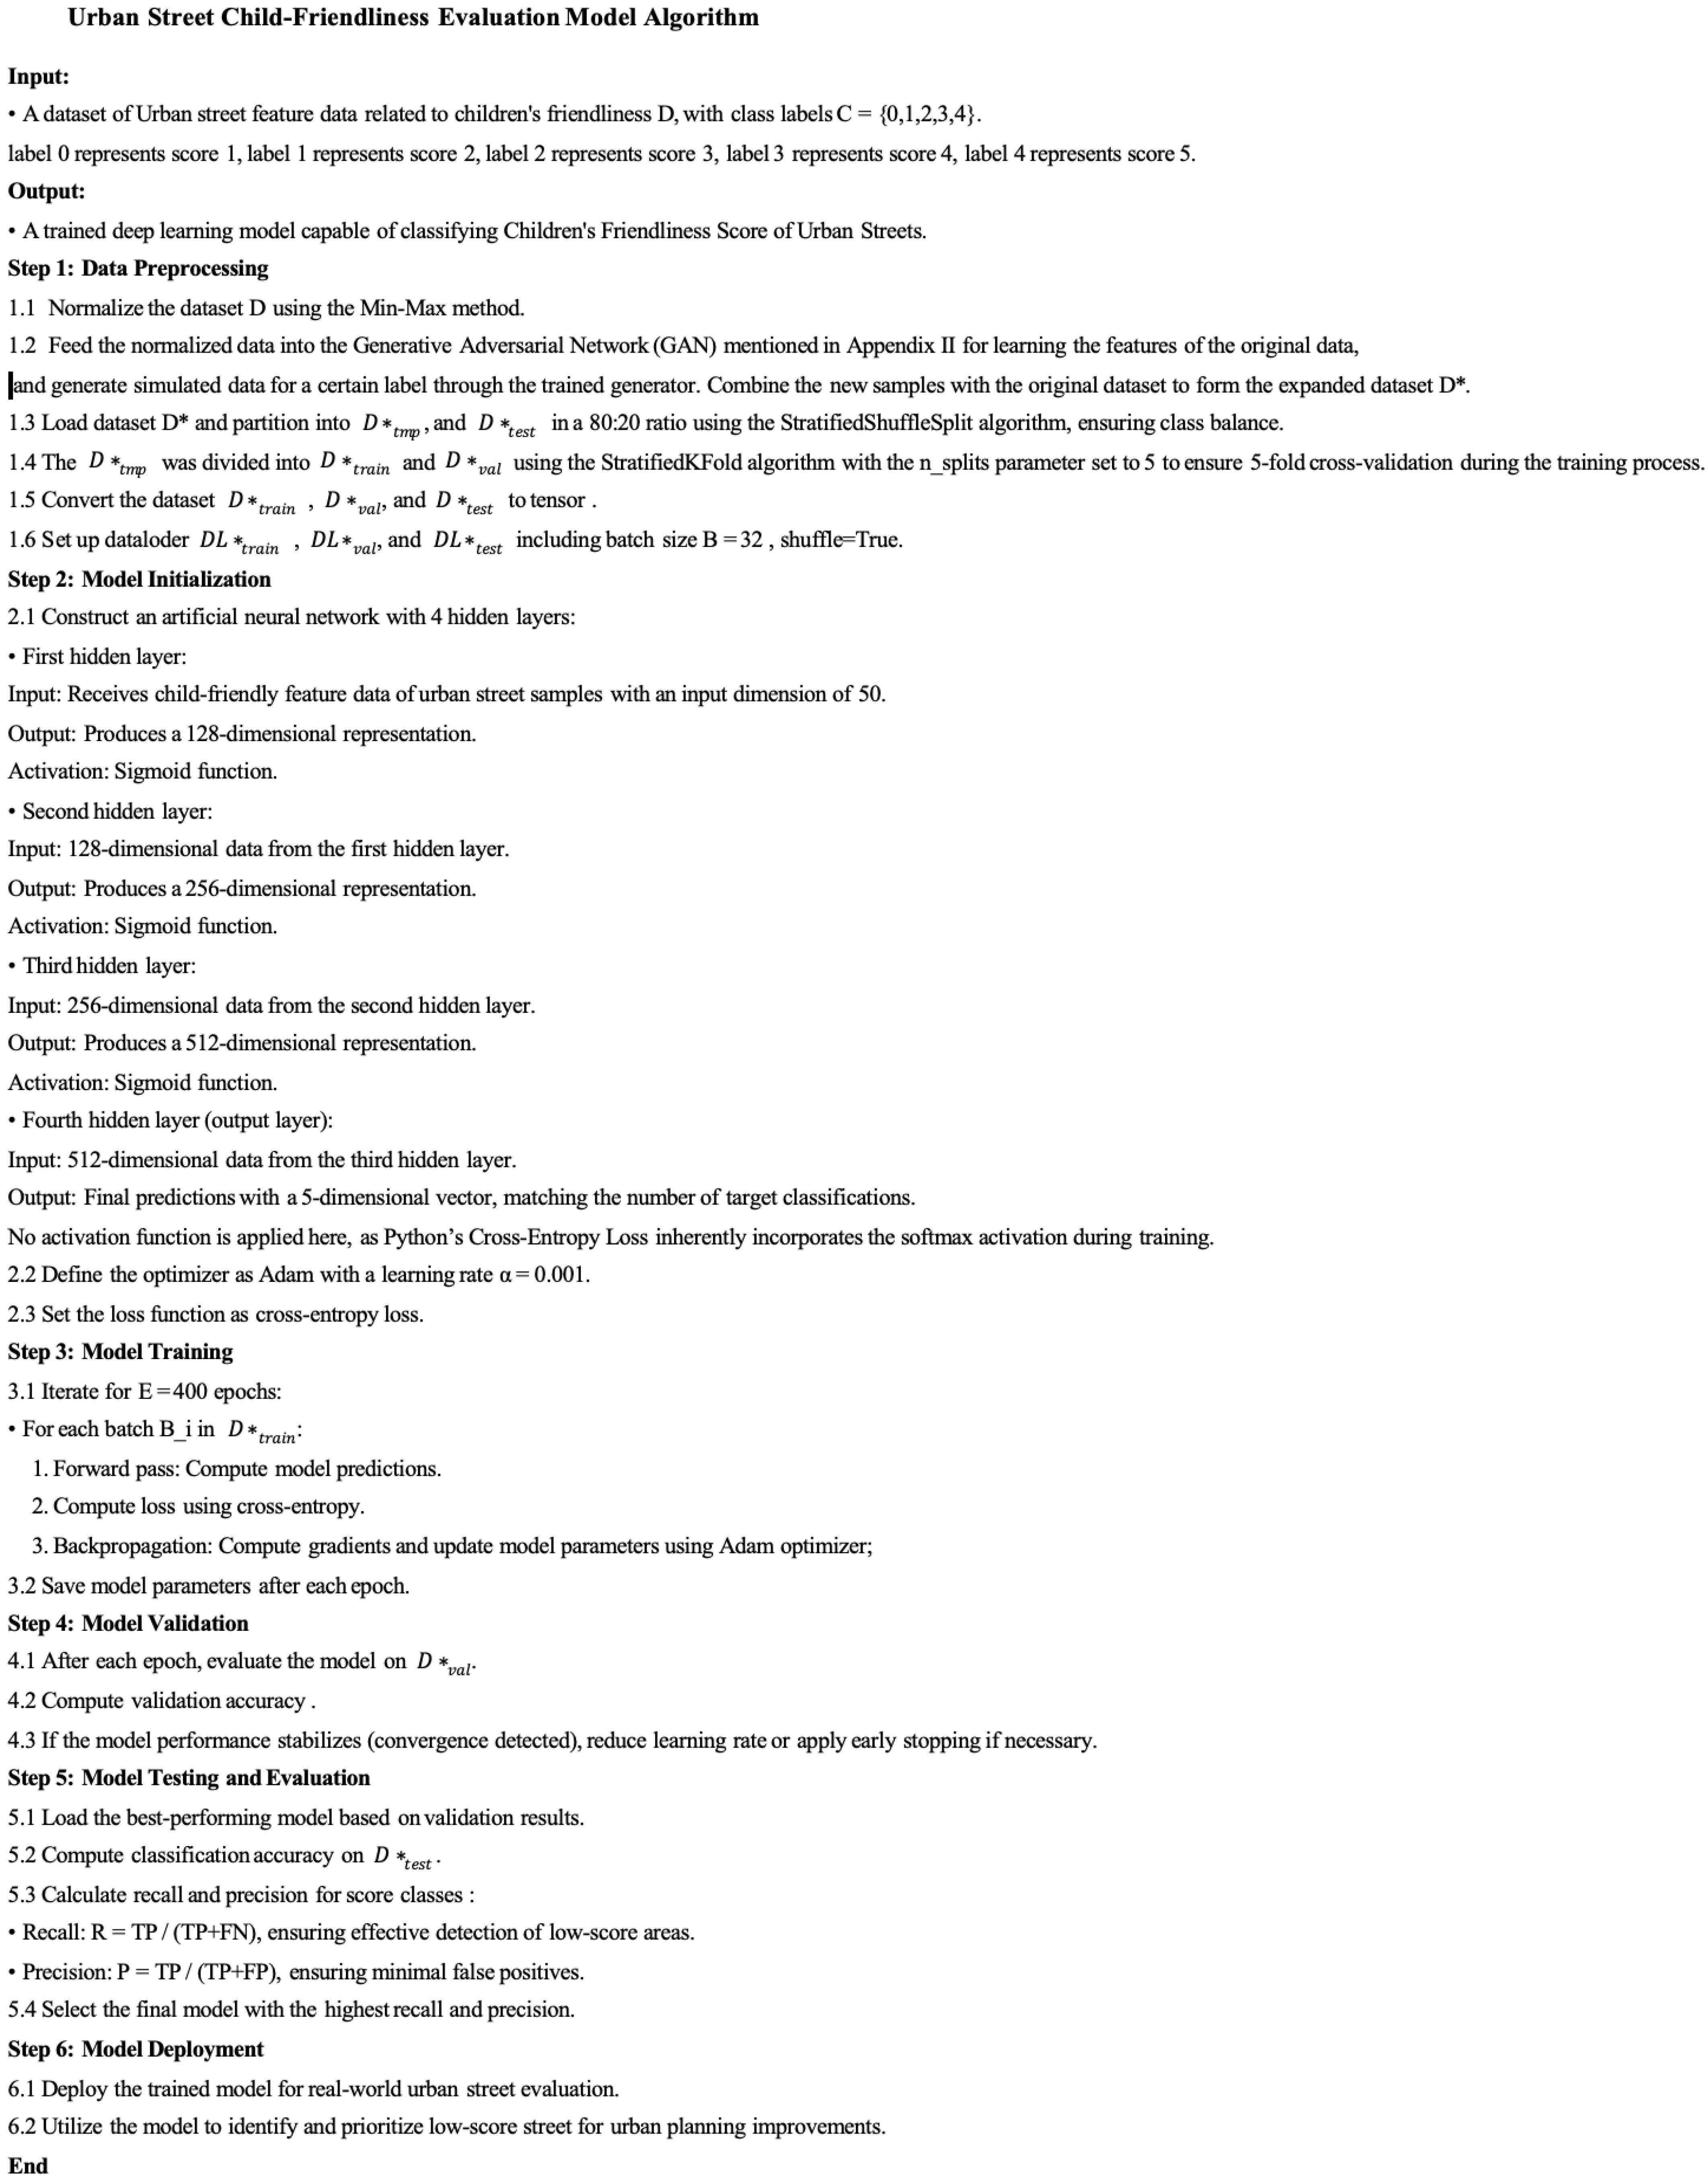
Appendix D. Urban Street Child-Friendliness Evaluation Model Algorithm

Buildings 15 02291 i0a4

Appendix E. Urban Street Child-Friendliness Enhancement Model Algorithm

Buildings 15 02291 i0a5

References

  1. Nasrabadi, M.T.; García, E.H.; Pourzakarya, M. Let children plan neighborhoods for a sustainable future: A sustainable child-friendly city approach. Local Environ. 2021, 26, 198–215. [Google Scholar] [CrossRef]
  2. Zhao, J.; Su, W.; Luo, J.C.; Zuo, J. Evaluation and Optimization of Walkability of Children’s School Travel Road for Accessibility and Safety Improvement. Int. J. Environ. Res. Public Health 2022, 19, 71. [Google Scholar] [CrossRef]
  3. Rigolon, A.; Toker, Z.; Gasparian, N. Who has more walkable routes to parks? An environmental justice study of Safe Routes to Parks in neighborhoods of Los Angeles. J. Urban Aff. 2018, 40, 576–591. [Google Scholar] [CrossRef]
  4. Brussoni, M.; Lin, Y.Y.; Han, C.; Janssen, I.; Schuurman, N.; Boyes, R.; Swanlund, D.; Mâsse, L.C. A qualitative investigation of unsupervised outdoor activities for 10-to 13-year-old children: “I like adventuring but I don’t like adventuring without being careful”. J. Environ. Psychol. 2020, 70, 101460. [Google Scholar] [CrossRef]
  5. D’Haese, S.; Vanwolleghem, G.; Hinckson, E.; De Bourdeaudhuij, I.; Deforche, B.; Van Dyck, D.; Cardon, G. Cross-continental comparison of the association between the physical environment and active transportation in children: A systematic review. Int. J. Behav. Nutr. Phy. 2015, 12, 145. [Google Scholar] [CrossRef]
  6. Ramezani, S.; Said, I. Children’s nomination of friendly places in an urban neighbourhood in Shiraz, Iran. Child. Geogr. 2013, 11, 7–27. [Google Scholar] [CrossRef]
  7. Murota, M. A study on the Use of Parks in the Green Matrix System of Kohoku New Town, Japan: -Focusing on Parks Combined with Pedestrian Roads-. J. Asian Archit. Build. Eng. 2009, 8, 73–79. [Google Scholar] [CrossRef]
  8. Poon, B.T.; Atchison, C.; Kwan, A. Understanding the Influence of Community-Level Determinants on Children’s Social and Emotional Well-Being: A Systems Science and Participatory Approach. Int. J. Environ. Res. Public Health 2022, 19, 5972. [Google Scholar] [CrossRef]
  9. Zhang, F.; Salazar-Miranda, A.; Duarte, F.; Vale, L.; Hack, G.; Chen, M.; Liu, Y.; Batty, M.; Ratti, C. Urban Visual Intelligence: Studying Cities with Artificial Intelligence and Street-Level Imagery. Ann. Am. Assoc. Geogr. 2024, 114, 876–897. [Google Scholar] [CrossRef]
  10. Schmidhuber, J. Deep learning in neural networks: An overview. Neural Netw. 2015, 61, 85–117. [Google Scholar] [CrossRef]
  11. Dai, S.Q.; Li, Y.C.; Stein, A.; Yang, S.J.; Jia, P. Street view imagery-based built environment auditing tools: A systematic review. Int. J. Geogr. Inf. Sci. 2024, 38, 1136–1157. [Google Scholar] [CrossRef]
  12. Wang, R.; Liu, J. Research on ecological-cultural coupling evaluation and optimization strategy of urban ecological parks: A case study of Yubei District, Chongqing. J. Hum. Settl. West China 2024, 39, 157–164. [Google Scholar]
  13. Giles-Corti, B.; Wood, G.; Pikora, T.; Learnihan, V.; Bulsara, M.; Van Niel, K.; Timperio, A.; McCormack, G.; Villanueva, K. School site and the potential to walk to school: The impact of street connectivity and traffic exposure in school neighborhoods. Health Place 2011, 17, 545–550. [Google Scholar] [CrossRef]
  14. Zhang, R.Y.; Huang, Q.; Peng, Z.M.; Zhang, X.Y.; Shang, L.; Yang, C.L. Evaluating the Impact of Elementary School Urban Neighborhood Color on Children’s Mentalization of Emotions through Multi-Source Data. Buildings 2024, 14, 3128. [Google Scholar] [CrossRef]
  15. Pitsikali, A.; Parnell, R.; McIntyre, L. The public value of child-friendly space Reconceptualising the playground. Archnet-IJAR 2020, 14, 149–165. [Google Scholar] [CrossRef]
  16. Torres, J.; Cloutier, M.S.; Bergeron, J.; St-Denis, A. ‘They installed a speed bump’: Children’s perceptions of traffic-calming measures around elementary schools. Child. Geogr. 2020, 18, 477–489. [Google Scholar] [CrossRef]
  17. Jin, S.; Deng, Y.; Tu, H. Reprogramming Urban Communities: Enhancing Children’s Well-being through a Value-Based Programming Approach in Inclusive Planning and Design. In Proceedings of the 60th ISOCARP World Planning Congress, Siena, Italy, 8–12 October 2024. [Google Scholar]
  18. Wang, Y.; Sun, Y.A.; Sun, Y.H.; He, T. Unveiling the magic of mega-city block environments: Investigating the intriguing mechanisms shaping children’s spontaneous play preferences. Front. Psychol. 2024, 15, 1354236. [Google Scholar] [CrossRef]
  19. Sheng, K.Y.; Liu, L.; Wang, F.; Li, S.N.; Zhou, X. An Eye-Tracking Study on Exploring Children’s Visual Attention to Streetscape Elements. Buildings 2025, 15, 605. [Google Scholar] [CrossRef]
  20. Yin, B.; Wang, L.J.; Xu, Y.; Heng, K.C. A Study on the Spatial Perception and Inclusive Characteristics of Outdoor Activity Spaces in Residential Areas for Diverse Populations from the Perspective of All-Age Friendly Design. Buildings 2025, 15, 895. [Google Scholar] [CrossRef]
  21. Moore, K.A. Developing an Indicator System to Measure Child Well-Being: Lessons Learned over Time. Child Indic. Res. 2020, 13, 729–739. [Google Scholar] [CrossRef]
  22. Schepers, S.; Schoffelen, J.; Zaman, B.; Dreessen, K. ‘I’m the boss of the Stiemerbeek valley!’ Reconsidering children’s empowerment in participatory design from the perspective of infrastructuring. Codesign 2022, 18, 340–354. [Google Scholar] [CrossRef]
  23. Cordero-Vinueza, V.A.; van Dijk, T.; Lamker, C.; Niekerk, F. Making child-friendly cities: A quest for local agenda-setting. Cities 2025, 161, 105882. [Google Scholar] [CrossRef]
  24. von Stülpnagel, R.; Riach, N.; Hologa, R.; Kees, J.; Gössling, S. School route safety perceptions of primary school children and their parents: Effects of transportation mode and infrastructure. Int. J. Sustain. Transp. 2024, 18, 465–477. [Google Scholar] [CrossRef]
  25. Wang, X.; Huang, J.P.; Qin, Z.Y.; Gan, W.; He, Z.; Li, X. Is the Children’s 15-Minute City an Effective Framework for Enhancing Children’s Health and Well-Being? An Empirical Analysis from Western China. Buildings 2025, 15, 248. [Google Scholar] [CrossRef]
  26. Li, F.; Yigitcanlar, T.; Nepal, M.; Nguyen, K.; Dur, F. Machine learning and remote sensing integration for leveraging urban sustainability: A review and framework. Sustain. Cities Soc. 2023, 96, 104653. [Google Scholar] [CrossRef]
  27. Khoei, T.T.; Slimane, H.O.; Kaabouch, N. Deep learning: Systematic review, models, challenges, and research directions. Neural Comput. Appl. 2023, 35, 23103–23124. [Google Scholar] [CrossRef]
  28. Tang, F.L.; Zeng, P.; Wang, L.; Zhang, L.H.; Xu, W.X. Urban Perception Evaluation and Street Refinement Governance Supported by Street View Visual Elements Analysis. Remote Sens. 2024, 16, 3661. [Google Scholar] [CrossRef]
  29. Baduge, S.K.; Thilakarathna, S.; Perera, J.S.; Arashpour, M.; Sharafi, P.; Teodosio, B.; Shringi, A.; Mendis, P. Artificial intelligence and smart vision for building and construction 4.0: Machine and deep learning methods and applications. Automat. Constr. 2022, 141, 104440. [Google Scholar] [CrossRef]
  30. Mo, Y.J.; Wu, Y.; Yang, X.N.; Liu, F.L.; Liao, Y.J. Review the state-of-the-art technologies of semantic segmentation based on deep learning. Neurocomputing 2022, 493, 626–646. [Google Scholar] [CrossRef]
  31. Wu, Y.F.; Liu, Q.Q.; Hang, T.; Yang, Y.H.; Wang, Y.J.; Cao, L. Integrating restorative perception into urban street planning: A framework using street view images, deep learning, and space syntax. Cities 2024, 147, 104791. [Google Scholar] [CrossRef]
  32. Yang, Y.H.; Wang, Q.; Wu, D.C.; Hang, T.; Ding, H.N.; Wu, Y.F.; Liu, Q.Q. Constructing child-friendly cities: Comprehensive evaluation of street-level child-friendliness using the method of empathy-based stories, street view images, and deep learning. Cities 2024, 154, 105385. [Google Scholar] [CrossRef]
  33. Ho, L.C.; Wei, Y.T.; Li, D.Y.; Chiang, Y.C. Revealing emotional responses to urban environmental elements through street view data and deep learning. Environ. Plan. B-Urban Anal. City Sci. 2025, 23998083251348280. [Google Scholar] [CrossRef]
  34. Huang, Y.J.; Zhang, F.; Gao, Y.; Tu, W.; Duarte, F.; Ratti, C.; Guo, D.S.; Liu, Y. Comprehensive urban space representation with varying numbers of street-level images. Comput. Environ. Urban Syst. 2023, 106, 102043. [Google Scholar] [CrossRef]
  35. Wang, S.Q.; Liang, C.; Gao, Y.F.; Ye, Y.; Qiu, J.Y.; Tao, C.; Wang, H.F. Social media insights into spatio-temporal emotional responses to COVID-19 crisis. Health Place 2024, 85, 103174. [Google Scholar] [CrossRef] [PubMed]
  36. Wedyan, M.; Saeidi-Rizi, F. Assessing the Impact of Urban Environments on Mental Health and Perception Using Deep Learning: A Review and Text Mining Analysis. J. Urban Health 2024, 101, 327–343. [Google Scholar] [CrossRef] [PubMed]
  37. Shi, H.D.; Chen, J.F.; Feng, Z.H.; Liu, T.; Sun, D.H.; Zhou, X.L. Exploring the Influence of Environmental Characteristics on Emotional Perceptions in Metro Station Spaces. Buildings 2025, 15, 310. [Google Scholar] [CrossRef]
  38. Ghanbari, M.; Karimi, M.; Claramunt, C.; Lagesse, C. Enhancing Urban Transportation Flow Modeling Through a Graph Neural Network-based Spatially Weighted Interaction Model: A Case Study of Chicago Taxi Data. J. Geovis. Spat. Anal. 2025, 9, 15. [Google Scholar] [CrossRef]
  39. Zhang, H.; Liu, H.; Kim, C. Semantic and Instance Segmentation in Coastal Urban Spatial Perception: A Multi-Task Learning Framework with an Attention Mechanism. Sustainability 2024, 16, 833. [Google Scholar] [CrossRef]
  40. Stark, T.; Wurm, M.; Zhu, X.X.; Taubenböck, H. Quantifying Uncertainty in Slum Detection: Advancing Transfer Learning With Limited Data in Noisy Urban Environments. IEEE J. Sel. Top. Appl. Earth Obs. Remote Sens. 2024, 17, 4552–4565. [Google Scholar] [CrossRef]
  41. Yao, Y.; Liang, Z.T.; Yuan, Z.H.; Liu, P.H.; Bie, Y.P.; Zhang, J.B.; Wang, R.Y.; Wang, J.L.; Guan, Q.F. A human-machine adversarial scoring framework for urban perception assessment using street-view images. Int. J. Geogr. Inf. Sci. 2019, 33, 2363–2384. [Google Scholar] [CrossRef]
  42. Guo, D.; Shi, Y.; Chen, R. Environmental affordances and children’s needs: Insights from child-friendly community streets in China. Front. Archit. Res. 2023, 12, 411–422. [Google Scholar] [CrossRef]
  43. Tu, H.; Jin, S. A group decision-making model for architectural programming in megaprojects. Eng. Constr. Archit. Manag. 2024, 31, 342–368. [Google Scholar] [CrossRef]
  44. Ye, Y.; Zeng, W.; Shen, Q.M.; Zhang, X.H.; Lu, Y. The visual quality of streets: A human-centred continuous measurement based on machine learning algorithms and street view images. Environ. Plan. B-Urban Anal. City Sci. 2019, 46, 1439–1457. [Google Scholar] [CrossRef]
  45. Krabbe, P.F.M. Chapter 5—Constructs and Scales. In The Measurement of Health and Health Status; Krabbe, P.F.M., Ed.; Academic Press: San Diego, CA, USA, 2017; pp. 67–89. [Google Scholar]
  46. Shafik, N.; Mansour, Y.; Kamel, S.; Morcos, R. The Impact of the Cairo Streets Development Project on the Independent Mobility of Children: A Field Study on the Streets of Heliopolis, Egypt. Infrastructures 2021, 6, 98. [Google Scholar] [CrossRef]
  47. Tezel, E. Exploring parental concerns about children’s interactions in gated communities: A case study in Istanbul. Child. Geogr. 2011, 9, 425–437. [Google Scholar] [CrossRef]
  48. Zhang, J.; Liu, J.; Ai, Q.; Liu, Q. Comparison and Analysis of Thermal Comfort in Summer between Riverside Parks and Parks under the Urban Viaducts in Chongqing. J. Southwest Univ. Nat. Sci. Ed. 2022, 44, 197–209. [Google Scholar]
  49. Lu, C.Y.; Yu, C.B.; Liu, X.W. Evaluating the Quality of Children’s Active School Travel Spaces and the Mechanisms of School District Friendliness Impact Based on Multi-Source Big Data. Land 2024, 13, 1319. [Google Scholar] [CrossRef]
  50. Han, H.T.; Huang, J.; Jia, X.F.; Zhang, J.T.; Guo, J.W. Evaluation of route choice for walking commutes to school and street space optimization in old urban areas of China based on a child-friendly orientation: The case of the Wuyi Park area in Zhengzhou. Child. Soc. 2024, 38, 1527–1556. [Google Scholar] [CrossRef]
  51. Jin, S.T.; Tu, H.J.; Li, J.F.; Fang, Y.W.; Qu, Z.; Xu, F.; Liu, K.; Lin, Y.Q. Enhancing Architectural Education through Artificial Intelligence: A Case Study of an AI-Assisted Architectural Programming and Design Course. Buildings 2024, 14, 1613. [Google Scholar] [CrossRef]
  52. Xu, S.; Zhuang, W. Research on the Quality Criteria of Street Space Affecting Children’s Hierarchy of School Travel Needs. J. Hum. Settl. West China 2023, 38, 45–51. [Google Scholar]
Figure 1. The framework of the child-friendliness evaluation and enhancement system for urban streets.
Buildings 15 02291 g001
Figure 2. Training and validation results of the evaluation model. (a) The average loss of the training set; (b) the accuracy of the training set; (c) the accuracy of the validation set.
Buildings 15 02291 g002
Figure 3. Training and validation results of the enhancement model. (a) The average loss per sample on the training set; (b) label-level accuracy on the training set; (c) label-level accuracy on the validation set.
Buildings 15 02291 g003
Figure 4. Street ID map of Siping Subdistrict, Yangpu District, Shanghai.
Buildings 15 02291 g004
Table 1. Summary of child-friendliness-related spatial features of urban streets.
Urban Street ElementChild-Friendliness-Related FeatureFeature Quantification Method
SidewalkSidewalk WidthAverage effective pedestrian passage width (unit: meters)
Sidewalk LengthStraight-line distance between intersections (unit: meters)
Degree of Sidewalk EncroachmentThe ratio of encroached sidewalk length to total sidewalk length (0% = 0, 0–20% = 1, 20–40% = 2, 40–60% = 3, 60–80% = 4, 80–100% = 5)
Sidewalk Damage LevelThe ratio of damaged sidewalk length to total sidewalk length (0% = 0, 0–20% = 1, 20–40% = 2, 40–60% = 3, 60–80% = 4, 80–100% = 5)
Sidewalk Cleanliness LevelRatio of smooth, clean sidewalk length free from illegal parking (0% = 0, 0–20% = 1, 20–40% = 2, 40–60% = 3, 60–80% = 4, 80–100% = 5)
Proportion of Barriers Isolating Sidewalk from Other Lanes(0% = 0, 0–20% = 1, 20–40% = 2, 40–60% = 3, 60–80% = 4, 80–100% = 5)
Bicycle LanePresence of Bicycle LanePresent = 1/Absent = 0
Bicycle Lane WidthAverage effective passage width (unit: meters)
Bicycle Traffic VolumePeak-period bicycle flow rate (units: vehicles per minute)
Motor Vehicle LaneMotor Vehicle Lane WidthAverage effective passage width (unit: meters)
Number of Motor Vehicle LanesCount (units: number)
Motor Vehicle Traffic ConditionSmooth = 1, Slow-moving = 2, Congested = 3, Severe Congestion = 4
Average Vehicle Speed0–40 km/h = 1, 40–60 km/h = 2, 60–80 km/h = 3, >80 km/h = 4
Presence of Safety IslandsPresent = 1/Absent = 0
Presence of Pedestrian Warning SystemsPresent = 1/Absent = 0
Presence of Pedestrian OverpassesPresent = 1/Absent = 0
Presence of Elevated Road AbovePresent = 1/Absent = 0
Traffic Lights at IntersectionsOne intersection with lights = 2/Both intersections = 1/None = 0
Street-Front BuildingsAverage Building HeightAverage height (unit: meters)
Number of Motor Vehicle Entrances/ExitsCount (units: number)
Proportion of Arcade/Overhanging Space(0% = 0, 0–20% = 1, 20–40% = 2, 40–60% = 3, 60–80% = 4, 80–100% = 5)
Presence of Objects Intruding into StreetPresent = 1/Absent = 0 (e.g., ground-floor encroachment or risk of falling objects from upper floors)
Proportion of Commercial Buildings0% = 0, 0–20% = 1, 20–40% = 2, 40–60% = 3, 60–80% = 4, 80–100% = 5
Proportion of Residential Buildings0% = 0, 0–20% = 1, 20–40% = 2, 40–60% = 3, 60–80% = 4, 80–100% = 5
Proportion of Cultural and Educational Buildings0% = 0, 0–20% = 1, 20–40% = 2, 40–60% = 3, 60–80% = 4, 80–100% = 5
Proportion of Sports Facility Buildings0% = 0, 0–20% = 1, 20–40% = 2, 40–60% = 3, 60–80% = 4, 80–100% = 5
Proportion of Medical Facility Buildings0% = 0, 0–20% = 1, 20–40% = 2, 40–60% = 3, 60–80% = 4, 80–100% = 5
Proportion of Office Buildings0% = 0, 0–20% = 1, 20–40% = 2, 40–60% = 3, 60–80% = 4, 80–100% = 5
Landscape and GreeneryProportion of Street Trees0% = 0, 0–20% = 1, 20–40% = 2, 40–60% = 3, 60–80% = 4, 80–100% = 5
Proportion of Child-Interactive Landscapes0% = 0, 0–20% = 1, 20–40% = 2, 40–60% = 3, 60–80% = 4, 80–100% = 5
Proportion of Other Landscape Features0% = 0, 0–20% = 1, 20–40% = 2, 40–60% = 3, 60–80% = 4, 80–100% = 5
Activity SpacesProportion of Usable Activity Space0% = 0, 0–20% = 1, 20–40% = 2, 40–60% = 3, 60–80% = 4, 80–100% = 5
Area of Usable Activity Space0 m2 = 0, 0–20 m2 = 1, 20–40 m2 = 2, 40–60 m2 = 3, 60–80 m2 = 4, >80 m2 = 5
Service FacilitiesProportion of Bicycle Parking Spaces0% = 0, 0–20% = 1, 20–40% = 2, 40–60% = 3, 60–80% = 4, 80–100% = 5
Proportion of Motor Vehicle Parking Spaces0% = 0, 0–20% = 1, 20–40% = 2, 40–60% = 3, 60–80% = 4, 80–100% = 5
Lighting System Coverage Rate0% = 0, 0–20% = 1, 20–40% = 2, 40–60% = 3, 60–80% = 4, 80–100% = 5
Surveillance System Coverage Rate0% = 0, 0–20% = 1, 20–40% = 2, 40–60% = 3, 60–80% = 4, 80–100% = 5
Proportion of Barrier-Free Facilities0% = 0, 0–20% = 1, 20–40% = 2, 40–60% = 3, 60–80% = 4, 80–100% = 5
Proportion of Fitness Trails0% = 0, 0–20% = 1, 20–40% = 2, 40–60% = 3, 60–80% = 4, 80–100% = 5
Number of Fitness FacilitiesCount (units: number)
Number of Play FacilitiesCount (units: number)
Number of Rest FacilitiesCount (units: number)
Number of Road SignsCount (units: number)
Number of Transit StopsCount (units: number)
Number of Drinking FountainsCount (units: number)
Number of Public ToiletsCount (units: number)
Other ElementsProportion of Non-Motorized Vehicle Parking on Street0% = 0, 0–20% = 1, 20–40% = 2, 40–60% = 3, 60–80% = 4, 80–100% = 5
Proportion of Motor Vehicle Parking on Street0% = 0, 0–20% = 1, 20–40% = 2, 40–60% = 3, 60–80% = 4, 80–100% = 5
Presence of Odor on StreetPresent = 1/Absent = 0
Street Sound EnvironmentNoisy (>60 dB) = 2/Normal (40–60 dB) = 1/Quiet (<40 dB) = 0
Table 2. Judgment matrix of stakeholder decision importance.
ChildrenChild CaregiverExpertGovernment DepartmentThe Public
Children11225
Child caregiver11225
Expert1/21/2113
Government department1/21/2113
The public1/51/51/31/31
Table 3. Sample distribution across child-friendliness rating levels (before data augmentation).
Child-Friendliness Score1 Point2 Points3 Points4 Points5 PointsSUM
SUM164286562295951402
Table 4. Statistics of urban street child-friendliness improvement needs (before data augmentation).
No.Universal Child-Friendliness Improvement MeasuresSUM
01Sidewalk Repairs233
02Removal of Obstacles on Sidewalks342
03Regulation of Illegally Parked Non-Motorized and Motorized Vehicles on Sidewalks314
04Addition of Barriers Isolating Sidewalks from Other Traffic Lanes362
05Installation of Speed Reduction Measures271
06Addition of Safe Pedestrian Crossing Facilities280
07Planting of Shade Trees/Installation of Shading Facilities413
08Addition of Interactive Landscapes (e.g., Walkable Lawns, Fountains, Sculptures)302
09Addition of Other Landscape Features (e.g., Shrubs, Flowers)300
10Expansion of Street-Side Areas for Children’s Activities and Rest398
11Addition of Facilities for Children’s Activities and Rest835
12Expansion of Street-Side Areas for Childcare Supervision401
13Addition of Facilities to Facilitate Childcare Supervision464
14Addition of Intergenerational Interaction Facilities for Children853
15Installation of Safety Facilities such as Lighting and Surveillance79
16Addition of Child-Friendly Barrier-Free Facilities295
17Addition of Child-Recognizable Wayfinding Signs416
18Addition of Convenience Facilities such as Children’s Restrooms and Nursing Rooms248
Table 5. Sample distribution for different child-friendliness rating levels (post-data augmentation).
Child-Friendliness Score1 Point2 Points3 Points4 Points5 PointsSUM
SUM131211441124118011405900
Table 6. Statistics of child-friendliness improvement needs (post-data augmentation).
No.Universal Child-Friendliness Improvement MeasuresSUM
01Sidewalk Repairs1254
02Removal of Obstacles on Sidewalks1485
03Regulation of Illegally Parked Non-Motorized and Motorized Vehicles on Sidewalks1357
04Addition of Barriers Isolating Sidewalks from Other Traffic Lanes1188
05Installation of Speed Reduction Measures1110
06Addition of Safe Pedestrian Crossing Facilities1086
07Planting of Shade Trees/Installation of Shading Facilities1436
08Addition of Interactive Landscapes (e.g., Walkable Lawns, Fountains, Sculptures)1271
09Addition of Other Landscape Features (e.g., Shrubs, Flowers)1311
10Expansion of Street-Side Areas for Children’s Activities and Rest1391
11Addition of Facilities for Children’s Activities and Rest1488
12Expansion of Street-Side Areas for Childcare Supervision1394
13Addition of Facilities to Facilitate Childcare Supervision1421
14Addition of Intergenerational Interaction Facilities for Children1433
15Installation of Safety Facilities such as Lighting and Surveillance1143
16Addition of Child-Friendly Barrier-Free Facilities1411
17Addition of Child-Recognizable Wayfinding Signs1440
18Addition of Convenience Facilities such as Children’s Restrooms and Nursing Rooms1192
Table 7. Test set performance of the evaluation model (the model with the best overall performance on the training and validation sets).
1 Point2 Points3 Points4 Points5 Points
Recall rate100%99.42%86.90%100%100%
Accuracy rate99.49%98.28%99.32%90.77%100%
Overall accuracy rate97.40%
Table 8. Experimental data table of the test set for the enhancement model of child-friendliness of urban streets (the model with the best overall performance on the training and validation sets).
No.Universal Child-Friendliness Improvement MeasuresRecall RateAccuracy RateTag-Level Accuracy Rate
01Sidewalk Repairs93.41%95.50%97.28%
02Removal of Obstacles on Sidewalks91.85%95.38%
03Regulation of Illegally Parked Non-Motorized and Motorized Vehicles on Sidewalks92.63%95.65%
04Addition of Barriers Isolating Sidewalks from Other Traffic Lanes98.04%96.77%
05Installation of Speed Reduction Measures95.65%96.49%
06Addition of Safe Pedestrian Crossing Facilities94.26%96.64%
07Planting of Shade Trees/Installation of Shading Facilities95.14%94.62%
08Addition of Interactive Landscapes (e.g., Walkable Lawns, Fountains, Sculptures)97.93%97.93%
09Addition of Other Landscape Features (e.g., Shrubs, Flowers)97.97%96.67%
10Expansion of Street-Side Areas for Children’s Activities and Rest96.37%98.97%
11Addition of Facilities for Children’s Activities and Rest99.22%98.19%
12Expansion of Street-Side Areas for Childcare Supervision95.36%98.93%
13Addition of Facilities to Facilitate Childcare Supervision93.26%97.08%
14Addition of Intergenerational Interaction Facilities for Children98.39%97.27%
15Installation of Safety Facilities such as Lighting and Surveillance95.83%95.83%
16Addition of Child-Friendly Barrier-Free Facilities99.27%100%
17Addition of Child-Recognizable Wayfinding Signs93.98%95.31%
18Addition of Convenience Facilities such as Children’s Restrooms and Nursing Rooms99.04%100%
Table 9. Child-friendliness evaluation matrix for urban streets in Siping Subdistrict, Yangpu District, Shanghai.
Road NumberChild-Friendliness ScoreRoad NumberChild-Friendliness ScoreRoad NumberChild-Friendliness ScoreRoad NumberChild-Friendliness Score
011a3062b4104a2151b5
011b5063a4104b2152a4
012a3063b3111a3152b4
012b1071a3111b1161a2
013a3071b3112a3161b3
013b5072a3112b4162a3
014a4072b4113a3162b3
014b3073a4113b1163a1
015a3073b3121a3163b2
015b3081a3121b2171a3
021a1081b3122a4171b2
021b1082a2122b3172a3
031a3082b3123a4172b4
031b1083a4123b3173a2
032a4083b3131a5173b1
032b3084a3131b3174a3
041a3084b1132a3174b3
041b4091a2132b2181a2
051a3091b2141a5181b3
051b1101a4141b3182a5
052a1101b4142a2182b3
052b2102a1142b4183a4
061a2102b1143a2183b2
061b2103a2143b5
062a2103b1151a3
Table 10. Recommended improvement measures for low-scoring urban streets in Siping Subdistrict, Yangpu District, Shanghai.
010203040506070809101112131415161718
score1012b
021a
021b
031b
051b
052a
084b
102a
102b
103b
111b
113b
163a
173b
score2052b
061a
061b
062a
082a
091a
091b
103a
104a
104b
121b
132b
142a
143a
161a
163b
171b
173a
181a
183b
Disclaimer/Publisher’s Note: The statements, opinions and data contained in all publications are solely those of the individual author(s) and contributor(s) and not of MDPI and/or the editor(s). MDPI and/or the editor(s) disclaim responsibility for any injury to people or property resulting from any ideas, methods, instructions or products referred to in the content.

