
A Multi-Objective Optimization Study on a Certain Lecture Hall Based on Thermal and Visual Comfort

Abstract
1. Introduction
2. Methodology
2.1. Research Approach
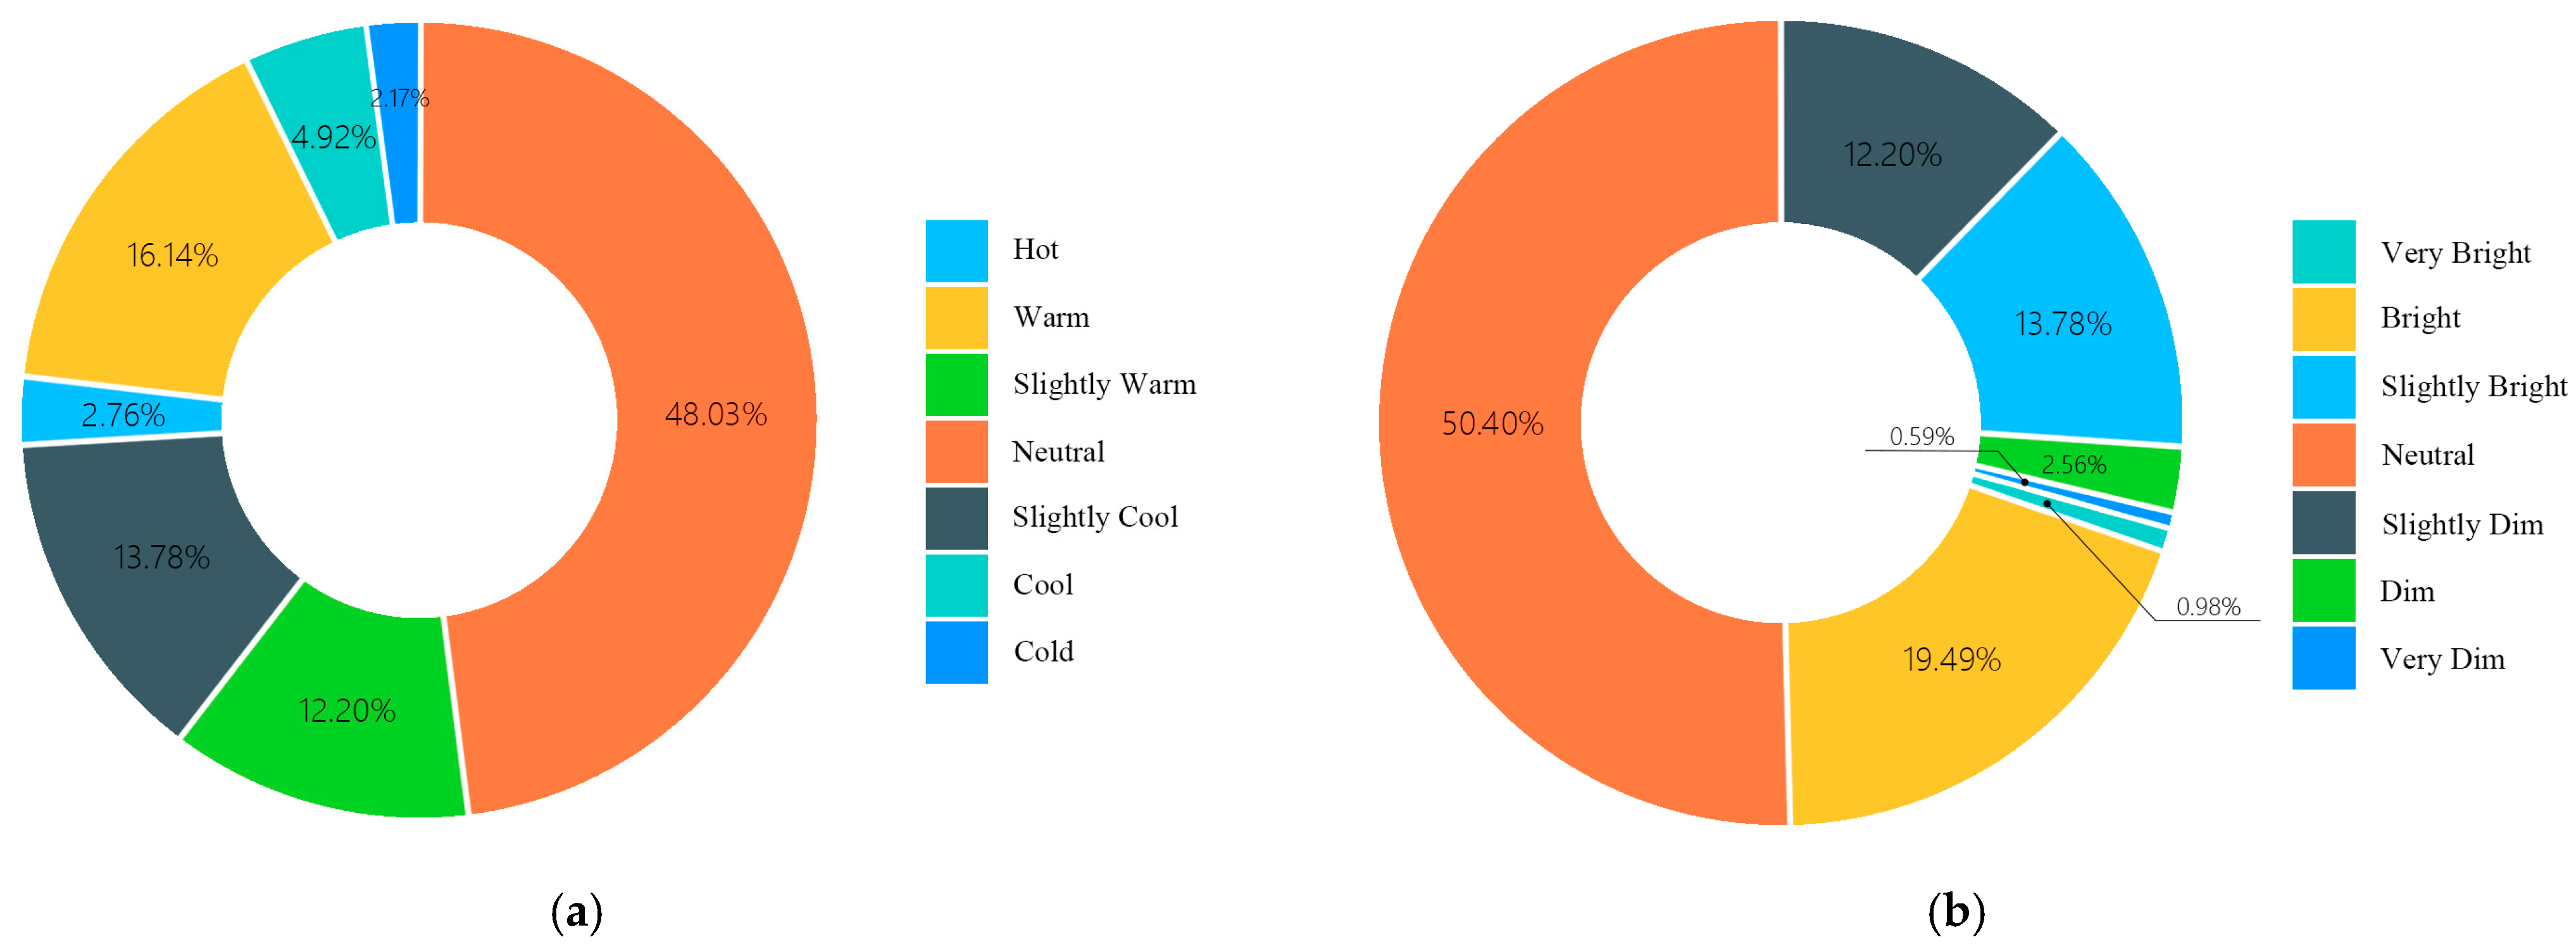
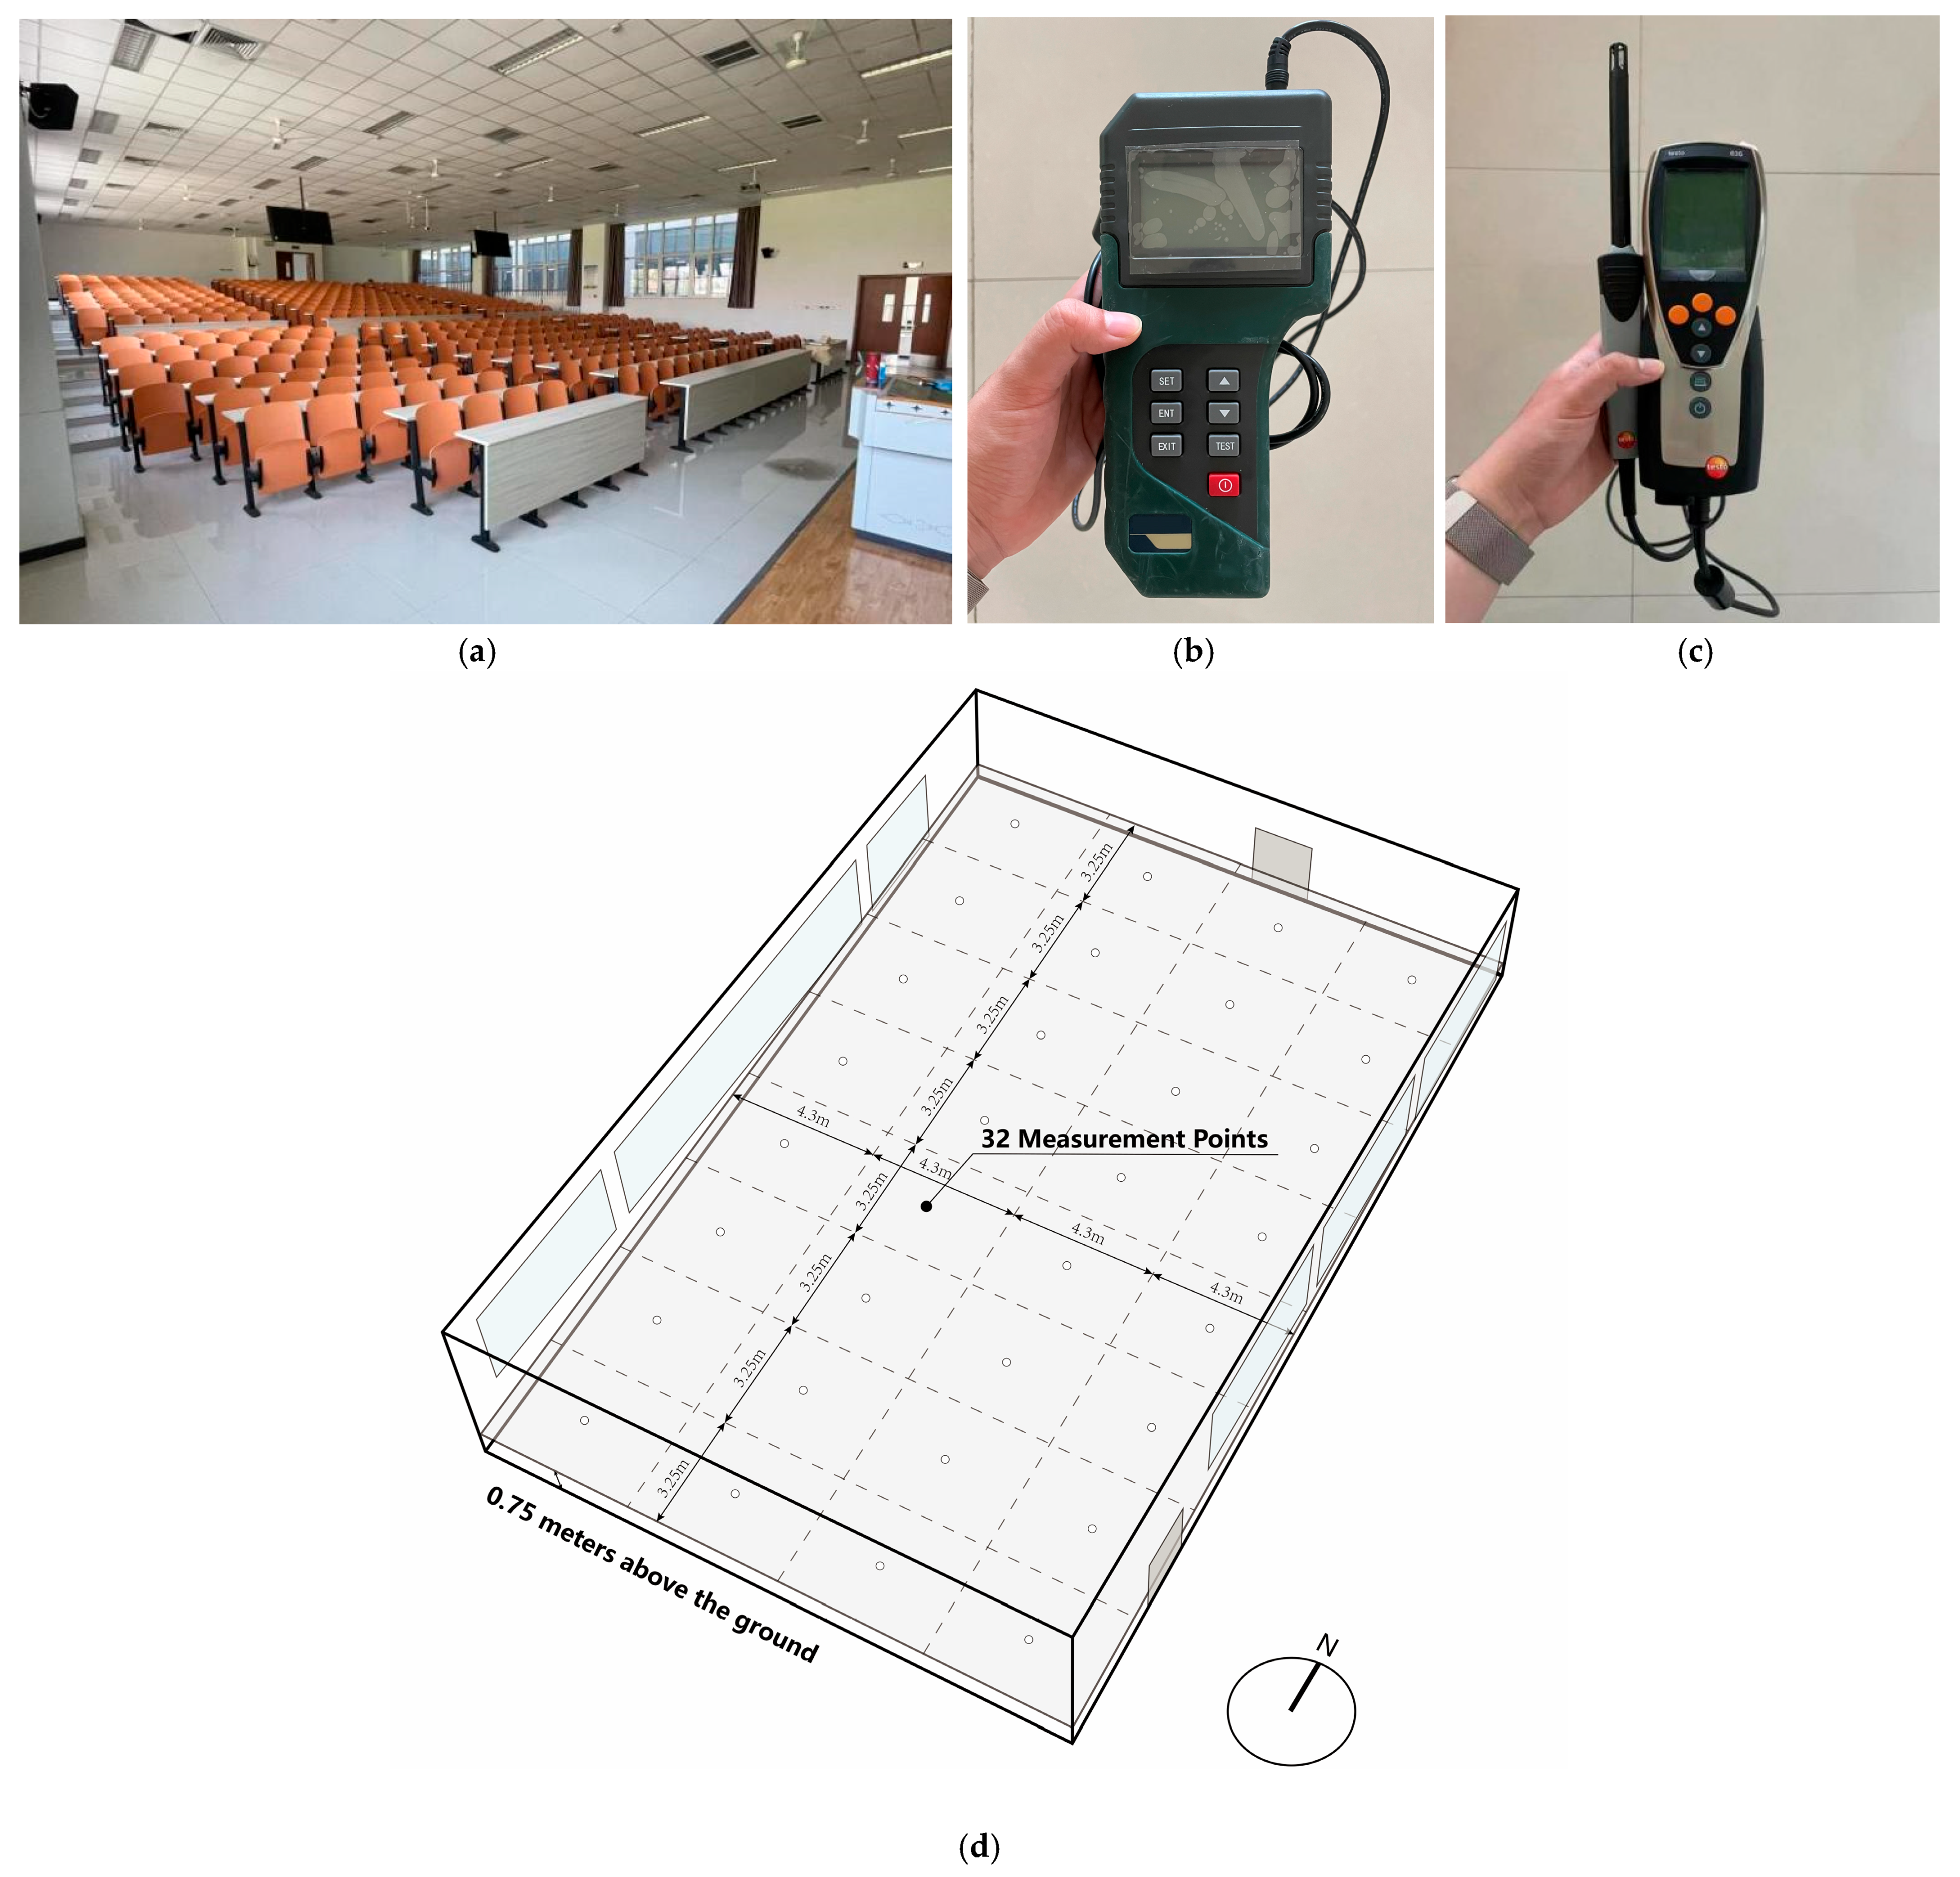
2.1.1. Survey Method
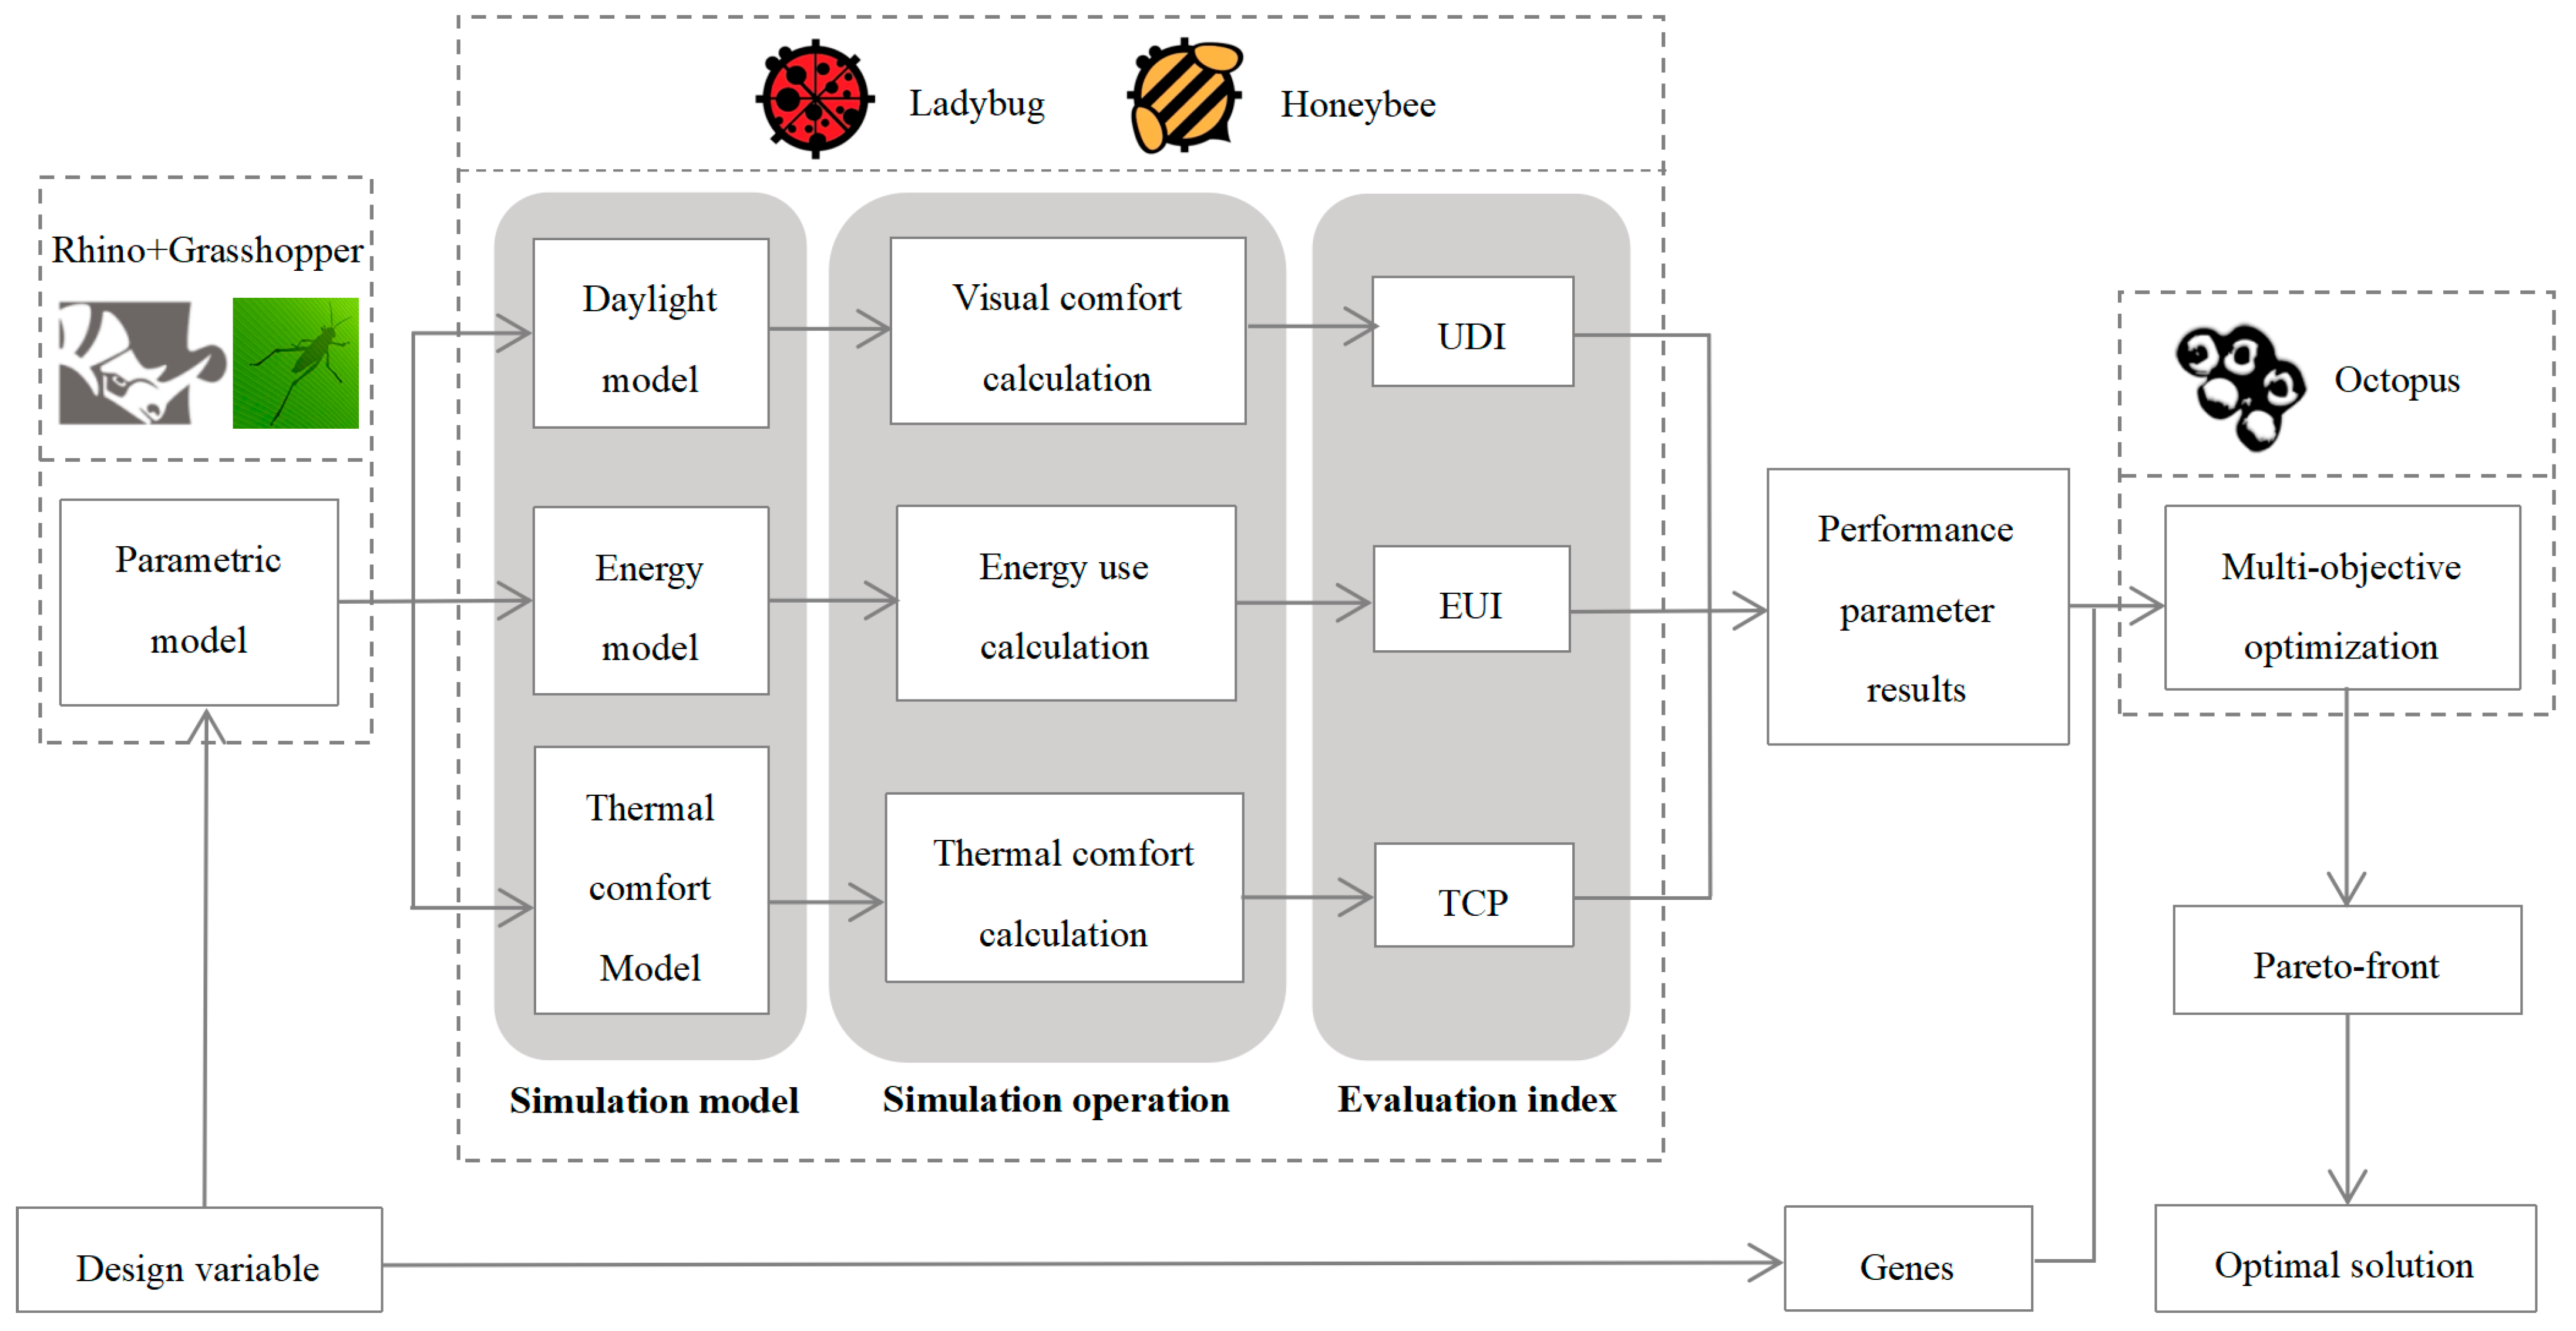
2.1.2. Simulation and Analysis Method
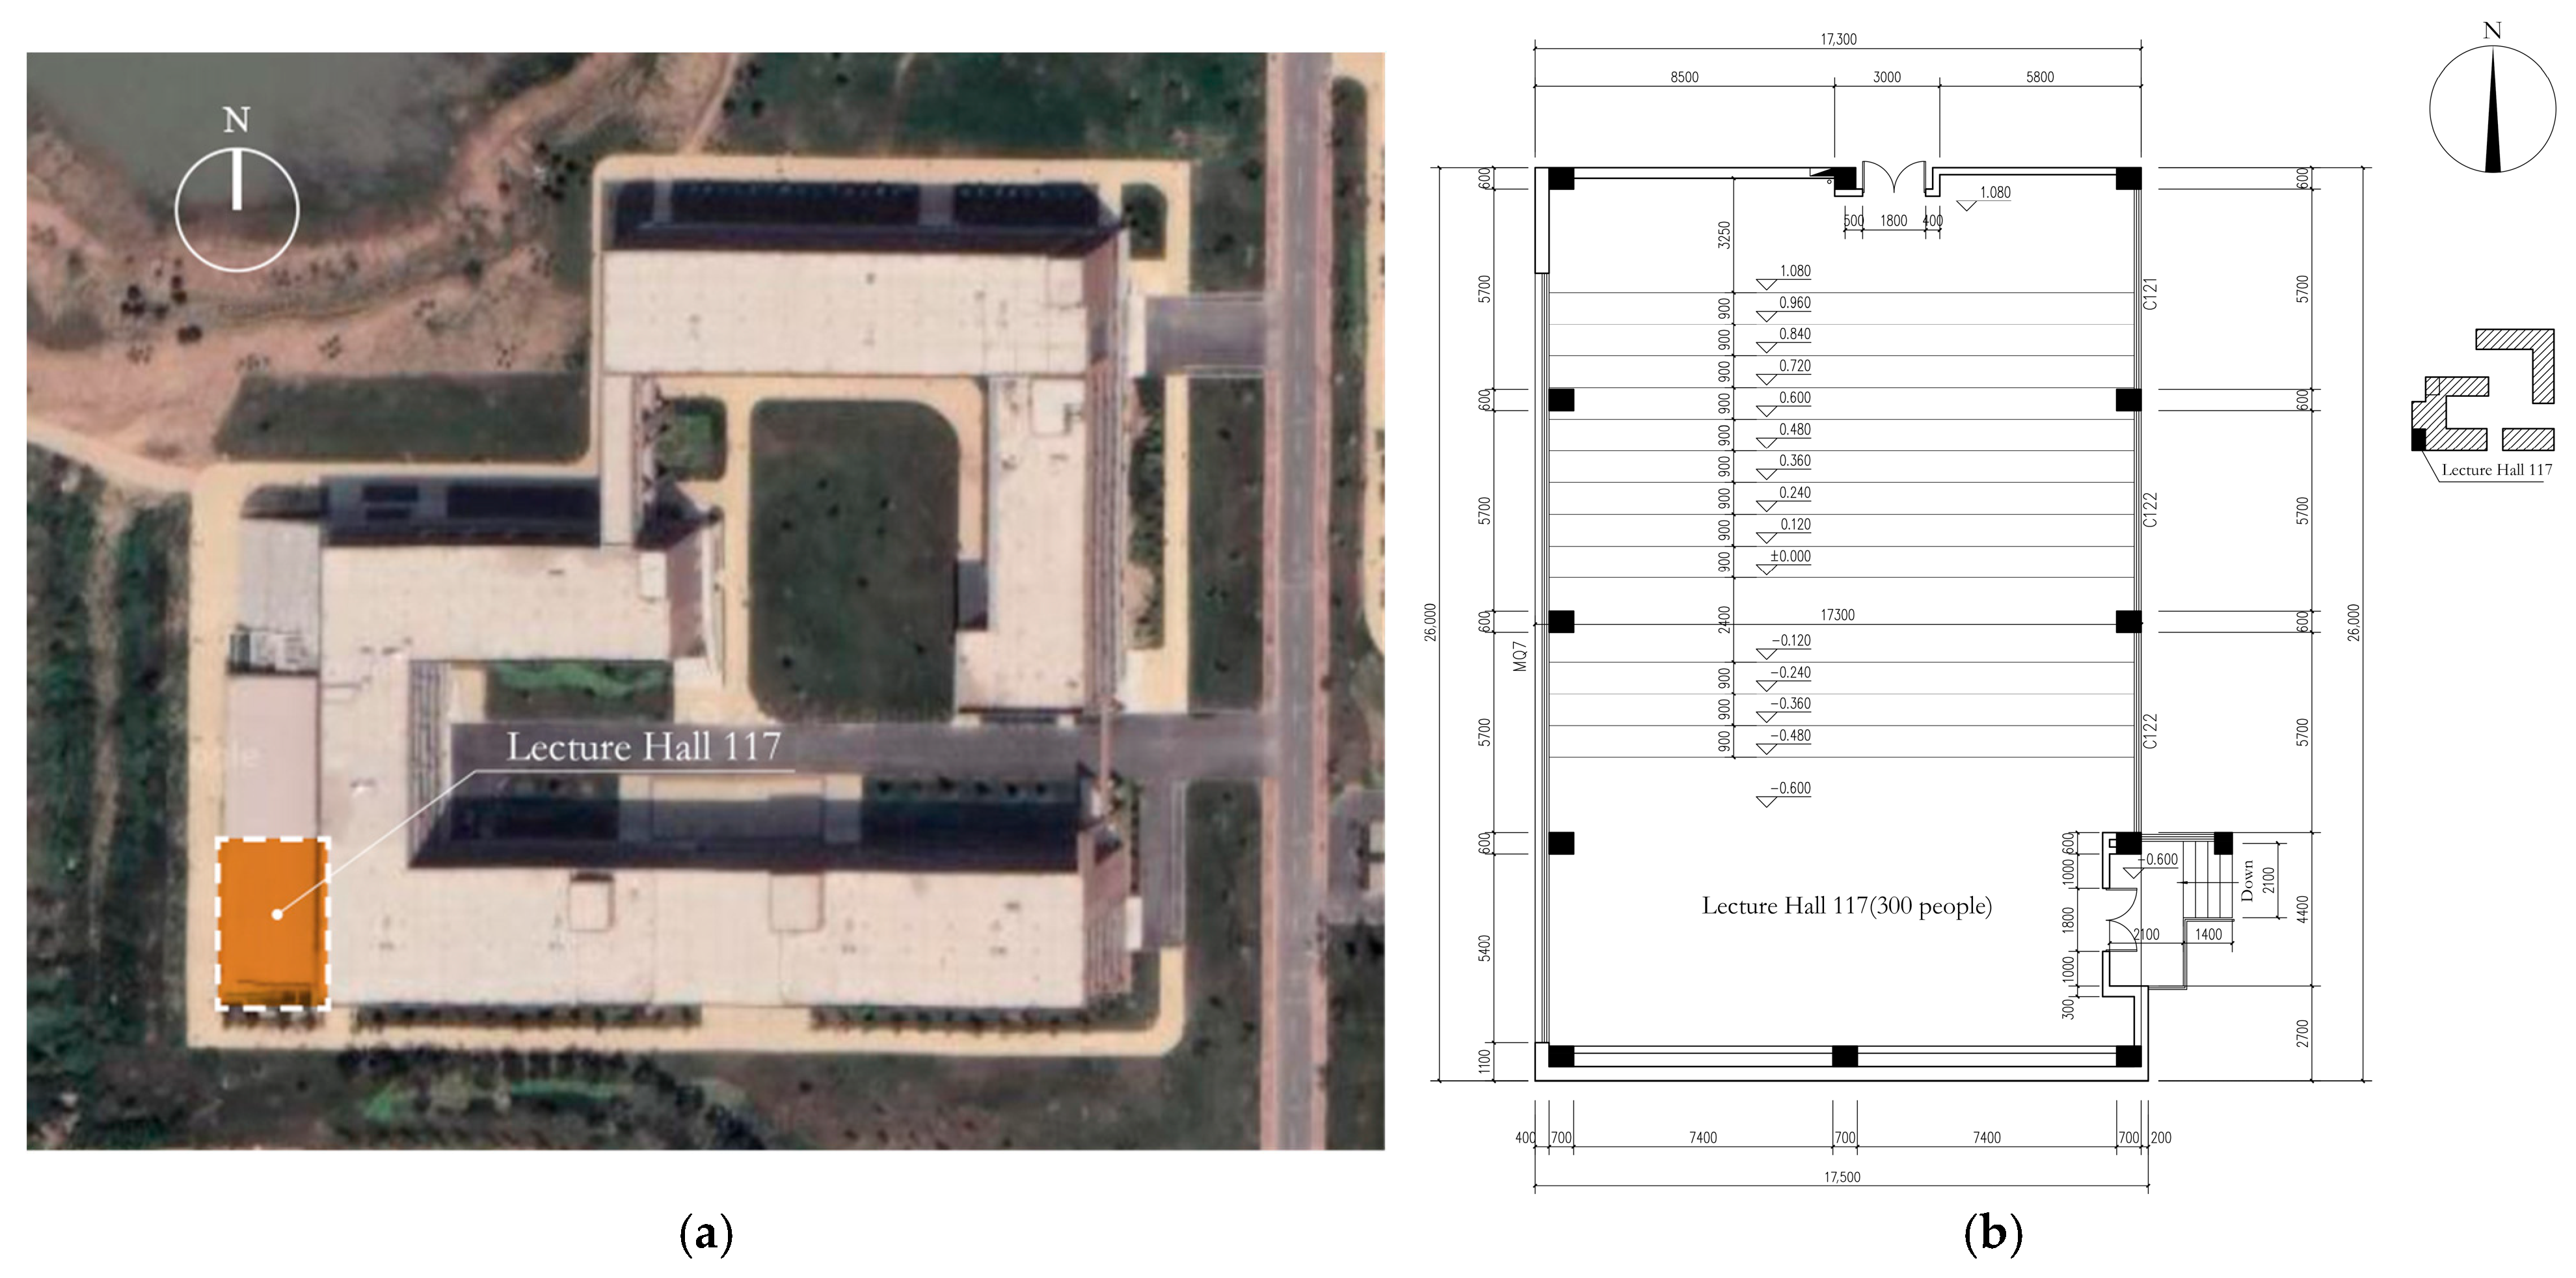
2.2. Case Study Construction and Questionnaire Research
2.3. Performance Simulation
2.3.1. Light Comfort Simulation
2.3.2. Thermal Comfort Simulation
2.3.3. Energy Consumption Simulation
2.4. Economic Analysis
2.5. Multi-Objective Optimization and Fitness Functions
3. Results and Discussion
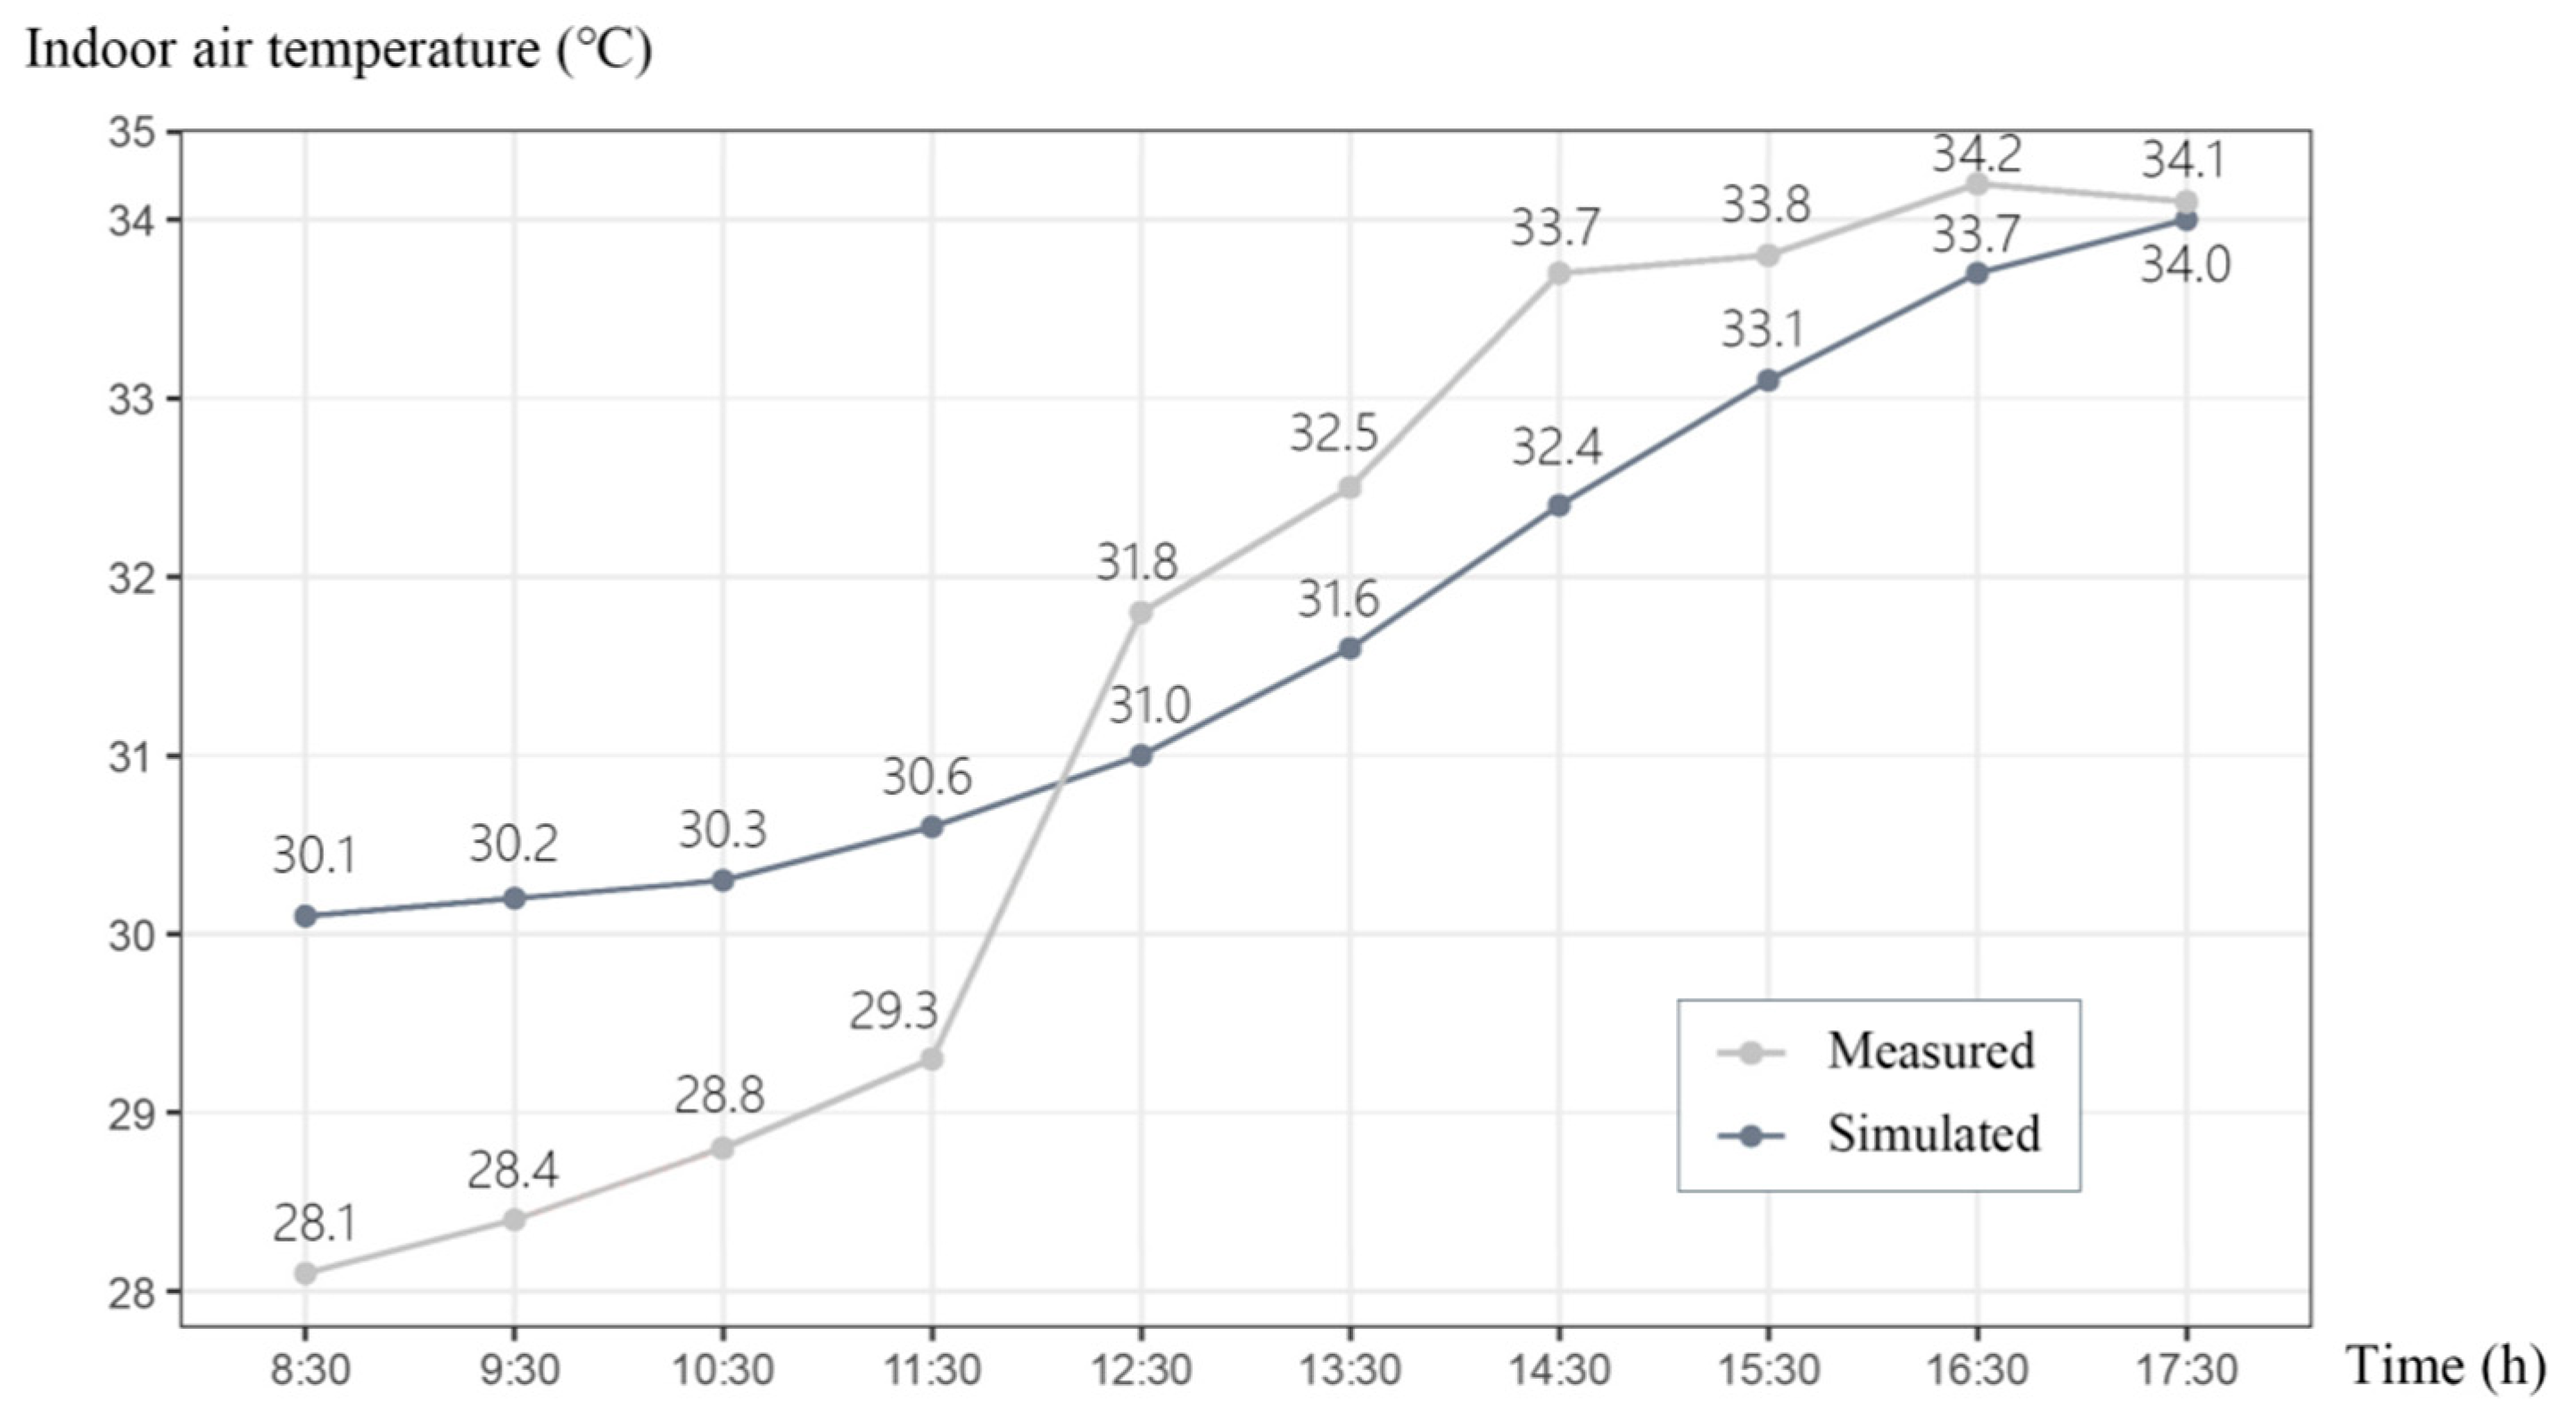
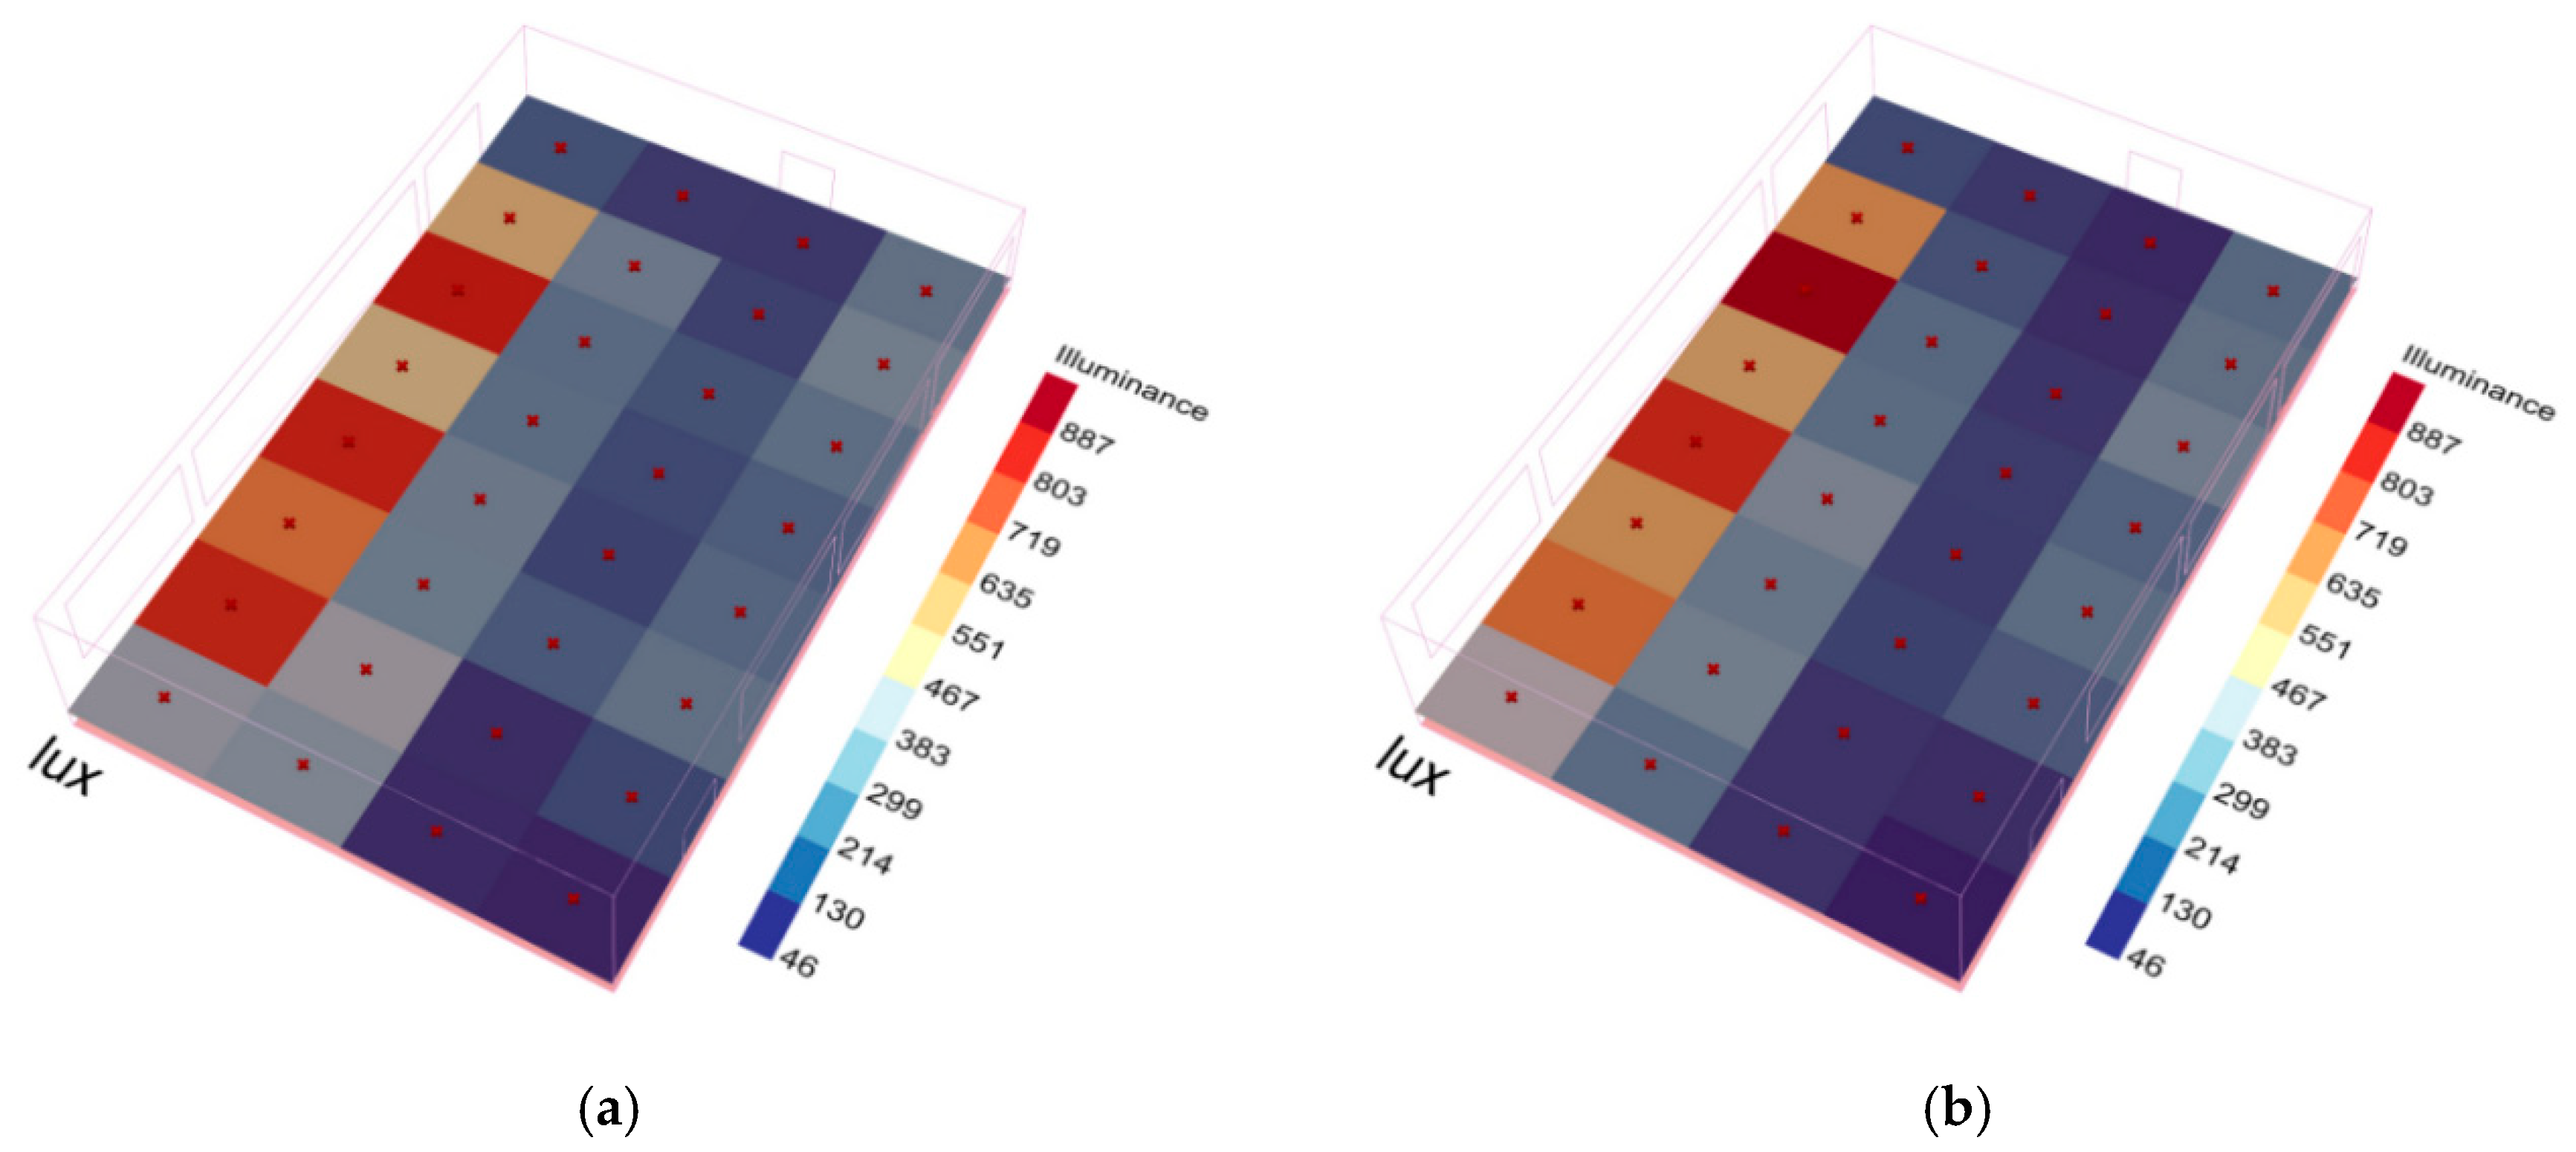
3.1. Model Validation
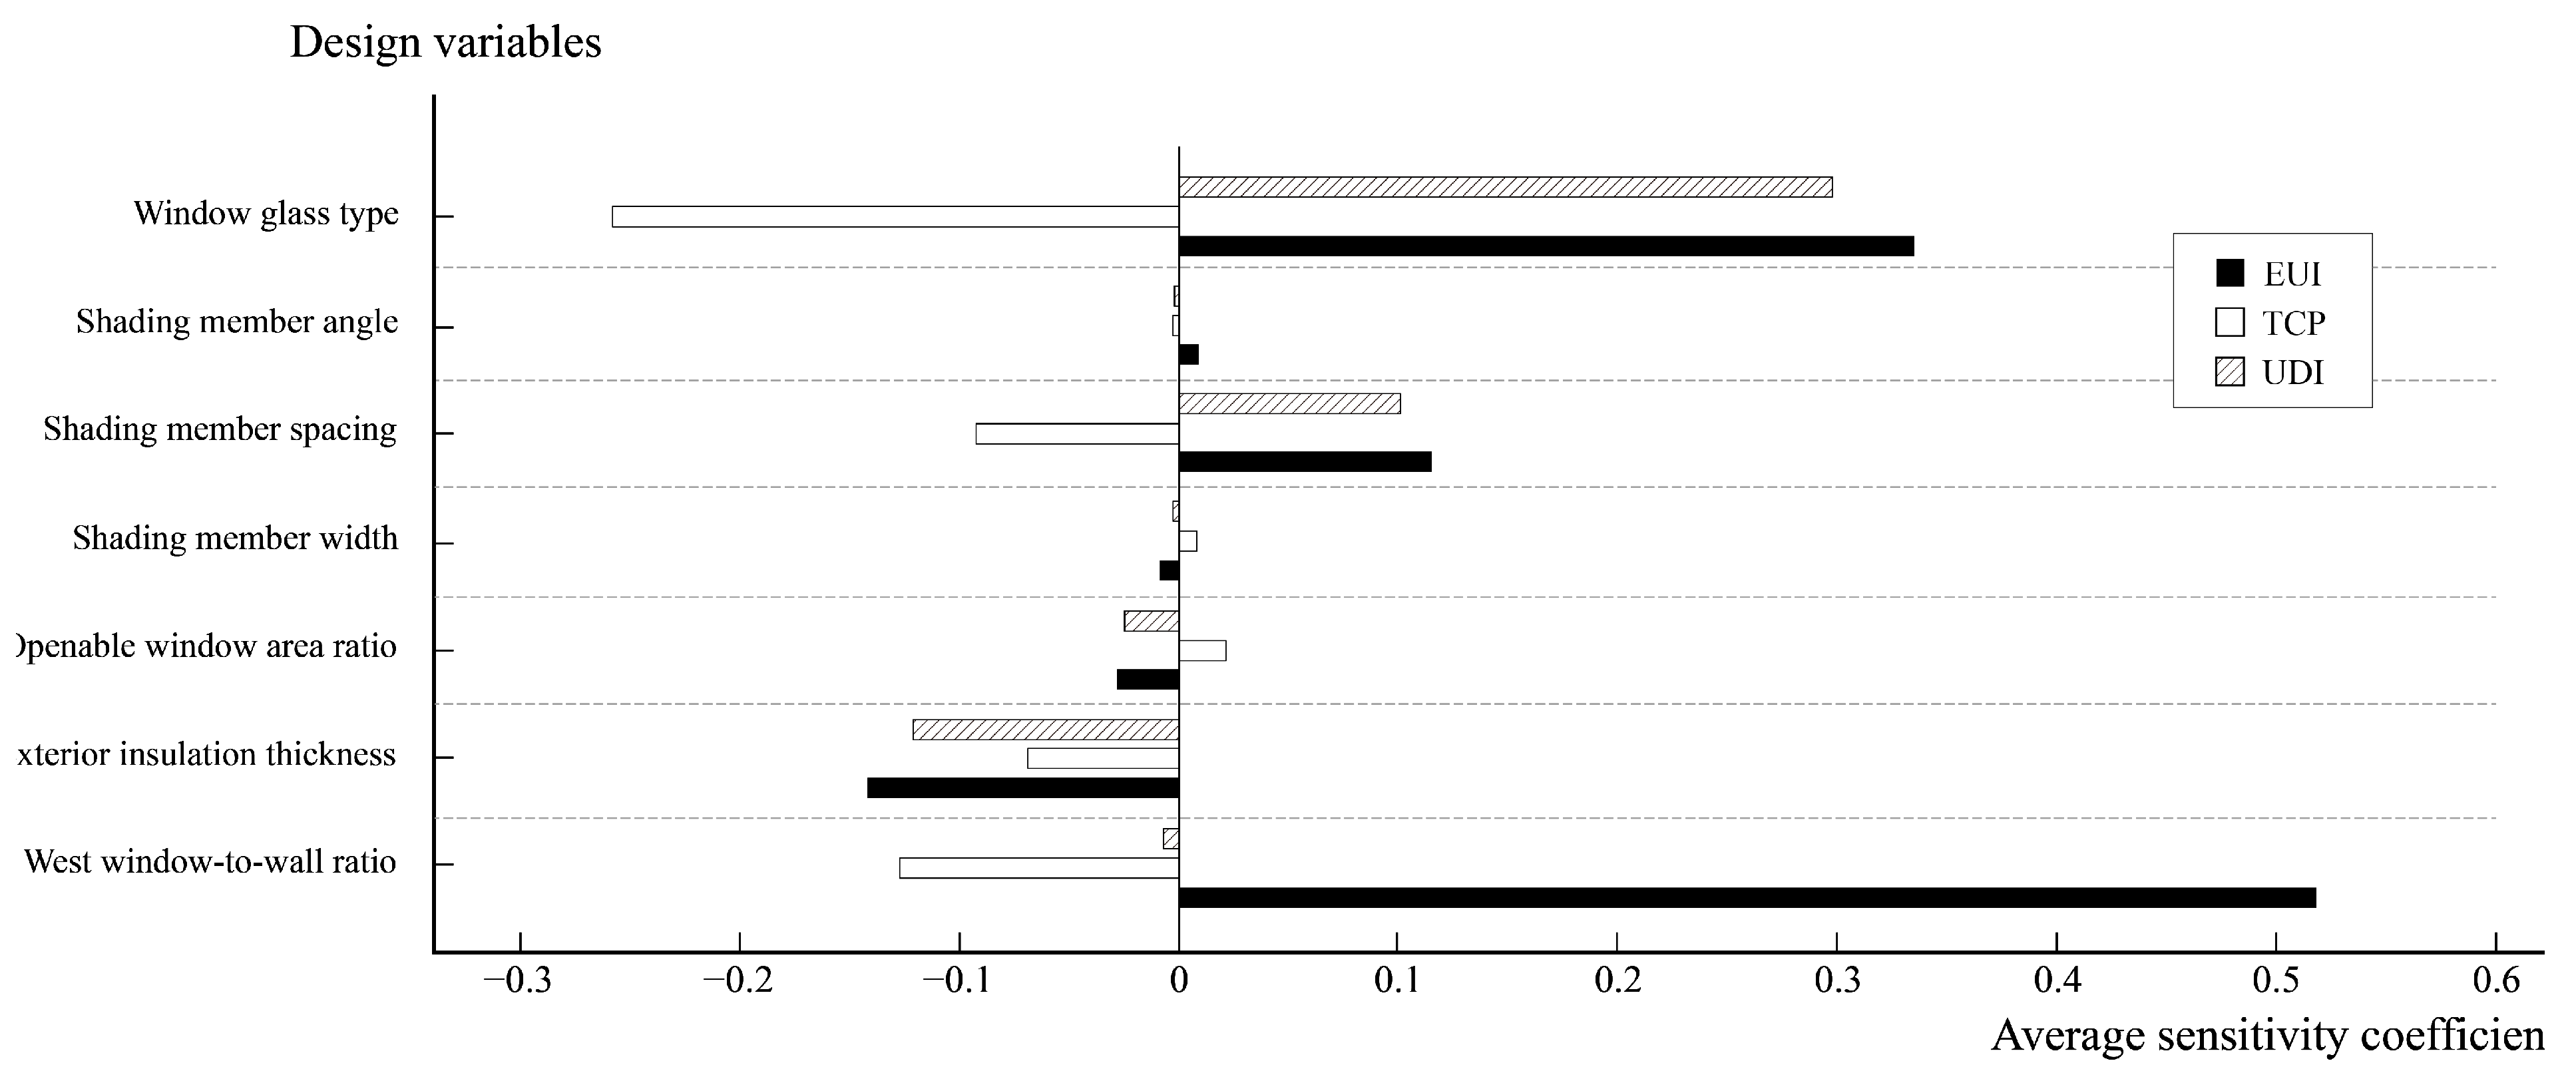
3.2. Sensitivity Analysis
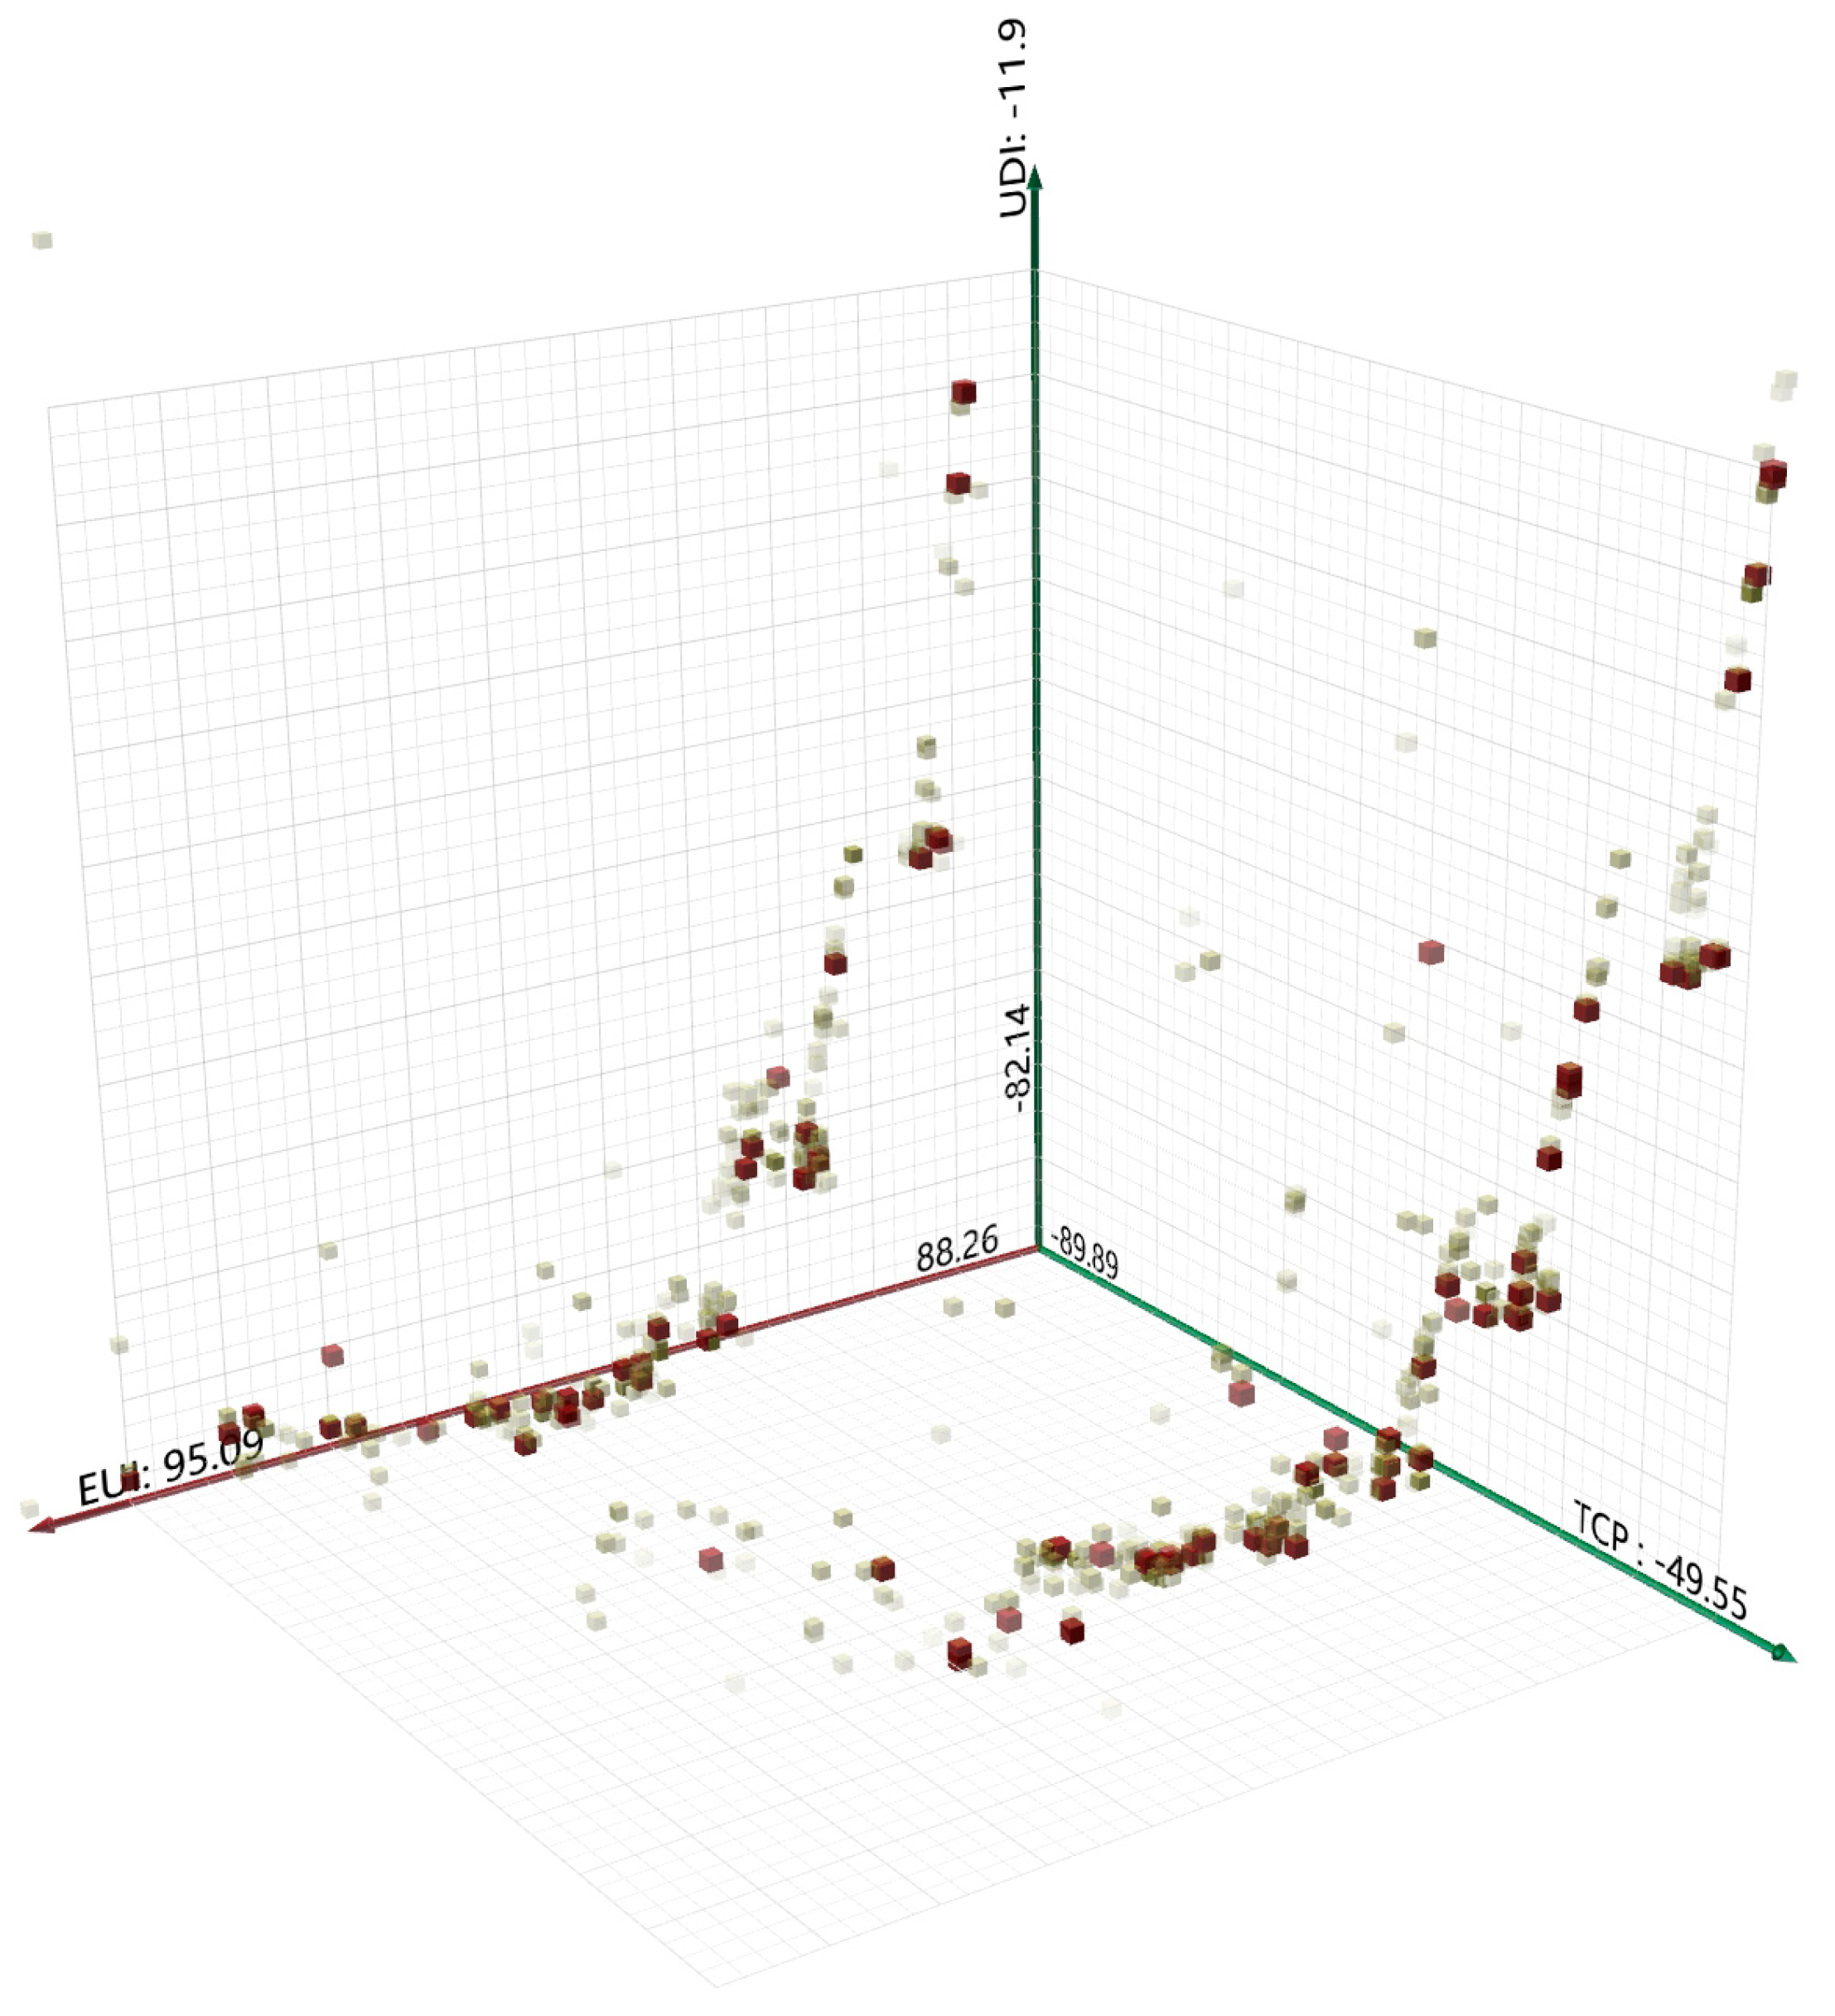
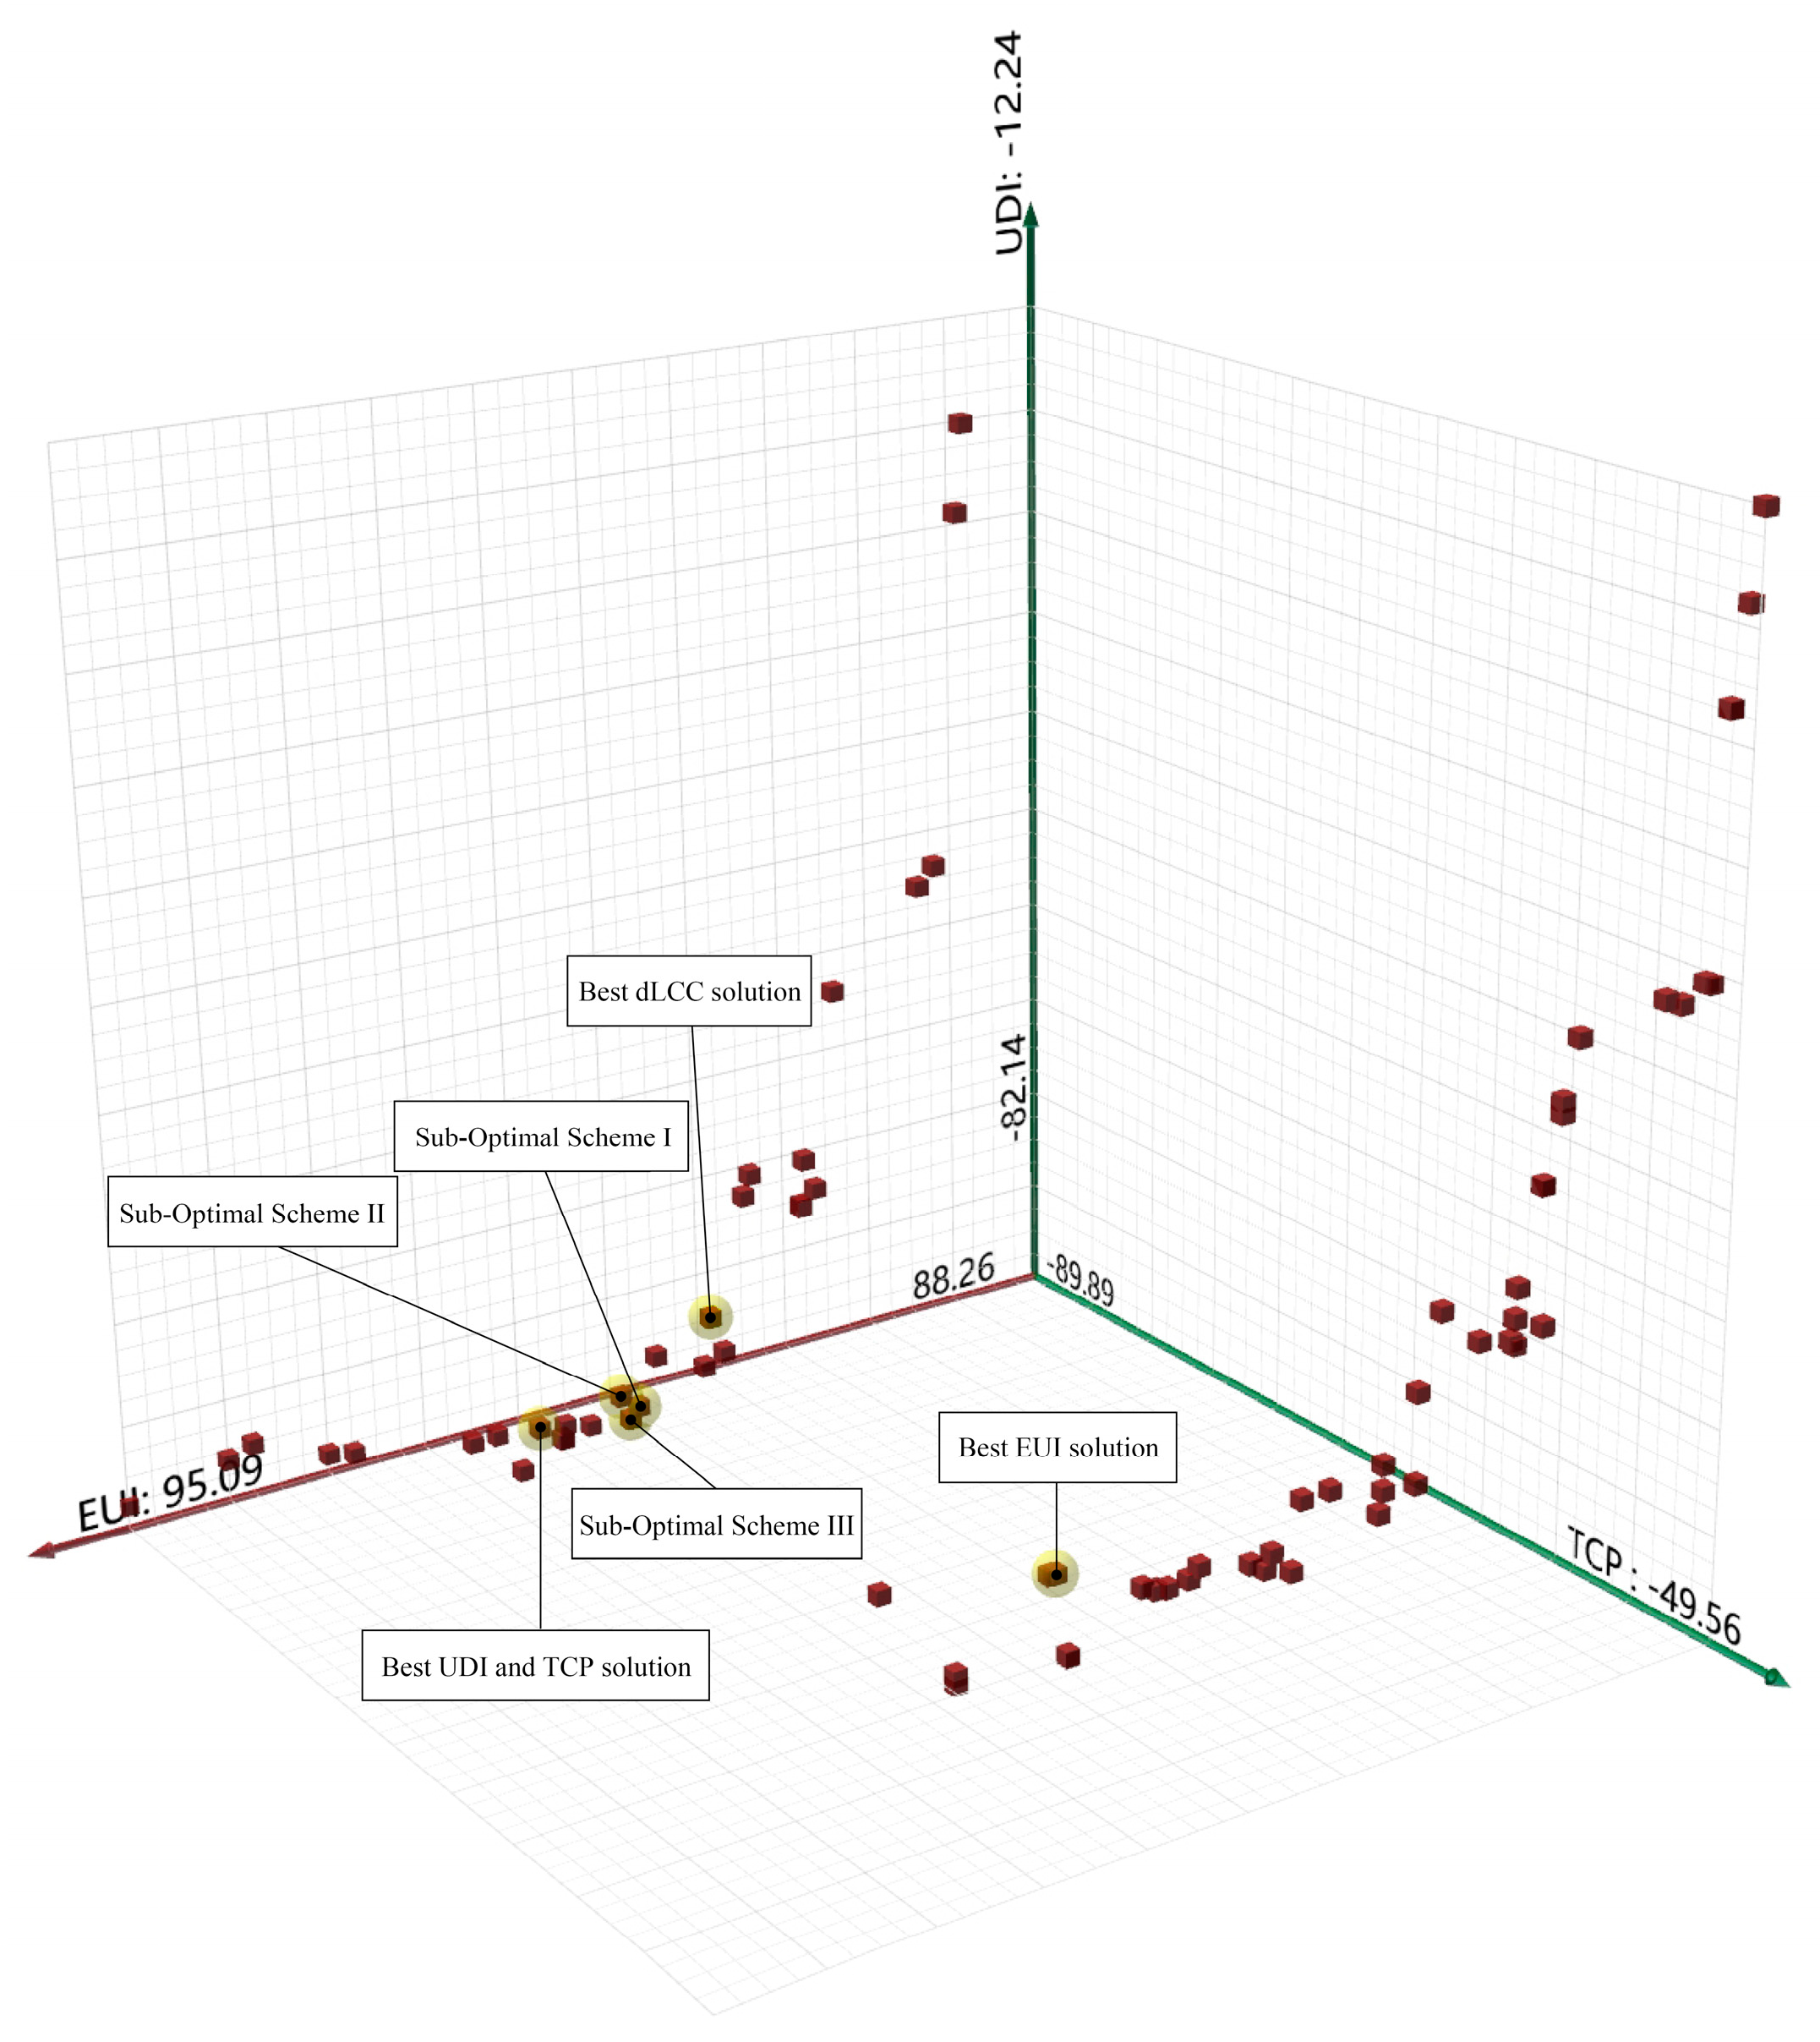
3.3. Multi-Criteria Decision-Making
4. Conclusions
Author Contributions
Funding
Data Availability Statement
Conflicts of Interest
References
- Guo, Y.-Y. Revisiting the building energy consumption in China: Insights from a large-scale national survey. Energy Sustain. Dev. 2022, 68, 76–93. [Google Scholar] [CrossRef]
- Mischke, P.; Karlsson, K.B. Modelling tools to evaluate China’s future energy system—A review of the Chinese perspective. Energy 2014, 69, 132–143. [Google Scholar] [CrossRef]
- China Association of Building Energy Efficiency, Institute of Urban and Rural Construction and Development, Chongqing University. Research report on building energy consumption and carbon emissions in China (2023). Constr. Archit. 2024, 2, 46–59. (In Chinese) [Google Scholar]
- Shan, G.; Youling, X.; Weihui, L. Investigation and analysis on current situation of energy consumption status and application of building technology in public buildings. Heat. Vent. Air Cond. 2024, 54, 30–37. (In Chinese) [Google Scholar]
- Yugen, W.; Tong, W.; Qi, M.; Liu, Y.; Chen, M.; Lou, Y. Analysis of China’s Energy Consumption Situation and Construction of Energy Security System. Coal Geol. China 2024, 36, 38–42. (In Chinese) [Google Scholar]
- Li, P.; Li, Y.; Luo, J.; Liu, B.; Liu, W.; Shi, H. Energy consumption test and energy saving optimization of newly built farm house in cold area. Buil. Energy Effic. 2024, 52, 30–35. [Google Scholar]
- Chua, K.; Chou, S.; Yang, W.; Yan, J. Achieving better energy-efficient air conditioning—A review of technologies and strategies. Appl. Energy 2013, 104, 87–104. [Google Scholar] [CrossRef]
- Ma, D.; Sun, Y.; Ma, S.; Ma, H. Energy consumption characteristics and evaluation of public buildings in Tianjin, China. Energy Built Environ. 2024, in press. [CrossRef]
- Building Energy Efficiency Research Center, Tsinghua University. China Building Energy Efficiency Annual Development Research Report 2022 (Public Buildings Topic) M1; China Building Industry Press: Beijing, China, 2022; Available online: https://xueshu.baidu.com/usercenter/paper/show?paperid=172u0t60cv3a06x0q20q06s0t3059838&site=xueshu_se (accessed on 25 April 2025).
- Wang, Q.; Dang, Y.; Li, G.; Meng, C.; Xie, L.; Liu, M.; Zeng, L. Current situation and prospect of healthy building development in China. Sci. Bull. 2020, 65, 246–255. Available online: https://www.cnki.com.cn/Article/CJFDTotal-FCYY202204027.htm (accessed on 25 April 2025). (In Chinese).
- Kuang, W.; Liu, J.; Dong, J.; Chi, W.; Zhang, C. The rapid and massive urban and industrial land expansions in China between 1990 and 2010: A CLUD-based analysis of their trajectories, patterns, and drivers. Landsc. Urban Plan. 2016, 145, 21–33. [Google Scholar] [CrossRef]
- Chou, J.-S.; Nguyen, H.-M. Simulating long-term energy consumption prediction in campus buildings through enhanced data augmentation and metaheuristic-optimized artificial intelligence. Energy Build. 2024, 312, 114191. [Google Scholar] [CrossRef]
- Afzal, S.; Shokri, A.; Ziapour, B.M.; Shakibi, H.; Sobhani, B. Building energy consumption prediction and optimization using different neural network-assisted models; comparison of different networks and optimization algorithms. Eng. Appl. Artif. Intell. 2024, 127, 107356. [Google Scholar] [CrossRef]
- Kheiri, F. A review on optimization methods applied in energy-efficient building geometry and envelope design. Renew. Sustain. Energy Rev. 2018, 92, 897–920. [Google Scholar] [CrossRef]
- Wang, R.; Lu, S.; Feng, W. A three-stage optimization methodology for envelope design of passive house considering energy demand, thermal comfort and cost. Energy 2020, 192, 116723. [Google Scholar] [CrossRef]
- Wu, C. Research on the Daylighting Environment Design of Auditoriums in Tianjin Area Based on Multi-Objective Optimization. Master’s Thesis, Tianjin University, Tianjin, China, 2020. Available online: https://link.cnki.net/doi/10.27356/d.cnki.gtjdu.2020.003645 (accessed on 25 April 2025). (In Chinese).
- Sadeghi, S.A.; Karava, P.; Konstantzos, I.; Tzempelikos, A. Occupant interactions with shading and lighting systems using different control interfaces: A pilot field study. Build. Environ. 2016, 97, 177–195. [Google Scholar] [CrossRef]
- Xiong, J.; Awalgaonkar, N.M.; Tzempelikos, A.; Bilionis, I.; Karava, P. Efficient learning of personalized visual preferences in daylit offices: An online elicitation framework. Build. Environ. 2020, 181, 107013. [Google Scholar] [CrossRef]
- Lee, M.; Mui, K.; Wong, L.; Chan, W.; Lee, E.; Cheung, C. Student learning performance and indoor environmental quality (IEQ) in air-conditioned university teaching rooms. Build. Environ. 2012, 49, 238–244. [Google Scholar] [CrossRef]
- Makaremi, N.; Schiavoni, S.; Pisello, A.L.; Asdrubali, F.; Cotana, F. Quantifying the effects of interior surface reflectance on indoor lighting. Energy Procedia 2017, 134, 306–316. [Google Scholar] [CrossRef]
- Elliott, M.; Quintino, V. The estuarine quality paradox concept. Encycl. Ecol. 2018, 1, 78–85. [Google Scholar] [CrossRef]
- Lan, L.; Lian, Z. Use of neurobehavioral tests to evaluate the effects of indoor environment quality on productivity. Build. Environ. 2009, 44, 2208–2217. [Google Scholar] [CrossRef]
- da Graça, V.A.C.; Kowaltowski, D.C.C.K.; Petreche, J.R.D. An evaluation method for school building design at the preliminary phase with optimisation of aspects of environmental comfort for the school system of the State São Paulo in Brazil. Build. Environ. 2007, 42, 984–999. [Google Scholar] [CrossRef]
- Amaral, A.R.; Rodrigues, E.; Gaspar, A.R.; Gomes, Á. A thermal performance parametric study of window type, orientation, size and shadowing effect. Sustain. Cities Soc. 2016, 26, 456–465. [Google Scholar] [CrossRef]
- Lee, J.W.; Jung, H.J.; Park, J.Y.; Lee, J.B.; Yoon, Y. Optimization of building window system in Asian regions by analyzing solar heat gain and daylighting elements. Renew. Energy 2013, 50, 522–531. [Google Scholar] [CrossRef]
- Maksoud, A.; Mushtaha, E.; Chouman, L.; Al Jawad, E.; Samra, S.A.; Sukkar, A.; Yahia, M.W. Study on Daylighting Performance in the CFAD Studios at the University of Sharjah. Civ. Eng. Arch. 2022, 10, 2134–2143. [Google Scholar] [CrossRef]
- Acosta, I.; Campano, M.Á.; Leslie, R.; Radetsky, L. Daylighting design for healthy environments: Analysis of educational spaces for optimal circadian stimulus. Sol. Energy 2019, 193, 584–596. [Google Scholar] [CrossRef]
- Puteh, M.; Ibrahim, M.H.; Adnan, M.; Che’aHmad, C.N.; Noh, N.M. Thermal comfort in classroom: Constraints and issues. Procedia—Soc. Behav. Sci. 2012, 46, 1834–1838. [Google Scholar] [CrossRef]
- Zomorodian, Z.S.; Tahsildoost, M.; Hafezi, M. Thermal comfort in educational buildings: A review article. Renew. Sustain. Energy Rev. 2016, 59, 895–906. [Google Scholar] [CrossRef]
- Zeiler, W.; Boxem, G. Effects of thermal activated building systems in schools on thermal comfort in winter. Build. Environ. 2009, 44, 2308–2317. [Google Scholar] [CrossRef]
- Wargocki, P.; Wyon, D.P. The effects of outdoor air supply rate and supply air filter condition in classrooms on the performance of schoolwork by children: ASHRAE 1257-RP. HVAC&R Res. 2007, 13, 165–191. [Google Scholar] [CrossRef]
- Wargocki, P.; Wyon, D.P. The effects of moderately raised classroom temperatures and classroom ventilation rate on the performance of schoolwork by children: ASHRAE 1257-RP. HVAC&R Res. 2007, 13, 193–220. [Google Scholar] [CrossRef]
- Yang, W.; Moon, H.J. Combined effects of acoustic, thermal, and illumination conditions on the comfort of discrete senses and overall indoor environment. Build. Environ. 2019, 148, 623–633. [Google Scholar] [CrossRef]
- Wang, D.; Xu, Y.; Liu, Y.; Wang, Y.; Jiang, J.; Wang, X.; Liu, J. Experimental investigation of the effect of indoor air temperature on students’ learning performance under the summer conditions in China. Build. Environ. 2018, 140, 140–152. [Google Scholar] [CrossRef]
- Wang, C.; Zhang, F.; Wang, J.; Doyle, J.K.; Hancock, P.A.; Mak, C.M.; Liu, S. How indoor environmental quality affects occupants’ cognitive functions: A systematic review. Build. Environ. 2021, 193, 107647. [Google Scholar] [CrossRef]
- Liu, C.; Sun, L.; Jing, X.; Zhang, Y.; Meng, X.; Jia, C.; Gao, W. How correlated color temperature (CCT) affects undergraduates: A psychological and physiological evaluation. J. Build. Eng. 2022, 45, 103573. [Google Scholar] [CrossRef]
- Working Memory. Available online: https://www.taylorfrancis.com/chapters/edit/10.4324/9780429449642-4/working-memory-alan-baddeley (accessed on 25 April 2025).
- Critchley, H.D. Psychophysiology of neural, cognitive and affective integration: FMRI and autonomic indicants. Int. J. Psychophysiol. Off. J. Int. Organ. Psychophysiol. 2009, 73, 88–94. [Google Scholar] [CrossRef]
- Leech, J.A.; Burnett, R.; Nelson, W.; Aaron, S.D.; Raizenne, M. Outdoor Air Pollution Epidemiologic Studies. 2000. Available online: https://www.researchgate.net/publication/306151715_Outdoor_air_pollution_epidemiologic_studies (accessed on 26 April 2025).
- Pisello, A.L.; Cotana, F.; Nicolini, A.; Buratti, C. Effect of dynamic characteristics of building envelope on thermal-energy performance in winter conditions: In field experiment. Energy Build. 2014, 80, 218–230. [Google Scholar] [CrossRef]
- Chwieduk, D.A. Some aspects of energy efficient building envelope in high latitude countries. Sol. Energy 2016, 133, 194–206. [Google Scholar] [CrossRef]
- Amasuomo, T.T.; Amasuomo, J.O. Perceived thermal discomfort and stress behaviours affecting students’ learning in lecture theatres in the humid tropics. Buildings 2016, 6, 18. [Google Scholar] [CrossRef]
- Wang, Y.; Yang, W.; Wang, Q. Multi-objective parametric optimization of the composite external shading for the classroom based on lighting, energy consumption, and visual comfort. Energy Build. 2022, 275, 112441. [Google Scholar] [CrossRef]
- Altun, A.F. Determination of Optimum Building Envelope Parameters of a Room concerning Window-to-Wall Ratio, Orientation, Insulation Thickness and Window Type. Buildings 2022, 12, 383. [Google Scholar] [CrossRef]
- Yao, R.; Short, A. Energy efficient building design. In Design and Management of Sustainable Built Environments; Yao, R., Ed.; Springer: London, UK, 2013; pp. 179–202. [Google Scholar] [CrossRef]
- Almeida, R.M.S.F.; De Freitas, V.P. An insulation thickness optimization methodology for school buildings rehabilitation combining artificial neural networks and life cycle cost. Statyba 2016, 22, 915–923. [Google Scholar] [CrossRef]
- Lakhdari, K.; Sriti, L.; Painter, B. Parametric optimization of daylight, thermal and energy performance of middle school classrooms, case of hot and dry regions. Build. Environ. 2021, 204, 108173. [Google Scholar] [CrossRef]
- Dokhanian, F.; Mohajerani, M.; Nikravan, E.M. Shading design optimization in a semi-arid region: Considering energy consumption, greenhouse gas emissions, and cost. J. Clean. Prod. 2023, 428, 139293.1–139293.19. [Google Scholar] [CrossRef]
- Thalfeldt, M.; Pikas, E.; Kurnitski, J.; Voll, H. Facade design principles for nearly zero energy buildings in a cold climate. Energy Build. 2013, 67, 309–321. [Google Scholar] [CrossRef]
- Zhao, M.; Künzel, H.M.; Antretter, F. Parameters influencing the energy performance of residential buildings in different Chinese climate zones. Energy Build. 2015, 96, 64–75. [Google Scholar] [CrossRef]
- Wu, H.; Zhang, T. Multi-objective optimization of energy, visual, and thermal performance for building envelopes in China’s hot summer and cold winter climate zone. J. Build. Eng. 2022, 59, 105034. [Google Scholar] [CrossRef]
- Fesanghary, M.; Asadi, S.; Geem, Z.W. Design of low-emission and energy-efficient residential buildings using a multi-objective optimization algorithm. Build. Environ. 2012, 49, 245–250. [Google Scholar] [CrossRef]
- Yuan, F.; Yao, R.; Sadrizadeh, S.; Li, B.; Cao, G.; Zhang, S.; Zhou, S.; Liu, H.; Bogdan, A.; Croitoru, C.; et al. Thermal comfort in hospital buildings—A literature review. J. Build. Eng. 2022, 45, 103463. [Google Scholar] [CrossRef]
- Ma, N.; Aviv, D.; Guo, H.; Braham, W.W. Measuring the right factors: A review of variables and models for thermal comfort and indoor air quality. Renew. Sustain. Energy Rev. 2021, 135, 110436. [Google Scholar] [CrossRef]
- Sharma, A.; Kumar, A.; Kulkarni, K.S. Thermal comfort studies for the naturally ventilated built environments in Indian subcontinent: A review. J. Build. Eng. 2021, 44, 103242. [Google Scholar] [CrossRef]
- Yüksel, A.; Arıcı, M.; Krajčík, M.; Civan, M.; Karabay, H. A review on thermal comfort, indoor air quality and energy consumption in temples. J. Build. Eng. 2021, 35, 102013. [Google Scholar] [CrossRef]
- Zou, Y.; Lou, S.; Xia, D.; Lun, I.Y.; Yin, J. Multi-objective building design optimization considering the effects of long-term climate change. J. Build. Eng. 2021, 44, 102904. [Google Scholar] [CrossRef]
- Chaturvedi, S.; Rajasekar, E.; Natarajan, S. Multi-objective Building Design Optimization under Operational Uncertainties Using the NSGA II Algorithm. Buildings 2020, 10, 88. [Google Scholar] [CrossRef]
- Li, H.; Wang, S.; Tang, R. Robust optimal design of zero/low energy buildings considering uncertainties and the impacts of objective functions. Appl. Energy 2019, 254, 113683. [Google Scholar] [CrossRef]
- Ladybugtools. 2025. Available online: https://www.ladybug.tools/ (accessed on 15 May 2025).
- Roudsari, M.S.; Pak, M.; Smith, A. Ladybug: A parametric environmental plugin for grasshopper to help designers create an environmentally-conscious design. In Proceedings of the 13th International IBPSA Conference, Chambery, France, 25–28 August 2013; pp. 3128–3135. Available online: https://publications.ibpsa.org/conference/paper/?id=bs2013_2499 (accessed on 26 April 2025).
- Grasshopper. 2025. Available online: https://www.grasshopper3d.com/ (accessed on 15 May 2025).
- Rhinoceros. 2025. Available online: https://www.rhino3d.com (accessed on 15 May 2025).
- Radiance. 2025. Available online: http://radsite.lbl.gov/radiance/ (accessed on 15 May 2025).
- EnergyPlus. 2025. Available online: https://energyplus.net (accessed on 15 May 2025).
- Luo, Z.; Lu, Y.; Cang, Y.; Yang, L. Study on dual-objective optimization method of life cycle energy consumption and economy of office building based on HypE genetic algorithm. Energy Build. 2022, 256, 111749. [Google Scholar] [CrossRef]
- Nabil, A.; Mardaljevic, J. Useful daylight illuminances: A replacement for daylight factors. Energy Build. 2006, 38, 905–913. [Google Scholar] [CrossRef]
- GB 50352–2019; Uniform Standard for Design of Civil Buildings. National Standard of the People’s Republic of China. China Architecture & Building Press: Beijing, China, 2019.
- van Hoof, J. Forty years of Fanger’s model of thermal comfort: Comfort for all? Indoor Air 2008, 18, 182–201. [Google Scholar] [CrossRef]
- ANSI/ASHRAE Standard 55-2023; Thermal Environmental Conditions for Human Occupancy. American Society of Heating, Refrigerating and Air-Conditioning Engineers: Atlanta, GA, USA, 2023.
- ISO 7730; Ergonomics of the Thermal Environment—Analytical Determination and Interpretation of Thermal Comfort Using Calculation of the PMV and PPD Indices and Local Thermal Comfort Criteria. International Standard Organization: Genève, Switzerland, 2005.
- Liu, N.; Qin, Y. Building Thermal Environment; Tsinghua University Press: Beijing, China, 2005. (In Chinese) [Google Scholar]
- GB50736-2012; Design Code for Heating, Ventilation and Air Conditioning of Civil Buildings. Ministry of Housing and Urban-Rural Development (MOHURD): Beijing, China, 2012.
- Borgstein, E.; Lamberts, R.; Hensen, J. Evaluating energy performance in non-domestic buildings: A review. Energy Build. 2016, 128, 734–755. [Google Scholar] [CrossRef]
- Star, E. Energy Star®. Program Requirements for Residential. 2010. Available online: https://www.responsibilityreports.co.uk/HostedData/ResponsibilityReportArchive/k/NYSE_KRC_2016.pdf (accessed on 26 April 2025).
- Shao, T.; Zhang, N.; Zhang, K.; Zheng, W.; Wang, J. Multi-objective collaborative optimization design for rural residential buildings in Xi’an using SVM and NSGA-II algorithms. Build. Sci. 2024, 10, 0232–0243. (In Chinese) [Google Scholar]
- Xue, Q.; Wang, Z.; Chen, Q. Multi-objective optimization of building design for life cycle cost and CO2 emissions: A case study of a low-energy residential building in a severe cold climate. Build. Simul. 2022, 15, 83–98. [Google Scholar] [CrossRef]
- Reinhart, C.F.; Andersen, M. Development and validation of a Radiance model for a translucent panel. Energy Build. 2006, 38, 890–904. [Google Scholar] [CrossRef]
- Guideline, A. Measurement of energy, demand, and water savings. ASHRAE Guidel. 2014, 4, 1–150. [Google Scholar]
- McNeil, A.; Lee, E. A validation of the Radiance three-phase simulation method for modelling annual daylight performance of optically complex fenestration systems. J. Build. Perform. Simul. 2013, 6, 24–37. [Google Scholar] [CrossRef]
- Merghani, A.H.; Bahloul, S.A. Comparison between radiance daylight simulation software results and Measured on-site data. J. Build. Road Res. 2016, 20, 48–69. [Google Scholar] [CrossRef]

| Parameter Category | Parameter Name | Parameter Value |
|---|---|---|
| Personnel and equipment | Number of students Per capita occupied use area/(m2/person) | 300 |
| 0.17 | ||
| Personnel activity/W | 120 | |
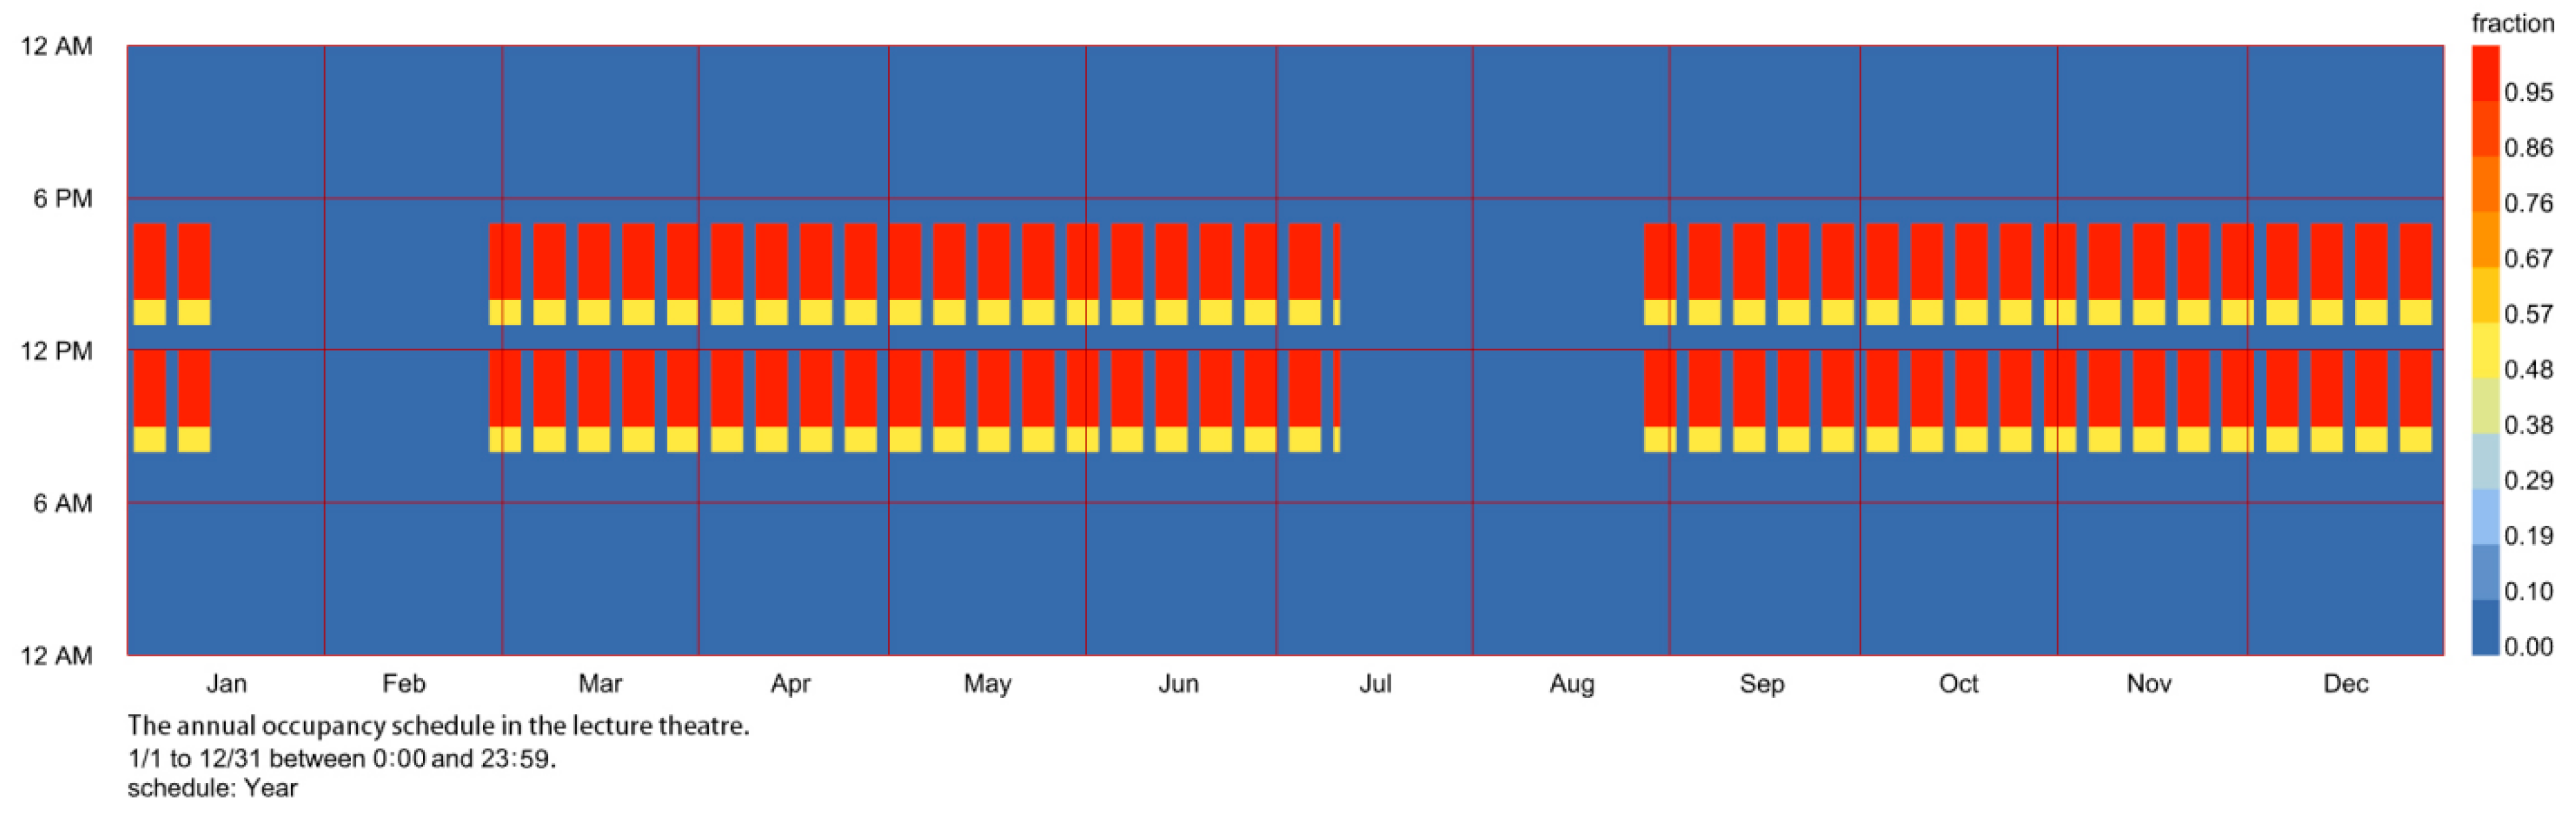
| Student use time | 8:30–12:00, 13:30–17:00 | |
| Winter Vacation Interval | 15 January–25 February | |
| Summer Vacation Interval | 11 July–27 August | |
| Illumination | Equipment power density/(W/m2) | 5 |
| Lighting power density/(W/m2) | 8 | |
| Calculated plane height of lighting/m | 0.75 | |
| Lighting calculation area grid width/m | 1 | |
| Air conditioning, heating and fresh air volume | Air conditioning on time in summer | 20 May–20 September |
| Ground-source heat pump on time in winter | 15 November–15 March of the following year | |
| Fresh air volume/(m3/h·person) | 30 | |
| Other parameters | Permeability/(m3/(s·m2)) | 0.0003 |
| Material Location | Input Parameter | Material Type |
|---|---|---|
| interior wall | Reflectivity: 0.75 | Radiance Opaque |
| ground level | Reflectivity: 0.62 | Radiance Opaque |
| awning (under ceiling) | Reflectivity: 0.75 | Radiance Opaque |
| fiberglass | Transmittance: 0.68 | Radiance Glass |
| Human Thermal Sensation | Hot | Quite Hot | Slightly Hot | Comfortable | Slightly Cold | Quite Cold | Very Cold |
|---|---|---|---|---|---|---|---|
| PMV value | 3 | 2 | 1 | 0 | −1 | −2 | −3 |
| Materials | Thicknesses (mm) | Thermal Conductivity λ [W/(m·K)] | Dry Density ρ0(kg/m3) | Specific Heat Capacity C [J/(kg·K)] | Solar Heat Gain Coefficient (SHGC) | |
|---|---|---|---|---|---|---|
| External wall | cement mortar | 20 | 0.93 | 1800 | 1050 | -- |
| extruded polystyrene insulation board (with epidermis) | 20 | 0.032 | 35 | 1380 | -- | |
| cement mortar | 20 | 0.93 | 1800 | 1050 | -- | |
| reinforced concrete | 200 | 1.74 | 2500 | 920 | -- | |
| mortar mix | 20 | 0.81 | 1600 | 1050 | -- | |
| Interior wall | mortar mix | 20 | 0.81 | 1600 | 1050 | -- |
| aerated concrete block | 200 | 0.14 | 500 | 1050 | -- | |
| mortar mix | 20 | 0.81 | 1600 | 1050 | -- | |
| Roof | mineral wool board ceiling | 10 | 0.05 | 130 | 1220 | -- |
| mortar mix | 20 | 0.81 | 1600 | 1050 | -- | |
| reinforced concrete | 150 | 1.74 | 2500 | 920 | -- | |
| aerated concrete | 80 | 0.18 | 700 | 1050 | -- | |
| cement mortar | 20 | 0.93 | 1800 | 1050 | -- | |
| extruded polystyrene insulation board (with epidermis) | 20 | 0.032 | 35 | 1380 | -- | |
| crushed stone, pebble concrete | 4 | 1.51 | 2300 | 920 | -- | |
| Fiberglass | 6 mm high transmittance low-E glass + 12 mm air + 6 mm clear glass | 30 | -- | -- | -- | 0.444 |
| Optimizing Variable Names | Typology | Range of Values |
|---|---|---|
| West window-to-wall ratio | continuous variable | 0.1~0.9 |
| Insulation thickness | continuous variable | 0.01 m~0.1 m |
| Ratio of openable window area | continuous variable | 0.1~1 |
| Exterior window glass type | discrete variable | 4 types (A~D) |
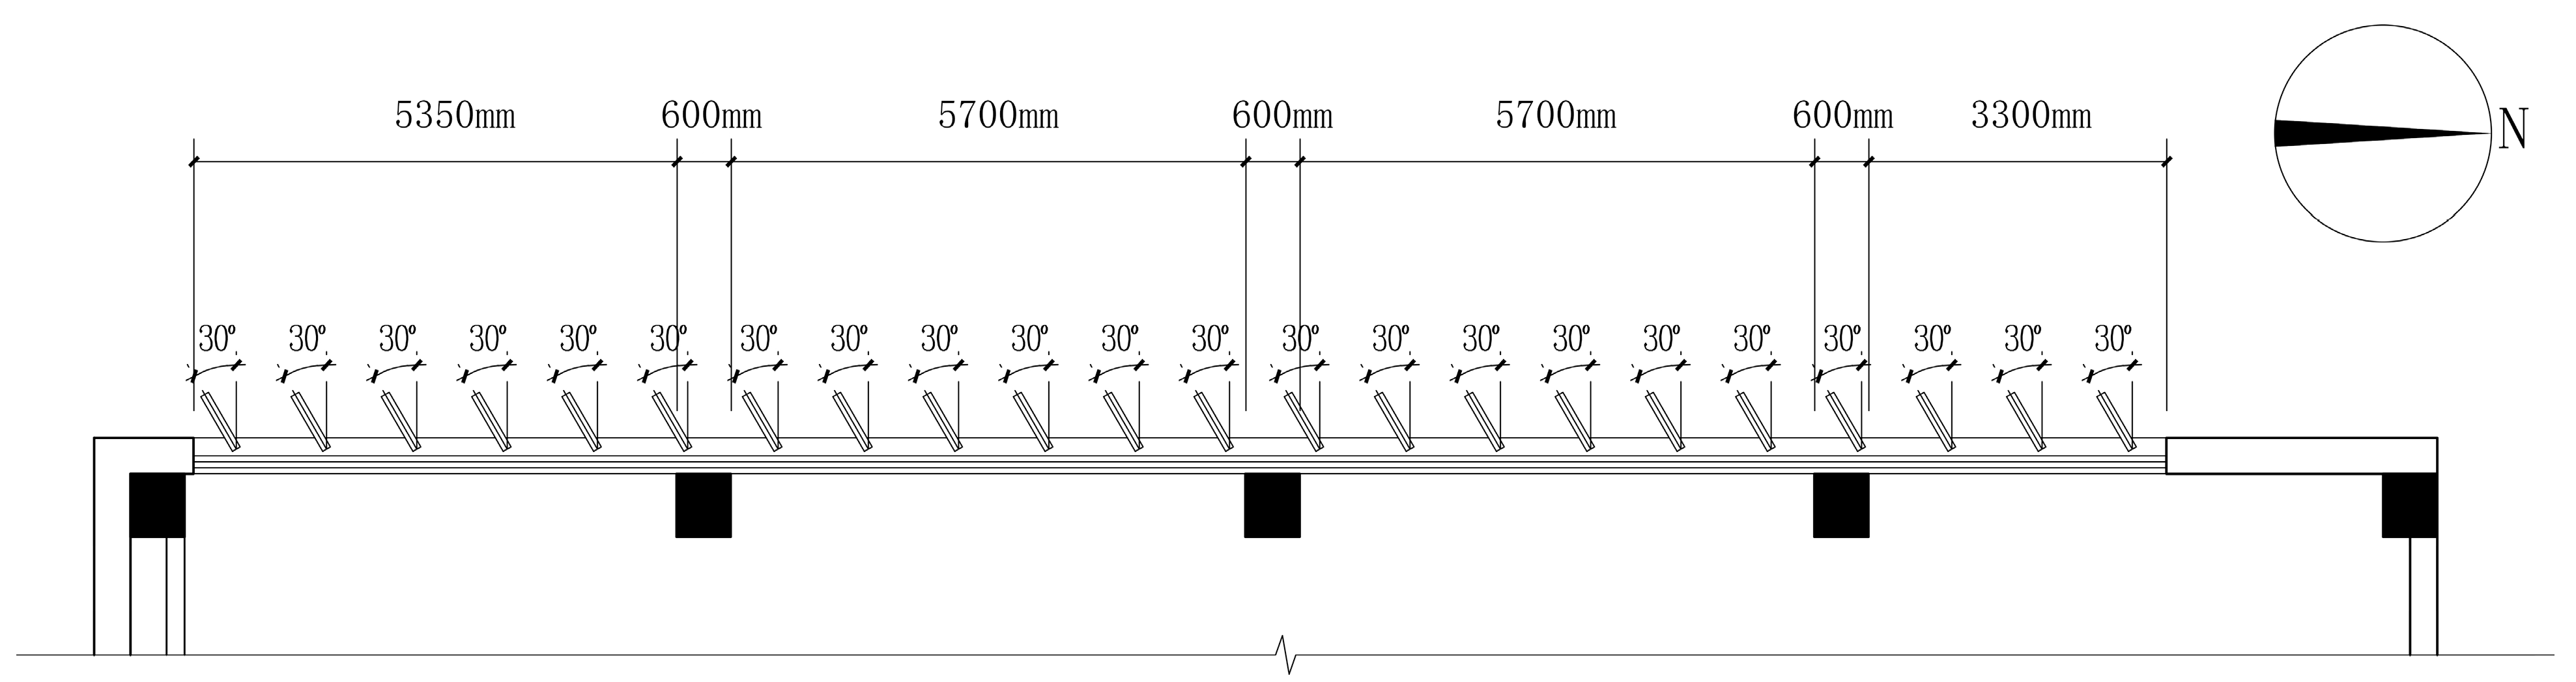
| Spacing of shading elements | continuous variable | 0.1 m~1 m |
| Angle of shading elements | continuous variable | −90°~90° |
| Depth of shading elements | continuous variable | 0.1 m~1 m |
| Glass Type | Operation | Heat Transfer Coefficient K W/(m·K) | Shading Coefficient (SC) | Visible Light Transmission Ratio Tvis |
|---|---|---|---|---|
| A. Double-glazed single low-E insulating glass | 6Low-E + 12Ar + 6 | 1.44 | 0.338 | 0.478 |
| B. Triple-glazed, two-cavity single low-E insulating glass | 6Low-E + 9Ar + 6 + 12Ar + 6 | 1.17 | 0.395 | 0.557 |
| C. Triple-glazed, two-cavity double low-E insulating glass | 6Low-E + 12Ar + 6 + 12Ar + 6Low-E | 0.75 | 0.367 | 0.423 |
| D. Vacuum-composite insulating single low-E glass | 6 + 12A + 6Low-E + V + 6 | 0.52 | 0.322 | 0.434 |
| Design Variable Parameters | EUI Weighting | TCP Weighting | UDI Weights |
|---|---|---|---|
| West window-to-wall ratio | 39.29% | 17.66% | 0.77% |
| Insulation thickness | 11.48% | 15.83% | 18.45% |
| Ratio of openable window area | 2.71% | 3.67% | 4.47% |
| Spacing of shading elements | 11.34% | 15.36% | 18.68% |
| Angle of shading elements | 1.64% | 2.14% | 2.49% |
| Depth of shading elements | 0.77% | 1.08% | 1.32% |
| Exterior window glass type | 32.76% | 44.26% | 53.82% |
| Optimization Indicators | Entropy Weight |
|---|---|
| EUI | 0.1649 |
| TCP | 0.1876 |
| UDI | 0.4864 |
| dLCC | 0.1611 |
| Rankings | EUI | TCP | UDI | dLCC | TOPSIS Ranking | VIKOR Ranking | RSR Ranking |
|---|---|---|---|---|---|---|---|
| 1 | 91.99 | 84.39 | 78.63 | −23.53 | 17 | 6 | 49 |
| 2 | 92.08 | 84.82 | 77.96 | −22.92 | 18 | 8 | 47 |
| 3 | 92.05 | 84.48 | 79.38 | −22.46 | 14 | 2 | 58 |
| 4 | 92.08 | 84.82 | 79.19 | −22.92 | 16 | 5 | 57 |
| 5 | 91.97 | 83.84 | 75.62 | −20.96 | 20 | 20 | 40 |
| Program Name | Research Objective | Optimization Rate | Economic Indicator | ||||
|---|---|---|---|---|---|---|---|
| Energy Use Intensity/(kWh/m2/y) | Optical Comfort Time Ratio/(%) | Thermal Comfort Time Ratio/(%) | Construction Total Energy Consumption/(%) | Optical Comfort Time Ratio/(%) | Thermal Comfort Time Ratio/(%) | Whole Life Cost Differential (USD/m2) | |
| Initial program | 102.13 | 71.92 | 63.55 | -- | -- | -- | -- |
| Optimal energy consumption | 91.08 | 80.11 | 65.46 | 10.82% | 11.39% | 3.01% | −14.27 |
| Optimal light and thermal comfort | 92.50 | 81.12 | 86.69 | 9.43% | 12.79% | 36.41% | −0.03 |
| Economically optimal | 91.66 | 71.94 | 82.35 | 10.26% | 0.03% | 29.58% | −38.71 |
| Preferred option I | 91.99 | 78.63 | 84.39 | 9.93% | 9.33% | 32.79% | −23.53 |
| Preferred option II | 92.08 | 77.96 | 84.82 | 9.84% | 8.40% | 33.47% | −22.92 |
| Preferred option III | 92.05 | 79.38 | 84.48 | 9.87% | 10.37% | 32.93% | −22.46 |
Disclaimer/Publisher’s Note: The statements, opinions and data contained in all publications are solely those of the individual author(s) and contributor(s) and not of MDPI and/or the editor(s). MDPI and/or the editor(s) disclaim responsibility for any injury to people or property resulting from any ideas, methods, instructions or products referred to in the content. |
© 2025 by the authors. Licensee MDPI, Basel, Switzerland. This article is an open access article distributed under the terms and conditions of the Creative Commons Attribution (CC BY) license (https://creativecommons.org/licenses/by/4.0/).
Share and Cite
Xi, H.; Guo, S.; Hou, W.; Wang, B. A Multi-Objective Optimization Study on a Certain Lecture Hall Based on Thermal and Visual Comfort. Buildings 2025, 15, 2287. https://doi.org/10.3390/buildings15132287
Xi H, Guo S, Hou W, Wang B. A Multi-Objective Optimization Study on a Certain Lecture Hall Based on Thermal and Visual Comfort. Buildings. 2025; 15(13):2287. https://doi.org/10.3390/buildings15132287
Chicago/Turabian StyleXi, Hui, Shichao Guo, Wanjun Hou, and Bo Wang. 2025. "A Multi-Objective Optimization Study on a Certain Lecture Hall Based on Thermal and Visual Comfort" Buildings 15, no. 13: 2287. https://doi.org/10.3390/buildings15132287
APA StyleXi, H., Guo, S., Hou, W., & Wang, B. (2025). A Multi-Objective Optimization Study on a Certain Lecture Hall Based on Thermal and Visual Comfort. Buildings, 15(13), 2287. https://doi.org/10.3390/buildings15132287