2. State-of-the-Art Review
Previous studies have explored the effects of high temperatures on the physical and mechanical properties of natural stones. These investigations have focused on a range of characteristics, such as porosity [
2], bulk density, and colour change [
3,
4,
5]. Other research has concentrated on mechanical parameters, including compressive and tensile strength, the modulus of elasticity, and the propagation of seismic waves [
6,
7,
8,
9], as well as acoustic emissivity [
10].
Several studies have compared results under varying cooling methods (e.g., water vs. air cooling) and different heating procedures. Additionally, some research indicates that mechanical properties can evolve over time, depending on whether samples are tested immediately after heating or after a delay of several hours or days. Although thermal exposure consistently impacts stone properties, the extent and nature of these changes depend greatly on the specific type of stone, highlighting the importance of individual material analysis.
Liu, Chen, and Su [
6] examined limestone samples from the Hebei region in China, subjecting them to seven temperature levels ranging from 100 °C to 475 °C. The samples underwent both uniaxial compressive strength (UCS) tests and Brazilian tensile strength tests after cooling. Deformation during these tests was monitored using Digital Image Correlation (DIC) technology. Their findings showed that high temperatures significantly compromised the mechanical performance of the limestone, with notable reductions in strength properties compared to baseline values at 25 °C. Sensitivity analyses were then applied to assess the interaction between physical and mechanical property changes.
Yu and colleagues [
8] conducted a study on sandstone from the Jiangxi region of China. Samples were heated to four temperatures ranging from 200 °C to 800 °C. Due to extensive structural damage, those heated to 800 °C were excluded from testing. The remaining samples were cooled and evaluated using both uniaxial compressive and triaxial shear tests. While samples treated at 200 °C showed a slight increase in stress, significant strength deterioration was evident at 600 °C. Under triaxial loading, peak stress initially increased at 200 °C but subsequently declined with further heating, especially beyond 400 °C.
Zhang et al. [
10] investigated sandstone samples subjected to temperatures ranging from 200 °C to 1000 °C. After heating, samples were maintained at target temperatures for two hours and then cooled inside the furnace. UCS tests were performed at a loading rate of 500 N/s, with acoustic emission sensors recording the formation of cracks. The results showed that heat treatment altered the microcrack network, which in turn led to changes in the sandstone’s macroscopic mechanical properties.
Tian, Ziegler, and Kempka [
4] focused on claystone from North Rhine-Westphalia, Germany. Samples were heated to eight distinct temperatures between 80 °C and 1000 °C and held for two hours before furnace cooling. UCS testing revealed an increase in strength up to 800 °C, followed by a sharp decline at 1000 °C, where residual strength was approximately 40% of the room temperature value.
Vagnon et al. [
2] studied Italian marble from the Valdieri region, subjecting it to temperatures from 105 °C to 600 °C for 24 h before slow cooling. They measured changes in porosity, density, UCS, and seismic wave velocity. The critical threshold was identified at 400 °C, beyond which a marked deterioration in mechanical properties and an increase in porosity were observed. The decline in strength followed an exponential pattern, consistent with other studies.
Yin and colleagues [
11] explored the behaviour of Laurentian granite from Canada under high temperatures, focusing on both static and dynamic tensile strength. While static strength declined steadily with temperature, dynamic tensile strength exhibited three phases: a slight increase up to 100 °C, stability between 100 °C and 450 °C, and a significant drop beyond 450 °C. High-speed cameras captured the failure of samples under dynamic load.
A study on grey sandstone from a mine roof in Shandong was conducted by Yang et al. [
12]. The research focused on changes in the mechanical and physical properties of samples subjected to heating and cooling at temperatures ranging from 25 °C to 900 °C, using a heating rate of 5 °C/min. Following thermal exposure, XRD analysis was performed to identify mineralogical changes induced by high temperatures. SEM analysis was used to observe the formation and development of thermal cracks as temperature increased. Tensile strength was also measured and found to decrease with rising temperature.
Jin et al. [
13] investigated the effects of elevated temperatures on the properties of sandstone. The samples were heated to four different temperatures, ranging from 300 °C to 650 °C. In terms of physical property changes, an increase in volume and a decrease in mass were observed with rising temperature, primarily due to water evaporation. As for mechanical properties, a slight increase in strength was observed up to 300 °C, followed by a progressive decline as temperatures increased further.
Some studies involve the comparison of multiple stone types. Vigroux et al. [
14] evaluated six limestones and one sandstone from various French regions. Specimens were divided into two groups: one analysed thermal expansion, relative weight, and heat flow after exposure to 250 °C, 500 °C, and 750 °C, while the other assessed changes in UCS, tensile strength, and P-wave velocity at 200 °C, 400 °C, 600 °C, and 800 °C. Although general trends were difficult to establish, most samples exhibited stable mechanical properties up to 400 °C, with degradation accelerating at higher temperatures. An exception was noted in a granular sample with minimal binding material, which showed early deterioration. Biró, Hlavička, and Lublóy [
15] tested four natural stones used in Hungarian construction: Rosa beta granite, Polish labradorite, Hungarian travertine, and Austrian limestone. After heating samples between 200 °C and 700 °C, both UCS and Brazilian tensile strength tests were conducted. Changes in density and porosity were also recorded. While granite and labradorite showed minimal density variation, limestone and travertine exhibited increasing porosity with temperature. Across all the materials, mechanical properties declined.
In addition to experimental investigations of thermally induced changes in stone, recent studies have also explored data-driven approaches for post-fire assessment. Hacıefendioğlu et al. [
16] examined the potential of using deep learning and convolutional neural networks to classify stone samples based on the temperature they were exposed to. The study compared several models in terms of their classification accuracy, with the Xception model achieving the best performance. Such an approach could be highly useful in the future for evaluation of fire-damaged stone materials, particularly in heritage conservation and structural diagnostics.
2.1. Heating Methods
In real fires, structures rarely heat uniformly. Due to varying cross-sectional thickness and the presence of combustible materials, some areas may experience direct flame contact, while others are indirectly heated. Items like wooden floors, furniture, and book collections can generate ash and soot during combustion, which adheres to stone surfaces and contributes to material degradation. McCabe et al. [
3] compared the effects of furnace heating and real-fire exposure on sandstone. Their study revealed that soot formed an impermeable surface layer that hindered salt efflorescence, leading to sub-surface crystallization and eventual delamination.
Although testing with real fires most accurately simulates actual conditions, such methods are inherently non-repeatable and difficult to standardize. As a result, most researchers employ electric muffle furnaces, which offer controlled heating by conduction. These devices allow precise regulation of temperature, heating rate, and exposure duration, making the results reproducible and suitable for comparison [
17].
For smaller specimens, laser irradiation may be employed. This method uses focused infrared radiation, similar to that in real fires, to induce microscopic changes. While effective for studying microstructural transformations, laser heating is unsuitable for assessing bulk material behaviour [
18].
Apart from the different heating methods, the rate of heating has been identified as a critical factor influencing the thermal response of natural stones. Several studies have focused on how different heating rates affect mechanical performance and structural integrity. Wasantha et al. [
19] investigated the effect of heating rate on the mechanical properties of Hawkesbury sandstone. The samples were heated to 1100 °C at rates of 2, 5, 10, and 20 °C/min and held at the target temperature for 60 min. In addition, a separate group of samples was heated according to the Modified Hydrocarbon Fire Curve (MHC). Afterwards, all the samples were tested under both compressive and tensile loading. The heating rate was found to influence the shape of the stress–strain curves. Samples heated at rates of 2, 5, and 10 °C/min exhibited similar stress–strain behaviour, while those heated at 20 °C/min showed a slight reduction in strength and increased deformation. The most pronounced effect on the stress–strain response was observed in samples subjected to the MHC curve.
A comprehensive study on sandstone from the Tangjiahui mining area in Mongolia was conducted by Zheng et al. [
20]. In the first phase of the study, samples were heated to temperatures ranging from 100 to 1200 °C at a heating rate of 10 °C/min. The second phase focused on the influence of heating rate, with samples heated to 1200 °C at rates varying from 5 °C/min to 30 °C/min. For all the samples, changes in mechanical and physical properties were monitored. An increase in both strength and elastic modulus was observed up to 500 °C, followed by a decrease at higher temperatures. The heating rate also played a significant role: the highest strength was recorded in samples heated at 5 °C/min, while the lowest was observed in those heated at 30 °C/min.
2.2. Cooling Methods
Extinguishing methods also play a crucial role in determining post-fire stone behaviour. Rapid cooling by water, commonly used in large fires, can induce thermal shock, resulting in severe material damage. Consequently, several studies have examined the impact of different cooling approaches.
Brotóns et al. [
21] tested San Julian limestone from Alicante, Spain, using two cooling methods: gradual cooling in a furnace at −0.5 °C/min, followed by air exposure and rapid immersion in water. Both methods adversely affected the material, but water-cooling produced more pronounced degradation.
Wu et al. [
22] explored three cooling techniques for granite from China’s Hunan province: furnace cooling, air cooling, and water quenching. The worst outcomes in tensile strength and P-wave velocity were recorded in samples exposed to temperatures above 600 °C and cooled in water. The decline in P-wave velocity signalled changes in mineral composition, confirming structural transformation.
Pires et al. [
23] evaluated three Portuguese granites used in façade cladding. They tested one set of samples (120 × 60 × 10 mm) by heating them to 500 °C and quenching in water and another set (150 × 30 × 25 mm) as reference specimens. The results demonstrated that thermal load effects varied by granite type and were influenced by material thickness.
Although some natural stone behaviour under high temperatures has been studied recently, our understanding remains limited compared to man-made materials like concrete. Most research focuses on basic mechanical and physical parameters such as UCS, tensile strength, porosity, and density. However, the degree of property change differs significantly among stone types due to variations in mineral composition and geological origin. Therefore, it is essential to study stones from different regions individually to develop accurate assessments of their post-fire performance.
3. Materials and Methods
Sandstone has historically been one of the most widely used natural stones in construction, favoured for its abundance, reliable mechanical properties, and aesthetic appeal. Despite the availability of numerous studies on sandstone from different regions, there remains a lack of research focused on sandstone from the Czech Republic.
Božanov sandstone is regarded as one of the most significant and high-quality stones used in Czech architecture. Notable examples of its use include the construction of St. Vitus Cathedral in Prague (14.–19. cent.) and the restoration of St. Barbara’s Church in Kutná Hora (14.–19. cent.) (
Figure 1).
Sandstone is a clastic sedimentary rock with a composition that varies petrographically. It typically consists of quartz or calcite grains, with void spaces between particles either remaining open or filled with a binding material. The mechanical and physical properties of sandstone are significantly influenced by this binder. High-quality sandstone generally features a binder rich in silicon oxides [
24,
25].
The Božanov sandstone used in this research was sourced from a quarry in the southernmost part of the Broumov Walls near the Polish border. Recognized as the highest quality sandstone available in the Czech Republic, it consists predominantly of quartz grains along with feldspar or other rock fragments. Its binder is largely composed of kaolinite, contributing to its desirable mechanical properties [
24,
25].
The present investigation provides the first systematic and comprehensive dataset on the behaviour of Božanov sandstone exposed to high temperatures, representing a significant contribution to understanding its thermomechanical properties.
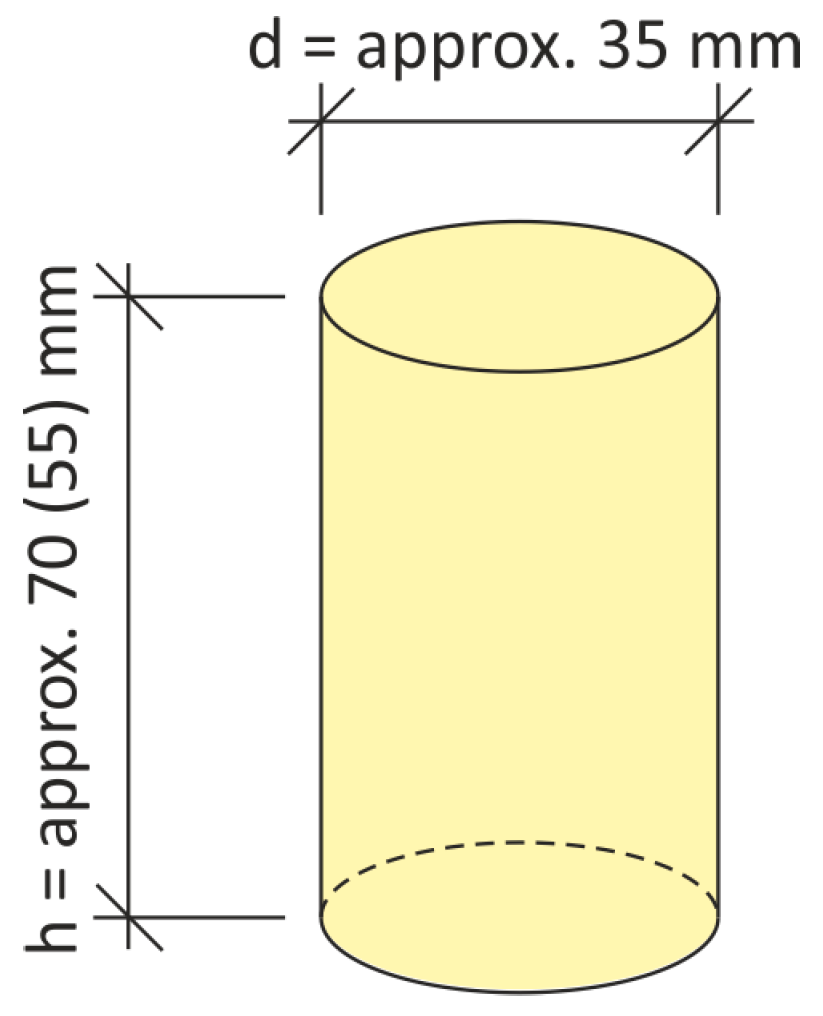
The experimental samples used in this study were cylindrical in shape, with dimensions of approximately Ø 35 mm and a height ranging from 55 mm to 70 mm (
Figure 2). Following thermal treatment in an electric muffle oven, the samples were allowed to cool to room temperature before being subjected to uniaxial compressive strength (UCS) tests. This procedure was designed to evaluate changes in mechanical performance resulting from high-temperature exposure, while minimizing the effects of thermal shock.
3.1. Experimental Samples
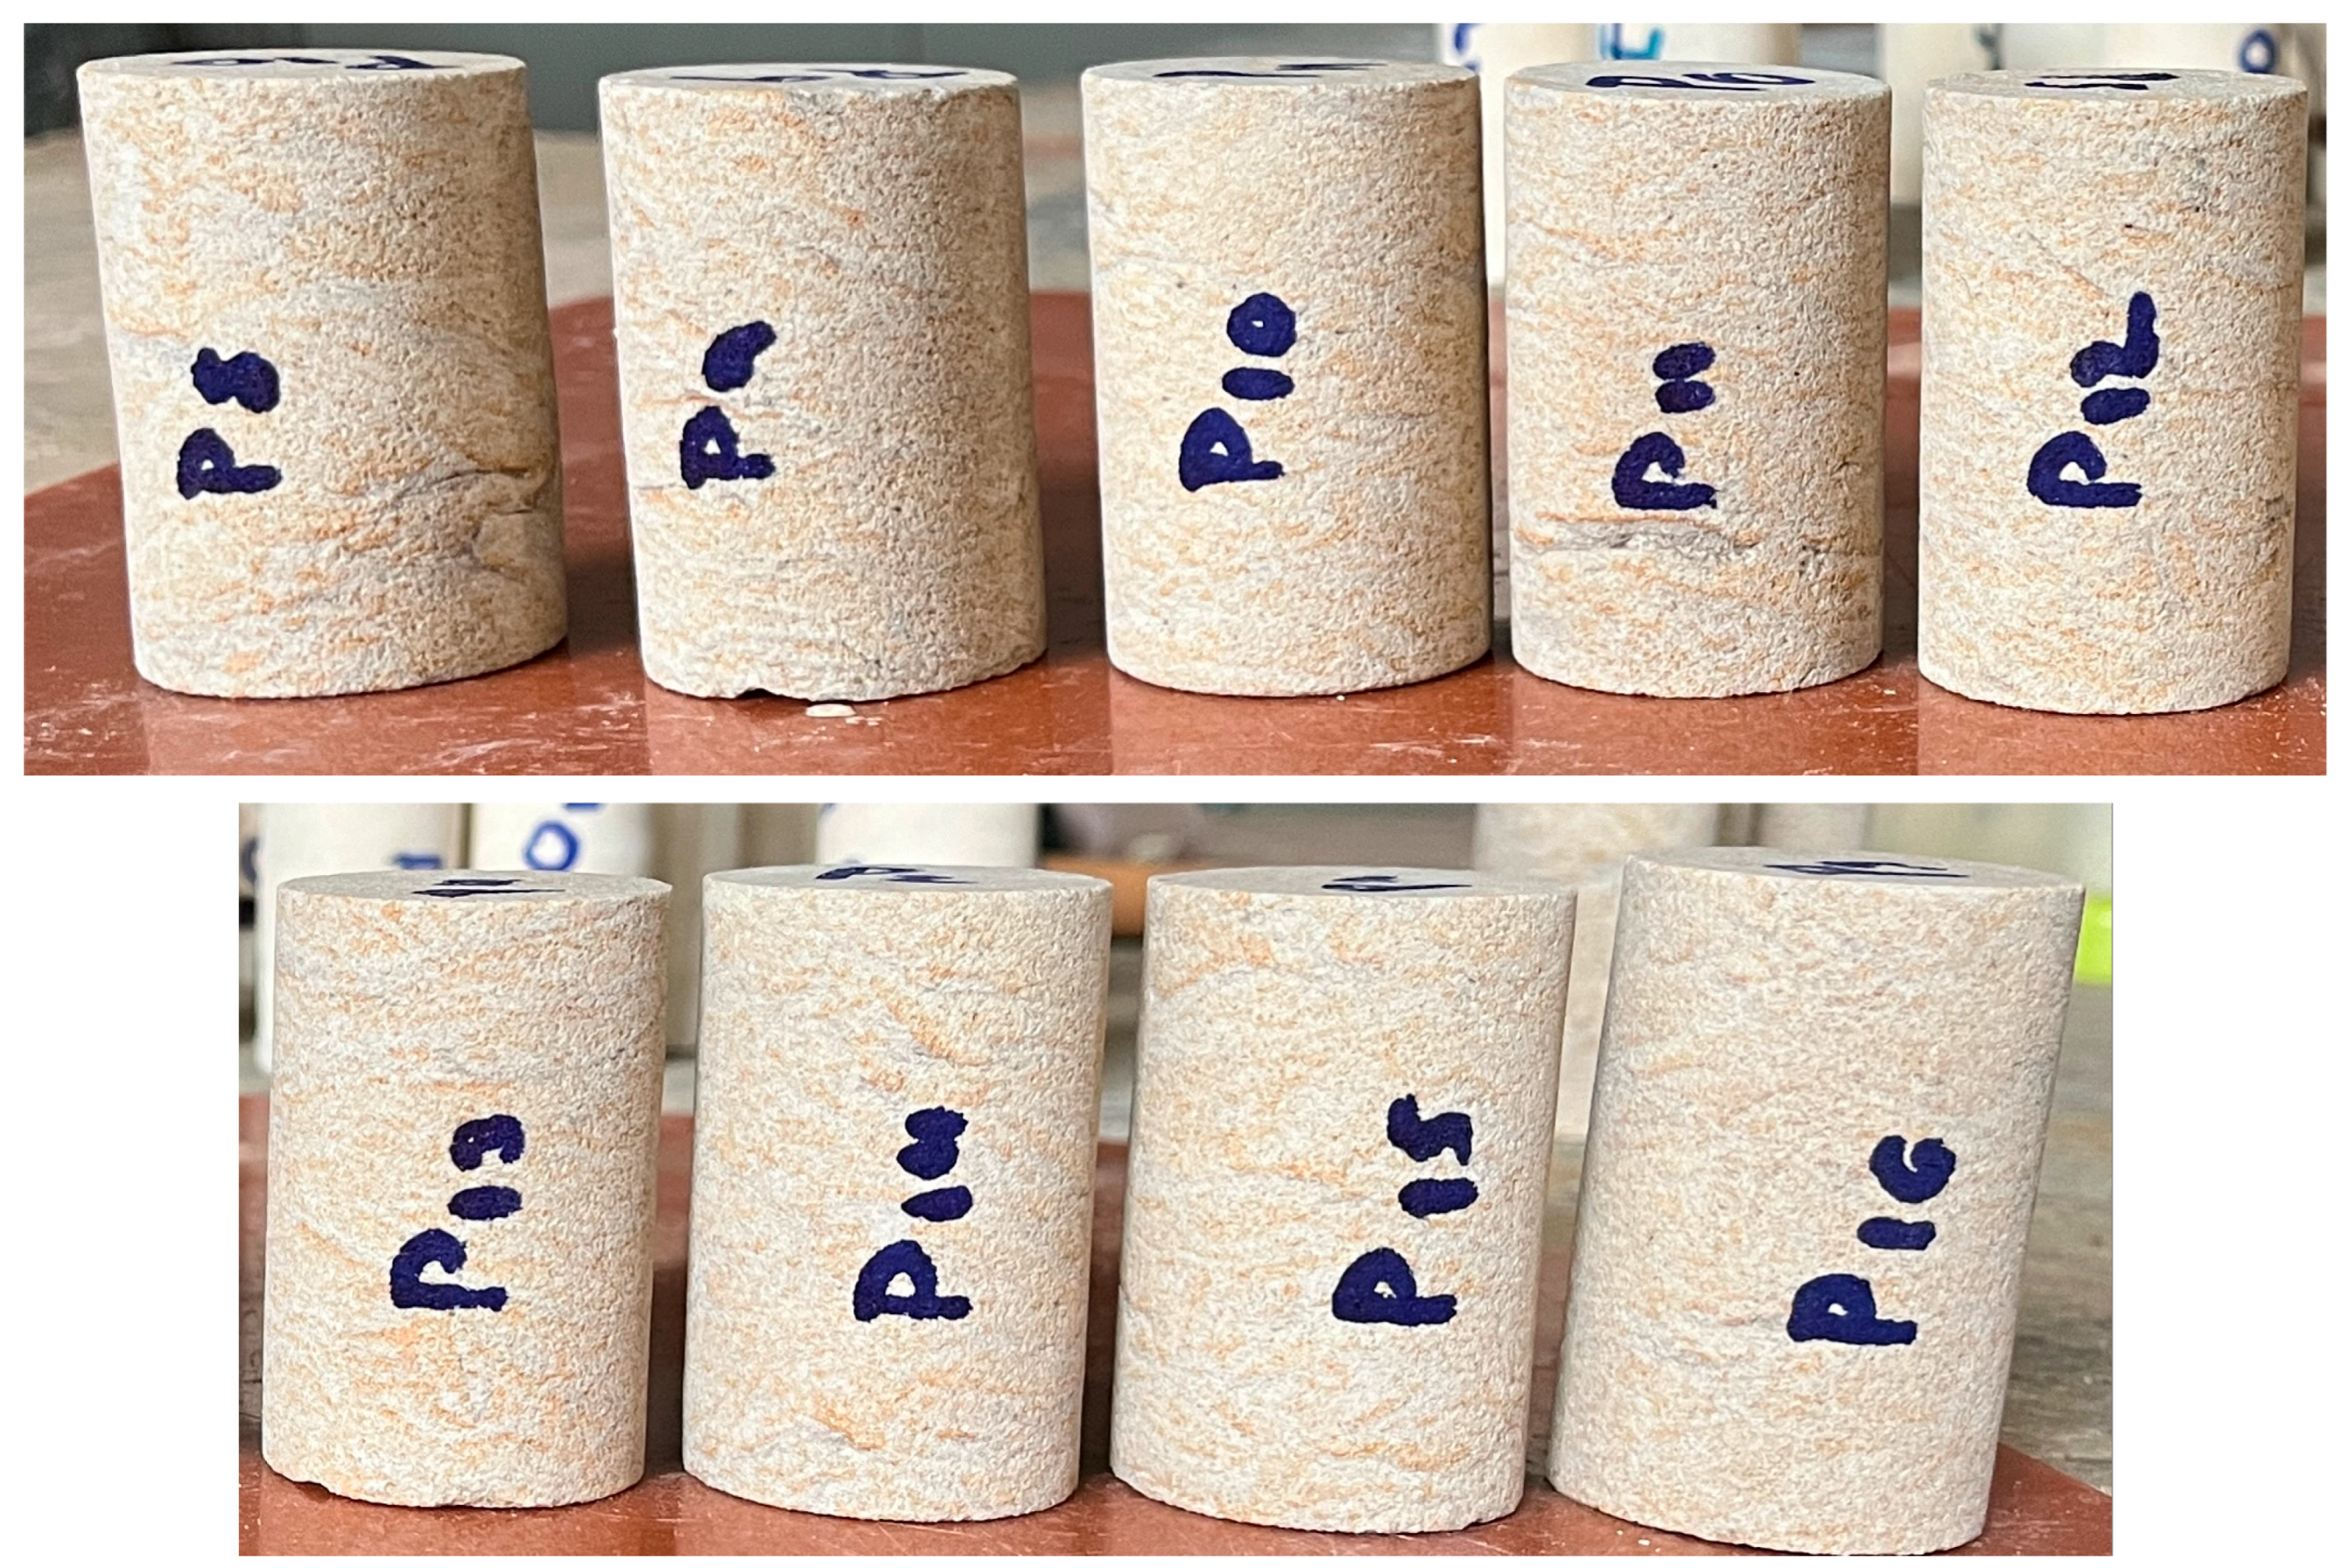
The cylindrical sandstone specimens prepared for testing had a diameter of approximately 35 mm and heights ranging from 55 mm to 70 mm (
Figure 3 and
Figure 4,
Table 1). The height of the samples was limited by the size of the original stones from which the samples were prepared. Due to the variation in sample height, particularly for those around 55 mm, it was necessary to normalize the measured compressive strength values for accurate comparison. Several standard methods exist for this adjustment; in this study, the shape coefficient δ
NP2 was applied. This coefficient was determined through linear interpolation based on Table 3.2 of the ČSN EN 772-1+A1 standard [
26] and was calculated to be approximately 91% of the measured compressive strength value. This adjustment ensured consistent and comparable results across all specimens regardless of height variation.
3.2. Experimental Procedures and Settings
In real fire scenarios, the temperature increase is typically rapid. However, in large-scale structures, the significant mass of materials means that internal heating occurs more gradually compared to small laboratory samples exposed to simulated fire conditions. Therefore, the slower heating rates used in experimental testing are considered appropriate and should not significantly influence the final mechanical properties measured.
Sample heating was conducted using an electric muffle furnace (
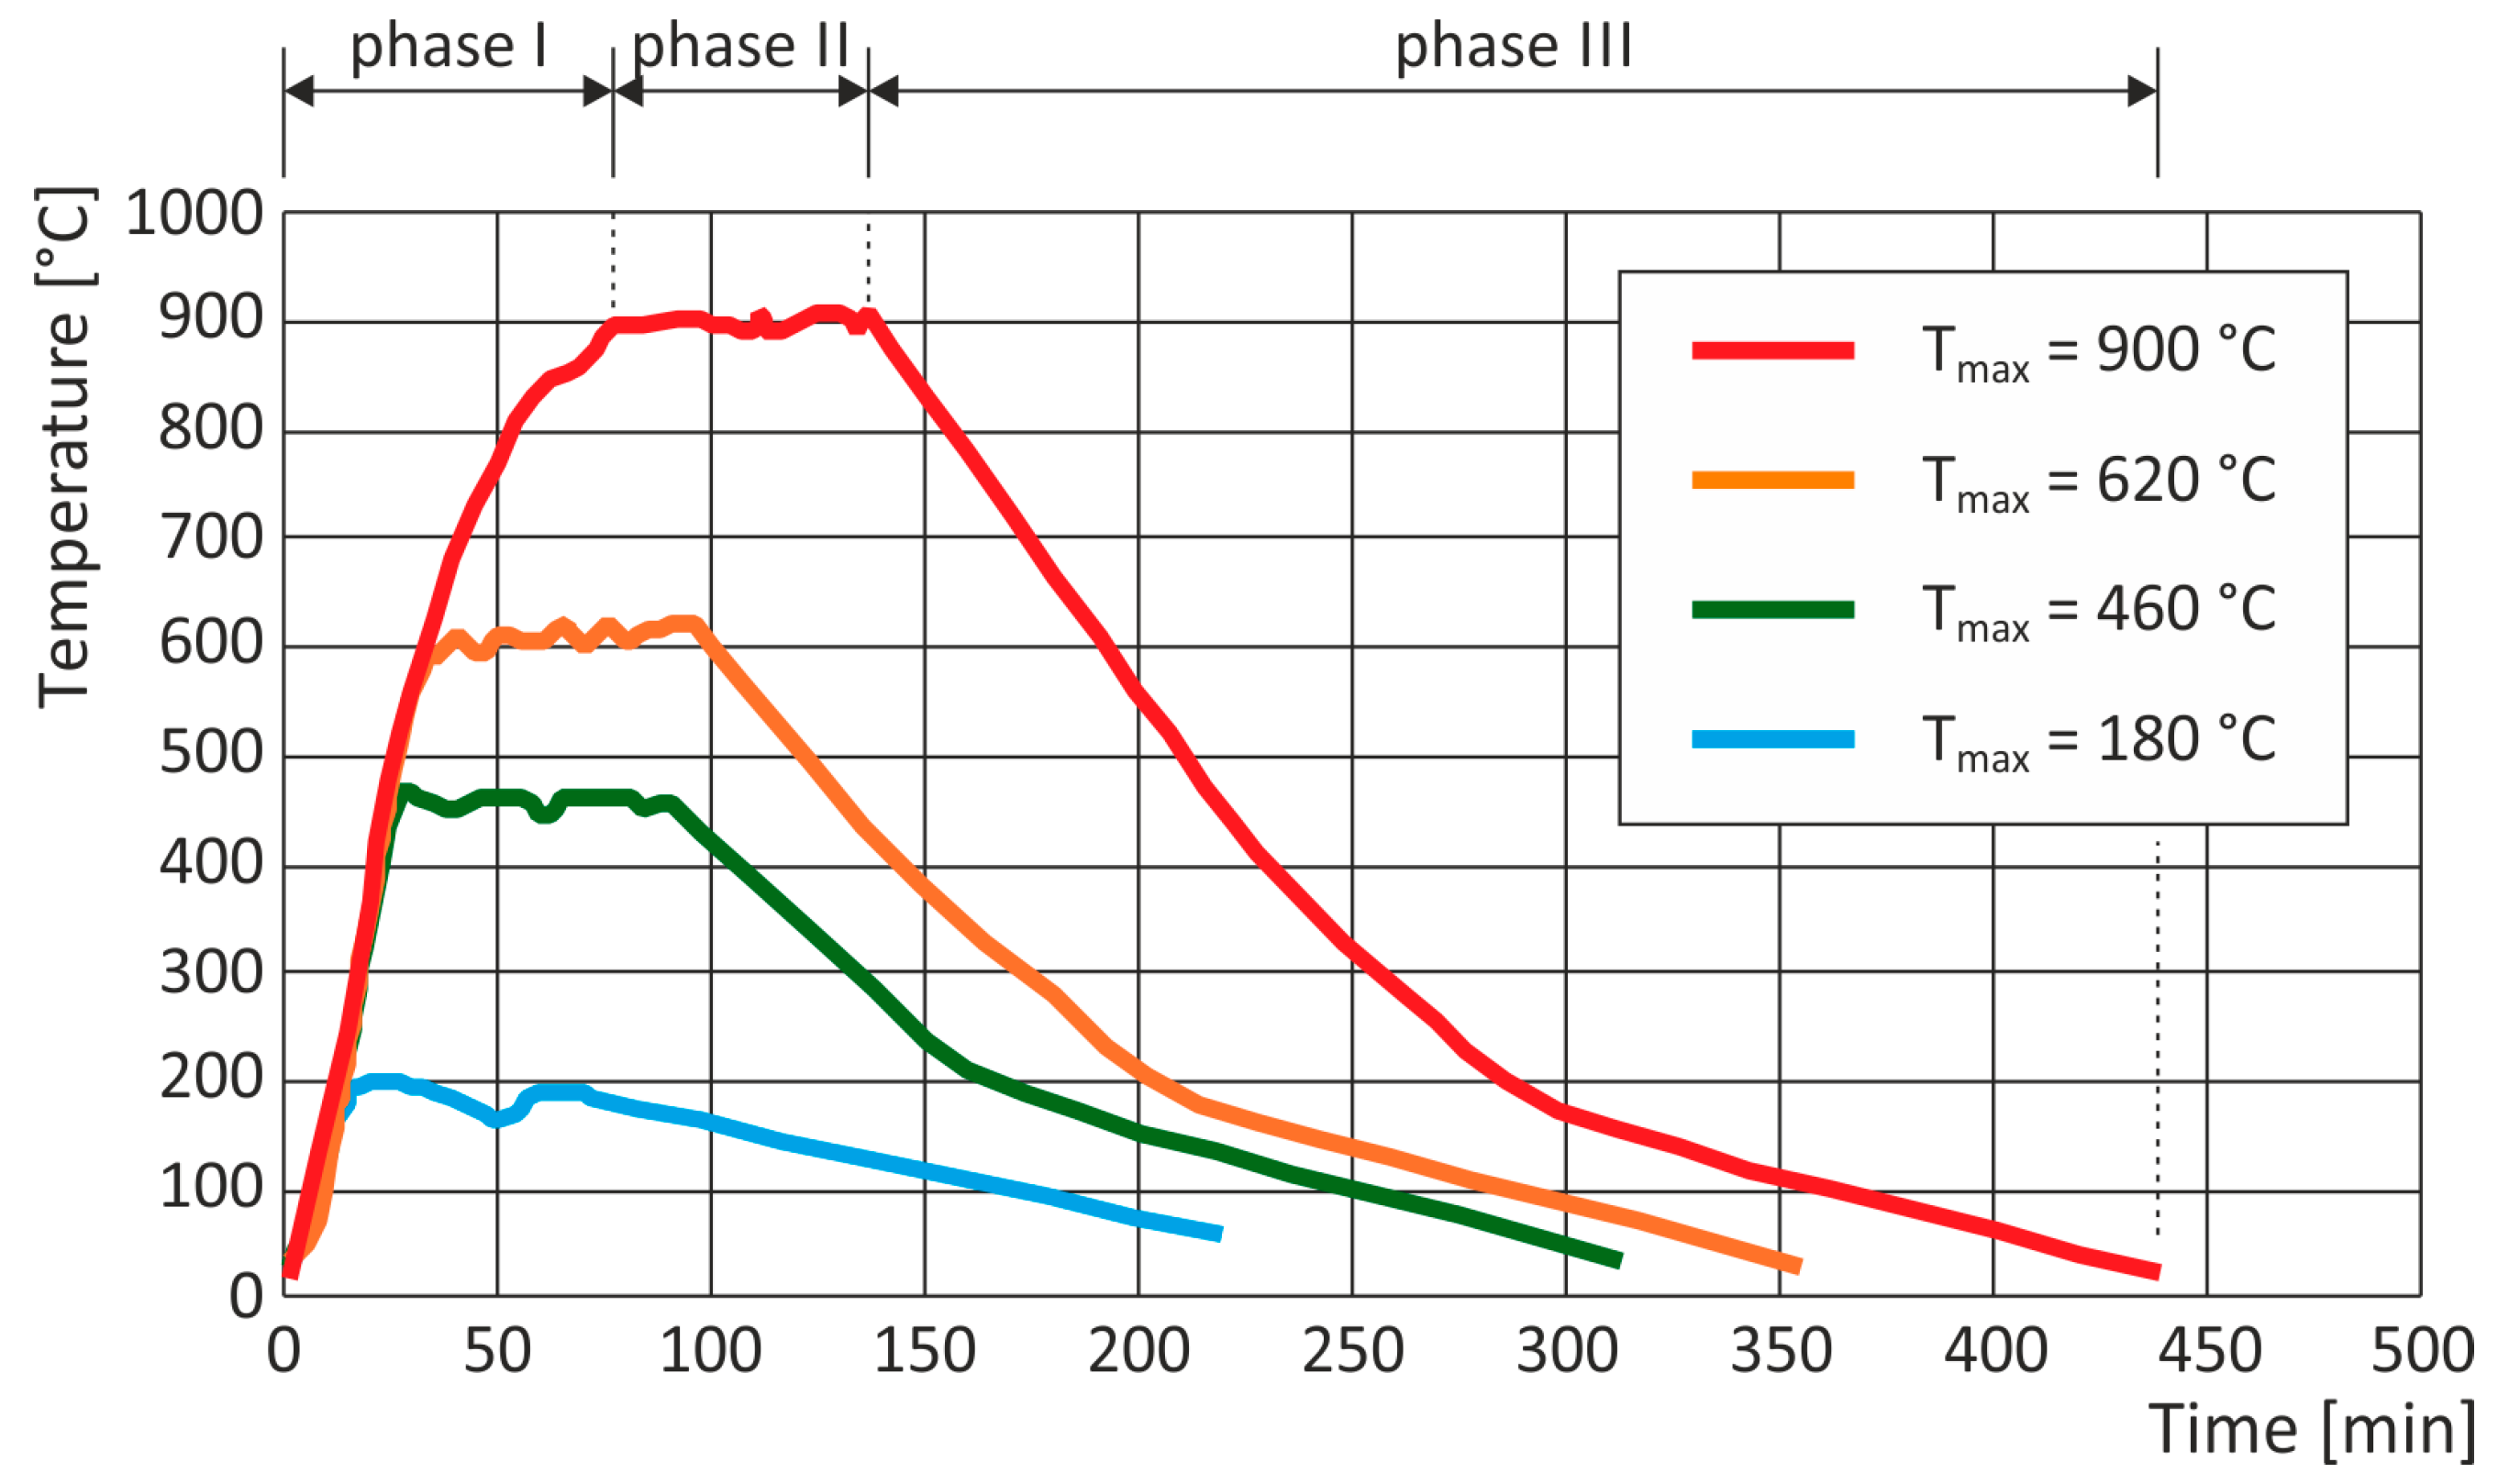
Figure 5). Four target temperatures were selected for the study: 180 °C, 460 °C, 620 °C, and 900 °C. The heating process comprised three stages: first, raising the temperature to the target value at a controlled rate of 16–18 °C/min (phase I); second, maintaining the target temperature for approximately one hour to ensure uniform heat distribution (phase II); and, third, allowing the samples to cool naturally within the furnace to ambient room temperature (phase III,
Figure 6). Throughout the process, the temperature was monitored using two thermocouples.
For each temperature, three samples were used, allowing for at least a basic statistical evaluation. However, the small sample size limits the robustness of statistical analyses and reduces the ability to generalize the findings. The total number of specimens was limited by the available raw stone material.
In this study, slow furnace cooling was selected to stimulate gradual temperature decreases common in real-world scenarios, for example post-fire cooling. While rapid quenching can lead to significant thermal stresses and altered mechanical behaviour due to steep temperature gradients, the objective of the present study was to analyse the microstructural changes and mechanical performance resulting from slow, uniform cooling.
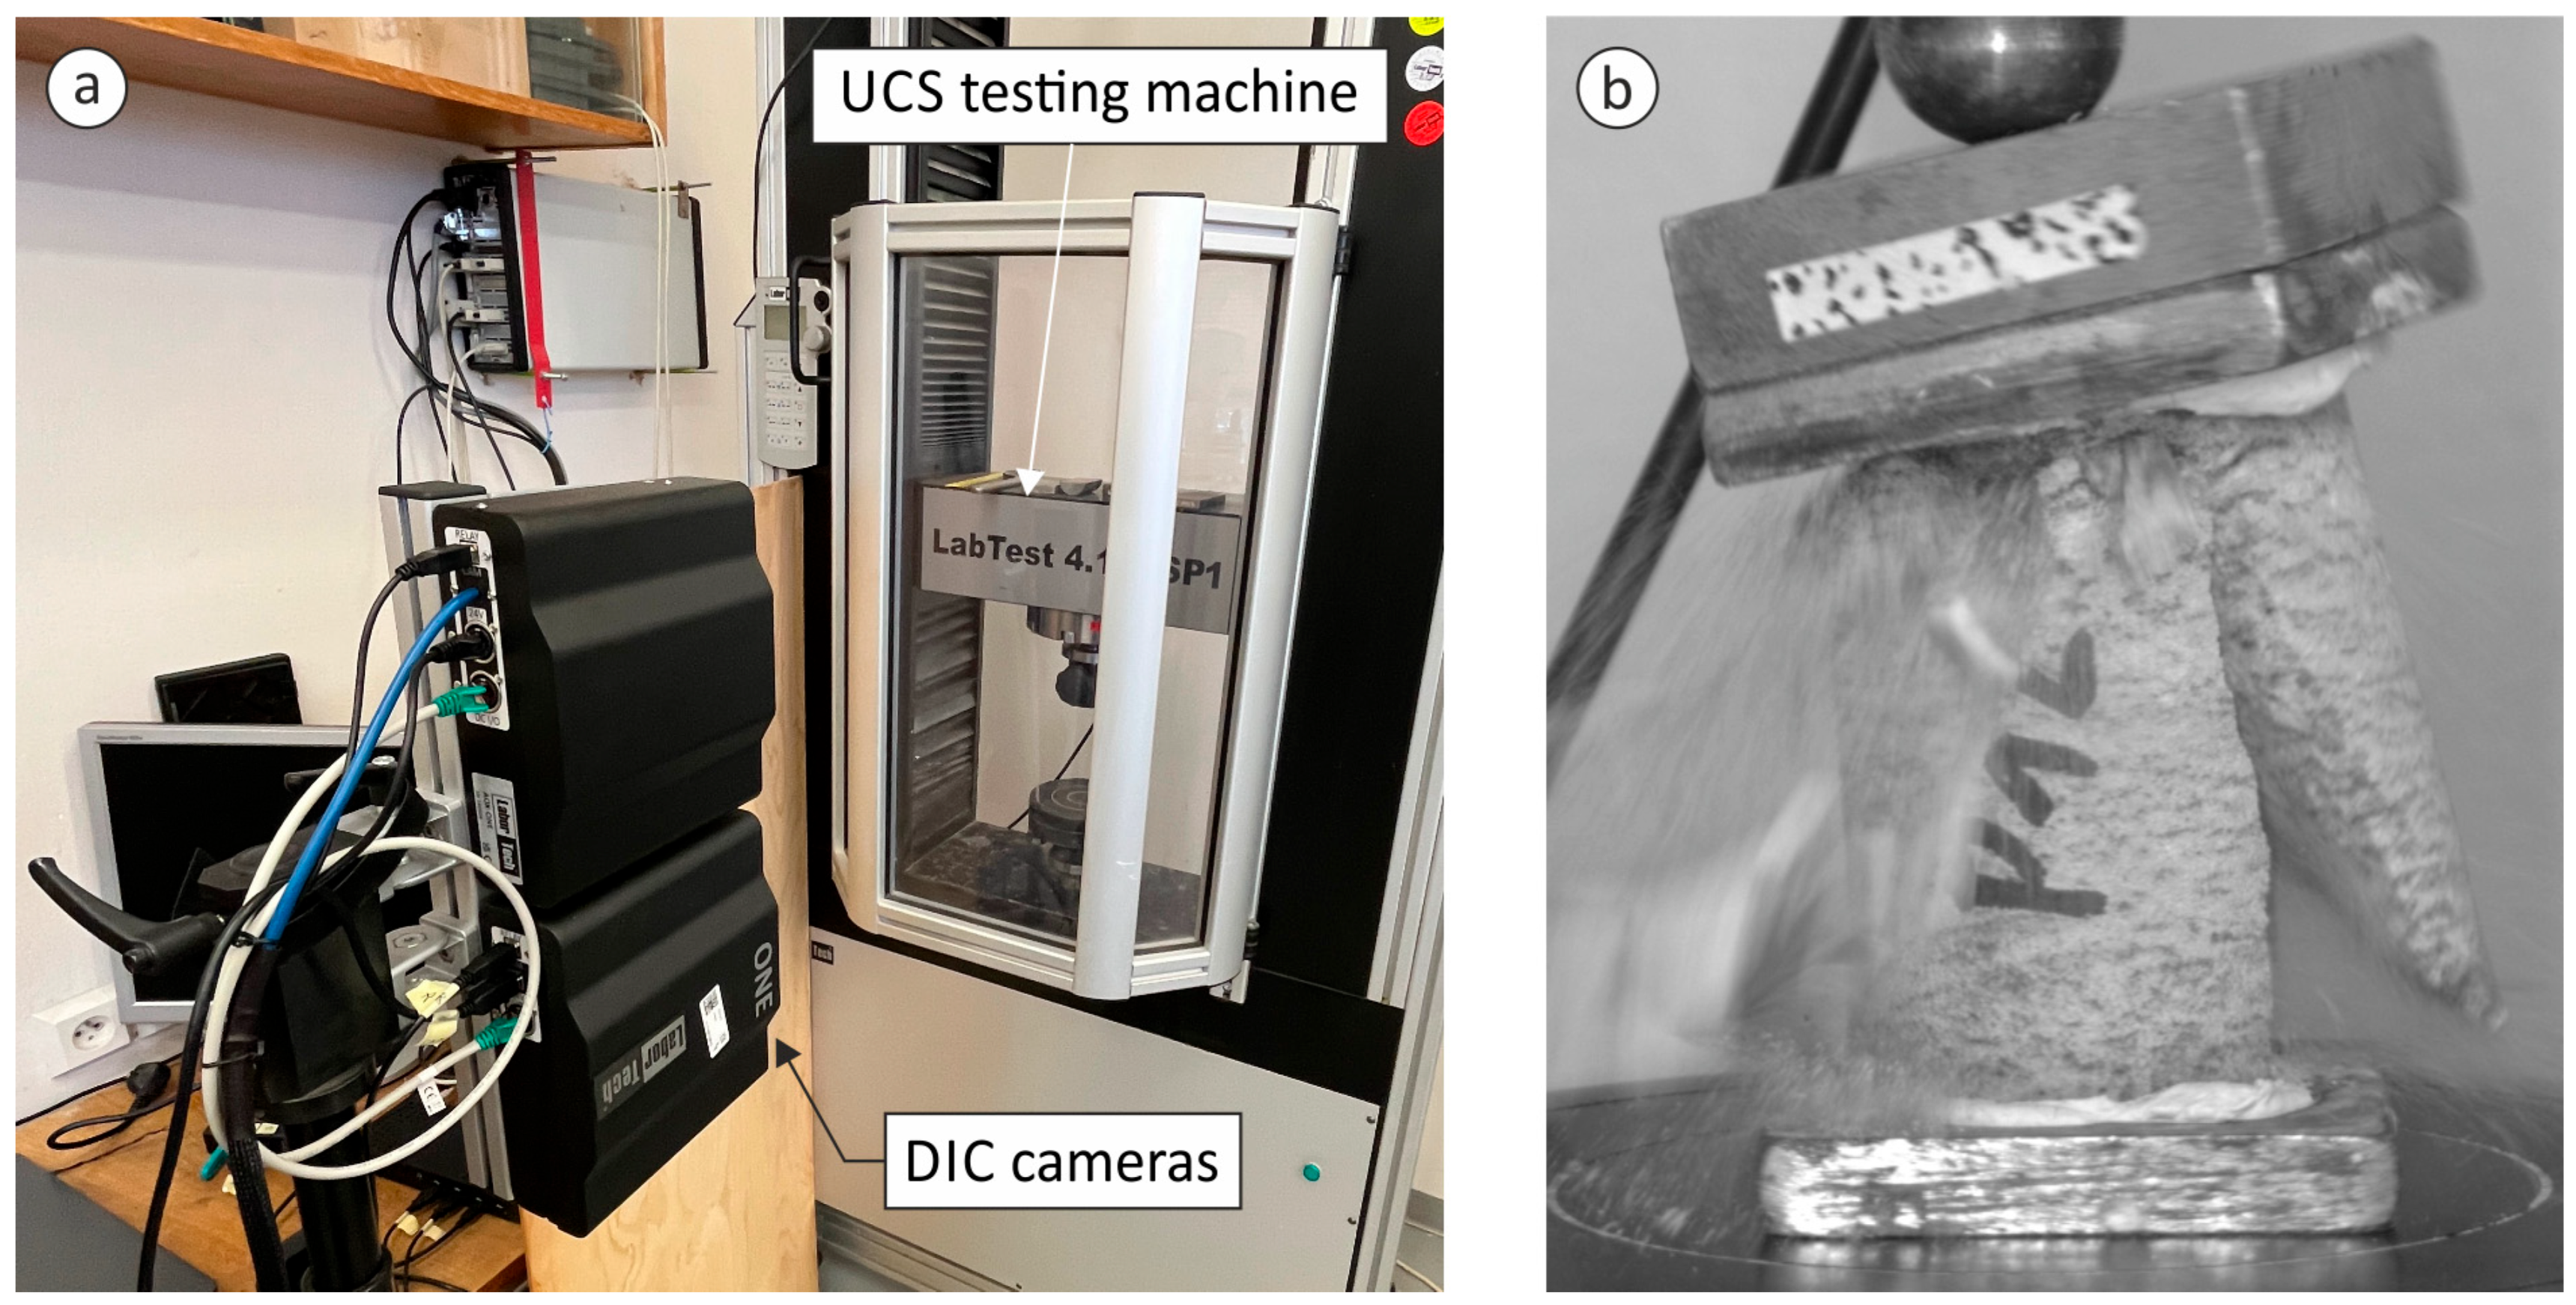
Once cooled to the room temperature, the samples were subjected to uniaxial compression testing using a LabTest 4.100.SP1 universal testing machine (manufactured by LaborTech s.r.o., Opava, Czech Republic), capable of applying a maximum nominal load of 100 kN (
Figure 7). The tests were conducted under displacement control with a constant loading rate of 0.25 mm/min.
During UCS testing, Digital Image Correlation (DIC) technology was used. DIC is a well-established, non-contact optical method widely used for measuring strain, displacement, and deformation in materials under load. Its high spatial resolution and ability to capture full-field data make it especially valuable for analysing heterogeneous materials such as natural stone. The DIC system used consisted of a LaborTech AOX-ONE camera with a 5 Mpx (2448 px × 2048 px) Blackfly BFS-U3-51S5M sensor and 50 mm lens, complying with EN ISO 9513 accuracy class 0.5 and ASTME 83: Class A. The calibration was performed using Fiducial Grid with a point distance of 5 mm. Consistent illumination was provided by the camera’s in-built blue monochromatic LED lighting, with wavelength corresponding to the highest sensitivity of the camera chip. The recorded data were processed in real time using the Alpha® software (version 1.0.377) package utilizing axial strain virtual sensors.
4. Results and Discussion
Thermal exposure had a pronounced impact on both the physical and mechanical characteristics of the Božanov sandstone. This study placed particular emphasis on evaluating changes in uniaxial compressive strength (UCS), axial strain, elastic modulus (Young’s modulus), and visible colour alterations following thermal treatment.
Table 2,
Table 3 and
Table 4 summarize the UCS test results for the samples across the different temperature groups, including the unheated reference samples. Additionally, the associated stress–strain curves for individual specimens are illustrated in
Figure 8, providing a visual comparison of behaviour under load. The standard Grubbs’s test was used to detect outliers, which were subsequently excluded from further analysis (however, all the measured values are presented in
Table 2,
Table 3 and
Table 4). The remaining data were then analysed using a one-way analysis of variance (ANOVA) to evaluate the effect of temperature on the measured parameters. When statistically significant differences were identified (
p < 0.05), post hoc comparisons were conducted using Tukey’s HSD (Honestly Significant Difference) test to determine which temperature groups differed significantly.
At the reference temperature, the sandstone samples exhibited a nearly linear stress–strain relationship (
Figure 8), characterized by a steep initial slope and relatively low strain at peak stress. This indicates a high modulus of elasticity and compact internal structure. The samples heated to 180 °C and 460 °C followed a similar trend, showing minor variations in stiffness and strain, suggesting that low to moderate thermal exposure does not significantly disrupt the stone’s internal cohesion.
In contrast, the samples subjected to higher temperatures of 620 °C and 900 °C showed markedly different behaviour. The stress–strain curves for these specimens revealed a longer densification phase, where strain increased more rapidly during the initial stages of loading. This response implies an early onset of microcrack closure and particle rearrangement before the material reached peak stress.
Moreover, a significant reduction in the slope of the stress–strain curves for these high-temperature samples indicates a decrease in Young’s modulus. This loss of stiffness suggests substantial damage to the internal microstructure, likely due to thermal expansion, mineral decomposition, and the formation of microcracks during heating and cooling cycles.
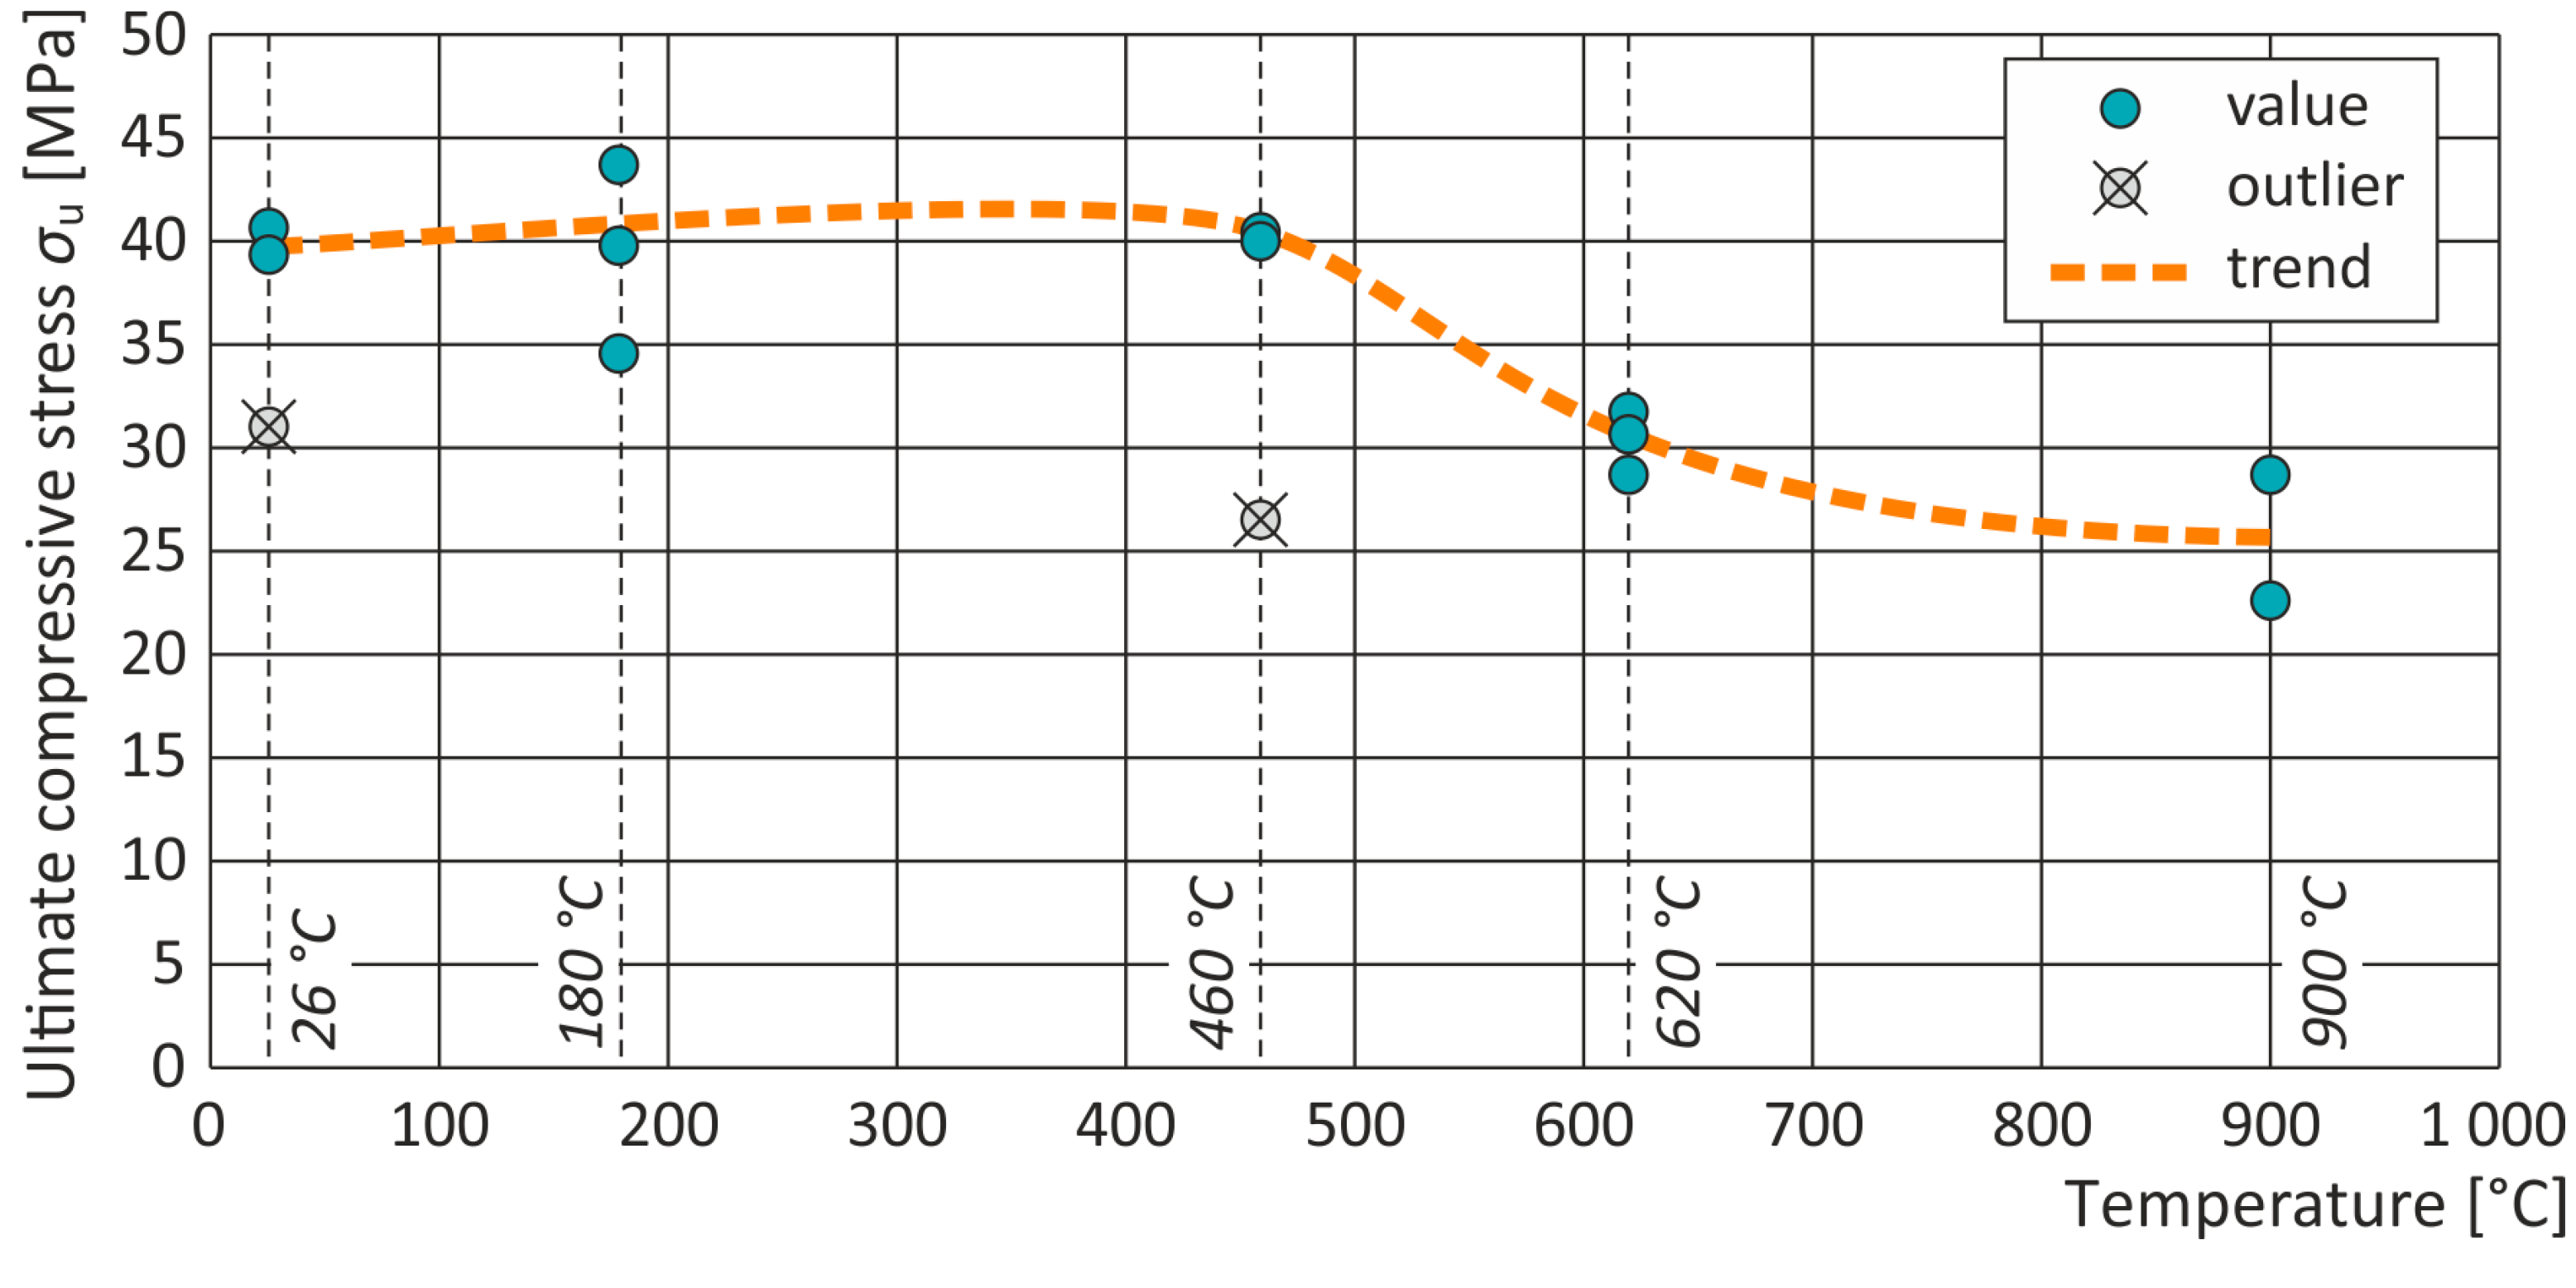
The compressive strength results presented in
Table 2 and illustrated in
Figure 9 confirm the observed trend. The samples heated to 180 °C and 460 °C retained most of their compressive strength and were comparable to the values of the reference (unheated) samples, which had a maximum strength of approximately 40 MPa (100%, reference value). For the samples heated to 180 °C, the average strength was approximately 39.5 MPa, representing 98.8% of the reference sample strength. The samples heated to 460 °C exhibited an average strength of approximately 40.2 MPa, equivalent to 100.4% of the reference value.
In contrast, the samples exposed to 620 °C showed strength values ranging from 28.8 MPa to 31.8 MPa, with an average of 30.4 MPa, corresponding to 72% to 79% of the reference strength (average 76% of the reference value). The degradation became more pronounced at 900 °C, where compressive strength ranged from 22.8 MPa to 28.7 MPa, with an average of 26.7 MPa. This corresponds to 57% to 72% of the reference strength, with an average of 66.8%.
To assess the statistical significance of differences among temperature groups, a one-way ANOVA was conducted, revealing a significant effect of heat treatment on compressive strength (F(4, 8) = 12.63, p = 0.00155). Post hoc comparisons using Tukey’s HSD test indicated that the samples heated to 620 °C differed significantly from the unheated samples (mean difference = –9.613, adjusted p = 0.041), as did the samples heated to 900 °C (mean difference = –13.298, adjusted p = 0.0069). However, no statistically significant differences were found between the unheated samples and those heated to 180 °C (adjusted p = 0.99) or 460 °C (adjusted p = 0.99).
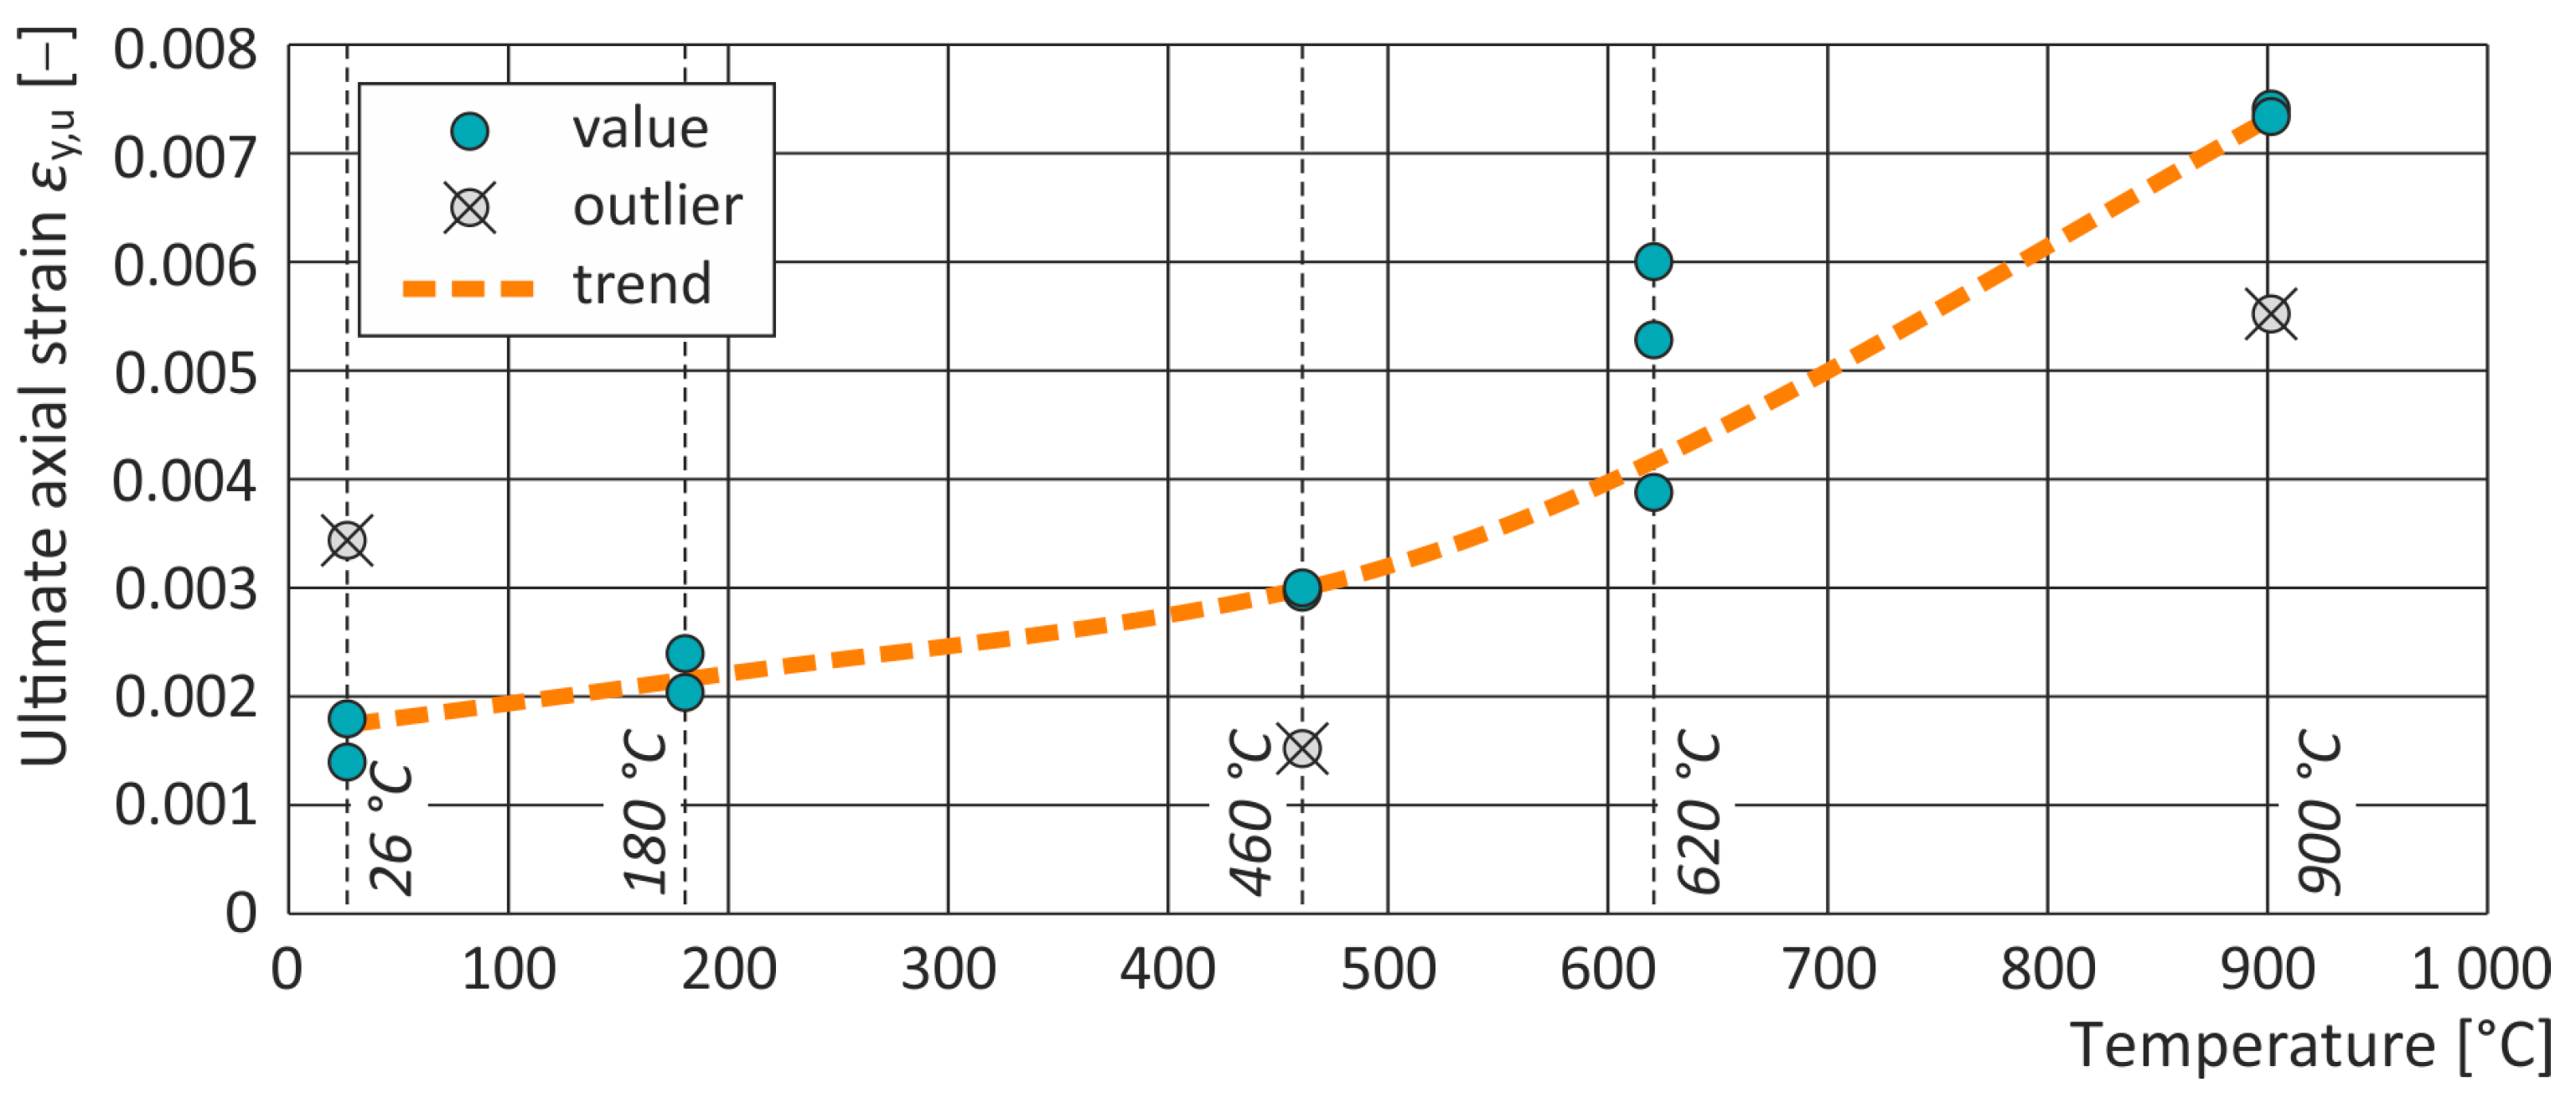
The ultimate axial strain values are presented in
Table 3 and illustrated in
Figure 10. As the exposure temperature increased, axial strain values rose accordingly, with particularly notable increases observed at 620 °C and 900 °C. At 620 °C, the axial strain measurements were 0.00385 (244% of the reference value), 0.00527 (334% of the reference value), and 0.00598 (379% of the reference value), yielding an average value of 0.00503 (319.6% of the reference value). At 900 °C, the axial strain values were 0.0074 (470% of the reference value) and 0.00745 (473% of the reference value), with an average of 0.00743 (471.4% of the reference value).
These increases contrast sharply with the strain values of the reference (unheated) samples, which ranged from 0.00140 (89% of the reference value) to 0.00175 (111% of the reference value) and averaged 0.00158 (100%, reference value). The samples heated to 180 °C had strain values between 0.00204 and 0.00235 (129% to 130% of the reference value), with an average of 0.00215 (136.3% of the reference value). For the samples heated to 460 °C, axial strain ranged from 0.00297 (188% of the reference value) to 0.00298 (189% of the reference value), averaging 0.00298 (188.9% of the reference value).
A one-way ANOVA confirmed that the differences in axial strain across temperature groups were statistically significant (F(4, 7) = 35.54, p = 9.71 × 10⁻⁵). Post hoc analysis using Tukey’s HSD test revealed that the samples heated to 620 °C differed significantly from the unheated samples (mean difference = 0.00346, adjusted p = 0.00239), as did those heated to 900 °C (mean difference = 0.00585, adjusted p = 0.000157). In contrast, the differences between the samples heated to 180 °C and the unheated samples (adjusted p = 0.82), and between those heated to 460 °C and the unheated samples (adjusted p = 0.23), were not statistically significant.
The values of Young’s modulus of elasticity were defined as the slope of the straight-line portion of the curve before the peak stress (the second half of the curve). The results, presented in
Table 4 and illustrated in
Figure 11, exhibited a similar temperature-dependent decline. The reference (unheated) samples had modulus values ranging from 17.6 GPa to 23.5 GPa, with an average of 20.6 GPa (100%, reference value). The samples heated to 180 °C ranged from 20.7 GPa to 22.2 GPa (101% to 108% of the reference value), averaging 21.3 GPa (103.5% of the reference value). Those heated to 460 °C ranged from 18.7 GPa to 20.7 GPa (91% to 101% of the reference value), with an average modulus of 19.5 GPa (94.6% of the reference value). A more substantial reduction was observed at 620 °C, where values ranged from 12.1 GPa to 15.1 GPa (59% to 74%), averaging 13.2 GPa (64.3%). This trend continued at 900 °C, with values ranging from 6.2 GPa to 8.2 GPa (30% to 40%) and an average of 7.4 GPa (35.8% of the reference).
These reductions are also visually reflected in the stress–strain curves (
Figure 8), where the change in stiffness and deformation behaviour of the samples with increasing temperature is clearly evident.
A one-way ANOVA confirmed that the differences in Young’s modulus across temperature groups were statistically significant (F(4, 10) = 37.67, p = 5.31 × 10⁻⁶). Post hoc analysis using Tukey’s HSD test indicated that the samples heated to 620 °C exhibited a statistically significant reduction in modulus compared to the unheated group (mean difference = −7.344, adjusted p = 0.00235), as did those heated to 900 °C (mean difference = −13.211, adjusted p = 0.000018). In contrast, the differences between the unheated samples and those heated to 180 °C (adjusted p = 0.98) or 460 °C (adjusted p = 0.92) were not statistically significant.
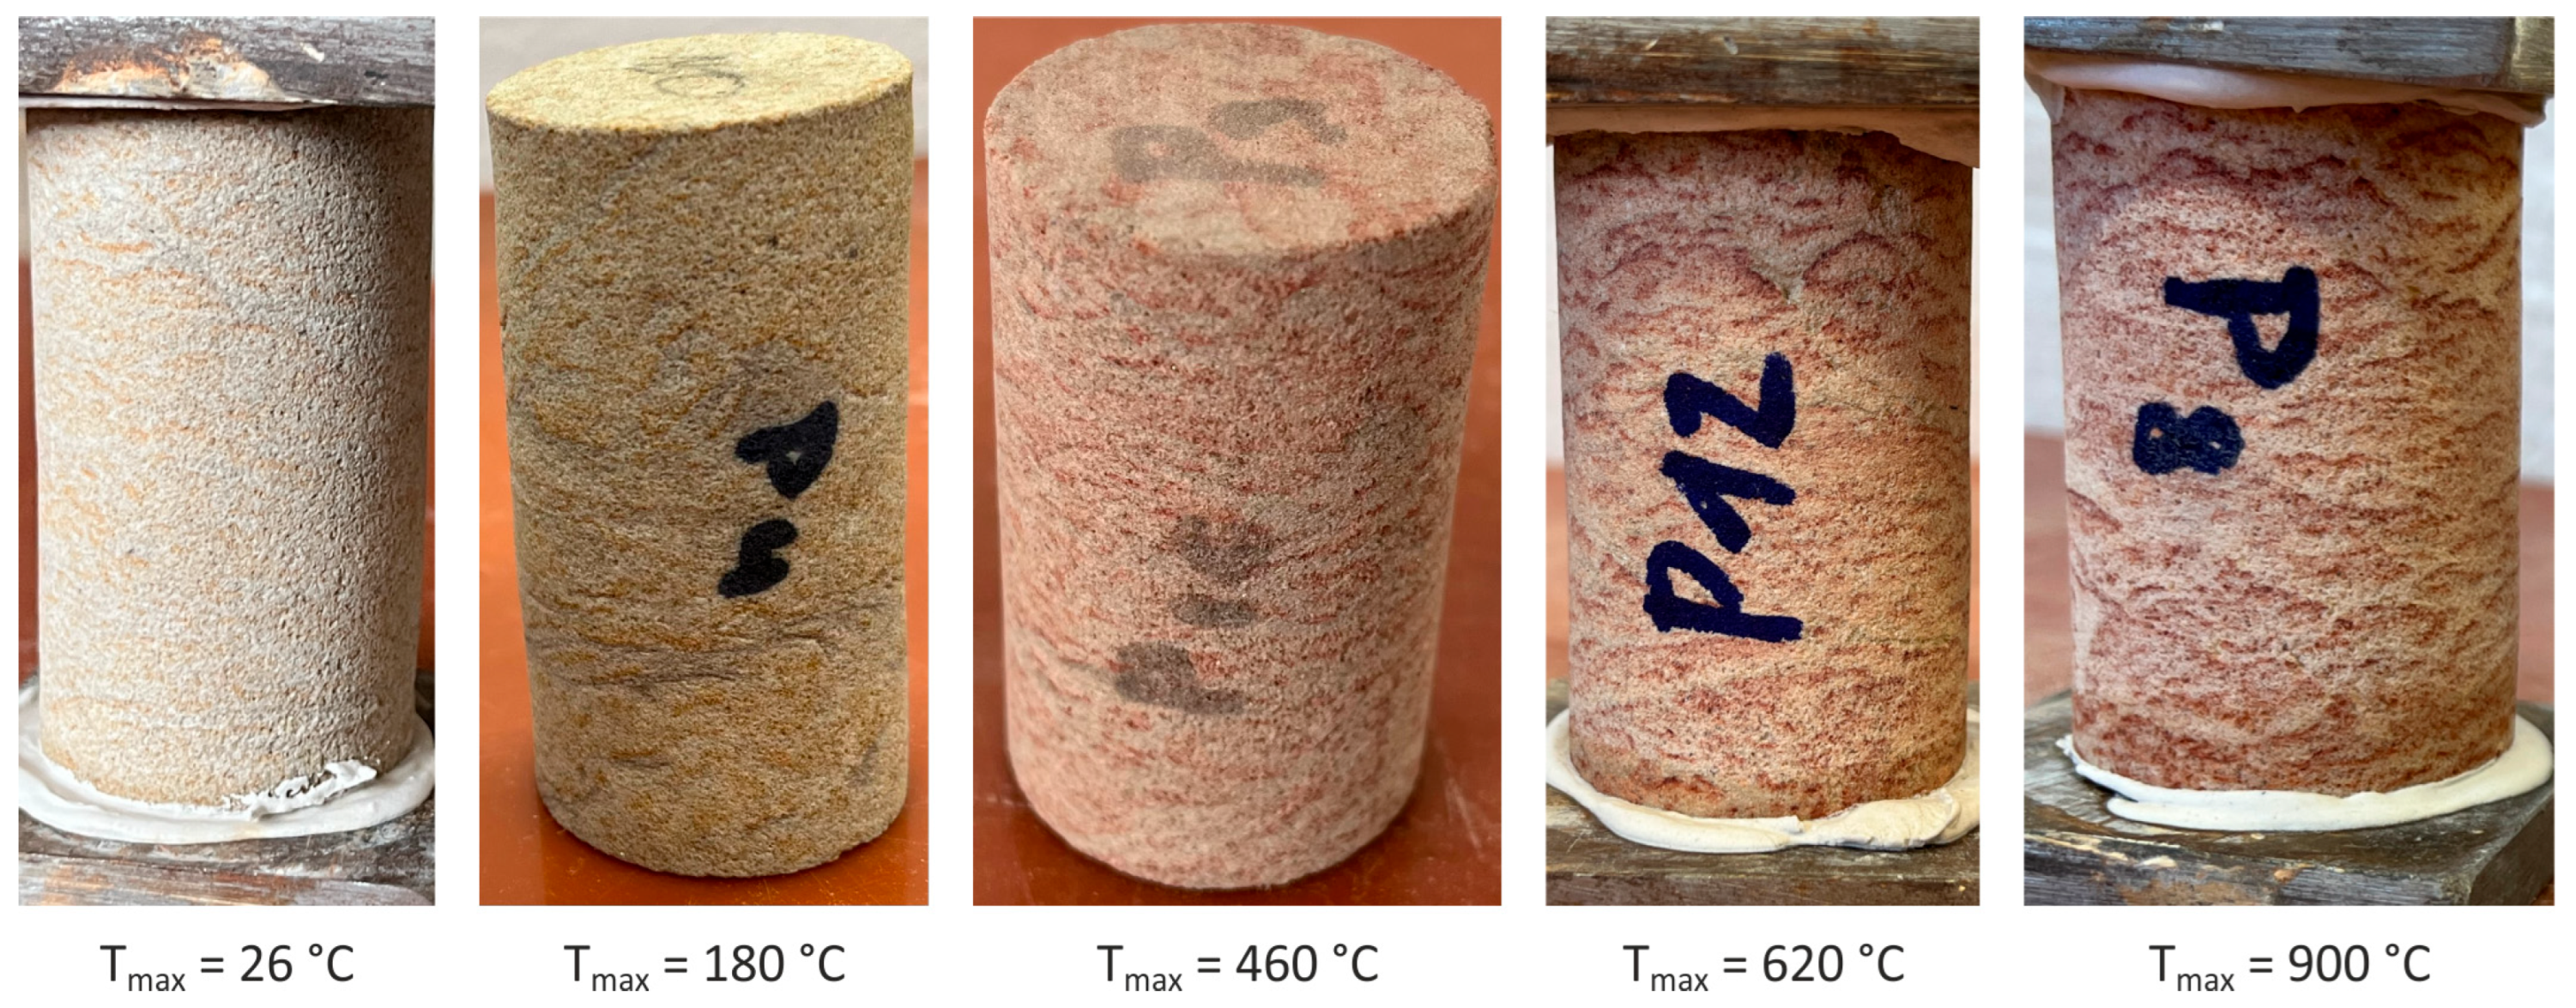
Colour change was also evident. The reference samples exhibited white to light grey and ochre layers. After heating to 460 °C, these shifted to a more vibrant orange-red. Further heating to 620 °C deepened the red hue, and samples at 900 °C showed no major additional changes, remaining dark red (
Figure 12). These transformations likely result from the oxidation of iron-bearing minerals, which change colour under high temperatures. While this explanation is consistent with the existing literature, further confirmation using mineralogical techniques (thin-section petrography or optical microscopy) could offer more detailed insights into microstructural and compositional changes. These methods allow for the direct observation of mineral phase transitions, grain boundary alterations, and oxidation patterns, thereby providing valuable evidence to support hypotheses on thermally induced colour changes. Incorporating such analyses in future work would strengthen the interpretation of thermal effects on sandstone and enhance the overall understanding of fire-induced transformations. Also, measuring colour changes with a colorimeter and using CIE Lab* values would make the results more objective.
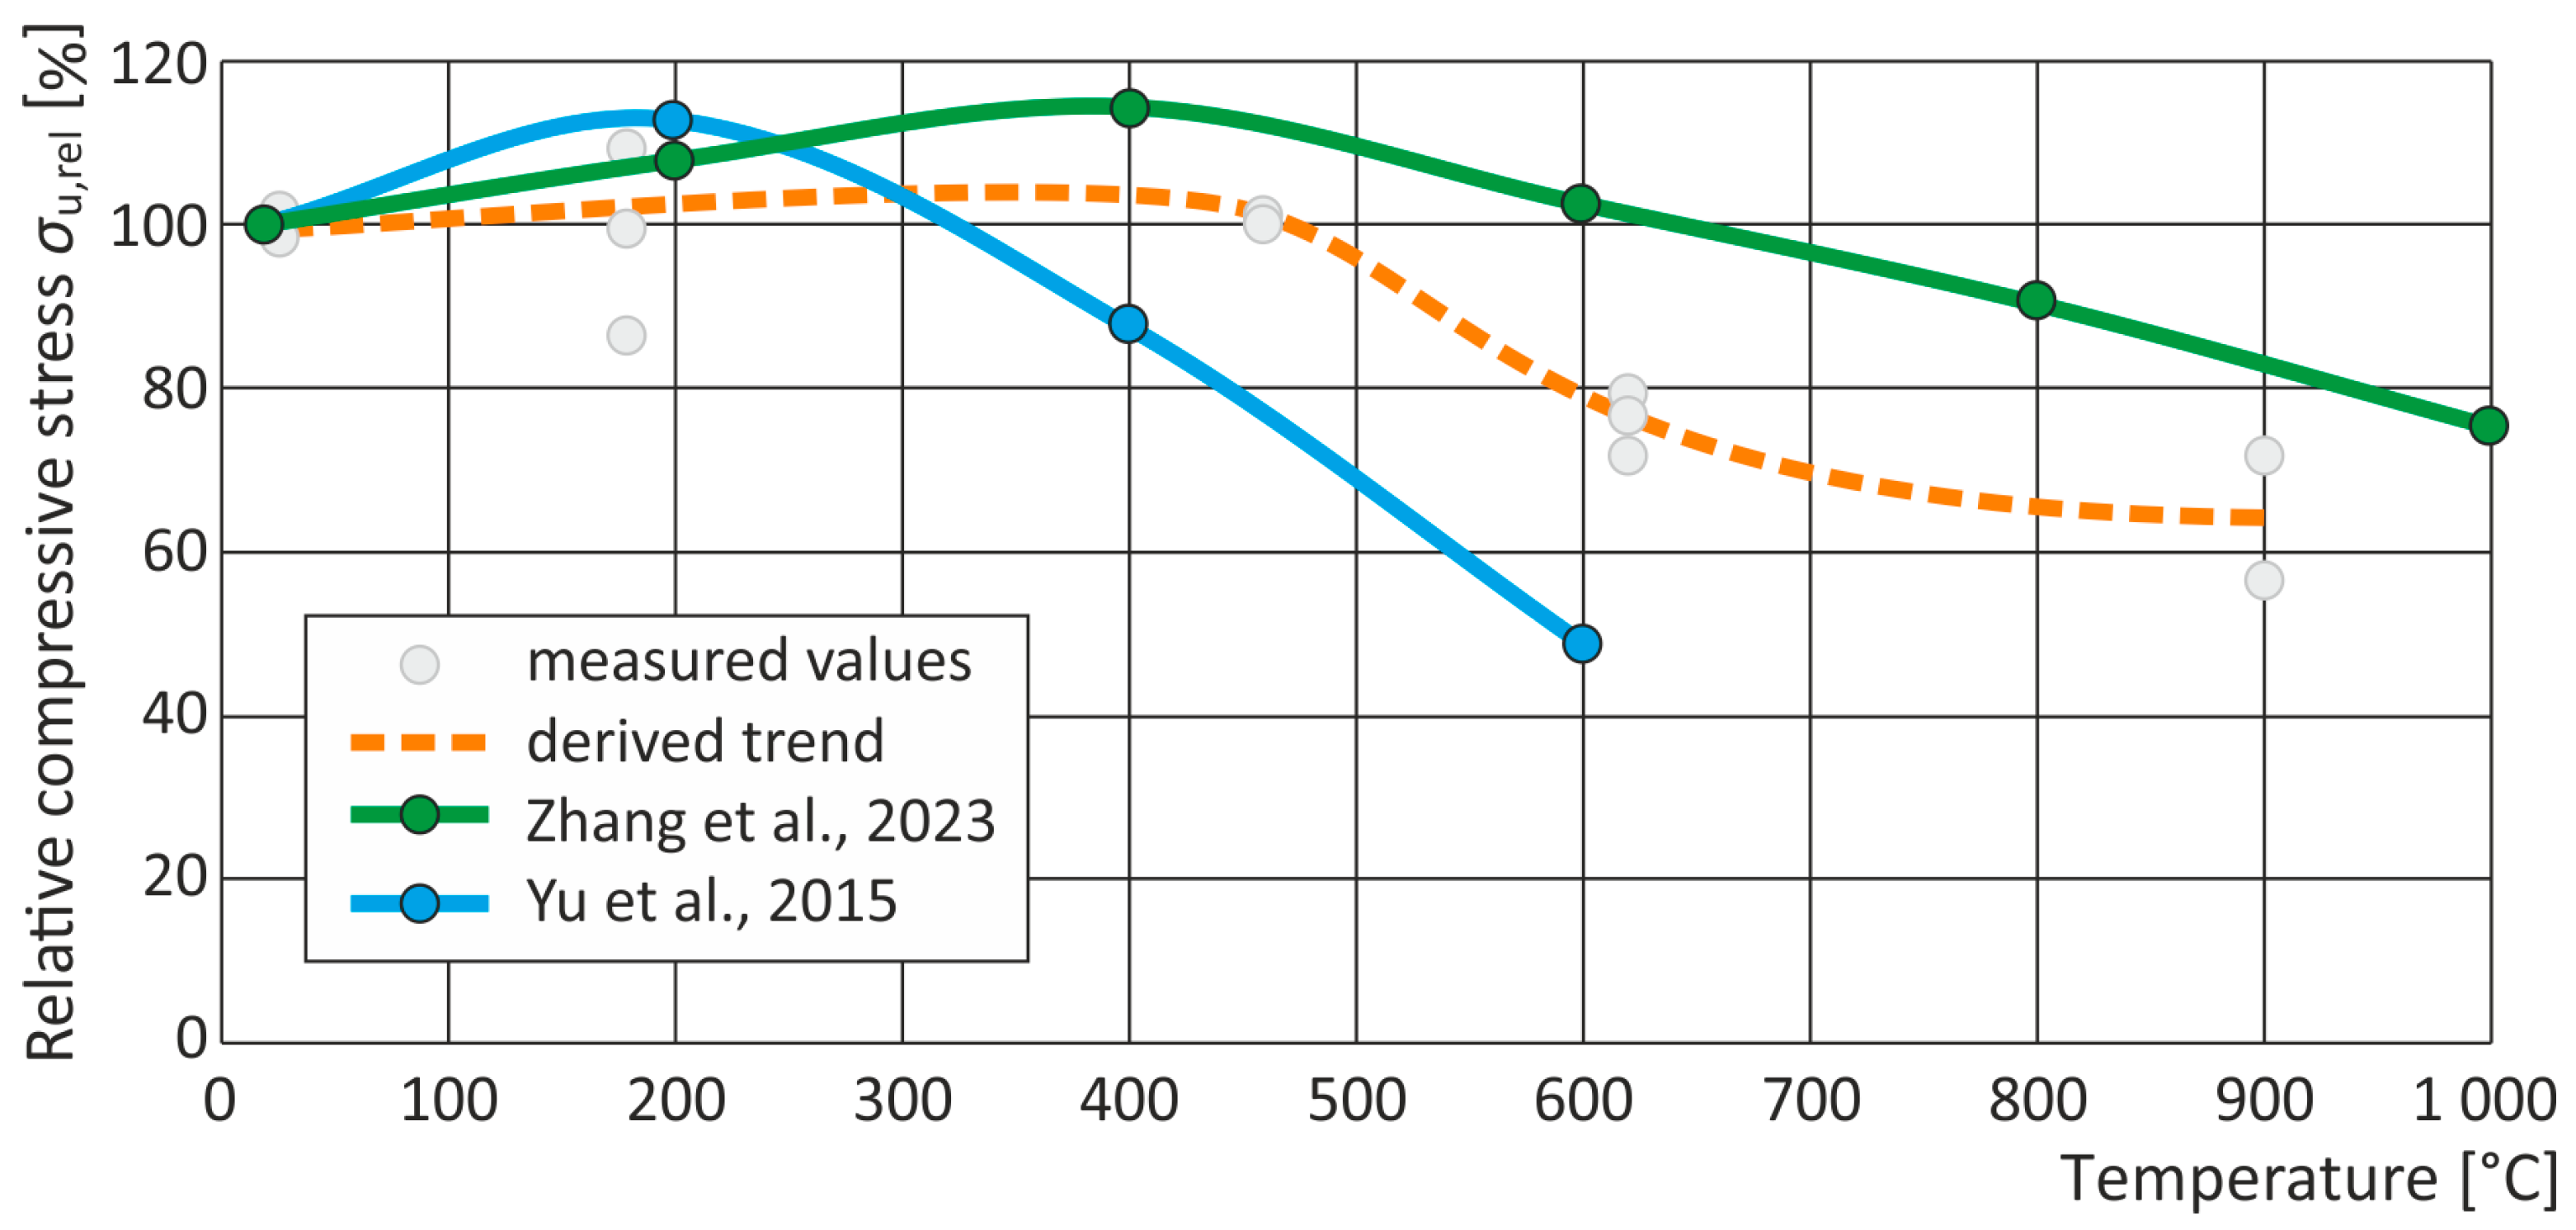
The overall findings of this study are consistent with observations reported in previous research. Zhang et al. [
10] noted that the relative compressive strength of sandstone samples initially rose to approximately 110% of baseline values when heated to 400 °C but then showed a marked decrease to around 75% of the original strength at 1000 °C. This trend mirrors the pattern seen in our Božanov sandstone samples, where strength remained stable up to 460 °C and then declined significantly beyond that point.
Similarly, Yu et al. [
8] investigated sandstone subjected to thermal cycles and observed changes in the stress–strain relationship. Their study highlighted an increase in strain and a decrease in maximum compressive strength with increasing heating temperatures. These results align closely with our own, which documented axial strain values increasing to more than three times the reference values after exposure to 900 °C, accompanied by strength reductions of up to 43%.
Figure 13 presents a comparison between the experimentally obtained values of ultimate compressive strength and those reported in the literature [
8,
10]. The results show a similar decreasing trend with increasing temperature, confirming the consistency of the current findings with established data.
Tian et al. [
4] also reported visual alterations in rock colour with increasing temperature, particularly in shale, which changed from dark grey to light red and eventually to a reddish-brown hue as temperatures approached 1000 °C. This phenomenon is in line with the colour transitions observed in our Božanov sandstone samples, supporting the conclusion that iron oxidation plays a central role in the thermally induced discoloration process.
Collectively, these findings confirm that Božanov sandstone is susceptible to mechanical and visual degradation under high thermal loads. Understanding this behaviour is vital for assessing the post-fire condition of heritage structures and planning appropriate conservation measures.
While this study primarily focused on compressive strength, it is important to recognize that shear strength also contributes significantly to the structural behaviour of natural stone. Future research should therefore incorporate shear testing to allow for a more comprehensive mechanical characterization. Additionally, although material brittleness is known to play a key role in failure mechanisms under thermal loading, it was not evaluated in the current work due to limitations in the available dataset. Moreover, advanced numerical approaches, such as peridynamic modelling, which have shown promise in simulating microstructural fracture development [
27,
28], were beyond the scope of this study. These aspects will be explored in future investigations to further advance understanding of sandstone degradation and failure following fire exposure.
5. Conclusions
This study investigated the impact of high temperatures on the mechanical properties of Božanov sandstone, a key material in historical Czech architecture. The results demonstrate that thermal exposure significantly alters the sandstone’s structural integrity, with notable changes occurring beyond 460 °C.
The key findings include the following:
Minimal impact at lower temperatures. Up to 460 °C, both compressive strength and Young’s modulus remained relatively stable, indicating limited thermal degradation within this range.
Significant degradation beyond 460 °C. Compressive strength began declined steadily with increasing temperature, reaching an average reduction of approximately 33% at 900 °C.
Progressive loss of elasticity. Young’s modulus exhibited a continuous decrease, dropping to an average of just 36% of its original value at the highest temperature, reflecting substantial structural weakening.
Increased deformation capacity. Higher temperatures led to greater axial strain, with average value reaching up to 471% of the reference value, highlighting a loss of internal cohesion and increased material brittleness.
Colour changes as indicators of transformation. Distinct shifts in colour, particularly beyond 460 °C, suggest mineralogical alterations that may compromise both structural and aesthetic properties of the material.
The shift in mechanical behaviour with increasing temperature highlights the thermal sensitivity and fire-induced deterioration of Božanov sandstone. It also emphasizes the importance of understanding how structural integrity can be compromised even before visible surface damage becomes apparent. This knowledge is crucial for assessing the fire resilience of historical sandstone structures and for planning effective conservation and restoration measures. In post-fire scenarios, a reliable understanding of the residual mechanical properties of natural stone is essential for making well-informed decisions about whether a damaged structure can be safely retained or requires partial or complete removal. It also helps determine whether invasive strengthening measures are necessary or if non-invasive approaches, such as surface cleaning and preservation treatments, will be sufficient. Particularly in case of a listed or protected monument, it presents a complex set of challenges that extend far beyond structural concerns. Even when structurally justified, partial or complete removal can lead to the irreversible loss of historical authenticity, architectural value, and cultural identity. Additionally, the replacement of original materials with modern alternatives may alter the visual and material coherence of the building, potentially diminishing its historical significance. These complications underscore the critical need for thorough assessment of post-fire material behaviour, as accurate evaluation of the residual load-bearing capacity can help avoid unnecessary removal and support minimally invasive conservation strategies. Ultimately, accurate post-fire assessment is key to ensuring both the structural safety and the continued preservation of a building’s historical and architectural value.
Building on the findings of this study and the identified limitations, future research will aim to deepen the understanding of fire-induced changes in sandstone. Future research will focus on comparison of mineralogical and petrographic analysis of sandstone samples before and after heating using techniques such as Scanning Electron Microscopy (SEM), X-Ray Diffraction (XRD), and Fourier-transform infrared spectroscopy (FTIR). These techniques will enable the observation of microcrack formation, grain boundary alterations, and other thermally induced structural changes, detect mineral phase transformations, such as the decomposition of clay minerals or quartz recrystallization, offer insight into changes in crystallinity and thermal stability, identifying variations in chemical bonding and the presence of specific functional groups, and will allow for the detection of subtle mineralogical alterations that may not be visible through other techniques, thus offering a more comprehensive understanding of the physical and chemical processes that contribute to the degradation of sandstone under high temperatures. In addition, the effects of cooling methods (i.e., quenching), thermal cycling, and real-fire exposure scenarios will be explored to develop strategies for mitigating sandstone damage in historical structures.
