1. Introduction
The United Nations Sustainable Development Goal No. 2 (SDG 2) promotes sustainable agriculture, which ensures food security, nutrition and productivity improvements, and waste reduction [
1]. SDG 2 sets out specific targets to this end, including ending hunger and all forms of malnutrition, doubling the income and productivity of small-scale food producers, and ensuring equitable access to resources, land, knowledge, and markets. The goal also calls for the implementation of resilient and sustainable agricultural practices that preserve ecosystems, improve soil and land quality, and strengthen adaptation to climate change. Other objectives include preserving the genetic diversity of seeds and livestock, increasing investment in agricultural research and rural infrastructure, and enhancing the transparency and stability of food markets to prevent extreme price volatility [
2].
In this regard, the agricultural sector is a major source of particulate matter (PM), and greenhouse gas (GHG) emissions, contributing 10–12% to the global total [
3]. Another important air pollutant is ammonia (NH
3), primarily emitted from agricultural activities such as fertilizer use and livestock farming. It contributes significantly to the formation of fine particulate matter having a diameter under 2.5 µm (PM2.5) [
4], which acts as a key precursor in atmospheric reactions with significant effects on both air quality and human and animal health [
5]. PM2.5 can reach the deepest regions of the human respiratory tract, thereby increasing the risk of serious health problems, including respiratory and cardiovascular diseases [
6].
Indeed, PM emissions represent the fourth largest mortality risk factor globally. Based on the literature [
7], in 2019, one out of nine deaths were attributed to PM2.5 and ozone pollution (O
3), with PM2.5 responsible for over 94% of these deaths. Despite the relevance of this issue, the quantification of PM2.5 concentrations is complex, due to both the spatial and temporal variability of emissions and the influence of meteorological factors. In this context, several mitigation strategies to reduce PM2.5 concentrations in dairy farms can be grouped into the categories identified by Guo et al. [
8], who reviewed air pollution control techniques in mechanically ventilated farms. These include:
- -
Optimising ventilation, especially during the critical phases of livestock activity (i.e., milking and feeding);
- -
Reducing rough surfaces, which are more prone to the PM2.5 accumulation and resuspension, in line with the source control strategy, to minimise dust retention and facilitate cleaning operations;
- -
Air flow controlling at ground level to limit resuspension of particles from litter and floor surfaces;
- -
Improving litter management and feeding;
- -
Installing vegetative biofilters, such as green walls, integrated into the livestock building, that are effective in capturing suspended particulates and improving indoor air quality.
Among these mitigation strategies, green systems have been widely studied and applied in both the civil and livestock sectors as a sustainable and effective solution to reduce PM concentrations, improving air quality. Based on the current state of the art, the most frequently examined green solutions are green walls [
9,
10,
11], green roofs [
12,
13,
14], vegetated buffers [
15,
16,
17], and potted plants [
18,
19,
20]. The aforementioned green mitigation systems primarily differ in the structural supports they utilise. Green walls, for instance, are developed on a support perpendicular to the floor plane. Green roofs, on the other hand, are vegetated coverings that extend over a horizontal structure or follow the inclination of the roof they are integrated with. Vegetation buffers are support-independent systems following the natural growth direction of plants and trees. Lastly, potted plants are simply contained within pots. These green solutions differ substantially in their structure, support system, and surface development. Among the nature-based solutions applicable to residential buildings, green walls represent the most effective intervention in reducing air pollution, with reductions in PM2.5 concentrations ranging from 25% to 99%, depending on plant species, wall configuration, and environmental context [
21]. The effectiveness of such walls depends mainly on the type of plant species used. In this regard, Weerakkody et al. [
9] demonstrated that living walls consisting mainly of small-leaved species and conifers are more efficient in retaining atmospheric PM2.5 than broad-leaved species. It is also crucial to select the most suitable green wall system according to the structural and climatic conditions, as well as the environmental implications and costs associated with the whole life cycle of the project [
22].
The existing literature mainly focuses on urban contexts in Northern and Central Europe, which are characterised by temperate or cold climatic conditions. Consequently, it offers limited knowledge for scenarios having different environmental and construction characteristics, especially in the livestock sector.
In addition, as it was reported by Ascione et al. [
23], there are some research gaps in the literature. These include the lack of international standards for the design and evaluation of green walls, which makes it difficult to compare data between different studies, and the high variability of data, depending on climate, exposure, and methodologies.
In the livestock sector, the study of Leso et al. [
24] considered the use of so-called “greenery systems” as an alternative solution for reducing the thermal load within greenhouse-type buildings. The results showed that these structures can guarantee indoor temperatures comparable to those achieved by buildings with insulated roofs in summer. In addition, green walls contribute to the creation of a more natural environment for the animals, while providing shade. A relevant example is the “cow garden” implemented in the Netherlands [
25,
26].
Ajami et al. [
27] implemented a mitigation system based on a combination of windbreaks and vegetative strips in a pig farm and a poultry plant. The system was tested for its efficacy in containing air pollutants by monitoring environmental parameters such as total suspended particulate matter (TSP), thermal conditions, air flow rate, filter material characteristics, and pressure variations. The data collected showed a significant reduction in TSP, odour, and NH
3 emissions, as well as a retention capacity of elements such as nitrogen and sulphur by soil and plants. Further studies in the literature [
15,
16] involved the use of vegetative environmental buffers at poultry farms, composed of shrubs and trees; these buffers were designed to reduce the dispersion of air pollutants, slow down air flows, and mitigate acoustic and visual impacts. The monitoring techniques included a LIDAR system, used to quantify atmospheric PM through light pulses, and continuous-reading aerosol sensors coupled with photometric laser instruments to analyse fine PM [
28].
Based on the study of the literature, there is limited research on the application of green systems in rural buildings or livestock farms [
15,
16,
27]. Furthermore, research focuses mainly on poultry and swine farms, with studies largely observing the impact of vegetation alone or in combination with artificial ventilation on air quality [
14,
15,
25]. Crucially, these studies often do not address the design phase of a green module or the definition of a vegetated tool. Instead, their focus is typically limited to evaluating the environmental effects of pre-existing solutions, such as simple trees, bushes, and shrubs, rather than technologies specifically engineered as replicable units.
The current study aims to bridge this gap by focusing on the precise design of a green wall. The goal is to develop and evaluate a specific, replicable vegetated module that can serve as a tool for future research. This strategy will facilitate the assessment of the module’s effectiveness across different livestock environments and farm types, offering a solid basis for the adoption of innovative and scalable green solutions in the industry. Therefore, the methodology employed shifts from studying and analysing existing green solutions to a focus on design, followed by an evaluation of the environmental impact improvements achieved through the developed green system. The contribution of this study is based on the development of sustainable livestock design strategies, with a focus on integrating nature-based solutions to improve indoor air quality in livestock farms. The aim of this study is to analyse the PM2.5 concentrations within an open dairy barn in the Mediterranean area, with the overall objective of increasing environmental sustainability, human health, and animal welfare in livestock housing systems. Specifically, the objectives of this study are to quantify the level of PM2.5 and identify influencing factors in open dairy barns; to develop and implement a green system (i.e., a vertical green wall system) designed to work as a passive mitigation strategy in open barn configurations; to test the green wall system’s performance in reducing PM2.5 concentrations; to compare the levels of PM2.5 before and after the application of the green wall; and to discuss the outcomes in relation to current regulatory limits and health-based guidelines.
This article is organised into several key sections detailing the research on the design and evaluation of the modular green wall system for particulate mitigation on livestock farms. In particular,
Section 2 details the barn environment in which the system is applied and tested, along with the green wall design process and the tools and methodologies for analysing its performance.
Section 3 presents the results of PM2.5 concentrations measured before and after the installation of the wall in the barn, describing the green system implemented and quantifying its effectiveness in reducing particulate matter.
Section 4 provides an interpretation of the results by comparing them with the existing literature, highlighting the innovations and limitations of this study and suggesting future research directions.
2. Materials and Methods
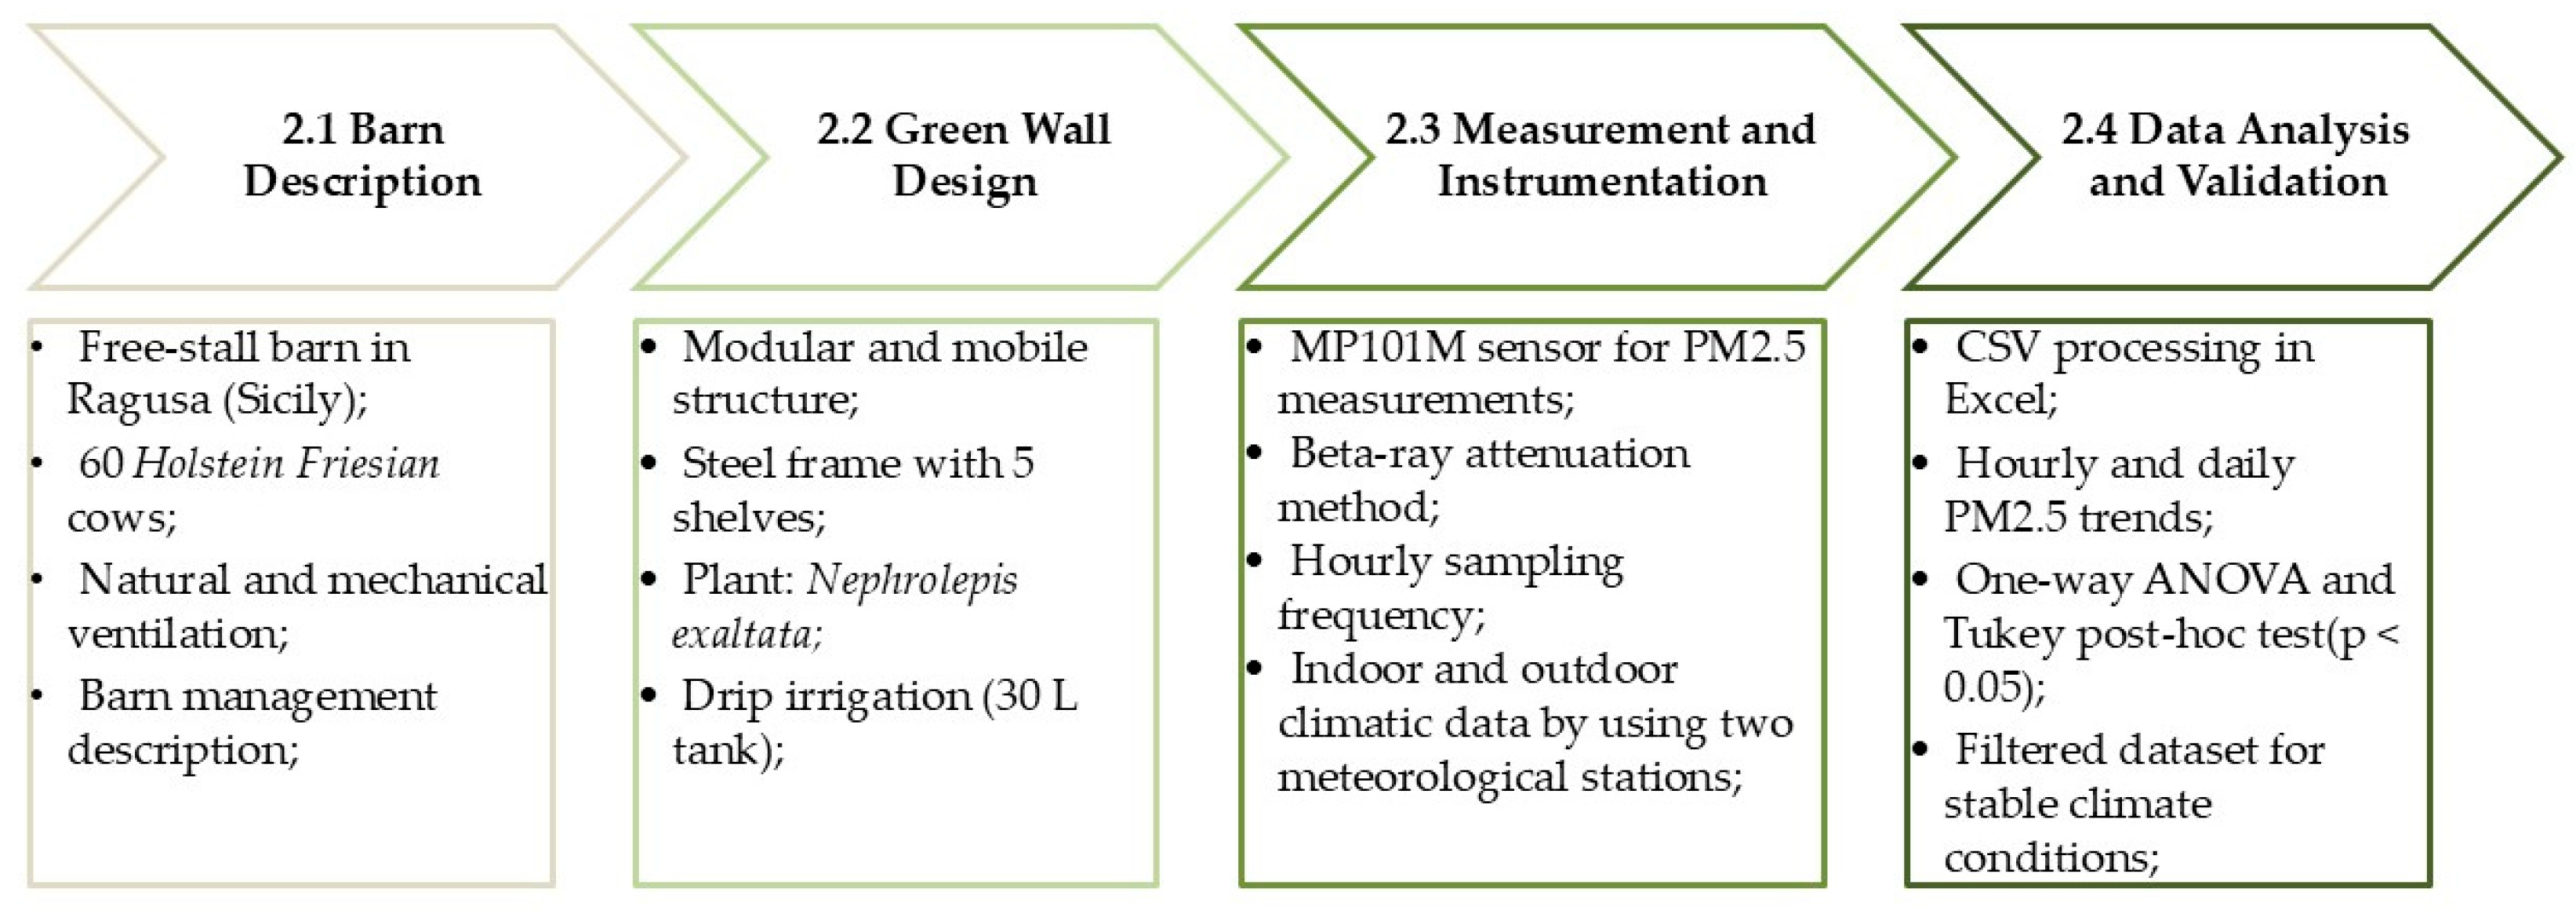
This study adopted a sequential methodological approach (
Figure 1) to assess the effectiveness of a green wall system in reducing PM2.5 concentrations within a livestock environment. Firstly, a representative free-stall dairy barn in southern Italy was selected and its structure, ventilation and management practices were described. A literature review and a technical review were then conducted to analyse existing green systems and define specific design requirements for integration into the barn. Based on these findings,
Nephrolepis exaltata was selected as non-noxious plant for animals and a modular, mobile green wall was designed and installed inside the barn. The experimental campaign involved the continuous monitoring of PM2.5 concentrations before and after installation, alongside the recording of relevant microclimatic parameters. Finally, the collected data were processed and statistically analysed to evaluate the green wall’s impact under real operating conditions.
2.1. Barn Description and Management
The experiment was carried out in a free-stall dairy barn, located in the province of Ragusa in Southern Italy (37°01′ N, 14°32′ E), one of the main milk production areas in Sicily. The barn housed 60 Holstein Friesian dairy cows with an average body weight of approximately 650 kg. The structure was rectangular in shape, measuring 55.50 m in length and 21.40 m in width. Based on these parameters, the stocking density was around 0.05 animals per square metre, equivalent to one cow per 19.8 m2. In terms of live weight, this corresponded to 32.8 kg/m2.
Figure 1.
Methodology framework.
Figure 1.
Methodology framework.
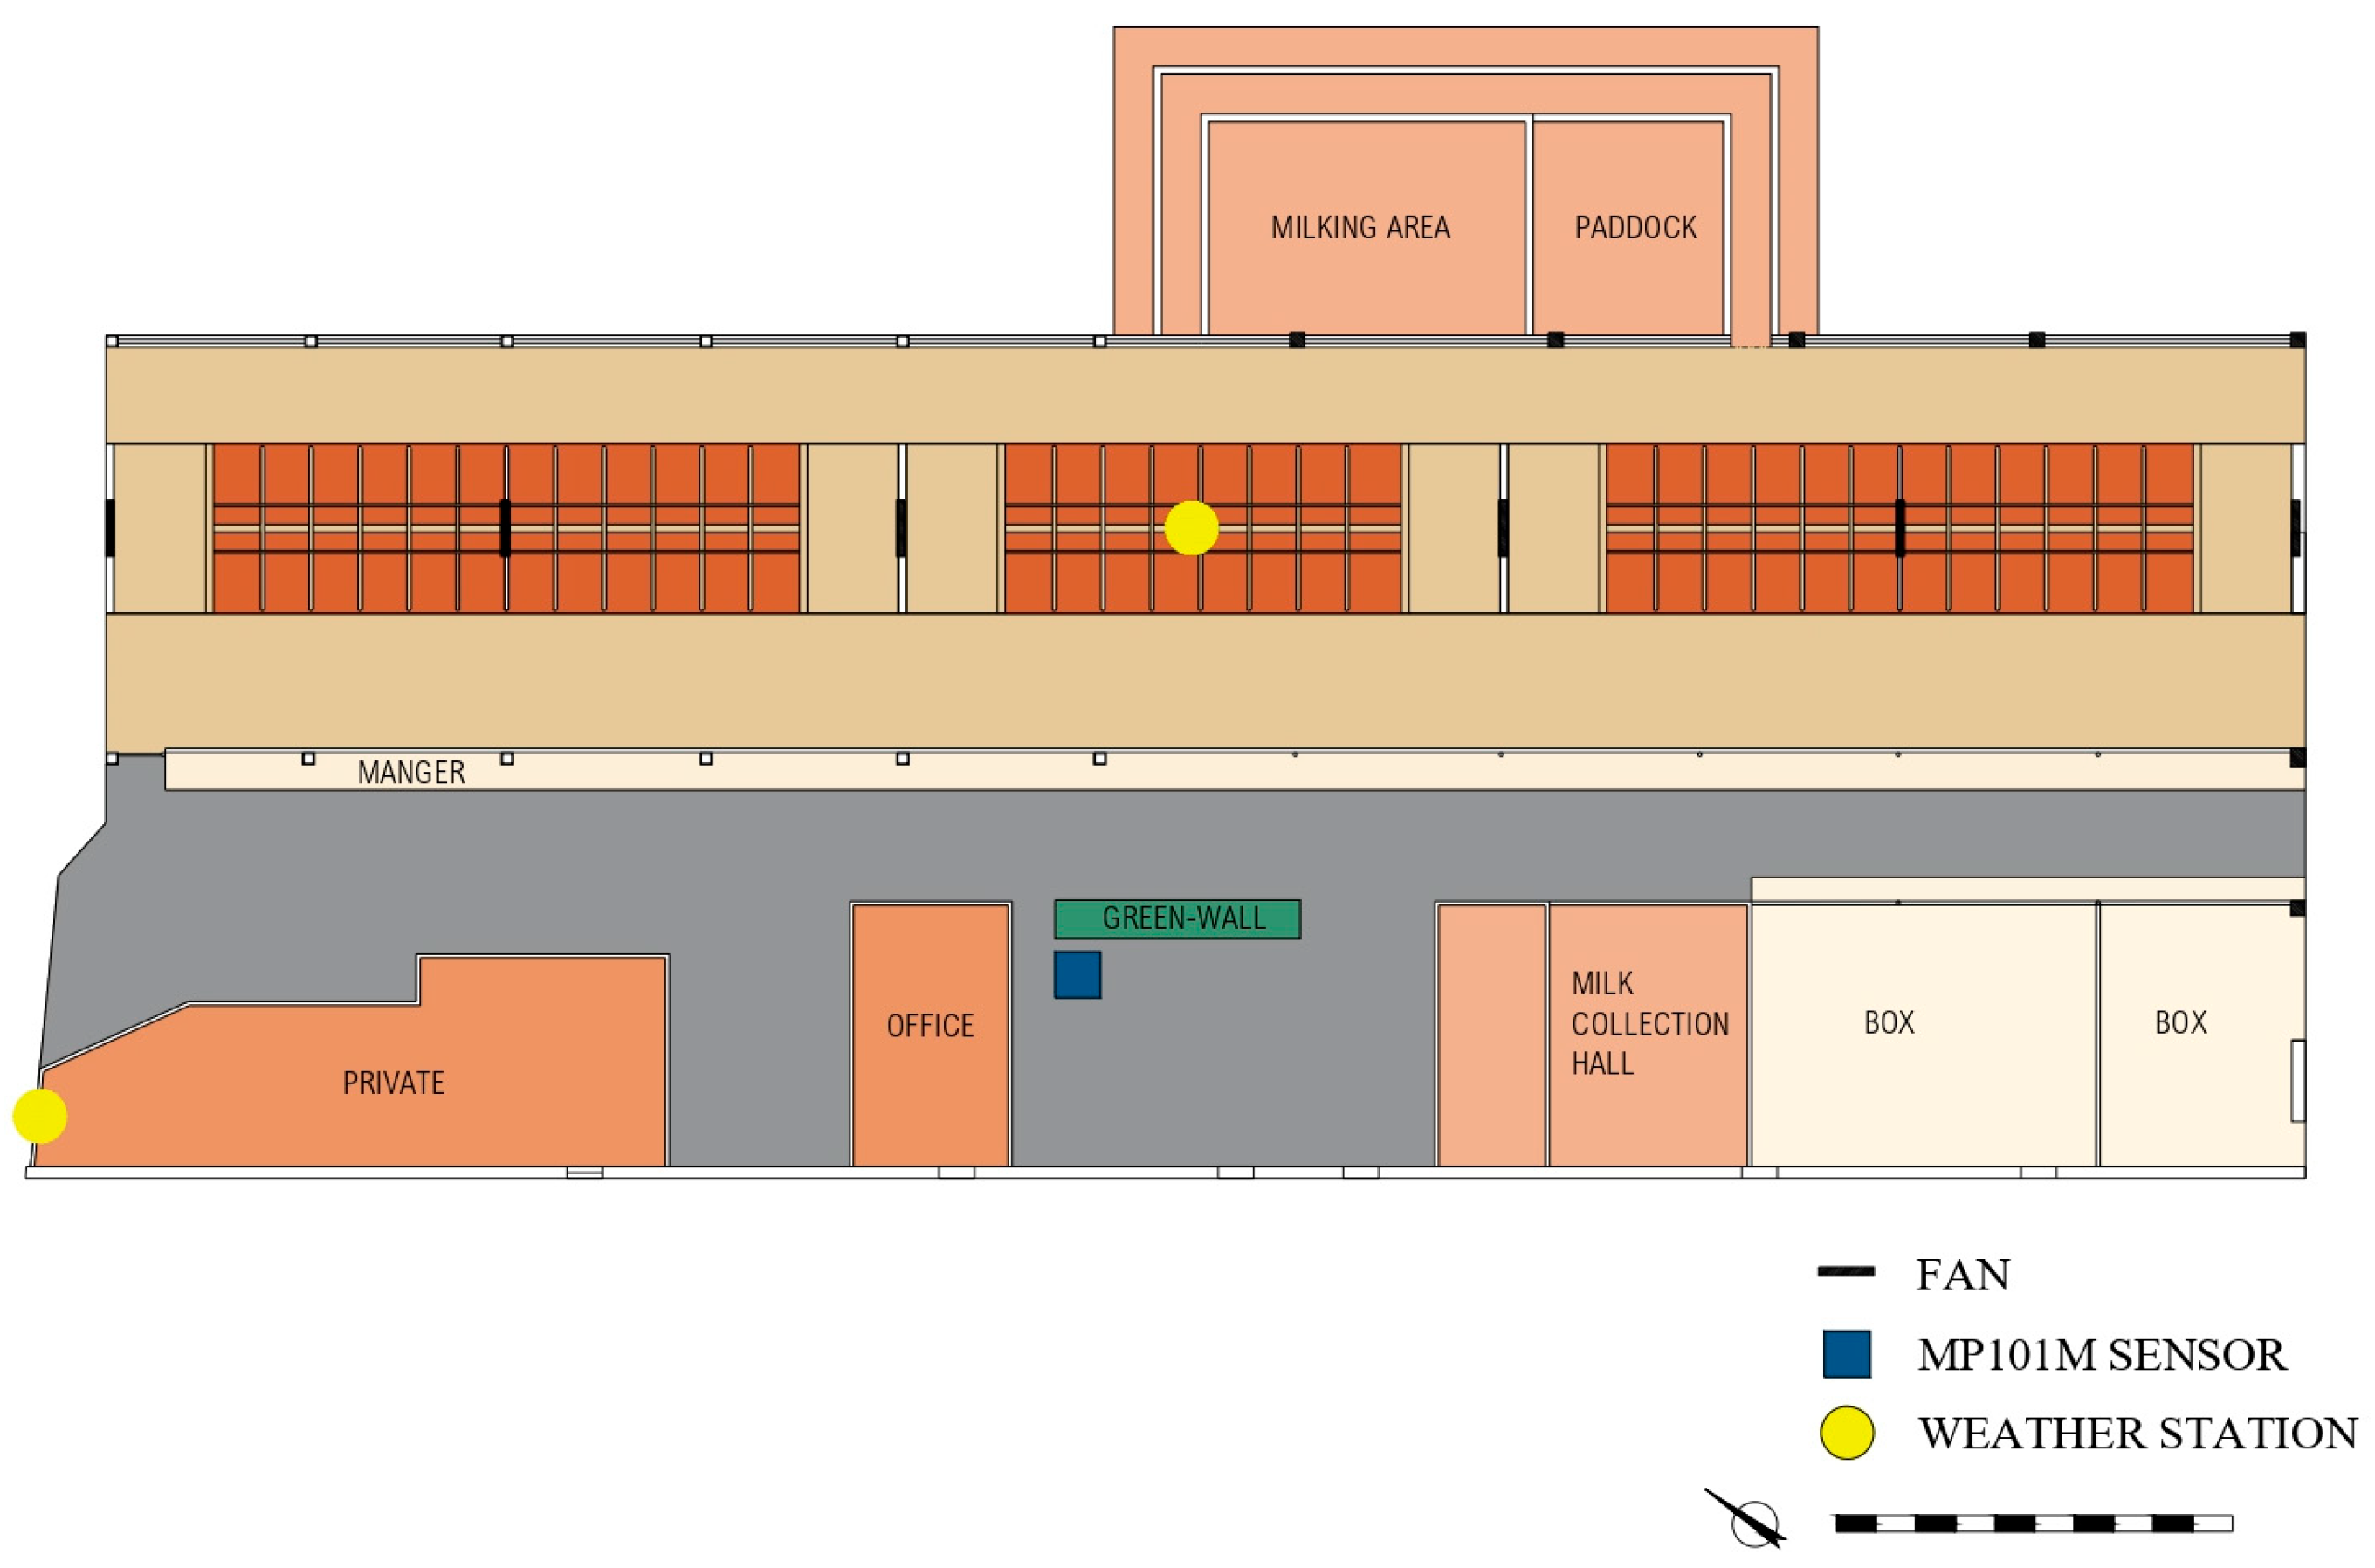
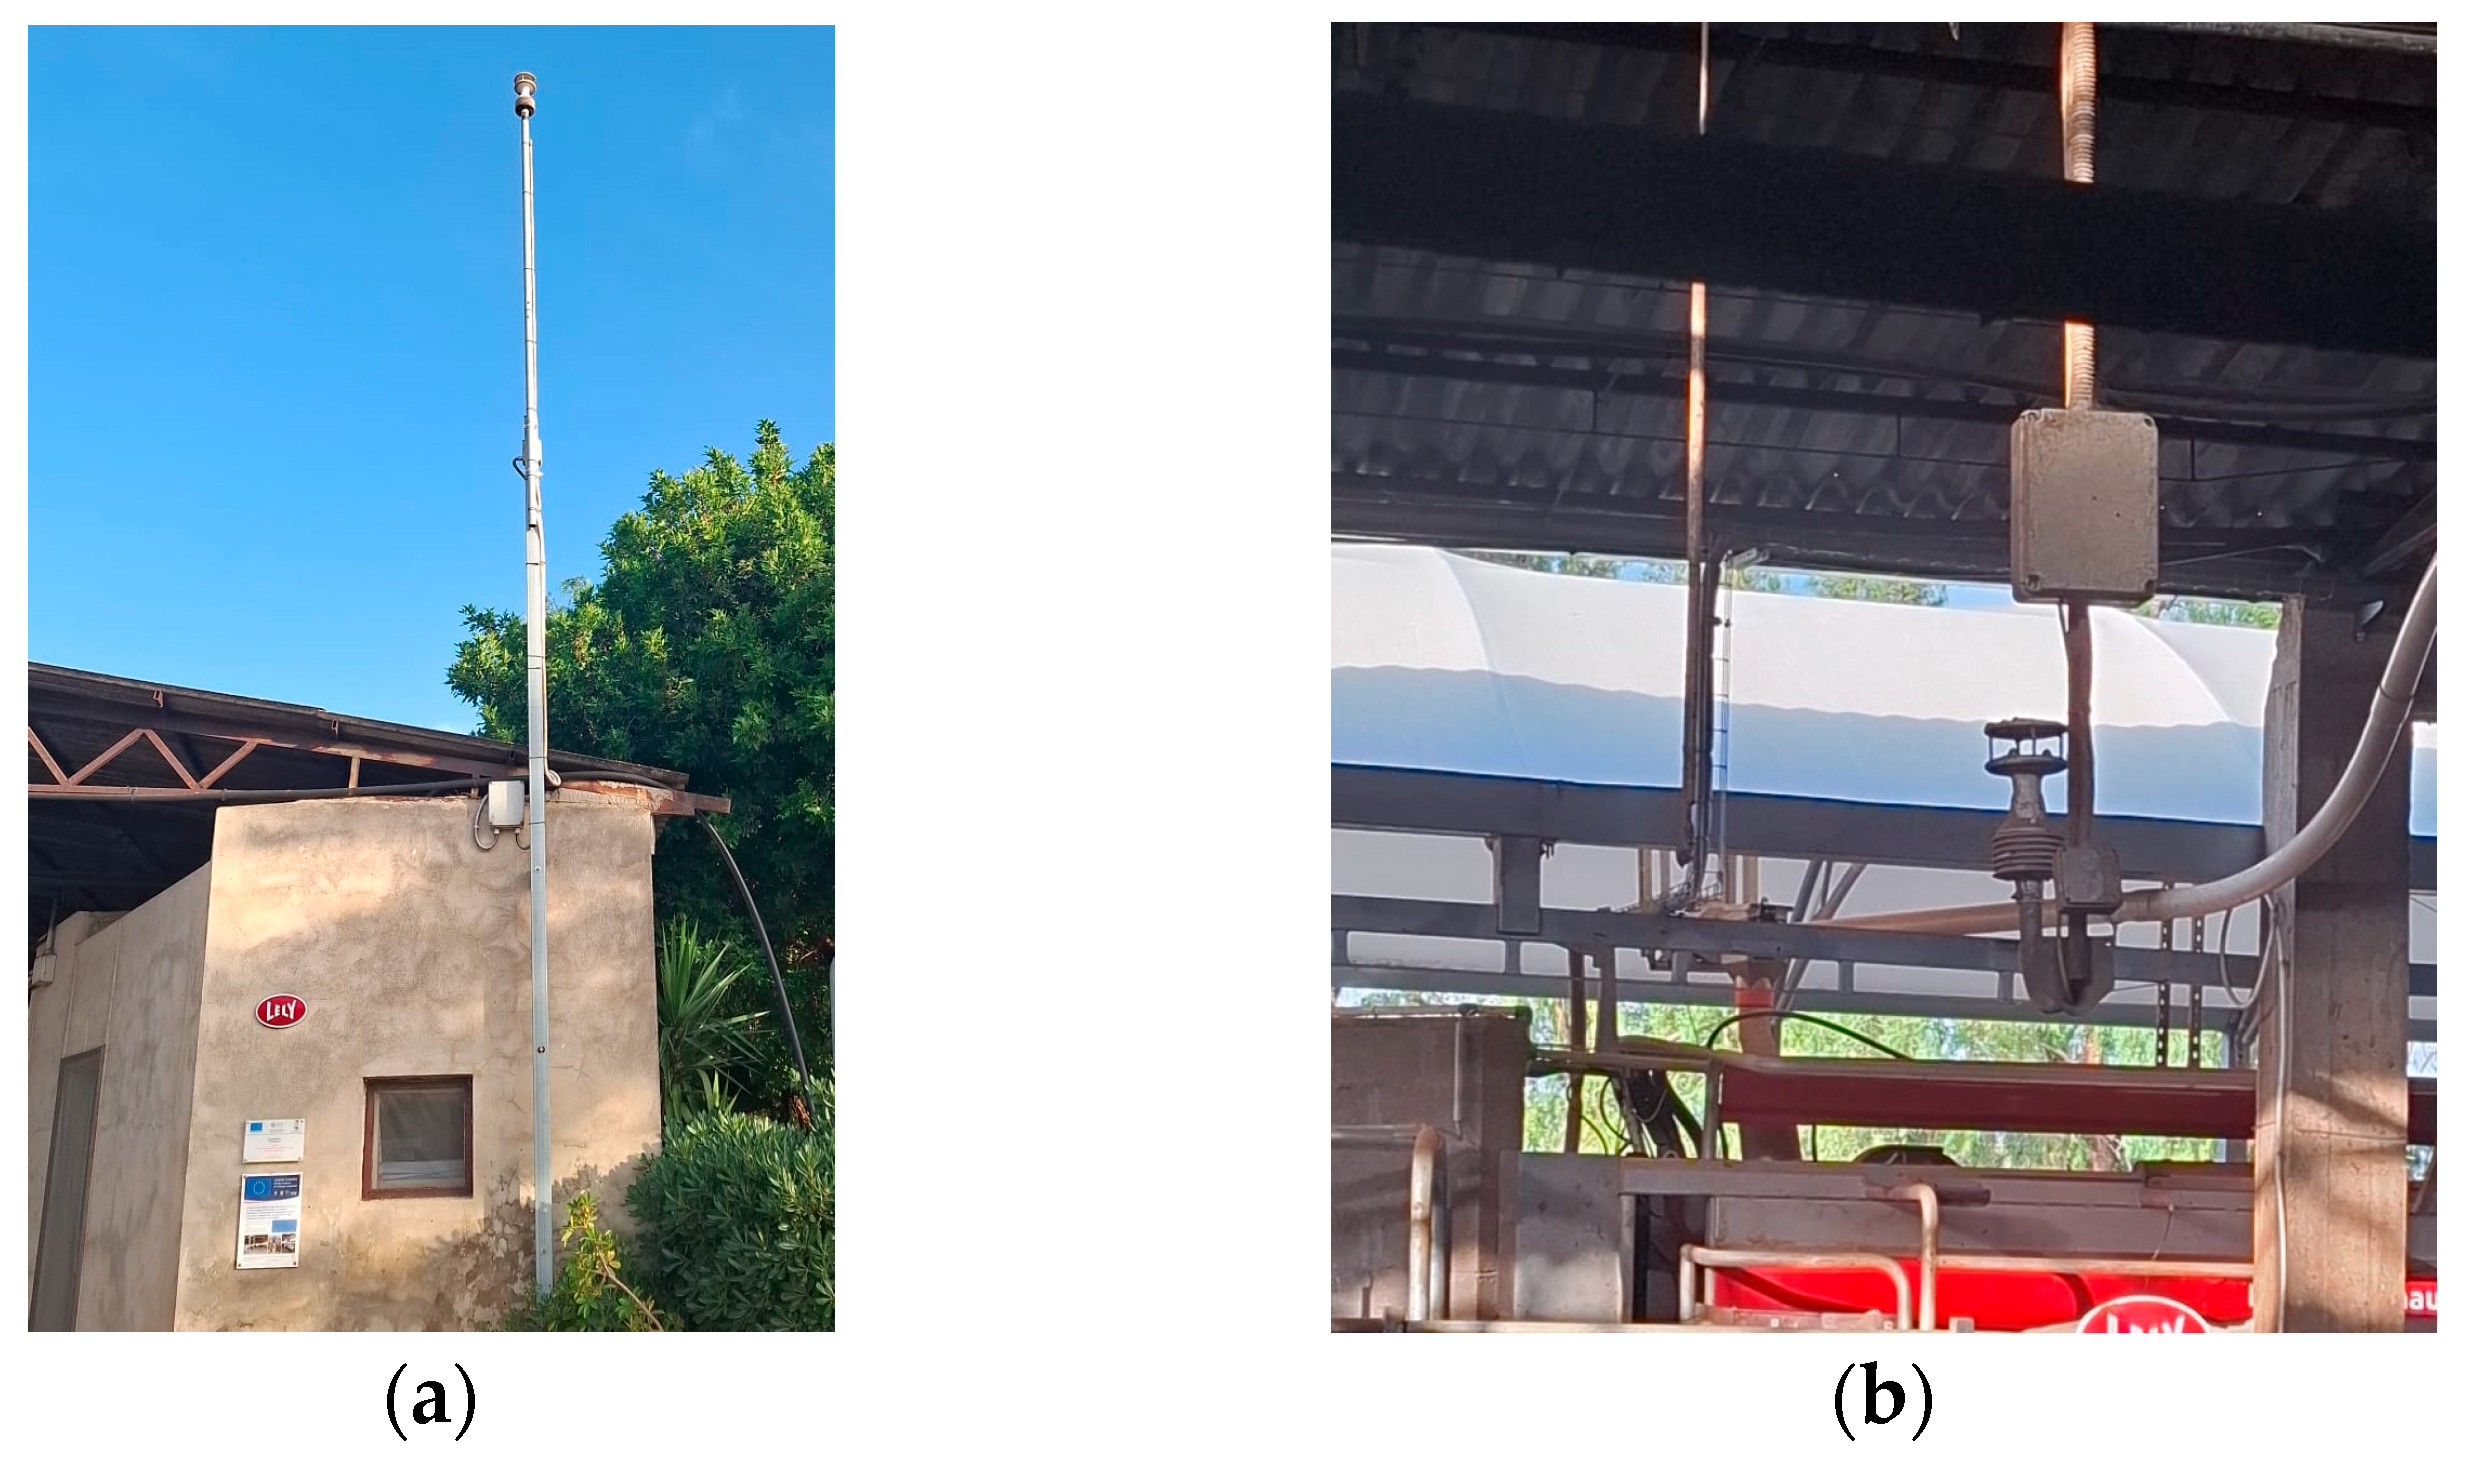
The building had three sides (i.e., south-east, north-east, and north-west) completely open, while the south-west side was closed by a continuous reinforced concrete wall with six openings (0.90 m × 2.10 m each). Inside, the area was divided into three concrete-floored enclosures with 64 “head-to-head” boxes, arranged in rows bounded by concrete curbs and covered with sand; on the north side, there was an area (17.8 m × 7.8 m) equipped with an Automatic Milking System (Lely, Maassluis, The Netherlands) (
Figure 2). The symmetrical roof was made of corrugated fibre-reinforced concrete panels. It had a central ridge that was 7 metres high, as well as a gutter that was 4 metres high and approximately 5 mm thick.
The open housing system allowed natural ventilation, which was supplemented by two mechanical cooling systems located in the resting area and in the feeding area. The fans in the cubicles operated in 3 min cycles every 30 min when the ambient temperature was below 20 °C. Between 20 °C and 29 °C, the ventilation systems operated continuously. Above 29 °C, a combined cycle was activated consisting of one minute of misting, followed by ventilation intervals modulated according to the temperature.
During the experimental period, the ambient temperature remained below 20 °C; thus, the ventilation system operated intermittently.
The daily barn management involved the breeder, at around 5.30 a.m., bringing in the mixture distributed the previous day, thus stimulating the first morning activity of the cows. Subsequently, around 7:00 a.m., the animals were moved from the service alley to the feeding one and vice versa to allow cleaning operations, carried out by a tractor with a scraper. Around 10.30 a.m., once a day, the new mixture was delivered, which constituted the main feed supply. The mixed ration consisted of grass hay, sodium bicarbonate, iodised salt, soya and purine nucleus, and pulp silage. The latter consisted of alfalfa hay, beet, whole maize, cottonseed, and orange pulp.
Manure management involved collecting waste in a storage area and adding straw to create a solid mixture. This fertiliser could then be used on agricultural land or sold to other users.
2.2. Design of the Green Wall
The methodology was divided into three distinct phases: an initial phase regarding the analysis of existing green systems, followed by the definition of specific design requirements, and finally, the design and implementation phase of the structure.
The analysis of existing green systems focused on the main green systems used in both urban and agricultural settings, investigating green walls, active solutions, urban green systems, and the most commonly used plant species for air purification. The study by Shushunova et al. [
29] analysed several green wall technologies, including Versawall, Biotecture, and Vertiss. The Versawall system is a modular structure available in several formats, consisting of a support frame on which pots with plants are placed and equipped with an integrated irrigation system. Biotecture, on the other hand, is a modular hydroponic system consisting of a galvanised steel structure, waterproof panels, and a geotextile drainage layer; the substrate used is rock wool (Grodan), a lightweight material with a high water-holding capacity. The special feature of this system is that it allows water and nutrients to be administered in a controlled manner, thereby optimising plant growth conditions. The Vertiss system uses substrate-filled modules mounted on a metal frame. It has a significantly higher weight than the others (94 kg/m
2), which increases its robustness and durability. The more compact substrate is made of pozzolan and cross-linked polymers, materials that ensure high water and nutrient retention. Irrigation is automatically controlled by a drip system. On the other hand, Shao et al. [
11] developed a prototype of an indoor green wall supported by a metal structure, with the aim of reducing CO
2 and suspended particulate concentrations. The system used drip irrigation connected to pots to improve water use efficiency. Active systems include the Naava One wall described by Torpy et al. [
30], which is equipped with forced ventilation. This freestanding, self-supporting unit is designed to draw air through the substrate and plant biomass and release it back into the indoor environment. Watering is done manually twice a day via a programmed humidification system. Tests have shown that up to 56.5% of volatile organic compounds (VOCs) can be removed in a single pass through the biofilter.
The design process considered the selection of plant species a key parameter, since some plant species are particularly effective in absorbing air pollutants, including particulate matter and noxious gases [
18]. Mikkonen et al. [
26] evaluated the impact of plants and substrates on air quality, while Shen et al. [
31] analysed aspects such as growth index, leaf density, and plant cover. Shen et al. [
32] focused on the ability of plant species used in green systems to absorb VOCs. Among the most commonly reported species in the literature are
Epipremnum pinnatum cv. aureum and
Davallia fejeensis Hook, which are effective in removing VOCs in pot applications;
Peperomia magnoliaefolia and
Kalanchoe blossfeldiana, grown on cocopeat and perlite substrates to reduce suspended particulates; and
Geranium macrorrhizum [
28] and
Nephrolepis exaltata ‘
Bostoniensis’. The latter is reported by Legislative Decree No. 155/2010 [
33] to be among the most effective in retaining atmospheric particulates.
Based on this analysis, the identified requirements are structural configuration (i.e., modularity, mobility, bearing capacity, and resistance to harsh environments), plant species selection, containers and growing medium, and irrigation system (i.e., water and energy autonomy).
The development of the final design proposal has followed the above-mentioned requirements, and it is the result of the design process, described in detail in
Section 3.2, as a result of this research activity (
Figure 3).
2.3. Instrumentation for PM2.5 Measurement and Climatic Conditions Monitoring
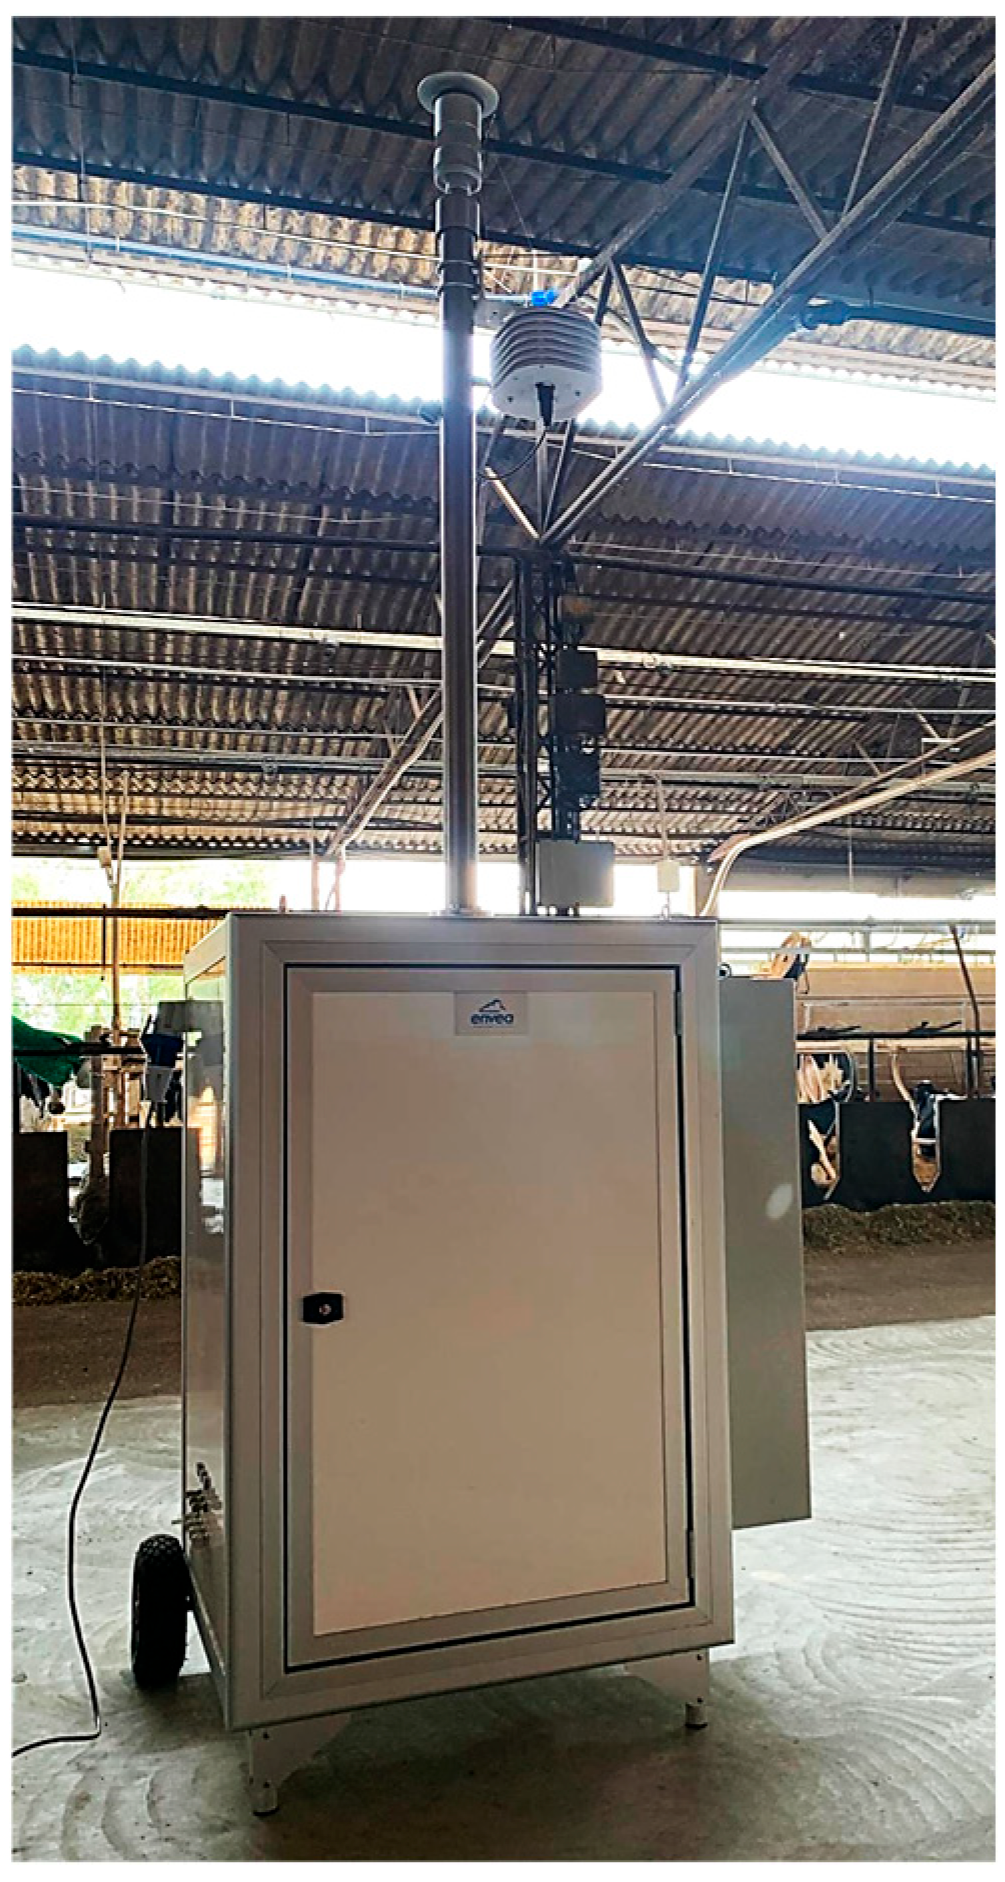
PM2.5 concentrations were measured using a particulate analyser MP101M device (ENVEA, Poissy, France), which is based on the beta-ray attenuation method for the continuous measurement of PM concentration in ambient air. This high-precision instrument has been certified as equivalent to the reference method according to the European standard EN12341:2014 [
34] and EN14907:2005 [
35] for the measurement of PM10 and PM2.5, respectively. In particular, the PM2.5 sensor had a measurement accuracy ≤ 2.5 µg/m
3 (24 h averages), zero level and detection limit ≤ 2 µg/m
3 (24 h averages), and flow accuracy ≤ 2% of nominal flow.
The MP101M is integrated with a web server that enables remote control, management, and analysis of data via network-connected devices such as PCs, tablets, or smartphones. In this research study, the MP101M instrument was located at the centre of the barn, inside an external climate-controlled cabinet (
Figure 4). The device continuously acquired PM2.5 measurements at an hourly sampling frequency.
Two meteorological stations (MeteoSense 2.0 GPRS + LAN, Netsens, Florence, Italy), located inside and outside the barn, continuously monitored climatic and microclimatic parameters (
Figure 5). Wind speed was measured with a resolution of 0.01 ms
−1 and air temperature with an accuracy of ±0.15 °C. The indoor station was installed at a height of 2.20 m above the cubicles, in the central pen. Data were acquired with a sampling frequency of 1 min s
−1.
2.4. Data Acquisition and Processing
The experiment was carried out over 20 days from 11 March to 31 March 2025. This period was divided into two acquisition phases, which was necessary to evaluate PM2.5 concentrations before and after the installation of the green wall, which was set up on 21 March 2025. The period from 11 March until 20 March was considered to assess PM2.5 before the application of the green wall, whereas the period from 22 March to 31 March was selected to evaluate PM2.5 after the green wall’s installation. The raw data were exported in CSV format and subsequently processed by using Microsoft Excel. The data were analysed on an hourly basis to study the daily path and on a daily basis to assess the overall statistical differences before and after the green wall was installed, as well as to evaluate the overall PM2.5 concentration in the barn. Data acquired on 21 March were excluded from the analysis since the installation of the green wall required the whole day.
The relationship between PM2.5 and microclimatic conditions was also examined. For statistical evaluations, the p-value was used, which indicates the significance of the statistical test. In particular, a p-value threshold of 0.05 was considered. If the resulting p-value was greater than 0.05, it indicated that, from a statistical point of view, there were no significant differences between the groups analysed. The Tuckey post hoc test was applied to highlight significant differences between groups, indicated by using lowercase letters of the alphabet.
3. Results
This section is subdivided into three subsections describing the outcomes related to the different PM2.5 concentrations due to the mitigation strategy applied (
Section 3.1), the characteristics of the implemented experimental green wall system fulfilling the requirements analysis (
Section 3.2), and the statistically-based assessment of the mitigation strategy results (
Section 3.3).
3.1. PM2.5 Concentrations
To evaluate the concentration differences before and after the application of the mitigation strategy, a preliminary assessment of indoor barn climatic conditions during the experiment was carried out. The one-way ANOVA (
Table 1) demonstrated that the difference in climatic conditions was not statistically significant in the periods before and after the application of the mitigation strategy (
p > 0.05).
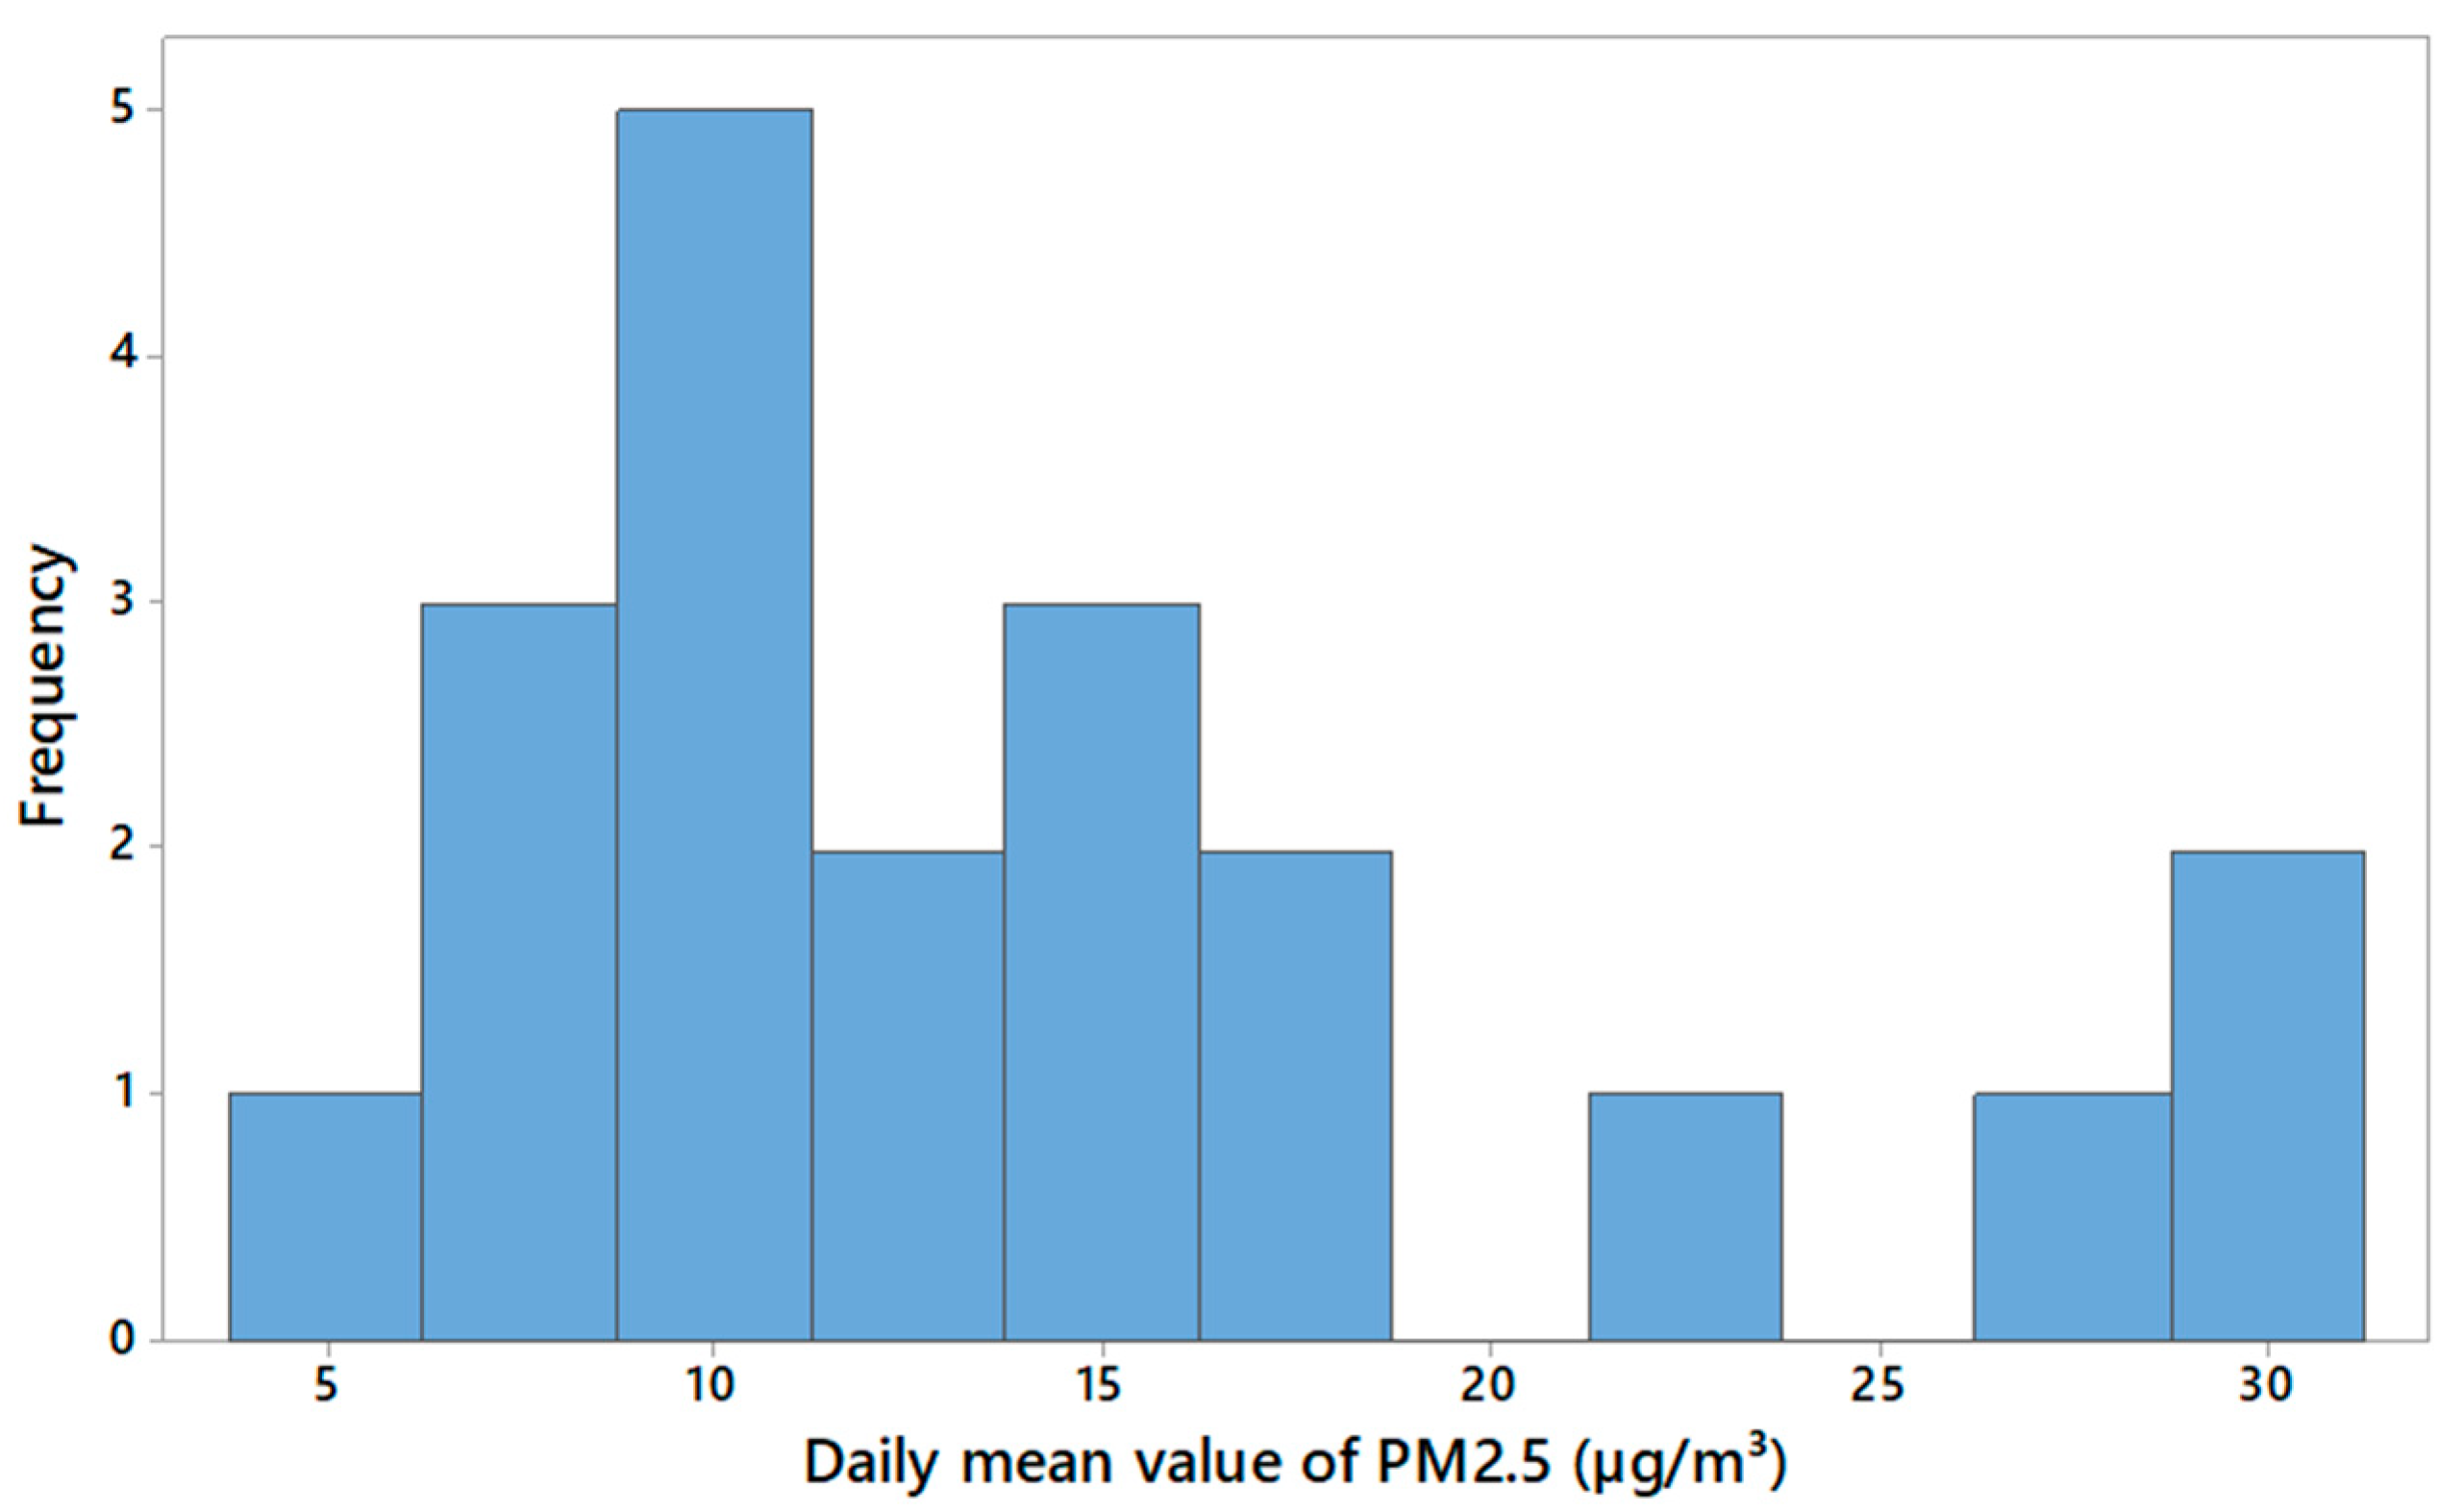
During the experimental period from 11 to 31 March, the mean value of PM2.5 concentrations was 14.806 ± 10.435 µg/m
3, ranging from 0.271 µg/m
3 to 59.800 µg/m
3. The daily mean value of PM2.5 was about 10 µg/m
3 throughout most of the experimental period. However, PM2.5 concentrations reached approximately 30 µg/m
3 on two out of the twenty days investigated (
Figure 6). Nevertheless, in 80% of the days the PM2.5 concentration was under 20 µg/m
3 and in 55% of the days it was under 15 µg/m
3. The overall daily trend of PM2.5 (
Figure 7) showed many peaks during the day, consequently to specific operations related to barn management. In fact, PM2.5 concentrations increased at 7:00, 11:00, 16:00, and 18:00, suggesting that it depended on specific activities, such as cleaning of the floor, feeding delivery, and fan activation. During these periods, median concentrations were frequently above 15 μg/m
3 and the upper quartiles (top of the boxes) often exceeded 20 μg/m
3. From approximately hour 0 to hour 9, concentrations tended to be lower, generally staying below 20 μg/m
3. The medians during these hours were mostly below 10 μg/m
3. The height of the boxes and whiskers indicates the variability in PM2.5 concentrations for each hour. There is considerable variability, especially during the daytime and evening hours, suggesting that activity within the barn or external factors fluctuated significantly. Numerous outliers (represented by asterisks) scattered throughout the 24 h period indicate instances where PM2.5 concentrations were exceptionally high, sometimes exceeding 50 μg/m
3. It can be highlighted that no outliers can be found in the hours between 7:00 to 13:00. Finally, the periods of lower concentration (night/early morning) might correspond to times of reduced activity or potentially more effective natural or mechanical ventilation. The higher concentrations during active hours could indicate that ventilation systems were either insufficient to handle peak emissions or were not operated optimally during these times.
Based on the correlation analysis, microclimatic conditions influenced levels of PM2.5. In fact, the correlation coefficient between PM2.5 and indoor air temperature was 0.604 (p < 0.001), whereas the correlation between PM2.5 and air speed was 0.34 (p < 0.001).
3.2. Green Wall System
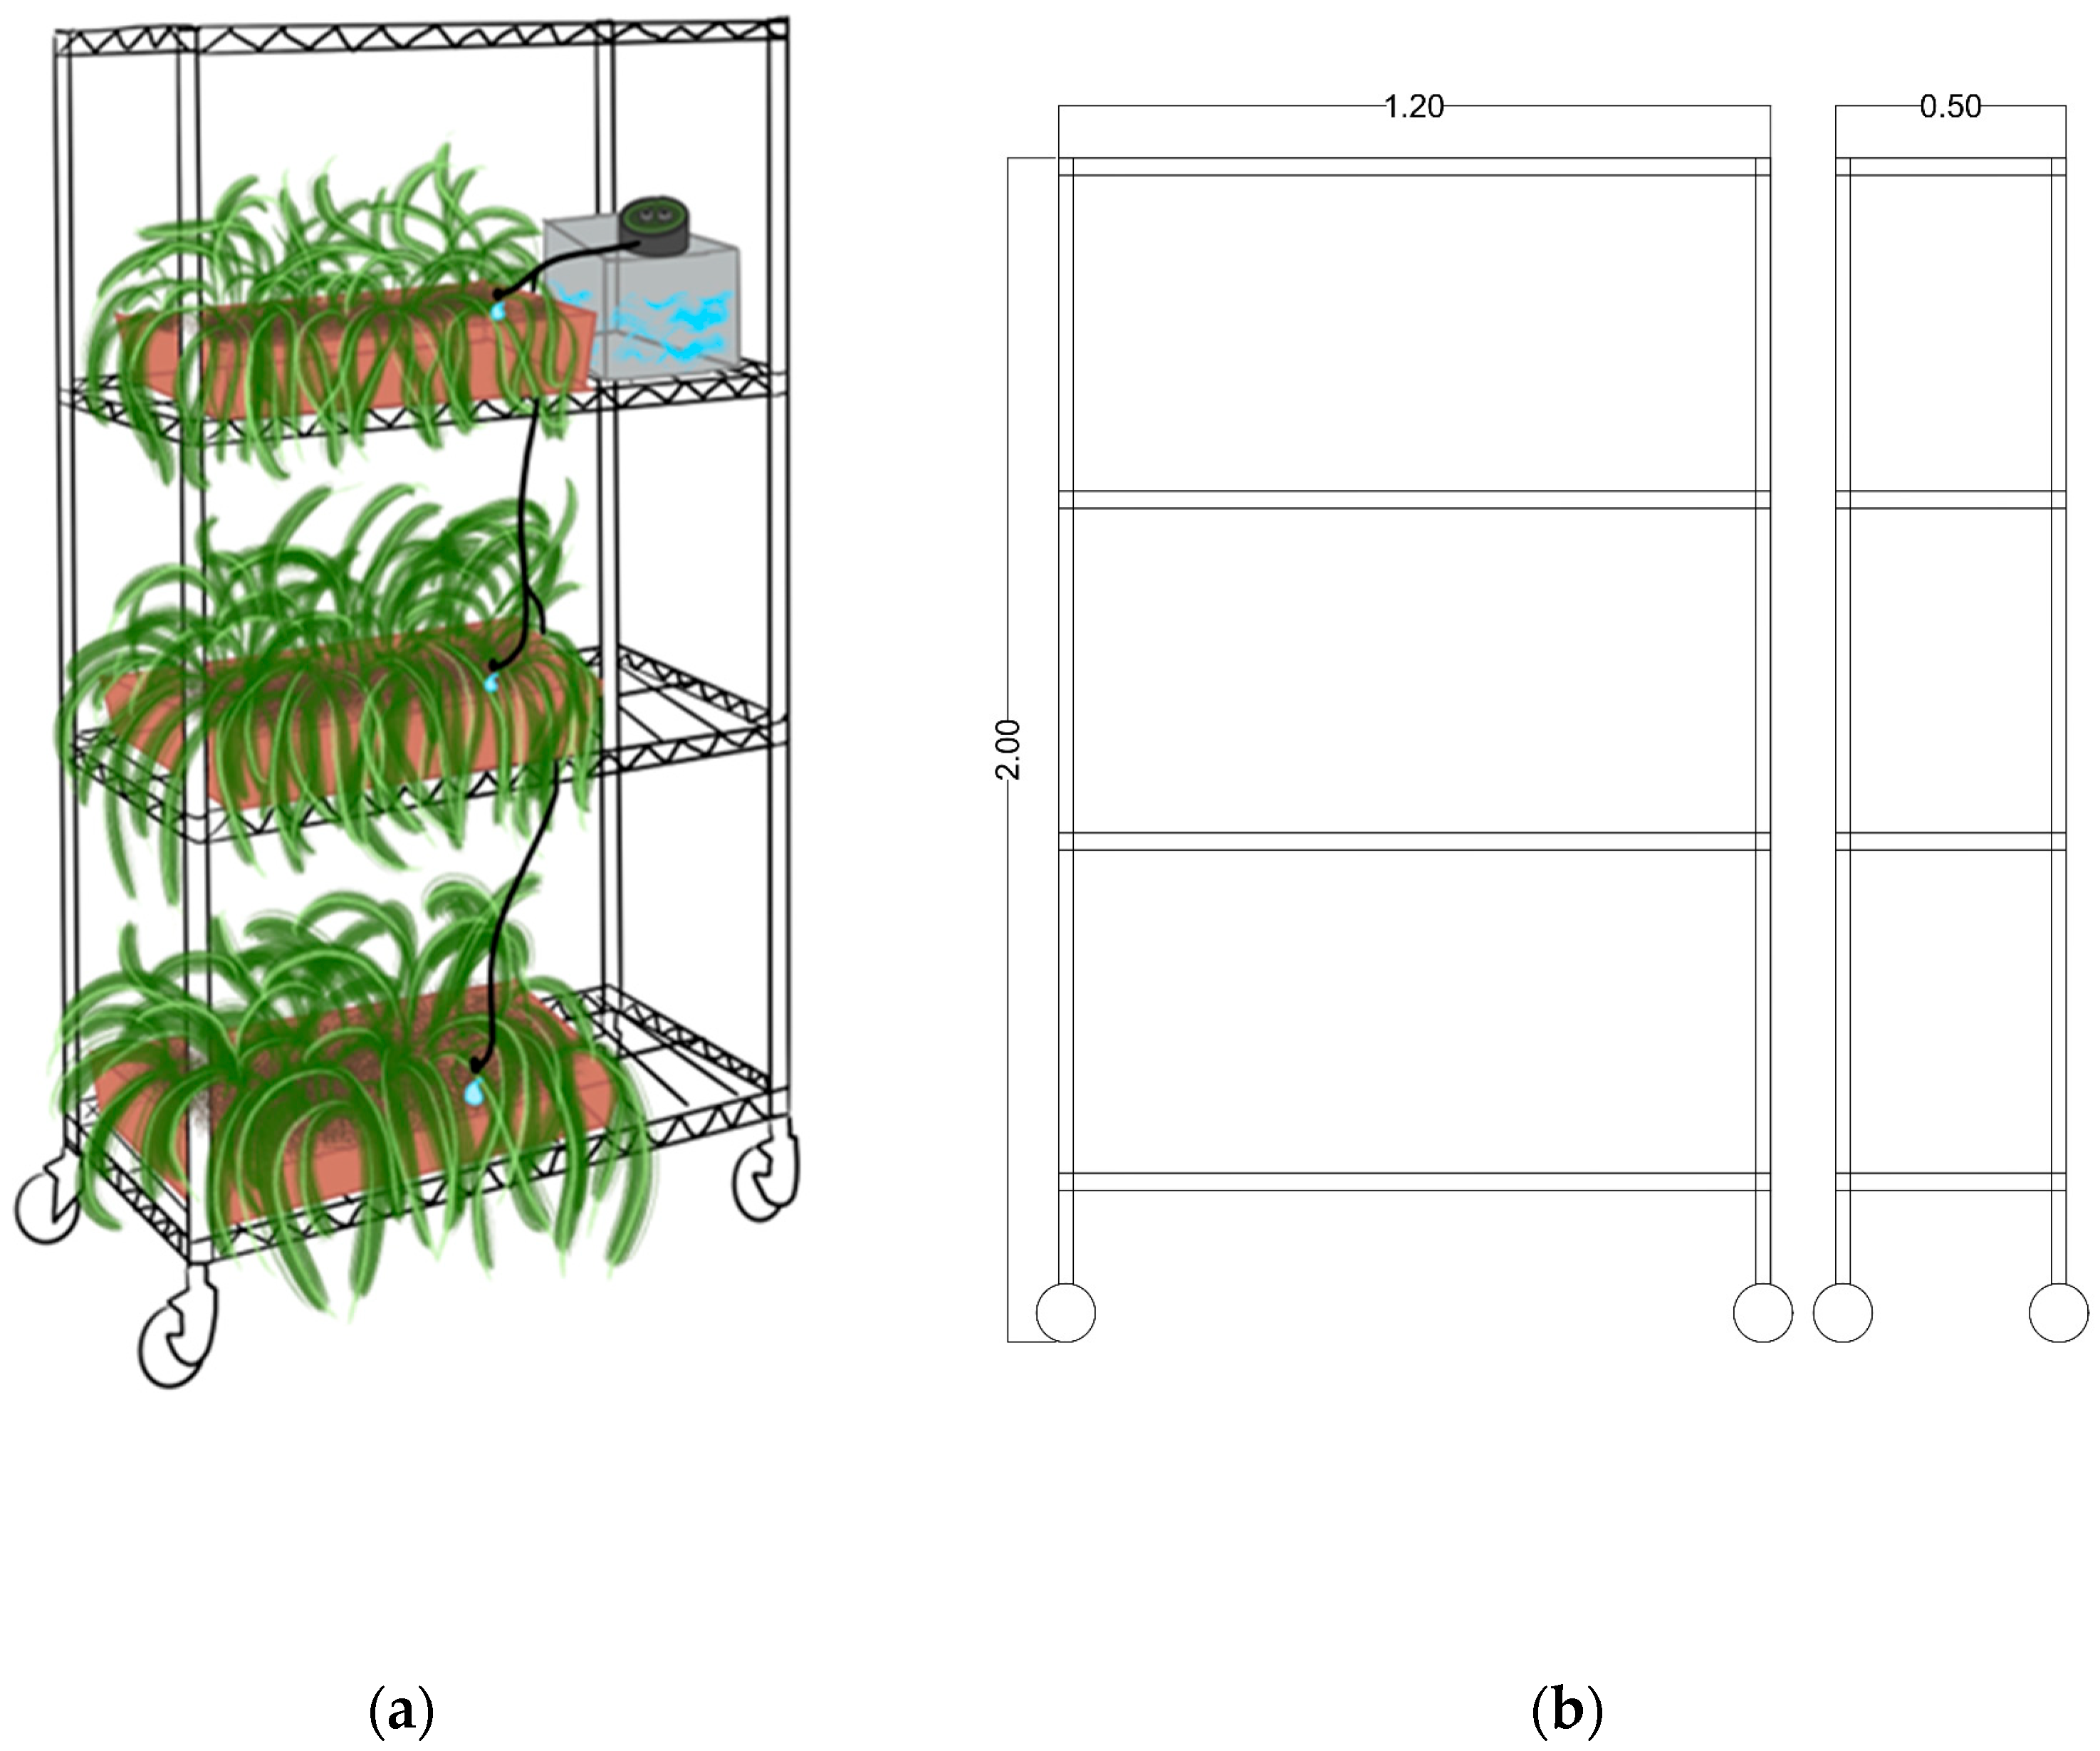
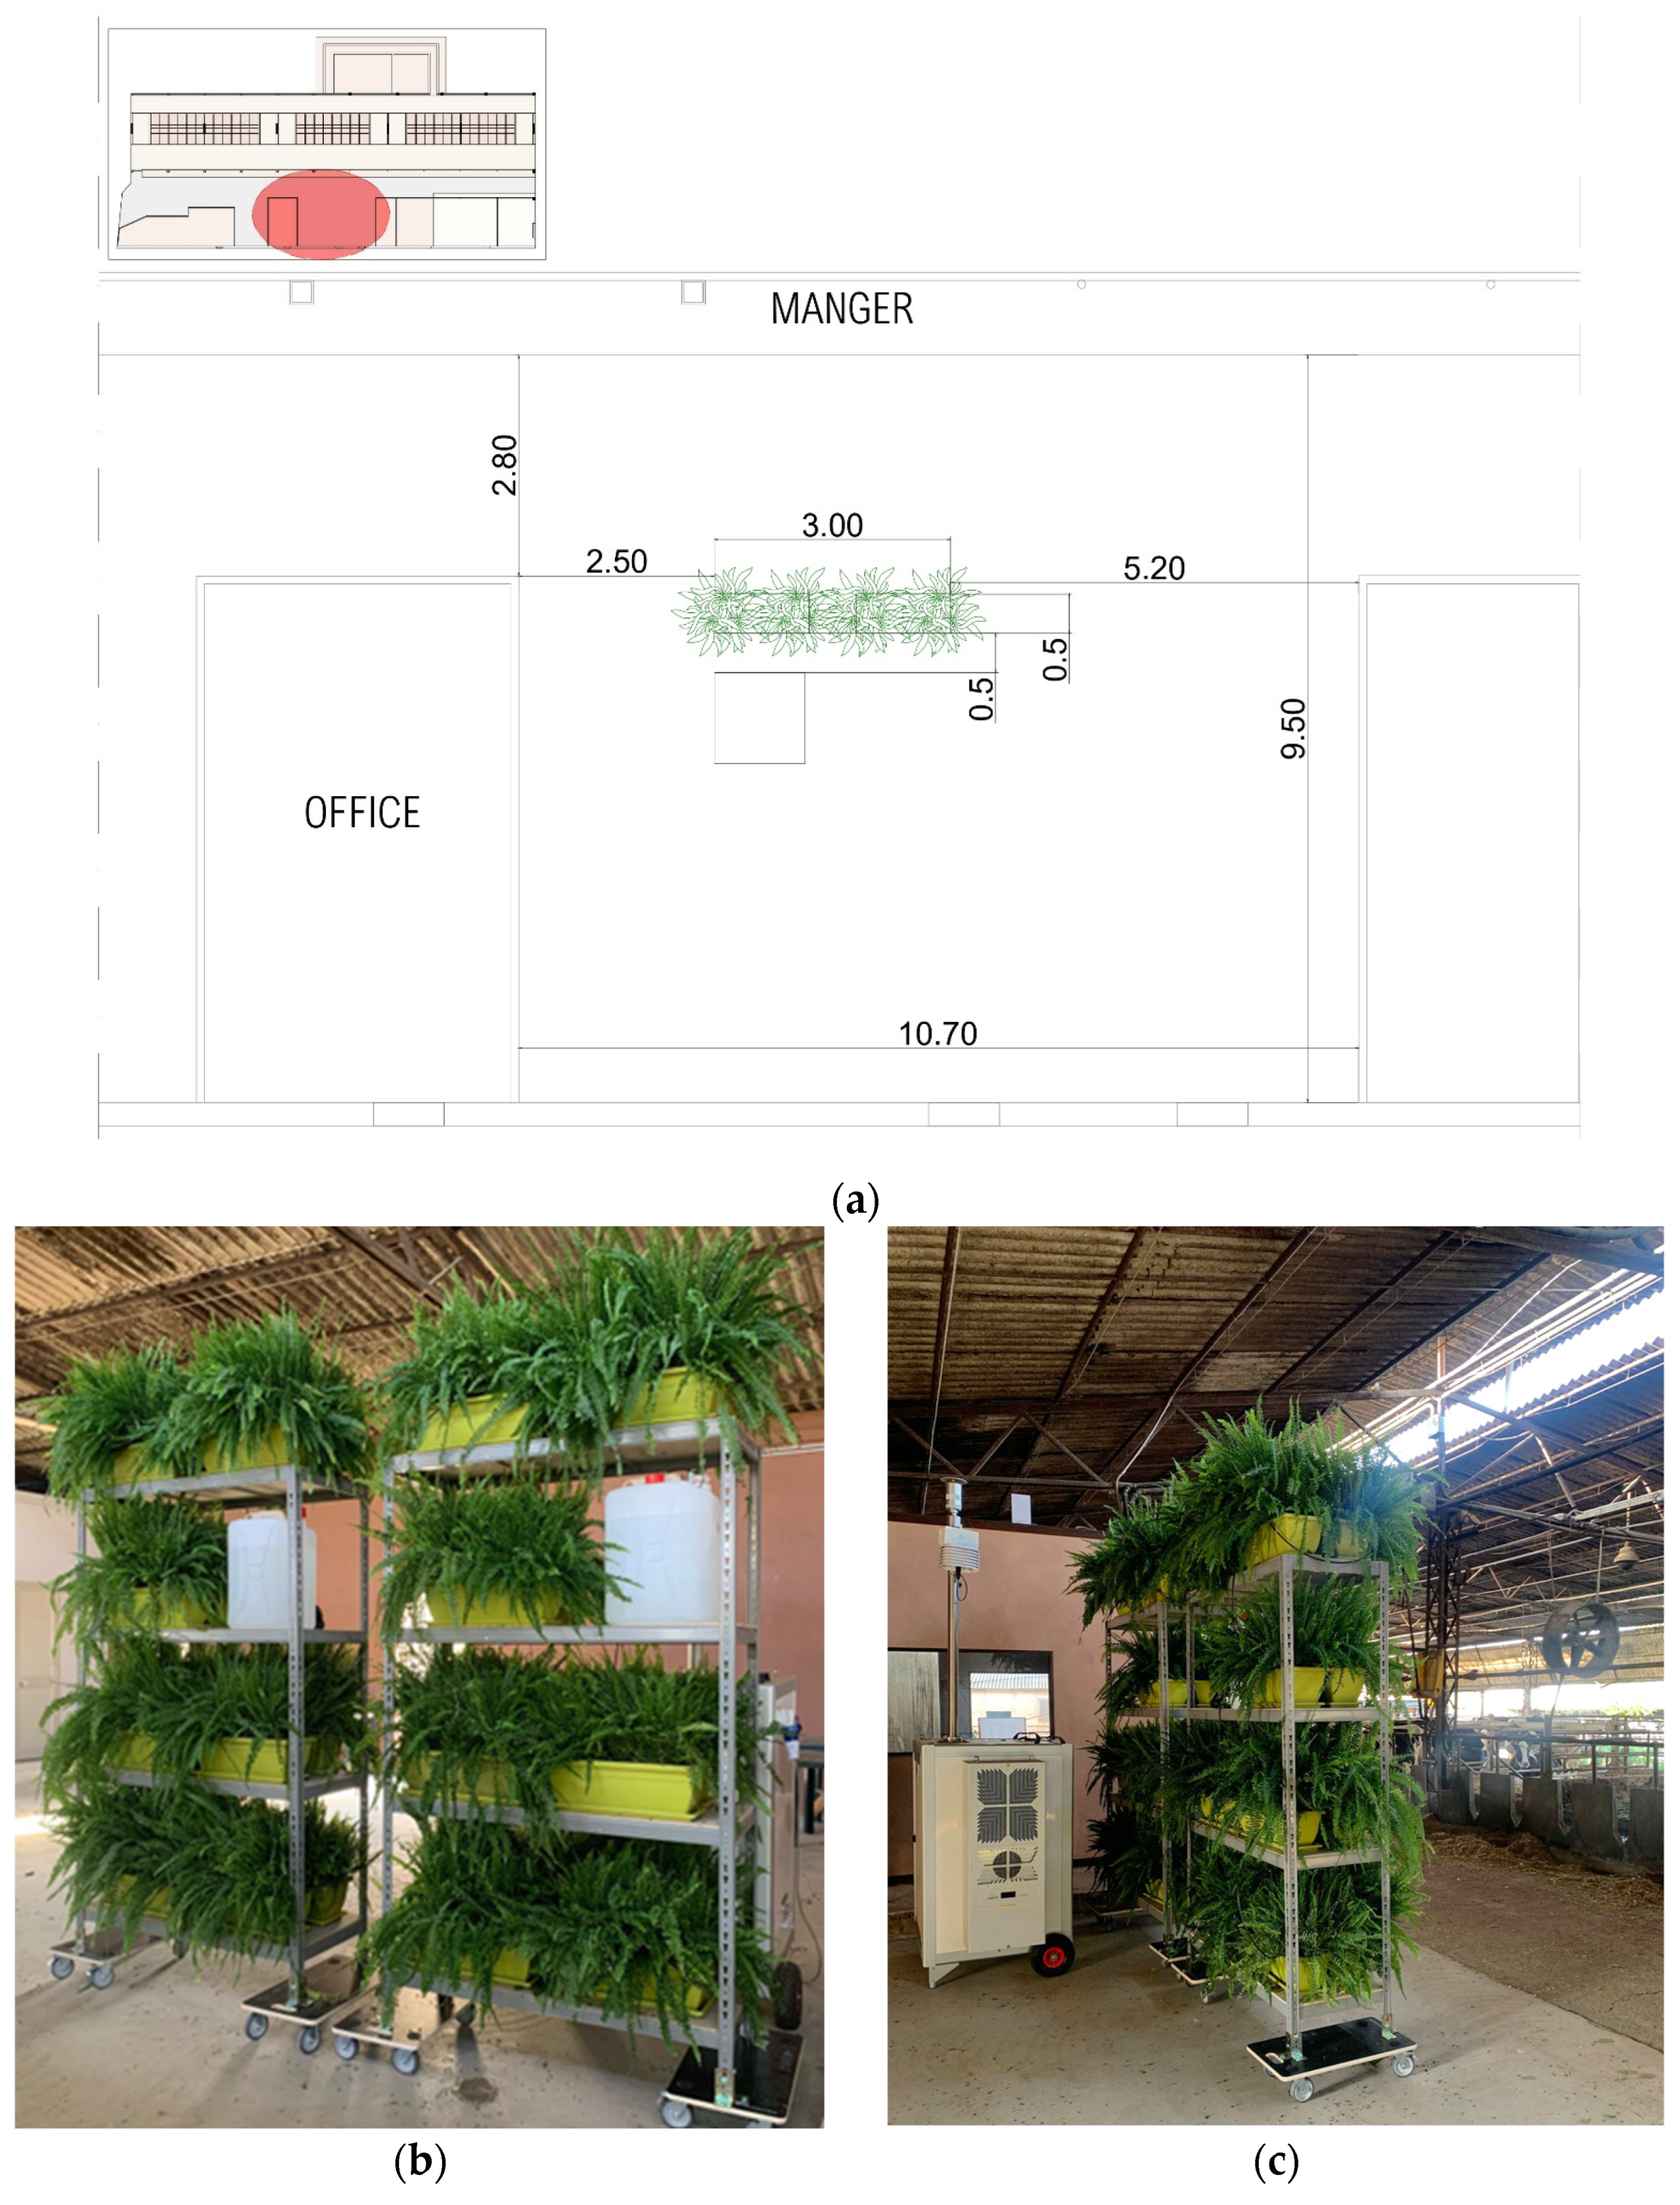
The experimental green wall system consists of two independent, mobile, modular modules fitted with castors to facilitate movement and positioning within the barn, preferably along the open sides (
Figure 8). This configuration makes it possible to adapt the installation of the walls according to the internal environmental conditions, thus allowing their effectiveness as biofilters to be evaluated in different operational contexts.
The supporting structure is made of steel, a material widely used in the livestock sector for its mechanical resistance, durability, and ease of cleaning, all of which are essential in environments where animals are present.
Each module has a height of 2.00 m, a width of 1.20 m, and a depth of 0.50 m and is made up of five shelves stacked one on top of the other, each with a load capacity of 300 kg, for a total of 1500 kg per wall. This configuration is designed to maximise the growing area both vertically, thanks to the overall height of the structure, and horizontally, thanks to the arrangement of the shelves.
Each shelf contains two 0.50 × 0.20 m containers filled with potting soil substrate. The plant species selected was Nephrolepis exaltata, a fern known for its excellent phytodepurative properties and large leaf area, estimated at approximately 2 m2 per plant. This plant was chosen for its effectiveness in purifying air and for its compatibility with the animals’ environment, making it suitable for indoor conditions that promote animal welfare. In addition, this plant is not toxic, in case of eventual ingestion by the animals.
The plants are watered by an automatic drip system connected to a water tank with a maximum capacity of 30 L. This system allows an even distribution of water and reduces waste, contributing to the sustainability and overall efficiency of the design.
3.3. Performance Assessment of the Green Wall for PM2.5 Reduction
Based on the one-way ANOVA, there was a significant difference (
p = 0.005) between PM2.5 concentrations measured when the mitigation strategy was not applied and those recorded when the green wall was installed in the barn. Specifically, PM2.5 concentrations before and after the application of the green wall were equal to 16.130 ± 9.581 µg/m
3 and 13.481 ± 11.086 µg/m
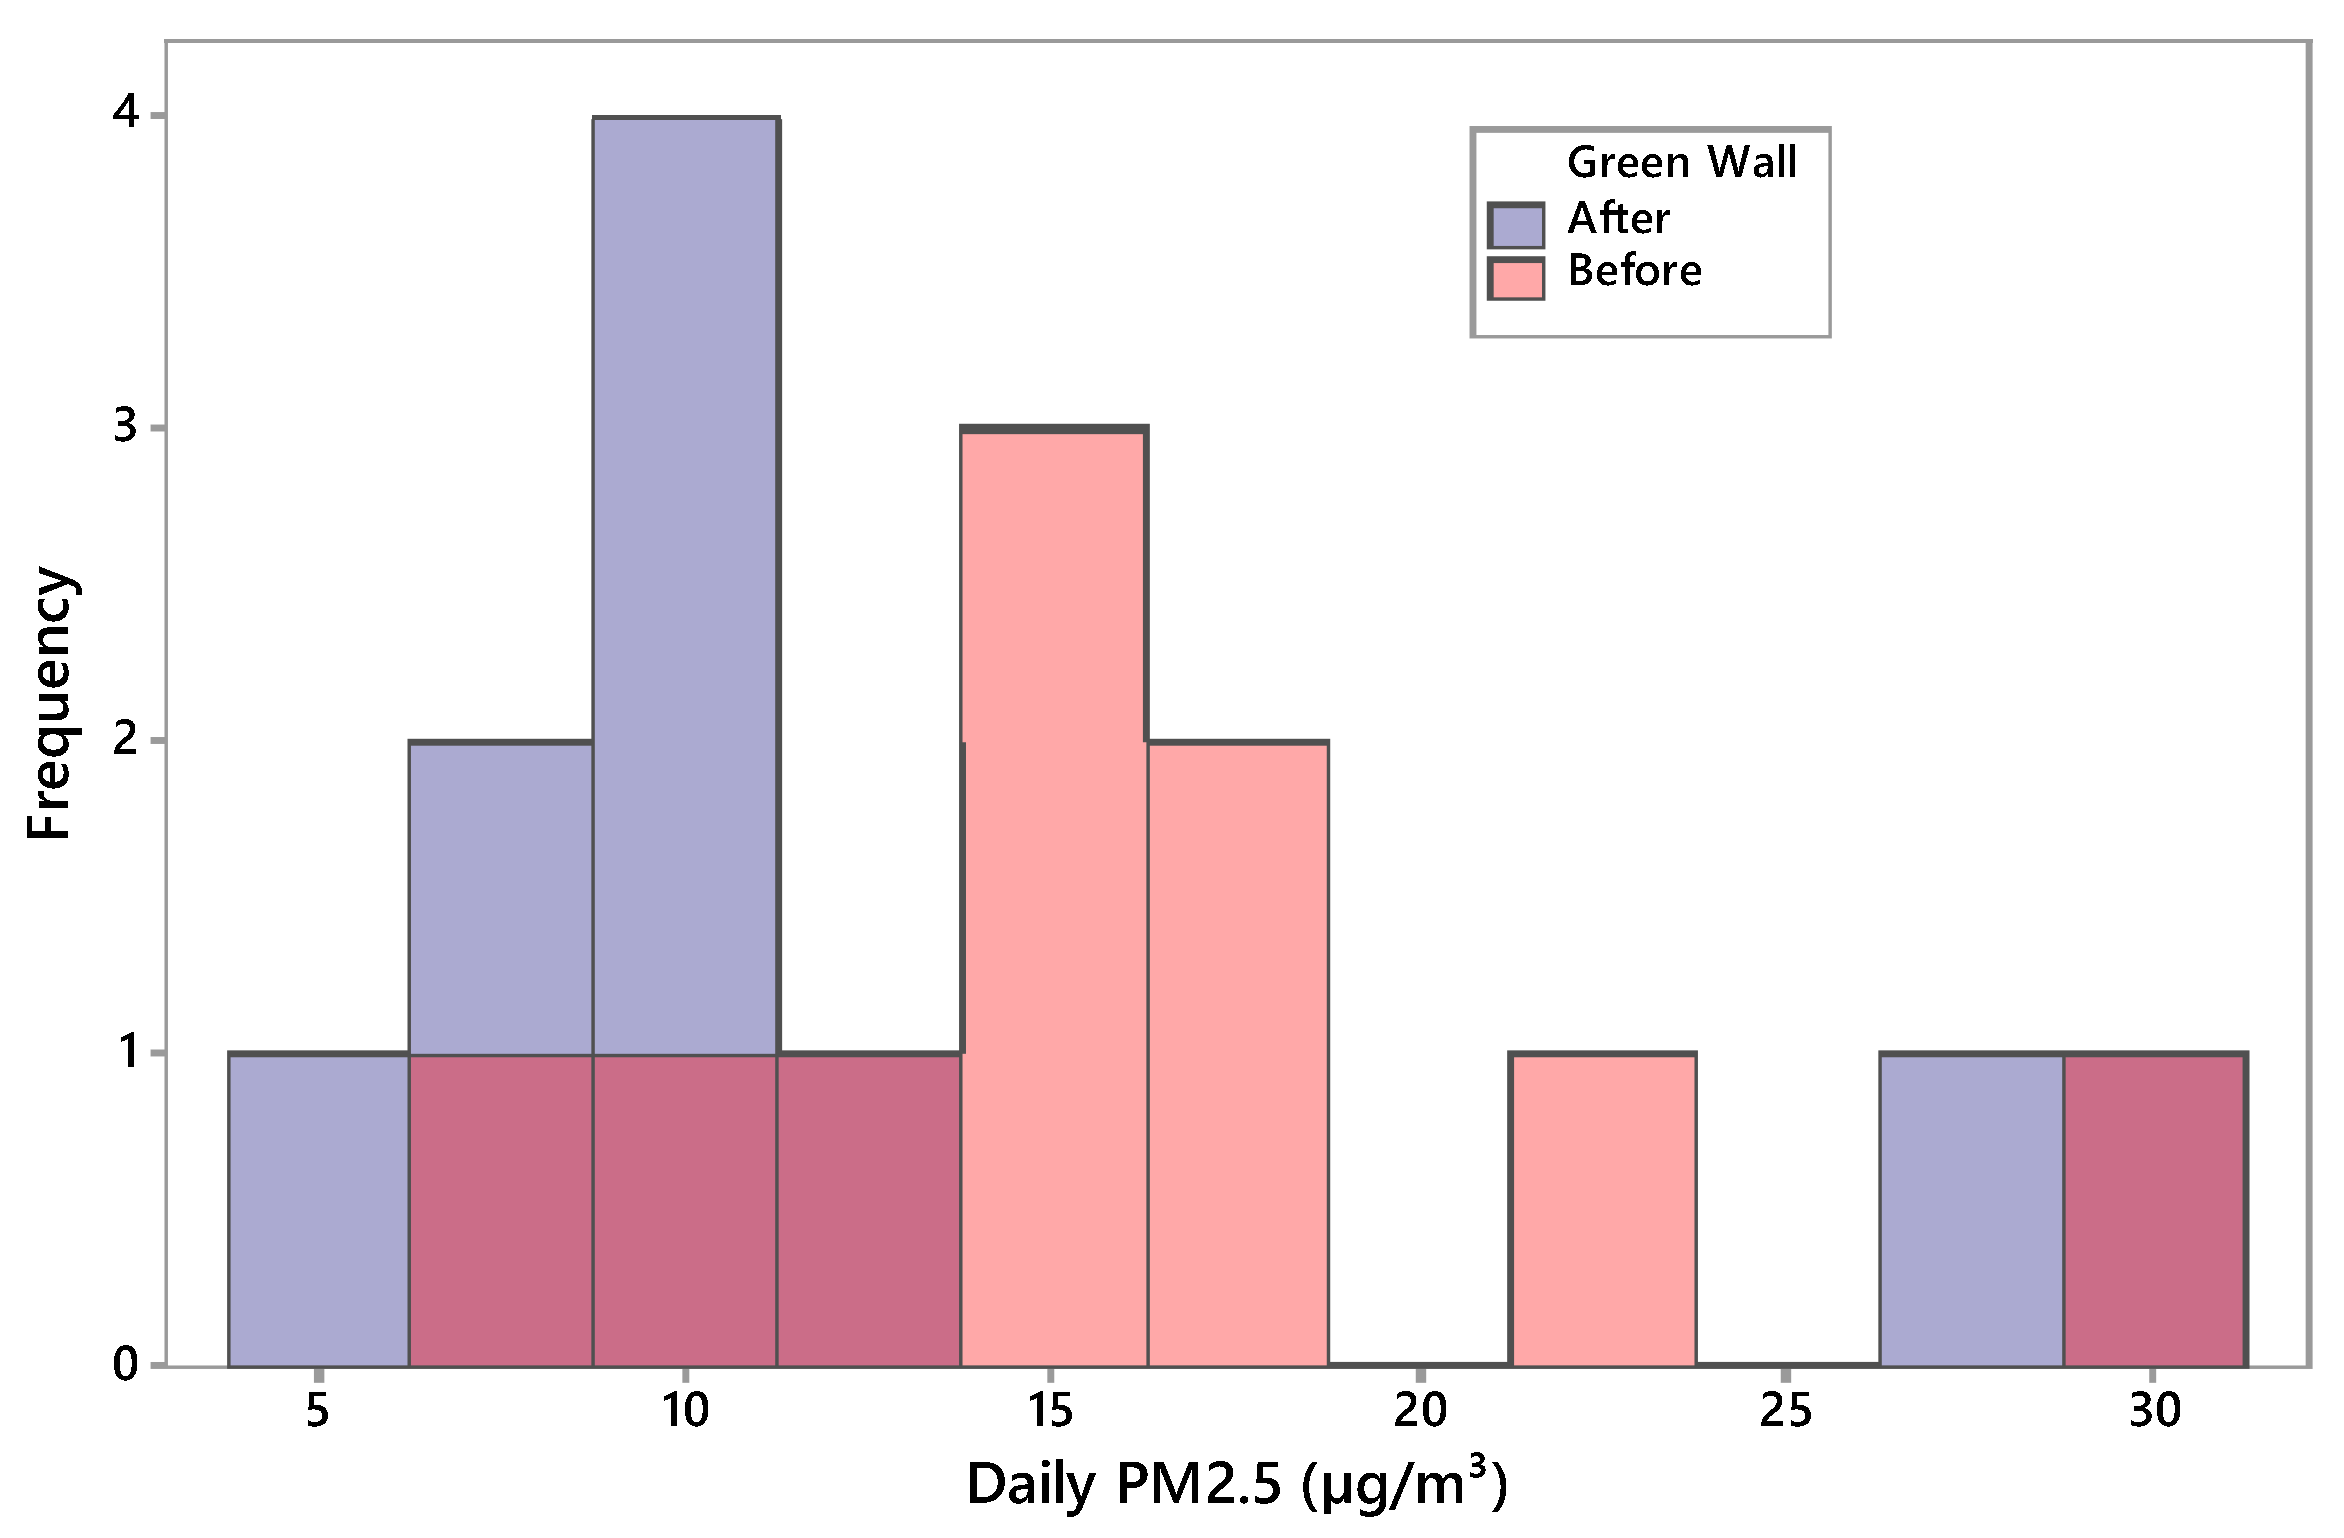
3, respectively; thus, the presence of the green wall reduced PM2.5 by 16%. Moreover, the histogram plot showed that the frequency of higher daily PM2.5 concentrations was reduced after the application of the green wall (
Figure 9). Daily PM2.5 values before the application of the green wall (“Before” data) showed a higher spread, with values ranging from approximately 6 μg/m
3 up to around 30 μg/m
3. The highest frequency (three instances) of the “Before” data points (red bars) occurred in the bin at around 14–16 μg/m
3. Conversely, while there was an outlier at the very high end (28–30 μg/m
3), the majority of the daily PM2.5 values after the application of the green wall (“After” data) were concentrated below 12 μg/m
3, suggesting a more consistent reduction in PM2.5. The highest frequency (four instances) of the “After” data was observed in the bin at around 10–12 μg/m
3, while lower frequencies were found in the 6–8 μg/m
3 range (two instances) and the 8–10 μg/m
3 range (one instance).
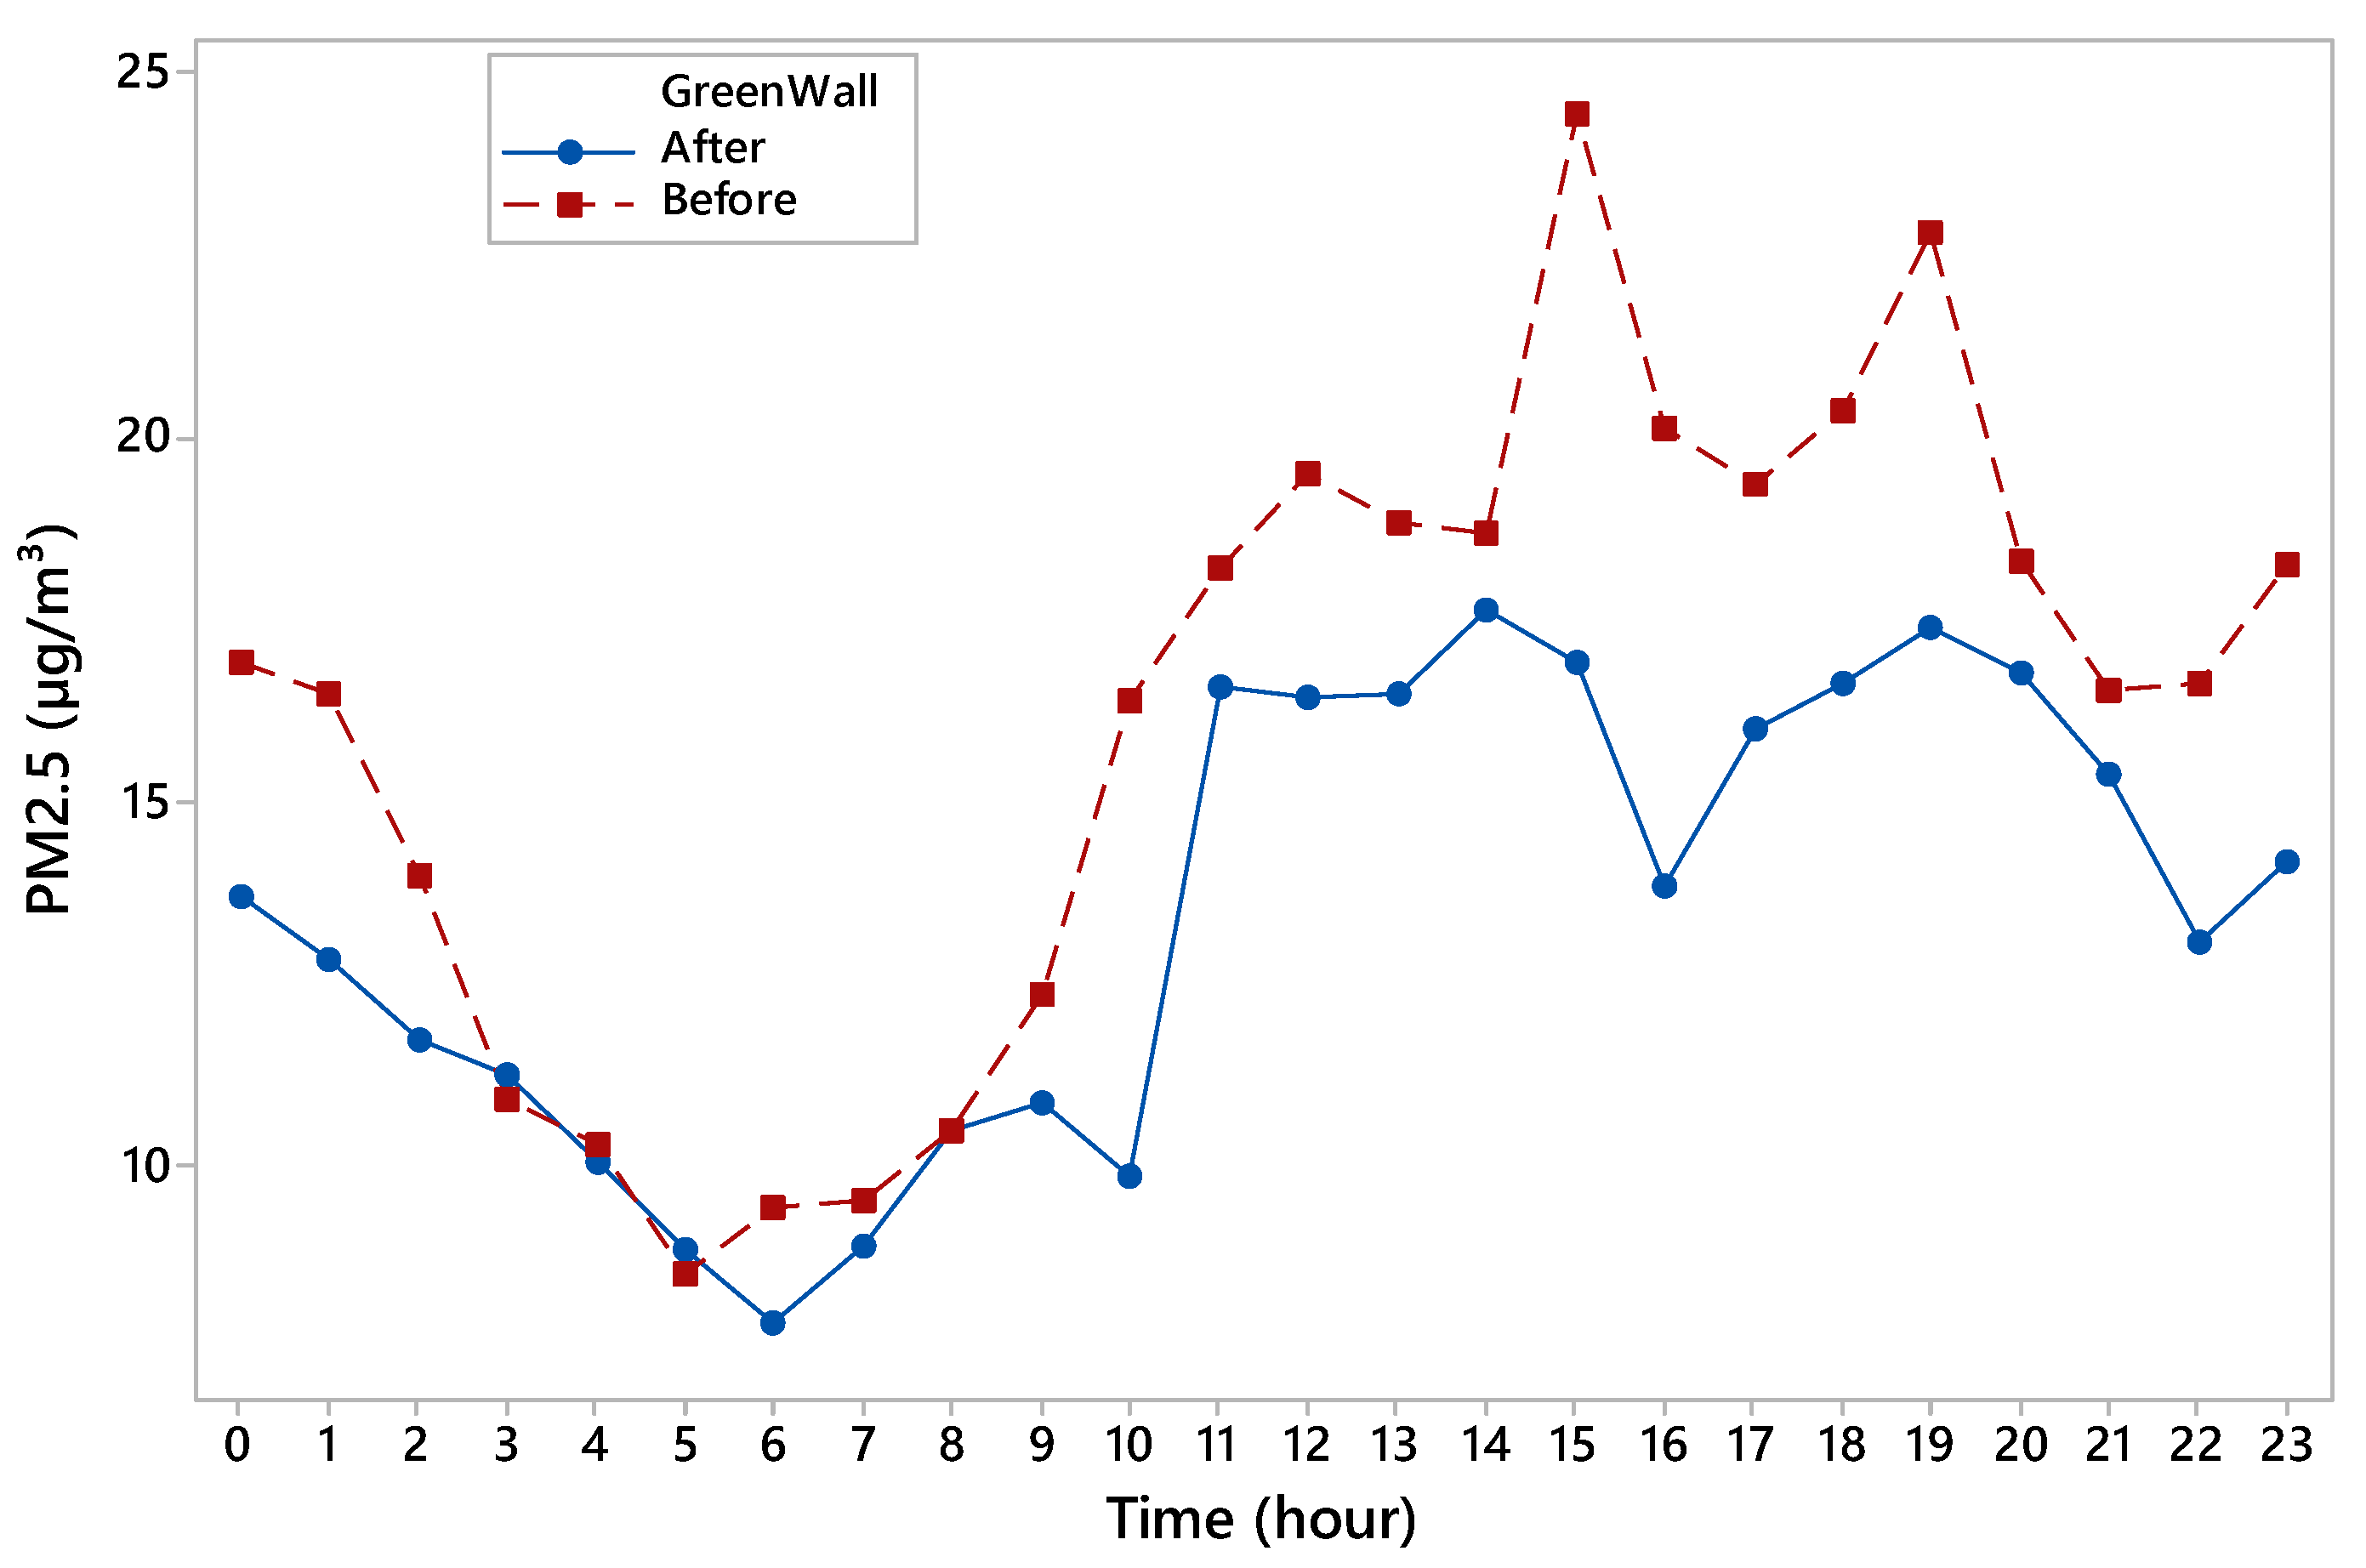
In the hourly-based analysis, shown in
Figure 10, the main mitigation effect of the green wall occurred during the central part of the day from 11:00 to 19:00. There was a noticeable reduction in PM2.5 concentrations in the early morning hours, with levels reaching a low point of around 9 μg/m
3 at hours 5 or 6. Before the green wall installation, PM2.5 levels used to rise sharply from around 9:00, reaching their first major peak at around hour 15, exceeding 24 μg/m
3, and another peak around 19:00, reaching over 20 μg/m
3. The PM2.5 levels after the mitigation strategy implementation, represented in
Figure 9 by the blue line, consistently remained below the red line for most of the 24 h period, indicating a general reduction in PM2.5 concentrations after the green wall was applied. Moreover, after the green wall’s installation, there were still two peaks over the day but, the highest “After” peak appeared around hour 12–13, reaching about 17 μg/m
3, and the second one around 19:00, both remaining below 20 μg/m
3. These differences in the daily path confirm once again the effectiveness of the green wall in lowering PM2.5 concentrations and mitigating their negative effects. However, these results are influenced by climatic conditions. In fact, the time series plot (
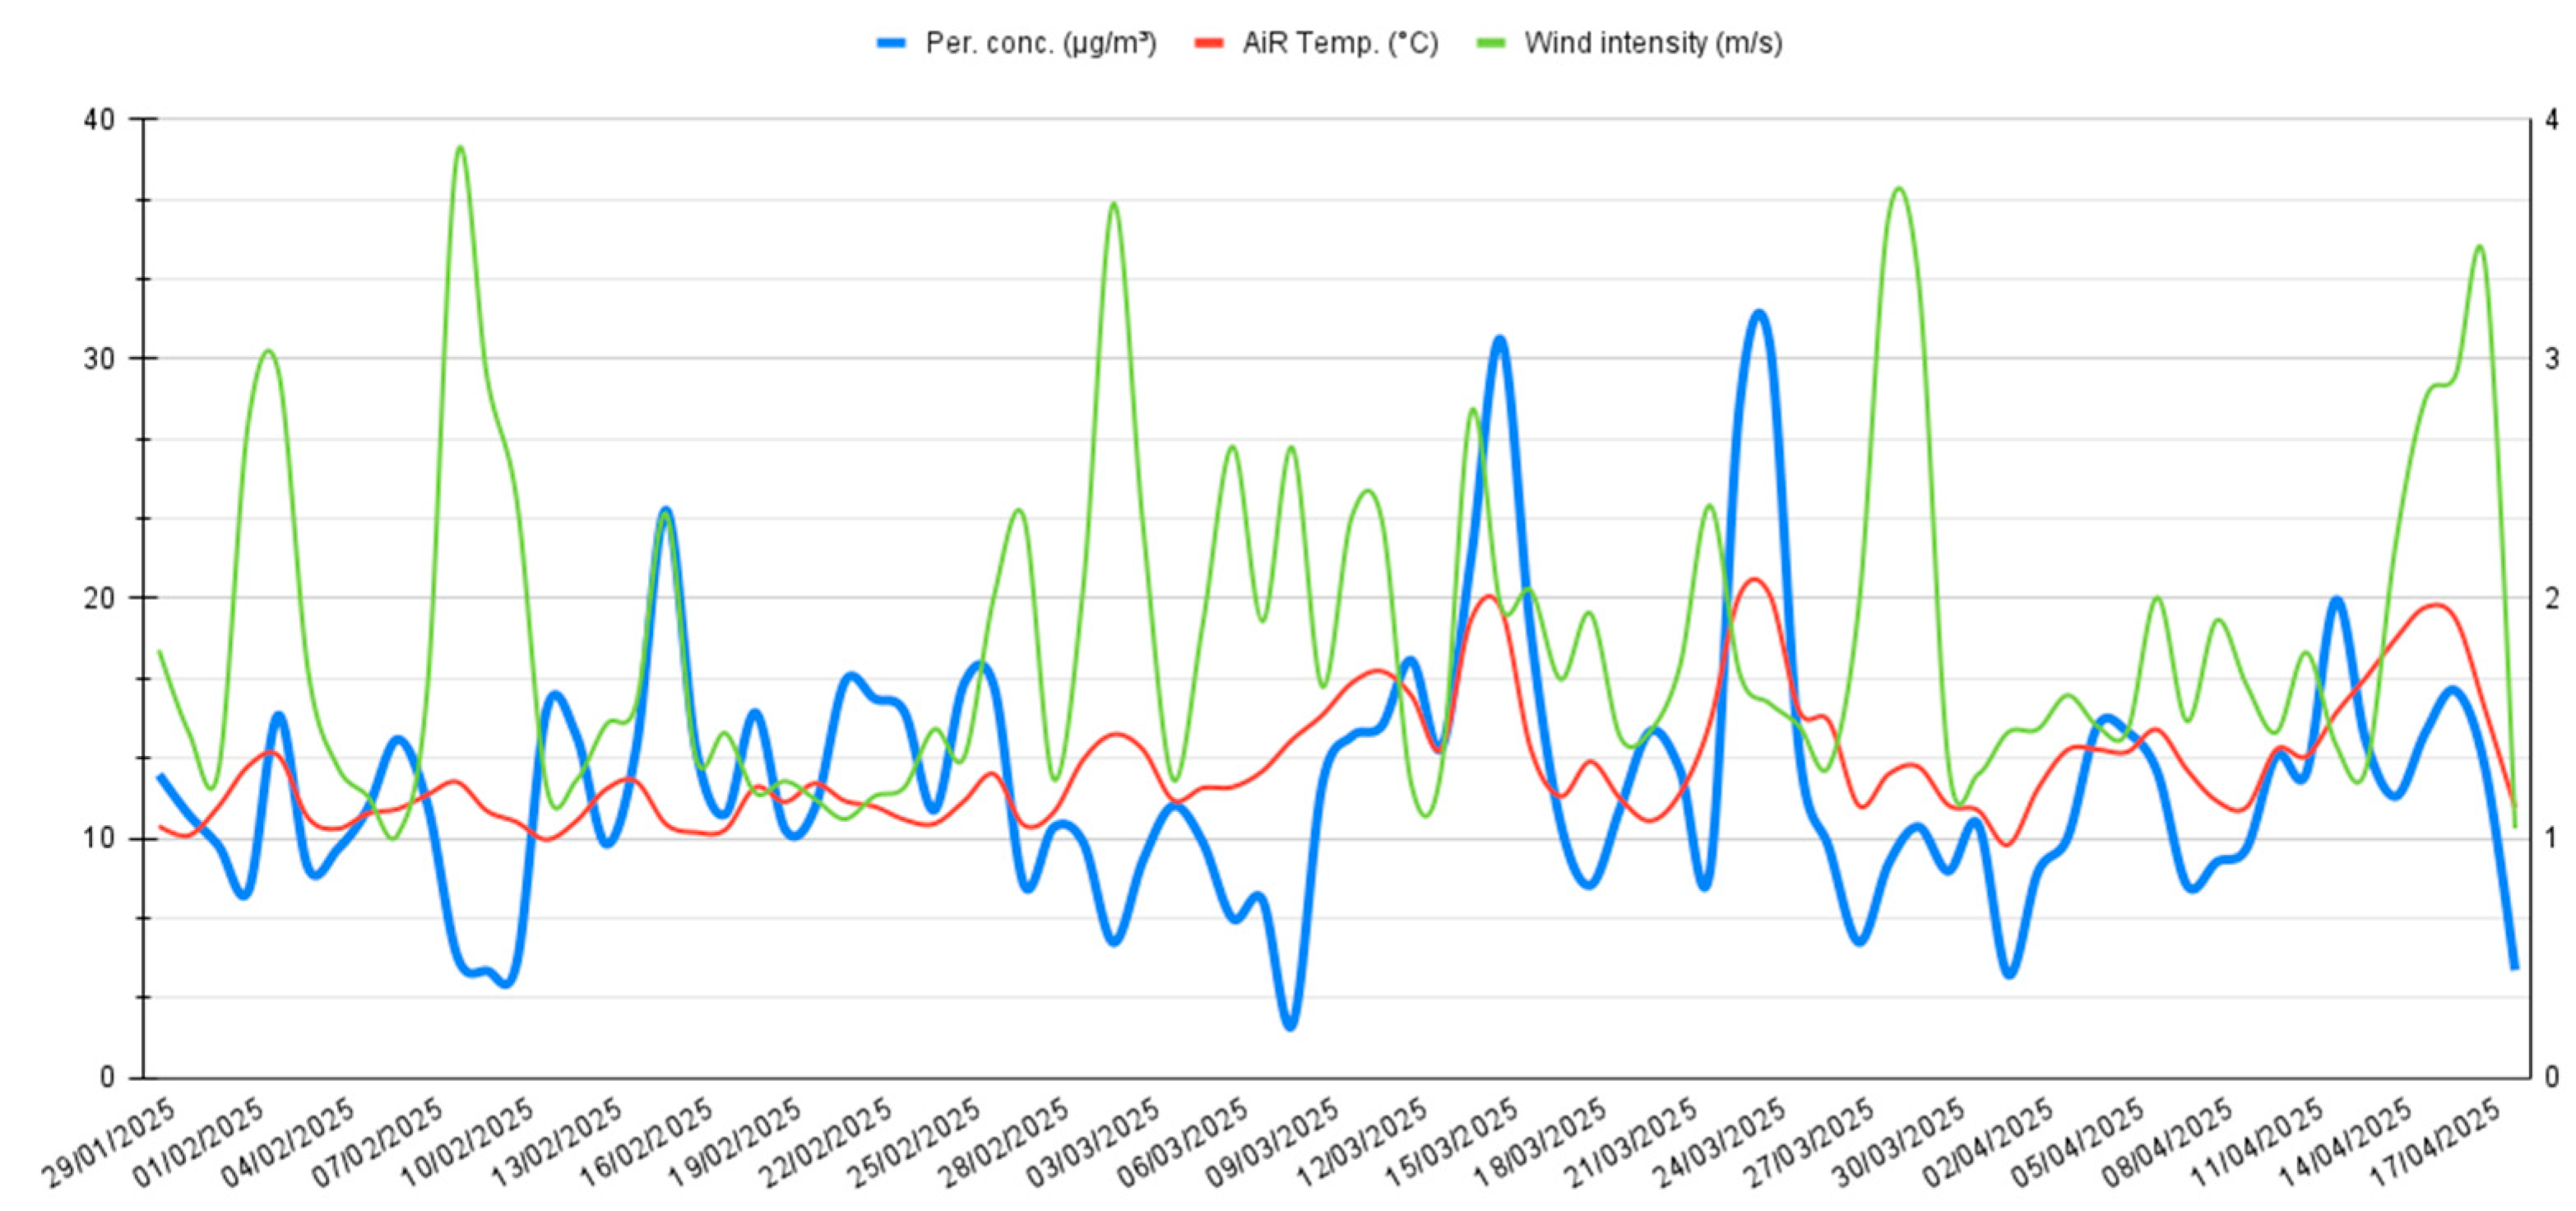
Figure 11) highlights that the peaks of PM2.5 are affected by indoor air temperature and velocity.
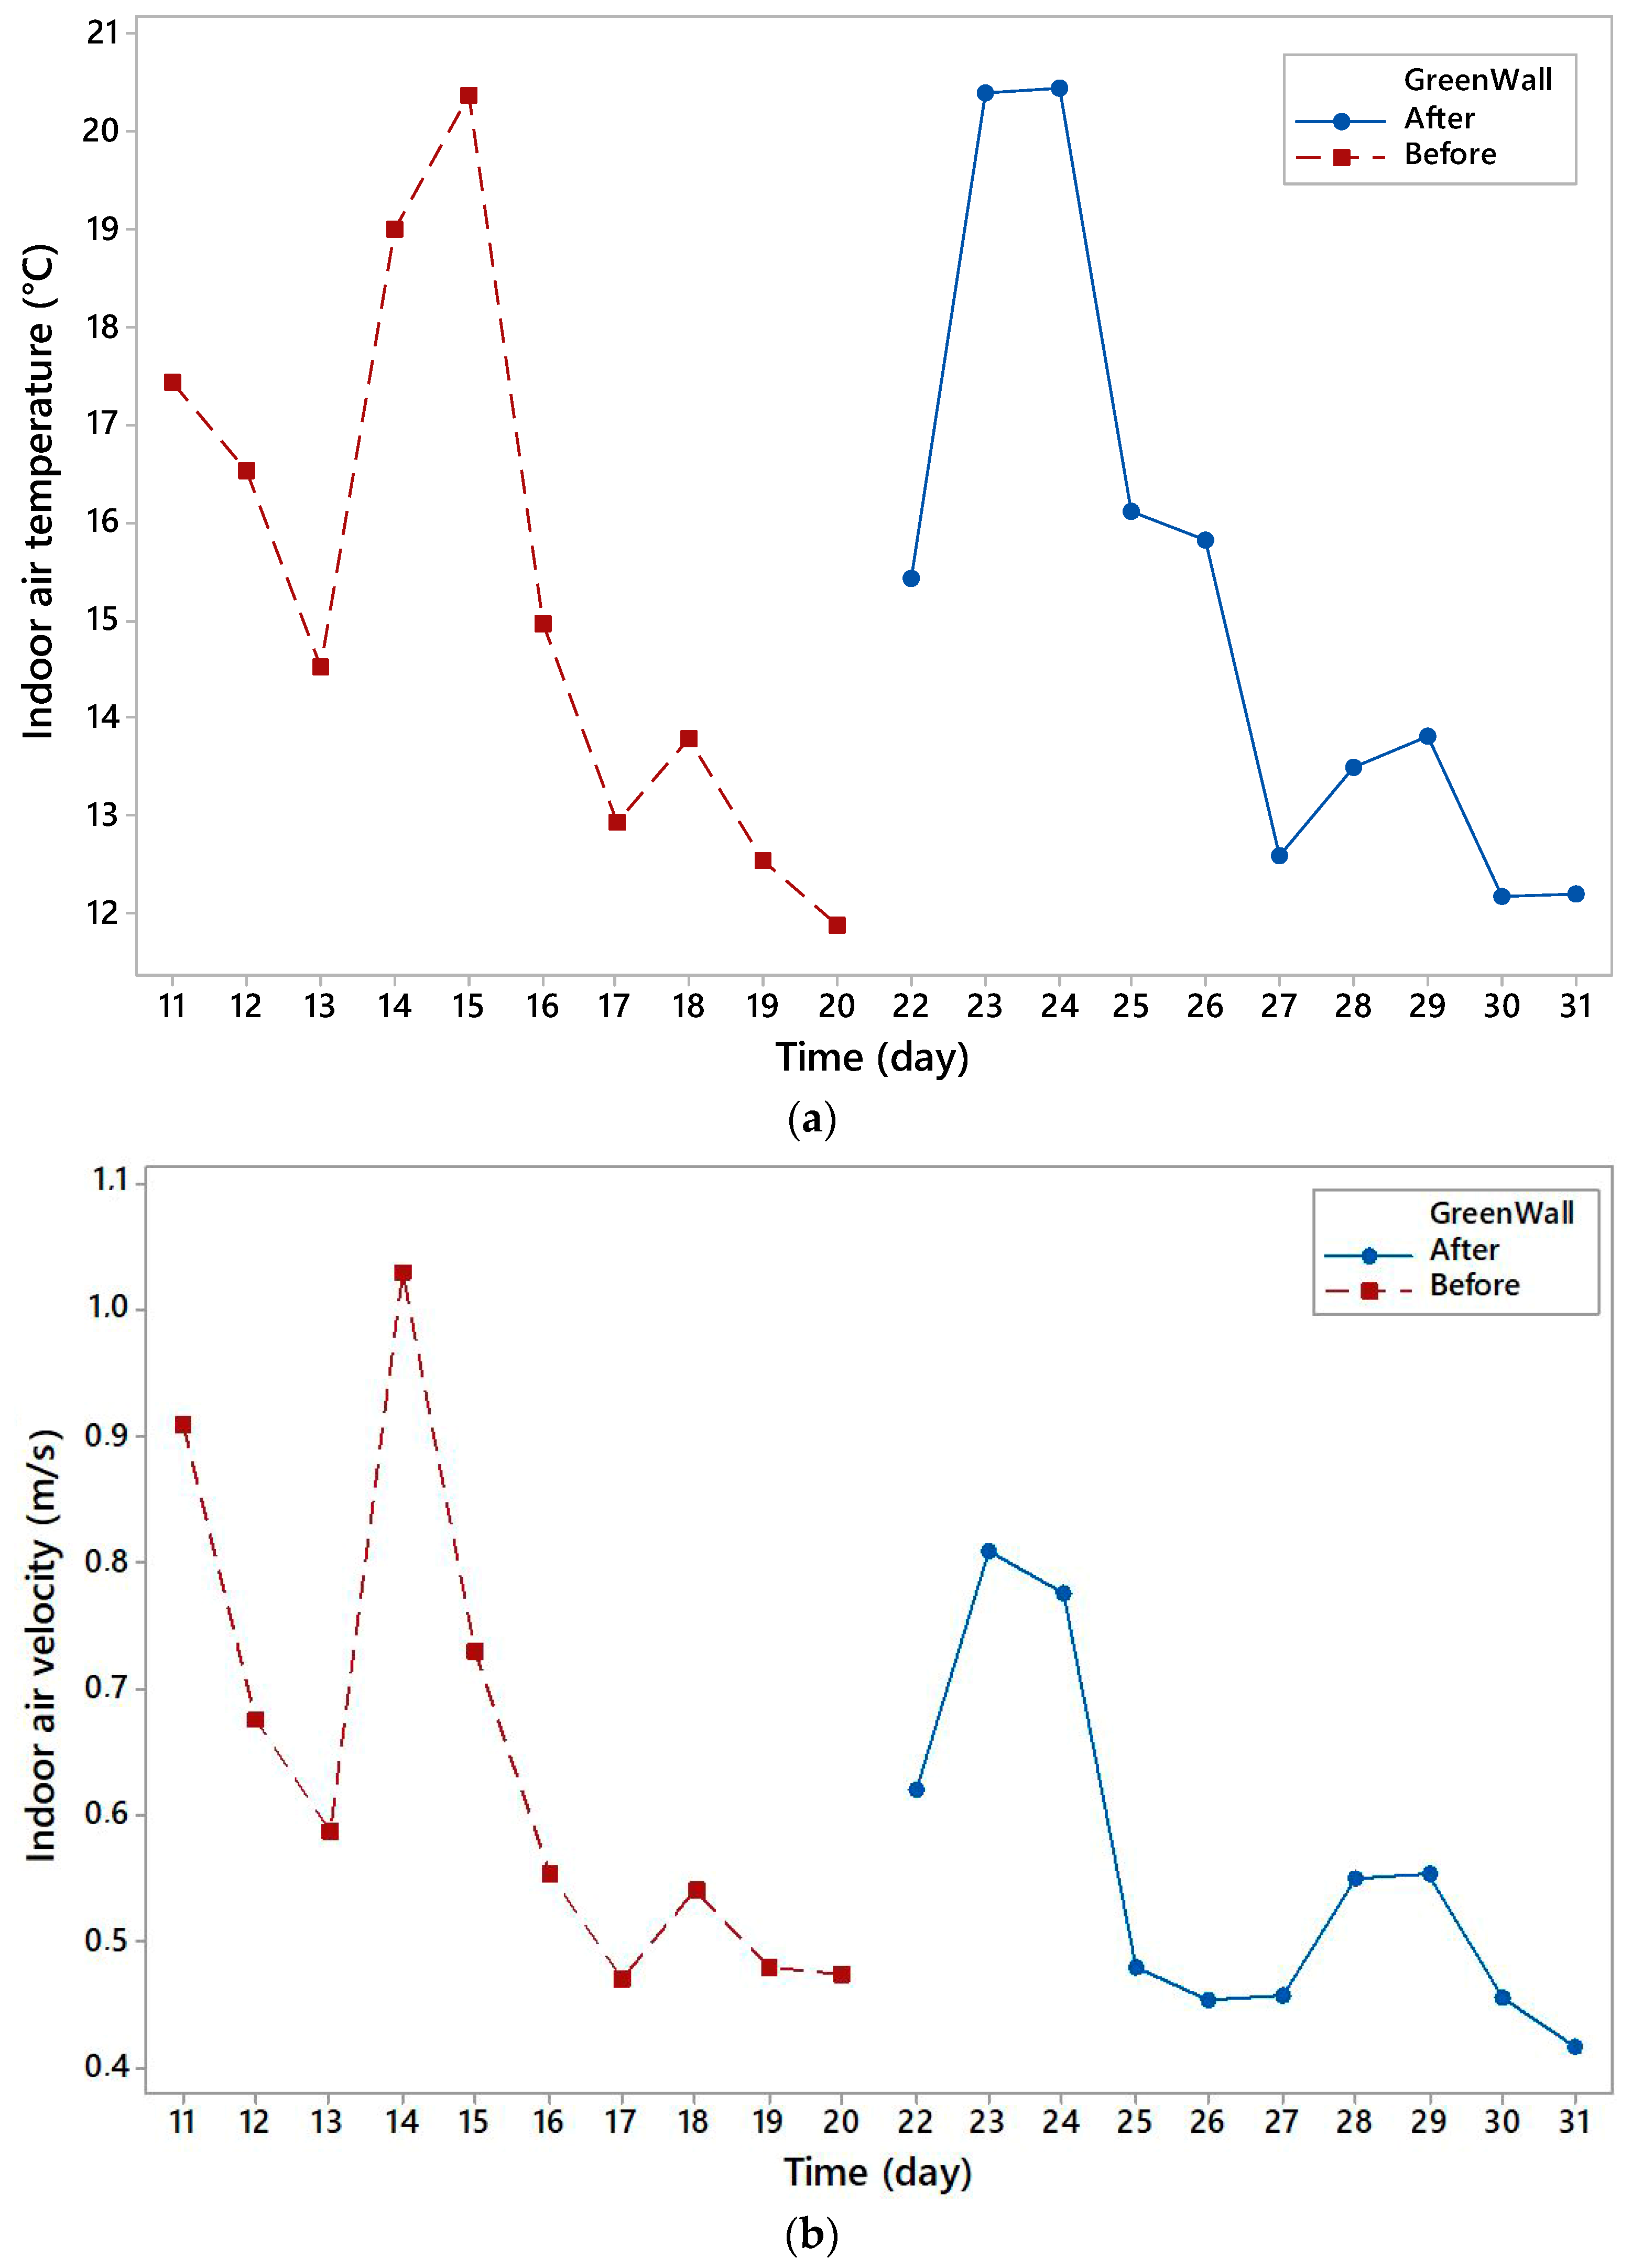
Therefore, the statistical evaluation was also carried out on a dataset where the influence of indoor air temperature and velocity on PM2.5 concentrations was reduced. To define the new dataset, the mean value of indoor air temperature (
Figure 12a) and indoor air velocity (
Figure 12b) have been analysed and days with similar climatic conditions have been selected. Based on
Figure 11, the data acquired from days 11, 14, 15, 23, and 24 have been removed from the dataset since they have high mean values of air temperature and speed.
When the selection of the dataset included static microclimatic conditions, the one-way ANOVA showed a significant difference (
p < 0.001) between PM2.5 acquired before the installation of the green wall and that acquired after. In detail, these results also confirmed a reduction effect of 44% in PM2.5 concentrations in the barn due to the presence of the green wall. Compared to the reduction of 16% obtained using the entire dataset, the 44% reduction refers to a filtered dataset of days with constant climate conditions. In this case, the daily mean value of PM2.5 concentrations before and after the installation of the green wall were 13.45 ± 7. 52 μgm
−3 and 9.51 ± 5.31 μgm
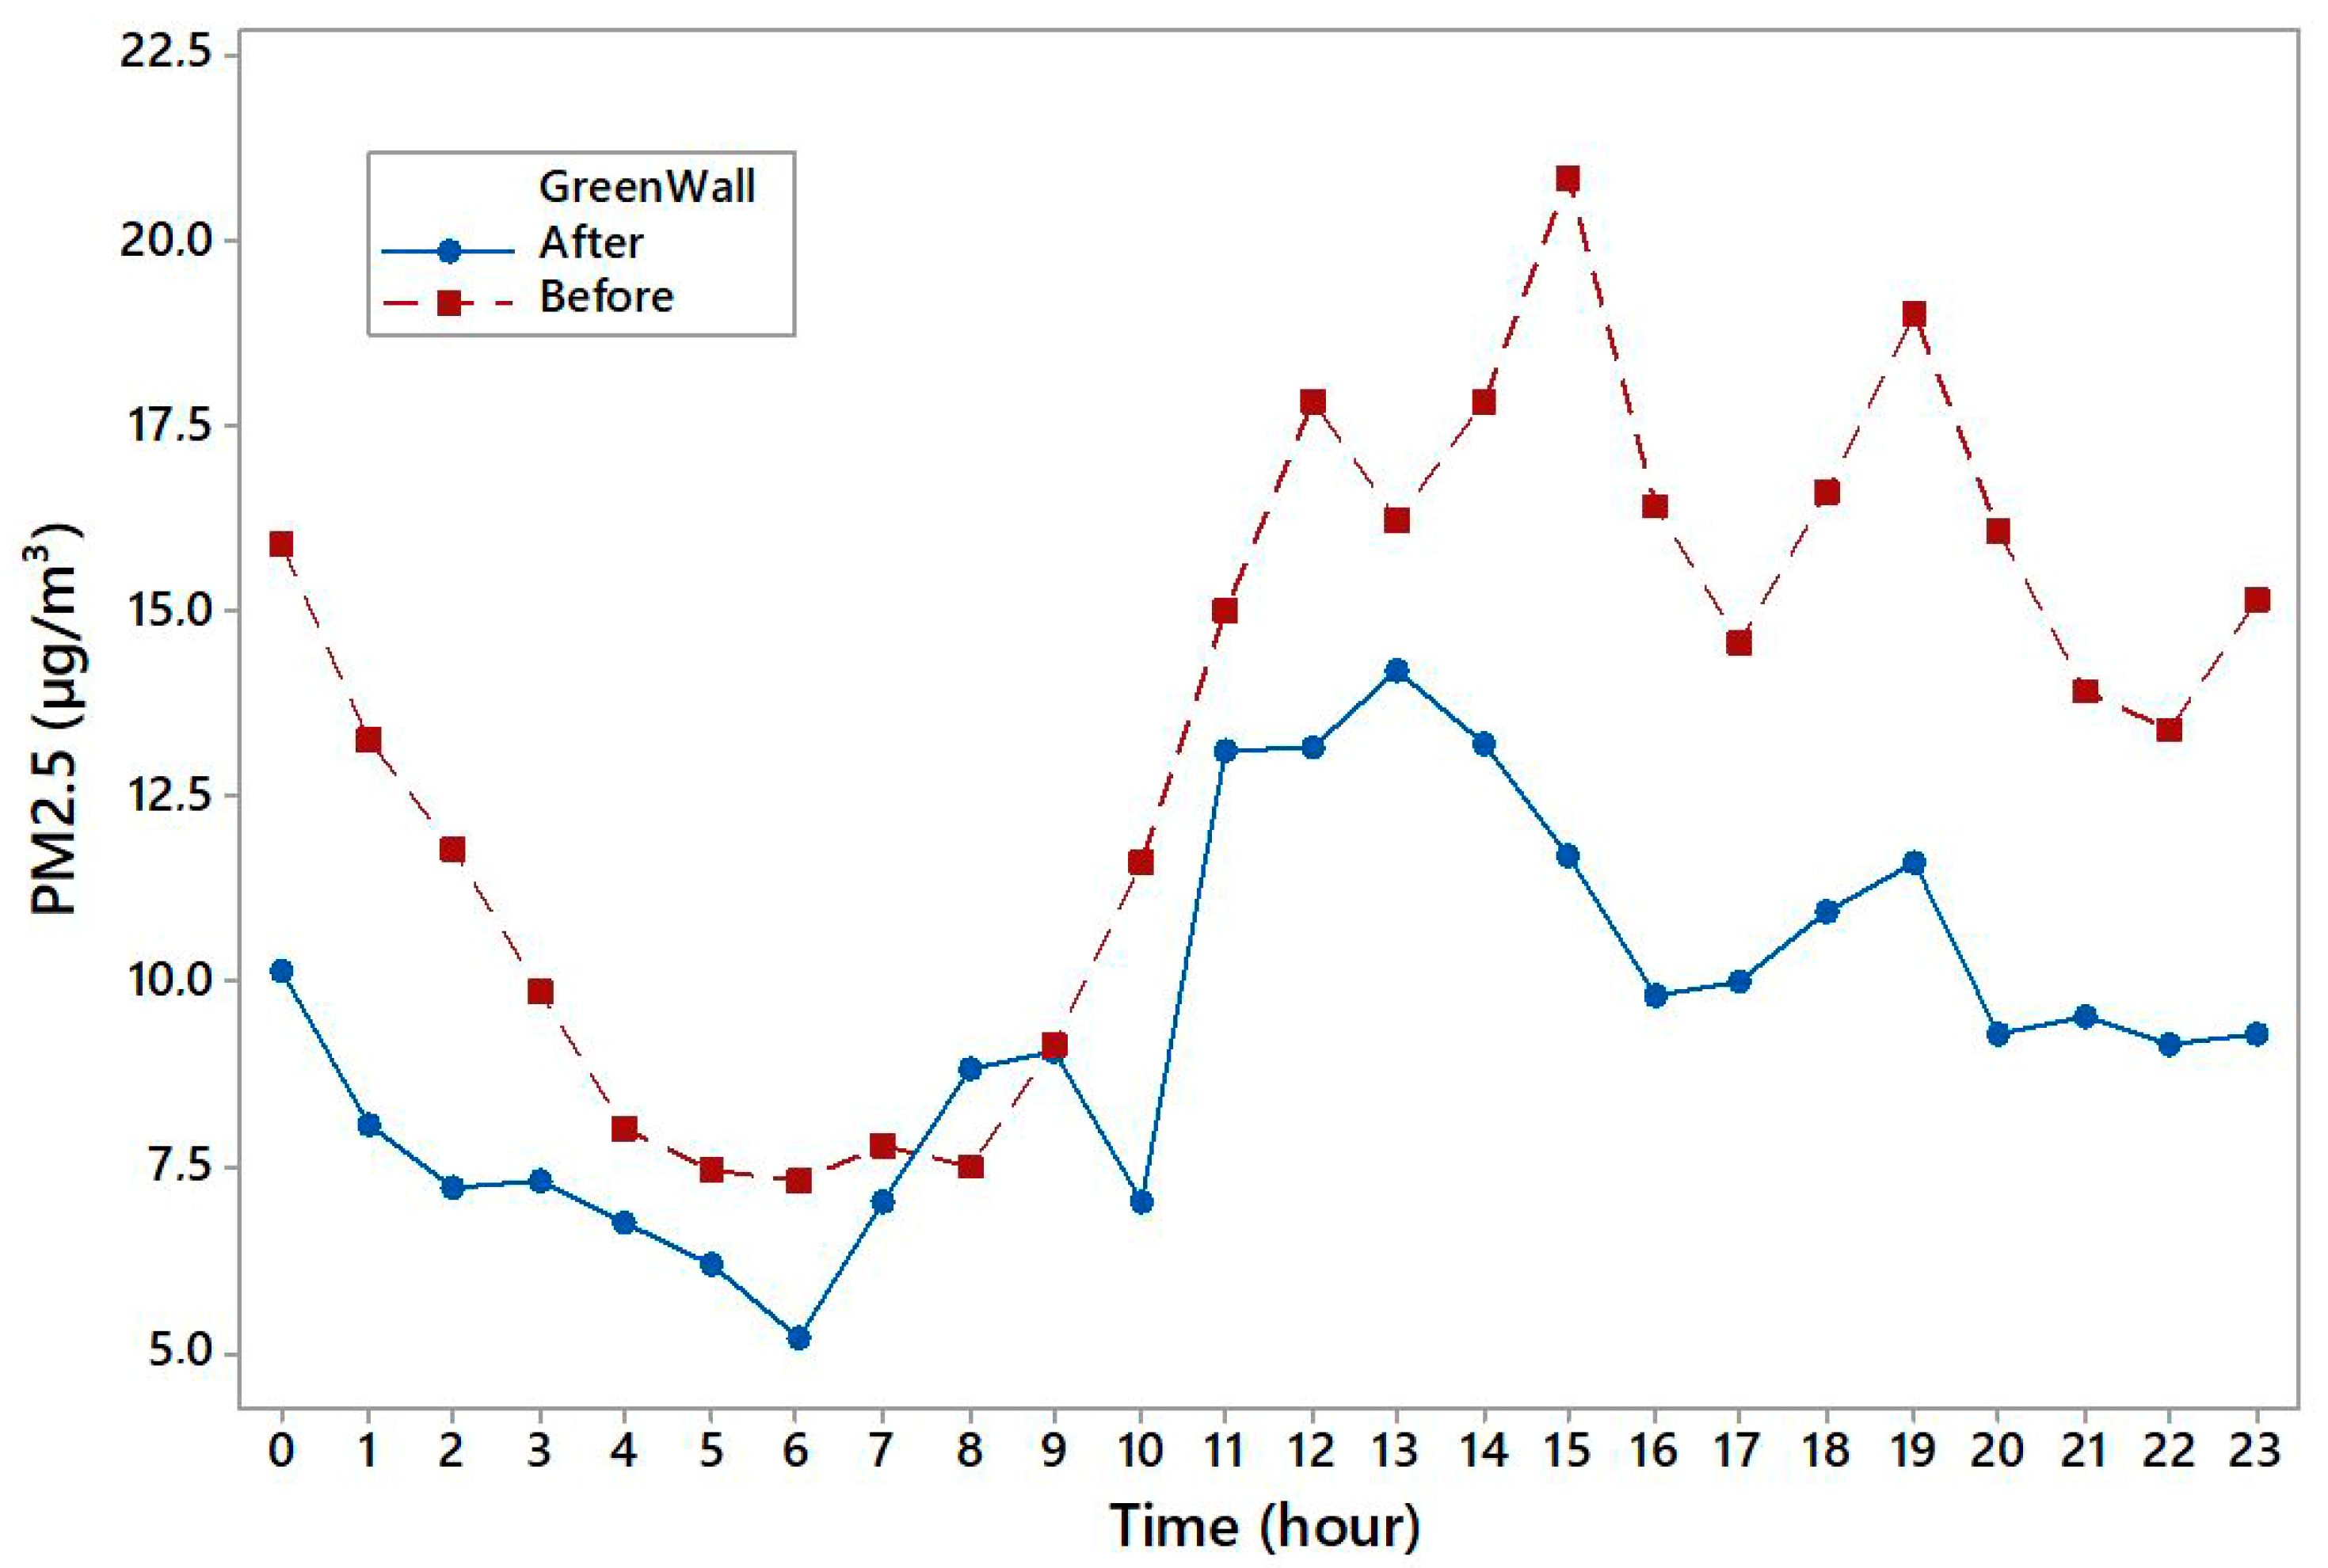
−3, respectively. Based on the hourly assessment, the highest effect of the green wall was observed in the second part of the day, with a higher distance between the two lines when analysing the days before and that after the positioning of the green wall (
Figure 13).
4. Discussion
In this study, PM2.5 concentrations were analysed inside an open barn during the winter season. The experimental results in the dairy barn indicate a reduction of 44% in PM2.5 concentrations close to the green wall. To confirm that this reduction was attributable to the green wall system itself, we verified that there were no significant differences in the climatic conditions before and after installation (ANOVA, p > 0.05). A specific analysis focused on days with stable conditions confirmed that the observed reduction was statistically significant (p < 0.001). However, it should be noted that the experiment was conducted over a limited period of 20 days in a single barn, which may limit the broad applicability of the results to other livestock housing systems or climates.
As shown in
Figure 3, the daily mean values of PM2.5 concentrations were about 15 µg/m
3, with maximum values of about 60 µg/m
3. These data are significant when compared to the actual regulatory limits.
According to Legislative Decree 155/2010 [
36], derived from Directive 2008/50/EC [
37], the annual limit value for PM2.5 is 25 µg/m
3, calculated as an annual average. Although the levels recorded during the experiment were lower than the threshold, the values of PM2.5 concentrations from this study highlight the need to monitor air quality for an accurate assessment of potential risks to operators’ health and animal welfare [
38]. Indeed, the new European Air Quality Directive (AAQD) [
37] established a daily limit of 25 µg/m
3, which should not be exceeded more than 18 times a year. The World Health Organisation (WHO) [
39] defined more stringent recommendations, suggesting a maximum value of 15 µg/m
3 as a daily average and 5 µg/m
3 on an annual basis. Based on the results from this study, the limit set by the AAQD was reached the times during a period of twenty days. With regards to the WHO, the maximum daily value of 15 µg/m
3 was exceeded six times. Although these guidelines are not mandatory, findings from this study highlight the importance of applying mitigation strategies in dairy barns. Moreover, the 44% reduction in PM2.5 concentrations close to the green wall would produce a reduction in the frequency of values exceeding both the 25 µg/m
3 threshold suggested by the AAQD and even the 15 µg/m
3 limit indicated by the WHO, as reported in
Figure 9.
When compared to the existing literature, these results align with those of previous studies that indicate the influence of barn management practices (such as feeding, cattle handling, and cleaning) as well as climatic factors (including temperature, wind, and relative humidity). In our study, we found a positive correlation between indoor air speed and PM2.5, as well as between indoor air temperature and PM2.5. In the study of Joo et al. [
40], PM2.5 emissions increased with temperature, whereas PM2.5 mass concentration and wind speed were negatively correlated. In addition, they found that PM2.5 emissions marginally increase with increased animal activity (i.e., during feeding or from suspensions of composted manure and fine bedding material within the stalls). Based on our experiment, the PM2.5 concentrations analysed in this research study showed many peaks during the day related to barn management and, in particular, to activities such as floor cleaning, feeding delivery, and fan activation. These operations take place during the day, and although no studies directly compare PM emissions between daytime and night-time, emissions are generally expected to be higher during the day due to their association with increased animal activity [
41].
NH
3, which is mainly emitted through animal waste, is a known precursor of atmospheric PM2.5 due to its role in forming secondary particles. Therefore, strategies to mitigate NH
3 emissions should be considered an integral part of any approach to reducing PM2.5. Techniques such as bioacidification and dietary interventions offer promising prospects for reducing ammonia emissions [
42,
43]. While NH
3 was not measured directly in this study, its pivotal role in PM2.5 dynamics is acknowledged. This represents a limitation of the present analysis and highlights the need for future research to assess the combined effects of PM and NH
3 mitigation strategies on overall air quality.
Although specific influencing factors have been identified in this research study, additional variables—including the relative humidity, ventilation rate, particulate composition, number of animals, body weight, water consumption, housing system, and manure management system—may significantly affect PM2.5 concentrations in a barn [
7,
41,
44]. The main novelty of this research study was represented by the design and testing of a vertical green system, which could be considered a passive strategy to improve air quality.
In the context of urban air pollution mitigation, Kaspar et al. [
45] demonstrated that the integration of green infrastructures within urban environments significantly reduces atmospheric pollutant concentrations. Their investigation revealed that structural attributes and density of urban vegetation are key features to optimise air filtration efficacy of green infrastructures. Similarly, Grzymazdzicka [
46] investigated the effectiveness of urban trees in reducing PM and carbon dioxide concentrations. The results indicated that the higher levels of pollutant observed during the autumn months were probably attributable to the seasonal leaf drop from the trees. This finding emphasises the critical role of leaves in capturing pollutants, as their absence significantly reduces a tree’s capacity to effectively filter the air. However, the application of such systems in rural areas and livestock farms is very limited, and this research study contributes to filling this gap. For instance, in the study conducted by Willis [
16], which applied parallel sequential rows of trees and hedges at a broiler house, PM capture efficiency ranged from 21% to 74%. In Guo et al. [
15], a notable limitation was identified concerning the validity of the experimental framework. Specifically, during the experimentation phase, the employed structure failed to accurately replicate real-world operational conditions, primarily due to the absence of animals and the use of surrogate particulate matter.
The current study aimed at addressing these methodological shortcomings. To this end, analyses were conducted within an active dairy cattle barn, with animals present during data collection. This approach allowed for the acquisition of valid PM2.5 measurements that are representative of authentic conditions.
The experiment conducted by Guo et al. [
15] demonstrated a 47.24 ± 4.33% reduction in PM2.5 concentration as a consequence of an integrated vegetative environmental buffer in a ventilated poultry house. Nevertheless, some challenges persist in this context. Specifically, the present study highlighted the enhanced adaptability and functionality of modular vertical green systems compared to basic vegetative strips; for example, those consisting of trees. This superiority stems from their design flexibility, which permits precise customisation of parameters such as the height and density of the vegetative component. Conversely, in a naturally growing system, such parameters are solely dependent on the inherent characteristics of the selected plant species, thereby limiting the scope for optimisation and adaptation.
Furthermore, implementing green systems in livestock barns may hold significance from both aesthetic and perceptual perspectives. In fact, livestock farms traditionally have housing systems characterised by essential functional structures. The integration of green walls in the housing system can promote new barn design, based not only on management efficiency, but also on environmental sustainability and architectural quality. In addition, livestock farms often are located in close proximity to urban areas (for example, in northern Italy), with negative effects on urban air quality and the built environment. These interactions create important overlaps with issues typically addressed in urban architectural and environmental studies. At the design stage, locating green walls close to emission sources could also be analysed to assess a potential increase in filtering effectiveness. The ability to easily move the proposed green wall not only simplifies its transport and maintenance, but also allows further measurements and comparative analysis of its effectiveness in different areas of the barn. While this feature was not tested in multiple locations during the present study, it was a key design element and will be investigated further in future research. This helps optimise the positioning of the green walls in relation to air flows and pollutant distribution, paving the way for future developments and adaptations of the system in the livestock sector. In addition, according to Ascione et al. [
23], future studies could focus on long-term research verifying the durability and reliability of such systems, as well as their economic feasibility, irrigation, and energy consumption. Future research should focus on directly validating the PM capture mechanism. This could be achieved through the analysis of particle deposition on leaf surfaces, measuring VOCs, and visualising airflow. In parallel, laboratory analyses could be conducted to quantify the efficiency with which PM is removed under controlled conditions.
Additionally, the use of alternative plant species should be evaluated, paying particular attention to the physiological and morphological effects of PM accumulation on vegetation. This information would contribute to a more comprehensive assessment of the system’s overall performance. Based on the literature, green walls provide ecosystem services not only by improving microclimatic conditions and air quality but also by enhancing the quality of the rural landscape. They contribute to making agricultural buildings more harmonious, inviting, and visually appealing. In this context, green systems represent multifunctional solutions, capable of addressing ecological, health, and aesthetic needs simultaneously. They also offer new perspectives for a sustainable animal husbandry, culturally integrated into the landscape in line with the New European Bauhaus goals [
47] for livestock farming.


 ,
, 


