Article

Participatory Drawing Methodology for Light in Architecture: Drawing Experienced Space

by
Ulrika Wänström Lindh
Department of Resource Recovery and Building Technology, University of Borås, SE-501 90 Borås, Sweden
Buildings 2025, 15(13), 2278; https://doi.org/10.3390/buildings15132278
Submission received: 26 May 2025 / Revised: 19 June 2025 / Accepted: 24 June 2025 / Published: 28 June 2025
(This article belongs to the Special Issue Lighting Design for the Built Environment)

Abstract

Visual techniques can capture information about visual experiences in ways that differ from speaking and writing. This article examines drawing as a data collection method in architectural lighting research. Lighting design is a rapidly growing profession, and there is a need to build research knowledge of people’s spatial experience of lit environments and to develop methods that capture it. Based on a study in which 16 participants’ experiences of different light scenarios were collected through sketches, semantic rating scales, and deep interviews, the participants drew the boundaries of what they experienced as “the room” and spatial directions inside it. In this study, the 64 sketches were compared in different combinations to detect patterns. The results showed that this drawing method worked well for everybody, both those with and those without professional drawing experience. This method, named Drawing Experienced Space, facilitated finding words and expressions for the experiences of participants, especially for those without training.

1. Introduction

Lighting design is a young and rapidly growing profession; university education in architectural lighting design started in many countries around the turn of the millennium. Lighting design pioneers came from the stage lighting profession within the event and theatre sectors, and from architects primarily interested in daylight. Lighting design is here defined as light planned to support human needs while being aesthetically appealing, often with a desire to express a defined spatial atmosphere through light colour, light distribution, and light levels. Earlier, light planning was primarily carried out by electrical engineers who focused on the more technical aspects of lighting. This is still the case within research: Most publications address technical issues. The lighting field includes both science and art, yet Boyce [1] described the gap between these as so deep that it could be regarded as a divorce between science and art. Previous lighting research has mostly been technocentric, with quantitative methods studying isolated phenomena through controlled experiments and within a laboratory context [2,3]. Mansfield describes the development in architectural lighting design for the last 50 years as it has moved from physics to engineering and, further, to a part of environmental design [4]. There are a few historical examples of lighting research in a social and behavioural context [5,6,7]. A qualitative approach is necessary to understand the user perspective, but qualitative research studies within the lighting field are scarce [1,2,8]. For a long time, results from two-dimensional experiments have been used as valid in three-dimensional space [9,10]. New methods are needed to evaluate people’s spatial experiences in complex real-life rooms [11,12,13].
Lighting designers bring value to people’s spatial experiences and impressions while addressing their functional needs in indoor and exterior environments. Lighting designers have the power to choose what in the environment to highlight and what people see. Semiotics and poetics are sometimes used to describe the added meaning that conscious light planning provides [14,15]. When architectural lighting designers now enter the research arena, new questions are formulated. Demands for analysing the spatial context holistically from the observers’ position have been raised [13,16,17]. The visual experience of rooms can differ from what is physically measurable [18]. With designers as researchers, it is natural to bring drawing and sketching in as a research tool [19,20,21,22].
A sketch can be made before a detailed drawing, and while it is a drawing, not all drawings are sketches. The sketch can be unfinished and provisional [23] Yet, it can also have a value on its own. There are many purposes for drawing. Sketching is akin to taking visual notes to capture momentary thoughts. Sketching can be a way to test ideas [24]. Presentation drawing and architectural visualisation have another purpose. Free-hand sketching is a quick and easy way to note visual impressions. When drawing is used as a data collection method, it is possible to reach information beyond what is provided by traditional research methods. It is possible to draw an experience one has not yet put into words. The participant takes a more active part, and the drawing process is a valuable opportunity for collecting data.
Modern computer visualisation and AI cannot fully replace hand-made drawings. Digital visualisations are effective in their precision and similarity when measured against the real environment. However, paper and pen may be easier to bring to an experimental site or for field studies. Moreover, digital images may provide too much information; in simple sketches, the information can be reduced to the most essential and personal. The drawing can, therefore, also contain the participant’s subconscious interpretations. Heath et al. [25] emphasise that sketches can contain more or less information than a photograph, as the sketcher chooses to include or leave out information in the picture, implying a personal interpretation at the time that the sketch is made.
Handwritten sketches are well-suited for quickly capturing spatial situations during field studies. According to Heath et al. [25], this makes the drawing method stand out from other visual methods. Drawing and photography differ in their processes. When observing the object for a longer time, more details are likely to be seen. Shimazaki [26] describes that sketching makes one continuously rediscover the world. Through seeing and drawing, attention and awareness become a unity. Shimazaki emphasises the possibilities of using sketching for academic purposes to explore and communicate the sense of a place.
The method Drawing Experienced Space constitutes a participatory methodology wherein the participant, rather than the researcher, undertakes the act of drawing. Still, the researcher takes part in the drawing process with questions that lead the process forward. This method is distinct from participatory design, in which users actively collaborate with designers in the co-development of proposals [27]. Yet participatory drawing is a well-suited method for participatory design projects.
In this study, participatory sketching collects individual experiences of spatial dimensions. This methodological article highlights drawing as a research method and presents a data collection method. The analysis detects patterns between different lighting scenarios, describes how room dimensions were experienced, and detects differences between different groups of participants. This article is based on empirical data from a study on experienced spatial dimensions, specifically focusing on drawings created during the interview phase. A previous article analysed findings from questionnaires and interviews centred on participants’ spatial experiences, using sketches mainly for illustration [28]. The purpose of this study is primarily to encourage other researchers and lighting designers to maintain focus on spatial perception and visual experience through developing a drawing method for collecting people’s spatial experiences. The aim of this article is, therefore, to analyse what spatial information one can retrieve from participatory drawings and to develop a framework for analysing and interpreting patterns within them.
The research questions are as follows:
1.
How can we analyse and make conclusions about these spatial drawings?
2.
How can drawings support other methods?
3.
Do the drawings need to be explained with words?
4.
How can we use the findings from the drawings?
5.
Does the method work better for professional sketchers than non-professionals?
To summarise, there are different traditions within the lighting design research field. The architectural lighting design tradition is newer and is less represented in research publications. There are only a few tools for qualitative lighting research. Besides learning traditional technical methods for lighting research, architectural lighting designers can also contribute to the field by introducing and refining methods derived from practice. Drawing Experienced Space is such a method that emphasises that experienced spaces are something different from measured, physically built spaces. While subjective experiences can be shared intersubjectively to some degree, drawings provide an effective means of communicating spatial perception beyond the limitations of verbal description.
Despite the remarkable advancements in AI-driven tools, lighting design must remain grounded in human spatial perception and visual experience. Perception is complex, shaped by surrounding contrasts, spatial context, and cultural knowledge. There is still insufficient understanding of how illumination influences spatial perception, particularly in determining whether a lit environment appears larger or smaller than its physical dimensions [18,29,30,31,32,33]. The method, Drawing Experienced Space, serves as a tool for both research and practice, facilitating the collection and interpretation of individual spatial experiences.

2. Theoretical Framework

General space and lighting concepts are described, followed by an overview of drawing in research, the benefits of drawing, and the communication between the participant and the researcher.
Since this article focuses on the visual experience of lighting, it emphasises the subjective experience rather than quantified data. For instance, light distribution is used instead of luminous intensity distribution, and light levels refer to the perceived impression of light and darkness within the entire room rather than measured illuminance. Similarly, light colour encompasses more than just the correlated colour temperature of the light source; it also considers its interaction with the overall visual perception of the space, including the painted surfaces [34,35,36].

2.1. Concepts, the Experienced Space, and the Light-Room

Experienced space has an experienced extension in all directions, while physical space has a measurable extension. Sometimes, these coincide. The concept of the light-zone was developed by Madsen [37,38] for daylight in interiors (in Danish: lysrum). The light-zone concept is used for describing the intersubjectively experienced rooms within the room, which consist of fields of light. Light-zones can be (A) separated, (B) interconnected, or (C) overlapping; these three categories are visualised with symbols that can be used both for analysing but also for planning light with simple sketches (See Figure 1). In this text, the concepts light-zone and light-room are synonymous. Although Madsen defined the concept of a light-zone, this may feel more like a light spot on the floor than a whole room surrounding you with light. Therefore, light-room refers here to the sense of being in a room created just by light. The concept of light-zones is used in more general terms, such as discussing several light-zones within a room.
The experience of being embraced by a room, and experiencing the smaller rooms within a room, is described by the architect and teacher Branzell [40,41,42]. He developed a methodology for architecture education at the Chalmers University of Technology, based on a “room bubble” that can be drawn to express spatial perception on maps. These bubbles can show the spatial distribution, the extensions, and the directions of an interpreted space in interiors and urban planning (see Figure 2).
The experienced space can change depending on the walls, room openings, and objects in the room. If light reinforces parts of the room, these spatial objects can become prominent, and it may feel that they come nearer. Similarly, reinforced openings may give an increasing experience; the room may, therefore, tend to enlarge and diminish in different parts, as shown by the drawn experienced outline of the room. If a room has a distinct direction, which could be caused by a spotlight or sunrays shining in through windows, this can be marked with arrows. Branzell shows how this is the case both in the interior and on a larger city planning scale [40,41].
Earlier research studies show that lightness and brightness on walls often have an enlarging effect on perceived rooms, and that darkness has a shrinking effect [5,43]. There are also previous findings that a brighter ceiling gives a higher and spacious impression [44,45,46]. However, if room surfaces become too bright and prominent, the perceived spatial enclosedness can decrease [30,47,48,49] (See Figure 3).

2.2. Sketching in Research

The design researcher James [50] writes that research literature about drawing is scarce. With only a few examples existing from lighting research, this theoretical overview is based on a wide range of disciplines. However, according to Shimazaki [26], sketching as a method for empirical data collection has a long tradition, as used by various professional categories, like botanists, anthropologists, ethnographers, geographers, and topographers. In these disciplines, sketching was traditionally used to take visual notes before the camera was introduced. The ethnographer Causey [51] writes about how much he learned from the local people by chatting about his insect drawings of flies. To him, drawing is a process to actively see and participate, while the actual drawing is just a by-product of the process. On the contrary, Berger [52] states that drawing contains the experience of looking: To draw is to look. Drawing is already an established research method in social science, used to work with field studies in complex perspectives like mental mapping [53,54]. The sociologists Martikainen and Hakoköngäs [55] use drawings in research for the ability to express social representations visually. They suggest drawing as an inclusive method that suits diverse groups of people. It is a method that can provide more in-depth information about how participants see the world than verbal communication can give. Heath et al. [25] stress that observational sketching in situ is largely absent from the contemporary visual methods toolkit, yet it could have significant potential. Drawing has an increased use in healthcare as it offers another way than speaking, which addresses human complexity and multiplicity [56]. In sociology, it has been used several times for collecting patients’ experiences, or as a tool for facilitating children’s interviews [57]. Sketching as a research method is more often used with children than with adult participants [23]. The psychologist Theron [54] uses sketching for participants to reveal their inner pictures of themselves. Even within art-based research, there seems to be a need to highlight sketching as a possible way to collect empirical data. Mäkelä [58] stresses that it is easy to forget the most natural method within the profession. Despite the closeness to design practice, drawing is not yet a commonly used method in lighting design research. When sketching is used for empirical collection, it is more common for the researcher to sketch, not the participant [50,57]. The design researcher James [50,59] describes his method, “Sketch and Talk”, as a temporal, spatial, corporal, and relational process. The researcher sketches while talking to the respondent about the physical environment. It is less common that the respondent sketches themself. Researchers are not using sketching to create an art piece; they use it to concentrate on seeing while simultaneously reflecting [50,59]. Jellema et al. [57] describe active drawing as a sensory engagement with an object. There are very different purposes for sketching and various ways to do it. Heath et al. [25] divide the aspects of drawing into three themes: sketchiness, concentrated seeing, and sketching as interaction.
Mapping as a drawing research method can, according to Powell [60], be used for noting social relations in city planning, as directional tool with graphic representations of places relative to scale, scope, symbol, and legend. Zweifel and Wezemal [53] used drawings for interviewees’ mapping models of their settings in a city-planning context, a method for data collection that can embrace the complexity of real-life situations. In Zweifel’s and Van Wezemal’s discussion about city planning, complexity refers to different views and interests among actors. It is a production, evaluation, and reflection process. Their methods come close to mind mapping, with circles and lines showing relationships previously not put into words, drawn during the discussion with the researcher. Usually, it does not follow a linear procedure. This method originates from soft system methodology (SSM), in the organisational management field, but it is also suitable for visual tasks such as city planning [53].
Lynch’s [61] mapping method is well known. It uses symbols for five city planning categories: paths, nodes, districts, borders, and landmarks. It is commonly used for mapping in lighting design analysis, as well as in architecture and city planning. Furthermore, the method can be combined with other types of sketching, as shown by Branzell [40,41,42]. Branzell combines Lynch’s mapping with Cullen’s “Serial Visions”, a method for drawing what is seen at eye height when passing along a path [62]. He also developed Lynch’s method by adding a symbol for the experienced space’s extension and direction. This involves encircling what is perceived as “the room”. In this study, this method is developed further and used for the experienced “light-zone” (see Figure 1 and Figure 2).

2.3. An Attentive Drawing Experience

Polanyi’s [63] concept, tacit knowledge, points out that there are values we usually do not formulate into words. The psychologist Theron [54], who appreciates drawings as a research tool for their tangibility and directness, raises concrete issues about participant sketching as a tool for collecting empirical data. According to her experience, drawing can function as an icebreaker for shy participants as it may also reduce inhibitions. Furthermore, it is beneficial for non-native speakers and others who are not confident in the language. Similarly, Zweifel and Van Wezemael [53] confirm that it facilitates communication when speech is an insufficient tool. Some people may feel more comfortable with pictures. By letting the interviewees sketch the process, the process turns from one-dimensional to a second communication level. Drawings can reveal the integration of affect and unspoken assumptions for the participant and the researcher. Moreover, the visual technique stimulates the sense-making process. Mapping shows both the inner mental world and the outer physical world.
Mäkelä [58] associates drawing with a method in which functionality moves the research process forward. She describes Ings’s [64] concept of “enstasic drawing” as an introspective phase when one develops the creative potential of something not yet formulated. When drawing in this way, in the state of enstacy, the purpose is not to make something but to explore and develop a thought [58]. Kashanipour [65] poetically describes the drawer’s attentive thinking as the gradual gaze: a relationship between the searching eye, in the process of conscious perception, and the object in focus. In this process, one needs to slow down. Heath et al. [25] describe this as a concentrated seeing.

2.4. Participatory Drawing

The collaboration between the researcher and the respondent is essential for the participatory approach [56]. Jellema et al. [57] sees drawings as a common ground where the respondents and the researcher meet. The hierarchy between the participant and the researcher can dissolve when drawing [55]. Additionally, Literat [66] argues that participatory drawing is inherently less hierarchical than verbal methods, as disparities in language proficiency and discourse between participants and researchers can create imbalances.
Theron [54] points out the need for awareness with the participatory drawing method. While the drawing process can be regarded as a helpful collaboration between the participant and the researcher, researchers may go too far in their data interpretations, making it important that the participant be treated as the expert in the process when analysing and understanding the drawing. Similarly, Literat [66] cautions against over-interpretation of visual data, as it tends to be more open-ended than verbal data. She further argues that allowing participants to interpret their own drawings enhances the study’s rigor and ethical integrity, shifting the researcher’s role to that of a listener while granting participants control over the process.
Drawing stimulates verbal descriptions as well. This is addressed by Heath et al. [25] with their concept sketching as interaction. Powell [60] describes how participants drew using Lynch’s method, and that they often told stories while mapping. The drawing stimulated speech. Theron et al. [54] also describe that the drawing process is usually accompanied by talking and writing. Zweifel and Van Wezemael [53] even stress that drawing needs to be accompanied by explanatory words.

3. Materials and Methods

To truly understand the potential of drawing for empirical collection, a case study in an auditorium with several lighting scenarios is used as an example. A previous article focused on people’s experiences of the lit room [28]. This article focuses on the interpretation of the sketches, which were one part of the empirical collection. Other methods were a semantic questionnaire and interviews. These methods are addressed here also, yet only as a background for discussing the sketches. Participants were recruited mainly from the university, either as staff (researchers, teachers, administrators, doctoral students, or as students). The gender distribution was rather equal (7 men/9 women), and the mean age was 45 years (age span 25–65). The 16 participants were tasked with drawing the spatial boundaries of the experienced space and the experienced light-zone(s) in an auditorium, with several lighting scenarios.
This auditorium was chosen because of the permanent pre-programmed lighting scenarios. The room’s dimensions are 18 m × 7 m and 4.6 m high. The auditorium’s lighting system was designed in 1998 by an experienced and reputable lighting designer. This historic building has specially designed luminaires inspired by the lighting character the building had 100 years ago. The lighting principles at the time of the original study are still valid, even though, after the study concluded, the clear incandescent light bulbs were replaced by corresponding retrofitted light sources with LED. The ambient lighting consisted of 14 recessed downlights of 50 W low-voltage halogen lamps, a consciously designed weak general lighting. It was combined with a large ceiling crown fitted with up- and down-directed light from warm-white compact fluorescent lights. Clear incandescent bulbs at 25 W decorated the outside of the crown. A curved brass track in the ceiling held 27 clear incandescent bulbs. Also, on this track, six spotlights with low-voltage halogen lamps were directed toward the podium. Additionally, specially designed wall-hung luminaires with incandescent bulbs spread light forward into the room and provided raking light along the walls. During the experiment, the daylight was omitted by thick, tightly closed curtains.
The room was illuminated at horizontal illuminance levels lower than those recommended by international and European lighting standardisation committees (see Table 1). This was a conscious decision by the lighting designer to use more vertically oriented lighting than horizontal lighting, which is better captured by a lux meter. The lighting designer intended to create a light that shows the room in the most beautiful way possible while simultaneously emphasising the podium. The scenarios differ in light levels, as well as in the distribution of light, the amount of wall lighting, and the focus of light against the podium. The direct or indirect light from the ceiling crown also shifts among the scenarios (see Figure 4 and Figure 5).
The four light scenarios were as follows:
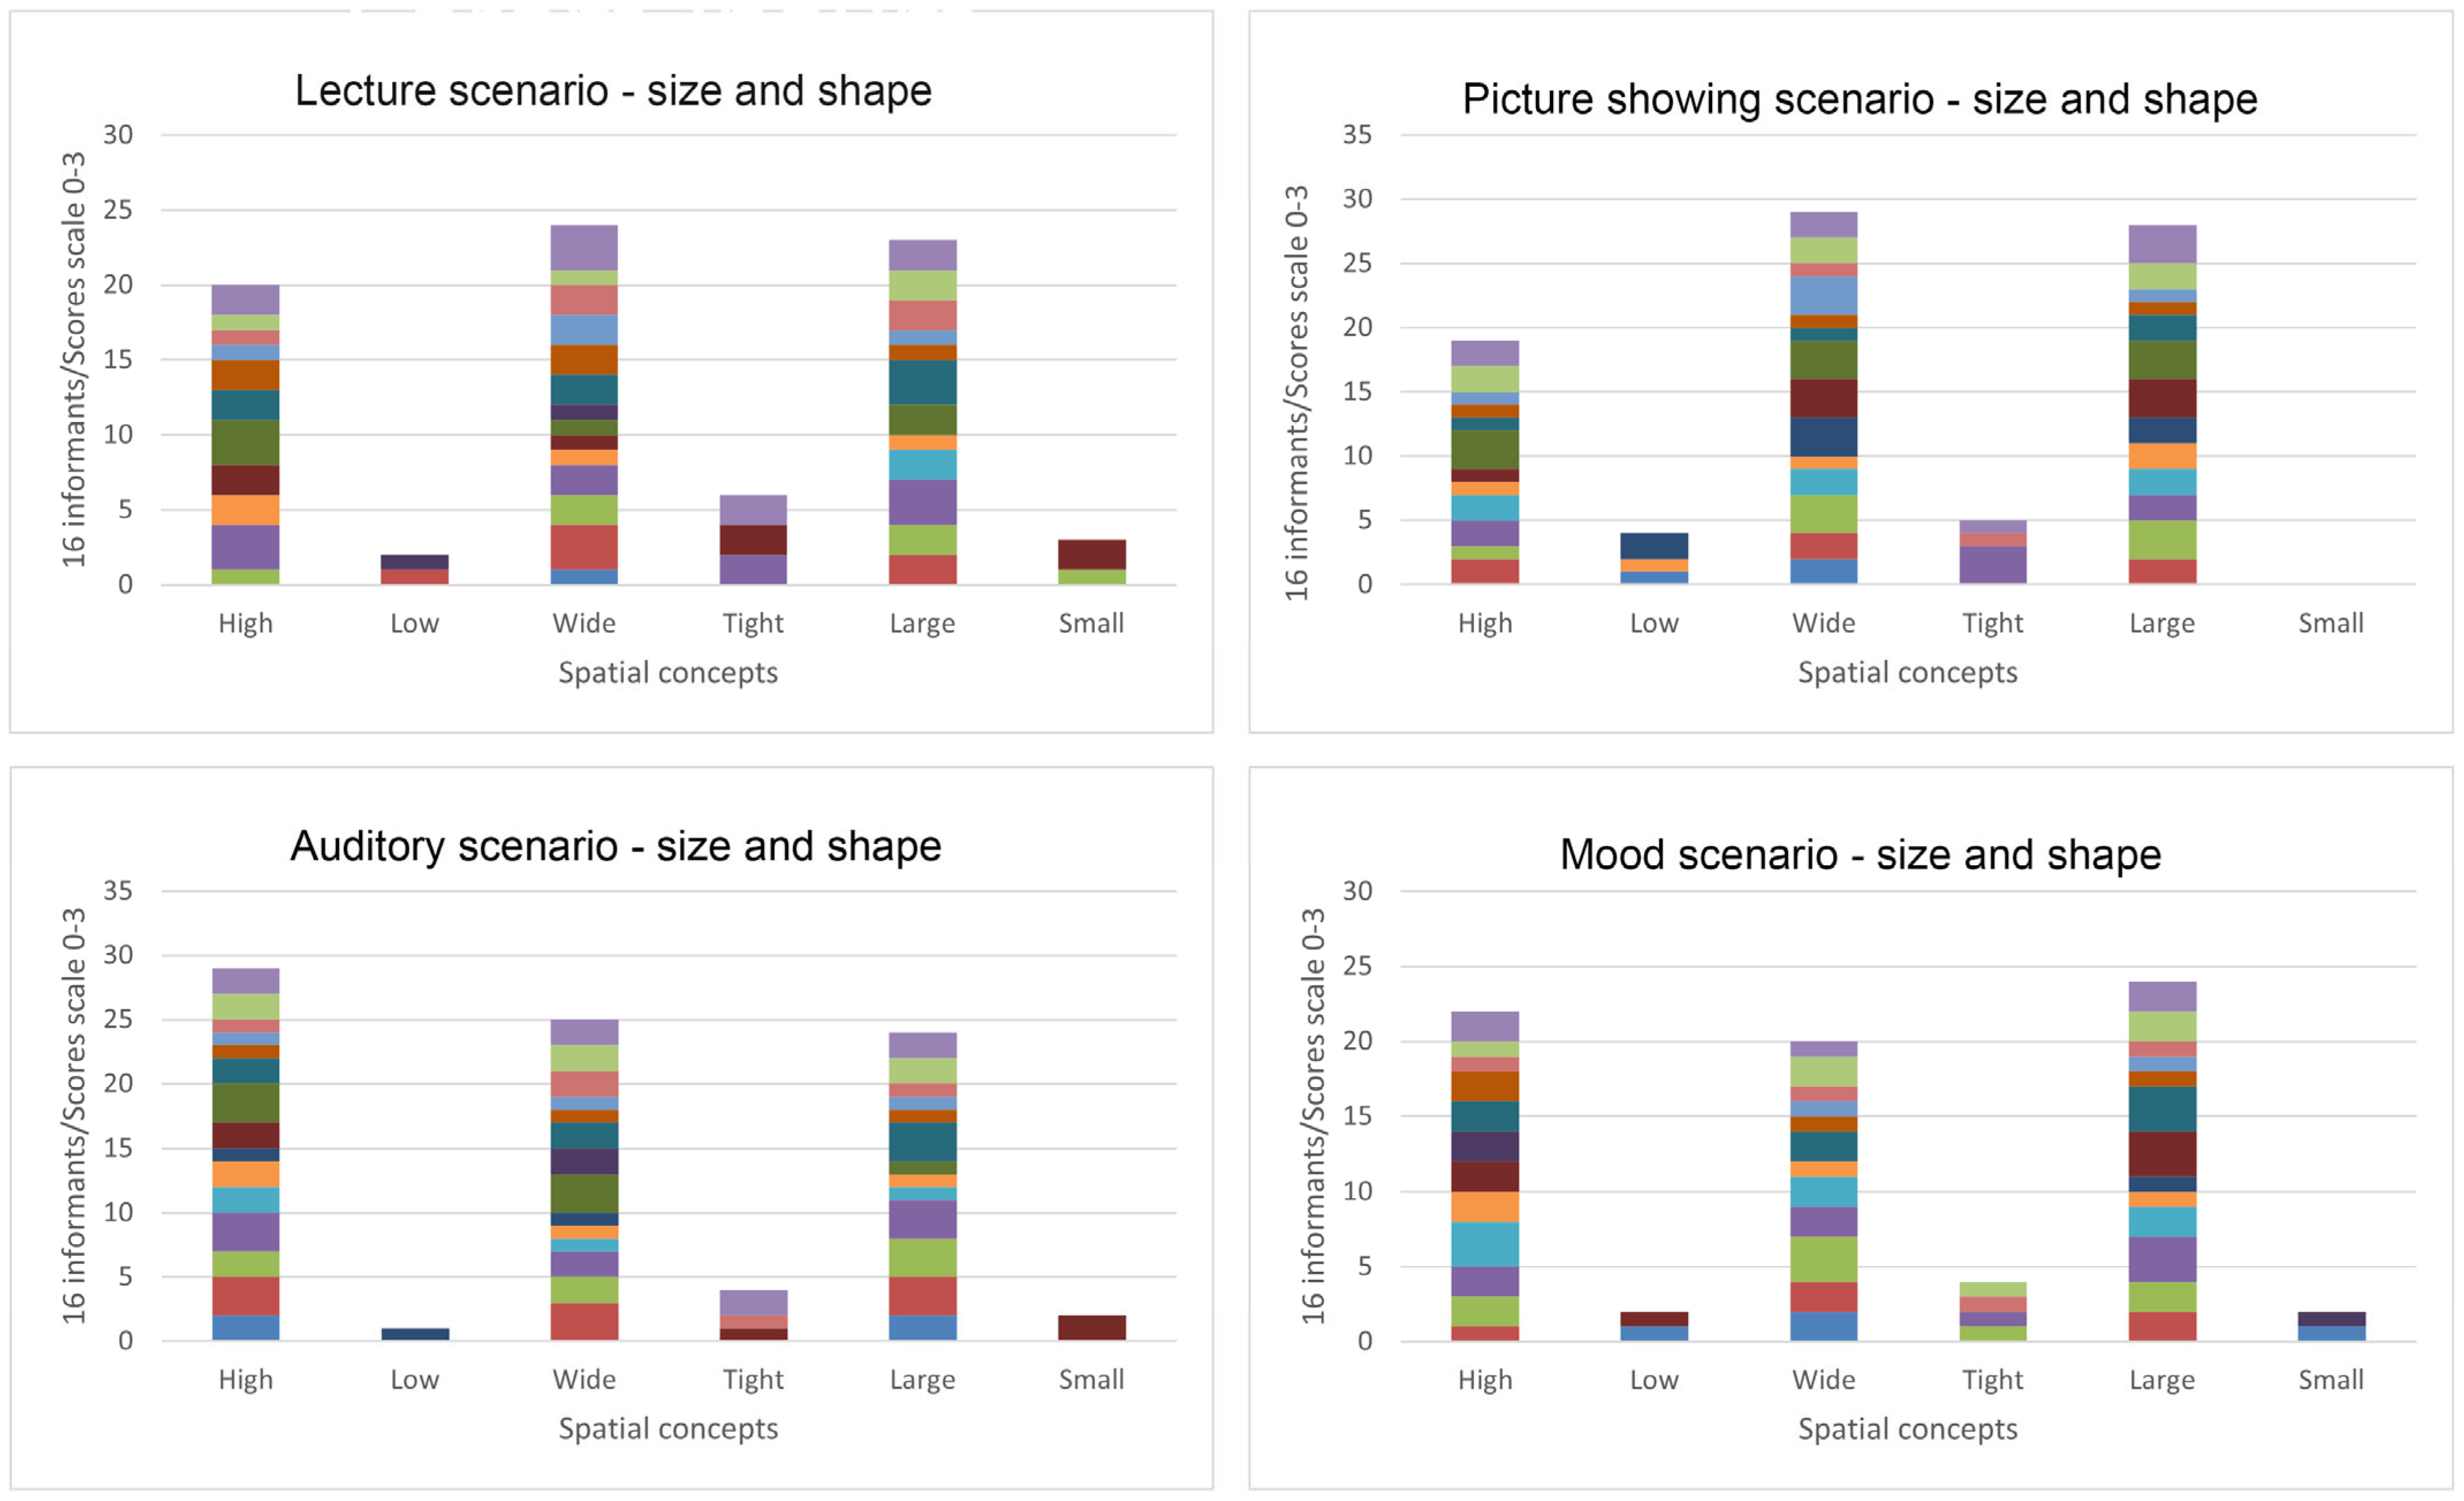
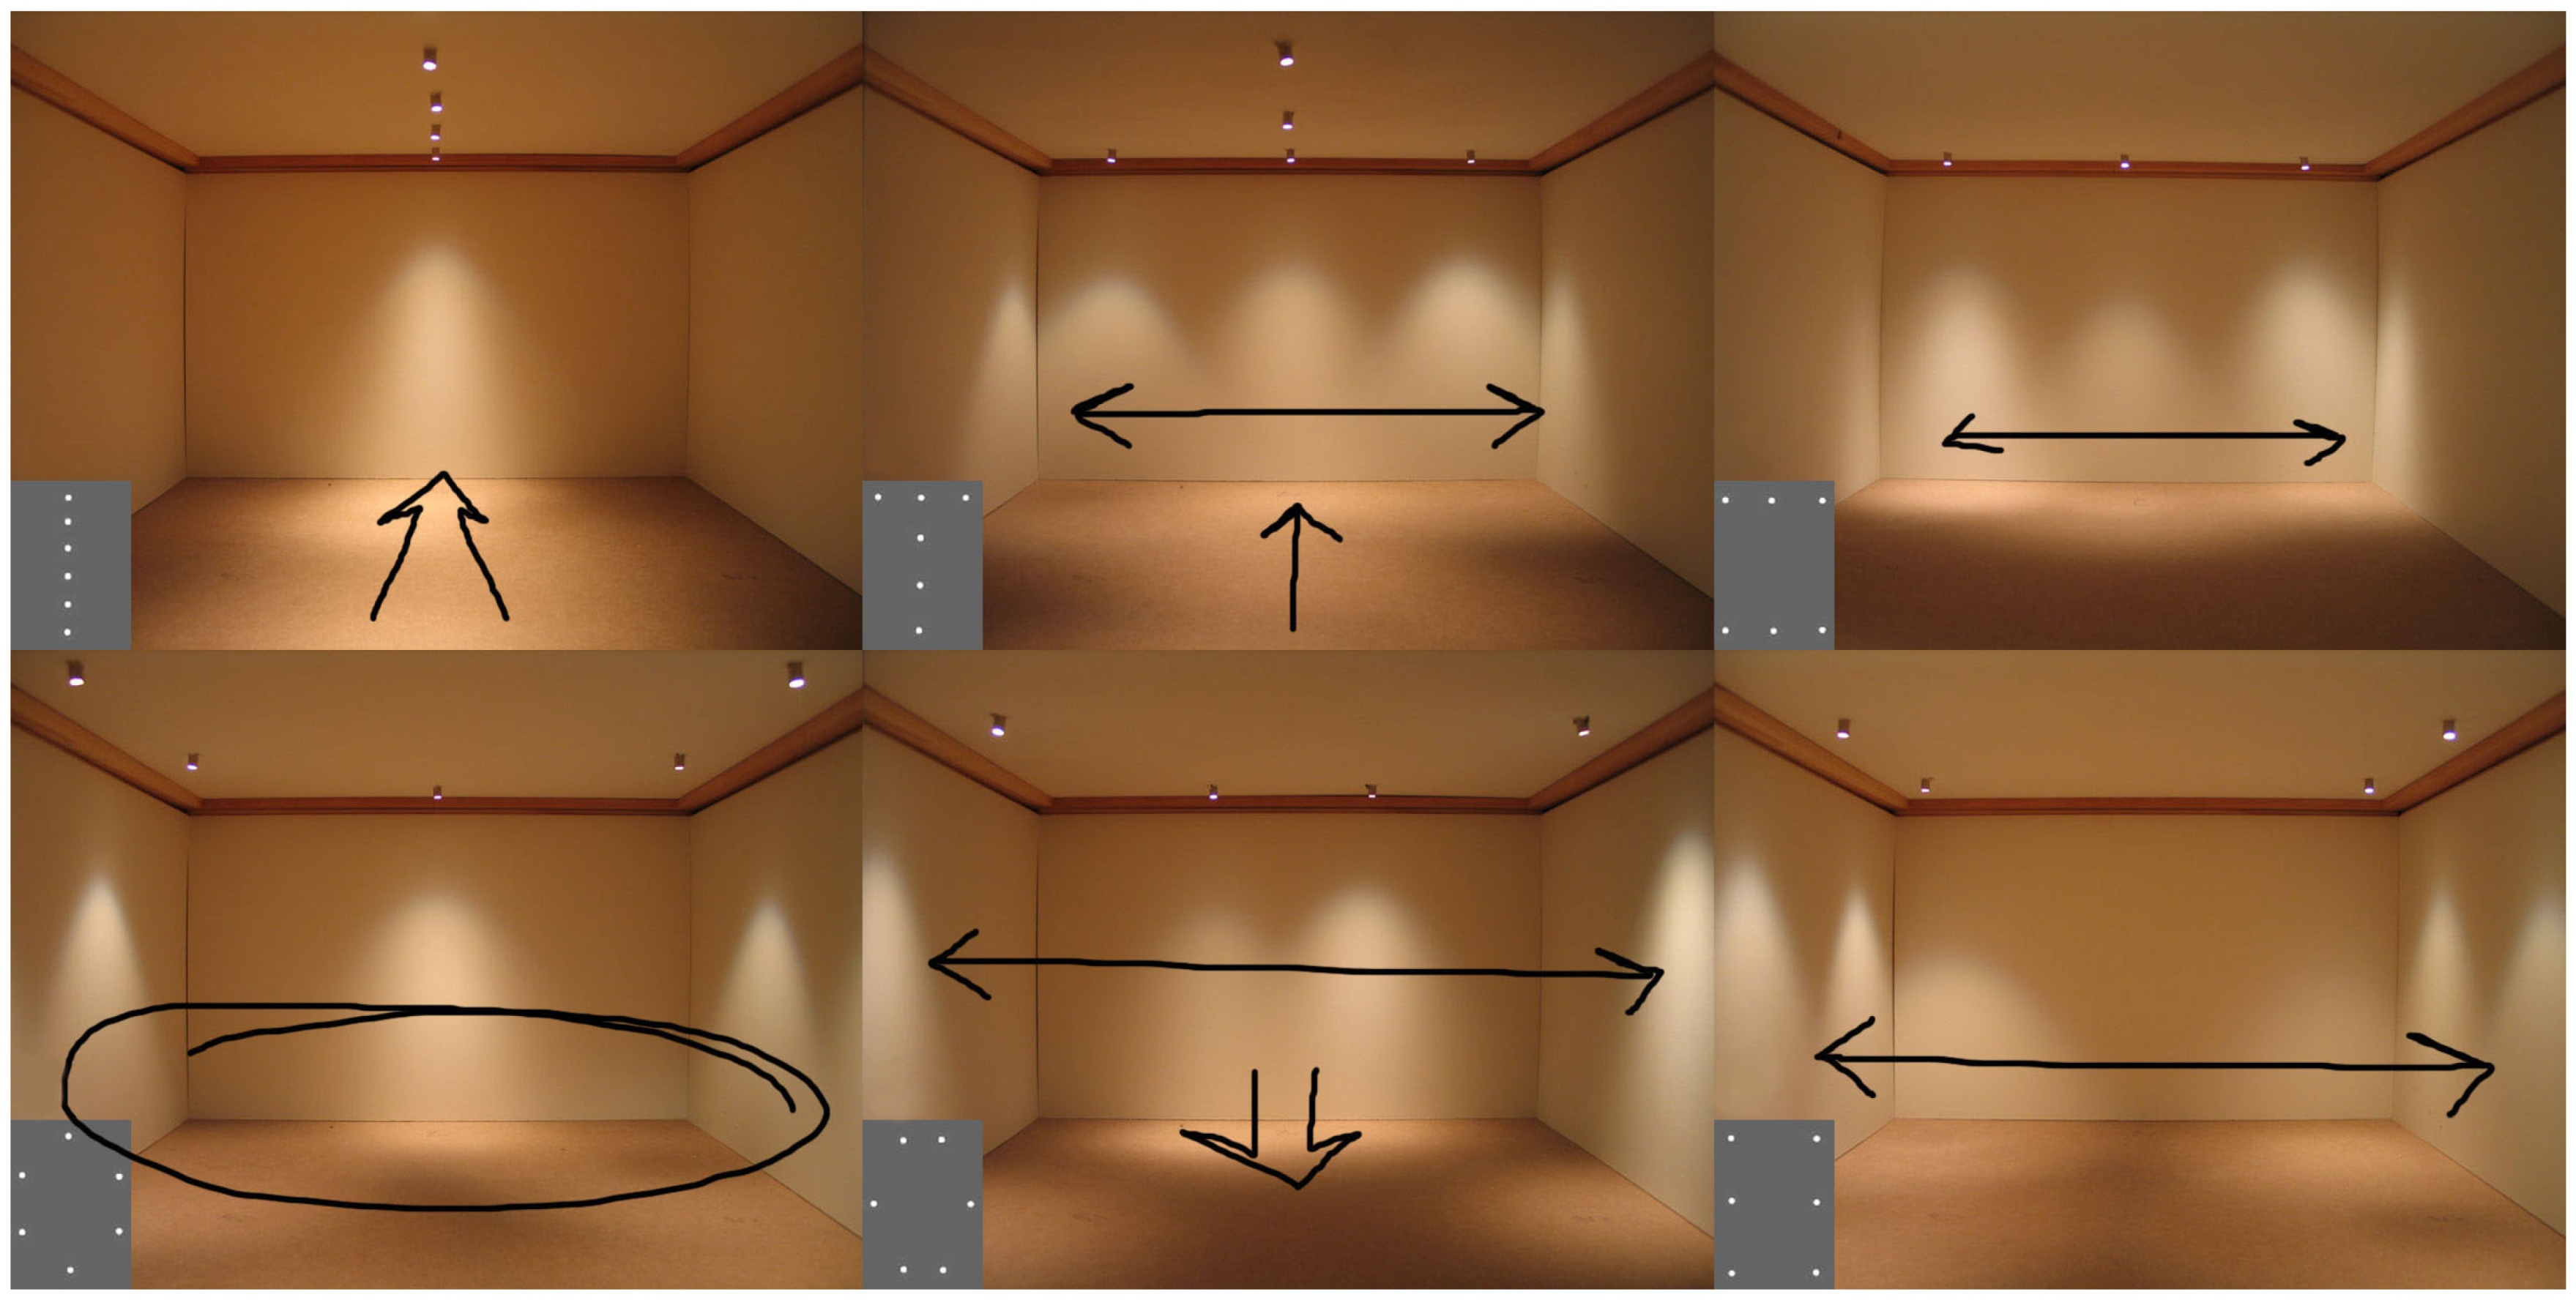
  • The Lecture Scenario is a bright scenario with less ceiling emphasis and greater focus on the podium.
  • The Picture-Showing Scenario is the darkest as it uses no wall lights. Only the recessed downlights are glowing weakly. The main light source is the overhead projector.
  • The Auditory Scenario is the brightest and the most uniform scenario. It is the only scenario with upward-directed light.
  • The Mood Scenario is rather dark, with wall emphasis and no directed light (no spotlight and no overhead projector).
The scenarios were presented in four different orders to ensure results were not influenced by the sequence in which participants viewed them. The participants were divided into groups of those with and those without professional experience of sketching: professional (n = 9) and non-professional sketchers (n = 7). Those with a background as an architect, lighting designer, industrial designer, or visual artist belong to the professional category; the other group consisted of other academics who were categorised as non-professionals in relation to sketching. Nine women and seven men between 25 and 60 years of age participated. An equal gender distribution was not considered necessary to achieve, as this was not expected to influence the results. The choice of participants was a convenient selection consisting of design students, doctoral students, and administrative staff from the artistic faculty, as well as acquaintances.
The data collection in the original study started with adaptation time when the researcher explained the procedure, followed by letting the participants write a couple of free sentences describing their experience of each scenario. It was directly followed by answering seven-grade semantic scales with questions on spatial shape (high, low, wide, narrow, deep, shallow, round, square, large, and small), and spatiality (delimited, open, enclosed, excluding, airy, confined, alienating, and close). The last part of the questionnaire dealt with atmosphere words; the participants should encircle words, from a list of 45 concepts, that correspond with their experience of each scenario. After this, the interview with the included drawing moment started. The in-depth interview was semi-structured in that the participant’s questionnaire answers were used as an interview guide.
The free-hand sketching method used here is inspired by a combination of the mapping methods of Lynch’s [61] and Branzell’s [41,42] methods of sketching the experienced spatial extension and directions. These methods comprise several concepts with signs. Here, just two were used: Branzell’s room extensions visualised with a “room bubble” and an arrow for spatial directions (see Figure 2. For the data collection process as a whole, see Figure 6).
During the interview, participants were encouraged to draw the experienced room’s spatial boundaries and the experienced light-zones in two ways: as a floor plan drawing and as a section drawing. The interview addressed one scenario at a time. The beginning of the drawing session was usually initially silent until the researcher asked questions and the participant explained. The whole session, from filling in the questionnaire to drawing and interviewing, lasted between 1.5 and 2 h for each participant. Only the researcher and one participant were present in the room during the entire session. All the participants sat and sketched in the same spot: at the podium desk in the middle of the room, which was the only table in the room. This spot provided an appropriate place for a conversation between the researcher and the participant. When initially responding to the questionnaire, participants sat either in the audience rows or on the side windowsill, so they had seen the room scenarios from different angles. They were also encouraged to walk around the room before the interview started. The names of the scenarios, originally determined by the auditorium’s lighting designer, were not revealed until the end of the session. The participants were instructed to use a red and a blue pen to draw spatial boundaries and the experienced directions. They had the freedom to draw in their own style. Some participants started to use one colour for the experienced boundaries of the built room and another colour for the experienced light-room. Therefore, the use of colours in the sketches is not consistent between the participants. However, what each of them meant is easily traced through the interviews. As several authors suggest [55,56], the researcher encouraged and guided the participants by telling them it was not the skill of drawing that mattered for the results, but just that they recorded their room impression on the paper. The researcher was attentive to the participants’ descriptions of what they drew, how, and why.

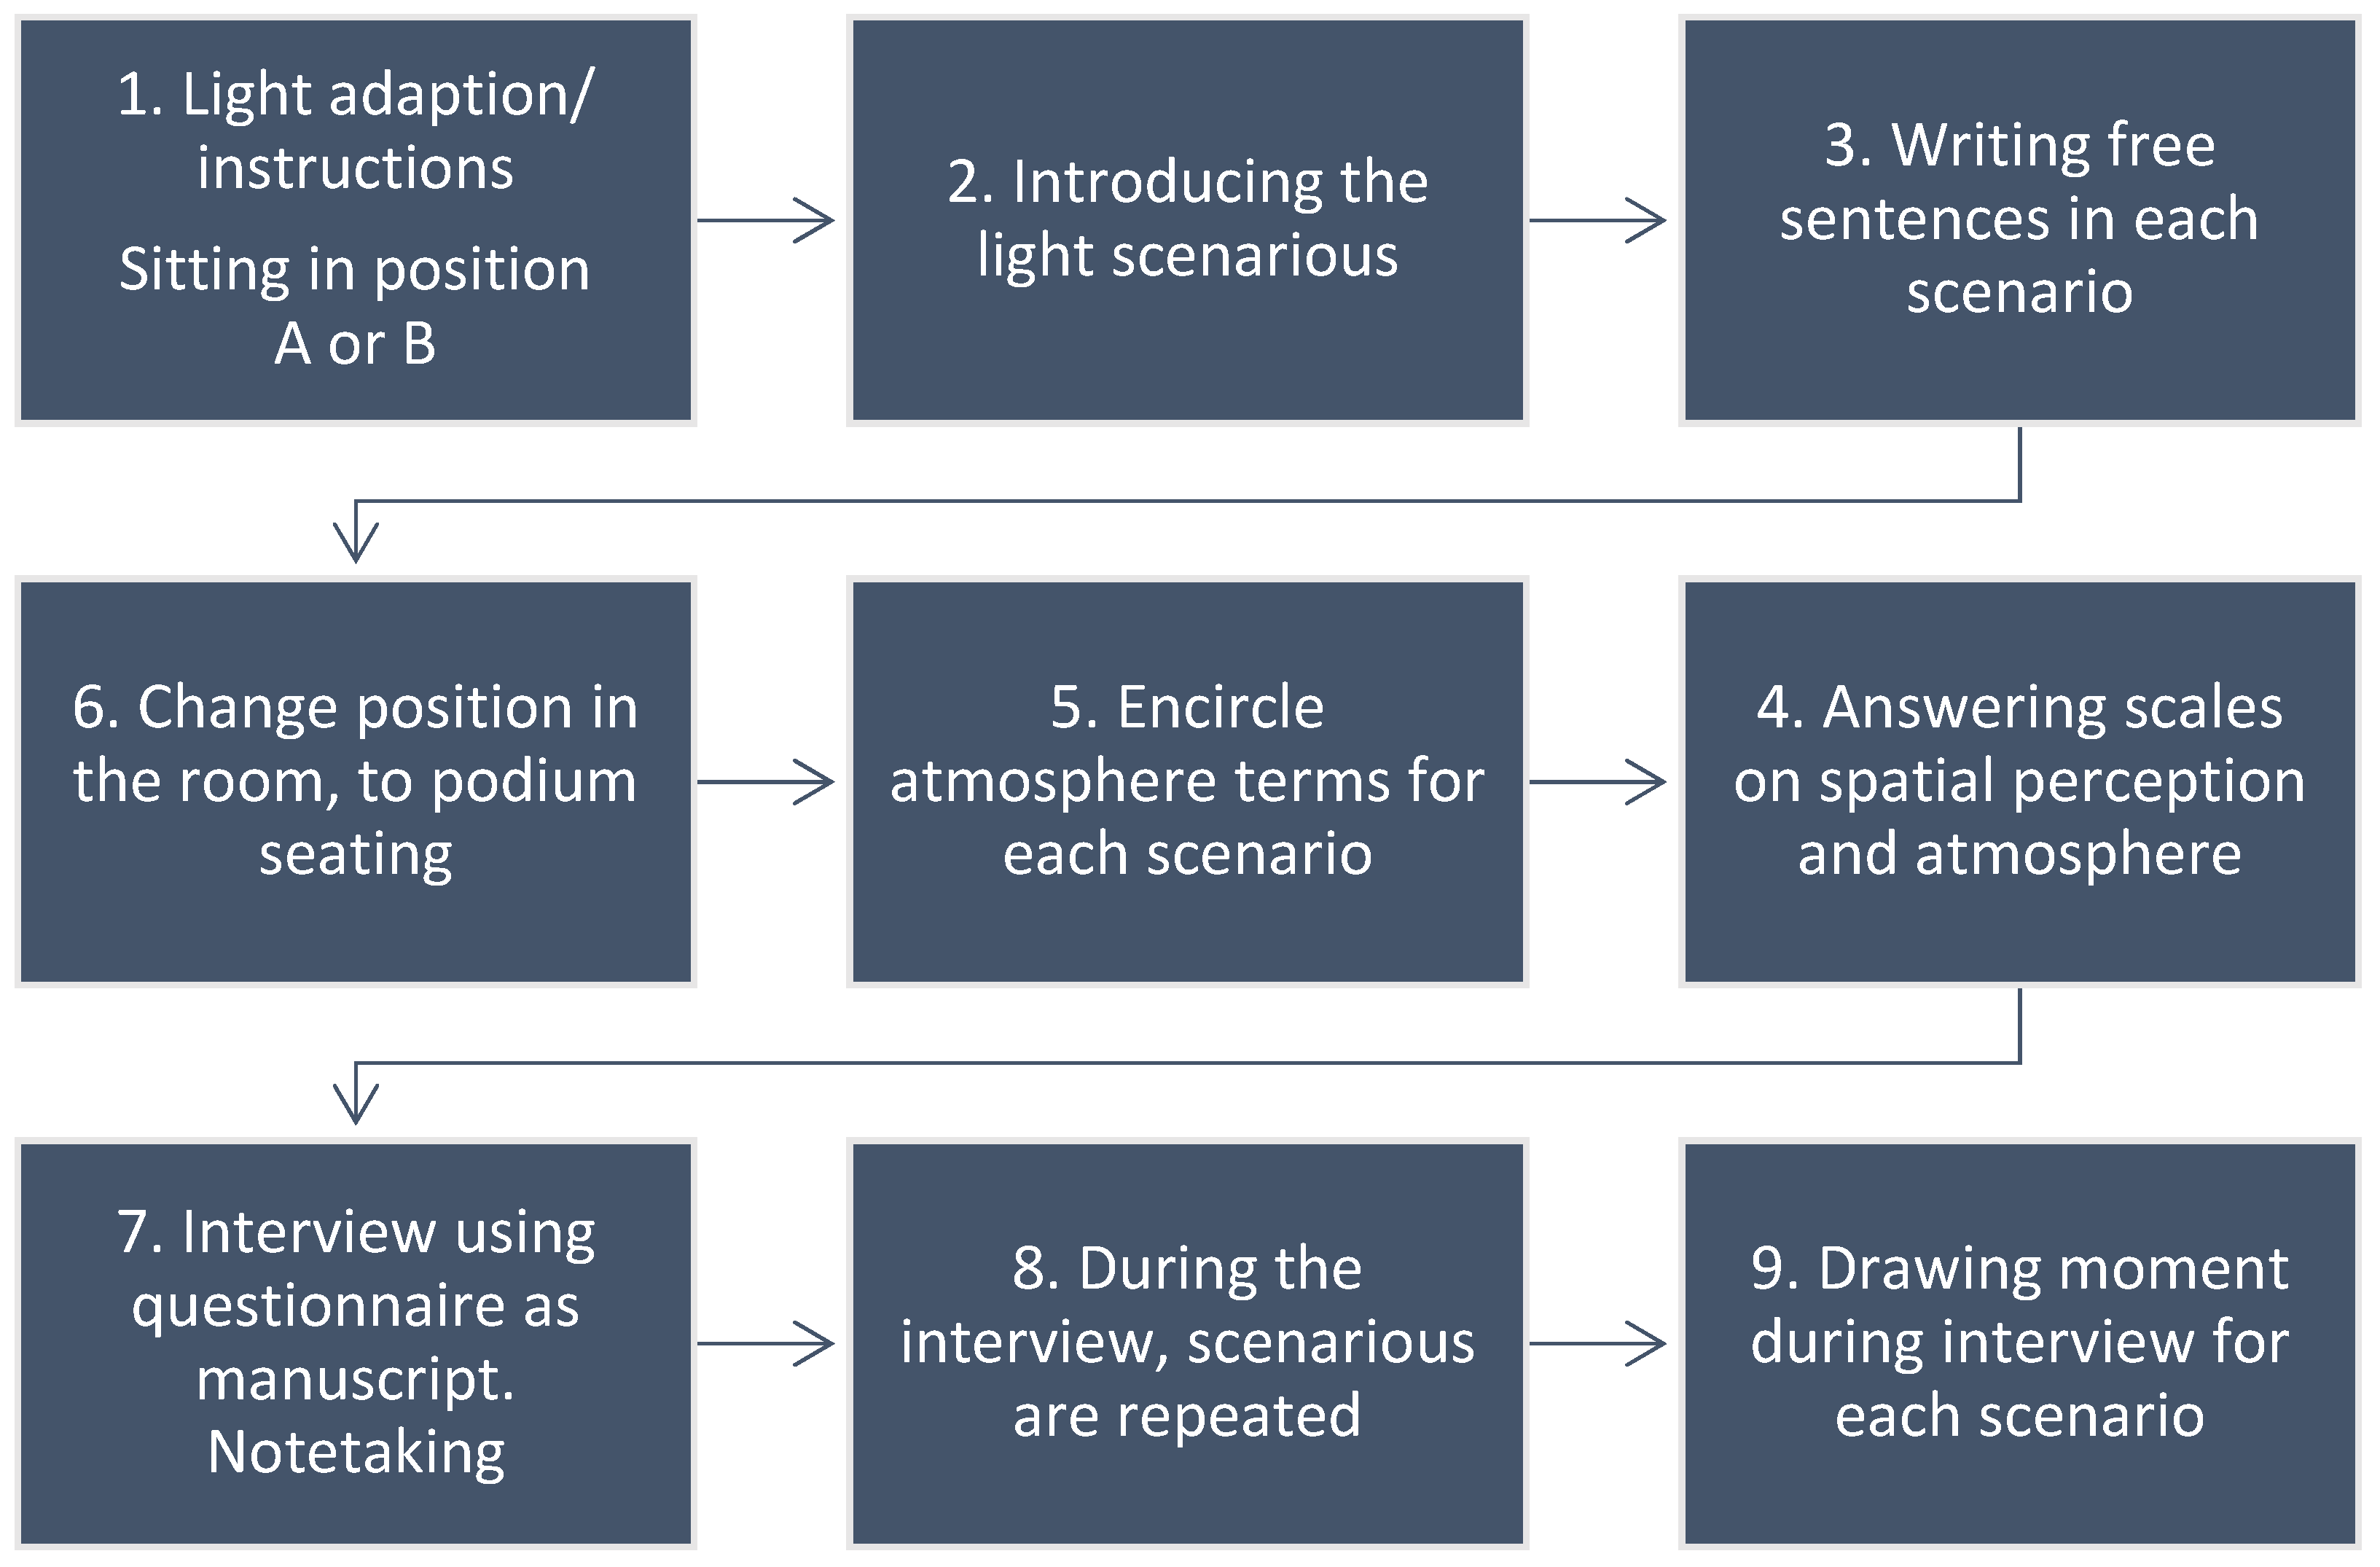
Procedure for Analysing Empirical Data

The analysis of the data started with sorting the sketches. The sketches were categorised according to their most prominent qualities (see Appendix A). Important parts of the analysis process were when the participants directly explained their sketches while drawing them [56]. Afterwards, the sketched scenarios were compared for each participant, relating each spatial concept to the scenario it represents (high, low, wide, narrow, direction inwards or outwards, large, or small). These concepts, and more, were included in the questionnaire, inspired by SED [67]. It was also noted whether the participants drew several light-zones and if the sketched boundaries aligned and followed the shape of the physical boundaries. Translating the sketched patterns into words was a way to organise, facilitate, and create a distance, to provide a helicopter view for a clearer and less subjective view. The most common concepts for each scenario, which at least four people drew, were chosen for the continued analysis (see Appendix A). The collected sketches (from 16 participants and ×4 lighting scenarios, 64 in total) were compared for each scenario, between scenarios, for each participant, and between participants. Images with similarities were sorted into groups and analysed further for similarities between the two groups (professionals vs. non-professionals). Tables were used to display the relationships between spatial qualities and the scenarios (see examples, Appendix A Table A1, Table A2, Table A3 and Table A4). From this, it was obvious that some concepts were more prominent and related to a specific scenario than others. All results were triangulated with the results from the questionnaire and the interview transcriptions [68,69]. Finally, explanations of the visual findings were sought in the interviews (see Figure 7).
Each individual’s comparisons of the various scenarios were important as the participants drew, just as they assessed using words and with different personal scales. Some are expressive and vivid, while others are introverted and more careful with details. Some participants drew close to the physical boundaries when they assessed the room as large, while others drew outside the limits. Nevertheless, it was not hard to understand what they meant when simultaneously listening to their descriptions.
The ethical board at Gothenburg University answered in 2007, when the original study material (interviews and drawings) was collected, that there was no need for a formal ethical approval application. Nothing was changed in the room and only the existing buttons for designed light scenarios were used; this was not considered harmful. To be sure, the ethical board of the University of Borås, the present affiliation, was also contacted before continuing with this article. Their answer 24-01-30 confirmed that there was no need for ethical approval consent for this study. The participants are anonymised, and the interview did not reveal any sensitive personal information. The participants were informed about the study, and their consent to participate was recorded.

4. Results

The result section starts with chosen sketches, which exemplify essential spatial concepts, comments on the analysis of these, and how frequently these concepts occurred at each of the four scenarios. These tables are followed by a table showing the four participants’ versions of all scenarios, to display differences and similarities between different participants’ interpretations. The chapter ends with a selection of interview quotations from the drawing sessions to show what kinds of conversations were ongoing during the drawing moment and how the participants explained what they drew.

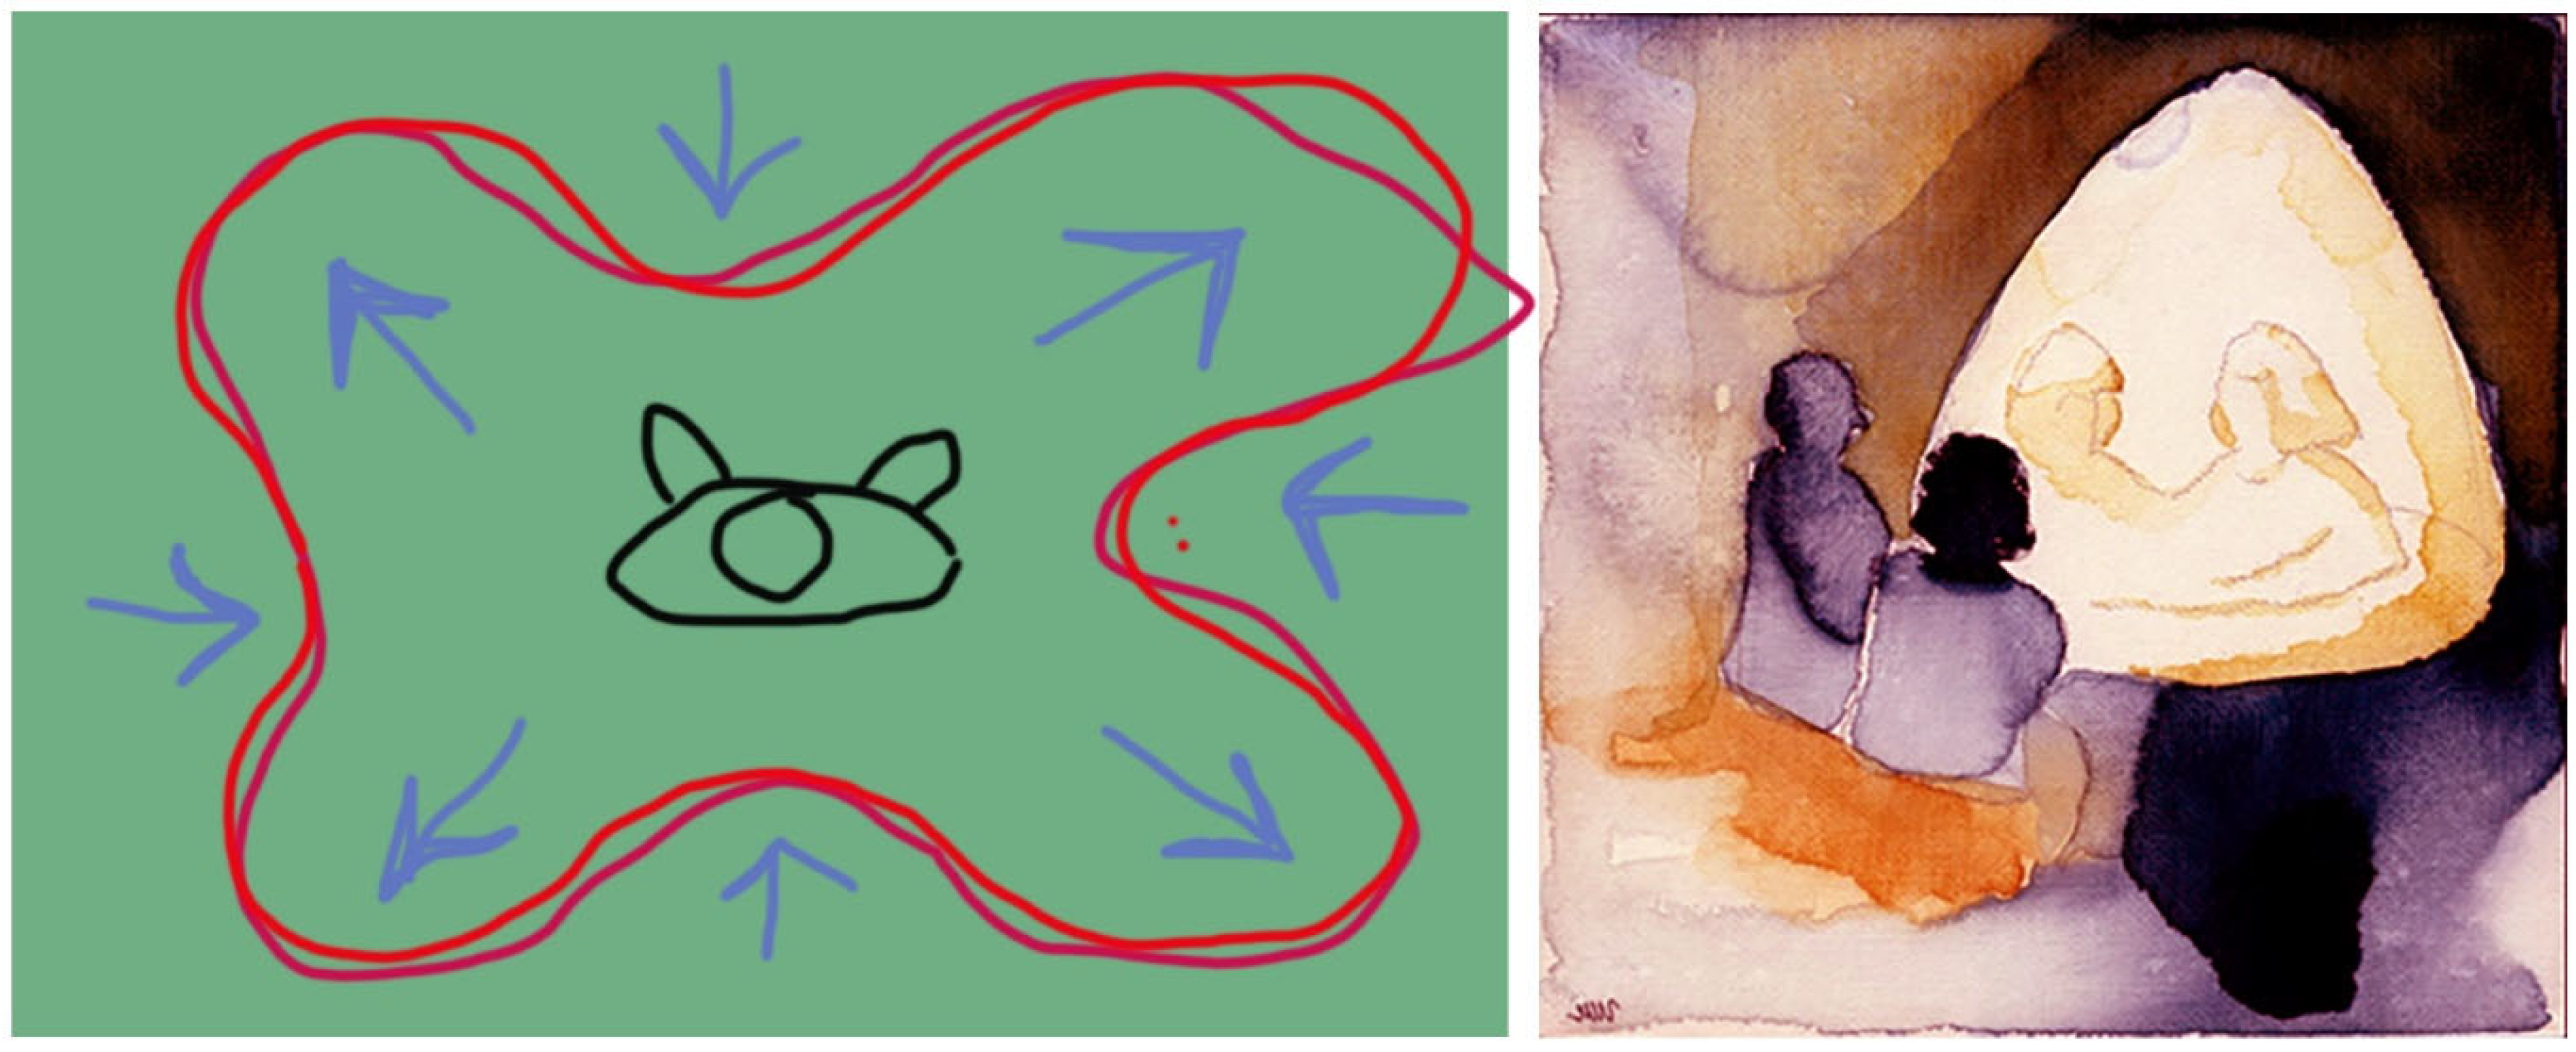
4.1. Sketches Exemplifying Spatial Concepts

The interpretation of the spatial concepts and the room belongs to the results in this methodological context. Table A1, Table A2 and Table A3 in Appendix A show examples of concept interpretations and how these relate to respective scenarios.
Note that the participants may have used the pen colours differently. Some used red for arrows, while others used blue; this difference is not of importance. They were instructed to use different colours for different aspects of the room. How each person interpreted the colours they used is recorded in the interviews.

4.2. Overview of Drawing Findings

The following section summarises the main findings concerning each scenario and for each spatial concept. The number in brackets shows how many participants sketched a specific scenario similarly, for example, as large (see Table 2).
Note that the same person may have sketched so that several possible concepts may suit each scenario, and several scenarios may fit one concept. The participants’ experienced rooms could extend the existing room boundaries or be much smaller than the physical room. Some scenarios were characterised by either outward- or inward-directed movements.
The drawings suggest that the bright Lecture Scenario exhibits an inward orientation and multiple rooms. Similarly, the dark Picture-Showing Scenario predominantly features an inward direction but is perceived as small. The brightest scenario, Auditory, with uplight, is depicted as expansive—large, centred, and aligned. The Mood Scenario is primarily inward-directed, neither distinctly small nor large, and tends to be perceived as lower rather than higher. The brightest scenario is frequently represented with its experienced space aligning with the built walls, highlighting the significance of brightness levels and contrast in defining spatial boundaries. Notably, scenarios without spotlights (Auditory and Mood) are generally perceived as centred (See Figure 8 and Figure 9).

4.3. Interview Quotations from the Drawing Moment

Below are two interview quotations that exemplify the difference in verbal skills between a professional observer and drawer compared to a non-professional. (The quotations were translated from Swedish to English by the researcher). The quotations also show how limited verbal descriptions can be when describing spatial issues. The drawings the two participants made, during the interviews cited below, are shown in Figure 10. When Participant No. 12 (Non-Pro) presented the Auditory Scenario, he was quickly able to respond as to whether he could draw the experienced boundaries for the light-room and the physical room; what he describes corresponds to the concept aligned:
Yes, it will be very easy. They will fill the room, both of them. … So actually, I’m lying a bit now. Actually, I should have pulled it [the line] over there because I… No, not so clearly. In such cases, it applies to the other one as well… I didn’t experience it clearly, I can say. I didn’t think about it before actually…Yes, there is no focus on anything here. Here, just as it is now, all places are equally good… Or important you could say…
The participants described that their opinion of what they regarded as the room changed during the session. In the beginning, they assessed most often the physical lit room, while they, during the session, turned their focus to regard the light-room as a room of its own. Instead of addressing the light scenarios as scenes, they shifted to talking about each scenario as one room. The light-room became more important than the real physical room.
The phenomenon “rooms within a room” was described by Participant No. 11 (Pro), who talked while sketching in the Lecture Scenario:
The room-room is not so important here, and not prominent either. The light-room receives a much more important, larger role here. It is clearer that it is a light-room, that this is the light-room, and there is also another light-room, more diffuse on the sides. There is a kind of tension between this light-room and the other, more subdued light-room. The experienced rooms are like two different rooms, in a sort of way.
Several examples of drawings by different professionals are presented in Appendix A Table A4. There appears to be a subtle tendency for trained drawers and observers to communicate their spatial experiences more clearly, both visually and verbally. They often find it easier to articulate spatial descriptions and their drawings may feature more precise lines and occasional annotations.
While this observation suggests a potential correlation between professional training and clarity of expression, it remains a preliminary finding. A larger-scale study would be necessary to confirm whether such differences are statistically significant and consistently attributable to professional background.
Figure 10. Potential professional differences in the drawings. Participant No. 12 (a non-professional, librarian) sketched the Auditory Scenario (left), while Participant No. 11 (a professional, industrial designer) sketched the Lecture Scenario (right). Interestingly, in this instance, the non-professional’s sketch appears clearer and more decisive than that of the professional. More comparisons between professions can be seen in Appendix A, Table A4.
Buildings 15 02278 g010

5. Discussion of Results

The results discussion section comprises primarily two aspects: the interpretation of the spatial concepts from the sketches and the professional differences.

5.1. Sketching Interpretation

The participants drew their interpreted light-space in a way that follows Branzell’s [40,41] own sketches, even though the participants had not seen them. They let the room bubbles go in and out of the physical borders, depending on the light situation. They also used arrows to illustrate directions in the room. Furthermore, they drew light-zones within the room as Madsen [37,38] describes them, without having much instruction to do it.
In the sketches, the Picture-Showing Scenario and the Mood Scenario are judged to be smaller than the others (the boundaries are drawn much smaller than the physical boundaries). Contrastingly, the Auditory Scenario was regarded as larger by all participants (the boundaries filled or even exceeded the physical boundaries). These patterns are clearer when viewing the images all together than when translating them into concepts one by one. These findings follow previous research by Flynn [5] showing that darkness usually has a shrinking effect and brightness enlarges perceived rooms. Additionally, Acking and Küller [43] found that opposite-positioned light-coloured walls had an enlarging effect compared to opposite dark-painted walls.
It is interesting to see that the results for the concept of small are much stronger than for large. A part of the reason might be the researcher’s interpretation; it is much easier to see if a participant draws a circle that is smaller than the physical walls, often clearly smaller, but it is more difficult to assess if boundaries that align with the physical walls means that the experienced room stops at the walls or expands as far out as possible. This has been interpreted based on how every participant drew their other images. When the participants drew experienced boundaries outside the underlay drawing, there is no doubt that it was experienced as large. The scenario for which the sketched boundaries align most with the physical walls is the Auditory Scenario.
Similarly, the sketching results for inwards are clearer than for outwards. In this case, the reason is probably not the interpretation itself, but rather the strong effect of the directed light pointing inwards in the Lecture and Picture-Showing Scenarios. Also, when a room feels small, as in the Mood Scenario, it is natural that the direction is experienced as more inward than outward. Furthermore, the pattern is not mirrored, so the scenario that scored highest for small did not score lowest for large.
In some cases, the same scenario inhibits contrasting concepts/sketched characteristics. This is the case in the Lecture Scenario; 10 participants drew it as inwardly directed, and four drew it as outwardly directed. The difference can be explained by these concepts, which address different aspects. Inwards in the Mood Scenario refers either to a direction towards the podium or a direction from the outside to the centre of the room. In the Picture-Showing Scenario, more participants said it was dark than small. But there are opinions supporting both aspects. This relates to whether they see darkness as shrinking the space so that the spatial boundaries surround just the area you can see closest to you—then, it is small. If, instead, the darkness creates an impression of vanishing boundaries, the room continues in eternity—then, it is large. This is explained through the interviews as detailed in previous publications [18,28]. Bright walls can both have an enlarging effect (most common) and a shrinking effect, depending on one’s focus. The enlargement effect occurs when the brightness, given surrounding contrasts, is so bright that the walls seem less material. This occurs in the Auditory Scenario, when the confining wall lighting makes the walls prominent but not overly lit, as contrasted with the Mood Scenario. The difference can be subtle and relates to the whole complex spatial context. This phenomenon is shown in Hesselgren’s et al. experiment, in which he increased the light level; first, the room became more restricted with the increased light level, but when the room became too bright, the spatial enclosedness decreased [47,48,49].
The height is also something that has been interpreted differently, and which is somewhat difficult to judge just from the sketches. Some participants address the height in the space created by the ceiling crown; the same height does not have to embrace the whole width of the space. Other participants refer to the general ceiling height in the room. The Lecture Scenario had spotlights directed from the ceiling, which can affect which area one refers to as high. Flynn and Mills [46] found that down-directed light with a narrow distribution made walls less prominent, yet indirect lighting, up in the ceiling, emphasized the ceiling. This is supported by Houser et al. [44], who found that indirect lighting gave a spacious impression while direct light decreased the perceived spatial size. That a bright ceiling increases a spacious impression is also supported by Oberfeld, Hecht, and Gamer [45]. The sketches were slightly unclear regarding the wide and narrow interpretations, which correspond to the ambiguity of the understanding of the room’s unusual shape, as it was wider than it was deep. A sketch was interpreted as narrow when it stretched from the podium to the bay window but did not include the sides of the room. When addressing the concepts, wide and narrow, this must be seen regarding the participants sitting, with the long sides of the room in front and back, when answering the questionnaire, but at the podium while sketching. During the session, participants could turn the drawing paper in any direction; in this article, we see them all from one side (See Appendix A, Table A1, Table A2, Table A3 and Table A4).

5.2. Professional Differences

Eight out of 16 participants were professional drawers since they work as architects, designers, or fine artists, yet everyone had an academic background. An initial presumption was that professional sketchers are more prone to draw multiple rooms in one drawing since this might need more empathy and insight. It was presumed that those with professions like architects and lighting designers should be more used to regarding spaces as rooms within a room, and to see several light-zones, as this is taught in architectural education. Surprisingly, no such difference was seen; most participants drew multiple light-zones. Surprisingly, only two participants did not draw multiple room bubbles, one of whom was a professional sketcher. There was also another initial presumption that professional sketchers may more often draw outside the boundaries of the built room since this may require less inhibition, but this was not the case. A third presumption relates to professional sketchers; it dealt with whether experienced sketchers would more loosely draw outside the built boundaries of the room. Also, this presumption was false since only four participants did not draw outside the built boundaries, and two were professional sketchers. This indicates that the method worked well for both categories, despite the participants’ previous drawing skills and spatial training. This follows what the sociologists Martikainen and Hakoköngäs [55] wrote about drawing being an inclusive method that fits diverse groups of people. The professional group expressed themselves more easily orally in the interviews than the non-professionals. This sketching may have neutralised professional differences. Since all participants had an academic background, they were somewhat accustomed to abstract thinking. A different group of individuals might have responded differently.
In the original study, a statistic analysis was conducted to examine differences between professional categories [28]. Histograms were generated for all scenarios; here for the Auditory Scenario, where the largest difference was observed (see Figure 11). In this histogram, all participants with training in drawing (four architects/interior architects, two of them also lighting designers, and four industrial designers) are labelled as “architects”. The data suggest that, in this context, architects tended to assign higher scale values, possibly due to greater confidence in spatial assessment. Notably, the most significant difference between professional groups concerned the concept of depth. During the interviews, non-professionals appeared to struggle more with understanding this concept and asked for clarification more frequently. Similar findings on different understanding of the depth-concept were seen in an exterior study as well [70,71]. More studies are needed to find out if it is the understanding of the concept as such which is crucial, or if it is the spatial understanding that differs most.

6. Discussions of Methods

It would have been hard to detect the spatial limits and to talk about them without the visual material through the sketches. Some patterns are clearer and easier to analyse; these relate to the concepts of low, inwards, small, and if the sketching boundaries “align with the whole physical space”. With words, it might be difficult to separate large from high and wide; a room can simultaneously be both. The sketches are less confusing on that point; it is just when they need to be translated into words that it becomes difficult again. The concepts interpreted to relate to the sketches were limited to a few words, to draw attention to the most prominent aspects, with the risk that some aspects were excluded.
The outcome of the drawing findings deals with the following:
  • What one experiences;
  • What one draws;
  • What the researcher interprets;
  • What the reader grasps;
  • The interpretation of the spatial aspects/bubbles and arrows.
Branzell’s [40,41,42] method with drawing room bubbles shows the experienced spatial boundaries and arrows symbolising the experienced spatial direction. Note that the direction of the space is not necessarily the same as the direction of the light. The directionality of a space can be created by other features, like the room’s shape, landmarks, furniture, et cetera. The Branzell method is designed for experiencing rooms within built rooms, not directly for light-spaces. However, this method works excellently for lighting design. One difficulty, though, is to determine what the participants should address and what they assess within their sketches: Were they drawing the experienced rooms, the light-rooms, or both? In what way did the researcher interpret them? For these cases, the questionnaire and the interviews are important complements. The study sessions started with questions to the participants, asking them to draw the experienced room with one colour and the light-room with another colour. However, after a few interviews with sketching, this seems counterproductive, the participants treated the light-room as the room. The light-room’s large impact on the other room characteristics overruled these. Several participants explained that the longer the time they spent in the room, the more the room they had to assess shifted from the experienced room to the light-room.
Naturally, other symbols could have been added; still, the simple bubble and the arrow were enough for this study. Regardless of the participants’ professional backgrounds, everyone knew how to draw them and what they stood for. The bubbles could be drawn differently, with one line or several; this did not affect the interpretation. Some drew one arrow, some several; this was more related to their experiences than their personality. Usually, this shifted in the scenarios drawn by each person.
The symbols used in the study relate to Powell’s [60] graphical representations of places in the form of scale: The bubbles differ in size and could be more or less directional; for scope, the translation of spatial features into symbols is essential; and the legend represents the connection to the character of the different scenarios.
In the description of Madsen’s [37,38] sketching method of light-zones with separated, interconnected, and overlapping light-zones, circles are used as symbols (see Figure 1). This gives information about the relations between light-zones, but not much about the light-zones themselves or their size, shape, and directions. For this, Branzell’s [40,41,42] irregular bubbles tell us more. Additionally, these can be used in the same way as the circles inspired by Madsen’s method, or they can be used as parallel analyses.
Martikainen and Hakokönkäs [55] describe how pictures can show people’s subconscious preunderstanding of power relations, an objectification they do not express in words. In this study, the opposite is true. It is verbally that the participants associate the room’s shifting atmosphere with earlier experiences, while their boundary drawings only show the experienced physical limitations. Their lines were not objected to anything more than spatial extension. This simplified drawing reduces the differences among professional belonging, age, and gender. The floor plan was sketched, not precise, and linearly drawn. The sketched underlay was intended to encourage the participants to add their lines to a drawing; the result does not have to be perfect.
Some participants did not draw multiple spaces/light-zones within the space. Still, there does not seem to be any difference between professional skilled sketchers and non-professionals regarding drawing spaces within the space or whether they drew experienced spatial boundaries that align with the physical walls. Those who did not draw multiple rooms/light-zones have related their bubble to the physical rooms’ walls. Some of the participants drew both experienced rooms within the rooms in addition to the light-room/s while others did not. Previous studies show that even if participants were asked to judge a room in different lighting or to judge the light within the room, the final results would be the same [12,13].
Theron [54] and Literat [66] raise the need for attention so that the researcher will not go too deep into the interpretations of a participant’s sketch, adding words into the participant’s mouth. The researcher always needs to make some interpretations; in this case, the three most prominent attributions in a sketch were translated into words, in some cases with a question mark when the meaning was not clear. Often, it was easy to see from a participant’s scenario sequence which scenario had the largest experienced light-room. When two scenario drawings showed that the room felt tall in several ways, it was harder to decide. It could be tall close to the chandelier, with indirect light, or in the whole centre of the room. Both were high. In that case, the interview gave guidance. The validity and reliability were strengthened when the participant had the opportunity to explain during the drawing session [56].
There is always a risk that participants behave differently in a study, compared to a normal situation (the experimental effect), related to the well-known Hawthorn effect [72]. In this case, they sat close to the researcher, who they knew was skilled in sketching. Still, this moment seemed to have worked well, no matter what their professional background. As Martikainen and Hakoköngäs [55] write, not all participants may be comfortable with drawing. Yet, in this study, no one hesitated to start drawing, and there were no hesitations from anyone in the moment. As suggested by several researchers, the participants were reassured that the quality of the sketching was not in focus [55,56]. The sketching method was simple enough. Some participants may have had concerns about the researcher’s architectural background; those not architects might wonder if they answered what was expected of them and may have adjusted their story according to this. Since several methods were included in the original study, both interviews, sketches, and a questionnaire, this should together reduce the risk of a possible researcher effect. Nevertheless, the sketching moment seemed to relax the participants during the interview and helped them to formulate their experiences into words.
Naturally, the presence of the researcher influences the participant—whether the researcher remains silent, speaks, or draws. Participants may wonder what is expected of them, both in terms of interpretation and drawing ability. During the sketching phase, the researcher emphasized that no drawing skills were required and that the quality of the drawings was not important. All participants were provided with the same brand of pens. If a participant hesitated, the researcher posed questions as neutrally as possible. When participants began drawing, they were asked to describe what they were drawing, how they were doing it, and why. Interview quotations were critically analysed using a reflective approach [73,74]. The fact that interviews were recorded may also have influenced participants, although this did not appear to inhibit anyone.
Several participants were known to the researcher—as colleagues or students—which introduces a potential for bias. This was a convenience sample. However, the study did not involve sensitive topics. The two student participants were not enrolled in any courses where they could benefit from the researcher’s assessment. In fact, the existing relationships may have facilitated more open discussions, allowing both participants and the researcher to express themselves more freely.
There is a risk that the researcher might place greater weight on data from professionals, but this was mitigated by triangulating the empirical material through multiple rounds of analysis.
The spatial context also played a significant role in shaping the results. Interview findings revealed that the powerful architecture of the municipal building influenced at least one scenario—the Mood Scenario. Although participants were not asked about their preferences, it became clear that opinions were divided: Half of the participants disliked the scenario, while the other half favoured it. Quotations revealed that those who appreciated it did so because they recognized the value of cozy lighting in an official setting. They were able to perceive the room independently of its institutional context. In contrast, those who disliked the Mood Scenario could not separate it from its surroundings and found it confusing [28].

7. Conclusions

This section answers the initial research questions (Q1–Q5) from Section 1 (Introduction).

7.1. How Can We Analyse and Make Conclusions About These Spatial Drawings?

The present study shows how drawings can illustrate experiences of an illuminated room’s extension, spaciousness, direction, and shape. Not all people drew this in the same way, yet they drew in similar ways, which are still rather easy to interpret. Some people may mark a space experienced as small with a smaller room circle, while other people show that it is small by using arrows that point inwards or outwards to illustrate a spacious room. Just as people answer semantic scales in different manners, close to the middle or in outer positions, some people drew with big strokes, while others drew more carefully. Therefore, it is important to interpret not only several drawers together, but also each drawer individually.

7.2. How Can Drawings Support Other Methods?

We need methods that grasp the complexity of a space [13,16,17]. Every methodological approach in this original study needs another approach to interpret or explain the findings. The statistics are not enough without the interviews, describing why. The interviews would be difficult to understand without the drawings telling how and where. It is easier to explain directions if one can also show them visually. Yet, the drawings also need guidance from the maker. The drawings show the participant’s inner experience more than the questionnaire does, while the interview quotations are descriptive enough to be directly interpreted by the researcher. The sketching moment opens the conversation, facilitating the interview. All parts strengthen each other.
Nevertheless, using participants’ drawings provides a quick overview of their experience, which raises questions for both the researcher and the participant. A better basis for starting an interview is hard to find. The participant is urged to explain, and the researcher follows him/her in the moment.

7.3. Do the Drawings Need to Be Explained with Words?

Sketching must be accompanied by verbal or written explanations, such as those provided during interviews [53,54], to ensure that the respondent’s own experiences are captured, rather than the researcher’s interpretation of them [66]. Verbal descriptions are particularly important because each participant uses their own internal scale when drawing.
This variation is also evident in responses to the semantic scale: Some participants placed their answers near the midpoint, while others chose values at the extremes. Similarly, some drawings depicted spatial boundaries that stopped within the physical walls, while others extended almost beyond the edges of the paper. Some participants omitted corners entirely, representing space as a rounded “bubble,” whereas others produced more precise and structured sketches. Respondents’ verbal descriptions are necessary for not over-interpreting the drawings.

7.4. How Can We Use the Findings from the Drawings?

The Drawing Experienced Space method can be applied in research, education, and professional practice. While it was originally developed for lighting studies, its use is not limited to that context. It can be employed in studies of architecture, room colour, furnishing, or even the spatial distribution of people within a room. The method is also adaptable to outdoor environments, such as public parks and squares.
Primarily, this method serves as a tool for deeper exploration rather than for use in every design project. However, it can be valuable for architects and designers during the early stages of a project or when evaluating completed work. In such cases, it may be used in collaboration with building users, as part of a participatory design approach. For example, architects may involve staff members in the design process, drawing on their firsthand knowledge of the space.
Importantly, the method does not require multiple lighting scenarios. It can be used to compare different user groups, furniture arrangements, or, in outdoor settings, different weather or lighting conditions—such as day versus night, or sunny versus rainy weather.
This method is particularly useful in complex environments where personal space and spatial relationships are critical, such as open-plan offices, hospital wards, or refugee camps, where many people share limited space for extended periods. Several light-zones in a larger office landscape could hypothetically reduce the impression of spaciousness and create zones of privacy. With brightness, a cramped and low room can be experienced as larger. It can also be applied to public squares that are perceived as unwelcoming or unsafe, helping to identify spatial qualities that contribute to those perceptions.
This simple method of noting spatial experience through sketches can also be used in other contexts, for example, for describing the subjectively experienced thermal room climate, with wind directions and warm and cold zones in the room. Another field can be visual management, in which lighting can facilitate the visual guidance of large building complexes and urban planning. Working intentionally with light distribution has lots of benefits. For lighting designers, it is important to know if people experience environments as intended. It is possible to work consciously with light-rooms and light-zones for nudging social behaviour, like inspiring focus in a meeting room or to stimulate relaxation and self-disclosure in a therapy room or an interrogation situation. Light-zones can also be planned consciously for visual guidance. In a classroom, the light distribution and directionality, together with the light level, can potentially make people listen or speak up. This is indicated in the previous study [28].
This can be a sustainable way to modify the built room’s perceived proportions with a limited budget and little added energy. It is more about rearranging the lighting than adding more luminaires.

7.5. Does the Method Work Better for Professional Sketchers than Non-Professionals?

The sketching process, as such, worked well for professional sketchers as well as non-professionals; no specific differences were seen between the two groups’ drawings. However, differences were seen when they answered the questionnaire with semantic scales and in the interviews. The non-professionals had difficulties in understanding the concepts of depth and delimitation [28]. The non-professionals had more difficulties expressing their spatial experiences in words than the trained group of architects and designers. That sketching opens up and makes people talk is supported by previous research [53,54]. In this aspect, sketching as a method seems to neutralise professional differences.

7.6. Practical Considerations for Applying the Drawing Experienced Space Method

It is not necessary to use all methodological steps described in this article—such as the semantic questionnaire with statistical analysis. However, it is recommended to begin with a written task to help participants feel comfortable and allow them to explore the environment without interruption from the researcher. In lighting research, it is essential to allow time for participants to adapt to the light or darkness levels before beginning the task.
Free-form written descriptions of each scenario proved to be a valuable warm-up exercise and they later served as rich sources for quotations. While the semantic scales in the questionnaire had analytical value, they were even more useful as guides for the interviews. These scales helped focus participants on the topic and provided a natural starting point for follow-up questions. If the drawing activity follows the interview, it creates a logical and intuitive sequence. The researcher can then ask participants to annotate or draw on the paper—indicating, for example, where a phenomenon is located, how it is shaped, whether it has a specific direction, and how large it appears. Decisions should be made in advance regarding the use of different colours for different elements, and whether participants should remain in one spot or be allowed to move around the room.
The participant’s verbal description is crucial for analysis, so the sketching session should be recorded. The researcher might ask clarifying questions such as the following:
“I see you drew a line here—can you describe your thinking, especially since it differs from what you drew over there?”
Using a simplified base drawing can be helpful. If the template is not overly polished, participants may feel less intimidated about adding their own contributions, reducing the fear of “ruining” a blank page or a construction drawing.
During analysis, it is important to alternate between examining individual sketches and analysing patterns at the group level. For individual analysis, verbal descriptions are especially important. At the group level, the focus shifts to identifying recurring patterns. In the final stage, all perspectives should be triangulated—integrating individual analyses, group-level findings, visual material, and both verbal and written data.
In this study, only one participant was present in the room at a time. However, the method can be adapted for focus groups of up to 10 participants. In such settings, all drawings can be displayed on a wall for collective discussion, similar to critique sessions in design education.

Funding

This research received no external funding.

Data Availability Statement

The raw data supporting the conclusions of this article will be made available by the author on request.

Acknowledgments

Thanks to all drawing participants. Dear colleagues, thanks for proofreading and encouragement. Thanks to Monica Billger, for advice on the previous article, which this current research is based on.

Conflicts of Interest

The author declares no conflicts of interest.

Appendix A. Patterns for Spatial Concepts

Table A1. Patterns of spatial concepts: inwards, outwards, small, and large. The numbers in the right column indicate how frequently each concept appeared in the scenarios and which participant included it in their drawing.
ConceptsExplanationPicture ExampleScenarios with Participant No.
InwardsArrows are pointing inwards, towards the podium.
The figure shows the Lecture scenario, of Participant No. 4.
Buildings 15 02278 i001
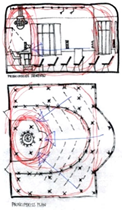
Lecture: 3, 4, 5, 6, 8,12, 13,14,15, 17, 18,19 and 21.
Picture: 3, 4, 5, 6, 8, 12, 13, 14, 17, 18, 19, 20 and 21.
Auditory: 3, 12 13, 17 and 21.
Mood: 1, 8, 11, 13, 17, 18, 19 and 20.
OutwardsArrows are pointing from the room centre outwards in the plan view.
The figure shows the Auditory scenario, of Participant No. 18.
Buildings 15 02278 i002Lecture: 3, 5, 6, 19 and 20.
Picture: 4 and 20.
Auditory: 8, 11, 15, 17, 18, 19 and 21.
Mood: 3, 4, 5,15 and 20.
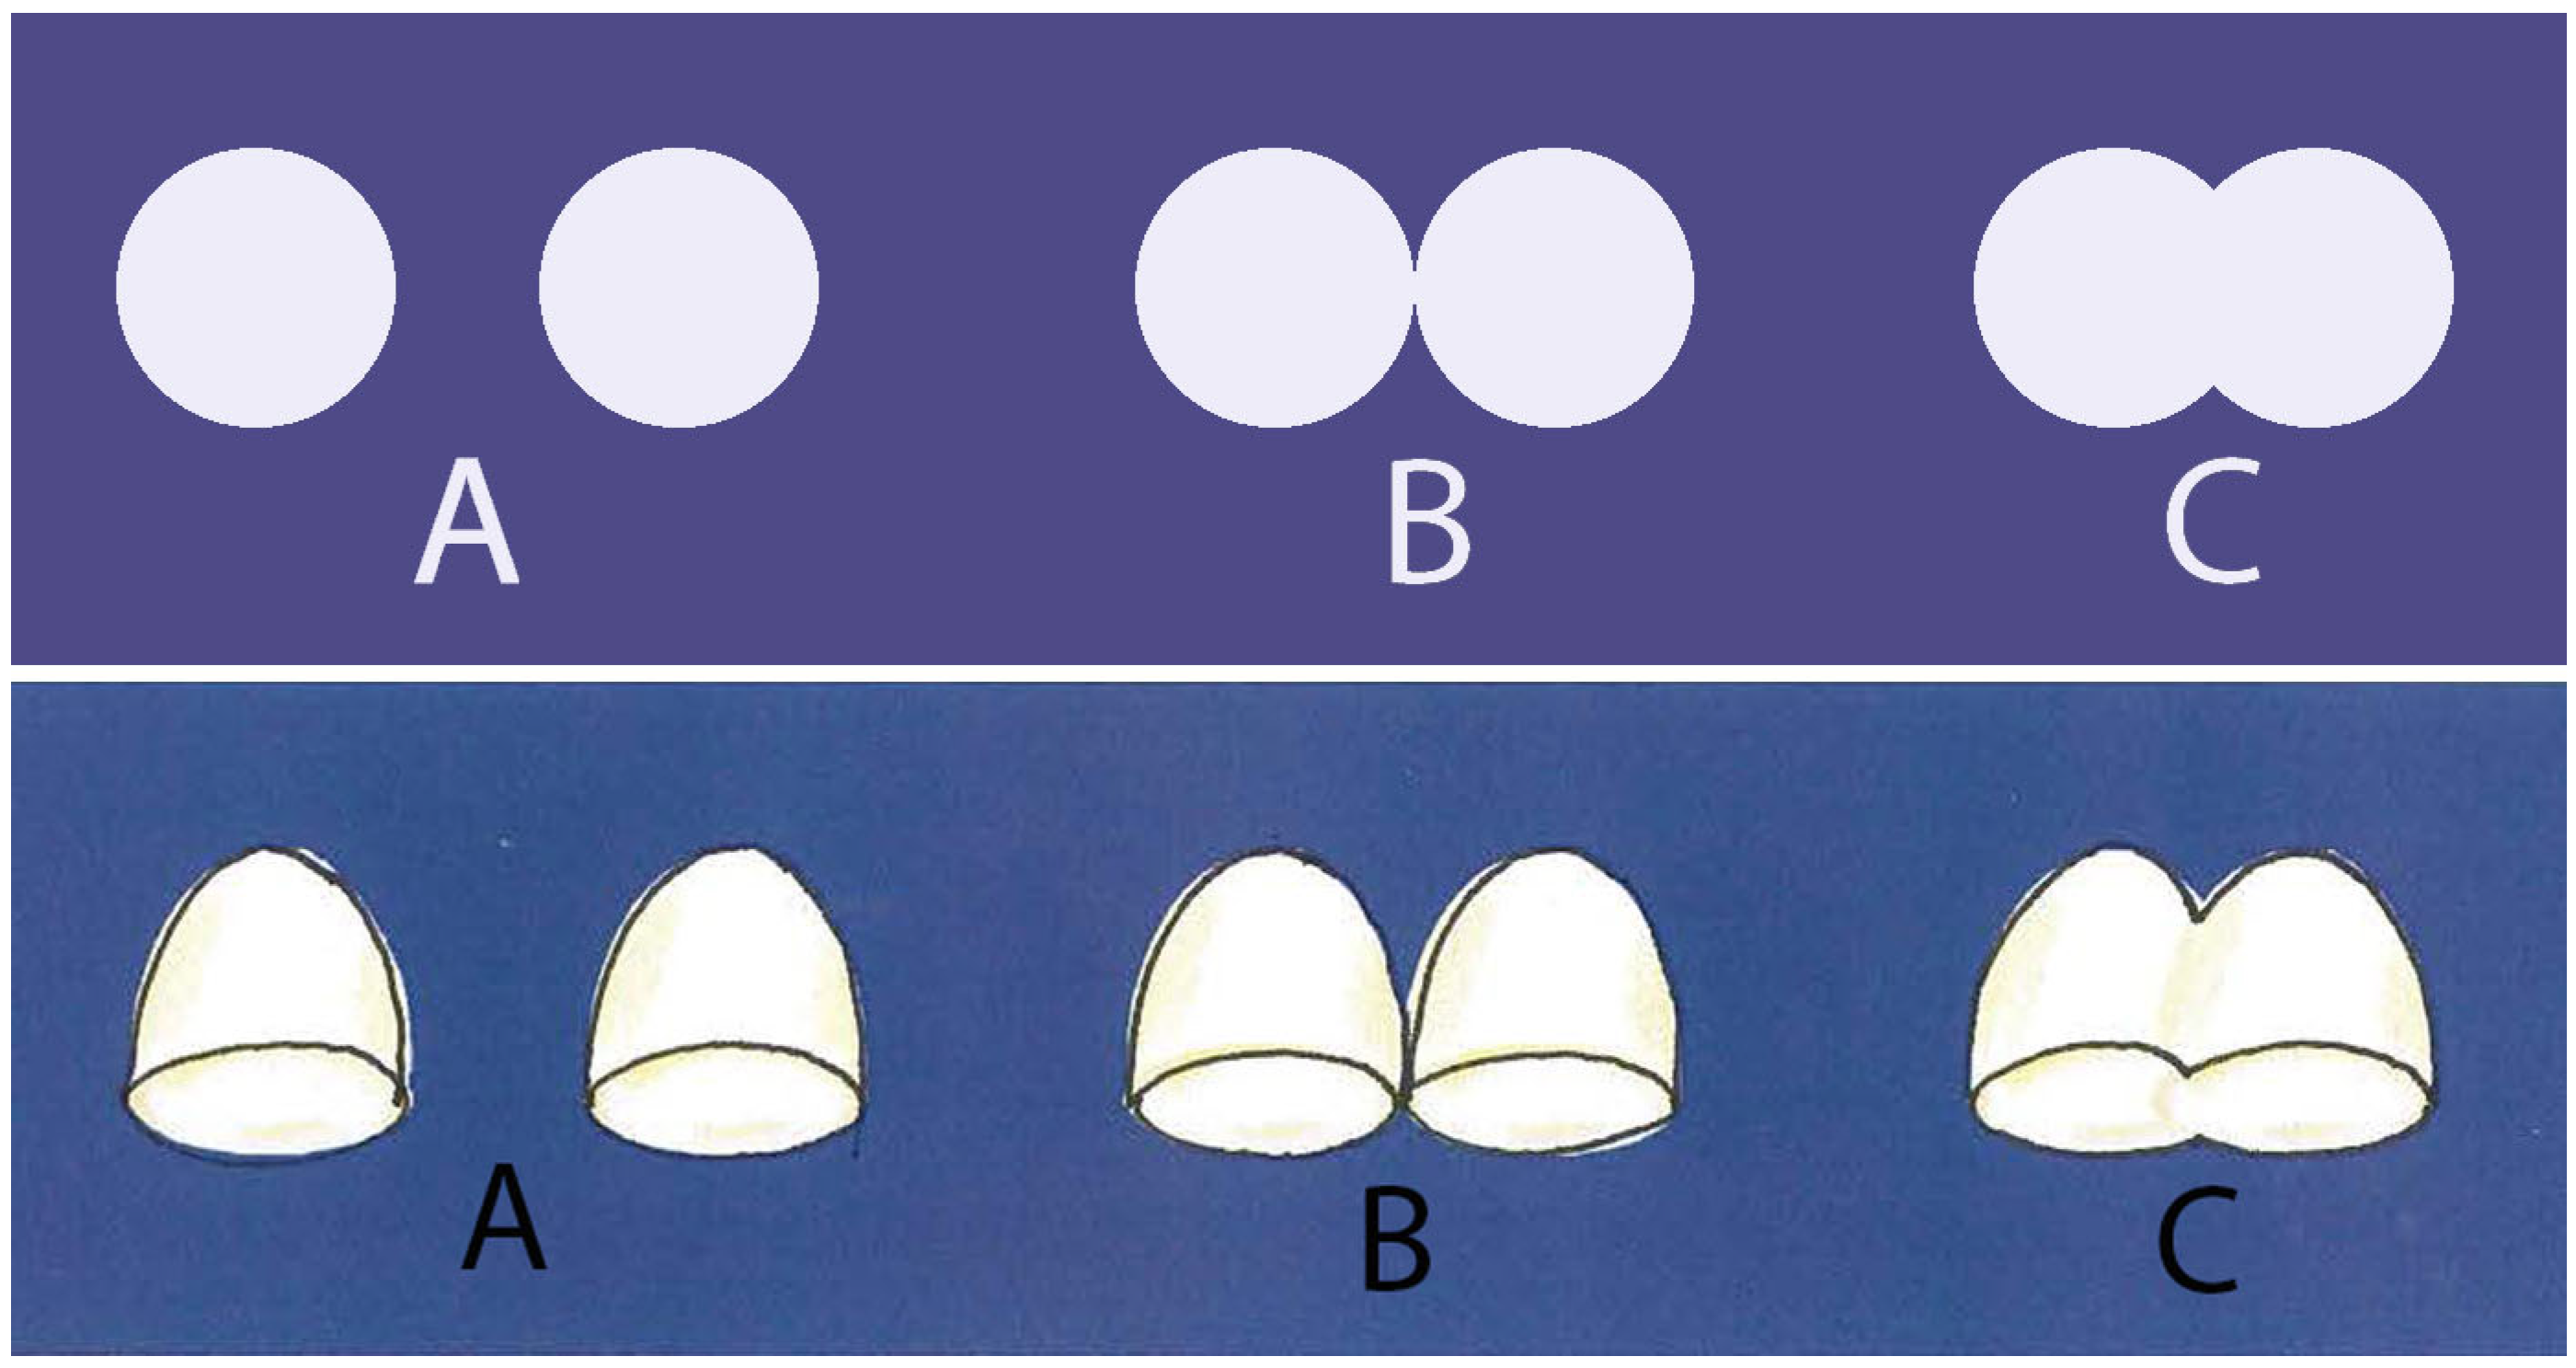
SmallA smaller space (circle) is drawn inside the room, with a distinctly smaller size than the built room size. Also, participants’ other drawings matter for comparing the assessment of size.
The figure shows the Picture scenario, of Participant No. 5.
Buildings 15 02278 i003
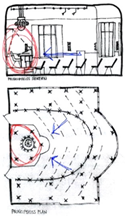
Lecture: 5, 8, 12, 14, 15, 17, 18 and 20.
Picture: 1, 3, 5, 6, 8, 11, 12, 14, 15, 19 and 21.
Auditory: -
Mood: 1, 6, 14, 18 and 21.
LargeThe experienced room bubble expands beyond or fills up the whole built room.
Also, participants’ other drawings matter for comparing the assessment of size. The figure shows the Mood scenario of Participant No. 12.
Buildings 15 02278 i004Lecture: -
Picture: 3, 12, 13, 15, 17 and 20.
Auditory: 4, 5, 6, 14, 15, 17, 18, 19 and 21.
Mood: 4, 5, 6, 12 and 20.
Table A2. Patterns of spatial concepts: wide, high, and low. The numbers in the right column indicate how frequently each concept appeared in the scenarios and which participant included it in their drawing.
ConceptsExplanationPicture ExampleScenarios with Participant No.
WideArrows are pointing outwards, in the widest room dimensions. Often the room bubble follows this direction. This pattern is also marked as outward.
The figure shows the Lecture scenario, of Participant No. 3.
Buildings 15 02278 i005Lecture: 3
Picture: -
Auditory: -
Mood: 3, 5 and 20.
HighHeight is shown on the section drawing either by the bubble’s shape drawn up and, or above the ceiling with a clear difference to other drawings, or height is shown through arrows pointing upwards.
The figure shows the Auditory scenario, Participant No. 12.
Buildings 15 02278 i006Lecture: 1, 4, 17 and 19.
Picture: 4, 12 and 15.
Auditory: 3, 6, 12, 15 and 19,
Mood: 6, 11 and 17.
LowA low-height experience is either shown by a lower room bubble in the section drawing and/or is shown by arrows pointing downwards.
The figure shows the Mood scenario of Participant No. 5.
Buildings 15 02278 i007
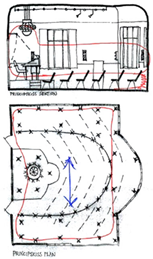
Lecture: -
Picture: 15 and 19.
Auditory: -
Mood: 1, 5, 15 and 19.
Table A3. Patterns of spatial concepts: centred, aligned, and rooms within. The numbers in the right column indicate how frequently each concept appeared in the scenarios and which participant included it in their drawing.
ConceptsExplanationPicture ExampleScenarios with Participant No.
CentredA room bubble is centred in the room. The figure shows the Auditory scenario, of Participant No. 5.Buildings 15 02278 i008Lecture: -
Picture: 20.
Auditory: 5, 6. 12, 13, 17, 18 and 20.
Mood: 1, 4, 14 and 17.
AlignedThe experienced room extension fills the room and coincides with the built walls. Some participants exclude the bay window. Therefore, the experienced room is more angular.
The figure shows the Auditory scenario, of Participant No.14.
Buildings 15 02278 i009
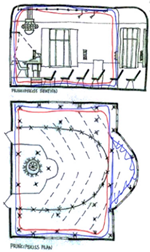
Lecture: 21.
Picture: -
Auditory: 1, 4, 5, 8, 12, 13, 14, 18 and 21.
Mood: -
Rooms within a roomSeveral participants draw “room bubbles” inside, freestanding from the physically built room.
The figure shows the Auditory scenario, Participant No.11.
Buildings 15 02278 i010Lecture: 4, 6, 8, 11, 13, 14, 15, 17, 18 and 19.
Picture: 1, 6, 11, 12, 13, 15, 17 and 19.
Auditory: 6, 11 and 12.
Mood: 6, 8, 11, 13, 17, 18 and 19.
Table A4. These sequences of sketches are chosen because they most clearly and consistently show the differences between the scenarios. Participants no. 4–5 are professionally-trained drawers, while participants no. 6 and 12 are non-professionals.
ScenarioLecturePictureAuditoryMood
Participant 4
Professional drawer
Buildings 15 02278 i011Buildings 15 02278 i012Buildings 15 02278 i013Buildings 15 02278 i014
Participant 5
Professional drawer
Buildings 15 02278 i015Buildings 15 02278 i016Buildings 15 02278 i017Buildings 15 02278 i018
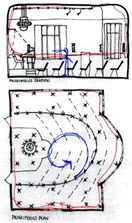
Participant 6
Non-professional drawer
Buildings 15 02278 i019Buildings 15 02278 i020Buildings 15 02278 i021Buildings 15 02278 i022
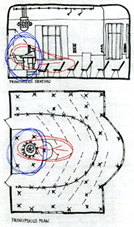
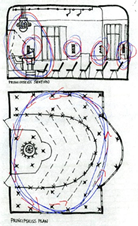
Participant 12 Non-professional drawerBuildings 15 02278 i023Buildings 15 02278 i024Buildings 15 02278 i025Buildings 15 02278 i026

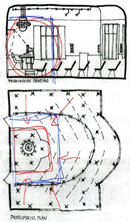
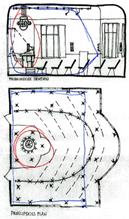
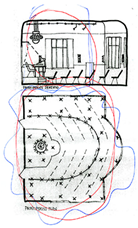
Appendix B. Comparison with Statistical Data

A statistical summary from the previous study, based on the questionnaire using semantic scales [28], is compared here with findings from the sketching activity. The spatial concepts of high/low, wide/tight, and large/small were present in both the questionnaire and the interviews, including during the sketching phase. Questions that were not relevant to the drawing task have been omitted from this comparison.
Notably, the drawing exercise also revealed additional spatial concepts that were not included in the original questionnaire. These included centred, aligned, inward-directed, and outward-directed, suggesting that the sketching method may elicit more nuanced or emergent spatial perceptions that are not easily captured through predefined scales.
Figure A1. The questionnaire results are based on the previous study [28]. The Y-scale shows the assessment of 0–3 by the 16 participants. (Each participant is symbolised by different colours, but the colours are not coded).
Buildings 15 02278 g0a1
It became evident that certain spatial aspects were more prominently expressed in the sketches than others. One notable example is the perception of height: Participants tended to perceive the room as taller when it was fully illuminated, particularly with lighting focused on the ceiling. This observation aligns with the statistical findings. The data showed that the brightest scenario—the Auditory Scenario, which featured the most uplight—was rated as the highest, while the darkest scenario—the Picture Scenario—was perceived as the lowest.
Interestingly, the Picture Scenario, despite being the darkest, was also assessed as the largest and widest. In contrast, the Lecture Scenario was perceived as the smallest. These findings suggest that darkness may have had a stronger influence on the perception of spatial largeness than brightness did. In Table A2, the Lecture Scenario was rated somewhat differently in terms of height when comparing the questionnaire results to the sketch-based assessments. However, aside from the Auditory Scenario, the differences between methods were relatively minor.
There were consistent patterns across methods: The two darkest scenarios (Picture and Lecture) were generally perceived as lower, while the brighter scenarios (Auditory and Mood) were considered higher. However, the perceived height differences were more pronounced in the questionnaire data than in the drawings. A slight discrepancy was also noted in the size assessments: The drawings suggested that the Lecture Scenario was slightly smaller than the Picture Scenario, whereas the statistical data indicated the opposite. This may reflect the fact that size is often easier to express using numerical scales and verbal descriptions than through drawings.
Interview data further revealed a split in how participants interpreted the darkest scenario (Figure 8). Half of the participants described it as expansive, with indistinct boundaries that allowed the room to feel as though it extended indefinitely. The other half, however, felt that the darkness reduced the perceived space, limiting it to only what was visible [28]. Most scenarios in this study were characterized by similar spatial concepts, reflecting the inherent architectural qualities of the room, which was physically large, wide, and high.
Some spatial concepts—such as inward-directed and outward-directed—were not included in the questionnaire but became more apparent in the drawings. Similarly, the theme of a room within a room was not part of the questionnaire, as it required further explanation and was better suited to exploration through drawing and interview dialogue.
Note on Participant and Scenario Selection. In the original study [28], 21 participants evaluated a total of five lighting scenarios. However, in this article, five participants (Nos. 2, 7, 9, 10, and 16) and one scenario were excluded due to a slight variation in two of the lighting setups—specifically, the addition of a spotlight—which rendered the corresponding sketches not fully comparable with the others. As a result, the findings presented in this manuscript are based on data from 16 participants and four scenarios. Importantly, the lighting characteristics of the excluded Display Scenario (the fifth variation) are not unique and are adequately represented by the remaining scenarios.

References

  1. Boyce, P. Editorial: The Divorce of the Art and Science of Lighting. Light. Res. Technol. 2017, 49, 671. [Google Scholar] [CrossRef]
  2. Kelly, K. A Different Type of Lighting Research—A Qualitative Methodology. Light. Res. Technol. 2017, 49, 933–942. [Google Scholar] [CrossRef]
  3. Boyce, P. Lighting Research for Interiors: The Beginning of the End or the End of the Beginning. Light. Res. Technol. 2004, 36, 283–294. [Google Scholar] [CrossRef]
  4. Mansfield, K.P. Architectural lighting design: A research review over 50 years. Light. Res. Technol. 2018, 50, 80–97. [Google Scholar] [CrossRef]
  5. Flynn, J.E.; Spencer, T.J.; Martyniuk, O.; Hendrick, C. Interim Study of Procedures for Investigating the Effect of Light on Impression and Behavior. J. Illum. Eng. Soc. 1973, 3, 87–94. [Google Scholar] [CrossRef]
  6. Kelly, R. Lighting as an Integral Part of Architecture. Coll. Art J. 1952, 12, 24–30. [Google Scholar] [CrossRef]
  7. Taylor, L.; Socov, E. The movement of people toward lights. J. Illum. Eng. Soc. 1974, 3, 237–241. [Google Scholar] [CrossRef]
  8. Calvillo Cortés, A.B.; Falcón Morales, L.E. Emotions and the Urban Lighting Environment: A Cross-Cultural Comparison. SAGE Open 2016, 6, 1–8. [Google Scholar] [CrossRef]
  9. Billger, M. Rummet som färgernas mötesplats. In Forskare Och Praktiker Om Färg, Ljus, Rum; Fridell Anter, K., Ed.; Formas: Stockholm, Sweden, 2006. [Google Scholar]
  10. Billger, M. Colour in Enclosed Space: Observation of Colour Phenomena and Development of Methods for Identification of Colour Appearance in Rooms. Doctoral Dissertation, Chalmers University of Technology, Gothenburg, Sweden, 1999. [Google Scholar]
  11. Kronqvist, A. Lighting Design in Computerised Offices. Doctoral Dissertation, Chalmers University of Technology, Department of Architecture, Gothenburg, Sweden, 2012. [Google Scholar]
  12. Boyce, P. Human Factors in Lighting, 1st ed.; Applied Science Publishers Ltd.: Essex, UK, 1981. [Google Scholar]
  13. Boyce, P. Human Factors in Lighting, 2nd ed.; Taylor & Francis: London, UK, 2003. [Google Scholar]
  14. Schielke, T. The Language of Lighting: Applying Semiotics in the Evaluation of Lighting Design. Leukos 2019, 15, 227–248. [Google Scholar] [CrossRef]
  15. Dugar, A.M. The role of poetics in architectural lighting design. Light. Res. Technol. 2018, 50, 253–265. [Google Scholar] [CrossRef]
  16. Fridell Anter, K.; Billger, M. Colour research with architectural relevance: How can different approaches gain from each other? Color Res. Appl. 2010, 35, 145–152. [Google Scholar] [CrossRef]
  17. Veitch, J.A. Psychological processes influencing lighting quality. J. Illum. Eng. Soc. 2001, 30, 124–140. [Google Scholar] [CrossRef]
  18. Wänström Lindh, U. Light Shapes Spaces: Experiences of Distribution of Light and Visual Spatial Boundaries. Doctoral Dissertation, University of Gothenburg Art Monitor, Gothenburg, Sweden, 2012. [Google Scholar]
  19. Häggström, C. Förhållandet mellan forskning och konstnärligt arbete—Om skissande som metod. Nord. J. Archit. Res. 1997, 4, 7–20. [Google Scholar]
  20. Molander, B. Kunskap i Handling; Bokförlaget Daidalos: Gothenburg, Sweden, 1996. [Google Scholar]
  21. Schön, D.A. The Reflective Practitioner; Ashgate Publishing Limited: Farnham, UK, 1983. [Google Scholar]
  22. Skipetari, A.; Nijhuis, S. Drawing in architectural lighting design. Magazine for Professional Lighting Design no. 80/81 Dec 2011/Jan 2012. pp. 42–45. Available online: https://www.researchgate.net/publication/287331755_Drawing_in_architectural_lighting_design (accessed on 23 June 2025).
  23. Lyon, P. Using Drawing in Visual Research: Materializing the Invisible. In The SAGE Handbook of Visual Research Methods; Sage Publications: Thousand Oaks, CA, USA, 2020. [Google Scholar]
  24. Wänström Lindh, U.; Jägerbrand, A.K. Perceived Lighting Uniformity on Pedestrian Roads: From an Architectural Perspective. Energies 2021, 14, 3647. [Google Scholar] [CrossRef]
  25. Heath, S.; Chapman, L.; The Morgan Centre Sketchers. Observational Sketching as method. Int. J. Soc. Res. Methodol. 2018, 21, 713–728. [Google Scholar] [CrossRef]
  26. Shimazaki, H. Sketching as a Research Tool for Understanding Sacred Places. Int. Res. Cent. Jpn. Stud. 2001, 2001, 245–267. [Google Scholar]
  27. Pihlajaniemi, H.; Luusua, A.; Teirilä, M.; Österlund, T.; Tanska, T. Experiencing Participatory and Communicative Urban Lighting through LightStories. In Proceedings of the MAB‘12: Proceedings of the Media Architecture Biennale Conference: Participation, Aarhus University, Aarhus, Denmark, 15–17 November 2012; pp. 65–74. [Google Scholar]
  28. Wänström Lindh, U.; Billger, M.; Aries, M. Experience of Spaciousness and Enclosure: Distribution of Light in Spatial Complexity. J. Sustain. Des. Appl. Res. 2020, 8, 33–48. [Google Scholar] [CrossRef]
  29. Durak, A.; Camgöz Olguntürk, N.; Yener, C.; Güvenç, D.; Gürçinar, Y. Impact of Lighting Arrangements and Illuminances on Different Impressions of the Room. Build. Environ. 2007, 42, 3476–3482. [Google Scholar] [CrossRef]
  30. Brent Prozman, J.; Houser, K.W. On the Relationship Between Object Modeling and the Subjective Response. Leukos 2005, 2, 13–28. [Google Scholar] [CrossRef]
  31. Baird, J.C.; Cassidy, B.; Kurr, J. Room preference as a function of architectural features and user activities. J. Appl. Psychol. 1978, 63, 719–727. [Google Scholar] [CrossRef]
  32. von Castell, C.; Oberfeld, D.; Hecht, H. The Effect of Furnishing on Perceived Spatial Dimensions and Spaciousness of Interior Space. PLoS ONE 2014, 9, e113267. [Google Scholar] [CrossRef]
  33. Bokharaei, S.; Nasar, J.L. Perceived Spaciousness and Preference in Sequential Experience. Hum. Factors 2016, 58, 1069–1081. [Google Scholar] [CrossRef]
  34. Arnkil, H.; Fridell Anter, K.; Klarén, U. Colour and Light: Concepts and Confusions; Aalto University Publication Series: Helsinki, Finland, 2012. [Google Scholar]
  35. Matusiak, B.; Fridell Anter, K.; Arnkil, H.; Klarén, U. PERCIFAL Method in Use: Visual Evaluation of Three Spaces. In Proceedings of the AIC Midterm Meeting, Interaction of Colour & Light in the Arts and Sciences, Zürich, Switzerland, 7–10 June 2011. [Google Scholar]
  36. Arnkil, H.; Fridell Anter, K.; Klarén, U.; Matusiak, B. PERCIFAL: Visual Analysis of Space, Light and Colour. In Proceedings of the AIC Midterm Meeting, Interaction of Colour & Light in the Arts and Science, Zürich, Switzerland, 7–10 June 2011. [Google Scholar]
  37. Madsen, M. Light-Zone(s): As Concept and Tool. An Architectural Approach to the Assessment of Spatial and Form-Giving Characteristics of Daylight. In Proceedings of the ARCC/EAAE International Research Conference, Philadelphia, PA, USA, 30 June 2006; p. 11. [Google Scholar]
  38. Madsen, M. Lysrum-Som Begreb Og Redskab. Doctoral Dissertation, Kunstakademiets Arkitekturskole, Copenhagen, Denmark, 2004. [Google Scholar]
  39. Wänström Lindh, U.; Billger, M. Light Distribution and Perceived Spaciousness: Light Patterns in Scale Models. Sustainability 2021, 13, 12424. [Google Scholar] [CrossRef]
  40. Branzell, A. Något Om … Liten Skissbok Om Det Upplevda Rummet; Rundqvists Boktryckeri: Göteborg, Sweden, 1995. [Google Scholar]
  41. Branzell, A. Management of sequential space experiences. In Proceedings of the Future of Endoscopy, Proceedings of the 2nd European Architectural Endoscopy Association Conference, Vienna, Austria, 30 August–1 September 1995; p. 20. [Google Scholar]
  42. Branzell, A. Att Notera Rumsupplevelser; Statens råd för byggnadsforskning: Stockholm, Sweden, 1976. [Google Scholar]
  43. Acking, C.-A.; Küller, R. Volymupplevelser i Rum: Inledande Studier; Arbetsrapport 1; Tekniska högskolan i Lund: Lund, Sweden, 1966. [Google Scholar]
  44. Houser, K.W.; Tiller, D.K.; Bernecker, C.A.; Mistrick, R.G. The Subjective Response to Linear Flourescent Direct/Indirect Lighting Systems. Light. Res. Technol. 2002, 34, 243–260. [Google Scholar] [CrossRef]
  45. Oberfeld, D.; Hecht, H.; Gamer, M. Surface Lightness Influences Perceived Height. Q. J. Exp. Psychol. 2010, 63, 1999–2011. [Google Scholar] [CrossRef] [PubMed]
  46. Flynn, J.E.; Mills, S.M. Architectural Lighting Graphic’s; Reinhold Publishing Corporation: New York, NY, USA, 1962. [Google Scholar]
  47. Hesselgren, S. Man’s Perception of Man-Made Environment; Studentlitteratur: Lund, Sweden, 1975. [Google Scholar]
  48. Hesselgren, S. The Language of Architecture; Studentlitteratur: Lund, Sweden, 1969; Volumes 1 and 2. [Google Scholar]
  49. Dalkvist, J.; Gärling, T. Visually Apparent Restricted Space as a Function of Number of Screens and Brightness Level Delineating an Empty Space. In Experimental Studies of Architectural Perception; Hesselgren, S., Ed.; National Swedish Building Research: Stockholm, Sweden, 1971; Document D2. [Google Scholar]
  50. James, F. “Sketch and Talk”—Drawing Lines Between Humans, the Interior and Stuff. Design Methodologies for Well-Being in Prisons, Forensic Psychiatric Hospitals, and Special Residential Youth Homes. Doctoral Dissertation, University of Gothenburg Gothenburg Art-Monitor, Göteborg, Sweden, 2023. [Google Scholar]
  51. Causey, A. Drawing flies: Artwork in the field. Crit. Arts 2012, 26, 162–174. [Google Scholar] [CrossRef]
  52. Berger, J. Drawn to That Moment. New Soc. 1976, 37, 81–82. [Google Scholar]
  53. Zweifel, C.; Van Wezemael, J. Drawing as a Qualitative Research Tool: An Approach to Field Work from a Social Complexity Perspective. Tracey J./Draw. Knowl. 2012, 5, 1–16. [Google Scholar]
  54. Theron, L.; Mitchell, C.; Smith, A.; Stuart, J. Picturing Research: Drawing as Visual Methodology; Sense Publishers: Rotterdam, The Netherlands, 2011. [Google Scholar]
  55. Martikainen, J.; Hakoköngäs, E. Drawing as a method of researching social representations. Qual. Res. 2022, 23, 981–999. [Google Scholar] [CrossRef]
  56. Horne, M.; Masley, S.; Allison-Love, J. Drawing as a research tool: What does it add? In Proceedings of the RCN International Research Conference, Oxford, UK, 5–7 April 2017. [Google Scholar]
  57. Jellema, P.; Annemans, M.; Heylighen, A. Drawing the researcher into data: Drawing as an analythical tool in qualitative research. Qual. Res. 2023, 23, 1398–1417. [Google Scholar] [CrossRef]
  58. Mäkelä, M. Drawing as a Research Tool: Making and understanding in art and design practise. Stud. Mater. Think. 2014, 10, 1–12. Available online: https://www.materialthinking.org/papers/147 (accessed on 5 September 2017).
  59. James, F. “Sketch and Talk”: An ethnographic design method opening closed institutions. In Proceedings of the Cumulus—Open Design for Everything, Hong Kong Design Institute, Hong Kong, China, 21–24 November 2016. [Google Scholar]
  60. Powell, K. Making Sense of Place: Mapping as a Multisensory Research Method. Qual. Inq. 2010, 16, 539–555. [Google Scholar] [CrossRef]
  61. Lynch, K. The Image of the City; The M.I.T. Press: Cambridge, MA, USA, 1960. [Google Scholar]
  62. Cullen, G. Townscape; Architectural Press: London, UK, 1961. [Google Scholar]
  63. Polanyi, M. The Tacit Dimension; Peter Smith, Doubleday & Company: Gloucester, MA, USA, 1966. [Google Scholar]
  64. Ings, W. Enstasy: Immersive drawings as a design process. In Proceedings of the Nordic Design. Research Conference: Experiments in Design Research, Copenhagen, Denmark; Malmö, Sweden, 9–12 June 2013; pp. 119–126. [Google Scholar]
  65. Kashanipour, J. The Gradual Gaze: Drawing as a practice of Ethnographic Description. Anthropol. Humanism 2021, 46, 81–94. [Google Scholar] [CrossRef]
  66. Literat, I. “A Pencil for your Thoughts”: Participatory Drawing as a Visual Research Method with Children and Youth. Int. J. Qual. Methods 2013, 12, 84–98. [Google Scholar] [CrossRef]
  67. Küller, R. A Semantic Model for Describing Perceived Environment; D 12:1972; National Swedish Institute for Building Research: Stockholm, Sweden, 1972. [Google Scholar]
  68. Stake, R.E. Multiple Case Study Analysis; The Guilford Press: New York, NY, USA, 2006. [Google Scholar]
  69. Yin, R.K. Case Study Research: Design and Methods, 3rd ed.; Sage Publications: Thousand Oaks, CA, USA, 2003. [Google Scholar]
  70. Wänström Lindh, U.; Billger, M. Light Topography and Spaciousness in the Urban Environment. Nord. J. Archit. Res. (NJAR) 2021, 33, 103–133. [Google Scholar]
  71. Wänström Lindh, U. Distribution of Light and Atmosphere in an Urban Environment. J. Des. Res. 2013, 11, 126–147. [Google Scholar] [CrossRef]
  72. Wickström, G.; Bendix, T. The “Hawthorn effect”—What did the original Hawthorn studies actually show? Scand. J. Environ. Health 2000, 26, 363–367. [Google Scholar] [CrossRef]
  73. Alvesson, M. Interpreting Interviews; Sage Publication Ltd.: London, UK, 2011. [Google Scholar]
  74. Alvesson, M.; Sköldberg, K. Reflective Methodology: New Vistas for Qualitative Research, 2nd ed.; Sage Publication Ltd.: London, UK, 2009. [Google Scholar]
Figure 1. Interpretation of Madsen’s three types of light-zones, (A) separated, (B) connected, and (C) overlapping. The upper row shows the concepts as Madsen presented them, the bottom row is this author’s interpretation [37,39].
Buildings 15 02278 g001
Figure 2. The experienced light-space. To the left, interpretation of Branzell’s room bubble, by the researcher. The experienced room bubble expands and diminishes depending on the surroundings. Arrows show the spatial directions. To the right, an illustration of how one can feel as being included or excluded by a light-zone (watercolour painting by Wänström Lindh [18]. Reprinted with permission from Studentlitteratur AB. Copyright 2018, Ulrika Wänström Lindh.).
Buildings 15 02278 g002
Figure 3. This picture shows how the lighting can affect the experienced spaciousness of the room, in relation to the spatial context (From a previous study. Often brightness has an enlarging effect. Note, that a brighter area in the centre of the back wall not always increases the perceived distance. Sometimes the effect can be the reverse, a bright light field can be so prominent that it tends to come forward. Photo/sketch, copyright Wänström Lindh 2012 [18,39]).
Buildings 15 02278 g003
Figure 4. Photos of the scenarios: Lecture, Picture-Showing, Auditory, and Mood (University of Gothenburg, main building).
Buildings 15 02278 g004
Figure 5. The lighting scenarios with light distribution and experienced light levels, illustrated by the researcher.
Buildings 15 02278 g005
Figure 6. A flowchart outlining the empirical data collection process. Each participant engaged in a one-on-one session with the researcher lasting 1.5 to 2 h. This article primarily reports findings from step 9, the drawing phase. While the questionnaire and statistical data are of secondary importance here, they played a preparatory role in helping respondents focus on the topic. For the researcher, these statistics contributed to the final triangulation of findings.
Buildings 15 02278 g006
Figure 7. The process of analysing the data derived from the drawings. While the process was largely linear, certain procedures were repeated cyclically and underwent multiple iterations.
Buildings 15 02278 g007
Figure 8. Illustration of the relationship between darkness and perceived spatial size. The Picture Scenario (left) and Mood Scenario (right) were frequently perceived as ‘small’ and ‘large,’ respectively (both drawn by Participant 2, a professional drawer and an architecture student). Interviews suggest that various factors influence these perceptions. In the Picture Scenario, the lower light levels limit visibility, preventing participants from seeing the entire room. Most respondents reported that this effect reduced the perceived space to only the visible area, whereas others noted that the absence of clear boundaries created an impression of infinite spatial extension, making the room feel expansive [28]. Similar findings have been observed in outdoor environments [70]. In contrast, while the Mood Scenario is also dark, its walls remain visible, allowing participants to discern the room’s boundaries. Slightly more participants evaluated the Picture Scenario as large (n = 6) compared to the Mood Scenario (n = 5). More people (n = 11) assessed the darkest Picture Scenario as small, compared with the Mood Scenario (n = 5).
Buildings 15 02278 g008
Figure 9. Illustration of inward versus outward direction. On the left, we see drawings of the Lecture Scenario and the Auditory Scenario, respectively (drawn by Participant No. 18, a non-professional participant, an administrator). The Auditory Scenario was perceived as the largest and tallest; it was also described as the brightest of all. The uplighting in the ceiling crown accentuates both the ceiling and the dome. This is reflected in the drawings, where the perceived spatial “room bubble” expands and arrows point upward. Unsurprisingly, many participants drew outward-pointing arrows in this bright room, as previous research supports the notion that brightness has an enlarging effect [29,30]. In contrast, the Lecture Scenario features inward-pointing arrows and a smaller room bubble, suggesting the perception of a smaller space within a larger one. The room is simultaneously experienced as both large and small. The arrows also indicate a clear sense of directionality and focus within the space.
Buildings 15 02278 g009
Figure 11. A histogram from the original analysis in the Auditory Scenario shows professional differences.
Buildings 15 02278 g011
Table 1. Experienced light levels and measured illuminance. The light level of the scenarios with estimated dimming percentages per light source type and horizontal illuminance values measured in the auditorium. The estimation of light level dimming is based on visual observation, with the Auditory Scenario being at the 100% level.
IlluminationLecturePicture-ShowingAuditoryMood
Ceiling light75%<25%100%25%
Wall lamps75%Off100%25%
Brass track75%Off100%25%
Crown upOffOff100%25%
Crown down75%Off100%25%
SpotlightOnOffOffOff
Overhead lightOnOnOffOff
Average illuminance, É_avg62 lux29 lux44 lux12 lux
Maximum illuminance, É_max252 lux141 lux83 lux26 lux
Minimum illuminance É_min21 lux5 lux 29 lux4 lux
Uniformity Uo0.60.420.730.67
Table 2. Summary on the frequency of the spatial concepts in each scenario. The numbers in the table indicate the frequency with which the researcher observed each spatial aspect in the respective scenarios.
Scenarios/
Concepts
Inw.Outw.SmallLargeWideHighLowCentAlignedMult. Rooms
Lecture135801400110
Picture132116032108
Auditory5709050793
Mood8555334407
Disclaimer/Publisher’s Note: The statements, opinions and data contained in all publications are solely those of the individual author(s) and contributor(s) and not of MDPI and/or the editor(s). MDPI and/or the editor(s) disclaim responsibility for any injury to people or property resulting from any ideas, methods, instructions or products referred to in the content.

