1. Introduction
Cleanrooms are essential in various industries, including healthcare, pharmaceuticals, electronics, and shipbuilding, where strict control of temperature, humidity, and airborne contaminants is crucial. Heating, ventilation, and air conditioning (HVAC) systems play a key role in maintaining indoor air quality (IAQ) and ensuring product safety and human health.
Cleanroom environments, especially in surgical operating rooms, must meet increasingly stringent sanitary and air quality standards. One of the most significant risk factors in such settings is airborne hospital-acquired infection, which can occur due to improperly managed airflow. Studies have shown that inadequate air distribution can lead to infection rates of up to 90–95% among patients. This risk has become even more critical in the post-pandemic era, where COVID-19 and its evolving variants continue to pose serious threats. In such environments, any contaminant entering the cleanroom—particularly in surgery—can potentially cause severe complications or even be life-threatening.
To ensure microbiological safety, cleanroom HVAC (heating, ventilation, and air conditioning) systems must incorporate advanced air purification technologies. These typically include multi-stage filtration units installed downstream of supply fans: coarse filters to capture large particles, antibacterial and fine filters for microbial and aerosol removal, and high-efficiency particulate air (HEPA) filters to achieve near-total air purity. In addition to filtration units, systems are equipped with air intake devices, fans, heaters, coolers, dampers, and air diffusers, all designed to minimize contamination and enable periodic decontamination.
Air quality in cleanrooms is assessed not only by temperature, humidity, carbon dioxide (CO2) levels, and airflow velocity but also by microbial content. A key metric is the colony-forming unit (CFU), which quantifies the number of viable microbial cells in the air. Advanced cleanroom technologies can achieve contamination levels below 10 CFU/m3. In surgical zones, reducing microbial concentrations by tenfold correlates with a 2% decrease in infection risk.
Maintaining the required environmental and microbiological conditions is a complex task that must be addressed during the early design and construction stages. According to SP RK 3.02.113-2014; Construction of Buildings and Structures in Medical Organizations. Committee for Construction, Housing and Communal Services Affairs: Astana, Kazakhstan, 2014 [
1] building regulations, medical staff workspaces must comply with strict indoor climate and microbiological requirements, especially where personnel spend more than two continuous hours.
While cleanroom zones offer substantial benefits, their operation entails significant energy and maintenance costs. These environments are critical not only in hospitals but also in pharmaceutical production and microelectronics. To optimize performance and reduce operational expenses, ventilation and air-conditioning systems must be re-engineered for energy efficiency. The challenge is further amplified in cleanrooms where recirculation is not allowed due to chemical or biological hazards.
This study aims to improve energy efficiency and air cleanliness in surgical cleanrooms through the development of a direct-flow air conditioning system equipped with a vapor-compression heat pump. The system is designed to maintain laminar airflow, reduce contaminant dispersion, and ensure rapid recovery of airflow stability after disturbances, such as human movement. Using computational fluid dynamics (CFD) simulations, the study investigates the optimal inlet airflow velocities and evaluates airflow recovery time following motion-induced disruption. The cleanroom classification and technical specifications follow GOST R 56640-2015; Cleanrooms and Associated Controlled Environments—Classification of Air Cleanliness by Particle Concentration. Federal Agency for Technical Regulation and Metrology: Moscow, Russia, 2015 [
2] and ISO 14644-1:2015; Cleanrooms and Associated Controlled Environments—Part 1: Classification of Air Cleanliness by Particle Concentration. International Organization for Standardization (ISO): Geneva, Switzerland, 2015 [
3].
The results of this research provide both theoretical insights and practical guidance for HVAC system design in high-purity environments, especially in critical zones where recirculation is not permissible.
Literature
Numerous recent studies have focused on optimizing airflow and energy efficiency in cleanroom environments, highlighting the challenges of maintaining cleanliness levels while minimizing energy consumption. For instance, researchers have proposed risk-based methods for the optimal placement of particle sensors in non-unidirectional cleanrooms, using CFD simulations to reduce measurement bias and spatial contamination risks. Their approach achieved a 31% reduction in spatial violation risk compared to conventional sensor layouts, thereby enhancing the efficiency of airflow control systems [
4]. In another study, airflow uniformity in Class 1 cleanrooms was investigated through both simulations and field measurements, revealing that lower fan filter unit (FFU) air velocities and increased raised floor heights contributed to reduced turbulence and improved unidirectional flow patterns [
5]. These findings align with the objectives of the present study, which seeks to optimize airflow distribution in surgical cleanrooms by refining air conditioning system design and evaluating the impact of inlet airflow velocity on contaminant dispersion. Building upon such prior work, our study integrates computational and practical approaches to develop an energy-efficient direct-flow ventilation system capable of ensuring high air cleanliness without recirculation, particularly in environments with elevated risks of chemical or biological contamination [
4,
5].
Previous studies have emphasized the importance of optimizing airflow characteristics and ventilation strategies in cleanrooms to ensure both energy efficiency and contamination control. For example, airflow and particle behavior in semiconductor cleanrooms were studied using an RNG k-ε (renormalization group k-epsilon) turbulence model and discrete phase modeling (DPM), revealing that vortices near corners significantly delay particle removal. The addition of localized FFUs (fan filter units) at ceiling corners was shown to reduce removal times by up to 7 min, depending on the supply air velocity, and provided important theoretical guidance on optimal airflow speeds and unit placement. In pharmaceutical cleanrooms, researchers applied response surface methodology combined with multi-criteria evaluation methods (AHP-entropy weight) to assess how air changes per hour (ACH), outlet sizes, and distribution ratios influence workspace satisfaction, energy efficiency, and clean ventilation index. Their findings identified an energy-saving configuration that reduced ACH by 10% while maintaining nearly optimal performance. These studies underscore the multifactorial nature of cleanroom ventilation performance and the trade-offs between air cleanliness, airflow stability, and energy use [
6].
Building upon these findings, our study addresses an identified gap in the literature by focusing specifically on surgical cleanrooms where recirculation of air is not permissible due to the high risk of chemical and biological contamination. Unlike electronic and pharmaceutical cleanrooms, such environments require a fully fresh air system with strict microbial cleanliness standards. Our work contributes to the field by developing an energy-efficient, direct-flow ventilation concept tailored for operating rooms, supported by CFD-based modeling that evaluates contaminant dispersion and airflow stabilization time as functions of inlet air velocity. This novel approach enables enhanced control of infection risks while optimizing energy consumption under regulatory and safety constraints specific to medical facilities [
7].
In the field of cleanroom research, recent studies have highlighted the need for optimized airflow management to balance contamination control and energy consumption, particularly in semiconductor and electronics industries. For instance, researchers have shown that centralized fan filter unit (FFU) configurations can significantly improve thermal performance and reduce particle concentration, with one optimized layout reducing temperature fluctuations by 12% and particle levels by 15% compared to traditional FFU placements. These findings underscore the importance of airflow pattern optimization in ensuring both product quality and compliance with environmental standards. Another study in non-unidirectional cleanrooms demonstrated that adjusting FFU speed and selectively switching off subzone units—based on the distance from the contamination source—can reduce total air volume by over 40% without compromising cleanliness, thus offering new strategies for sensor layout and ventilation control [
8].
While these contributions have advanced cleanroom design for industrial settings, they primarily focus on environments where recirculation and partial filtration are permissible. In contrast, surgical cleanrooms—such as operating theatres—require direct-flow, 100% fresh air systems with stringent microbial cleanliness. Our study addresses this critical gap by evaluating airflow performance in such high-risk environments, where recirculation is prohibited due to the danger of chemical or biological contamination. Using CFD-based modeling, we explore the effect of inlet air velocity on airflow stabilization and contaminant dispersion in surgical cleanrooms, contributing novel insights into the development of energy-efficient and hygienically compliant air supply systems for healthcare applications [
9].
Recent studies have demonstrated the effectiveness of computational fluid dynamics (CFD) in evaluating ventilation performance in clean environments. In cleanrooms, airflow direction and source motion significantly impact contaminant dispersion, with unidirectional flow providing the highest removal efficiency [
10,
11]. In operating rooms, increased air changes per hour (ACH) improve both thermal comfort and ultrafine particle control, though excessive airflow leads to unnecessary energy consumption [
12,
13,
14,
15]. Similarly, CFD analysis of ship engine rooms highlights the need for optimal fan placement to minimize welder exposure to fumes [
16,
17,
18,
19,
20].
In high-containment BSL-3 (Biosafety Level 3) laboratories, even minor leakage can compromise negative pressure and biosafety. CFD simulations support optimizing airflow rates and sealing to enhance safety and energy efficiency [
21,
22,
23].
Turbulent ventilation is simple and cost-effective but limited to ISO Class 6–7 due to uneven airflow. Unidirectional systems, using HEPA/ULPA filters and static pressure chambers, achieve higher cleanliness (ISO Class 5 and better) but are more energy intensive. FFMs (fan filter modules) provide modular airflow control, zoning flexibility, and better uniformity, despite higher capital costs.
Dynamic factors, such as personnel entry through airlocks, can disrupt cleanroom conditions. Experiments show that low airflow rates and fast movement increase contamination risk, while increased doorway airflow improves protection [
24,
25,
26,
27,
28,
29].
Recent developments also include dual-function HVAC (heating, ventilation, and air conditioning) systems for both positive and negative pressurization, useful in managing infectious risks. CFD studies show that air curtains can improve ventilation efficiency by up to 10%, enhancing contamination control in both modes [
30,
31,
32,
33,
34,
35].
Cleanrooms are critical environments in high-tech, medical, and pharmaceutical industries where precise control over airborne contamination is essential. In Kazakhstan, the development of cleanroom infrastructure—particularly in pharmaceuticals, healthcare, and electronics—has accelerated, prompting the need for advanced HVAC systems aligned with GOST R ISO 14644-1-2017; Cleanrooms and Associated Controlled Environments—Part 1: Classification of Air Cleanliness by Particle Concentration. Federal Agency for Technical Regulation and Metrology: Moscow, Russia, 2017 [
36] and local GOST standards.
Conventional air-handling units (AHUs) maintain temperature, humidity, and particle concentration, but challenges such as high energy consumption, cost, and adaptation to local requirements necessitate improved solutions. Recirculating systems, although widely used, are often unsuitable for hazardous environments, where once-through systems are preferred despite their energy intensity. This highlights the need for optimizing air volume and velocity to reduce operating costs without compromising cleanliness.
Numerical modeling and CFD tools are increasingly used to design and assess cleanroom environments. For instance, airflow simulations in MEMS cleanrooms have shown that contaminant levels can be reduced to 2% of the ISO limit within 10 minutes, while life cycle assessments (LCA) help evaluate environmental sustainability with impressive scores of 56.1/60 [
37,
38,
39,
40,
41]. Similarly, CAD-based modeling of aerobiology chambers has helped optimize airflow and particle distribution, allowing more efficient data collection and fan placement [
42,
43].
To develop an accurate geometric representation of the cleanroom environment, CAD-based modeling was utilized using Autodesk AutoCAD 2025 and SolidWorks 2022 SP3.0. The layout of the cleanroom, including walls, ceiling-mounted fan filter units (FFUs), floor elevation changes, and internal equipment (such as the operating table and shelving), was first constructed in CAD format based on standard cleanroom dimensions and field measurements. These CAD models were then imported into ANSYS Fluent 2025 R1 through ANSYS SpaceClaim 2023 R2 for meshing and further CFD analysis. For instance, the geometry of the operating table, which significantly affects recirculation zones beneath it, was modeled with precise clearance from the floor to simulate realistic airflow obstruction. This approach ensured fidelity between the physical layout and the simulation environment, enabling more reliable analysis of airflow disturbance and contaminant transport mechanisms.
Given that excessive airflow increases energy use and inadequate velocity compromises air quality, identifying the optimal inlet velocity is critical. This study develops a 3D CFD model to investigate how air velocity affects the removal of aerosol contaminants, aiming to balance energy efficiency with performance. The findings will support sustainable and effective cleanroom design in Kazakhstan and other developing regions.
In Kazakhstan, the application of cleanroom technologies has significantly expanded in recent years, particularly in the medical, pharmaceutical, and high-tech manufacturing sectors, in response to growing demands for sterility and environmental control. Cleanrooms are governed by GOST R ISO 14644, a localized adaptation of the international ISO 14644 series, which establishes strict standards for airborne particulate concentration and airflow regulation. According to these standards, airflow velocities in cleanrooms typically range from 0.35 to 0.52 m/s, with an allowable deviation of no more than 20%. Air-handling units (AHUs) are used to ensure full-cycle air treatment, including multi-stage filtration (G1–G4 for coarse, F5–F8 for fine, H13–H14 for high-efficiency, and U15–U17 for ultra-fine purification), temperature and humidity control, and pressure differentials between zones of different cleanliness classes. The systems are designed to prevent stagnant zones, where particles and microbes tend to accumulate, and they operate continuously with minimal noise and automated regulation. These cleanroom infrastructures are essential for contamination-sensitive environments and have become a national priority in the post-pandemic context to enhance health and safety standards.
The main objective of this study is to develop a numerical model to simulate airflow distribution within cleanroom environments and assess how air velocity affects contaminant removal efficiency. By leveraging computational fluid dynamics (CFD), the study aims to identify the optimal air velocity parameters that balance energy use and cleanliness performance, contributing to the improvement of cleanroom design in Kazakhstan and beyond.
2. Materials and Methods
This study proposes and implements a functional air conditioning unit based on a novel design that does not require the development of new structural components. The system incorporates standard HVAC elements: fans, humidifiers, filters, and air dampers, selected similarly to conventional units. The refrigerant circuit includes standard heat exchangers, compressors, and control valves widely available from manufacturers, such as VTS, YORK, Alfa Laval, Emerson, and Danfoss.
Existing direct-flow air conditioning systems used in cleanrooms are generally less efficient than systems based on air recirculation. At the same time, current methods aimed at reducing energy losses in direct-flow systems—such as various types of heat recovery units—have several significant structural drawbacks.
To reduce energy consumption during air treatment, we developed a new system layout, as presented in
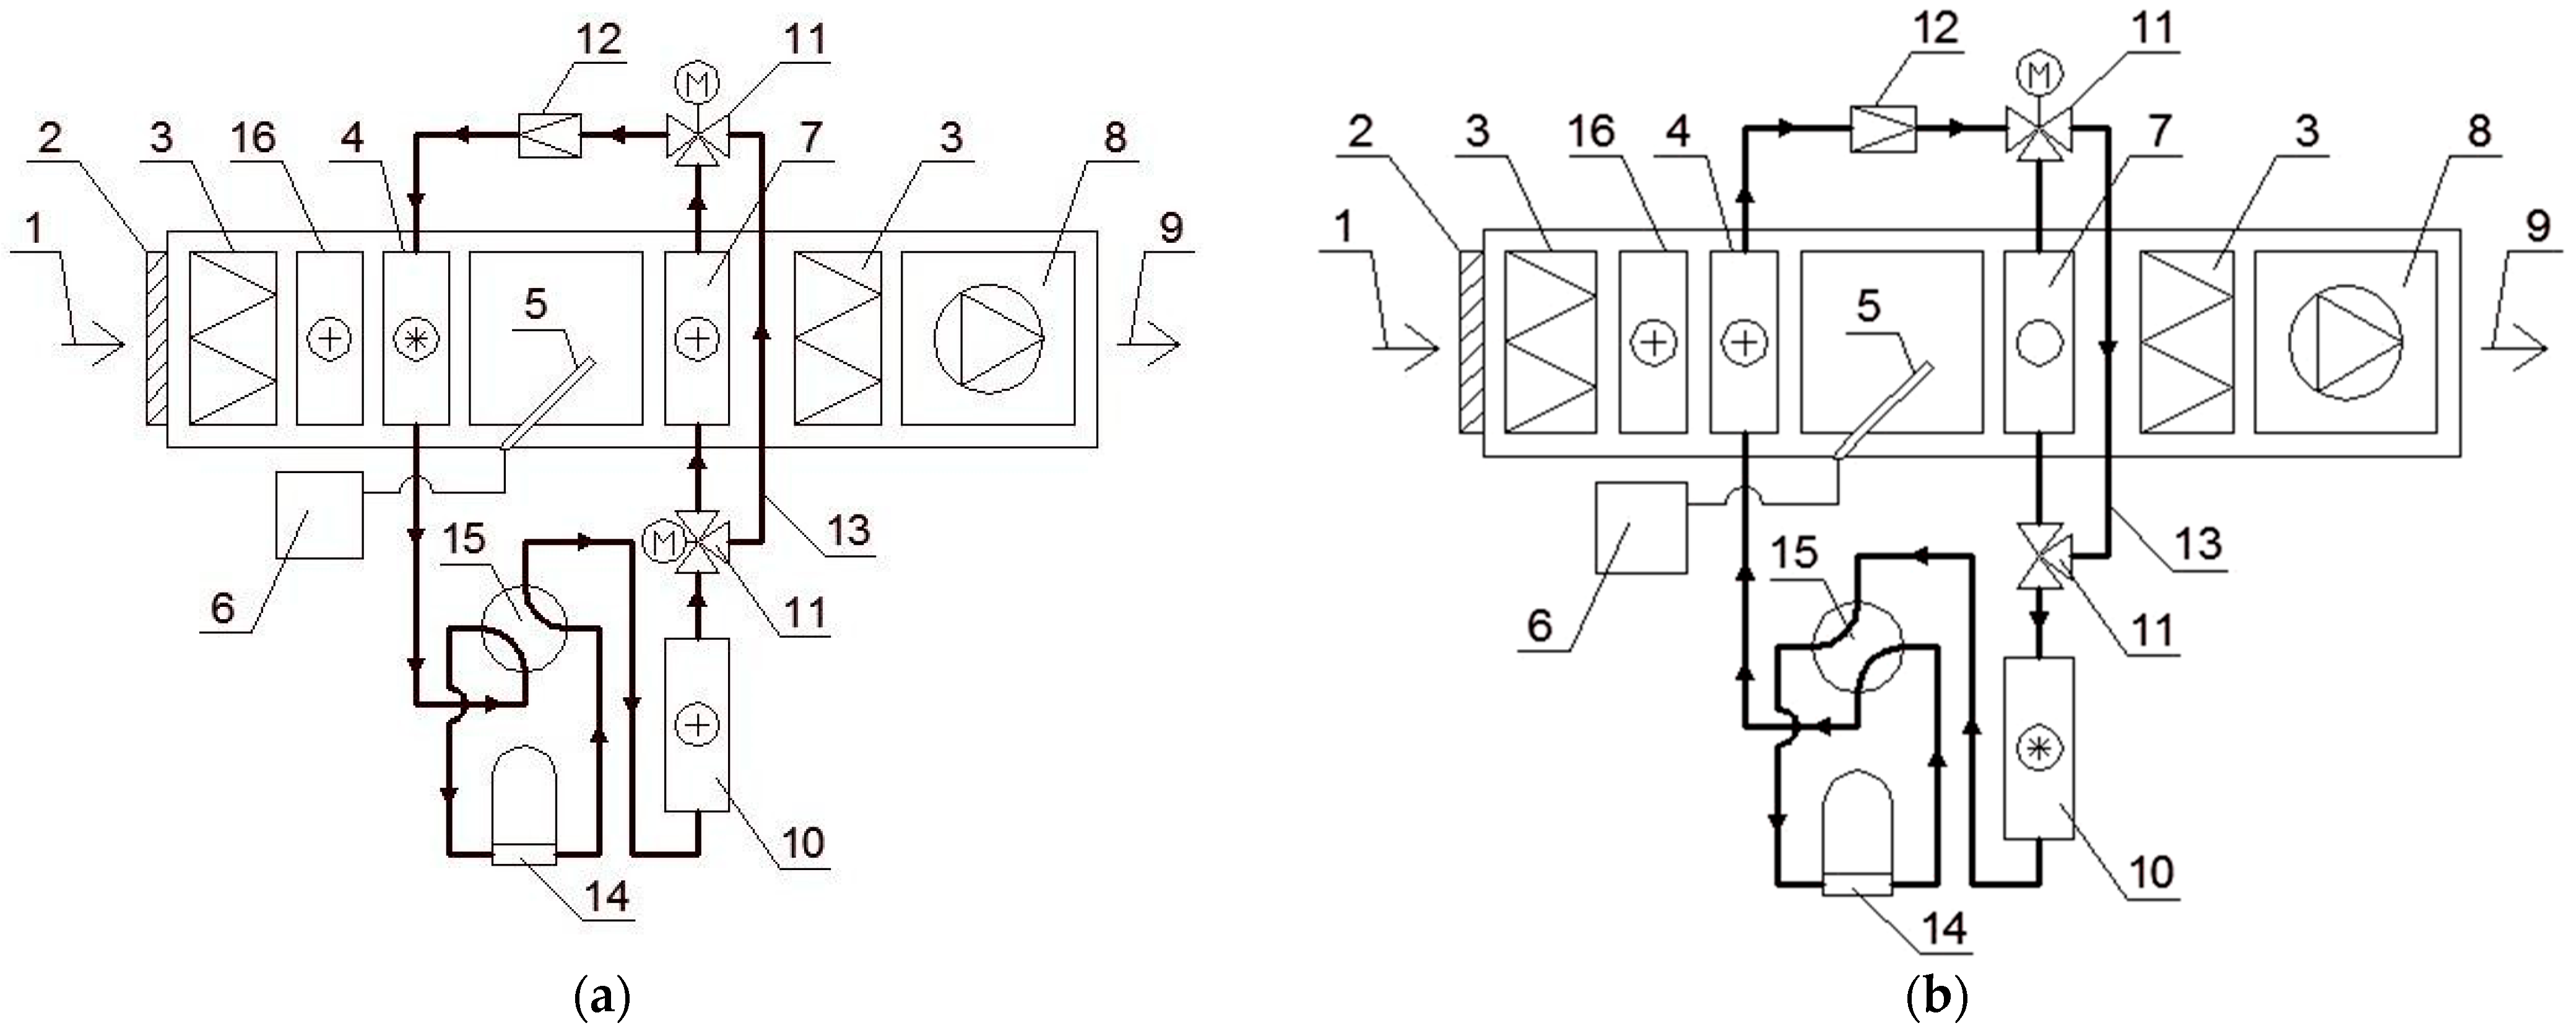
Figure 1. The developed air conditioning system layout for the warm season includes the following components: the flow of outdoor air (1) passes through an air damper (2) and an air filter (3), followed by a series of Freon heat exchangers (4, 7, 10). Steam is introduced through a steam supply tube (5) connected to a steam generator (6). A fan (8) ensures the movement of the conditioned air stream (9). The system incorporates a three-way valve (11), a throttling device (12), and a bypass (13) to regulate refrigerant flow. Compression is handled by a compressor (14), supported by a four-way valve (15) for refrigerant circuit control. Finally, the air can be additionally heated using an electric air heater (16).
The proposed air conditioning system shares many features with a typical direct-flow air conditioning configuration, such as the one illustrated in
Figure 1. It includes components like air dampers (2), air filters (3), a steam humidifier (5 and 6), and a fan (8). In this design, heat exchangers (4, 7, 10) are integrated into a single hydraulic circuit with circulating refrigerant. The circuit also includes a compressor (14) and a throttling device (12), forming a vapor-compression refrigeration cycle (VCRC). While this study considers a single-stage VCRC, multi-stage systems are also applicable [
44].
Depending on the refrigerant flow direction within the cycle, the heat exchangers (4, 7, 10) may function as either evaporators or condensers. During the warm season, heat exchanger 4 acts as an air cooler, directly evaporating the refrigerant, and therefore functions as the evaporator. Meanwhile, heat exchanger 7 serves as a secondary air reheater, functioning as the condenser. Heat exchanger 10 also acts as a condenser. Its inclusion addresses the imbalance in thermal loads between the evaporator and condenser, as the heat released by the condenser exceeds the heat absorbed by the evaporator by the compressor’s power input.
In conventional direct-flow air-handling units, the heat demand for reheating air in the second-stage heater (VCRC condenser) is significantly lower than the cooling load removed in the cooler section (VCRC evaporator). This discrepancy arises due to the substantial difference in air temperature changes before and after the cooler (4) and the secondary reheater (7). To maintain a balanced and stable VCRC operation, a portion of the heat is discharged through the additional condenser (10).
The system also includes a bypass line (13), which allows control over the refrigerant volume passing through heat exchanger 7, enabling system flexibility. In the cold season, the four-way valve (15) reverses the direction of refrigerant flow, altering the functions of the heat exchangers. Heat exchanger 4 then operates as a condenser (air heater), while heat exchangers 7 and 10 function as evaporators. At this stage, refrigerant is diverted away from heat exchanger 7 via the three-way valves (11) and routed through the bypass line (13), effectively removing it from the cycle (
Figure 1b).
Figure 1 presents the air conditioning system scheme specifically developed within the framework of this research. The diagram illustrates a proposed direct-flow system designed to improve energy efficiency in cleanroom environments, particularly in surgical settings where air recirculation is not permitted.
Prior to the development of this configuration, an analysis of existing single-pass air-handling systems was conducted. These conventional systems, while simple, often demonstrate high energy consumption and limited heat recovery capabilities. The identified shortcomings include the imbalance between the thermal energy removed by the evaporator and that required by the reheating stage, as well as inadequate adaptability to seasonal temperature variations.
To address these limitations, the proposed scheme incorporates a vapor-compression refrigeration cycle, reversible refrigerant flow, a dedicated bypass line, and an additional heat exchanger. These features enable thermal load balancing and operational flexibility. The configuration is supported by a detailed schematic and component description, distinguishing it from typical systems and substantiating its novelty and applicability.
Under such conditions, the entire evaporative load is handled by heat exchanger 10. Additionally, an auxiliary electric air heater (16) is included to compensate for insufficient heating capacity from heat exchanger 4, ensuring the required supply air temperature is maintained.
This study relied on numerical modeling and existing experimental research focused on airflow behavior in cleanroom environments. Previous investigations by Hu and Chuah (2003) examined how operator movement influences the removal of airborne contaminants near workstations [
44]. Yang-Cheng Shih and colleagues analyzed the effects of human movement on airflow distribution within turbulent-ventilated isolators, focusing on velocity and pressure profiles. M.H. Saidi studied how the position of a contamination source affects the dispersion of pollutants inside cleanroom spaces. The current research continued this line of inquiry by applying advanced simulation tools to further explore airflow and contaminant removal efficiency [
45].
For the simulation process, specialized software tools were used to discretize complex geometries and conduct the necessary fluid dynamic calculations. Ansys ICEM-CFD version 2023 R1 (Integrated Computer Engineering and Manufacturing—Computational Fluid Dynamics) provided high-quality mesh generation through its Tetra/Prism and Hexa modules, which are suitable for creating both unstructured and structured grids, respectively. For simpler geometrical models, Ansys GAMBIT 2023 R2 (Geometry and Mesh Building Intelligent Toolkit) was employed due to its ease of use and compatibility with common CAD (computer-aided design) formats, such as IGES, Catia, Parasolid, and ACIS [
44].
All computational settings, including boundary conditions and initial parameters, were configured in ANSYS Fluent 2025 R1, which also served as the primary platform for simulation and analysis of airflow and particle dynamics. FLUENT offers a robust environment for solving a wide range of fluid dynamics problems and allows for the integration of custom models through user-defined functions (UDFs), enabling tailored simulations specific to cleanroom conditions.
To ensure a comprehensive assessment of airflow dynamics and contaminant behavior in the cleanroom, a multi-step simulation-based methodology was adopted. The study began with the development of a schematic layout for an air conditioning system specifically designed for operating rooms. A three-dimensional geometry of the cleanroom was constructed, taking into account realistic room dimensions, equipment layout, and human presence. Computational fluid dynamics (CFD) simulations were then conducted using the k-ε turbulence model under transient conditions to capture the influence of human motion and airflow disturbances on particle transport and distribution.
The simulation procedure included the definition of boundary conditions, such as inlet velocity (ranging from 0.2 m/s to 0.6 m/s), outlet pressure, wall properties, and contaminant release points. A moving human model was incorporated to replicate real surgical activities and their effect on airflow patterns. The workflow of this study follows a structured sequence that includes literature analysis, system design, 3D modeling, simulation setup, airflow and contaminant analysis, and final interpretation of results. This structured approach ensures the repeatability and transparency of the simulation process and highlights the relationship between airflow velocity and contamination risk in cleanroom environments.
The resulting data from simulations were visualized and interpreted using Tecplot 360, which facilitated clear representation and evaluation of airflow patterns and contaminant behavior across different operational scenarios.
3. Results
In this study, a numerical model of a cleanroom was developed, replicating the geometry and conditions of a laboratory-scale cleanroom facility. The cleanroom dimensions were 3 × 6 × 2.8 m (
Figure 2), chosen deliberately to reflect typical operational spaces. The model included key elements, such as the operator (1), two workbenches (2 and 3), an aerosol contamination source placed on one of the workbenches (4), the operator’s movement path (5), and the directions of supply airflow (6), simulating realistic working conditions in a controlled clean environment.
The numerical simulation in this study was carried out using a transient CFD model over a period of 600 s to capture unsteady airflow patterns and contaminant dispersion caused by human motion. The operating room was modeled with a simplified layout, including one operator to isolate and clearly evaluate the effect of individual movement on airflow disruption and particle transport. While this approach limits the complexity of interactions found in multi-user environments, it provides a controlled baseline for validating the influence of key parameters, such as inlet air velocity and turbulence intensity. The validity of the model is supported by using established turbulence modeling (k-ε RNG) and boundary conditions aligned with real-world ventilation scenarios. Despite the simplified assumptions, the results are reliable for identifying critical trends in air distribution and contamination zones, and they offer a foundation for future studies involving more complex user scenarios and functional activities in cleanrooms.
Considering the fact that the geometry of this model changes over time due to the movement of the operator, the entire model should be divided into several blocks depending on the nature of this movement, i.e., compressible, stretchable, moving, and stationary. Thus, the volume was divided into six blocks, as follows:
RIGHT—stationary block on the right side of the operator, containing the table with the aerosol contamination source.
LEFT—stationary block on the left side of the operator, containing another workbench.
CUBE—moving block that contains the operator itself.
FRONT—compressible block along the Z-axis, in front of the CUBE.
BACK—stretchable block along the Z-axis, behind the CUBE.
BOTTOM—stationary block representing the “base” of the cleanroom, 10 cm thick (
Figure 2).
Preliminary calculations showed that the inclusion of the BOTTOM block helped avoid errors in the simulation caused by time-dependent changes in the surface area through which air is removed from the cleanroom. The dimensions of each block are presented in
Table 1.
The airflow distribution in this model corresponds to the scheme shown in
Figure 1b: a vertical unidirectional airflow configuration with 100% ceiling coverage by filters. Air was removed through perforated panels covering the entire floor area of the cleanroom.
According to the simulation setup, the operator moved at a constant speed (1 m/s) along the Z-axis, which corresponds to the average walking speed of a person. The total distance traveled by the operator was 4 m.
The operator (mannequin) model used in the simulation was constructed with realistic geometric proportions to mimic human presence in a cleanroom. As shown in
Table 2, the model comprises six main components: the body, head, arms, and legs, each assigned specific dimensions along the X, Y, and Z axes. The body measures 0.3 m × 0.2 m × 0.7 m, while the limbs and head are proportionally scaled to reflect anatomical accuracy. This simplified yet representative geometry was generated using Ansys ICEM-CFD version 2023 R1 and served to evaluate the effects of human motion on airflow patterns and contaminant dispersion.
Mesh generation is a critical component of the numerical simulation process. The quality of the computational mesh affects the accuracy of the results, the convergence behavior, and the time required for solving the problem.
In this study, an unstructured meshing technique was applied. The primary advantage of unstructured mesh models lies in their ability to consist of various element shapes: quadrilaterals and triangles for two-dimensional models, and hexahedra, tetrahedra, prisms, and pyramids for three-dimensional models.
For compressible/expandable volumes—namely, the FRONT and BACK blocks—as well as for geometrically simpler domains like the LEFT, RIGHT, and BOTTOM blocks, a hexahedral mesh with the Cooper scheme was selected. This approach is particularly suitable for surfaces subject to deformation. The Cooper method generates a volume mesh by extruding a two-dimensional mesh from a face along the body. The edge length of the hexahedral elements was set to 50 mm.
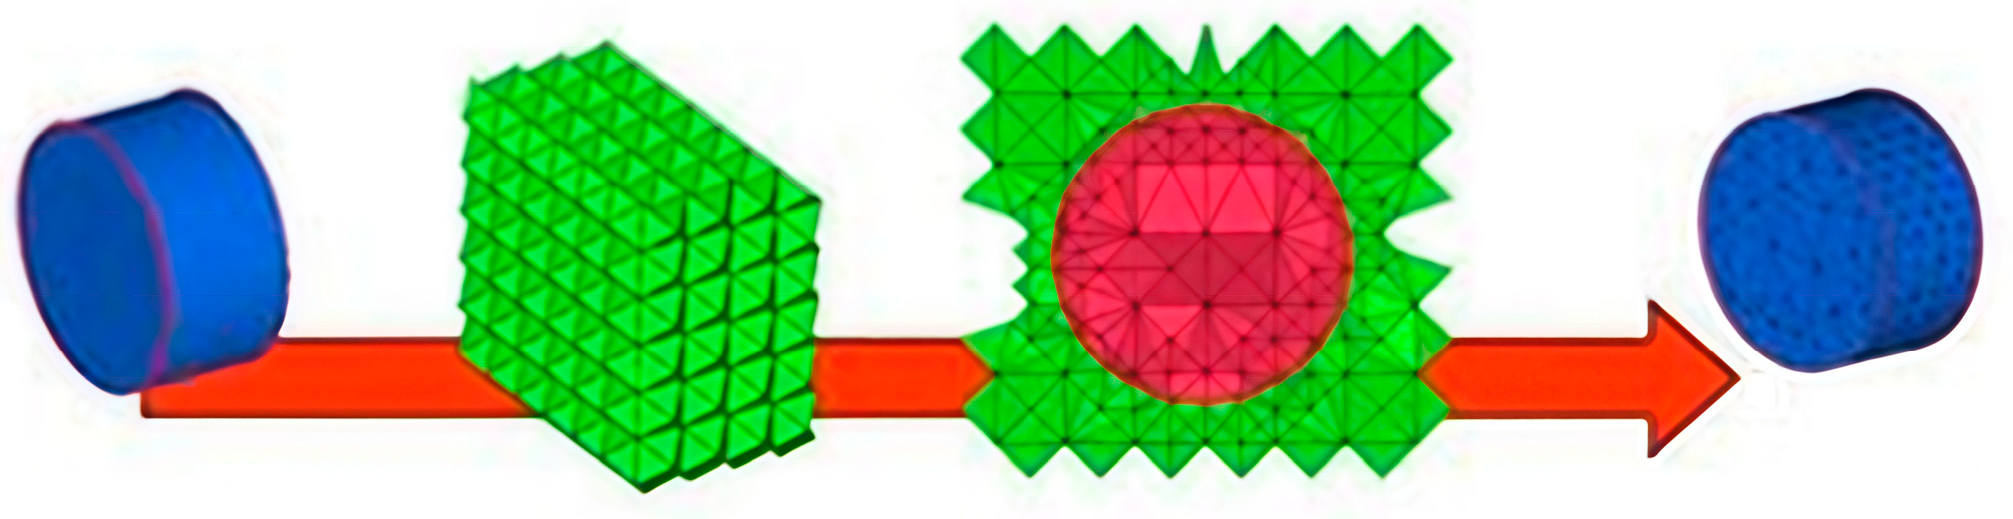
For the geometrically complex CUBE block, which contains the operator model, a tetrahedral mesh was used based on the boundary correction method (Octree/Quadtree), with an edge length of 10 mm. This technique involves overlaying a pre-generated mesh on the domain. Then, any elements extending beyond the domain are trimmed, and the positions of the nodes near the boundaries are corrected so that they align with the domain’s corners, edges, and faces.
This algorithm was divided into two stages: generation of the primary mesh and boundary correction. A schematic representation of this process is shown in
Figure 3.
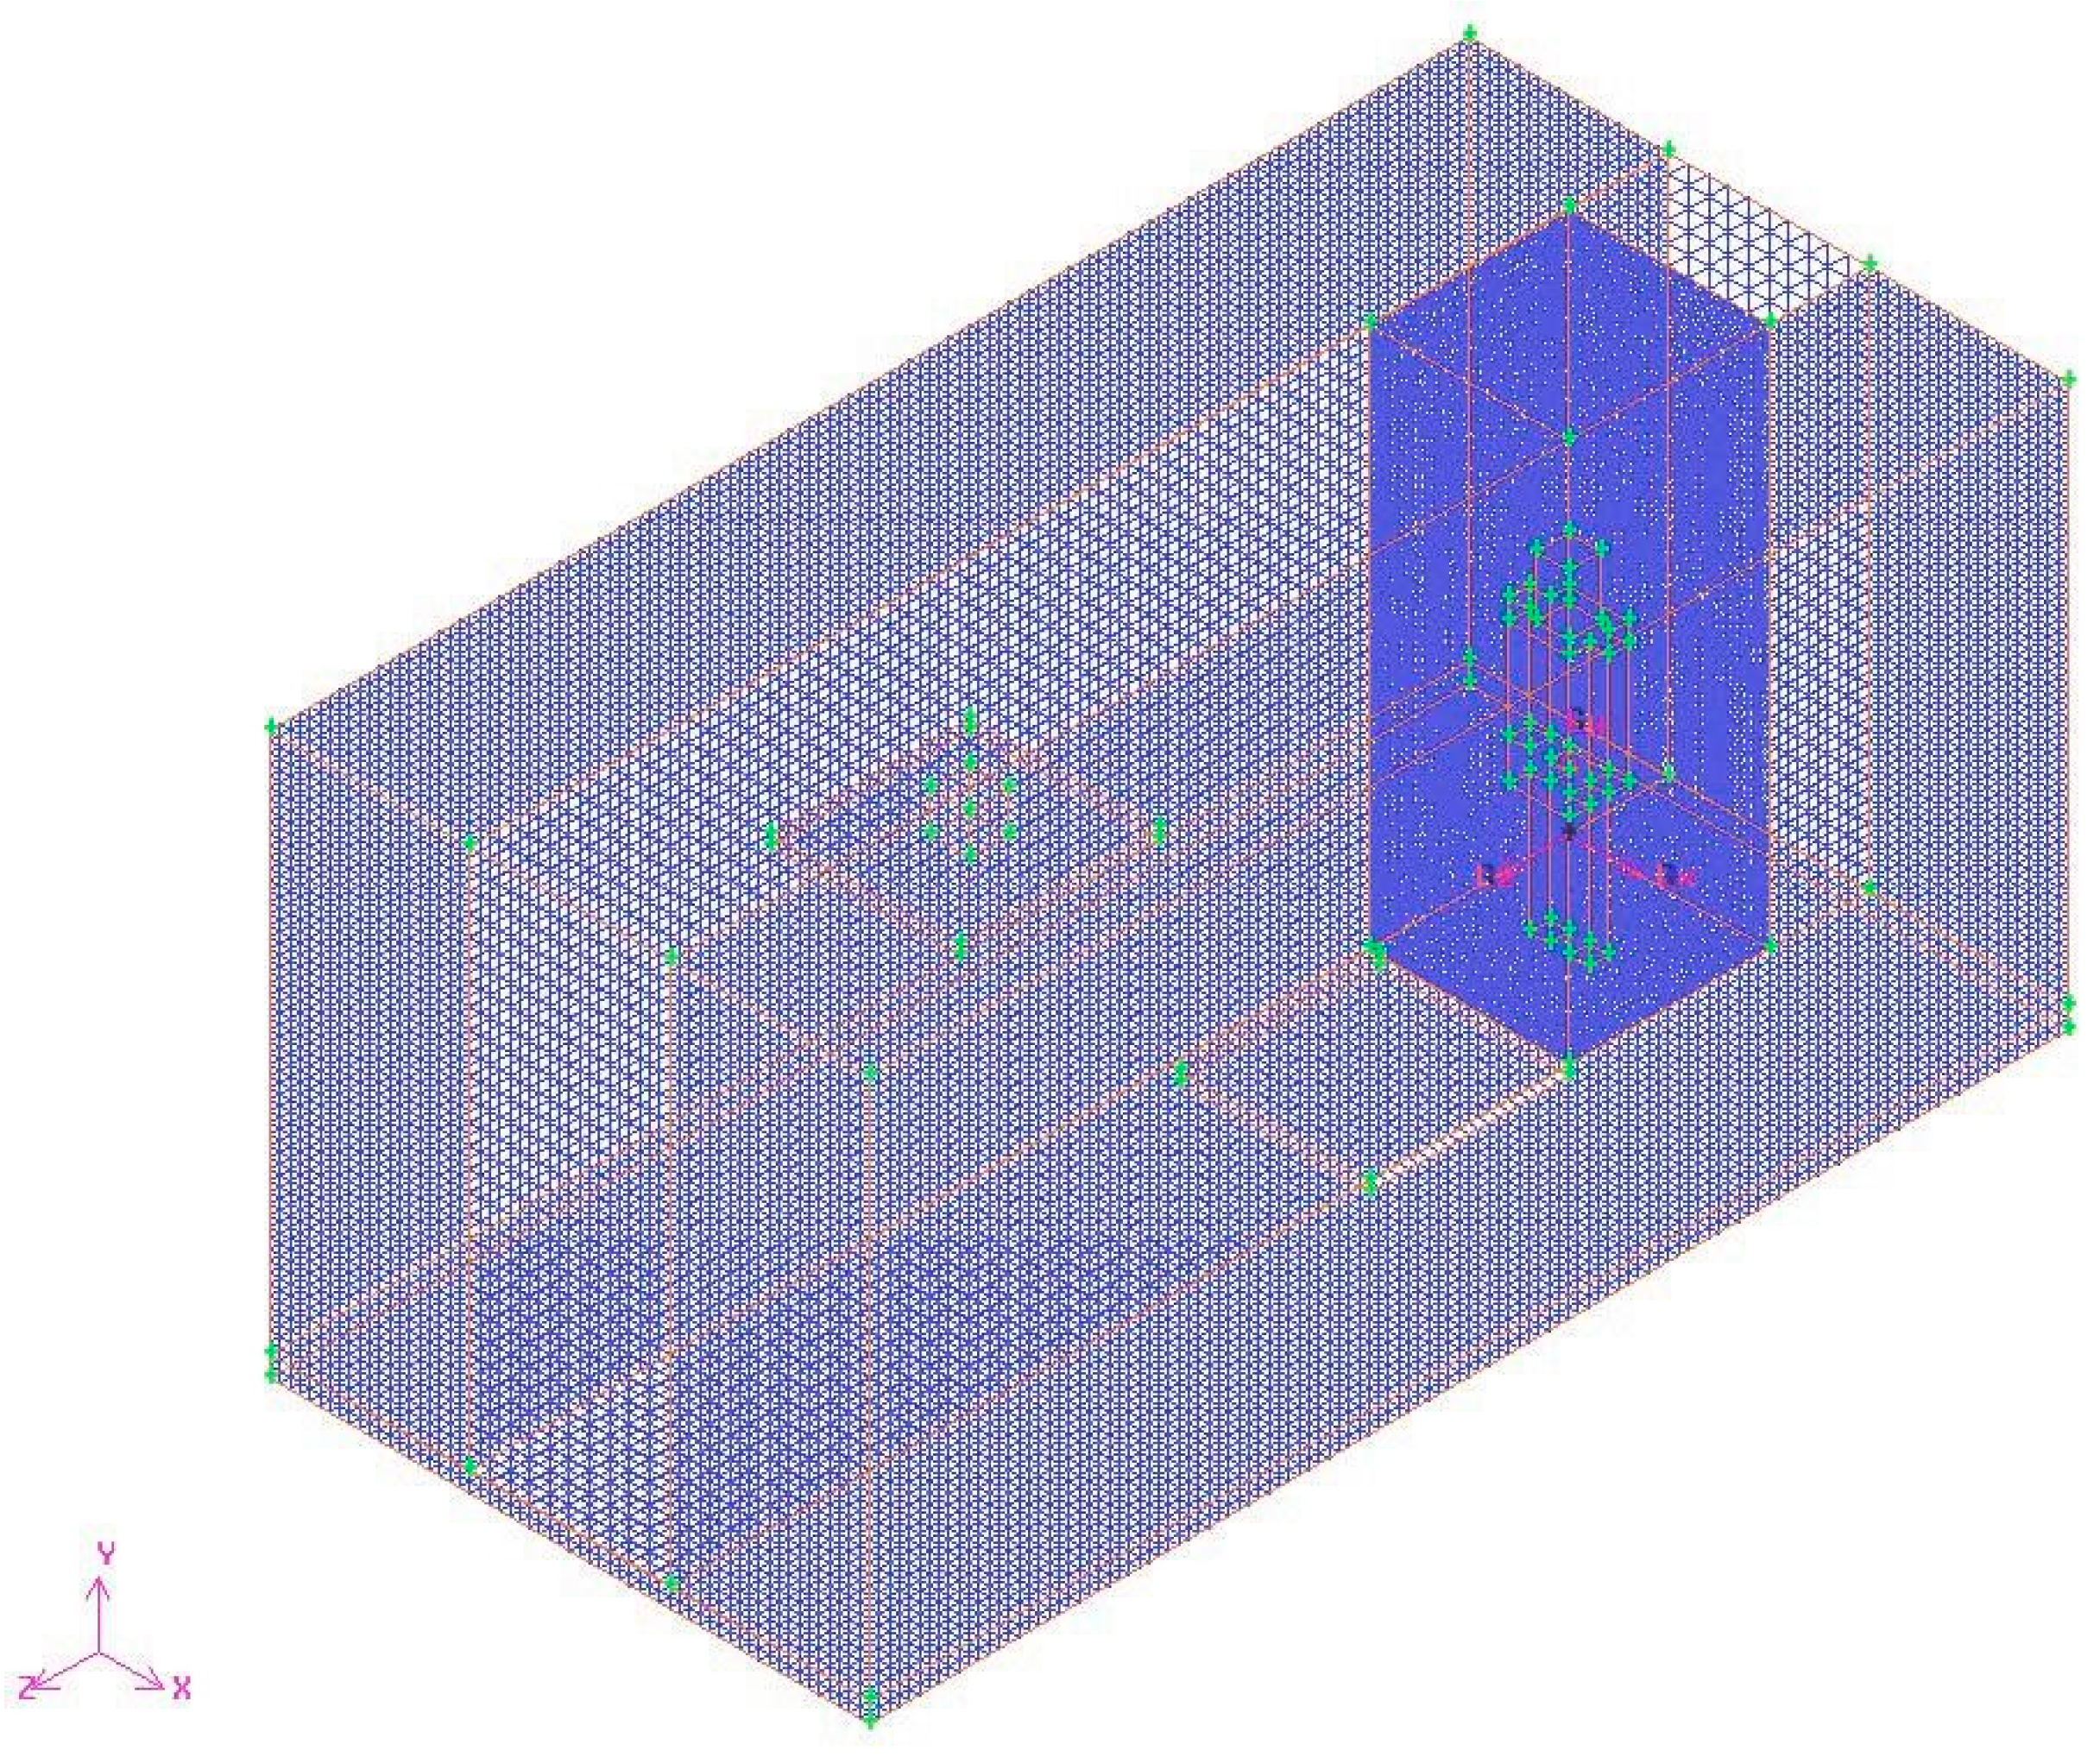
As a result of mesh generation on the model, a total of 264,559 tetrahedral and 286,276 hexahedral computational cells were obtained (
Figure 4).
3.1. Calculation Procedure
The entire modeling process can be conventionally divided into three stages:
Analysis of airflow velocities and directions with a stationary operator.
Investigation of the influence of supply air velocity on the transport of aerosol contaminants in the cleanroom space due to disturbances created by the movement of the operator. The following range of air velocities was considered: 0.01 m/s, 0.1 m/s, 0.2 m/s, 0.3 m/s, 0.4 m/s, 0.5 m/s, 0.6 m/s, 0.7 m/s, 0.8 m/s, 0.9 m/s, and 1.0 m/s.
Investigation of the effect of air velocity at the cleanroom inlet on the recovery time (stabilization) of the airflow after being disturbed by the operator along one of the room’s axes.
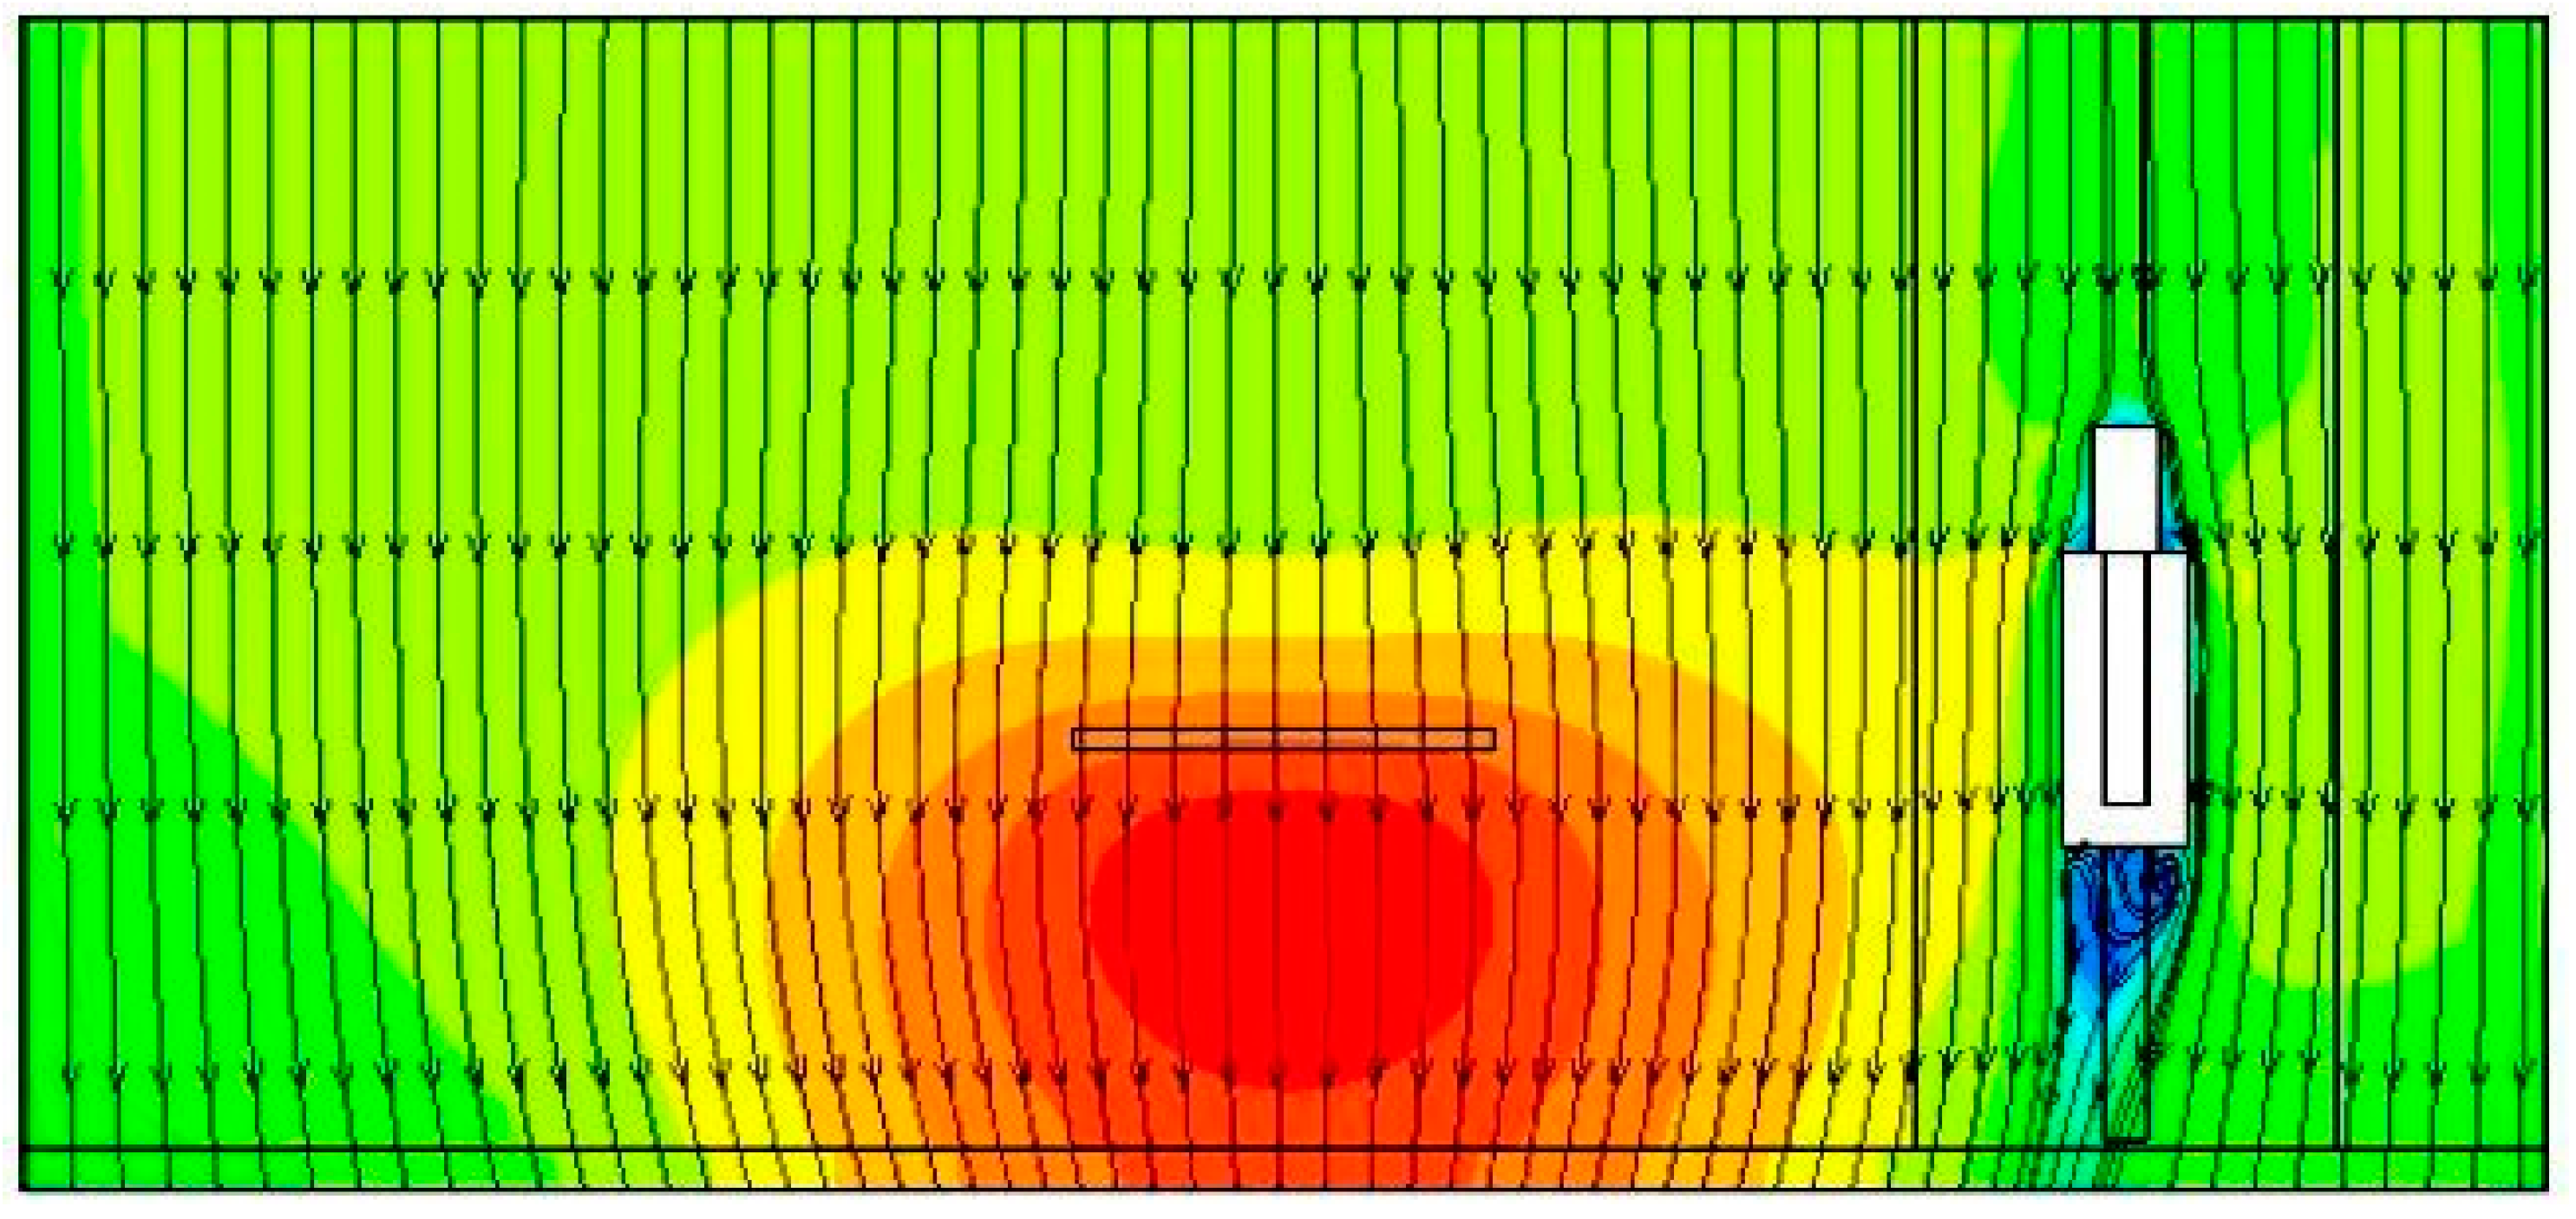
As a result of the simulation with a stationary operator, it can be concluded that in the absence of movement inside the cleanroom, air flowed around the operator without significant disturbances (
Figure 5 and
Figure 6).
Thus, in such a state, even one of the lowest air velocities (0.1 m/s) was sufficient to maintain a stable unidirectional airflow.
However, regardless of the presence of the operator and the velocity of the supply air, recirculation zones may form in certain areas of the cleanroom, where a significant number of particles can accumulate. A typical example is the area directly underneath the workstation. This effect can be avoided only with proper room layout (e.g., eliminating voids beneath the table or any horizontal surface).
An investigation of the influence of supply air velocity on the transport of aerosol contaminants in a cleanroom due to disturbances generated by a moving operator was conducted.
As a result of the numerical simulation, dependencies were established between the supply air velocity and the efficiency of particle removal from the working area of the cleanroom, taking into account the operator’s movement.
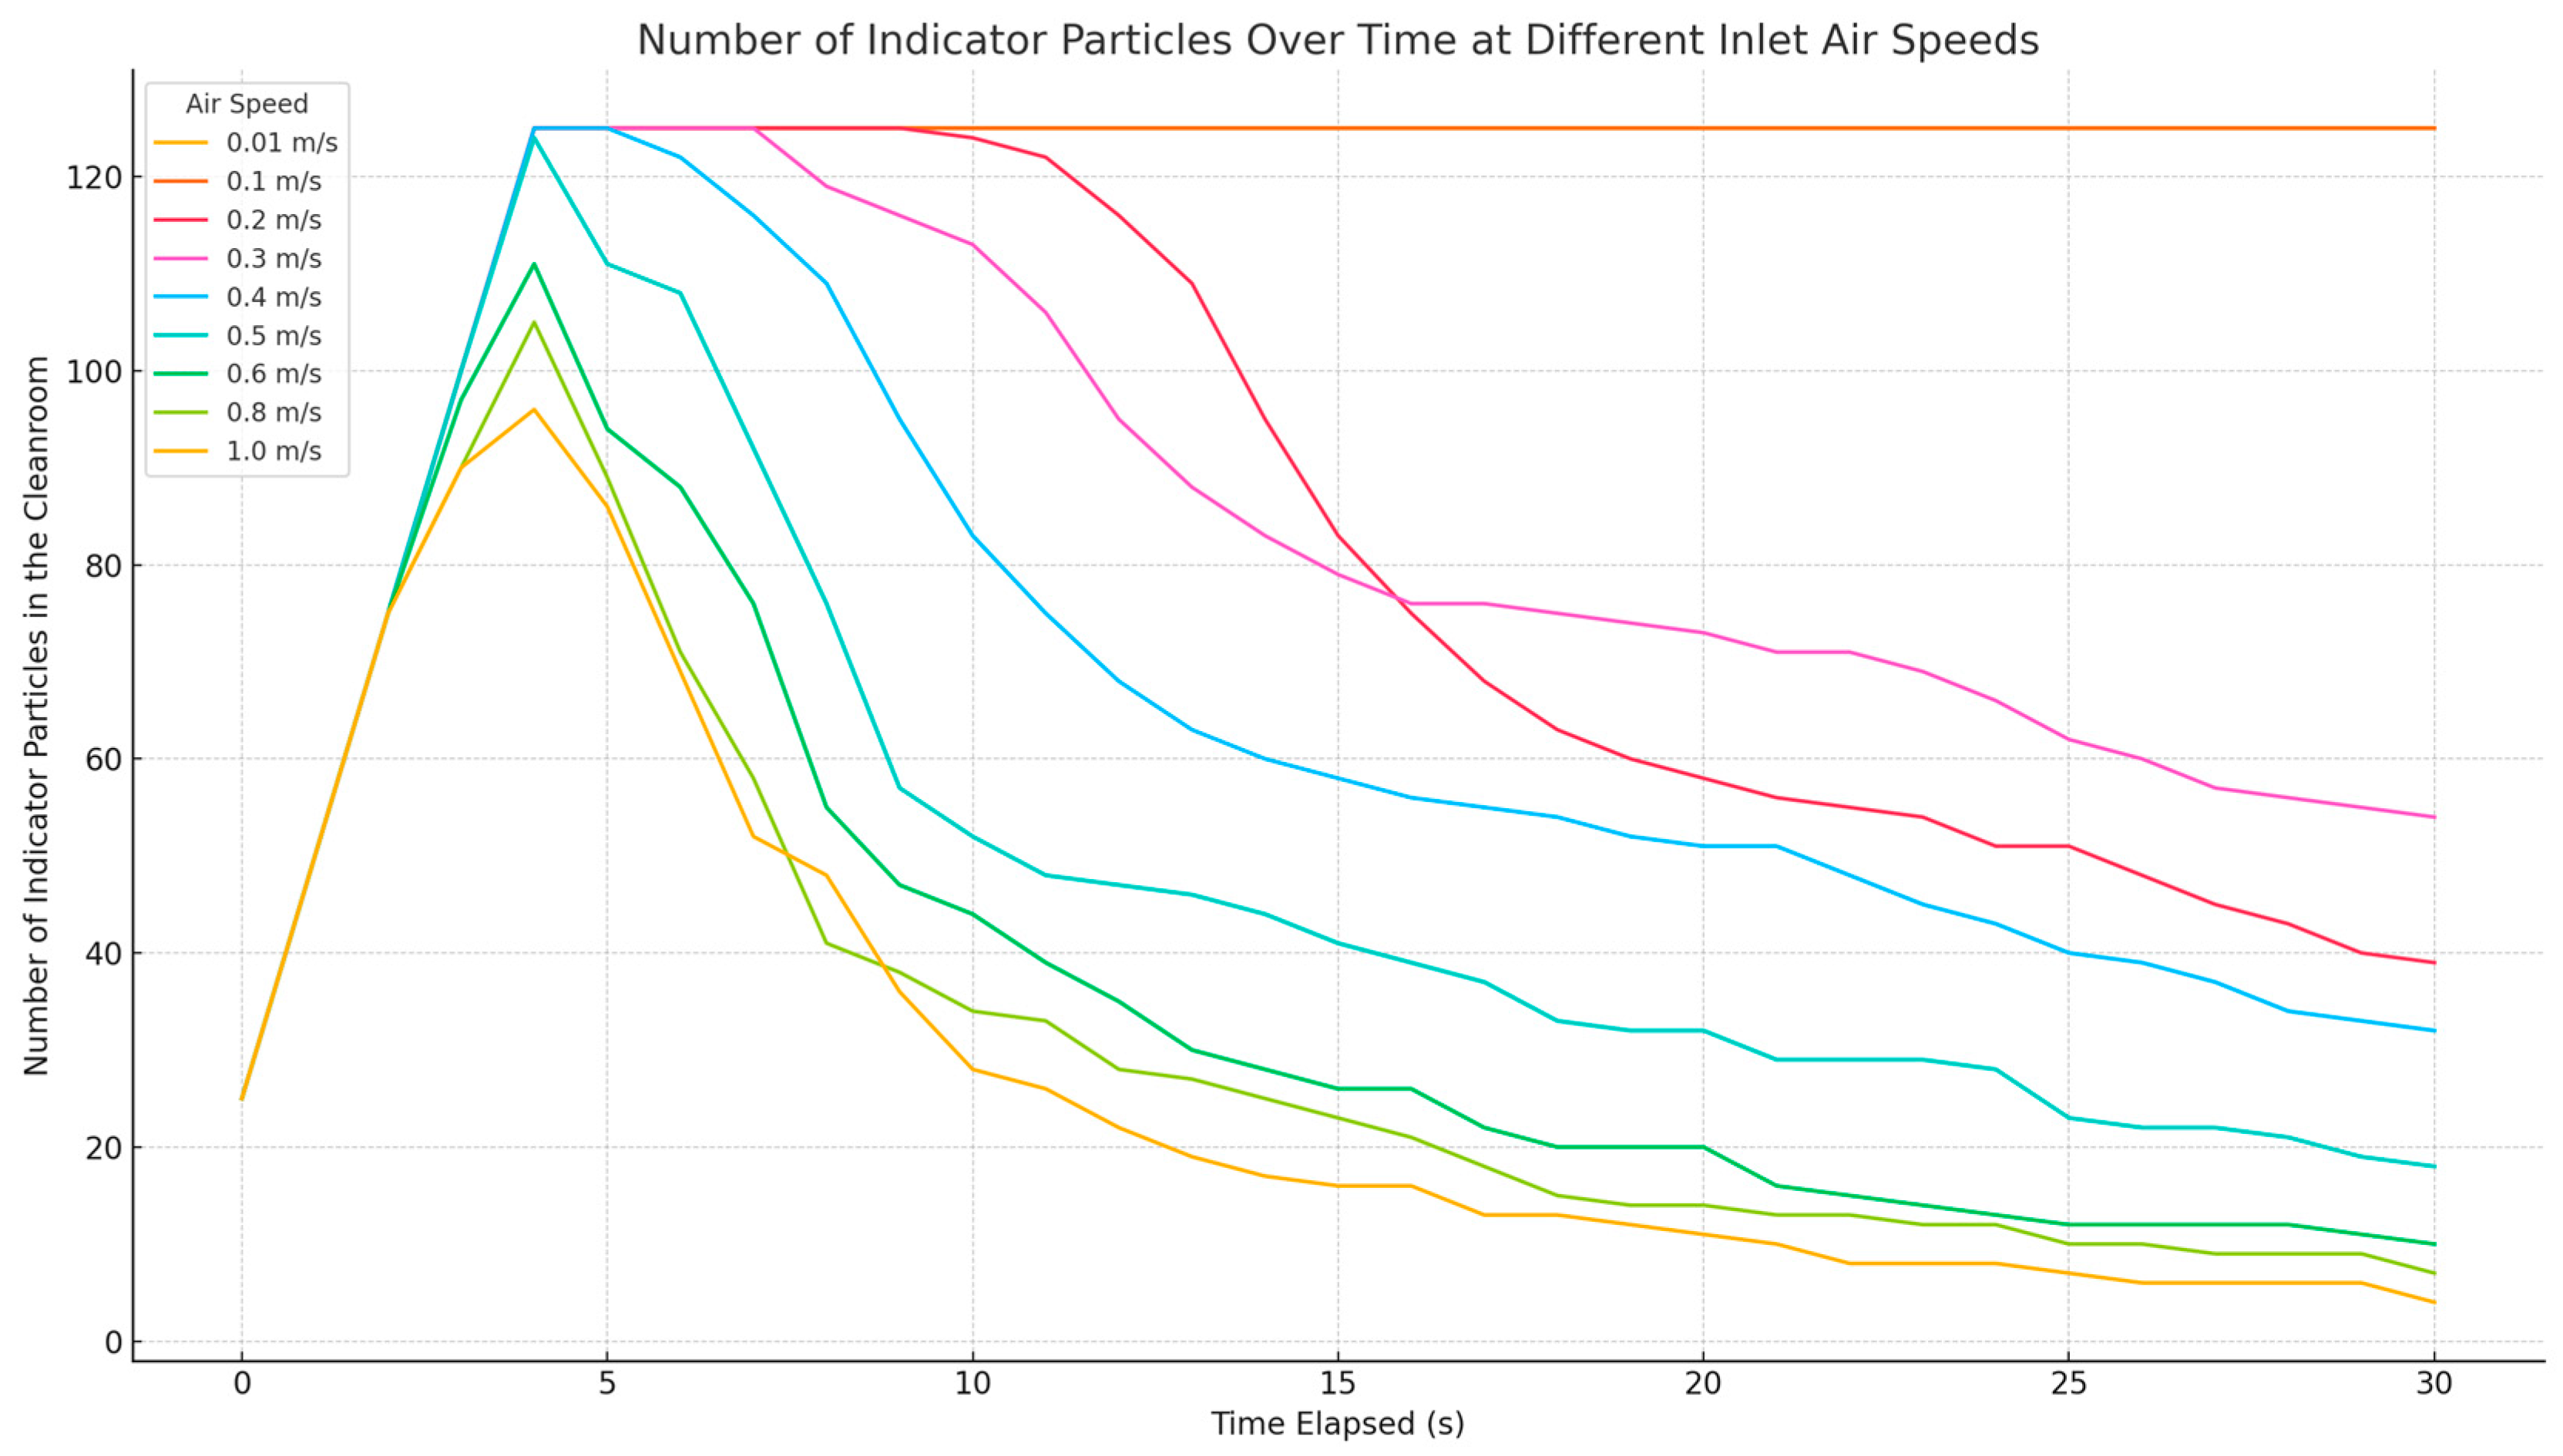
Figure 7 shows a graph illustrating the effectiveness of contaminant particle removal at various airflow velocities, under conditions where indicator particles were introduced every second from the beginning of the operator’s movement to the moment they stopped at the opposite wall of the cleanroom (0 to 4 s of the simulation). A total of 125 indicator particles were introduced into the cleanroom environment.
An analysis of
Figure 7 clearly showed that the supply air velocity directly affected the rate at which particles were removed from the clean zone. However, several important characteristics were identified:
Air velocities in the range of 0.01 m/s to 0.1 m/s were insufficient for removing particles from the critical zone within the entire simulation period (30 s).
In the velocity range of 0.6 m/s to 1.0 m/s, the particle removal efficiency remained almost unchanged, indicating that supply air speeds above 0.5–0.6 m/s were not energy-efficient.
The most significant influence of the supply air velocity on the removal efficiency of contaminant particles was observed within the 0.2–0.5 m/s range.
It should also be noted that at each moment when tracer particles were introduced, the operator was positioned differently within the cleanroom space, i.e., at varying distances from the particle source.
Therefore, to analyze in more detail the influence of supply air velocity on the removal efficiency of contaminant particles, it makes sense to consider each particle introduction separately.
Figure 8,
Figure 9,
Figure 10,
Figure 11 and
Figure 12 present graphs showing the efficiency of contaminant particle removal from the working zone at various supply air velocities, in the case of single tracer particle introductions (25 particles each) at different time intervals:
at the exact moment the operator started moving (
Figure 8),
one second after the operator began to move (
Figure 9),
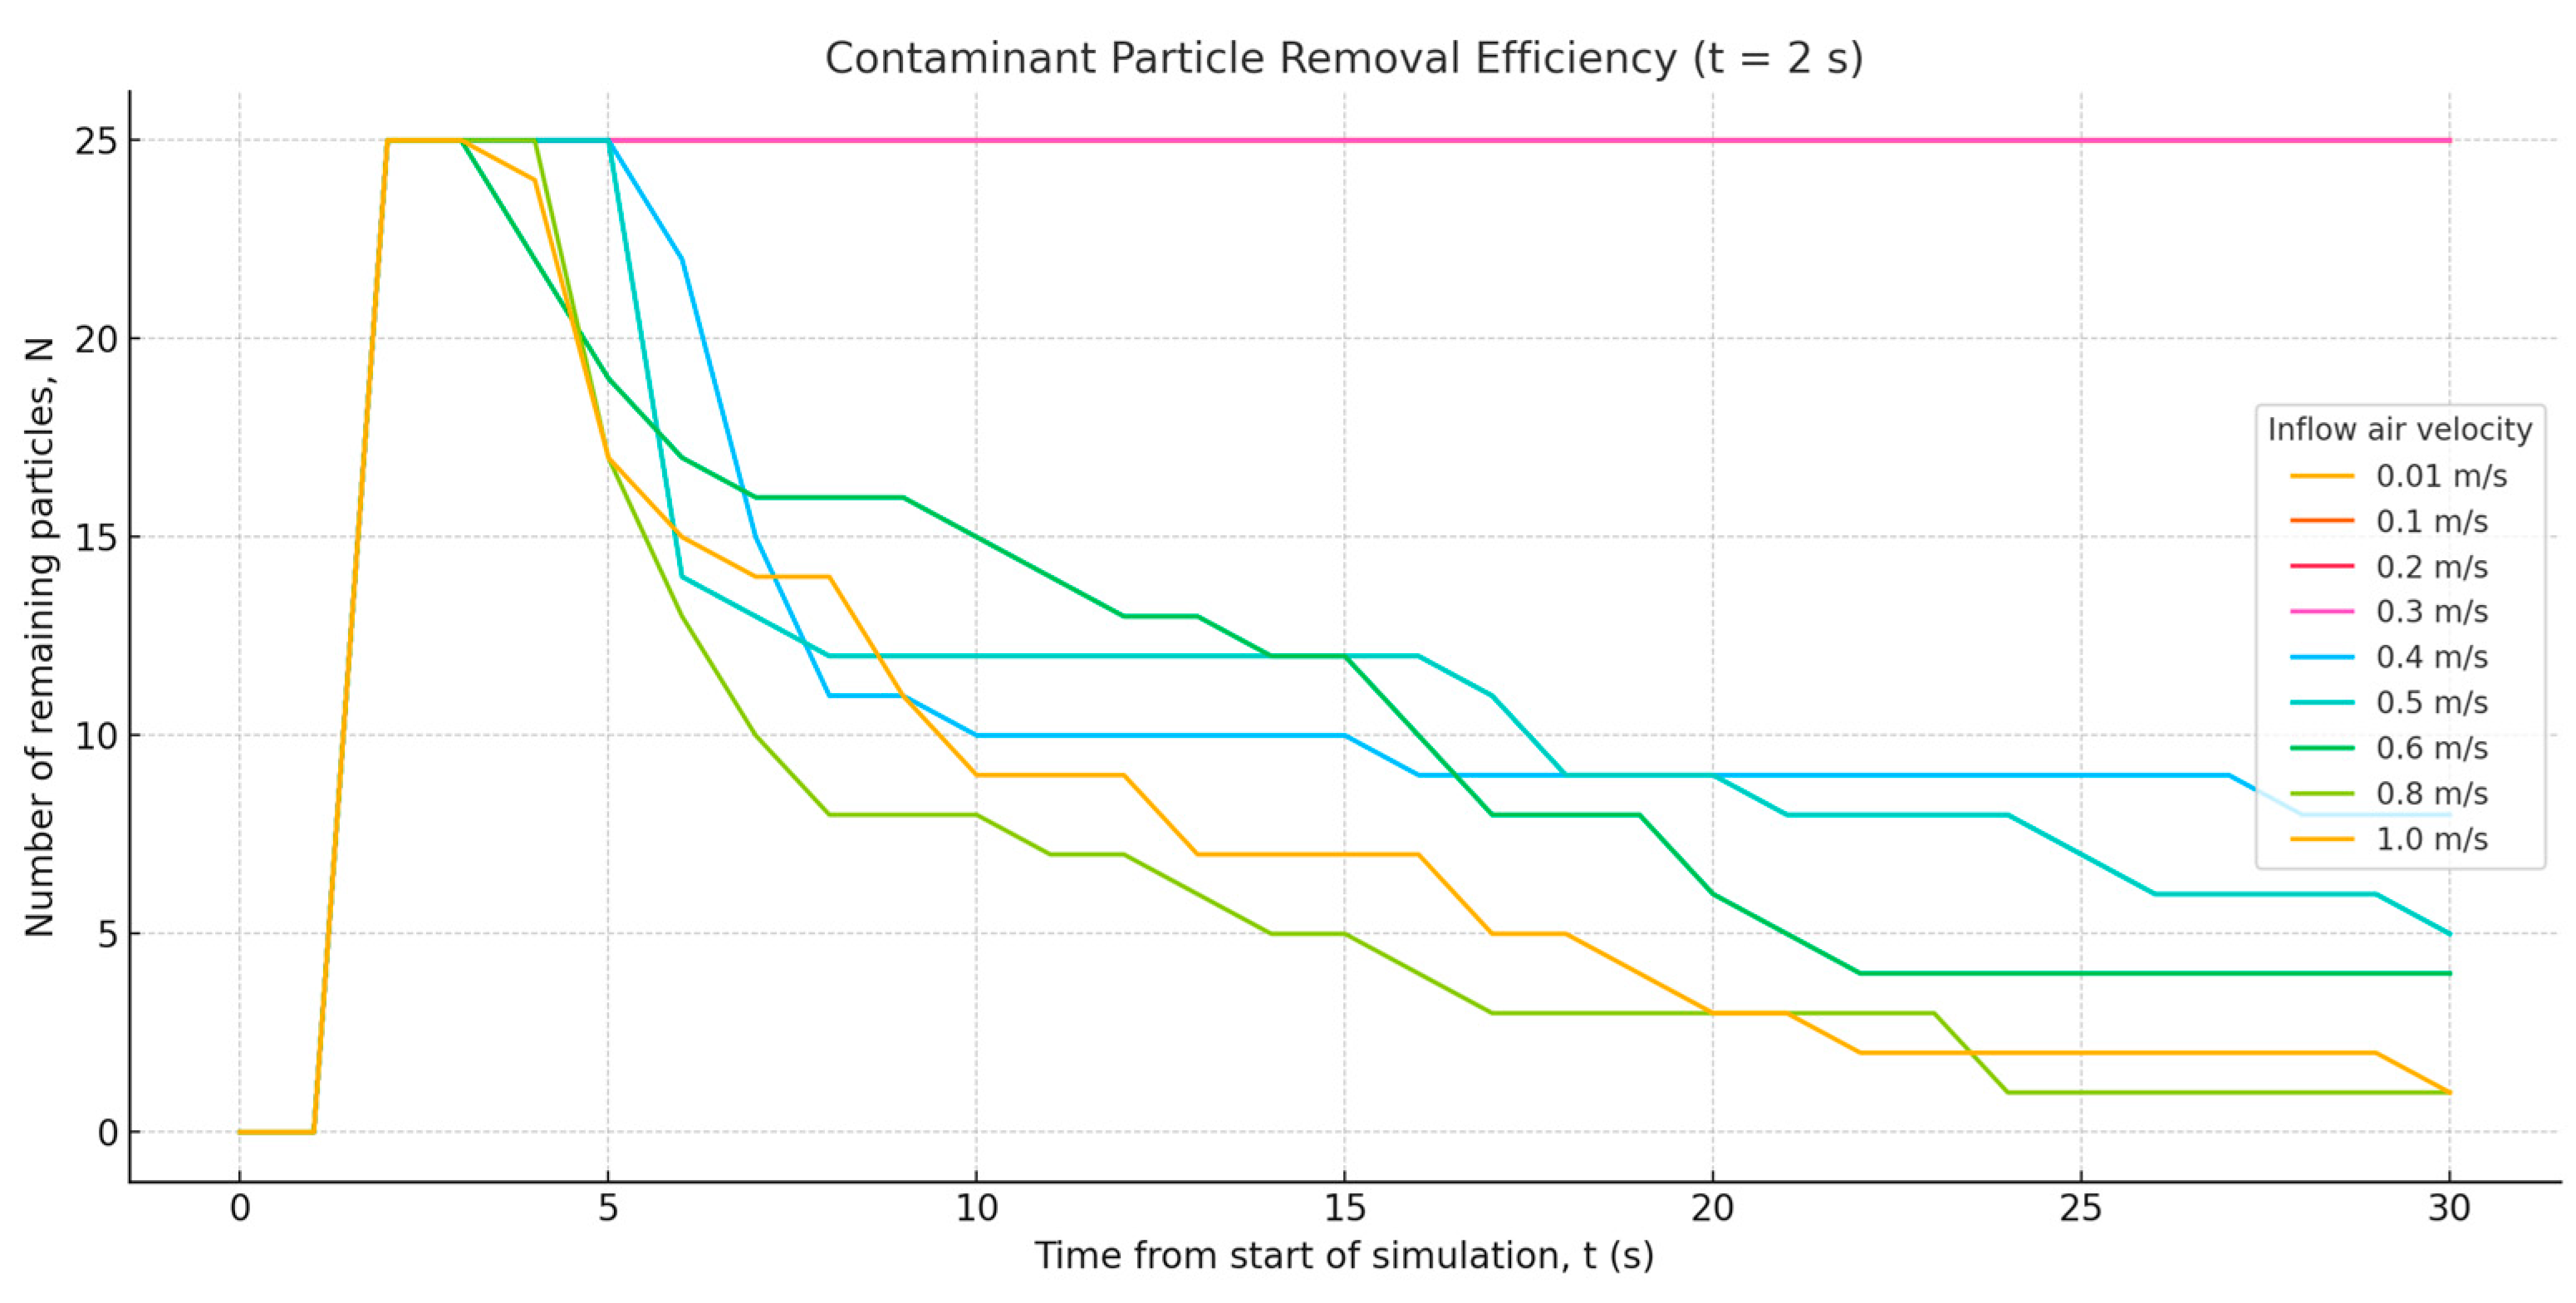
two seconds after the start of movement (
Figure 10),
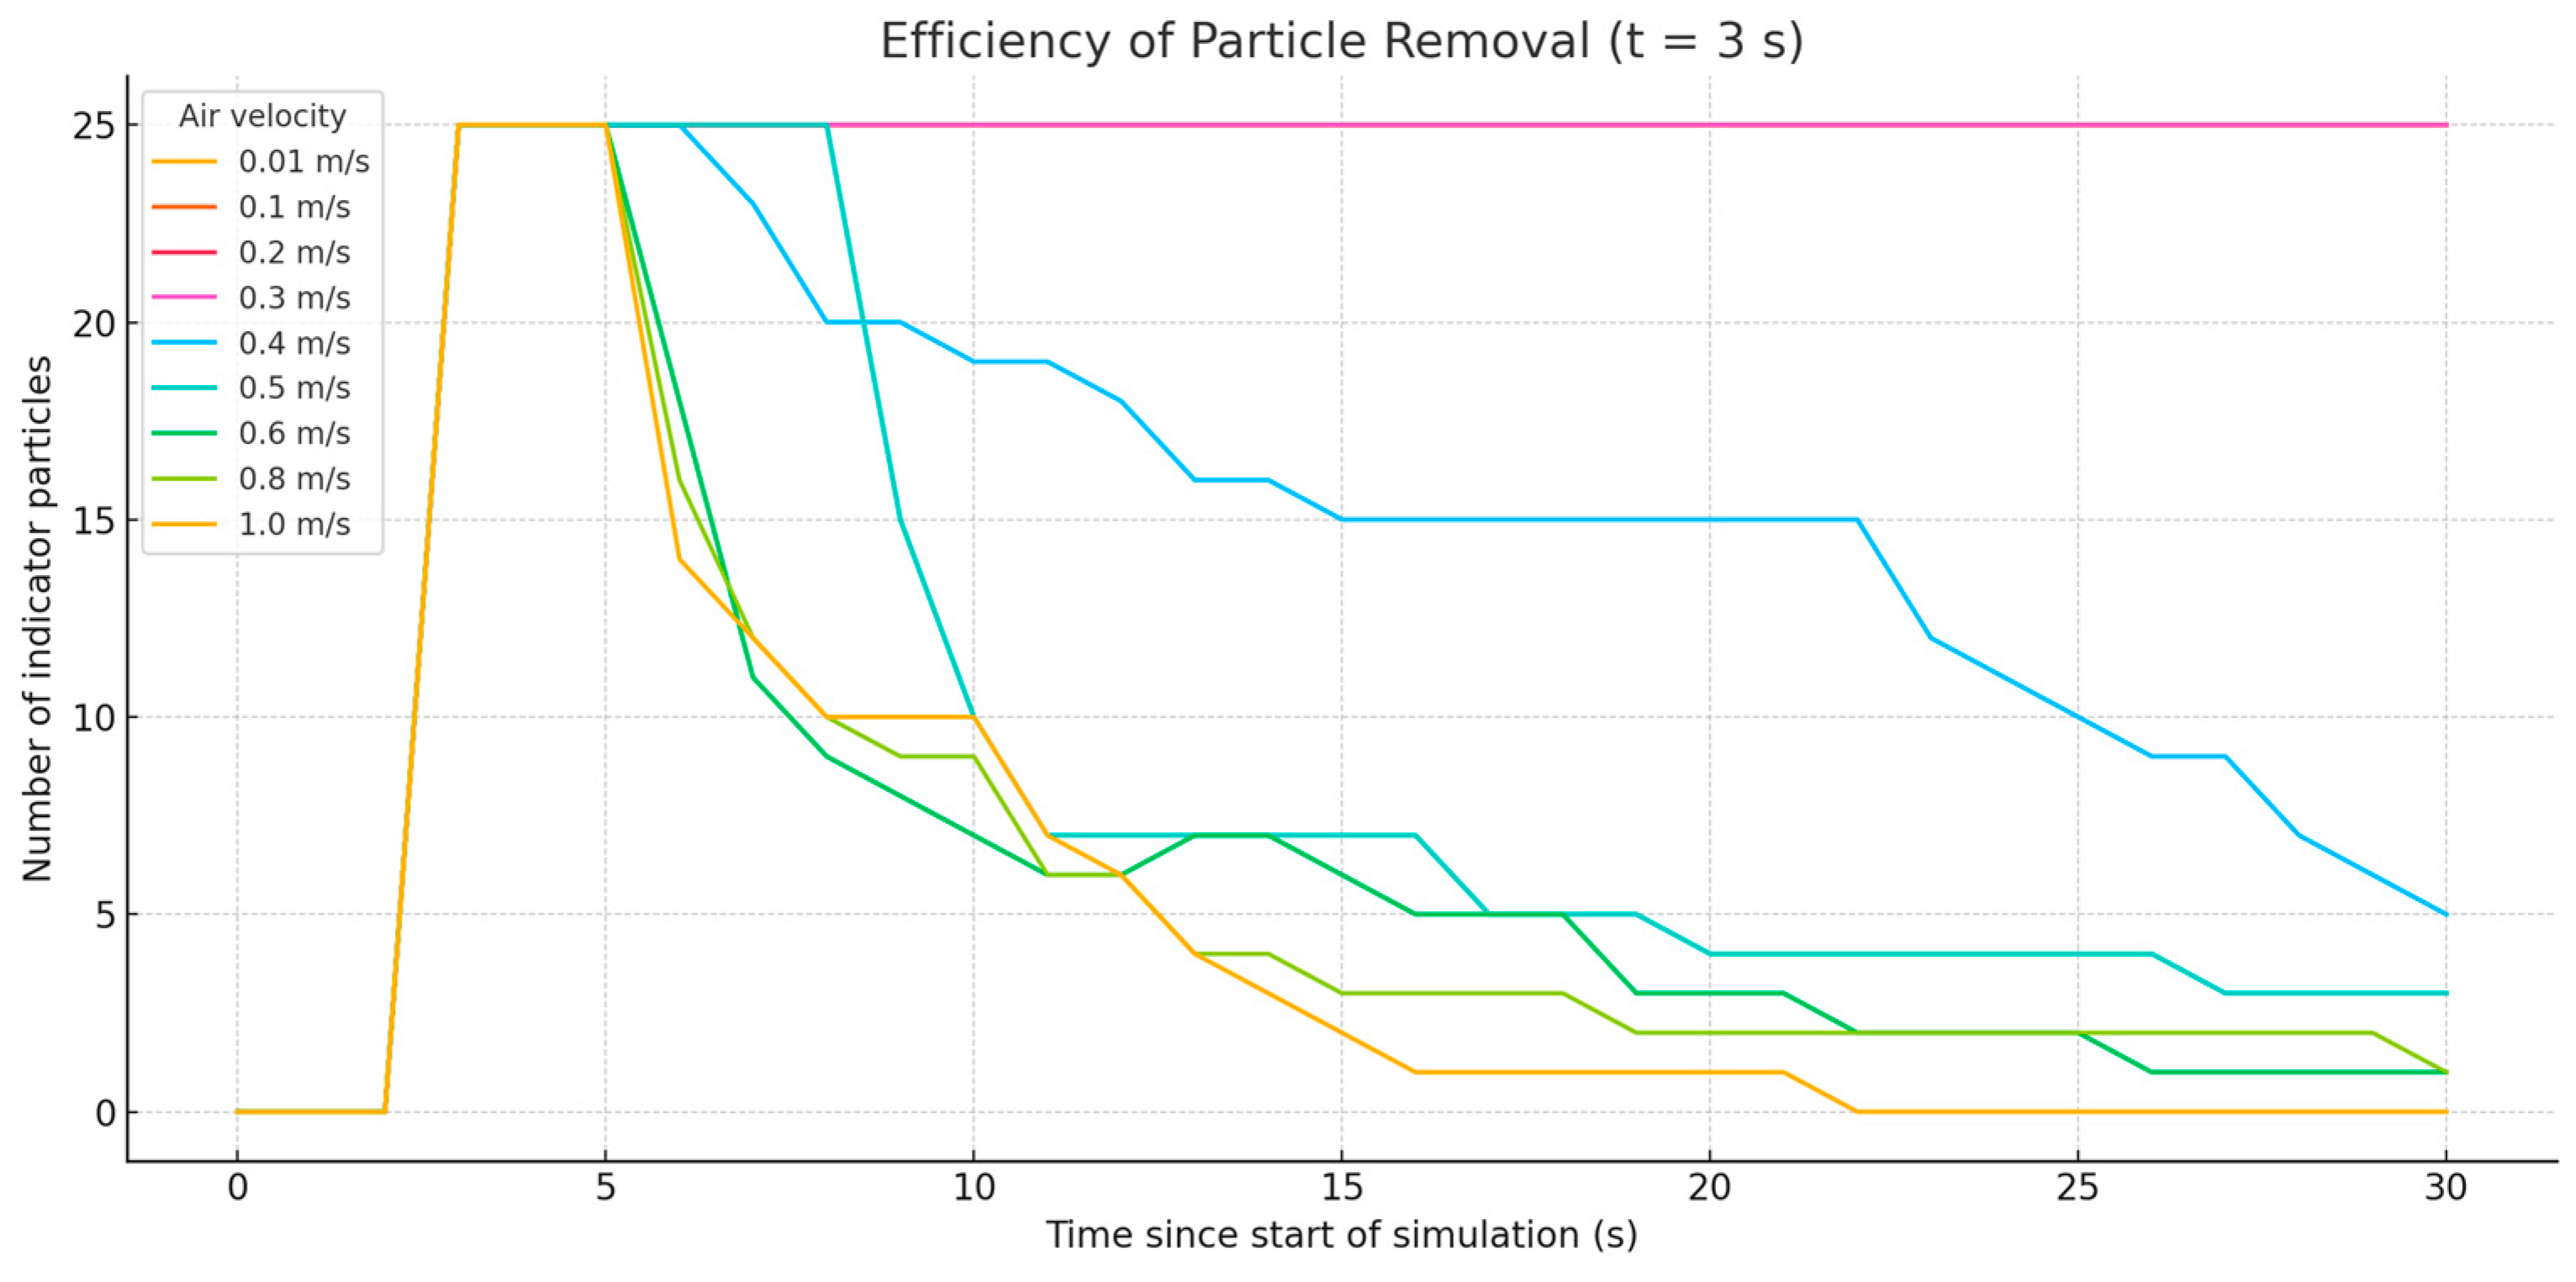
three seconds after the start of movement (
Figure 11),
four seconds after the start of movement (
Figure 12).
As a result of analyzing each graph individually, the dependencies identified during the analysis of
Figure 7 were confirmed, while additional observations were revealed:
At the moment the operator began moving (
Figure 8), when a stable unidirectional airflow was maintained near the contaminant source, a direct correlation between contaminant removal efficiency and airflow velocity was confirmed.
At the moments when the operator crossed the contamination generation zone (
Figure 9,
Figure 10,
Figure 11 and
Figure 12), particles entered recirculation zones that inevitably formed around the moving operator. As a result, a situation may occur in which an airflow with lower velocity removes contaminant particles from the workspace more effectively than a higher-velocity stream. For example, in
Figure 10, an airflow of 0.2 m/s removed particles faster than one at 0.3 m/s. This suggests that removal efficiency also depends on the relative location of the contamination source.
In such cases, the dominant factor influencing removal efficiency is not the air supply velocity but the direction of the airflow in which the indicator particle is located:
At the moment the operator reached the opposite wall of the room (
Figure 12), where the airflow direction near the source began to stabilize again, a direct correlation between contaminant particle removal and supply airflow velocity was once again observed, similar to the behavior in
Figure 7.
The non-linear behavior observed in
Figure 7,
Figure 8,
Figure 9,
Figure 10,
Figure 11 and
Figure 12, particularly the unexpected higher particle removal efficiency at 0.2 m/s compared to 0.3 m/s, can be attributed to the development of localized airflow recirculation zones near the working surface and around obstructions, such as the table. Although this explanation was initially presented qualitatively, additional CFD post-processing was conducted to validate this behavior. The analysis of streamline patterns and velocity vectors revealed that at 0.3 m/s, stronger vortex structures formed beneath the table due to the interaction between incoming air and surface boundaries, which delayed the transport of contaminants. In contrast, at 0.2 m/s, the lower inertia of the airflow allowed for smoother passage beneath the table, reducing the formation of these stagnant zones and promoting more uniform clearance. This phenomenon emphasizes that optimal contaminant removal is not solely dependent on increasing velocity but also on the interaction between airflow and geometrical features of the room.
Thus, based on a comprehensive analysis of
Figure 7,
Figure 8,
Figure 9,
Figure 10,
Figure 11 and
Figure 12, it can be concluded that the effectiveness of particle removal was directly influenced by the supply airflow velocity. However, when a moving operator was present, this relationship can be disrupted. Therefore, the main task in selecting the optimal supply airflow velocity was to determine a velocity that allowed for the fastest possible recovery of the unidirectional airflow pattern, which was disturbed by the operator’s movement.
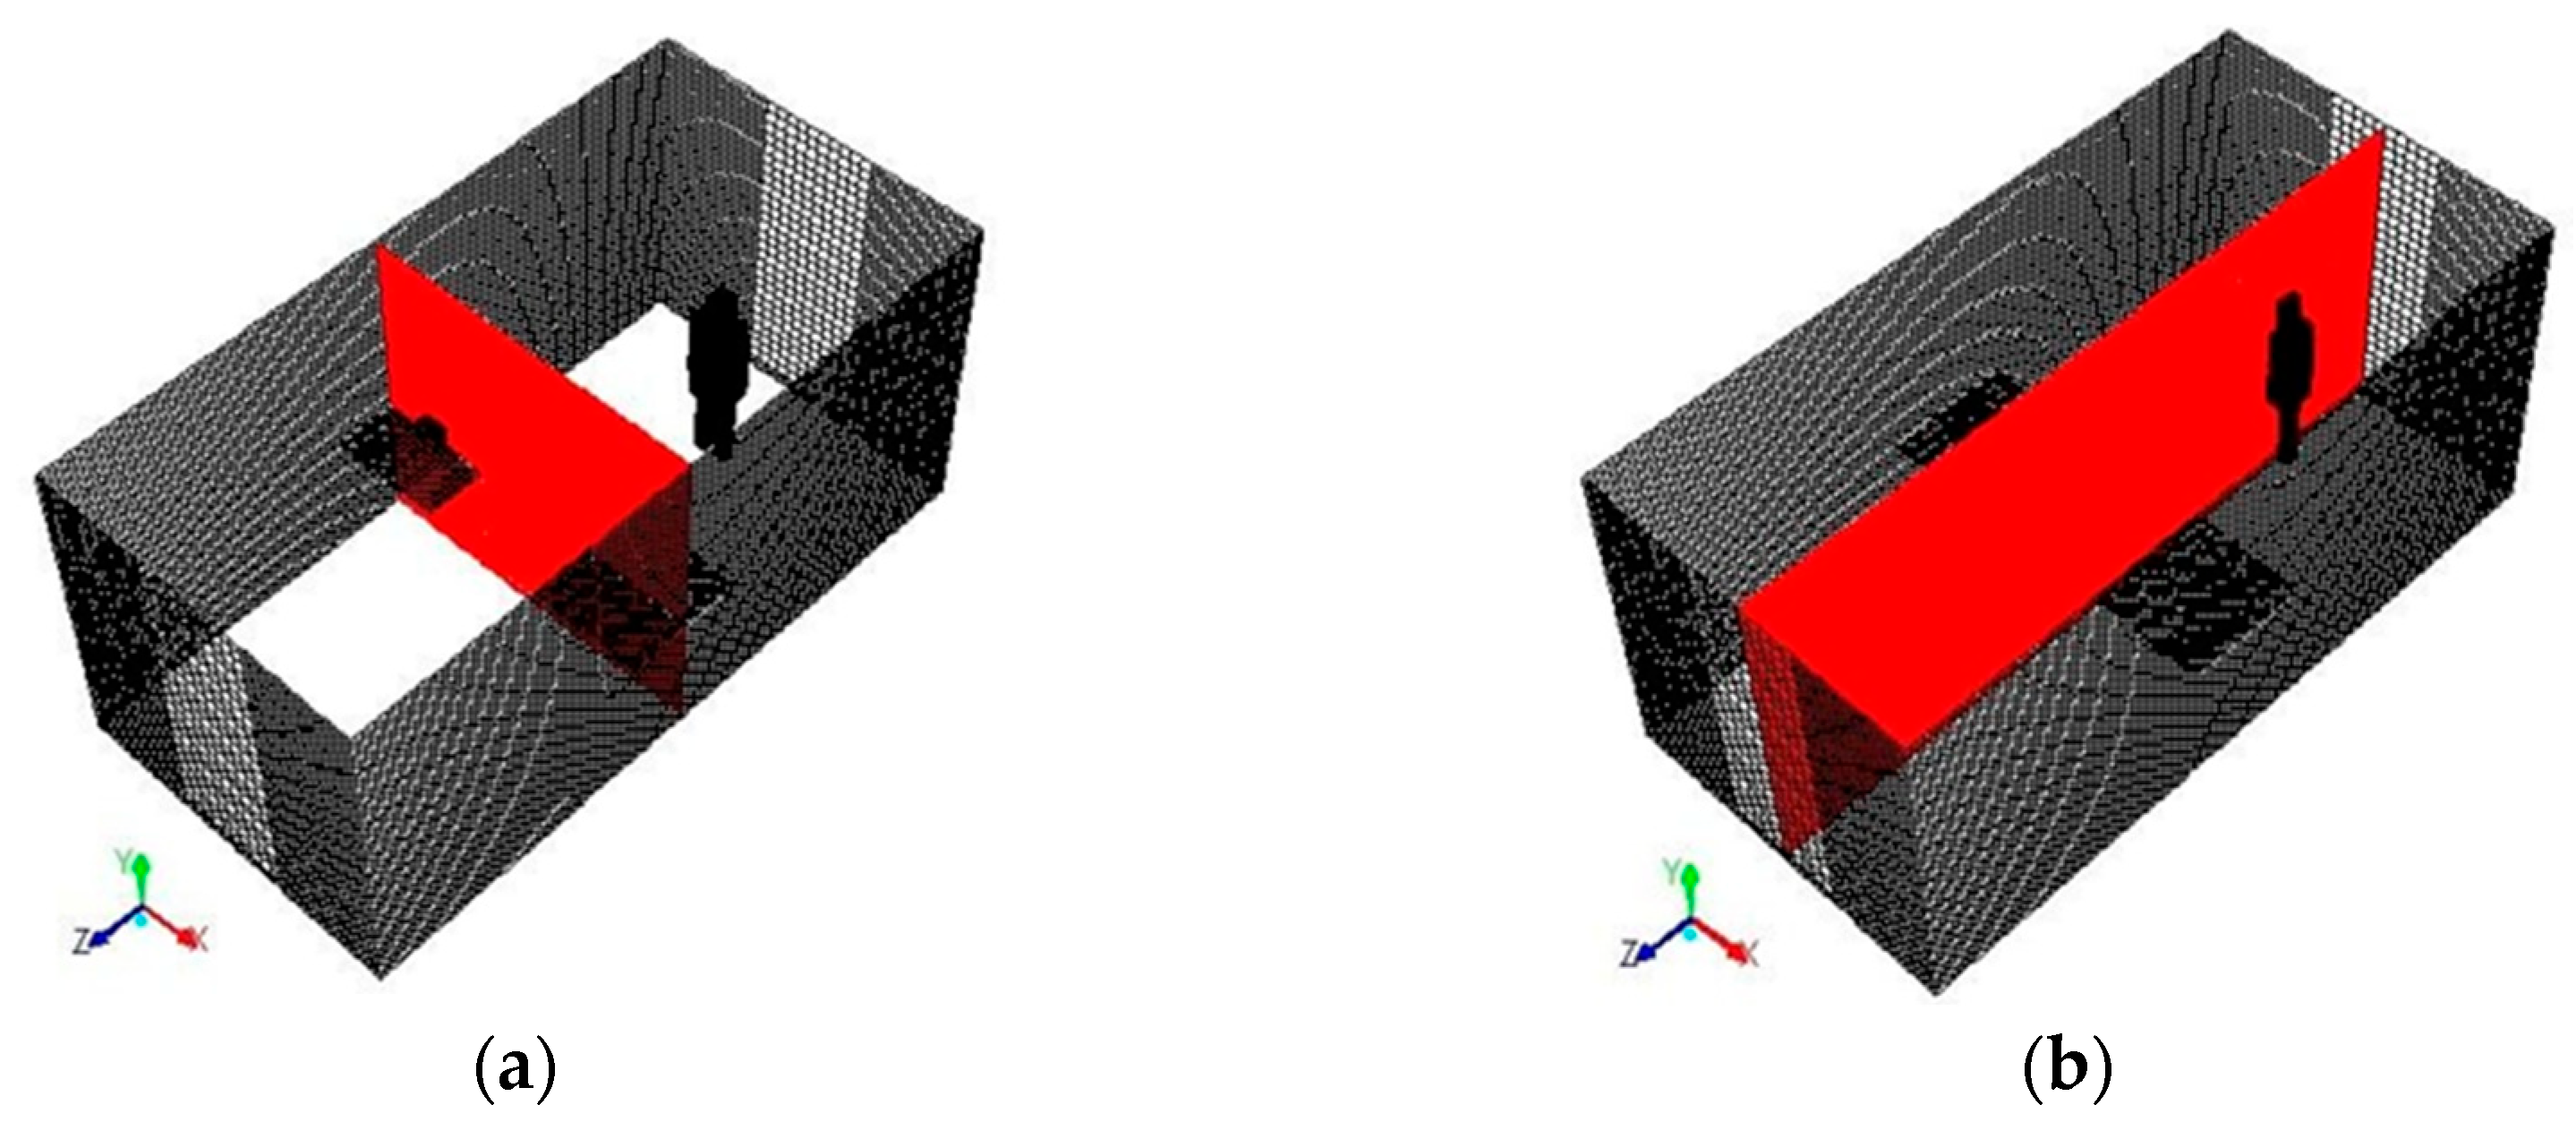
To study the influence of the air velocity at the inlet of the cleanroom on the recovery time (stabilization) of the disturbed airflow caused by the operator’s movement along one of the room’s axes, two indicator planes were selected (
Figure 13):
(a) A plane intersecting the cleanroom space along the Z-axis, dividing the room into two equal volumes.
(b) A plane intersecting the cleanroom space along the X-axis, likewise dividing the room into two equal parts.
The airflow stabilization time was defined as the period from the beginning of the operator’s movement to the moment the airflow in the indicator planes returned to its original unidirectional pattern.
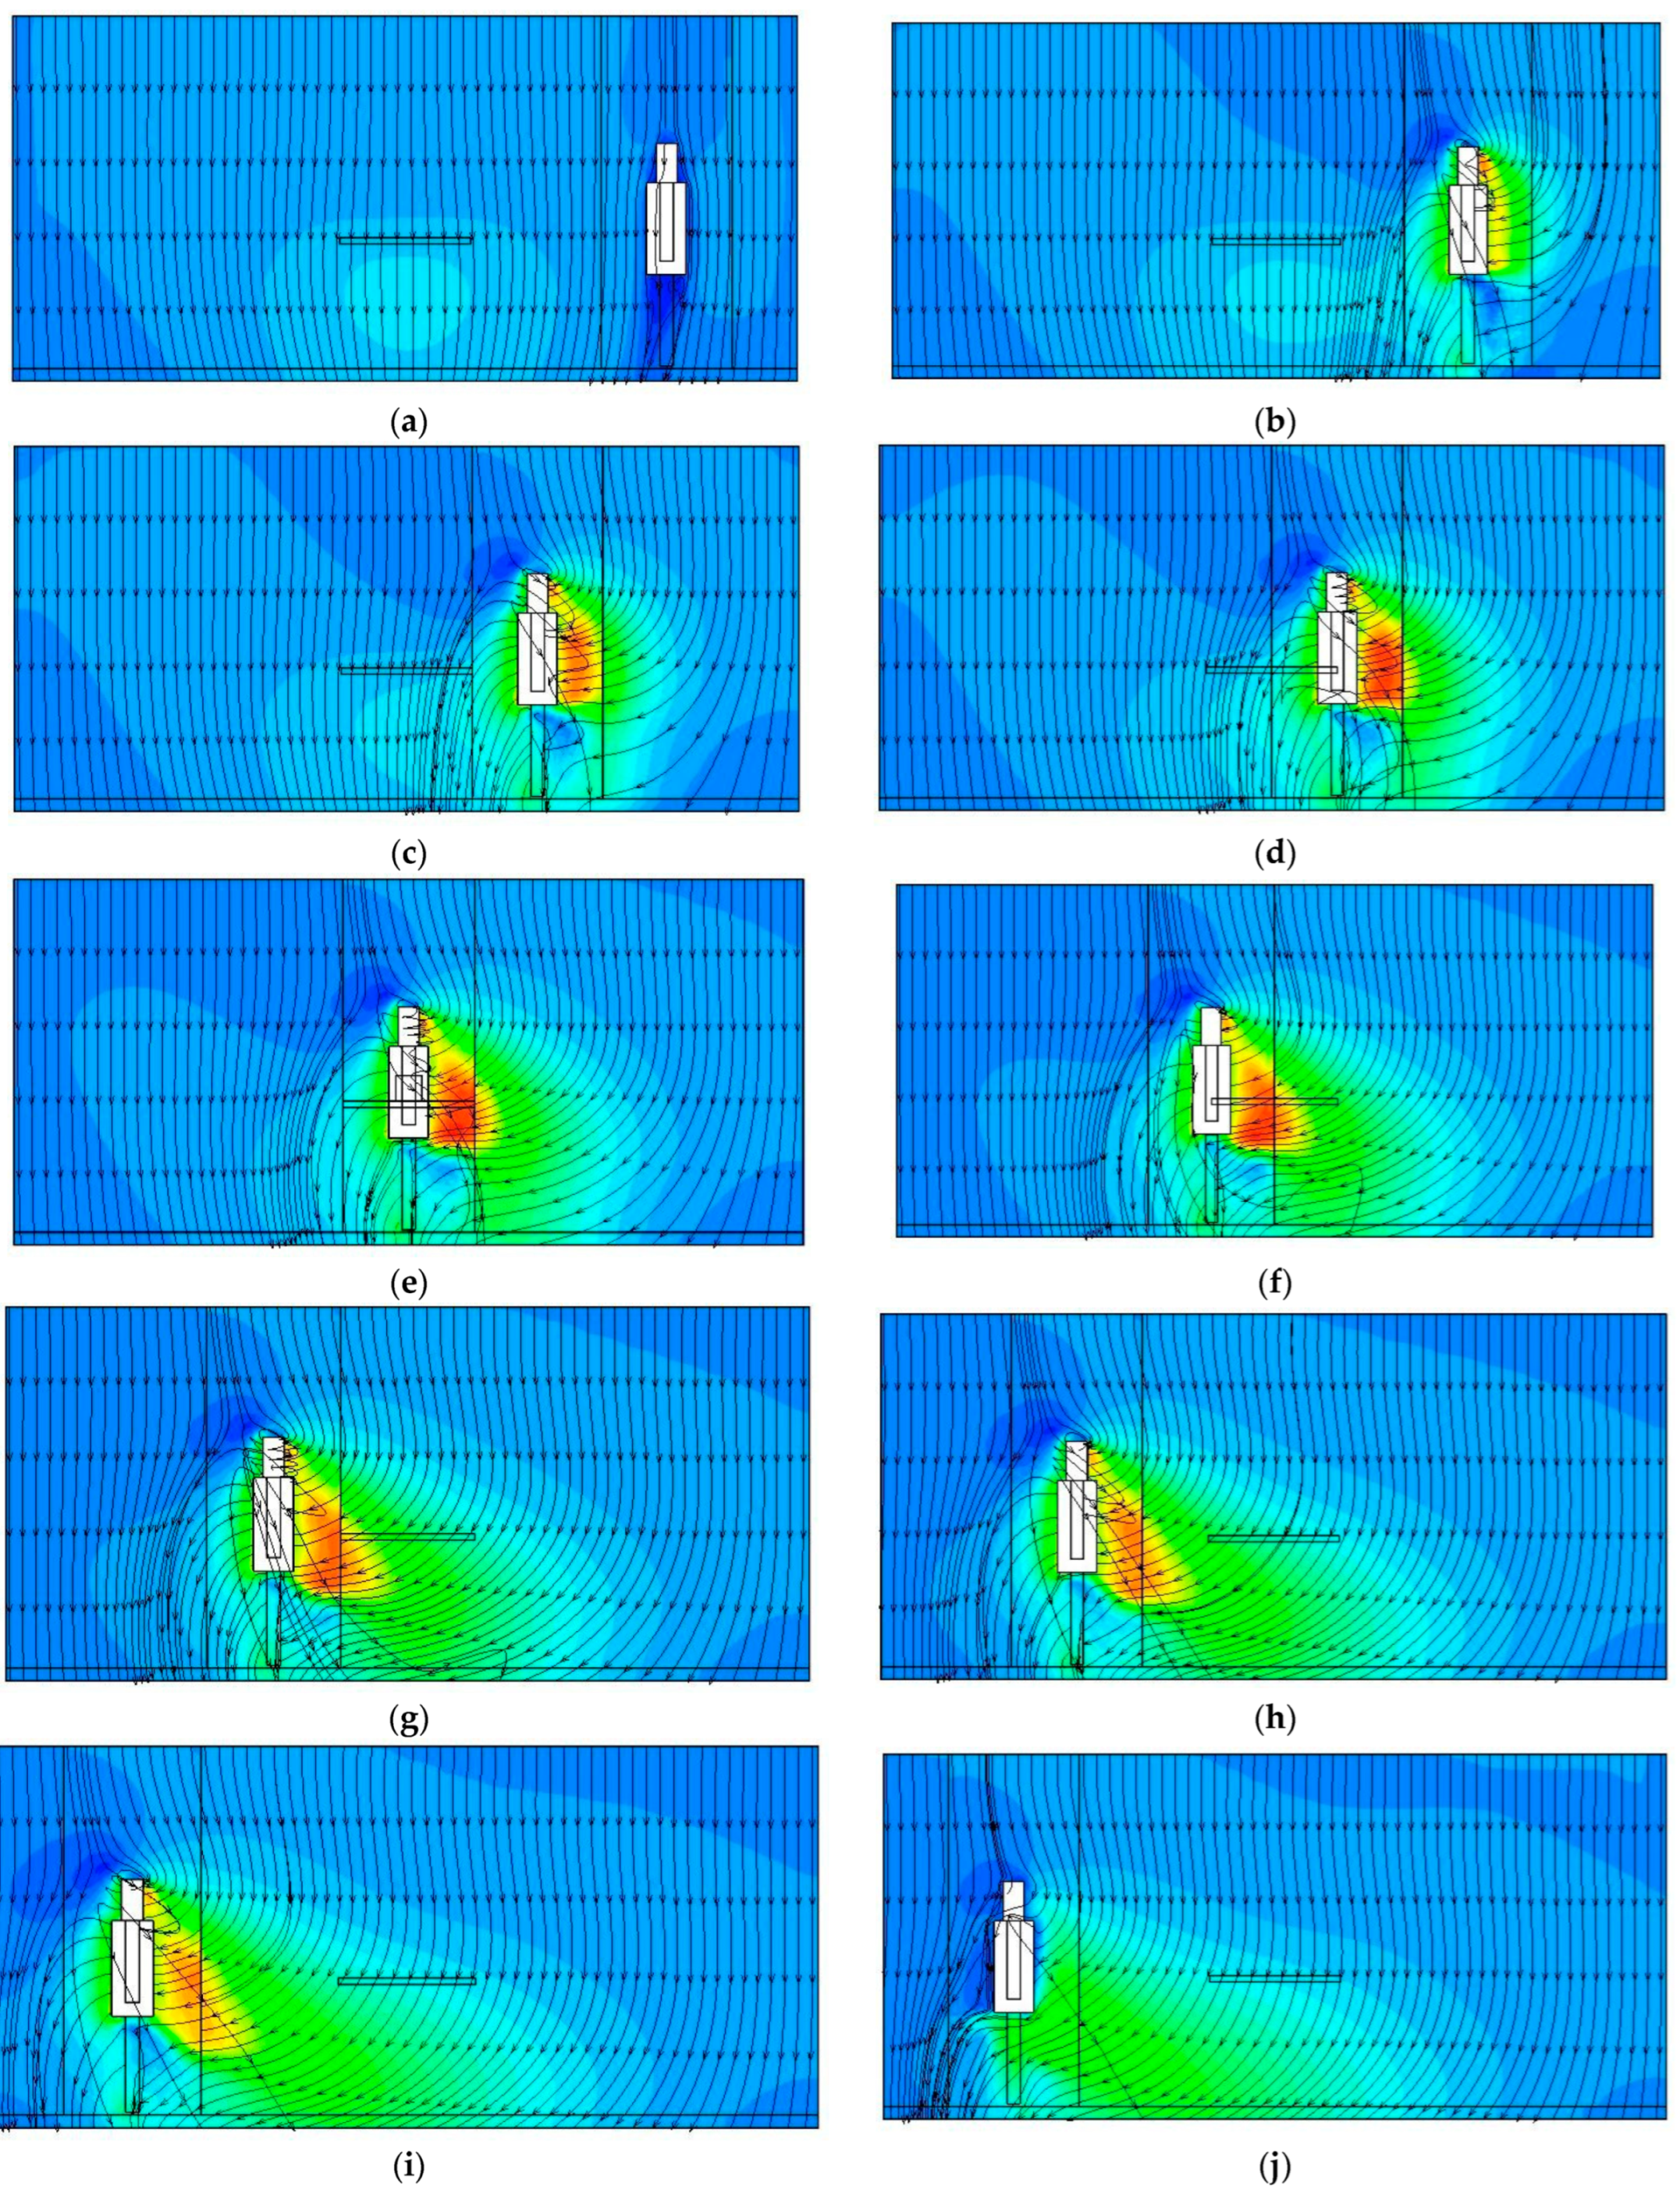
The trajectory of the airflow in indicator plane A at the moment the operator began to move is shown in
Figure 14a. When the operator crossed the center of the room, the trajectory was as illustrated in
Figure 14b.
The results obtained from measuring the airflow stabilization time are presented in
Table 3. As a result, a graph can be constructed to illustrate the relationship between airflow stabilization time
t and the supply air velocity
v at the cleanroom inlet.
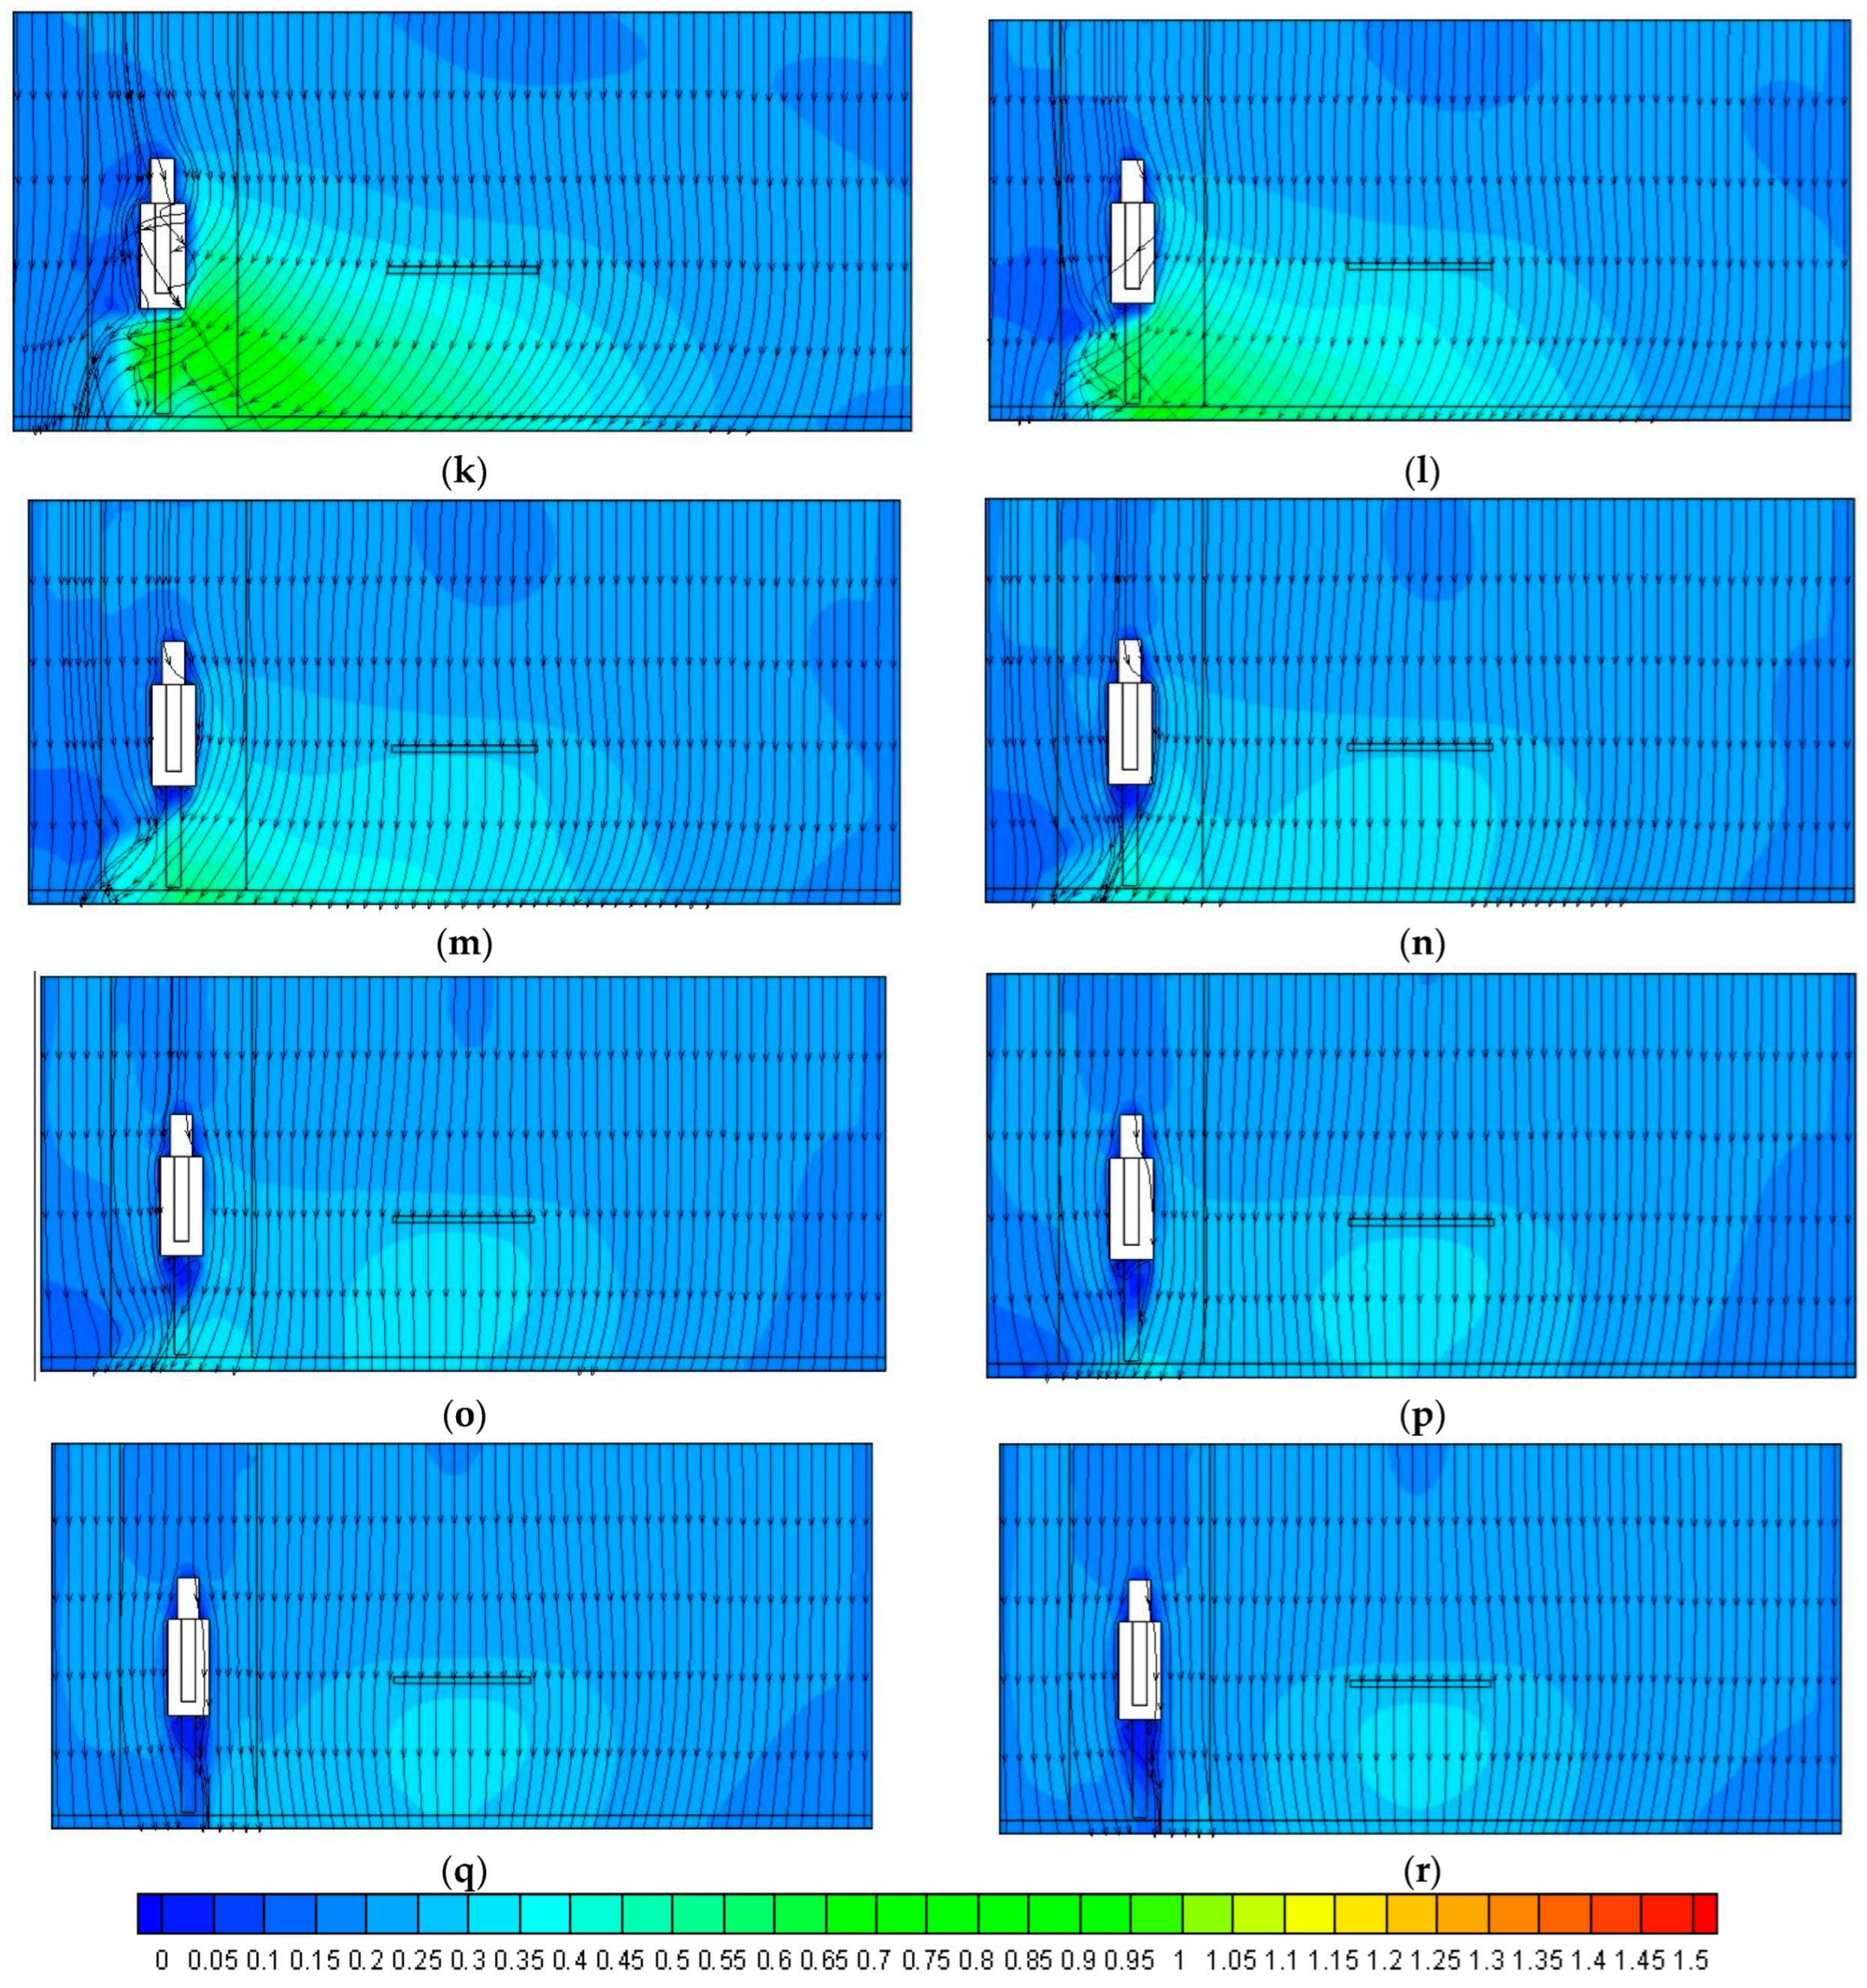
The operator’s movement caused significant disturbances in the airflow within the cleanroom and, therefore, actively influenced the rate of contaminant particle removal from the clean zone.
The supply air velocity had a direct effect on the stabilization time of the airflow after it had been disrupted by the operator’s movement.
When the air velocity reached 0.5 m/s or higher, the differences in airflow stabilization time became negligible.
During the operator’s movement, various vortex structures formed, which in practice may serve as “transport tunnels” for airborne contaminants. Consequently, the longer the airflow takes to stabilize, the greater the likelihood that contaminants will spread across a significant portion of the cleanroom space.
These disturbances can be conditionally divided into two types:
The first type of vortex, occurring in close proximity to the operator, tends to dissipate quickly after the operator stops, while the second type can persist significantly longer (2–3 times longer).
The difference in airflow stabilization time tended to decrease as supply air velocity increased. For example, the difference in stabilization time when the air velocity increased from 0.1 m/s to 0.2 m/s was much greater than the difference between 0.3 m/s and 0.4 m/s (approximately 4.5 s and 1 s for indicator surface A, and 10.5 s and 2 s for indicator surface B, respectively).
3.2. Evaluation of Thermodynamic Performance and Energy Efficiency
To assess the thermodynamic performance and energy efficiency of the proposed HVAC system—which incorporates a single-stage vapor-compression cycle with energy recovery through an auxiliary condenser—a comparative analysis of energy consumption was carried out. This evaluation focused on air treatment systems that do not involve the mixing of supply and exhaust air streams, which are commonly used in cleanroom environments.
The analysis involved estimating the energy requirements for cooling/dehumidification and heating of the supply air needed to serve a complex of cleanrooms. The proposed system was compared with several conventional systems under the same operating conditions:
A basic single-pass air conditioning system,
A system with an additional hydraulic loop,
A supply and exhaust system with a plate heat exchanger,
A supply and exhaust system with air-cooled heat pump integration.
Input parameters and calculation methods were derived from established methodologies. The proposed system’s compressor corresponded to a cooling capacity of 273.6 kW and a reheating capacity of 81.2 kW. The auxiliary heat exchanger in the developed scheme contributed an additional 384.1 kW of thermal energy in summer, which can be repurposed for technological applications. In the heating season, the system generated 294.3 kW of heating capacity using the vapor-compression cycle, while the auxiliary condenser produced up to 210.2 kW of cooling potential for reuse.
The total electric and thermal energy consumption of each configuration was assessed, allowing a practical comparison of efficiency across HVAC technologies. This approach serves as an indirect validation of the energy-saving potential and thermodynamic effectiveness (e.g., COP equivalent) of the proposed system under typical cleanroom load profiles. Future work will incorporate detailed COP calculations using simulation tools to further optimize the system’s performance.
4. Discussion
The simulation results confirmed a strong correlation between supply air velocity and the efficiency of airborne contaminant removal, supporting findings from previous studies on airflow behavior in cleanroom environments. This aligns with earlier research indicating that increased airflow enhances particle transport and reduces contamination, especially in unidirectional or turbulent-controlled ventilation systems.
A key contribution of this study lies in evaluating dynamic disturbances caused by human activity—specifically, operator movement. The transient aerodynamic wake generated by motion introduced localized disruptions that acted as particle transport pathways. These effects have been identified in earlier empirical studies but are rarely integrated into CFD simulations of cleanroom performance. Our approach demonstrated the importance of accounting for these transient conditions in design and risk assessment.
The geometry of furniture and equipment was also shown to play a crucial role. The area beneath the operating table consistently exhibited recirculation zones, even at high inlet velocities. These stagnant regions allowed for prolonged particle retention, highlighting a critical need to re-evaluate furniture design and spatial layout in cleanrooms—a topic that has received limited attention in prior CFD-based studies.
Interestingly, particle removal efficiency did not improve significantly beyond the 0.6–1.0 m/s velocity threshold, which is consistent with energy-efficiency-focused research advocating for optimal rather than maximal airflow rates. Similarly, the airflow stabilization time showed the most variability at low velocities (0.1–0.5 m/s), suggesting that minor adjustments in this range can produce significant improvements in the system’s response to disturbances.
Taken together, these results have broader implications for cleanroom design in high-sensitivity sectors, such as pharmaceuticals, electronics, and biotechnology. They point to the need for smarter airflow control systems capable of dynamically adapting to human-induced disturbances. Future research could explore real-time monitoring and responsive HVAC systems, as well as multi-agent CFD models simulating multiple personnel and equipment interactions under variable operating conditions.
5. Conclusions
This study explored airflow dynamics and contaminant transport in cleanroom environments using transient CFD modeling, with a focus on how supply air velocity and operator movement affect contamination control and system efficiency.
Key findings included the following:
A clear positive relationship existed between supply air velocity and contaminant removal efficiency.
Operator movement generated aerodynamic wakes that could significantly alter airflow paths and contribute to contaminant dispersion.
Interior geometry, particularly under-table zones, contributed to the formation of recirculation areas that trap particles.
The most significant changes in airflow stabilization occurred within the 0.1–0.5 m/s supply velocity range.
A supply velocity of 0.3 m/s appeared sufficient to maintain required cleanliness levels, presenting an opportunity for substantial energy savings.
Based on the modeling results, it can be concluded that the optimal range of supply air velocities for effective contaminant removal and airflow stabilization lay between 0.2 and 0.6 m/s. Within this interval, contaminant removal efficiency remained high, while energy consumption could be significantly reduced compared to higher velocities. Notably, the velocity of 0.3 m/s was shown to provide the best trade-off between maintaining cleanliness standards and minimizing operating costs, especially in settings where recirculation was not allowed due to chemical or biological safety concerns.
To achieve these outcomes, a direct-flow air conditioning scheme without recirculation was developed and validated through CFD simulations. Practical recommendations for design optimization were proposed, including the use of alternative energy sources, such as heat pumps. These insights contribute to the ongoing development of energy-efficient, contamination-controlled ventilation systems and establish a foundation for future work involving adaptive control and intelligent cleanroom design.


 ,
, 


