Article

Research on the Performance Evaluation of Urban Innovation Spaces: A Case Study in Harbin

School of Architecture and Design, Harbin Institute of Technology, Key Laboratory of National Territory Spatial Planning and Ecological Restoration in Cold Regions, Ministry of Natural Resources, Harbin 150001, China
*
Author to whom correspondence should be addressed.
Buildings 2025, 15(13), 2258; https://doi.org/10.3390/buildings15132258
Submission received: 11 April 2025 / Revised: 17 June 2025 / Accepted: 26 June 2025 / Published: 27 June 2025
(This article belongs to the Collection Strategies for Sustainable Urban Development)

Abstract

Innovation has become a pivotal factor in driving economic growth for cities and regions. Urban innovation spaces are urban spaces where innovative economic and industrial activities, such as research, teaching, and high-tech manufacturing, are clustered. They have become hot research topics in recent years. Evaluating the performance of urban innovation spaces to promote rational resource allocation and enhance land development potential has become a critical task in urban planning. However, existing studies suffer from insufficient depth of research scales and a lack of quantitative indicators and data analysis. In response to the above gaps, this study constructed a framework for evaluating the performance of urban innovation spaces from 25 indicators of five major types, including core elements of innovation, entrepreneurship support institutions, service facilities, external environments, and diversities, aiming to quantify the performance heterogeneity of innovation spaces at the micro scale. This study took Harbin as an example and employed the entropy, kernel density estimation, and entropy-weighted TOPSIS methods, identifying four high-scoring areas of innovation spaces—the Science and Technology Innovation City area, the High-tech Industrial Development area, the core area of the old city, and the Harbin Veterinary Research Institute area—which were divided into three types: the Entrepreneurial leading area, Environmental Support area, and Balanced Development area. Finally, this study analyzed the interaction between each indicator. It was found that the correlation between the core elements of innovation and the indicators of entrepreneurship support institutions was strong and had a high degree of importance. The correlation of different types of service facility indicators is quite different, and the external environment indicators and diversity indicators are mainly affected by other indicators, especially the core elements of innovation and entrepreneurship support institutions. This paper provides a valuable tool for the performance evaluation of urban innovation spaces for researchers and urban planning decision makers.

1. Introduction

Knowledge innovation has emerged as the primary engine of wealth creation and economic growth [1]. Attracting innovative talent, creating an innovative atmosphere, and supporting the development of innovative industries play a key role in economic and social development. The concept of innovation was first proposed by the economist Joseph Schumpeter in the early 20th century [2], who believed that innovation is a self-occurring process within a system, a kind of “creative destruction”. Afterwards, scholars in the field of economics studied innovation [3,4]. In 1950, Perroux, F. [5] first proposed the growth pole theory and constructed a framework for the association between innovation activities and geospatial space. Since the 1980s, the research on the relationship between innovation and space has shown an expansion in scale: Cooke, P. [6] put forward the concept of a “regional innovation system”, and Fujita, M. et al. [7] analyzed how knowledge spillovers promote industrial agglomeration and urban development through geographic proximity, and these results have deepened the understanding of the relationship between innovation and space. Entering the 21st century, the role of knowledge innovation in economic development has significantly increased, and cities have become an important platform for the concentration of global innovation activities. Landry, C. [8] proposed the theory of the “creative city”, arguing that a “creative city” pays more attention to urban planning and emphasizes the harmonious coexistence of people, cities, and nature. Katz, B. [9] proposed the concept of “Innovative Districts”, which is a new path to stimulate the growth of a city. Currently, urban innovation spaces are hot topics that many government administrators and researchers continue to pay attention to [10].
Due to the differences in development among regions regarding the concept of “urban innovation spaces”, relevant expressions in academia are not uniform, such as “innovation clusters” [11], “innovation districts” [12], “knowledge and innovation spaces” [13], “innovation and cultural districts” [14], etc. However, most of the related definitions contain the two key words “innovation” and “city”, emphasizing characteristics such as the high concentration of innovation and entrepreneurship activities in addition to the urbanized living environment. This article uniformly refers to them as “urban innovation spaces” and defines the concept as urban spaces where innovative economic industrial activities, such as scientific research, teaching, and high-tech manufacturing, are clustered. They are a production system that brings wealth to a region [10,15]. Against the background of the development of urban land stock, the urban industrial development model has shifted from a labor-intensive to technology- and knowledge-intensive orientation towards high added value. This transformation has put forward new requirements for innovation spaces. As a core city of the old industrial base in Northeast China, Harbin is under particularly significant pressure for industrial transformation. It is necessary to conduct a scientific and reasonable performance evaluation of the city’s innovation spaces in order to identify potential areas, promote the rational allocation of resource elements, drive the aggregation of urban innovation elements, optimize as well as upgrade the industrial structure, and achieve high-quality development.
Thus far, most of the current research on the performance evaluation of innovation spaces has mainly focused on national, regional, and other macro scales in terms of its research scope. For example, Xing, Li. et al. applied the principal component analysis and cluster analysis methods in order to make an empirical and comparative analysis of the regional scientific and technological innovation capacity of 30 provinces, cities, and districts within Mainland China, and determined the comprehensive ranking of all regions’ scientific and technological innovation capacities [16]. Burke, J. et al. designed three core indicators: innovation intensity, innovation performance, and innovation impact [17]. The paper offered descriptive statistics of 50 prominent innovation spaces in the United States and compared them with the average level of the whole United States. It was found that the innovation spaces had a super-linear growth phenomenon in the three indicators. Tretyakova, E. et al. [18] combined the comprehensive indicator system with econometrics and statistical methods to evaluate the innovation performance of the Northwestern Federal District in Russia. Rodrigues, M. et al. [19] adopted a quantitative research method and used two multivariate statistical techniques, exploratory factor analysis and principal component analysis, to evaluate the innovation performance of all 308 towns and cities in Portugal. The cluster of 12 towns and cities was obtained and divided into four categories: excellent, high, average, and weak. In the existing research, many scholars mostly studied the performance evaluation of innovation spaces from a macro scale, such as country and region, while there is little research on micro in-depth evaluation levels, such as the city and block scales.
In terms of indicator selection, most of the current research started from the relevant assessment concepts and categorized as well as evaluated innovation spaces based on some basic indicators. For example, Forsyth, A. divided innovation spaces into six types, including the corridor, cluster, and core, based on purely physical indicators such as location and scale [20]. Esmaeilpoorarabi, N. et al. conducted research from the perspective of determining the local characteristics of innovation spaces, and the advantages as well as disadvantages of specific indicators. An evaluation framework was established from five areas: function, form, image, ambiance, and context [13,21,22]. Based on reviewing relevant literature, Yigitcanlar, T., and Adu McVie, R. et al. adopted the Delphi method to determine a classification framework of innovation spaces that consisted of four dimensions (feature, function, space, and context), 16 indicators, and 48 measures [23,24]. They applied the classification framework to 30 regions in southeast Queensland, Australia, adopted descriptive analysis, collected data with a Likert scale, and divided the study regions into three levels: desired, acceptable, and unsavory [25]. Rapetti, C. et al. [26,27,28] built a conceptual framework from four dimensions (urban, economic, social, and governance) based on knowledge-based urban development theory and triple Helix theory [29]. Through the research of the 22@barcelona region and Porto Digital in Brazil, they identified the key indicators for evaluating innovation performance, further verified them, and discussed the correlation among the indicators by using the DEMATEL method. Most of the studies above started from the concept of performance evaluation and established a theoretical evaluation framework, but they have not been applied to case studies and objective data analysis in innovation spaces. Youwei, T. et al. [30] used the Delphi method and case study method to construct a quantitative recognition indicator system of innovation spaces from two aspects of spatial features and element characteristics, taking Kendall Square and the Boston Innovation District as references, selecting the Nanshan District of Shenzhen as the research object. They identified the Gaoxin South District as an urban innovation space. However, they did not conduct a holistic analysis of the innovation performance indicators across all regions within the study scope. In the current research on innovation performance assessment, there is a lack of relevant studies that use objective, specific, and easily quantifiable indicators to evaluate the performance of actual cases of innovation spaces and discuss the interrelationships and mechanisms of each indicator.
Through the review of the literature above, it was found that there are some deficiencies in the existing research on the performance evaluation of innovation spaces. Firstly, in terms of research scope, most focus on macro scales such as countries and regions, while research on more micro scales, such as cities and blocks, needs to be deepened. Secondly, the existing research lacks quantitative indicators and data analysis, and there is insufficient discussion on the interrelationships and action mechanisms among various indicators. This study defined the research scope as the central urban area of Harbin and used fishnets for spatial division [31] to evaluate the performance of innovation spaces within the city at micro scales, such as the city and blocks. A performance evaluation indicator system comprising 25 indicators was constructed across five dimensions: core elements of innovation, entrepreneurship support institutions, service facilities, external environments, and diversities. Four distinct high-scoring innovation spaces were identified within the study area. Finally, the DEMATEL method (Decision-making Trial and Evaluation Laboratory) was applied to analyze the interdependencies among the indicators, revealing critical factors that influence innovation areas’ development at a deeper analytical level.

2. Materials and Methods
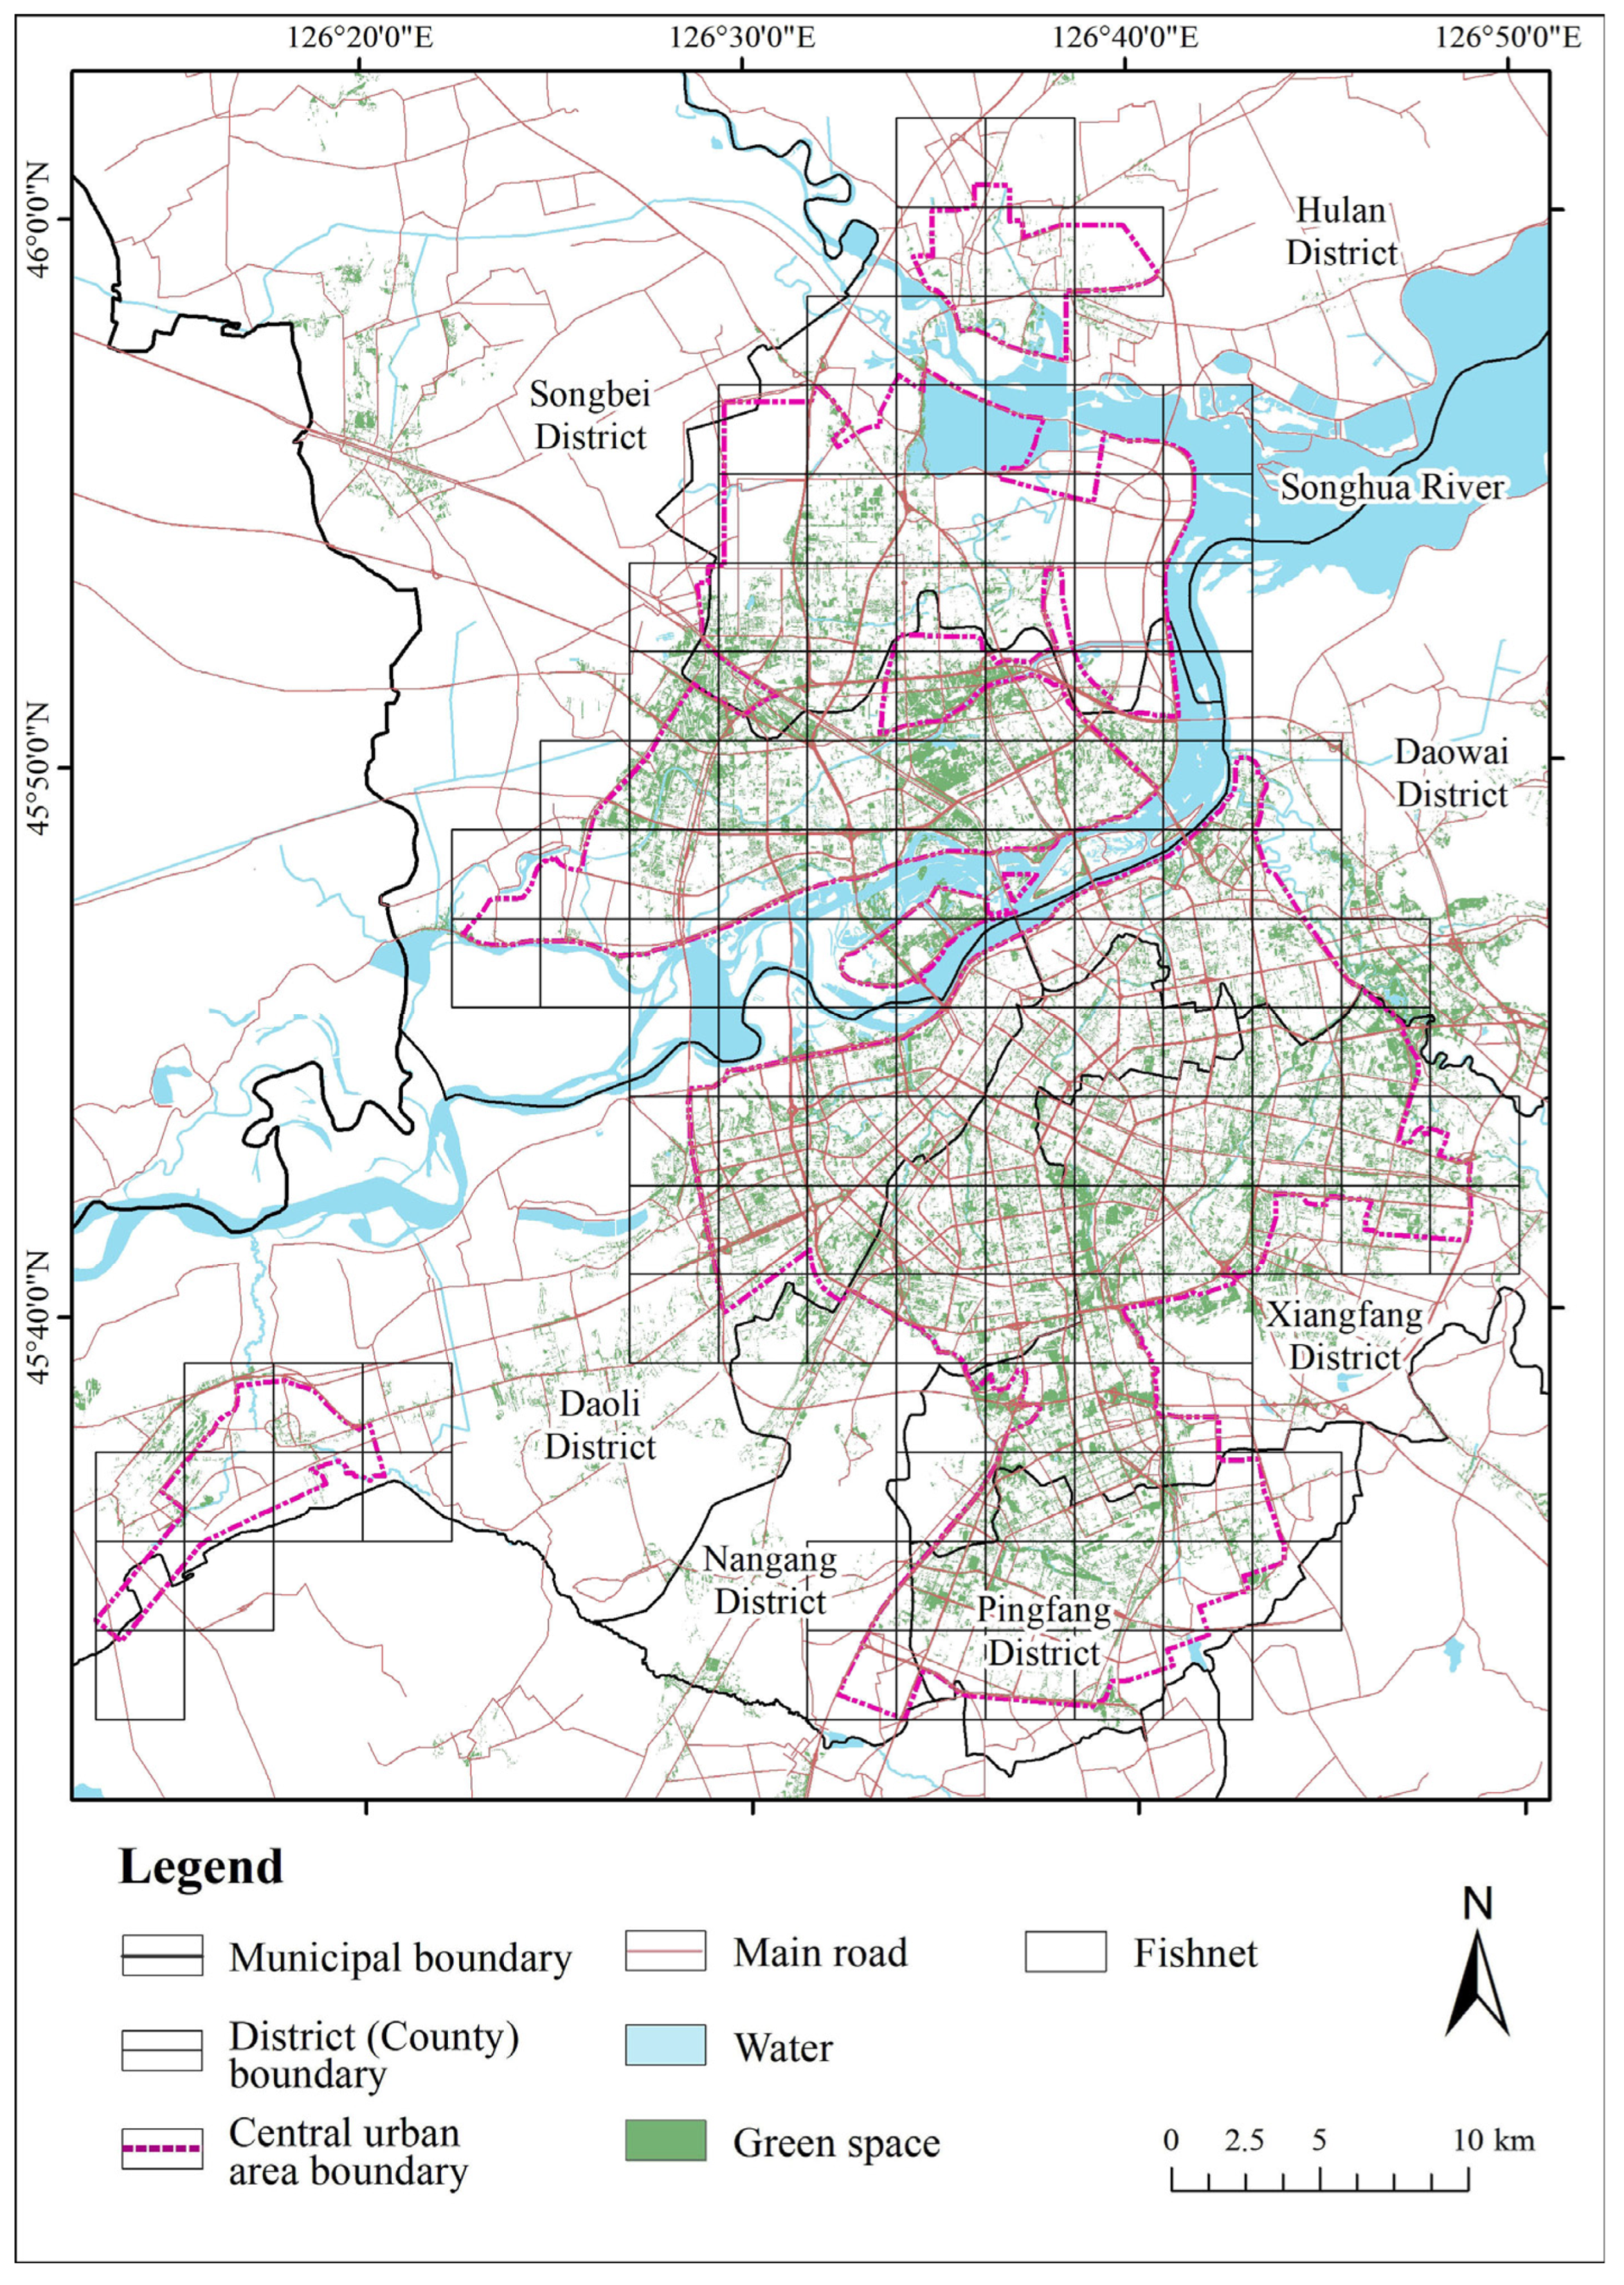
2.1. Data Sources

Harbin is located in Northeast China, where innovation elements are concentrated, and there are abundant resources of universities, technology enterprises, and innovative talents. It is an ideal case area for conducting the performance evaluation of innovation spaces. As an old industrial base city, Harbin is facing challenges and pressure in China’s innovation-driven development strategy and urgently needs to break away from path dependence through innovative development. Against the background of urban renewal and the transformation of urban land finance, Harbin needs a higher level of innovative development to drive the advanced transformation of industries. Against multiple backgrounds, Harbin has become a significant case area for the performance evaluation of urban innovation spaces.
This study focuses on the central urban area of Harbin, specifically including several administrative districts: Nangang District, Xiangfang, Daoli District, Daowai District, Pingfang District, Songbei District, Hulan District, etc. (Figure 1). The study area spans geographic coordinates from 126°12′ to 126°50′ E and 45°32′ to 46°1′ N, covering a total area of approximately 690 km2. Prior studies [32,33,34,35] have demonstrated that OpenStreetMap (OSM) data exhibit high granularity in urban contexts, particularly regarding pedestrian street networks and routing information completeness. Consequently, this research adopts OSM datasets [36], including road networks, green space, and water, to represent cartographic and built environment features. Square grid analysis, a widely used method in urban metric studies, is implemented through fishnet grid generation across the study area to facilitate the performance evaluation of innovation spaces at micro scales (neighborhood and block levels). Empirical evidence [37] indicates that the spatial extent of a “15-min life circle” aligns with the fundamental unit scale of innovation activity clusters, where this size ensures frequent interdisciplinary interactions while avoiding excessive spatial dispersion. Accordingly, the grid size is standardized as 3 km × 3 km, equivalent to the coverage of a typical 15 min life circle (15 min cycling or 30 min walking distance). The generated fishnet divides the study area into 130 grids, which serve as the fundamental spatial units for the micro-scale performance evaluation of innovation spaces [38,39].
Existing studies [30] indicate that successful urban innovation spaces share common characteristics, including robust high-tech industries, proximity to universities and research institutes, superior urban environments, abundant public cultural and sports facilities, and support for sociocommercial interactions through third places. Based on the theory of the innovation ecosystem, scholars such as Mulas, V. and Minges, M., Na, M., and Bian, B. have conducted research on urban innovation spaces from perspectives such as innovation subjects (innovation resources), innovation-supporting services (innovation facilities), and innovation environments [40,41]. Inspired by these studies, and based on the idea of “innovation core-innovation support-innovation environment”, this study established an evaluation framework for the performance of urban innovation spaces across five dimensions: core elements of innovation, entrepreneurship support institutions, service facilities, external environments, and diversities. Considering data precision and availability, 25 indicators were selected to construct the performance evaluation indicator system (Table 1).
The core elements of innovation include innovation institutions, innovation talents, and innovation output. Innovation institutions refer to knowledge-intensive and technology-intensive institutions, which are important carriers of innovation activities. In this study, universities, scientific research institutions, and high-tech enterprises are selected as three indicators. Highly educated and talented agents can produce innovative ideas that significantly improve productivity, being the key assets with which to stimulate economic growth as well as the source of innovation development [42,43]. This study adopts three indicators: university teachers, undergraduates, master’s as well and doctoral students. Innovation output refers to the results produced in the process of innovation activities such as scientific research and development. Patents can quantitatively characterize regional innovation performance to a certain extent and are widely used in relevant studies on innovation output [44,45]. In this study, patent applications are used to represent innovation output. The data on core elements of innovation were obtained from the websites of relevant universities, the official website of the Harbin Municipal government [46], and the patent website [47].
Entrepreneurship support institutions refer to institutions that directly or indirectly provide help and support for entrepreneurial activities of entrepreneurs, and play a key role in transforming scientific research achievements into market products and improving the innovation chain. In this study, incubation type, cultural and creative type, and specialized type are selected, among which the incubation type refers to incubators and maker spaces. The cultural and creative type refers to the industry that creates cultural resources with the help of science and technology to produce high-value-added products, including conferences and exhibitions, cultural activity services, design services, and Internet information software services. The specialized type refers to innovative enterprises that focus on market segments, have strong innovation ability, have high market share, and master key core technologies [48]. They have flexible innovation mechanisms, can adjust their innovation direction quickly, and promote the marketization of innovative products. Data on entrepreneurship support institutions were obtained from relevant university websites and the official website of the Harbin Municipal government [46,49].
The service objects of service facilities are mainly innovative people, innovative institutions, and other innovative elements. This study adopts four types of service facilities: knowledge and technology type, fundamental education type, shopping type, and leisure and communication type. These service facilities are the “hard indicators” that constitute the innovation environment. By strengthening knowledge interaction, retaining innovative talent, and promoting the exchange of innovative elements, they indirectly affect the performance of the innovation spaces. Meanwhile, by improving the quality of life in the area, well-developed service facilities have a significant impact on the location decision of the “creative class”, which is more sensitive to quality of life [50]. Service facilities data were obtained through the Gaode Map API, and the period was set up to 2024.
External environment refers to the macro external environment that has an indirect impact on innovation. Although it does not directly participate in innovation activities, as the “hardware” of the flow of innovation elements, it reflects spatial connectivity. Relevant studies show that it can have a certain impact on innovation from multiple perspectives and through various approaches [38,51,52]. In this study, traffic conditions, the degree of land development, and the ecological environment were selected to represent the external environment. The data were all from the OSM dataset [36].
Diversities are divided into the diversity of land use and the diversity of business patterns. Mixed land use and diversified business patterns make urban activities dynamically diversified, making urban living and workplaces more attractive [53]. At the same time, they promote the interaction of informal knowledge and improve the efficiency of communication [54]. In this study, the degree of land-use mixing and the degree of business pattern mixing represent two types of diversity. The diversity of land-use data came from the land-use planning map of the central urban area of Harbin Municipal Land Spatial Planning (2020–2035), which was downloaded from the official website of the Harbin Municipal government [46], and the diversity of business pattern data was obtained through the Gaode Map API.
In this study, the POI (point of interest) data were obtained through the Gaode Map API, and the total number of POI data was 172,226 by April 2024 (Table 2). Combining geographical location information and attribute classification information, Gaode POI data have many advantages, such as high openness, a large sample size, and large information coverage, and have been widely used in urban factor extraction and functional area identification, and other fields [55,56,57]. Its classification system includes 14 categories, such as catering services, shopping and consumption, tourist attractions, and medical care. It covers many fields and industries, and can better reflect the development richness of regional business patterns.
After the collection of POI data, external built environment data, land-use data, and other data, this study carried out coordinate correction, screening, and de-duplication. Finally, this study used the ArcGIS Pro 3.0.2 software platform to conduct geographical matching, integrate various spatial data, and build a geographic information database for the performance evaluation of urban innovation spaces.

2.2. Research Methods

2.2.1. Entropy Method

The degree of land-use mixing can be expressed in terms of entropy in information theory. Entropy is used to measure the degree of uncertainty of random events in an experiment [58]. The calculation formula is as follows:
L a n d u s e m i x i = i = 1 m P m i l n ( P m i )
where Landusemixi is the degree of land-use mixing; m is the number of land-use types in grid i. Based on the land-use planning map of the central urban area of Harbin Municipal Land Spatial Planning (2020–2035), this study vectored the map plaques of various land-use types into 47 land-use categories. Pmi represents the proportion of land-use type m to the total area of grid i. The larger the value of Landusemixi, the higher the mixing degree of all types of land in the grid; the smaller the value, the lower the mixing degree of all types of land in the grid.
Similarly to the degree of land-use mixing, the degree of business pattern mixing is also expressed by entropy in information theory, and the calculation formula is as follows:
P O I m i x i = j = 1 n P n j l n ( P n j )
where POImixj is the degree of business pattern mixing; n is the number of POI types in grid j. This study divides the POI into 14 types according to the data obtained by the Gaode Map API. Pnj represents the proportion of the nth POI type to the total number of j in the grid. The larger the value of POImixj, the higher the degree of business pattern mixing in the grid; the smaller the value, the lower the degree of business pattern mixing in the grid.

2.2.2. Kernel Density Estimation Method

The kernel density estimation method analyzes the spatial aggregation characteristics and degree by estimating the distribution density of the data in the study area and displays the distribution characteristics of each indicator in general. The calculation formula is as follows:
f x = 1 n h i = 1 n K x x i h
where K is the weight function of the kernel; h is the bandwidth, that is, the width of space extension of the surface with the center point of the fishnet grid as the origin; n is the number of indicators; and x − xi is the distance from the estimated point x to the sample xi.

2.2.3. Entropy-Weighted TOPSIS Method

The TOPSIS method (Technique for Order Preference by Similarity to Ideal Solution) is a comprehensive evaluation method proposed by Hwang and Yoon in 1981, which is suitable for the comparison and selection of multiple schemes based on multiple indicators [59]. The basic idea is to determine the Euclidean distance between each scheme and positive and negative ideal values, to obtain the similarity and proximity degree between the scheme and the optimal scheme, and to judge the advantages and disadvantages of each scheme [60,61]. When the TOPSIS method is used for multi-objective evaluation, determining the weight of the evaluation indicators has a great influence on the final evaluation result. The entropy-weighted method is a typical weighting method based on diversity. It calculates weights according to the diversity of data, and only requires objective data, excluding the influence of subjective preferences [62]. In this study, the entropy-weighted TOPSIS method was used to evaluate the performance of innovation spaces in the central urban area of Harbin.
Firstly, the entropy-weighted method was used to determine the weight of indicators. The calculation formulas are as follows:
(1)
For m objects to be evaluated, each evaluated object has n evaluation indicators, and the decision matrix X is constructed:
X = x i j m × n , i = 1,2 , , m ; j = 1,2 , , n
(2)
Normalize the decision matrix:
y i j = x i j x j m a x
(3)
Calculate information entropy Hj:
H j = i = 1 m p i j l n p i j l n m
where
p i j = y i j i = 1 m y i j
(4)
Define the weight wj of indicator j:
w j = 1 H j j = 1 n 1 H j , w j 0,1   a n d   j = 1 n w j = 1
Then, the TOPSIS method was used for multi-objective evaluation, and the calculation formulas are as follows:
(1)
Construct the weighted judgment matrix R:
R = r i j m × n
r i j = w j · y i j , i = 1,2 , , m ; j = 1,2 , , n
(2)
Determine the positive ideal solution Rj+ and negative ideal solution Rj:
R j + = m a x r 1 j , r 2 j , , r n j
R j = m i n r 1 j , r 2 j , , r n j
(3)
Calculate the Euclidean distance of each object to the positive ideal solution Di+ and the negative ideal solution Di:
D i + = j = 1 n R j + r i j 2
D i = j = 1 n R j r i j 2
(4)
Calculate the relative closeness to the ideal solution Ti, and the score of object i, Scorei:
T i = D i D i + + D i , T i 0,1
S c o r e i = 10 T i , S c o r e i 0,10
where the closer Ti is to 1, the better the performance of the evaluation object; the larger the Scorei value, the higher the innovation performance score of the grid.

2.2.4. DEMATEL Method

The DEMATEL method (Decision-making Trial and Evaluation Laboratory) can effectively solve complex and tangled problems within societies. By understanding the complex causal relationship structure, the degree of influence among indicators can be observed, with both structural relationship and influence strength among the indicators being calculated via the use of a matrix and related mathematical theories [63,64]. In this study, the DEMATEL method was used to determine the correlation and influence relationship between various indicators of performance evaluation in innovation spaces. The calculation steps are as follows:
(1)
Establish an evaluation scale. Each expert’s cognition of the degree of influence of the guideline was evaluated by comparing the indicators with each other, and evaluation scales 0, 1, 2, and 4 were used as the measurement criteria, representing relationships of “no influence”, “low influence”, “medium influence”, and “strong influence” in the sequence.
(2)
Construct the direct-influence matrix A. According to the opinions of all experts, an initial matrix A of order n × n was obtained by comparing the degree of influence among the indicators:
A = a i j = k = 1 H x i j k
where aij represents the degree of influence of indicator i on indicator j, H represents the total number of experts, k represents the Kth expert, and xk represents the matrix obtained by scoring the Kth expert.
(3)
Calculate the normalized direct-influence matrix X:
X = m × A
m = m i n 1 m a x i i = 1 n a i j ; 1 m a x j j = 1 n a i j , i , j 1,2 , 3 , , m
where the sum of each column of X is less than 1.
(4)
Calculate the total-influence matrix T:
T = X I X 1
where I is denoted as an identity matrix.
(5)
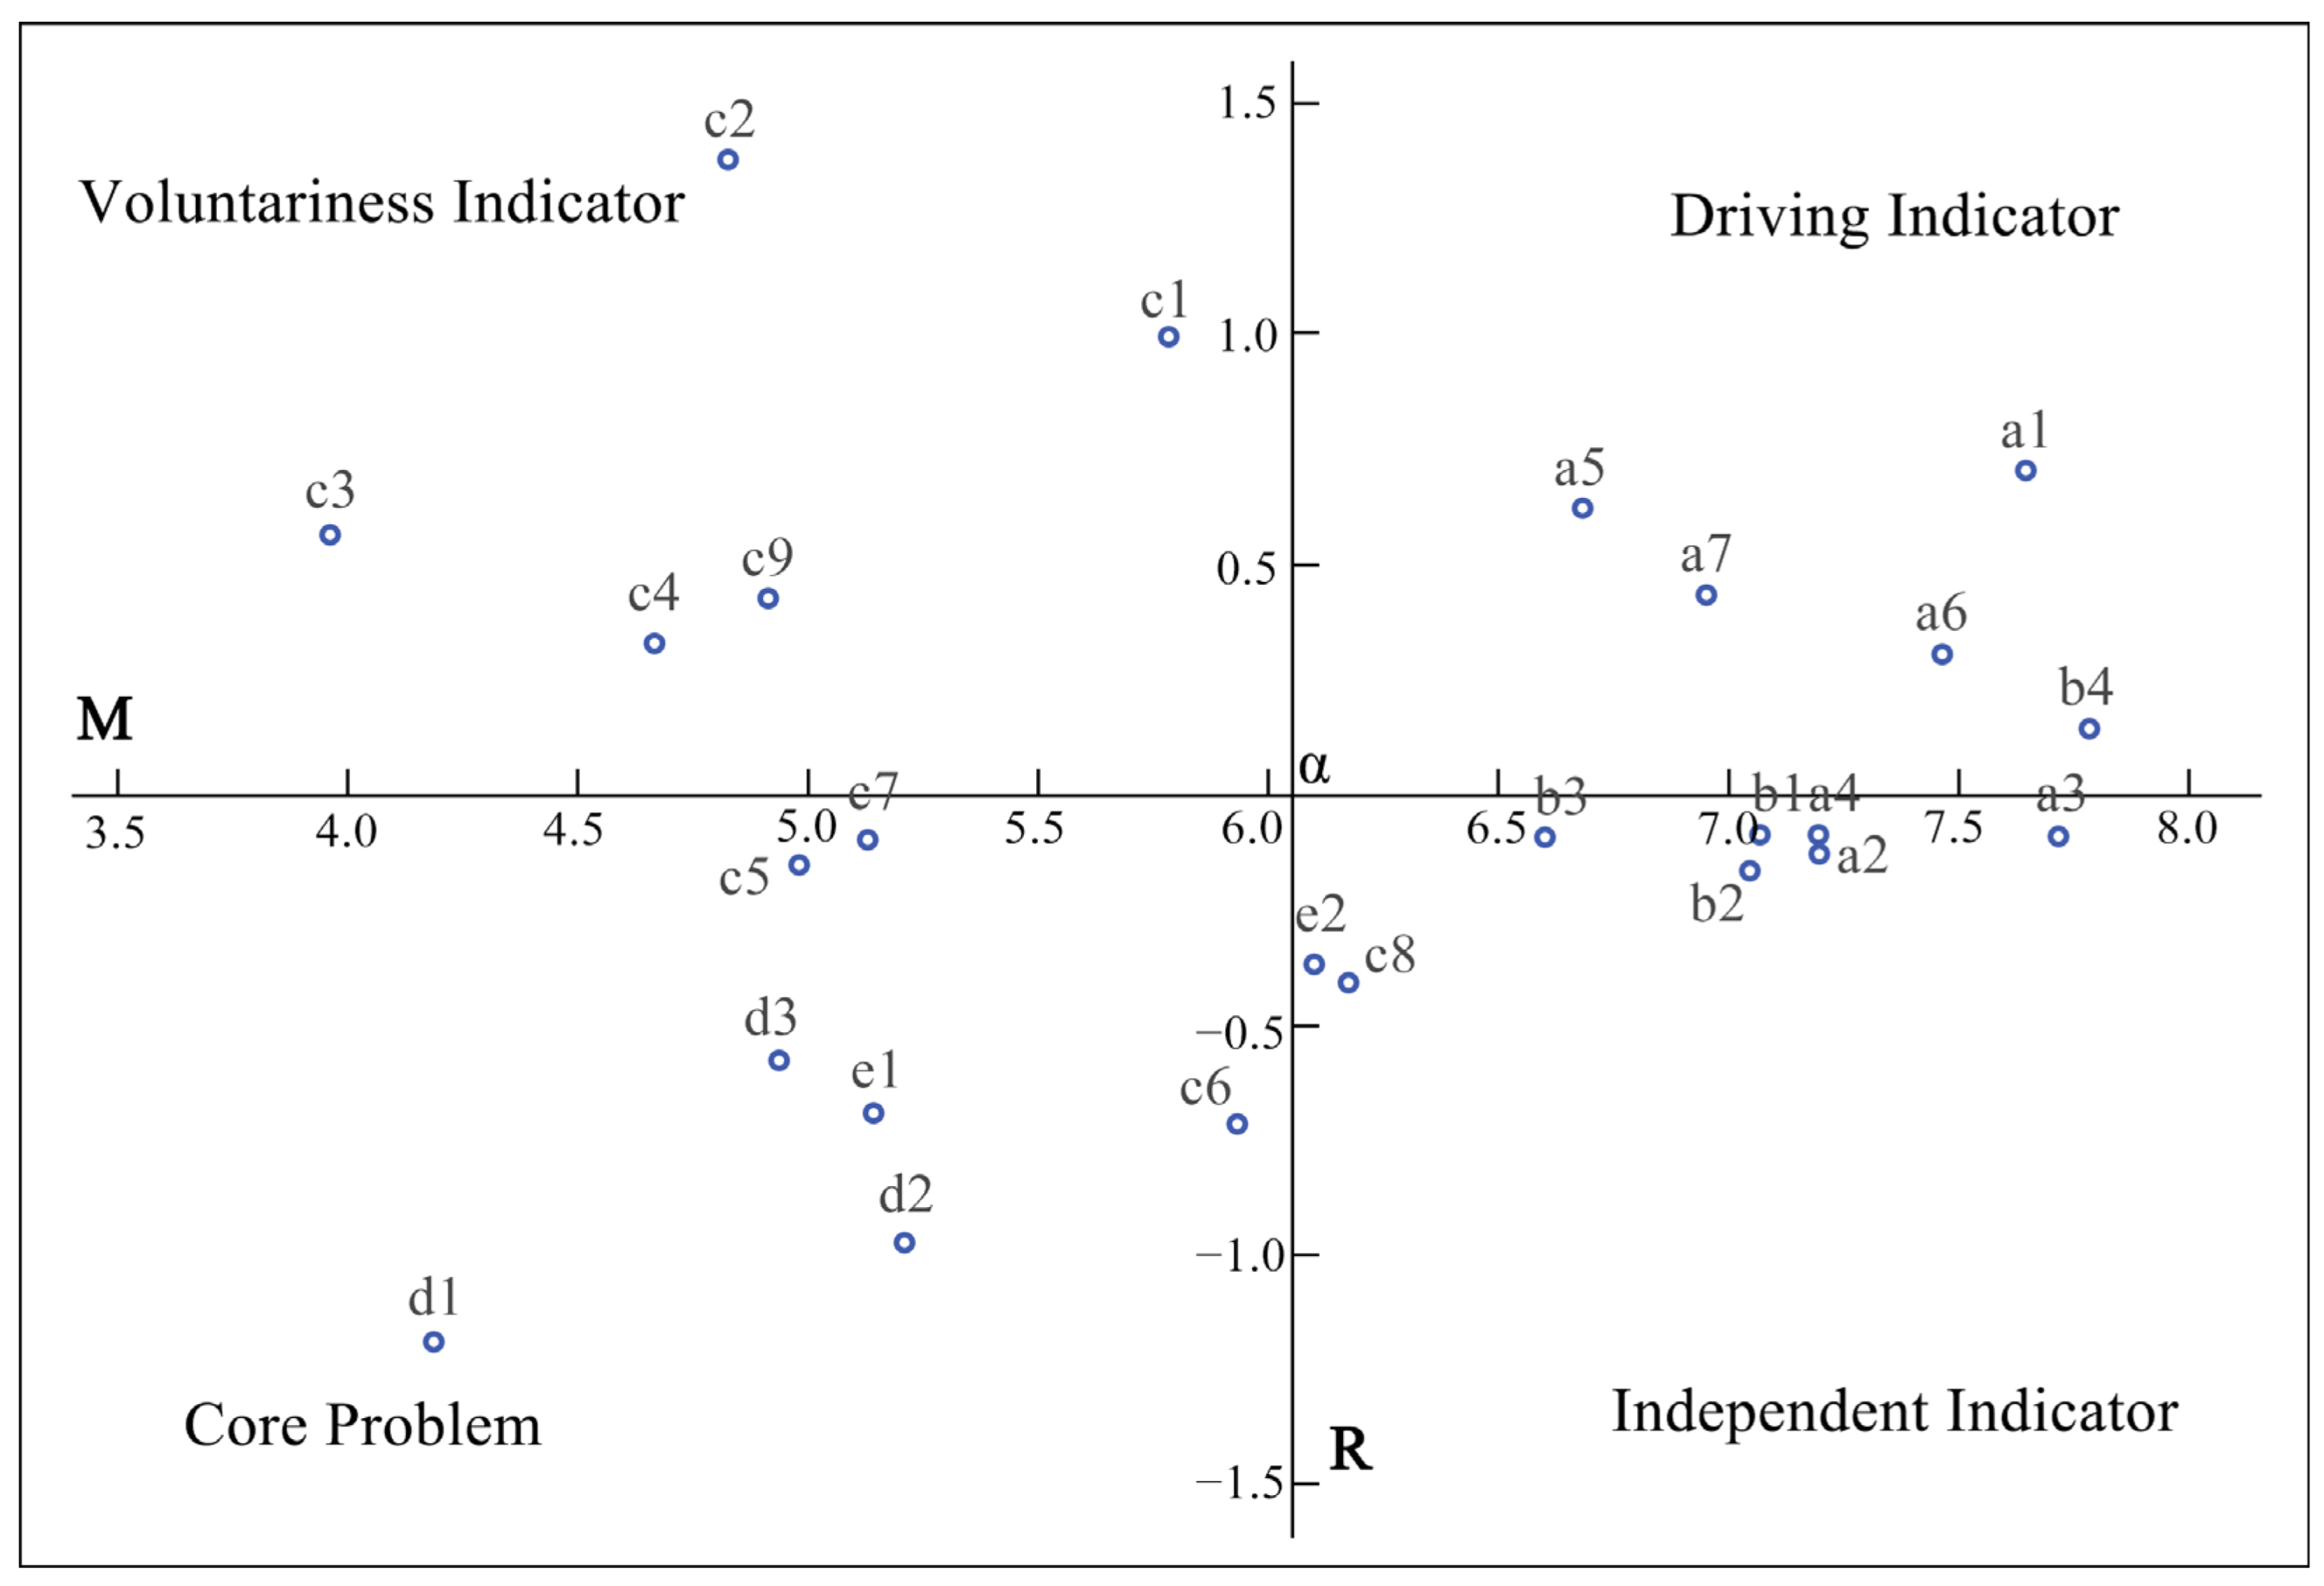
Calculate the sum of rows D and the sum of columns C, which represent the degree of influence of the indicators on other indicators and by other indicators, respectively. Then, calculate the prominence M and relation R:
D = D i n × 1 = j = 1 n t i j n × 1
C = C i 1 × n = i = 1 n t i j 1 × n
M = D + C
R = D C
A total of 10 experts in innovation-space-related fields were contacted to participate in the DEMATEL questionnaire survey. The consulting experts’ backgrounds included urban planning, public policy, architecture, landscape science, sociology, etc. The membership information of the expert group is summarized in Table 3. The questionnaire survey includes offline questionnaires and online questionnaires.

2.2.5. Summary of Research Methods

This study adopted four methods: the entropy, the kernel density estimation, the entropy-weighted TOPSIS, and the DEMATEL methods. The corresponding objectives of each method are shown in Table 4.

3. Results

3.1. Performance Evaluation Results of Five Types of Indicators

Before the performance evaluation, this study first tested the collinearity of each indicator, and the results were within the acceptable range. The entropy-weighted TOPSIS method was used to calculate the five types of indicators; no outliers, such as extreme outliers, were detected after testing. After determining the weights of each type of indicator (Table 5), the scores in each grid within the research scope were obtained, with the values ranging from 0 to 10.

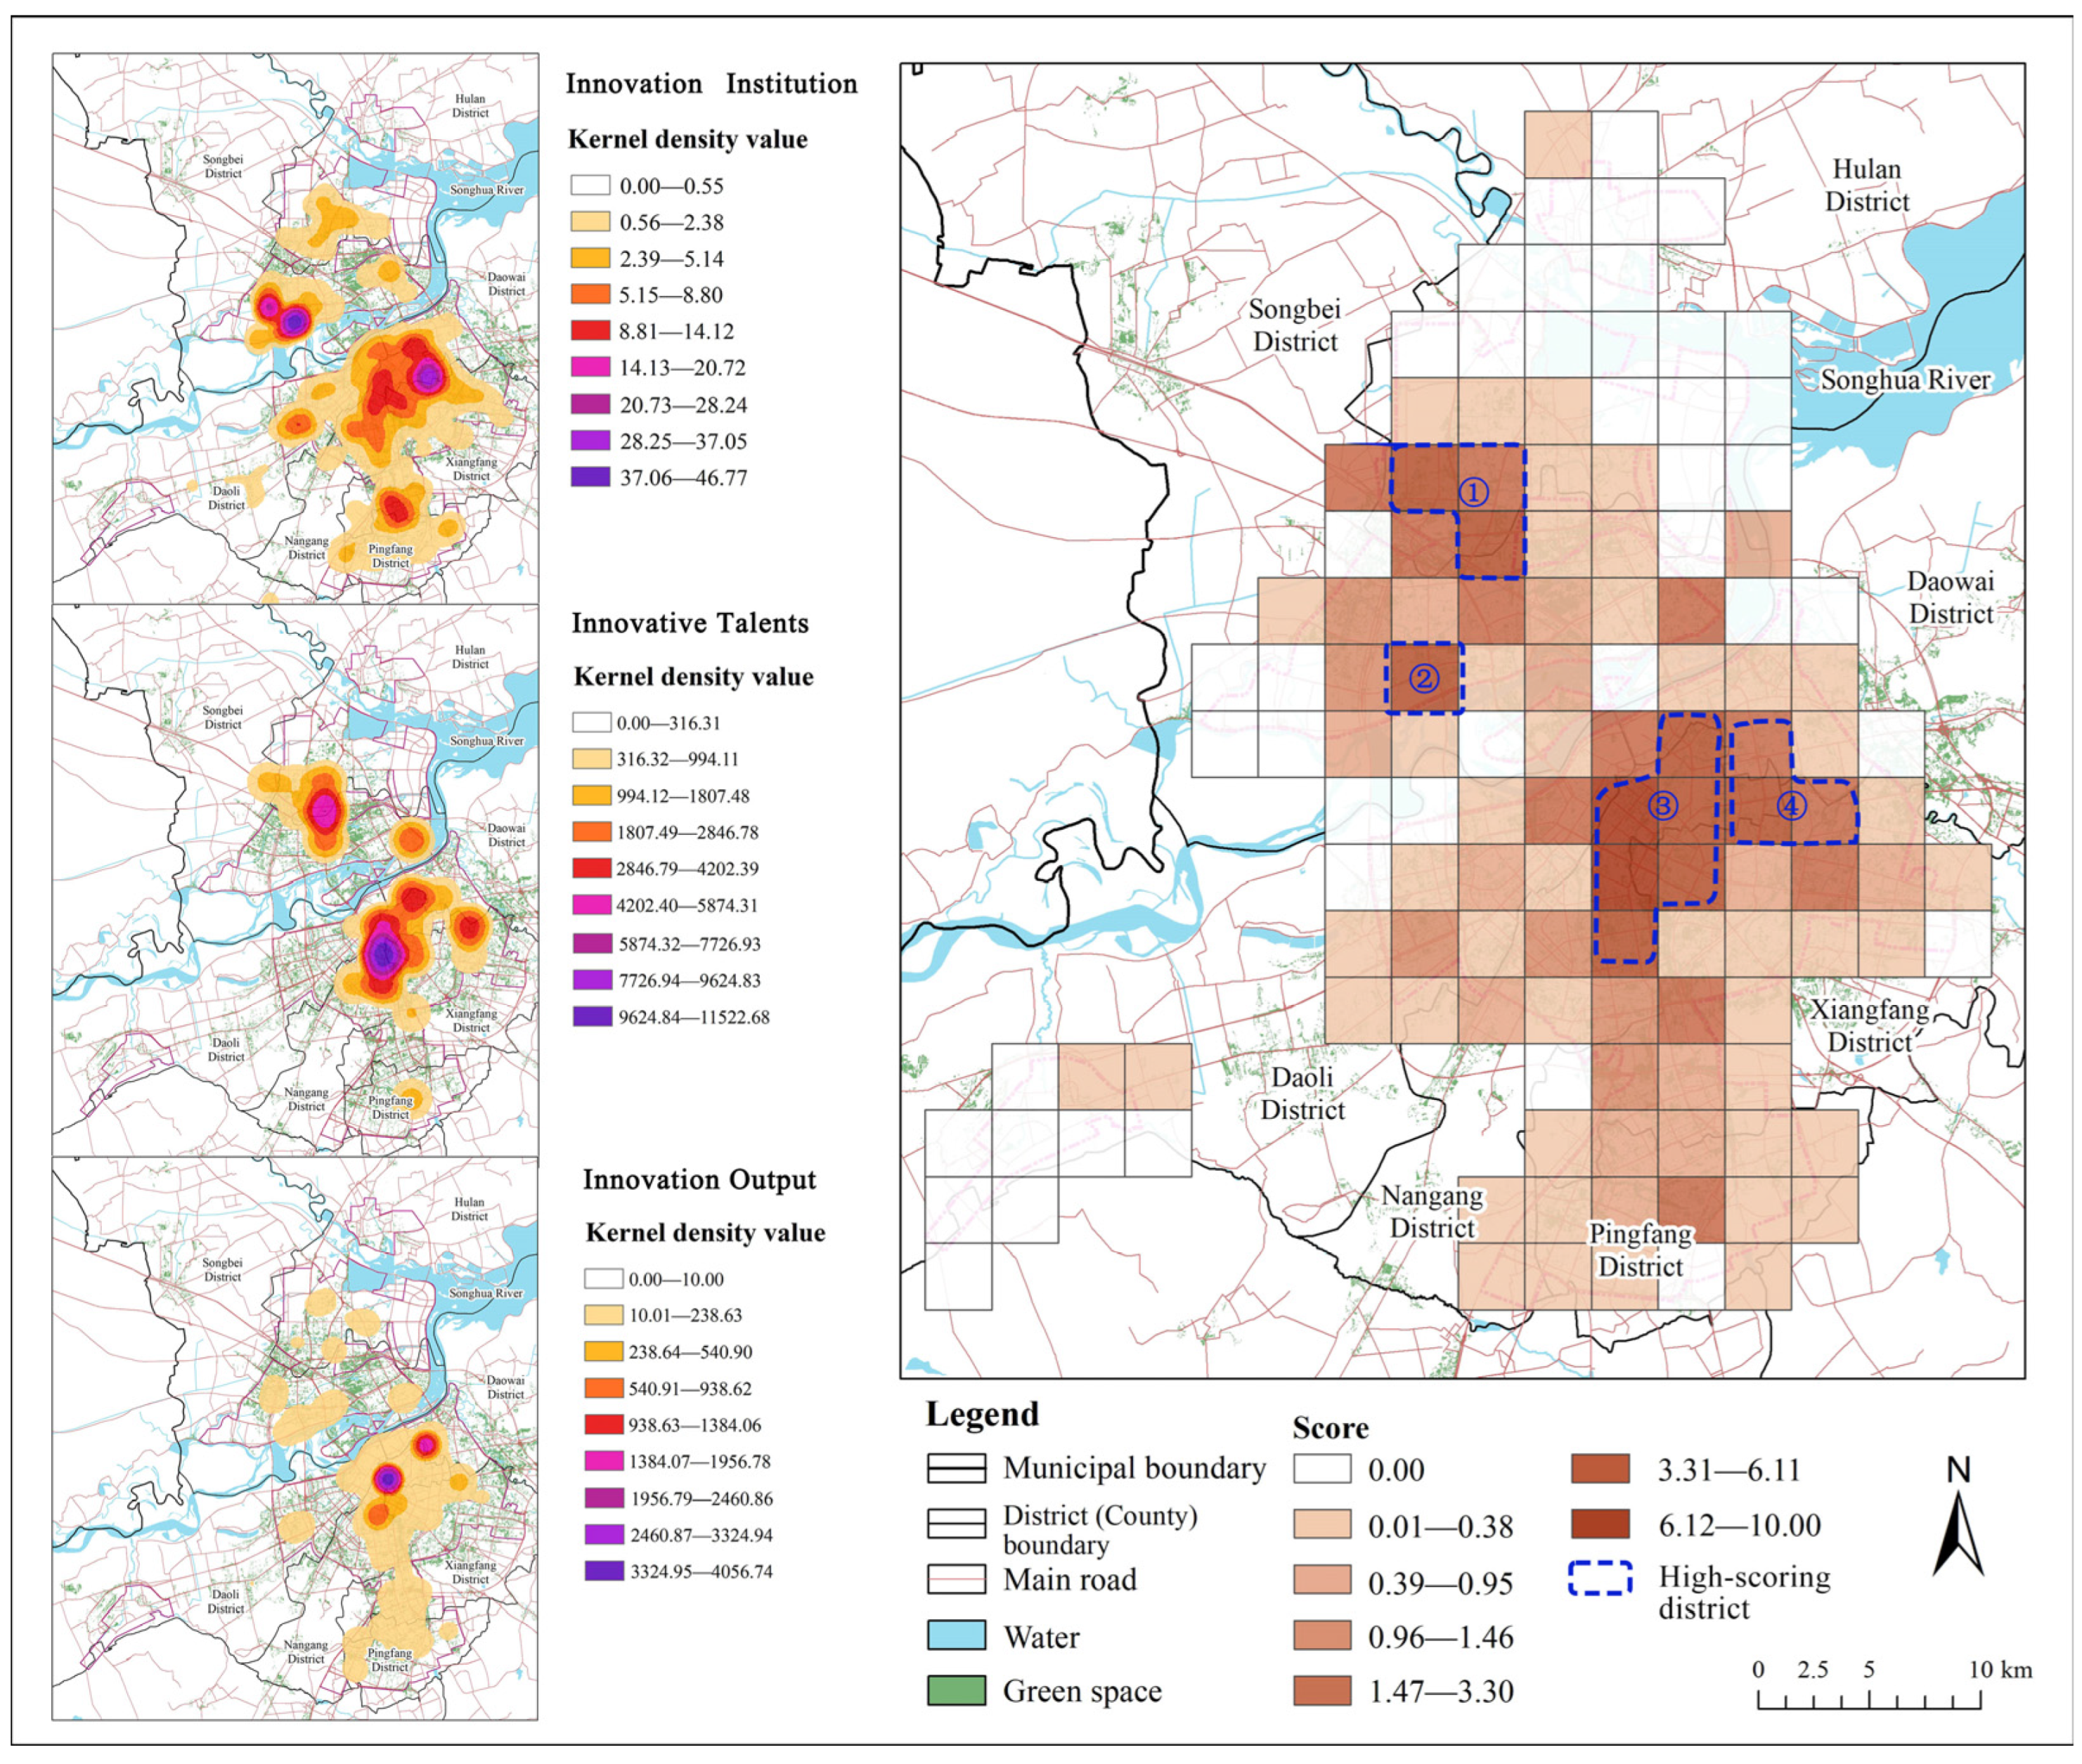
3.1.1. Evaluation of Core Elements of Innovation

The core elements of innovation can be divided into three types: innovation institutions, innovation talents, and innovation output. Innovation institutions include colleges and universities, scientific research institutions, and high-tech enterprises. Innovation institutions are places of intense innovation activities, where many new ideas and inventions are born. Innovation talents include university teachers, undergraduates, master’s as well and doctoral students. While imparting knowledge, college teachers can often produce new knowledge and technology by researching in their professional frontier fields. Undergraduate, master’s, and doctoral students are young groups with active and energetic thoughts, and are important innovative groups. Selecting invention patents as a representative of innovation output can reflect the spatial distribution of innovation output more accurately.
The kernel density analysis was conducted on the indicators of the three types of core elements of innovation. The results show (Figure 2) that innovation institutions in the central urban area of Harbin are mainly distributed in five areas: the Science and Technology Innovation City area, the International Exhibition Center area, the No. 1 campus area of the Harbin Institute of Technology, the High-tech Industrial Development area, and the Harbin Veterinary Research Institute area. Utilizing the natural breaks (Jenks) method for the kernel density values in ArcGIS Pro 3.0.2 software, the kernel density data were divided into nine categories according to size (the same method was used in the later section) and found to be above 8.80 for all five areas. The innovation talents are mainly distributed in five areas around the universities: the No. 1 campus area of the Harbin Institute of Technology, the Harbin Engineering University area, the Northeast Agricultural University area, the Jiangbei University Town area, and the Heilongjiang University of Science and Technology area. The kernel density values are all above 1800. The spatial distribution of innovation output has a high degree of agglomeration, which is mainly distributed in the No. 1 campus area of the Harbin Institute of Technology, the Harbin Engineering University area, and the Heilongjiang University area. The kernel density values are all above 540.
Utilizing the entropy-weighted TOPSIS method to calculate the scores of core elements of innovation, the natural breaks (Jenks) method was used to divide the data of the core elements of innovation scores of grids into seven categories according to their size (the same method is used later). In general, the core elements of innovation are mainly concentrated in the following areas: ① the Jiangbei University Town, ② the Science and Technology Innovation City area, ③ the No. 1 campus of the Harbin Institute of Technology and its surrounding areas, and ④ the Northeast Agricultural University and its surrounding areas. The average grid scores in each area are 3.66, 4.34, 5.81, and 3.45, respectively, while the scores in other areas are all below 2.00.

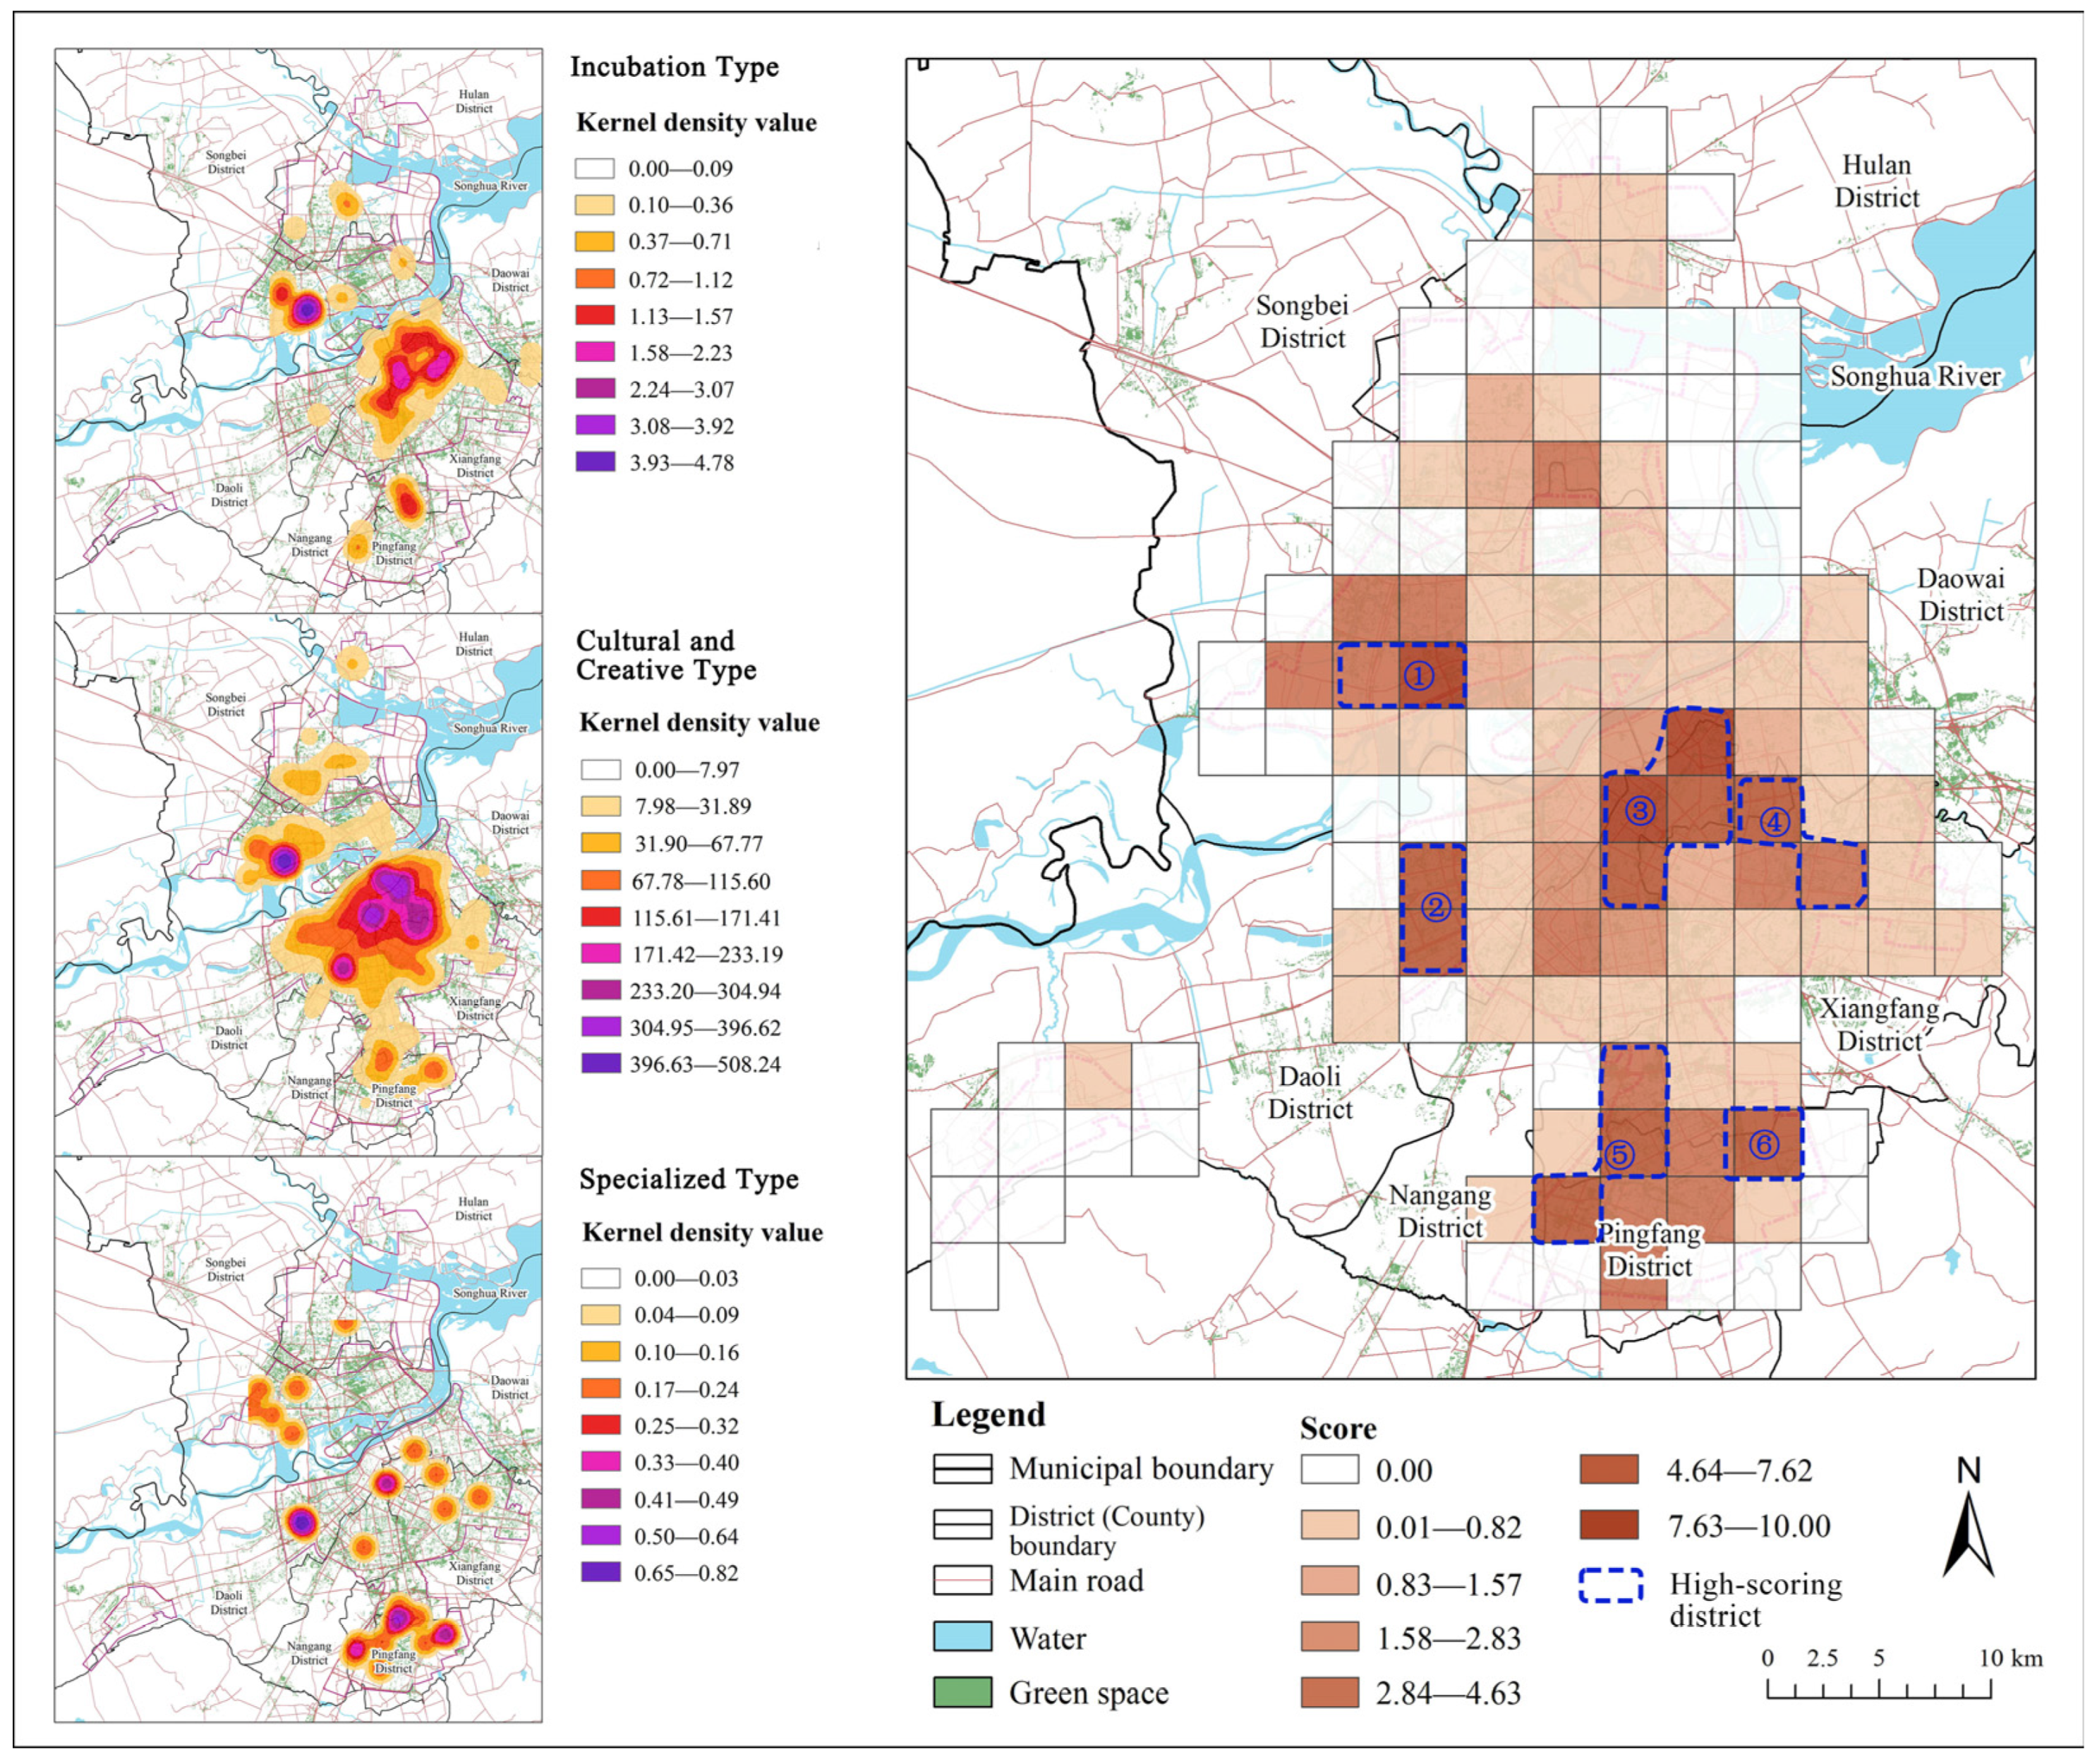
3.1.2. Evaluation of Entrepreneurship Support Institutions

Entrepreneurship support institutions include three types: incubation type, cultural and creative type, and specialized type. The incubator type includes high-tech business incubators and maker spaces, which are accelerators of innovation activities, providing startups and innovation projects with the necessary resources and support, such as funding, venues, equipment, and professional guidance. In addition, through the sharing of resources and experience, incubation institutions enable startups to iterate and validate products faster, and innovation efficiency is improved significantly as a consequence.
Cultural and creative facilities cover conferences and exhibitions, cultural activity services, design services, and Internet information software services. On the one hand, they provide a good working environment and resource support for creative talents, creating an atmosphere that stimulates innovation. On the other hand, they gather a variety of cultural and artistic forms, helping to promote cross-border cooperation, produce novel ideas and products, and diversify the development of the industry.
Specialized enterprises usually focus on specific technical fields, take specialized products and services as advantages, meet the specific needs of the market, and promote the progress of industry technology through researching and developing innovative technologies and products in depth. They usually have flexible innovation mechanisms. Due to their relatively small scale, they can be more agile in decision making and execution. They can quickly carry out trial and error, adjust their direction in responding to market changes, and promote the rapid production of innovative products.
The kernel density analysis was conducted on indicators of the three types of entrepreneurship support institutions. The results show (Figure 3) that the agglomeration areas of the incubation type are mainly distributed in the Science and Technology Innovation City area, the International Exhibition Center area, the No. 1 campus area of the Harbin Institute of Technology, and the Harbin Veterinary Research Institute area. The kernel density values are all above 1.10. The cultural and creative type is mainly distributed in the area of the No. 1 campus area of the Harbin Institute of Technology—the Harbin Engineering University area—the International Exhibition Center area, the Science and Technology Innovation City area, the West Red Square area, the Harbin Veterinary Research Institute area, and the Wei Yi Road area. The kernel density values are all above 68. The distribution of the specialized type is scattered, mainly concentrated in the Harbin Veterinary Research Institute area, the Wei Yi Road area, the High-tech Industrial Development area, and the No. 1 campus area of the Harbin Institute of Technology. The kernel density values are all greater than 0.17.
Utilizing the entropy-weighted TOPSIS method to calculate the score of entrepreneurship support institutions, in general, entrepreneurship support institutions are densely distributed in several areas: ① the Science and Technology Innovation City area, ② the High-tech Industrial Development area, ③ the No. 1 campus of the Harbin Institute of Technology and its surrounding areas, ④ Northeast Agricultural University and its surrounding areas, ⑤ Songhua Road—the Hanan Eighth Avenue area—and ⑥ the Weiyi Road area. The average grid scores in each area are 7.15, 6.00, 7.23, 6.01, 6.06, and 5.96, and the scores in other areas are all below 4.00.

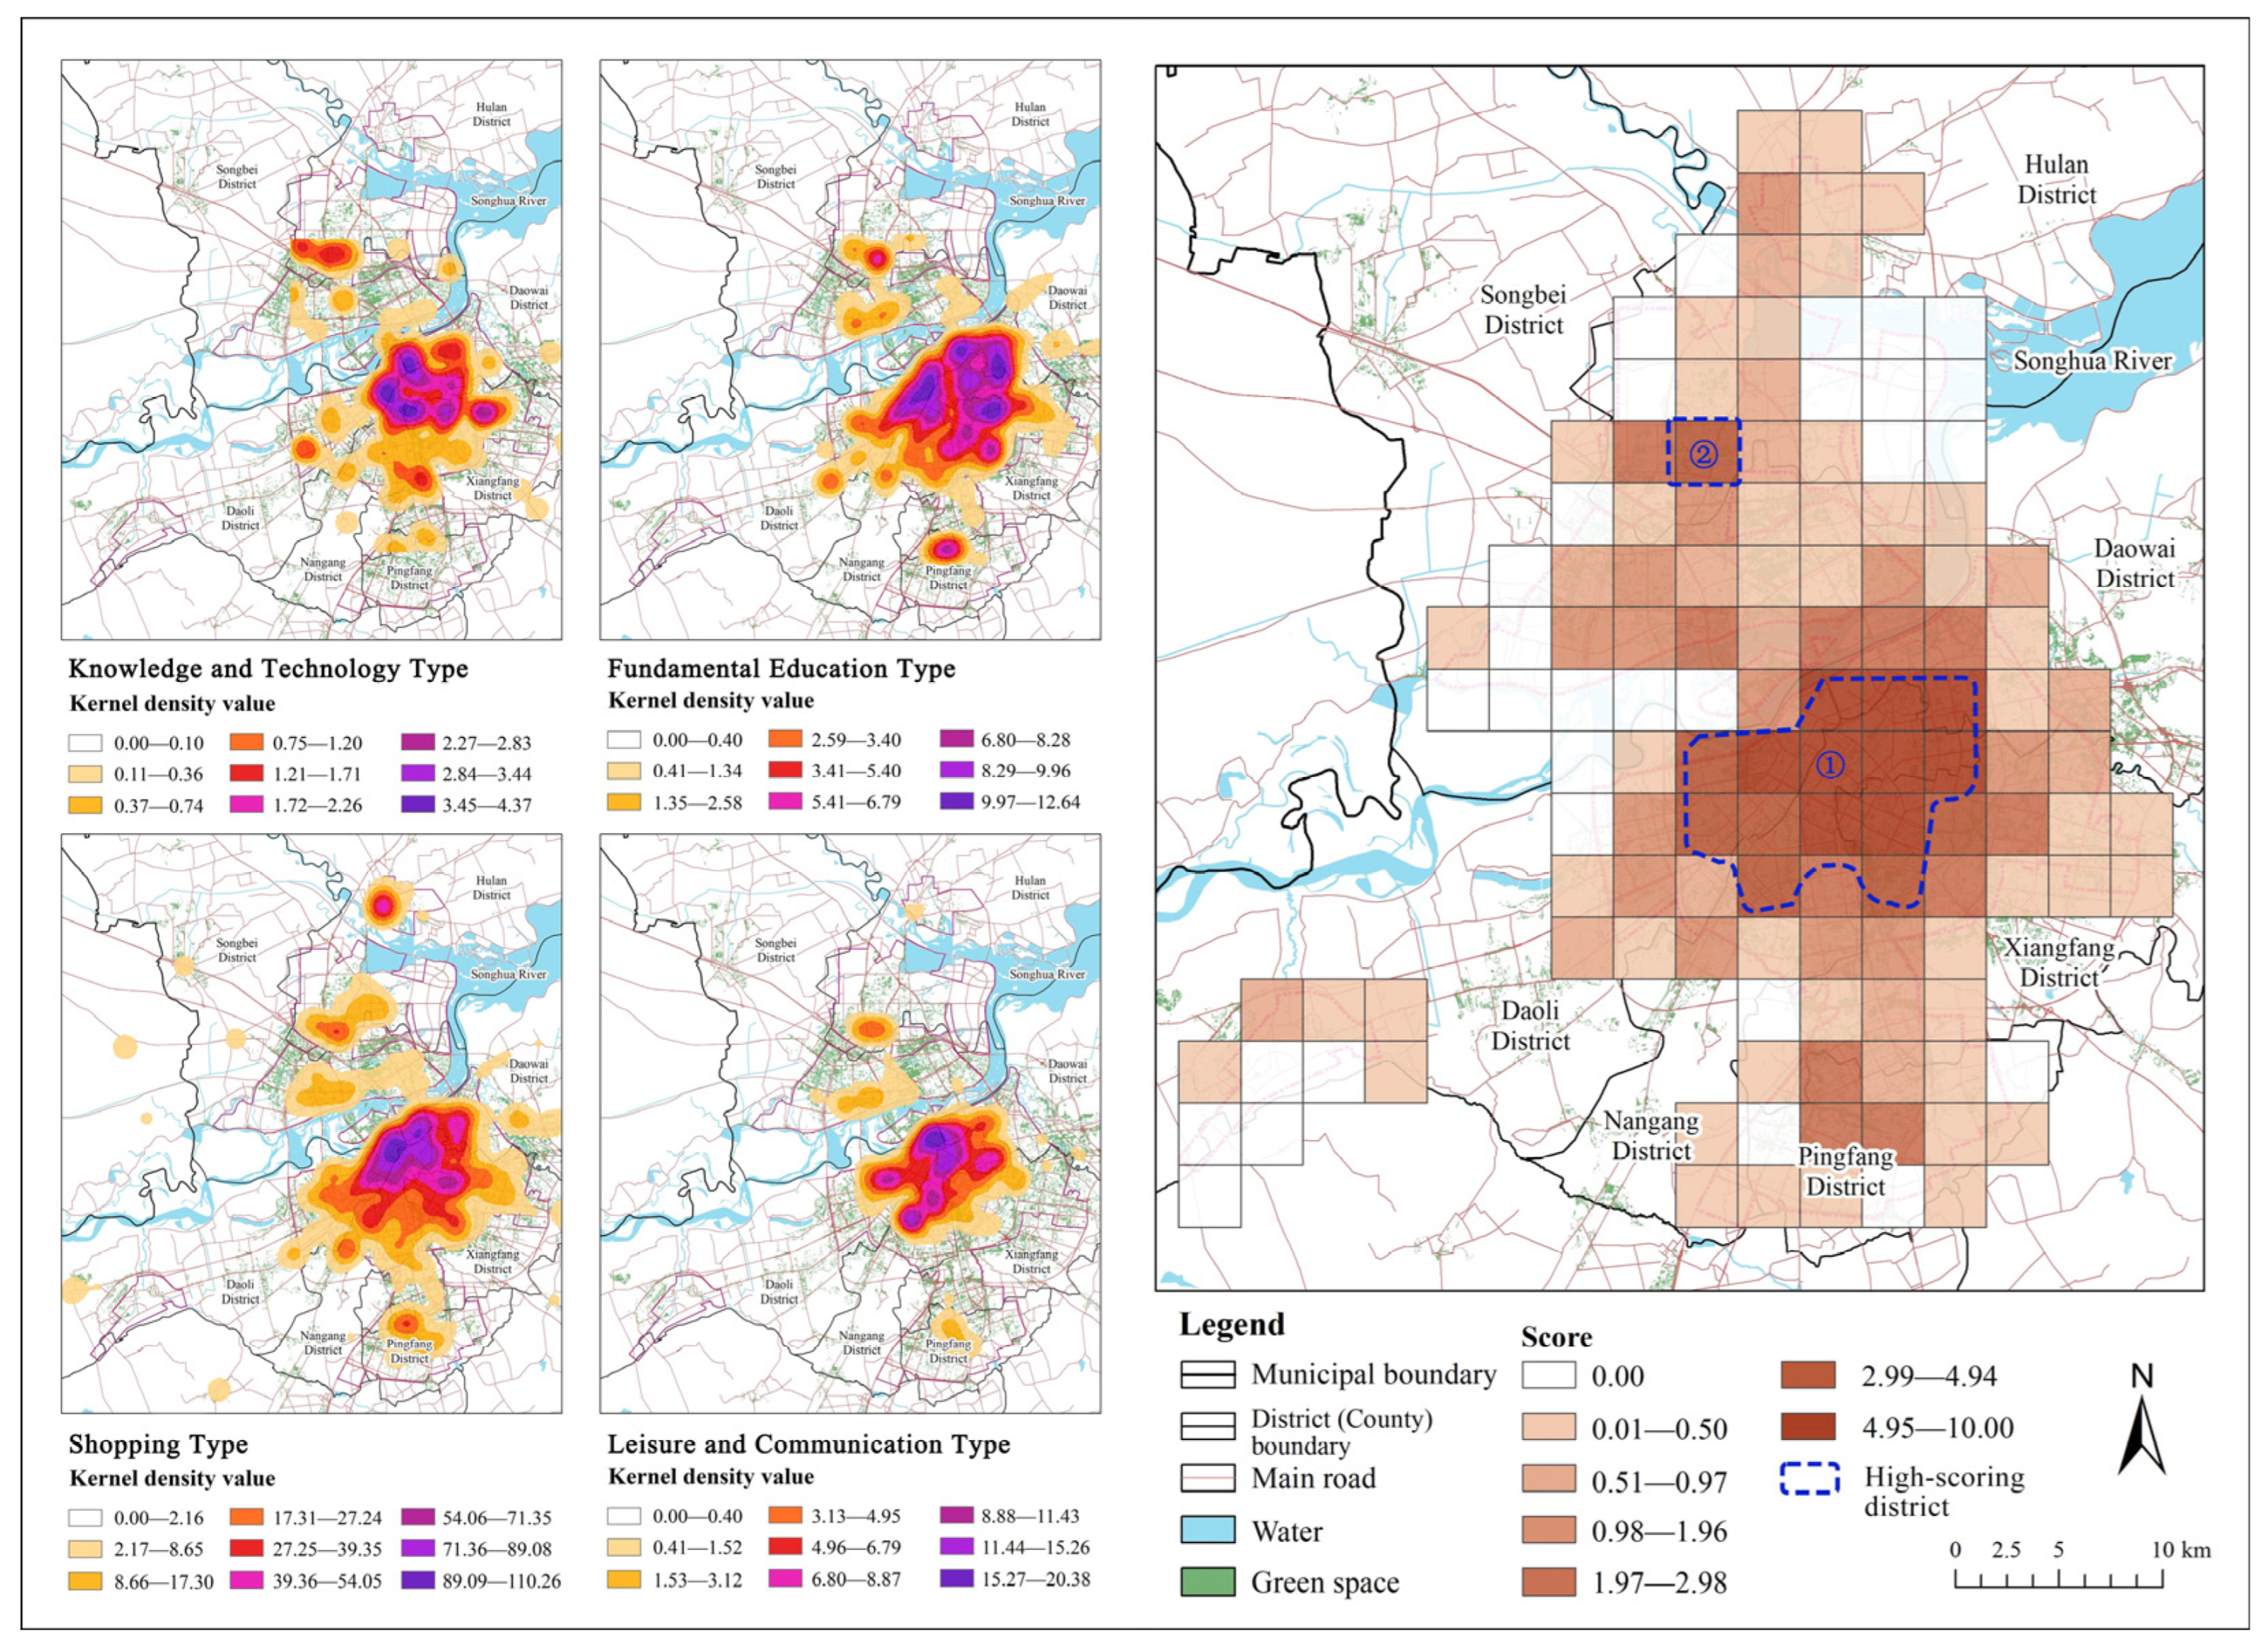
3.1.3. Evaluation of Service Facilities

The service facilities cover a wide range and variety, and the facilities closely related to innovation talents and activities were selected and divided into four types: knowledge and technology type, including libraries and vocational as well as technical schools; fundamental education type, including primary schools and kindergartens; shopping type, including supermarkets and convenience stores; and leisure and communication type, including fitness centers, coffee shops, and parks. These service facilities provide support for innovative talents with regard to many aspects, such as learning and exchange, residence and employment, shopping and consumption, and leisure and entertainment, and create an environment conducive to innovation to attract and retain innovative talents.
The kernel density analysis was conducted on the indicators of the four types of service facilities. The results show (Figure 4) that the distribution characteristics of several types of service facilities are similar, and most of them are clustered in the central urban area of Harbin, south of the Songhua River. Utilizing the entropy-weighted TOPSIS method to calculate the scores of service facilities, it was found that the area within the third ring road with the No. 1 campus of the Harbin Institute of Technology as the core (area ①) was a high-scoring area, and that the average grid score was 6.50. In addition, in the northern Limin Avenue area of Harbin Normal University (area ②), the score of service facilities was 4.14, which is also significantly higher than that of the other areas. The rest of the areas scored below 3.50.

3.1.4. Evaluation of External Environment

The external environment was quantified by selecting three indicators: density of road network, density of buildings, and green space ratio. To a certain extent, the density of the road network represents the traffic development of a region. Generally, the higher the density of the road network, the more developed the traffic in a region, the more convenient the contact between individuals, enterprises, and other innovative subjects, and the higher the possibility of producing innovation results. Building density represents the degree of land development. When the proportion is higher, it indicates that the land is intensively developed, which means bustling business, a dense population, and a more frequent flow of innovation factors. The green space ratio represents the degree of environmental quality. Generally, the higher the green space ratio, the better the air quality, the lower the noise, the higher the livability, and the more attractive for innovative talents to live there.
The grid distribution of the three types of external environment was visualized (Figure 5). The distribution of density of the road network is basically the highest value in the area of the No. 1 campus of Harbin Institute of Technology—the International Exhibition Center in the old city, and gradually decreases around, which is consistent with the radial road network of the city ring road. The areas with high building density were mainly the following: the area around the No. 1 campus of the Harbin Institute of Technology, the International Exhibition Center area, the Harbin Veterinary Research Institute area, and the West Red Square area. The areas with a high green space ratio are mainly distributed in the periphery of the old city, such as Longfeng Road, Diantan Road, Tongxiang Street, Tongjiang Road, Haping Road, Xinjiang Street, Jiangnan Middle Ring Road and Heha Expressway, Xueyuan Road, and Limin Avenue in the north of the Songhua River.
The entropy-weighted TOPSIS method was utilized to calculate the score of the external environment. In general, the areas with high scores in the external environment were mainly as follows: ① the Wetland Park area of the Harbin Cultural Center, ② the High-tech Industrial Development area, ③ the area between the No. 1 campus of the Harbin Institute of Technology and Northeast Agricultural University, and ④ the Harbin Veterinary Research Institute. The average grid scores in each area were 9.24, 8.76, 9.16, and 8.90, respectively, while the scores in other areas were all below 8.53.

3.1.5. Evaluation of Diversities

Diversities were divided into two parts: diversity of land use and diversity of business patterns. The diversity of land use refers to the richness of various land-use types such as residence, commerce, culture, and entertainment. Multi-functional spatial allocation is one of the key factors promoting innovation and enhancing urban vitality, which can not only improve the efficiency of land use but also promote the diversity of social interaction and economic activities, providing the soil for urban innovation to grow. The diversity of business patterns refers to the existence of many different business models and service forms in the fields of business and services. The diversification of business forms can not only provide a richer choice of consumption, but also promote the exchange and collision of innovative thinking and technology, promote cooperation between industries, and promote the overall economic and social development of a city.
The grid distribution of the two types of diversities was visualized (Figure 6). The distribution of the degree of land-use mixing varied greatly in different places. The mixing degree score in the core area of the central urban area was below 1.70, while the scores around it were above 1.81. In Pingfang District, the mixed degree score of the central area in the north–south direction was above 1.71, while the scores of the east and west sides were below 1.55. The degree of business pattern mixing also varied greatly in different places. The mix score in the core area of the central urban area was below 5.83, while the scores around it were above 6.52.
The entropy-weighted TOPSIS method was utilized to calculate the score of diversities. In general, the areas with high diversity evaluation scores were mainly distributed at the edges of the study area (①–⑦), and the average grid scores in each area were 9.25, 9.52, 9.53, 9.48, 9.49, 9.33, and 9.55, respectively, while the scores in other areas were all below 9.00.

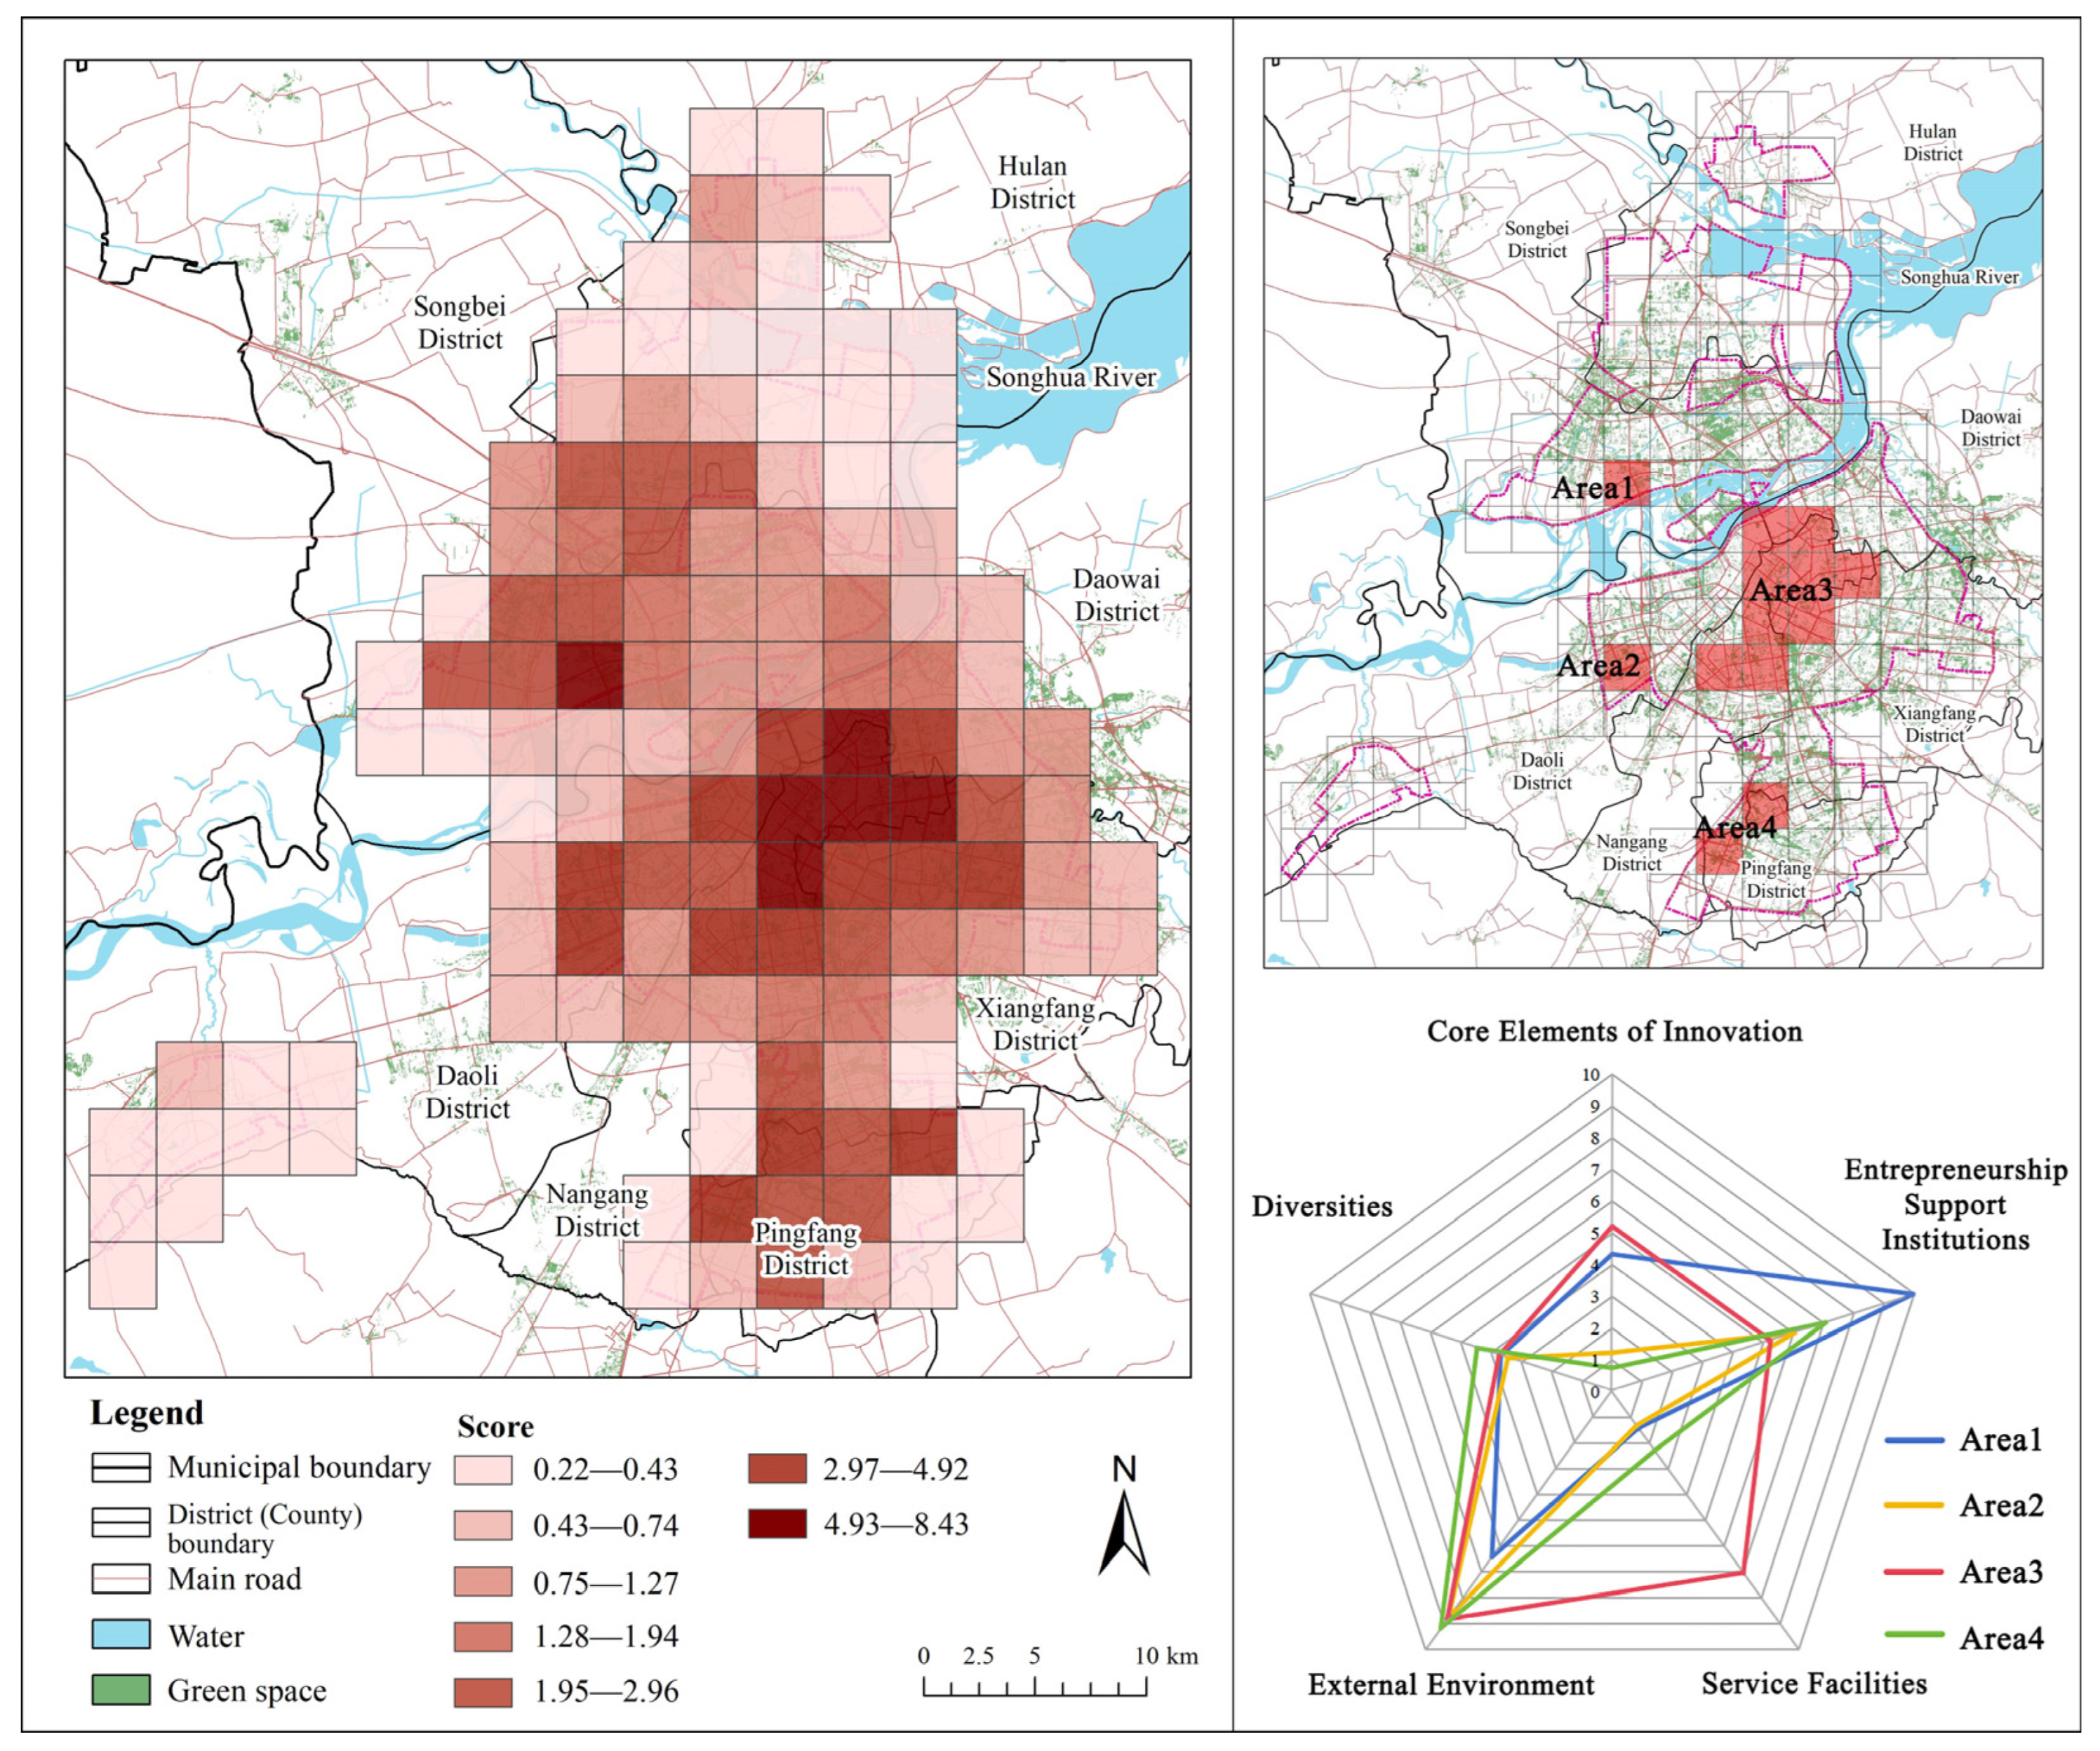
3.2. Performance Evaluation Results of Innovation Spaces

The “urban innovation spaces performance” proposed in this study refers to the comprehensive ability of urban spaces to carry and catalyze innovation activities within a certain spatiotemporal range, which is specifically manifested as the aggregation intensity of innovation elements, the interaction efficiency of the innovation network, and the transformation effectiveness of innovation achievements. Among the five types of indicators, the core elements of innovation directly quantify and reflect the innovation potential of the regional foundation. The entrepreneurship support institutions assess the maturity of innovation transformation and technology commercialization. Service facilities represent spatial support. The external environment portrays the “spatial skeleton” of the flow of innovation elements. Diversity constitutes the breeding ground for innovation incubation.
The entropy-weighted TOPSIS method was used to summarize and calculate the scores of the five types of indicators above, and the final performance evaluation results of innovation spaces were obtained (Figure 7). According to the evaluation results of the overall performance, grids with a score of more than 3.5 were selected as the high-scoring areas of innovation spaces. Thirteen grids, accounting for 10% of the total, were selected, which were divided into four areas: (1) the Science and Technology Innovation City area, (2) the High-tech Industrial Development area, (3) the core area of the old city, and (4) the Harbin Veterinary Research Institute—Songhua Road Area. The average grid scores in each area were 5.61, 3.71, 5.68, and 3.89, respectively.
Through the analysis of the radar map results, the four high-scoring areas were divided into three kinds. The first kind is an “Entrepreneurship Leading Area”, that is, the Science and Technology Innovation City area. There is a significant cluster of entrepreneurship support institutions in this area, with a corresponding score of 9.96. According to the actual situation, more incubators, cultural and creative facilities, etc., are introduced into the relevant supporting policies, which is reflected in the analysis above (Figure 3). The core elements of innovation are also sufficient, second only to area 3, with a score of 4.34. However, the external environment is poor, with a score of 6.43, and there is a shortage of innovation-related service facilities, with a score of 1.31. This area belongs to Harbin New District and enjoys policy benefits such as a reduction in or exemption of land transfer fees and preferential policies on enterprise income tax. It has a prominent feature of gathering innovative elements. However, due to its short development period, the construction of supporting facilities has not kept up, resulting in an imbalance between industrial development and service support. It is necessary to improve the innovation environment and implement accessory service facilities, such as setting up cafes and convenience stores around the incubator. Flexible land policies should be implemented, such as encouraging the temporary conversion of idle industrial land into low-cost maker spaces.
The second kind is an “Environmental Support Area”, including the High-tech Industrial Development area (Area 2) and the Harbin Veterinary Research Institute area (Area 4). This kind of area has convenient transportation, a high degree of land development, a high greening ratio in the overall level (Figure 5), a superior external environment for innovation, scoring 8.76 and 9.17, respectively, and great development potential. However, there are few innovation-related service facilities, with scores of 1.31 and 2.28, respectively, and core elements of innovation are very lacking, with scores of only 1.24 and 0.76, respectively. Area 2 is part of the Harbin High-tech District, where high-tech industries and modern manufacturing clusters have been formed. However, it lacks knowledge innovation institutions such as universities and research institutes. Area 4 has formed a specialized and innovative cluster featuring the research and development of veterinary vaccines, which is highly specialized and independent. In the future, it will be necessary to introduce innovative elements such as university branches, laboratories, and high-tech enterprises in a targeted manner based on regional characteristics, accelerate industrial transformation and upgrading, and adopt some specific policies to encourage the introduction of innovative elements, such as setting a red line for the proportion of innovative land use and giving floor area ratio rewards to areas that meet standards.
The third kind is a “Balanced Development Area”, that is, the core area of the old city (Area 3). This area has balanced scores in all aspects of indicators, and the highest total score of innovation performance. In particular, the service facilities are perfect (Figure 4), and the score is 7.03, far exceeding that of other areas. However, there are fewer entrepreneurship support institutions than in other areas, with a score of 5.24, indicating that innovation achievements have not fully realized the local transformations, and the industrial chain needs to be integrated and improved. This area has a long history of development and a solid foundation in culture and education. However, entrepreneurship support institutions find it difficult to expand due to land saturation. In the future, it is necessary to develop entrepreneurship support institutions, give full play to the advantages of the existing agglomeration of core innovation elements and complete service facilities, and implement relevant measures for innovative development, such as taking advantage of the industrial heritage renewal policy to convert idle commercial spaces into low-cost maker spaces, strengthening the construction of entrepreneurship service platforms for college students, building entrepreneurship incubation bases for college students, and encouraging postgraduate and doctoral students to participate in enterprise projects.

4. Discussion

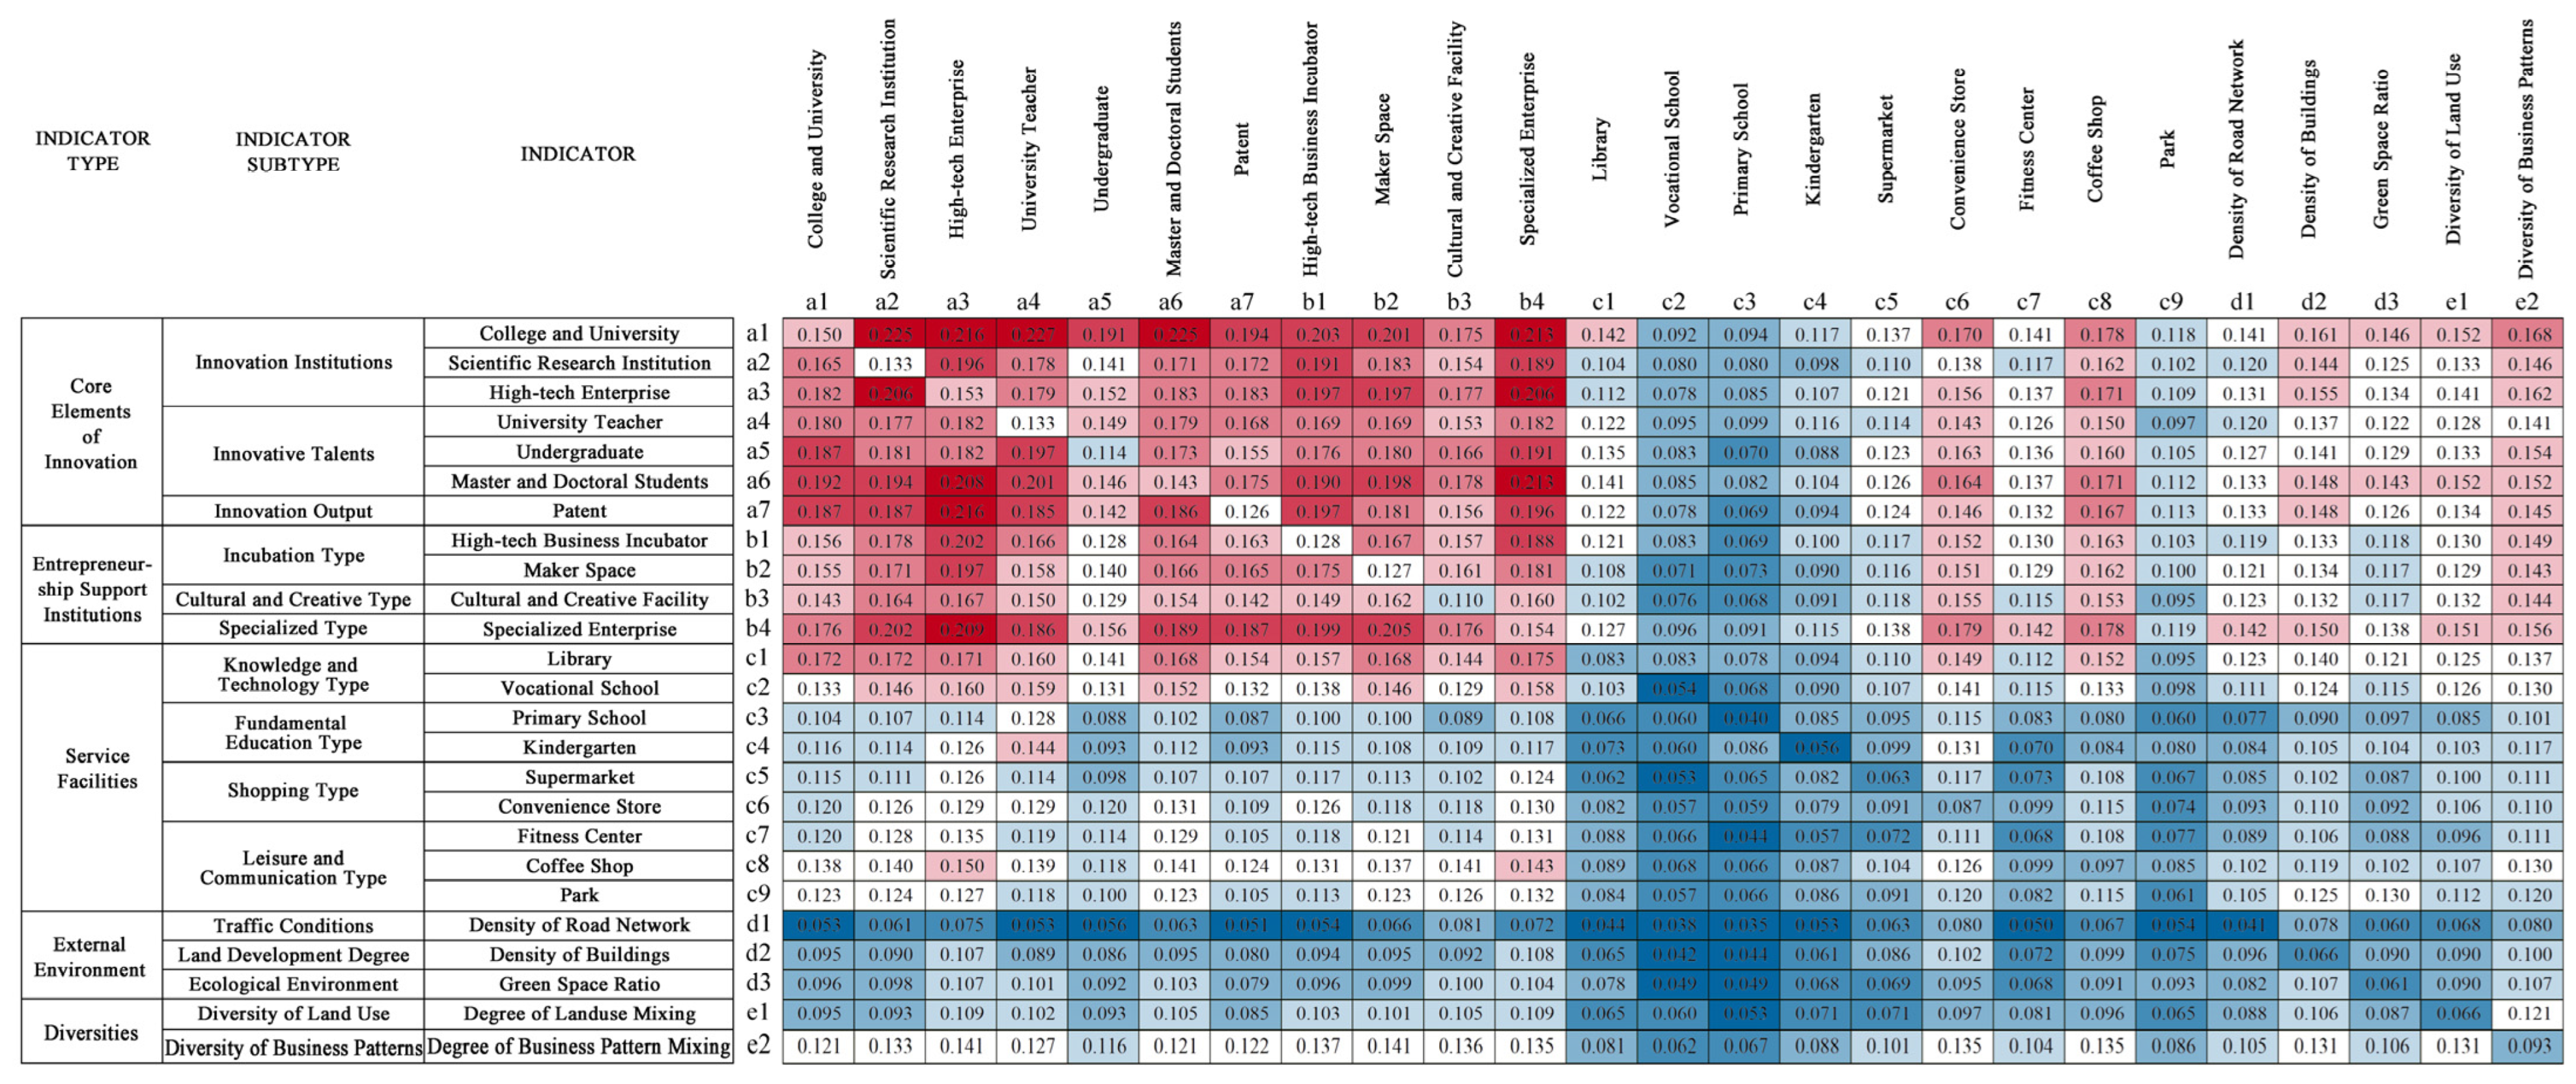
4.1. Correlation Between Various Indicators

Based on evaluating the performance of innovation spaces in the central urban area of Harbin, this paper analyzed the correlation between various indicators and various factors that have an essential influence on the development of innovation spaces at a deeper level. The DEMATEL method was adopted to determine the correlation between various indicators and generate a heat diagram (Figure 8). The larger the value in the figure, the darker the red, and the higher the correlation between indicators. In the figure, the sum of the coefficients in the row of indicators (D) represents the degree of influence on other indicators. The sum of the coefficients in the column of indicators (C) represents the degree of influence by other indicators.
The calculated values of each indicator were statistically analyzed (Table 6). Among them, M represents the role of the indicator in the whole performance evaluation system of innovation spaces. The higher the value, the higher the importance of the indicator in the system. R is used to judge the overall degree of influence of an indicator. When it is greater than 0, it means that the indicator has a greater influence on other indicators and is a cause-type indicator. If the value is less than 0, it indicates that the indicator is greatly affected by other indicators and is an effect-type indicator.
By combining the values of the cause-type indicator and the effect-type indicator, a quadrantal distribution diagram was drawn (Figure 9). In the figure, the intersection coordinates of the horizontal and vertical coordinates are (α, 0), where α is the average value of the M of each indicator. The quadrants divide the indicators into four categories. The indicator centrality M in the first quadrant is higher than the average value and plays an important role in the entire system. R is greater than 0 and has a significant influence on other indicators. They are “Driving Indicators”. Similarly, the indicators in the second quadrant play a minor role in the entire system and have an auxiliary influence within the system. They are “Voluntariness indicators”. The indicators in the third quadrant play a small role in the entire system and are greatly influenced by other indicators. They are “Independent indicators”. The indicators in the fourth quadrant play an important role in the entire system and are highly susceptible to the influence of other indicators. They are “Core Problem indicators”.

4.1.1. Indicators of Core Elements of Innovation

In terms of the correlation among the indicators, the heat diagram shows a strong correlation, and the degree of mutual influence among innovation institutions (A1), innovation talents (A2), and innovation output (A3) is also high. This is in line with the findings of existing research [28]. Generally, innovation institutions such as universities have multiple functions, such as being knowledge hubs, talent cultivation, and entrepreneurship incubation. According to the “triple Helix Theory”, on the one hand, universities have made tacit knowledge explicit through institutionalized knowledge production and transformation mechanisms. On the other hand, as the core subject of the institutional helix, they have participated in the formation of an effective cooperation “triple helix” innovation model among universities, the government, and enterprises, and are the main force in the construction of the urban innovation system [29]. The more innovative institutions there are in a region and the larger their influence, the more innovation talents they can attract and the more innovative achievements they can create, thereby further increasing the number and influence of innovation institutions and forming a positive cycle. This explains that in the case of the central urban area of Harbin, the high-density areas of the three kinds of kernel density analyses partially overlap.
On the whole, the M values of the indicators of the core elements of innovation are all high, indicating the important role played by the indicators of the core elements of innovation in the overall evaluation system. They are “Driving Indicators” or “Independent Indicators”, highlighting that they are key indicators with which to measure innovation performance. Among them, the number of colleges and universities (a1) and undergraduates (a5) have higher R values, indicating a greater influence on other indicators. This is highly consistent with the phenomena mentioned in Section 3.1.1. that the No. 1 campus of the Harbin Institute of Technology and its surrounding areas have a spatial agglomeration of core innovation elements, and in Section 3.2., that the core areas of the three old urban districts in the region belong to a “Balanced Development Area”. As knowledge-resource-intensive areas, universities have frequent innovation exchanges, which have a great impact on scientific research institutions, high-tech enterprises, and other innovation institutions through the knowledge spillover effect [65]. Existing studies have shown [21] that highly educated and talented individuals are the endogenous growth engines of the new economy. According to Florida, R. [50]’s “Creative class” theory, while young undergraduates are engaged in innovative activities, they have a strong demand for learning, entertainment, etc. This compound consumption preference has given rise to new consumption patterns, triggered the reconstruction of the urban spatial economy, and has an important impact on the surrounding environment. The phenomenon of the concentration of high-tech enterprises and service facilities in the No. 1 campus of the Harbin Institute of Technology and its surrounding areas, which have a high density of undergraduate students, also proves this point.

4.1.2. Indicators of Entrepreneurship Support Institutions

In terms of the correlation among the indicators, the correlation is also strong, and the degree of mutual influence among the incubation type (B1), the cultural and creative type (B2), and the specialized type (B3) is also high. The increase in incubators, the number of incubated enterprises, and investment in startups is often accompanied by the growth of private investment and a rise in the number of innovative enterprises [28], and they are highly correlated. Specialized enterprises (b4) are usually small in scale, and they need to keep close contact with incubation institutions in the initial stage and development period, and seek certain support, such as funds and venues. Cultural and creative facilities are similar. The three influence each other and constitute the regional entrepreneurial system to a certain extent.
On the whole, the indicators of entrepreneurship support institutions are similar to the indicators of core elements of innovation, with high M values, playing an important role in the entire evaluation system. They are “Driving Indicators” or “Independent Indicators”. Among them, the M value of specialized enterprises (b4) is the highest, indicating that it occupies an important position in the whole system. The phenomenon of the spatial agglomeration of specialized enterprises in the Harbin Veterinary Research Institute area and the High-tech Industrial Development area, as mentioned in Section 3.1.2, as well as the fact that these two areas are high-scoring areas in Section 3.2, also proves this point. Specialized enterprises have great advantages in some specific areas, with their high core competitiveness, and can improve the stability of the industrial chain and supply chain, as well as effectively promote the high-quality development of the manufacturing industry, which is very important for regional innovation.

4.1.3. Indicators of Service Facilities

In the correlation of each indicator, the correlations between different service facilities are quite different. Knowledge and technology (C1) have a high degree of influence on other indicators. For example, a library (c1) on the one hand provides access to knowledge and information, promotes the dissemination and sharing of knowledge, enables people from different backgrounds to have a collision of ideas, and provides the basis for innovation. On the other hand, it establishes cooperative relations with universities, research institutions, enterprises, etc., promotes the combination of production, university, and research, and provides support for the development of local innovation-related industries. The correlation is not particularly clear in the basic education type (C2). Convenience stores (c6) in the shopping type (C3) and coffee shops (c8) in the leisure and communication type (C4) are highly influenced by other indicators. The scales of these two types of indicators are usually small, the site selection is flexible, they are easily affected by multiple factors, and they have the characteristics of an agglomeration economy. On the one hand, convenience stores and cafes meet the high-frequency and fragmented immediate consumption demands of innovation talents through the Jacobs external effect. On the other hand, they rely on the knowledge spillover effect to build an innovative network for informal knowledge exchange.
On the whole, the indicators of service facilities are mostly “Voluntariness Indicators” or “Core Problem Indicators”, and the M value is low. The roles they play in the entire evaluation system are minor. The fundamental education class (C2) is the “Voluntariness Indicator”, which plays an auxiliary role in the system. In addition, the coffee shop (c8) is the “Independent Indicator” with a high M value, which plays a greater role in the entire system. Cafes are places for economic transactions, social connections, and community building [66]. They are accessible and inclusive, serving as a “third space” apart from the home and workplace, providing a space for people to communicate and interact [67]. As mentioned in Section 3.1.3. above, as a leisure and communication facility, the high-density area of the cafe has spatial overlap with the high-density area of the core elements of innovation. In addition, a considerable proportion of the audience of coffee shops are young people or middle-aged people with certain assets, who have a high degree of overlap with the innovative population. Therefore, the number of coffee shops and the degree of aggregation of the innovative population have a significant positive correlation with the development level of innovative activities.

4.1.4. Indicators of External Environment

In terms of the relevance of the indicators, the external environment indicator is mainly influenced by other indicators, in particular the core elements of the innovation indicator (A) and the entrepreneurship support institutions indicator (B). Take the density of buildings (d2) as an example: the higher the innovation vitality of an area, the more perfect the development of innovative industries, the higher the degree of land development in the area, and a corresponding increase in density of buildings.
On the whole, the external environment indicators are “Core Problem Indicators”, which are highly affected by other indicators and have relatively low M values. The roles they play in the entire evaluation system are minor because they do not directly participate in innovation activities, but play an indirect role in their periphery.

4.1.5. Indicators of Diversities

Similarly to the external environment indicator in its relevance, the diversity indicator is mainly influenced by other indicators, in particular, the core elements of innovation (A) and entrepreneurship support institutions (B). Various innovative elements promote the optimization of space utilization so that different types of land can be combined more flexibly, improve the efficiency of space use, and enrich various industrial formats. Secondly, unlike traditional industries, the boundaries between work, leisure, and the residences of people engaged in innovative industries are relatively blurred, which encourages developers to integrate office, commercial, and residential spaces to meet the needs of innovative people for multi-functional space and diversified business patterns.
On the whole, the degree of land-use mixing (e1) is the “Core Problem Indicator”, and the degree of business pattern mixing (e2) is the “Independent Indicator”. The M values of the two are in the middle position in the indicator system and have a certain influence on the regional innovation performance.

4.2. Comparative Analysis of the Indicator System

The existing performance evaluation classification systems for innovation spaces mostly focus on a single dimension, such as those of Yigitcanlar, T., and Adu McVie, R. et al. [23,24], who constructed an evaluation system consisting of function, feature, space, and context, focusing on static attributes. Rapetti, C. et al. [26,27,28] constructed a system of indicators from the four dimensions of city, economy, society, and governance, focusing on institutional elements. Youwei, T. et al. [30] constructed a system of indicators from two levels of spatial identification and elements focusing on the resources of innovation subjects, and so on.
The innovation spaces indicator system constructed in this paper is based on the idea of “innovation core (core elements of innovation, entrepreneurship support institutions), innovation support (service facilities), and innovation environment (external environment, diversity)”, and it is a multidimensional framework that is dynamic, spatial, and easy to quantify. Firstly, it has the characteristic of dynamics. For instance, among the core elements of innovation, such as innovation institutions, innovation talents, and innovation outputs, each indicator influences the others, forming an interactive feedback system. Secondly, it emphasizes spatiality, presenting various indicators in space. It uses a grid as the basic analysis unit to conduct a unified evaluation of the innovation performance of different areas, highlighting the differences in development among areas and having a high spatial resolution. Thirdly, it is easy to quantify. The specific indicators selected can all be quantitatively analyzed. By collecting various types of data and building a multi-source database, the precise measurement of the performance of innovation spaces has been achieved.
The evaluation framework of innovation space performance constructed in this paper provides a valuable practical tool for urban planning decision makers. Through the entropy-weighted TOPSIS method, the performance of urban innovation spaces is evaluated from multiple dimensions, and different types of innovation spaces, such as “Entrepreneurship Leading Area” and “Environmental Support Area”, are identified, which is convenient for optimizing the regional allocation of fiscal funds, land supply, and talent policies. Based on the results of a DEMATEL analysis, relevant measures can be implemented by focusing on some specific indicators. For example, for the “Driving Indicator” undergraduate (a5), a university talent residence program can be implemented to retain innovation talents, promote technological innovation and the local transformation of university scientific research achievements, accelerate industrial transformation, and promote regional economic development. For the “Independent Indicator” coffee shop (c8), subsidies for the construction of the “Third Space” can be provided to encourage the cultivation of key carriers for knowledge flow, social interaction, and creative incubation.
The evaluation system constructed in this paper has certain scalability and can be applied to other cities. At the data acquisition level, core indicators such as innovation institutions and POI facilities rely on public data sources and can be seamlessly integrated with government open platforms or commercial map services of other cities. At the research scope level, for cities of different scale grades, the grid analysis method allows the resolution to be flexibly adjusted according to the size of the city. At the research method level, the objective weight calculation of the entropy-weighted TOPSIS method can effectively adapt to the indicator distribution characteristics of different cities. The visual comparison of the correlations of each indicator in DEMATEL can reveal the heterogeneity of the innovation-driven mechanisms in different cities.

5. Conclusions

This study took the central urban area of Harbin as the research object. From the perspective of an urban micro-grid, this paper established a relatively micro and refined quantitative performance evaluation framework of innovation spaces from five aspects, including core elements of innovation, entrepreneurship support institutions, service facilities, external environment, and diversities, and twenty-five indicators, which provided a valuable tool for researchers and urban planning decision makers.
This paper used a rating indicator system and the entropy-weighted TOPSIS method to determine the weight with which to evaluate the performance of innovation spaces. Finally, based on the comprehensive evaluation results, four high-scoring areas of innovation spaces were identified: the Science and Technology Innovation City area, the High-tech Industrial Development area, the core area of the old city, and the Harbin Veterinary Research Institute area, which were divided into three types: “Entrepreneurship Leading Area”, “Environmental Support Area”, and “Balanced Development Area”. According to the specific conditions of each area, planning and development suggestions were given. The Entrepreneurship Leading Area needs to improve service facilities, increase the density of highly centralized service facilities, such as convenience stores and coffee shops, and activate knowledge spillover. The Environmental Support Area needs to introduce core innovation elements such as branch campuses of universities and high-tech enterprises in a targeted manner, accelerate industrial transformation and upgrading, and adopt some specific policies to encourage the introduction of innovative elements, such as setting a red line for the proportion of innovative land use and giving floor area ratio rewards to areas that meet standards. The Balanced Development Area needs to develop entrepreneurship support institutions and implement relevant measures for innovative development, such as utilizing industrial heritage renewal policies to convert idle commercial spaces into low-cost maker spaces, play a leading role in innovation, and drive the development of surrounding areas.
Finally, the DEMATEL method was used to analyze the interaction between each indicator and determine the status of each indicator in the entire evaluation system, so as to better consider and weigh the advantages and disadvantages when knowing how one or several indicators affect other indicators. It was found that the correlation between the core elements of innovation and the indicators of entrepreneurship support institutions was strong and the degree of importance was high. The correlation between different types of service facility indicators was quite different. The knowledge and technology type had a high degree of influence on other indicators, the fundamental education type played an auxiliary role, the shopping type was the core problem indicator, and the leisure and communication type was an independent indicator. The external environment indicators and diversity indicators were mainly affected by other indicators, especially the indicators of the core elements of innovation and entrepreneurship support institutions.
There are also some deficiencies in this study. In terms of the indicator system, the Gaode POI data used in this study have certain limitations and cannot fully and accurately reflect the distribution of various business types. Further improvement is needed. Due to the limitation of data acquisition, some economic indicators that have an impact on innovation performance, such as enterprise management indicators of high-tech enterprises, and micro indicators, such as the accessibility of various innovation facilities, were not included in the evaluation system. In addition, indicators such as innovation culture and innovation policies were not included in the research framework either. The indicator system needs to be further improved in the future. In terms of research time series, in the future, panel data can be combined to analyze the evolution law of innovation space performance and identify the lag effects and characteristics of key indicators. Finally, the research area of this paper was Harbin; in the future, the research scope can be expanded to other cities with different geographical locations and development levels to refine regional optimization strategies.

Author Contributions

Conceptualization, S.W. and D.X.; methodology, B.L. and D.X.; validation, S.W., B.L. and D.X.; formal analysis, B.L. and D.X.; resources, B.L. and D.X.; data curation, B.L.; writing—original draft preparation, B.L. and D.X.; writing—review and editing, S.W., B.L. and D.X.; visualization, B.L.; supervision, S.W.; project administration, S.W. and D.X.; funding acquisition, S.W. and D.X. All authors have read and agreed to the published version of the manuscript.

Funding

This research was supported by “Research on the master plan and design of the construction of innovation and entrepreneurship ecosphere of Harbin Institute of Technology (including HIT Advanced Technology Research Institute and Future Industrial Science and Technology Park) (GNCMSSJH20240035)”, “Specific subjects on the construction of Innovation and Entrepreneurship Ecosphere around the university, compound and institute in Harbin (No. 2022STQZXKT01)”, and the HeiLongiiang Association of Higher Education, “Research on the construction path of Innovation and Entrepreneurship Ecosphere around the university, compound and institute in Heilongjiang province (No. 23GJZD001)”.

Data Availability Statement

The original contributions presented in the study are included in the article; further inquiries can be directed to the corresponding author.

Acknowledgments

The authors gratefully acknowledge the support and guidance of the professors of the School of Architecture and Design, Harbin Institute of Technology.

Conflicts of Interest

The authors declare no conflicts of interest.

References

  1. Xu, C.; Du, Y.; Qi, L.; Li, R.; Yang, Z. Assessing the Potential for Developing Innovation Districts at the City Scale by Adapting a New Sustainable Entrepreneurial Ecosystems Method. Buildings 2023, 13, 2572. [Google Scholar] [CrossRef]
  2. Fritsch, M. The theory of economic development: An inquiry into profits, capital, credit, interest, and the business cycle. Reg. Stud. 2017, 51, 654–655. [Google Scholar] [CrossRef]
  3. Solow, R. A contribution to the theory of economic growth. Q. J. Econ. 1956, 70, 65–94. [Google Scholar] [CrossRef]
  4. North, D. Institutional change: A framework of analysis. In Social Rules; Routledge: London, UK, 2018; pp. 189–201. [Google Scholar]
  5. Perroux, F. Note sur la notion de “pôle de croissance”. Économie Appliquée 1955, 8, 307–320. [Google Scholar] [CrossRef]
  6. Cooke, P. Regional innovation systems: Competitive regulation in the new Europe. Geoforum 1992, 23, 365–382. [Google Scholar] [CrossRef]
  7. Holmes, J. The Spatial Economy: Cities, Regions, and International Trade; MIT Press: Cambridge, MA, USA, 2000; pp. 491–493. [Google Scholar]
  8. Landry, C. The Creative City: A Toolkit for Urban Innovators; Earthscan Publication Ltd.: London, UK, 2000. [Google Scholar]
  9. Katz, B.; Wagner, J. The rise of urban innovation districts. Harv. Bus. Rev. 2014. [Google Scholar]
  10. Tang, S.; Zhang, J. Review on Progress and Prospect of Urban Innovation Space and Its Planning Practice. Shanghai Urban Plan. Rev. 2022, 87–93. (In Chinese) [Google Scholar] [CrossRef]
  11. Huggins, R. The evolution of knowledge clusters: Progress and policy. Econ. Dev. Q. 2008, 22, 277–289. [Google Scholar] [CrossRef]
  12. Esmaeilpoorarabi, N.; Yigitcanlar, T.; Guaralda, M.; Kamruzzaman, M. Does place quality matter for innovation districts? Determining the essential place characteristics from Brisbane’s knowledge precincts. Land Use Policy 2018, 79, 734–747. [Google Scholar] [CrossRef]
  13. Pancholi, S.; Yigitcanlar, T.; Guaralda, M. Place making for innovation and knowledge-intensive activities:the Australian experience. Technol. Forecast. Soc. Change 2019, 146, 616–625. [Google Scholar] [CrossRef]
  14. Jones, A. Regenerating urban waterfronts—Creating better futures—From commercial and leisure market places to cultural quarters and innovation districts. Plan. Pract. Res. 2017, 32, 333–344. [Google Scholar] [CrossRef]
  15. Pancholi, S.; Yigitcanlar, T.; Guaralda, M. Urban knowledge and innovation spaces: Concepts, conditions, and contexts. Asia Pac. J. Innov. Entrep. 2014, 8, 15–38. [Google Scholar]
  16. Li, X.; Chen, K. Evaluation on Regional Scientific and Technological Innovation Capacity Based on Principal Component Analysis. In International Conference on Logistics Engineering, Management and Computer Science (LEMCS 2015); Atlantis Press: Dordrecht, The Netherlands, 2015; pp. 1582–1587. [Google Scholar]
  17. Burke, J.; Gras Alomà, R.; Yu, F. Multiplying Effects of Urban Innovation Districts. Geospatial Analysis Framework for Evaluating Innovation Performance Within Urban Environments. In Innovating Strategies and Solutions for Urban Performance and Regeneration; Springer International Publishing: Cham, Switzerland, 2022; pp. 191–207. [Google Scholar]
  18. Tretyakova, E.; Noskov, A. Innovation performance of Russia’ s northwestern regions: A comparative evaluation. Balt. Reg. 2021, 13, 4–22. [Google Scholar] [CrossRef]
  19. Rodrigues, M.; Franco, M. Taxonomy of Holistic Performance of Current Creative Cities: Empirical Study. J. Urban Plan. Dev. 2020, 146, 04019030. [Google Scholar] [CrossRef]
  20. Forsyth, A. Alternative forms of the high-technology district: Corridors, clumps, cores, campuses, subdivisions, and sites. Environ. Plan. C Gov. Policy 2014, 32, 809–823. [Google Scholar] [CrossRef]
  21. Esmaeilpoorarabi, N.; Yigitcanlar, T.; Guaralda, M.; Kamruzzaman, M. Evaluating place quality in innovation districts: A Delphic hierarchy process approach. Land Use Policy 2018, 76, 471–486. [Google Scholar] [CrossRef]
  22. Esmaeilpoorarabi, N.; Yigitcanlar, T.; Guaralda, M. Place quality in innovation clusters: An empirical analysis of global best practices from Singapore, Helsinki, New York, and Sydney. Cities 2018, 74, 156–168. [Google Scholar] [CrossRef]
  23. Yigitcanlar, T.; Adu-McVie, R.; Erol, I. How can contemporary innovation districts be classified? A systematic review of the literature. Land Use Policy 2020, 95, 104595. [Google Scholar] [CrossRef]
  24. Adu-McVie, R.; Yigitcanlar, T.; Erol, I.; Xia, B. Classifying innovation districts: Delphi validation of a multidimensional framework. Land Use Policy 2021, 111, 105779. [Google Scholar] [CrossRef]
  25. Adu McVie, R.; Yigitcanlar, T.; Erol, I.; Xia, B. How can innovation district performance be assessed? Insights from South East Queensland, Australia. J. Place Manag. Dev. 2023, 16, 183–247. [Google Scholar] [CrossRef]
  26. Rapetti, C.; Pique, J.; Pareja-Eastaway, M.; Grimaldi, D. Measuring the development of innovations districts through indicators: 22@Barcelona Case. J. Evol. Stud. Bus. 2022, 7, 6–39. [Google Scholar] [CrossRef]
  27. Rapetti, C.; Pique, J.; Berbegal-Mirabent, J.; Figlioli, A. Performance indicators for the evolution of areas of innovation: Porto digital case. J. Evol. Stud. Bus. 2022, 7, 219–267. [Google Scholar] [CrossRef]
  28. Rapetti, C.; Pique, J.M.; Etzkowitz, H.; Miralles, F.; Duran, J. Development of Innovation Districts: A Performance Assessment. Triple Helix 2023, 10, 77–124. [Google Scholar] [CrossRef]
  29. Etzkowitz, H.; Leydesdorff, L. The dynamics of innovation: From National Systems and “Mode 2” to a Triple Helix of university-industry-government relations. Res. Policy 2000, 29, 109–123. [Google Scholar] [CrossRef]
  30. Tan, Y.; Qian, Q.; Chen, X. Innovation District Space and Element Identification Framework: Empirical Research from Shenzhen, China. J. Urban Plan. Dev. 2023, 149, 05022041. [Google Scholar]
  31. Musiaka, Ł.; Nalej, M. Application of GIS Tools in the Measurement Analysis of Urban Spatial Layouts Using the Square Grid Method. ISPRS Int. J. Geo-Inf. 2021, 10, 558. [Google Scholar] [CrossRef]
  32. Zielstra, D.; Zipf, A. A comparative study of proprietary geodata and volunteered geographic information for Germany. In Proceedings of the 13th AGILE International Conference on Geographic Information Science, Guimarães, Portugal, 11–14 May 2010; pp. 1–15. [Google Scholar]
  33. Neis, P.; Zielstra, D.; Zipf, A. The street network evolution of crowdsourced maps: OpenStreetMap in Germany 2007–2011. Future Internet 2011, 4, 1–21. [Google Scholar] [CrossRef]
  34. Corcoran, P.; Mooney, P.; Bertolotto, M. Analysing the growth of OpenStreetMap networks. Spat. Stat. 2013, 3, 21–32. [Google Scholar] [CrossRef]
  35. Al-Bakri, M. Ten years of OpenStreetMap project: Have we addressed data quality appropriately?—Review Paper. J. Eng. 2015, 21, 158–175. [Google Scholar] [CrossRef]
  36. Available online: www.openstreetmap.org (accessed on 10 December 2022).
  37. Li, Y. The Measurement and Evolution Characteristics of Spatial Structure of Urban Innovation: The Perspective of Innovation Activity Distribution. Urban Plan. Forum 2022, 1, 74–80. (In Chinese) [Google Scholar]
  38. Guan, M.; Sun, S. Agglomeration characteristics and influencing factors of urban innovation space: A case study of Nanjing main city. City Plan. Rev. 2023, 47, 21–31. (In Chinese) [Google Scholar]
  39. Chen, J.; Huang, H.; Chen, X. The Evolution of Urban Innovation Spatial Structure on the Basis of Spatial Grids: A Case Study of Guangzhou. Mod. Urban Res. 2018, 84–90. (In Chinese) [Google Scholar] [CrossRef]
  40. Na, M.; Bian, B. Research on Planning Path of Innovation Districts Based on Innovation Ecosystem Theory: A Case Study of Hangzhou Future Scitech City. City Plan. Rev. 2022, 46, 7–20+53. [Google Scholar]
  41. Mulas, V.; Minges, M.; Applebaum, H. Boosting tech innovation: Ecosystems in cities: A framework for growth and sustainability of urban tech innovation ecosystems. Innov. Technol. Gov. Glob. 2016, 11, 98–125. [Google Scholar] [CrossRef]
  42. Clifton, N. The “creative class” in the UK: An initial analysis. Geogr. Ann. Ser. B Hum. Geogr. 2008, 90, 63–82. [Google Scholar] [CrossRef]
  43. Shi, X.; Chen, Y.; Xia, M.; Zhang, Y. Effects of the talent war on urban innovation in China: A difference-in-differences analysis. Land 2022, 11, 1485. [Google Scholar] [CrossRef]
  44. Nagaoka, S.; Motohashi, K.; Goto, A. Patent statistics as an innovation indicator. In Handbook of the Economics of Innovation; North-Holland: Amsterdam, The Netherlands, 2010; Volume 2, pp. 1083–1127. [Google Scholar]
  45. Ponta, L.; Puliga, G.; Manzini, R. A measure of innovation performance: The Innovation Patent Index. Manag. Decis. 2021, 59, 73–98. [Google Scholar] [CrossRef]
  46. Available online: https://www.harbin.gov.cn (accessed on 10 September 2023).
  47. Available online: https://pss-system.cponline.cnipa.gov.cn/conventionalSearch (accessed on 10 June 2024).
  48. Available online: https://www.gov.cn/zhengce/zhengceku/2022-06/02/content_5693548.htm (accessed on 10 September 2023).
  49. Available online: https://hlipa.hlj.gov.cn/hlipa/c103155/202306/c00_31645587.shtml (accessed on 10 September 2023).
  50. Florida, R. Cities and the creative class. City Community 2003, 2, 3–19. [Google Scholar] [CrossRef]
  51. Wu, S.; Li, B.; Xu, D. Agglomeration Characteristics and Influencing Factors of Urban Innovation Spaces Based on the Distribution Data of High-Tech Enterprises in Harbin. Buildings 2024, 14, 1615. [Google Scholar] [CrossRef]
  52. Li, L.; Zhang, X. Spatial evolution and critical factors of urban innovation: Evidence from Shanghai, China. Sustainability 2020, 12, 938. [Google Scholar] [CrossRef]
  53. Jacobs-Crisioni, C.; Rietveld, P.; Koomen, E.; Tranos, E. Evaluating the impact of land-use density and mix on spatiotemporal urban activity patterns: An exploratory study using mobile phone data. Environ. Plan. A 2014, 46, 2769–2785. [Google Scholar] [CrossRef]
  54. Chen, Z.; Dong, B.; Pei, Q.; Zhang, Z. The impacts of urban vitality and urban density on innovation: Evidence from China’s Greater Bay Area. Habitat Int. 2022, 119, 102490. [Google Scholar] [CrossRef]
  55. Liu, B.; Zheng, S.; Zhang, L.; Liu, J.; Fu, T.; Hao, R.; Yin, M. Identification and Analysis of Potential Open-Sharing Subjects of Unit-Affiliated Green Spaces in Shanghai Based on POI Data. Land 2023, 12, 2162. [Google Scholar] [CrossRef]
  56. Psyllidis, A.; Gao, S.; Hu, Y.; Kim, E.K.; McKenzie, G.; Purves, R.; Yuan, M.; Andris, C. Points of Interest (POI): A commentary on the state of the art, challenges, and prospects for the future. Comput. Urban Sci. 2022, 2, 20. [Google Scholar] [CrossRef]
  57. Yao, Y.; Zhu, Q.; Guo, Z.; Huang, W.; Zhang, Y.; Yan, X.; Dong, A.; Jiang, Z.; Liu, H.; Guan, Q. Unsupervised land-use change detection using multi-temporal POI embedding. Int. J. Geogr. Inf. Sci. 2023, 37, 2392–2415. [Google Scholar] [CrossRef]
  58. Li, X.; Bu, R.; Chang, Y.; Hu, Y.; Wen, Q.; Wang, X.; Xu, C.; Li, Y.; He, H. The response of landscape metrics against pattern scenarios. Acta Ecol. Sin. 2004, 1, 123–134. (In Chinese) [Google Scholar]
  59. Hwang, C.; Yoon, K. Multiple Attribute Decision Making; Springer: Berlin/Heidelberg, Germany, 1981; p. 36. [Google Scholar]
  60. Sayareh, J.; Alizmini, H. A hybrid decision-making model for selecting container seaport in the Persian Gulf. Asian J. Shipp. Logist. 2014, 30, 75–95. [Google Scholar] [CrossRef]
  61. Shen, L.; Huang, Z.; Wong, S.W.; Liao, S.; Lou, Y. A holistic evaluation of smart city performance in the context of China. J. Clean. Prod. 2018, 200, 667–679. [Google Scholar] [CrossRef]
  62. Chen, P. Effects of the entropy weight on TOPSIS. Expert Syst. Appl. 2021, 168, 114186. [Google Scholar] [CrossRef]
  63. Si, S.; You, X.; Liu, H.; Zhang, P. DEMATEL technique: A systematic review of the state-of-the-art literature on methodologies and applications. Math. Probl. Eng. 2018, 1, 3696457. [Google Scholar] [CrossRef]
  64. Kumar, A.; Dash, M. Using DEMATEL to construct influential network relation map of consumer decision-making in e-marketplace. Int. J. Bus. Inf. Syst. 2016, 21, 48–72. [Google Scholar] [CrossRef]
  65. Wu, Y.; Yang, Y.; Xu, W.; Chen, Q. The influence of innovation resources in higher education institutions on the development of Sci-tech parks’ enterprises in the urban innovative districts at the stage of urbanization transformation. Land 2020, 9, 396. [Google Scholar] [CrossRef]
  66. Ferreira, J.; Ferreira, C.; Bos, E. Spaces of consumption, connection, and community: Exploring the role of the coffee shop in urban lives. Geoforum 2021, 119, 21–29. [Google Scholar] [CrossRef]
  67. Oldenburg, R. The Great Good Place: Cafes, Coffee Shops, Bookstores, Bars, Hair Salons, and Other Hangouts at the Heart of a Community; Da Capo Press: Cambridge, MA, USA, 1999. [Google Scholar]
Figure 1. Study area.
Buildings 15 02258 g001
Figure 2. Kernel density distribution of various core elements of innovation and the overall evaluation results of core elements of innovation (numbers ①–④ represent high-scoring areas).
Buildings 15 02258 g002
Figure 3. Kernel density distribution of various entrepreneurship support institutions and the overall evaluation results of entrepreneurship support institutions (numbers ①–⑥ represent high-scoring areas).
Buildings 15 02258 g003
Figure 4. Kernel density distribution of various service facilities and the overall evaluation results of service facilities (numbers ①, ② represent high-scoring areas).
Buildings 15 02258 g004
Figure 5. Spatial distribution of various external environments and the overall evaluation results of the external environment (numbers ①–④ represent high-scoring areas).
Buildings 15 02258 g005
Figure 6. Spatial distribution of various diversities and the overall evaluation results of diversities (numbers ①–⑦ represent high-scoring areas).
Buildings 15 02258 g006
Figure 7. Performance evaluation results of innovation spaces: spatial distribution of high-scoring innovation spaces and radar map.
Buildings 15 02258 g007
Figure 8. DEMATEL-based heat diagram of correlation between indicators (the larger the number, the stronger the correlation between the indicators and the darker the red color of the grid where they are located, the smaller the number, the weaker the correlation between the indicators and the darker the blue color of the grid where they are located).
Buildings 15 02258 g008
Figure 9. Quadrantal distribution diagram of indicators based on M and R.
Buildings 15 02258 g009
Table 1. Indicator system of performance evaluation of innovation spaces.
TypeSubtypeSpecific IndicatorUnitData Source
(A) Core elements of innovation(A1) Innovation institutions(a1) Density of colleges and universitiesper km2Websites of relevant universities
(a2) Density of scientific
research institutions
per km2Official government website
(a3) Density of high-tech enterprisesper km2
(A2) Innovation talents(a4) Density of university teachersper km2Websites of relevant colleges and universities
(a5) Density of undergraduatesper km2
(a6) Density of master’s and
doctoral students
per km2
(A3) Innovation output(a7) Density of patentsper km2Patent website
(B) Entrepreneurship support institutions(B1) Incubation type(b1) Density of high-tech
business incubators
per km2Official government website
(b2) Density of maker spacesper km2
(B2) Cultural and creative type(b3) Density of cultural and
creative facilities
per km2
(B3) Specialized type(b4) Density of specialized enterprisesper km2
(C) Service facilities(C1) Knowledge and technology type(c1) Density of librariesper km2Gaode Map API
(c2) Density of vocational schoolsper km2
(C2) Fundamental education type(c3) Density of primary schoolsper km2
(c4) Density of kindergartensper km2
(C3) Shopping type(c5) Density of supermarketsper km2
(c6) Density of convenience storesper km2
(C4) Leisure and communication type(c7) Density of fitness centersper km2
(c8) Density of coffee shopsper km2
(c9) Density of parksper km2
(D) External Environment(D1) Traffic conditions(d1) Density of road networkkm per km2OSM dataset
(D2) Land development degree(d2) Density of building%
(D3) Ecological environment(d3) Green space ratio%
(E) Diversities(E1) Diversity of land use(e1) Degree of land-use mixing#Official government website
(E2) Diversity of business patterns(e2) Degree of business pattern mixing#Gaode Map API
Table 2. POI data information.
POI Data TypeNumber
(Entries)
POI Data TypeNumber
(Entries)
Catering services33,405Tourist attractions813
Companies14,374Automobile services9466
Shopping and consumption44,921Commercial residences4423
Traffic facilities9487Life services24,749
Financing institutions2473Entertainment2038
Hotel accommodations6494Medical care9532
Science, education, and cultural services8193Exercise and fitness1858
Table 3. DEMATEL expert information.
ExpertMajorAffiliationHighest DegreeExperience (Years)Mode of Investigation
Expert 1Public policyHarbin Municipal governmentPhD39Offline
Expert 2Geographic informationHarbin Institute of TechnologyPhD29Offline
Expert 3Urban planningBeijing Institute of Architectural DesignPhD12Offline
Expert 4Urban planningXi’an University of Architecture and TechnologyPhD10Offline
Expert 5Urban planningHarbin Institute of TechnologyMaster’s10Offline
Expert 6LandscapeWuhan UniversityPhD16Online
Expert 7ArchitectureChinese Academy of ForestryPhD14Offline
Expert 8LandscapeUrban Planning and Design Institute, Harbin Institute of TechnologyMaster’s23Offline
Expert 9SociologyNortheast Forestry UniversityMaster’s21Online
Expert 10SociologyHeilongjiang University of Science and TechnologyMaster’s20Offline
Table 4. Summary table of the correspondence between research methodology and objectives.
Method NameCore ObjectiveKey Input DataCorresponding to Sections
Entropy methodMeasuring the degree of land-use mixing and the degree of business pattern mixing Land-use data, POI dataEvaluation of diversities
Kernel density estimation methodIdentifying hotspots of the spatial aggregation of innovation elementsGeographic data of innovation elementsEvaluation of core elements of innovation, entrepreneurship support institutions, and service facilities
Entropy-weighted TOPSIS methodCalculating the performance score of innovation spaces’ grid cellsInnovative spaces’ performance evaluation indicator dataResults
DEMATEL methodCalculating the interactions between indicatorsExpert scoring matrixDiscussion
Table 5. Indicators’ weights in the performance evaluation of innovation spaces.
TypeWeight (%)SubtypeWeight (%)Specific IndicatorsWeight (%)
(A) Core elements of innovation29.78(A1) Innovation institutions11.59(a1) Number of colleges and universities4.03
(a2) Number of scientific
research institutions
4.60
(a3) Number of high-tech enterprises2.96
(A2) Innovation talents14.02(a4) Number of university teachers4.22
(a5) Number of undergraduates4.37
(a6) Number of master’s and
doctoral students
5.43
(A3) Innovation output4.17(a7) Number of patents4.17
(B) Entrepreneurship support institutions33.80(B1) Incubation type17.10(b1) Number of high-tech
business incubators
8.14
(b2) Number of maker spaces8.96
(B2) Cultural and creative type7.37(b3) Number of cultural and
creative facilities
7.37
(B3) Specialized type9.33(b4) Number of specialized enterprises9.33
(C) Service facilities26.62(C1) Knowledge and technology type5.59(c1) Number of libraries3.34
(c2) Number of vocational schools2.25
(C2) Fundamental education type5.30(c3) Number of primary schools2.35
(c4) Number of kindergartens2.95
(C3) Shopping type6.69(c5) Number of supermarkets3.64
(c6) Number of convenience stores3.05
(C4) Leisure and communication type9.04(c7) Number of fitness centers2.60
(c8) Number of coffee shops3.10
(c9) Number of parks3.34
(D) External environment7.28(D1) Traffic conditions2.08(d1) Density of road network2.08
(D2) Land development degree2.38(d2) Density of buildings2.38
(D3) Ecological environment2.82(d3) Green space ratio2.82
(E) Diversities2.52(E1) Diversity of land use0.86(e1) Degree of land-use mixing0.86
(E2) Diversity of business patterns1.66(e2) Degree of business pattern mixing1.66
Table 6. DEMATEL value of indicators.
TypeSubtypeSpecific IndicatorsD (Influence Degree)C
(Influenced Degree)
M
(Centrality)
R
(Cause Degree)
(A) Core elements of innovation(A1) Innovation institutions(a1) Number of colleges
and universities
4.1773.4747.6510.703
(a2) Number of scientific
research institutions
3.5343.6627.196−0.128
(a3) Number of high-tech enterprises3.8133.9067.719−0.093
(A2) Innovation talents(a4) Number of university teachers3.5533.6427.195−0.089
(a5) Number of undergraduates3.6493.0356.6840.614
(a6) Number of master’s and
doctoral students
3.8843.5847.4680.300
(A3) Innovation output(a7) Number of patents3.6903.2626.9520.428
(B) Entrepreneurship support institutions(B1) Incubation type(b1) Number of high-tech
business incubators
3.4873.5737.060−0.086
(b2) Number of maker spaces3.4383.6067.044−0.168
(B2) Cultural and creative type(b3) Number of cultural and
creative facilities
3.2533.3496.602−0.096
(B3) Specialized type(b4) Number of specialized enterprises3.9613.8217.7820.140
(C) Service facilities(C1) Knowledge and technology type(c1) Number of libraries3.3852.3995.7840.986
(c2) Number of vocational schools3.0991.7264.8251.373
(C2) Fundamental education type(c3) Number of primary schools2.2591.6993.9580.560
(c4) Number of kindergartens2.4992.1734.6720.326
(C3) Shopping type(c5) Number of supermarkets2.4112.5674.978−0.156
(c6) Number of convenience stores2.6103.3225.932−0.712
(C4) Leisure and communication type(c7) Number of fitness centers2.5152.6175.132−0.102
(c8) Number of coffee shops2.8813.2946.175−0.413
(c9) Number of parks2.6702.2454.9150.425
(D) External environment(D1) Traffic condition(d1) Density of road network1.4972.6904.187−1.193
(D2) Land development degree(d2) Density of buildings2.1183.0945.212−0.976
(D3) Ecological environment(d3) Green space ratio2.1812.7564.937−0.575
(E) Diversities(E1) Diversity of land use(e1) Degree of land-use mixing2.2252.9215.146−0.696
(E2) Diversity of
business patterns
(e2) Degree of business pattern mixing2.8573.2286.085−0.371
Disclaimer/Publisher’s Note: The statements, opinions and data contained in all publications are solely those of the individual author(s) and contributor(s) and not of MDPI and/or the editor(s). MDPI and/or the editor(s) disclaim responsibility for any injury to people or property resulting from any ideas, methods, instructions or products referred to in the content.

