Abstract
This study investigates the relationship between architectural attributes of workspaces and employee satisfaction, situating its inquiry within the broader context of post-pandemic hybrid work models and the evolving understanding of territoriality in organizational environments. Drawing on the social production of space and the multidimensional framework of Quality of Work Life (QWL), this research employs a quantitative, questionnaire-based methodology across three diverse corporate settings in Belgrade, Serbia. A total of 124 participants took part in the survey, representing the logistics (Fercam), IT (UBConnect), and healthcare (Medigroup) sectors. The survey integrates validated instruments—the Workspace Characteristics Scale (WCS) and the Workspace Satisfaction Scale (WSS)—to assess the impact of 12 variables and spatial features, reflecting functional, sensory, and sociological dimensions. Multiple regression analyses reveal that aesthetics, flexibility, and a sense of belonging consistently emerge as significant predictors of workspace satisfaction, with sector-specific variations observed across the cases. Notably, the findings underscore the importance of aligning spatial design with organizational values and user expectations while also highlighting the nuanced roles of sociological and psychological dimensions. The results offer practical relevance for architects and interior designers, providing insights into how design strategies tailored to user needs and sector-specific cultures can foster more effective workplace environments. This study concludes that evidence-based, multidimensional design strategies are essential for fostering well-being and productivity in contemporary work environments, demonstrating the value of aligning design with user expectations to enhance organizational outcomes. It recommends further research into the interplay between flexibility and belonging as determinants of workplace satisfaction.
1. Introduction
1.1. Background and Relevance
Time spent in contemporary workspaces—particularly in the aftermath of COVID-19 and the integration of hybrid work models, alongside companies’ ongoing efforts to manage the challenges of hybridization and reintegration into the physical workplace—has brought renewed attention to the influence of architectural and spatial elements of both territory and interior environments on employee satisfaction and productivity. Concurrently, the context of the information age and the distinction between the space of places and the space of flows, as theorized by Manuel Castells [1], foregrounds the notion of territoriality and the emergent dynamics shaped by informational flows. This raises critical questions about the definition of territory in contemporary work environments and how such territories can be meaningfully connected to employees. In this study, territory is not understood solely in terms of physical or architectural features. Instead, space is conceptualized through the lens of Henri Lefebvre’s theory of the social production of space [2], which frames territoriality as an identity-bearing dimension. In his seminal work The Production of Space (originally published in 1974 and translated into English in 1991), Lefebvre proposes that space must be understood as a social construct rather than as a purely geometric, mathematical, material, or physical product. He shifts the analytical focus from a semiotic conception of space as a coded message to its active construction and sociopolitical embodiment. Accordingly, this research integrates the sociological dimension into the analysis of the physical interior of the workspace. This study forms part of a broader conceptual model intended to inform and support the design of work environments that promote both the mental and physical well-being of users. It also incorporates contemporary examples of workspace interiors to ground the findings in current architectural practice.
The design of the workplace and its influence on employee satisfaction has been explored through a range of variables, including performance [3], motivation and satisfaction [4], and employee work performance and well-being [5]. These dimensions are often examined in conjunction with aspects of the physical environment, such as spatial configuration [6], workspace size [7], aesthetic impression [8], furniture quality [9], the adaptability of the space to individual needs [10], distance between workstations [11], and layout organization [12]. Other relevant factors include flexibility privacy [13,14]. Knight and Haslam [15] demonstrated through experimental research that employee participation in the design of the workspace significantly contributes to productivity, well-being, and a sense of dignity and the research connection of psychological comfort and autonomy and organizational identification. Complementing this, Nikolaeva and Russo [16] (p. 206) argue that “there is an individualized interpretation of physical space that shapes perceptions of value, autonomy, comfort, identity, and dignity.” Given that employees with higher levels of professional capacity tend to seek greater autonomy in their work [17], it becomes increasingly important to understand and address the diverse structures and needs of different user profiles. In line with the above, workplace satisfaction metrics play a critical analytical role in shaping the framework for both the design and post-occupancy evaluation of contemporary work environments, serving not only as indicators of user experience but also as essential tools for informing evidence-based spatial and organizational strategies.
1.2. Conceptual Framing and Theoretical Context
Quality of Work Life (QWL) research has evolved significantly over the past five decades, transitioning from basic workplace condition assessments to comprehensive multidimensional frameworks that capture the complex interplay between work environment factors and employee well-being, becoming increasingly important within the scope of architectural design. QWL refers to the dimension of life quality that is influenced by work, extending beyond mere job satisfaction to encompass the broader context of the work environment and its developmental potential [18]. The concept of QWL is considered a subcategory of the overall quality of life (QoL) and has been studied independently since the late 1970s [19].
The evolution of QWL research can be traced through distinct phases, each characterized by different conceptual approaches and measurement strategies. During the 1980s and 1990s, researchers began to move beyond simple job satisfaction measures to develop more comprehensive frameworks for understanding work–life quality [20]. Efraty and Sirgy [21] conducted seminal work during this period, focusing on both work-related and personal factors that could improve or reduce QWL, establishing important theoretical foundations for subsequent research. Their approach was particularly notable for incorporating life satisfaction as a broader outcome measure, recognizing that workplace experiences extend their influence beyond organizational boundaries. This approach is supported by a series of studies aimed at strengthening the conceptual framework of Quality of Work Life (QWL) and its theoretical consolidation, including the following advancements: (1) a systematic investigation on how specific job characteristics could be measured and modified to enhance overall work–life quality [22], (2) an understanding of QWL antecedents by investigating positive work experiences and their relationship to both personal and organizational factors, providing empirical evidence for the multidimensional nature of work–life quality [23], and (3) the development of metrics that could assess various work-related factors systematically [24]. These studies established the foundation for contemporary measurement approaches by demonstrating that QWL could be reliably assessed through structured instruments that captured multiple dimensions of workplace experience. In this context, Simon A. Easton and Darren L. Van Laar from the University of Portsmouth developed the Work-Related Quality of Life (WRQoL) Scale as a targeted instrument for measuring work–life quality. The World Health Organization [25] (p. 1) further defines quality of life as “an individual’s perception of their position in life in the context of the culture and value systems in which they live and in relation to their goals, expectations, standards, and concerns”.
The development of psychometrically sound QWL measurement instruments represents a critical advancement in the field, with several studies providing a comprehensive validation of multidimensional scales, including (1) a comprehensive measurement index that identifies four primary QWL dimensions—work stress, work occupy, job and career satisfaction, and working conditions [26]—and (2) a case study examination of the relationship between QWL and job satisfaction, providing empirical evidence for the practical application of QWL measurement in organizational settings [27].
In this emerging theoretical framework, QWL metrics become a vital analytical tool in architectural design, offering a structured means of assessing how spatial environments contribute to employee well-being, satisfaction, and performance. Recent research has emphasized the importance of measurable spatial features in optimizing workplace outcomes from following lenses: (1) the development of a biophilic design index demonstrating significant improvements in concentration, stress recovery, and reduced presenteeism through natural materials and circadian lighting systems [28], (2) a longitudinal analysis identifying spatial flexibility, ergonomic adaptability, and informal collaboration zones as predictors of job satisfaction, physical comfort, and innovation [29], and (3) the formulation of a Functional Comfort Index (FCI) integrating metrics such as acoustic zoning, thermal autonomy, and daylight sufficiency, showing strong correlations with overall QWL scores in sustainable office settings [30]. Collectively, these studies establish architectural design as a multidimensional contributor to QWL and highlight the potential for data-driven spatial strategies to support holistic workplace well-being. Following this line of reasoning, this manuscript addresses the impact of workspace characteristics on quality of work life, understood as an integral component of the broader concept of quality of life.
1.3. Research Design and Paper Outline: Bridging the Gap Towards Integrated Framework of QWL Measurment
An insight into recent research on QWL measurement in architectural and interior design reveals an increasingly diverse yet methodologically dispersed understanding of spatial determinants influencing workplace well-being. Many studies demonstrate stronger focus on building physics (e.g., environmental comfort) over aesthetics [31], including air quality, lighting conditions, acoustic quality, thermal comfort [32], and workstation ergonomics [33]. Simultaneously, others highlight design-related dimensions [34], such as spatial layout, color harmony, material selection, and aesthetic coherence [35].
Beyond physical parameters, a scope of the literature examines psychosocial and emotional variables, including emotional health outcomes [36], perceived harmony and enchantment [37], the meaningfulness of work [38], and interpersonal relationships [39]. Still, important spatial constructs such as personal space [33], collaborative zones [40], quiet zones for concentration, and inspirational environments for creativity [41] are addressed only intermittently.
The literature sporadically acknowledges workplace flexibility, notably in terms of spatial adaptability [42]. However, flexibility is rarely examined in conjunction with aesthetic preference or a sense of belonging, despite their critical role in shaping employee satisfaction and spatial identity [37]. Similarly, dignity, understood through lenses of equality and control in workspace environments, is only implicitly addressed through constructs like organizational culture and management support [39,43].
This evidences a significant research gap, as no prior study has developed an integrated framework capable of capturing the combined effects of flexibility, belonging, and aesthetics across diverse workspace typologies. Moreover, although certain studies applied multidimensional assessments—such as TIHPS-based system models [44] or wearable multimodal integrations [45]—none link these data explicitly to spatial properties of architectural environments.
In response, this study proposes a QWL model that operationalizes spatial constructs through discrete and measurable categories, aiming to (1) bridge the gap between functional, psychological, and experiential dimensions of the workspace and (2) provide a comprehensive tool for the evidence-based evaluation of spatial quality in contemporary workplaces. Central to this investigation are two guiding questions: RQ1—which spatial characteristics of the workspace most strongly predict employee satisfaction across diverse organizational settings? RQ 2—how can these findings inform practical design strategies that enhance employee satisfaction, well-being, and broader organizational outcomes?
To address these research questions, this study employs a quantitative, questionnaire-based approach implemented across three distinct corporate settings in Belgrade, Serbia. These cases, selected for their diversity in organizational structure and spatial typology, allow for the exploration of sector-specific variations and broader patterns in workspace experience. Situated within this urban and organizational context, this research also responds to a broader regional gap: the number of studies addressing the measurement of QWL in the field of architecture and interior design remains limited across Serbia and Eastern Europe. Existing research in Serbia has primarily focused on aspects such as employees’ work–life balance [46], while spatial qualities of the work environment within architectural and interior design domains have been largely overlooked. Although certain Eastern European countries, such as the Czech Republic, have developed QWL measurement instruments—most notably the Subjective Quality of Working Life index (SQWLi) [47]—their integration into architectural and interior design research remains limited. In this context, the present study, through a case study in Belgrade, aims to address this existing gap, contributing to the originality of this research and enhancing its contextual value within the regional body of knowledge on QWL in architectural and design disciplines.
The structure of the paper is as follows. Section 2 outlines the methodological framework, including the design of the questionnaire, description of the observed workspaces, characteristics of the sample, and analytical procedures. Section 3 presents the results of the multiple regression models used to assess the predictive value of each spatial attribute, along with general insights from value-based questions. Section 4 offers a critical discussion of the findings, including a comparative interpretation of the three cases and broader reflections on workspace design implications. Finally, Section 5 concludes this paper with key takeaways, methodological considerations, and recommendations for future research.
2. Materials and Methods
This study employed a quantitative, questionnaire-based research design to explore the relationship between specific spatial characteristics and user satisfaction across three distinct corporate work environments. The methodological framework is organized into three key components. First, the design of the questionnaire is presented (Section 2.1), detailing two core instruments—the Workspace Characteristics Scale (WCS) and the Workspace Satisfaction Scale (WSS)—followed by demographic and general value-based items. Second, the implementation process is outlined (Section 2.2), including a description of the selected workspaces, sample composition, and procedural steps for data collection. The spatial characteristics measured by the WCS were conceptually grounded in the authors’ prior design experience and theoretical considerations, rather than collected through a separate observational phase. Third, the analytical approach is described (Section 2.3), focusing on a series of multiple regression models used to evaluate the predictive potential of spatial variables on workspace satisfaction. Together, these elements offer a comprehensive foundation for understanding the empirical basis of the study.
2.1. Questionnaire Design
The questionnaire was structured into four distinct sections, each addressing a specific aspect of the research framework. The first section focused on collecting general background information about the respondents, including company name and location, organizational role (ranging from executive management to entry-level positions), departmental affiliation, gender, educational background, professional field, total years of work experience, tenure within the company, basic psychological self-assessment, and the type of workspace they occupy (individual office, shared office for 2–8 people, assigned desk in an open-plan office, or flexible/unassigned seating in a shared open-plan setting). The second and third sections formed the analytical core of the questionnaire and included two validated instruments: the Workspace Characteristics Scale (WCS) and the Workspace Satisfaction Scale (WSS). These tools were designed to assess key spatial attributes and the overall satisfaction of respondents with their work environment. Finally, the fourth section comprised a set of general value-based questions intended to capture broader attitudes toward the workspace and its perceived impact. This final segment served as a complementary layer of insight, enriching the interpretation of the primary scale-based responses. An overview of both the initial and revised versions of the scales, along with the list of general and demographic questions, is provided in Appendix A.
2.1.1. Instrument 1: Workspace Characteristics Scale (WCS)
The WCS was theoretically grounded in Lefebvre’s triadic concept of space [2]—spatial practice, representations of space, and representational spaces—providing a socio-spatial lens for assessing workspace quality. The scale consisted of 12 subscales, each designed to measure a distinct spatial characteristic of the work environment. Aspects of spatial practice, referring to the physical and functional routines within space, were assessed through the following: (1) personal space, (2) distance from other employees, (3) areas for social interaction, (4) variability in organization (the possibility of choosing a place to work within the workspace), (5) spaces for quiet and focused work, and (6) spaces for creative work and inspiration. Representations of space, as the formal, planned spatial order, were captured through the following: (7) aesthetic preference (the importance and consistency of aesthetic appearance), (8) dignity (equality and control), and (9) work flexibility (the possibility of choosing the time and place of work outside the workspace). Finally, representational spaces, reflecting users’ lived, emotional, and symbolic experience, were measured via (10) the sociological dimension of space, (11) a sense of belonging, and (12) views and open outlook. The full scale comprised 38 items rated on a 10-point scale (1 = least descriptive of the workspace; 10 = most descriptive), with 10 items reverse-coded. Each subscale included between two and four items.
For the purpose of conducting the survey in Workspace 3, the legal department from that office required specific adaptations of the WCS. As a result, the third subscale—the sociological dimension of space, consisting of four items related to interpersonal relationships and social dynamics within the company—was removed due to internal corporate constraints. However, the key spatial indicator of sociological relevance—spaces for informal social interaction—remained included and assessed, thereby preserving the spatial validity of the construct. The excluded items were not directly related to spatial characteristics but rather to perceived interpersonal relations, which extend beyond the architectural scope of this study and align more closely with psychological or organizational research. Additionally, the decision to exclude interpersonal relationship questions was shaped by company-specific sensitivities, which may reflect a broader contextual limitation when applying comprehensive tools in real organizational environments. These adaptations, while methodologically justified, are acknowledged as potential limitations affecting the scope of measurement, and they highlight the complexity of implementing spatially grounded instruments in applied workplace settings.
In addition to this modification, 7 other items were removed from different subscales due to internal policy and procedural constraints, resulting in a total reduction of 11 items. Despite these removals, each retained subscale included at least two to three items, ensuring conceptual representation and preserving internal coherence for comparative analysis across cases. This selective adaptation introduces a potential instrumentation bias, as one site was evaluated using a slightly modified tool. Nevertheless, the modifications are transparently documented and interpreted as a methodological limitation arising from context-specific constraints.
An additional four-item scale aimed at evaluating alignment with company values was also introduced to explore potential connections with workspace satisfaction. However, due to corporate policy in Workspace 3, responses to these items were not obtained. As a result, these data were excluded from analysis, and the final research focus was methodologically limited to spatial aspects of the workspace environment.
2.1.2. Instrument 2: Workspace Satisfaction Scale (WSS)
The WSS consisted of four items/questions designed to assess respondents’ satisfaction with their company’s workspace. The scale focused on the spatial influence on quality of work life (QWL), modeled after established scales such as Working Conditions (WCS) as part of QWL—Satisfaction with Quality of Work Life. Respondents rated each item on a scale from 1 to 10: S1. The workspace fully meets the needs of my job description for successfully completing work tasks. S2. I feel good and comfortable in my workspace. S3. My work performance in this space is excellent. S4. I am satisfied with the aesthetic elements of my company’s workspace.
2.1.3. General Value-Based Questions
The fourth section of the questionnaire was designed to explore respondents’ broader attitudes and personal values related to the workspace. Using a 10-point Likert scale (1—strongly disagree, 10—strongly agree), participants rated their level of agreement with a series of statements concerning the symbolic, functional, and psychosocial dimensions of the work environment. Topics included the perceived impact of workspace quality on job satisfaction and performance, alignment between spatial design and organizational values, social dynamics in the office, and the role of aesthetics and natural elements. Additionally, this section incorporated multiple-choice questions addressing preferred office typologies and the estimated proportion of time respondents require for focused work versus team collaboration. These insights served to complement the core analytical scales and informed further reflections on spatial preferences and behavioral needs in different organizational contexts.
2.2. Questionnaire Implementation
2.2.1. Observatory Framework—Workspaces
This research was conducted across the workspaces of three companies based in Belgrade, Serbia, each operating in distinct sectors. A primary criterion for case selection was the direct involvement of one of the study’s authors in the architectural design of all three work environments. This ensured privileged access to the design rationale, spatial documentation, and post-occupancy conditions, thereby supporting a robust and accurate analysis. Following this, the cases were selected purposefully to reflect diversity in both organizational structure and spatial typology. The selected companies include the following:
- Case 1: Fercam—A logistics and transportation firm with a traditional organizational structure and defined fixed office zones each for team for 75 employees. The organization of work is team-based (with five or six employees in a team), so the organization of the space has prioritized teams and groups of workstations consisting of 5 (6) desks in an open space. The accompanying functions include three kitchens with seating areas and visual dividers and greenery, separated from the workspace, which also represent informal zones for socialization and interaction, harmonized materialization and chlorite, and the space also contains three formal meeting rooms (two medium-sized and one large room).
- Case 2: UB Connect—A multinational engineering and telecommunications company characterized by hybrid work practices and closed office spatial organization; there is no designated flexible work zone, instead the concept of traditional workspaces has been applied where each employee has their own workspace, and the area is organized with a larger number of individual offices, without a large open space. The number of employees using the space is 80 (84 workstations were designed), but the work concept changed after 2020, so the space is regularly used by 60 employees (the others work from home or from other locations). The space also includes three closed meeting rooms of various sizes, an entrance hall with seating, a dining area with a kitchen, without additional facilities. Individual offices are defined by the project task for management (four separate offices for one, and one office for two people from the company’s management), three offices are designated for engineering teams with eight employees each, and two for ten each. The structure is clear, engineering-oriented, and team-oriented and organized.
- Case 3: Medigroup—A private healthcare provider operating within a highly structured and function-specific office environment. The flexible work zone is organized in most of the space with 40 workstations; while 45 positions are planned with fixed workstations, only the lockers for laptops and personal belongings are personalized. The number of employees using the space is 130. Work desks in the flexible part of the space are intended to be used on a ‘first come, first served’ basis, while only the accounting, IT service, and management departments have their personalized work desks due to the nature of their work. The space also includes four formal closed meeting rooms of various sizes, one open meeting area, two phone booths designated for phone calls, designed lounge seating areas, a dining area with a kitchen, and a space for entertainment and relaxation (billiards, table tennis, video game console), along with a large terrace for outdoor leisure. Individual offices are defined for management (four separate offices for one person each, and one office for two persons from the company’s management).
The focus on Belgrade was a deliberate strategy to ensure a shared cultural, legislative, and economic context across cases, which allowed for a more coherent comparison of spatial and organizational influences on employee experience. Additionally, practical feasibility was a determining factor in finalizing case selection. All three workspaces are located within the same commercial office complex, providing a consistent external setting (Figure 1). Notably, Case 1 and Case 3 share a matching structural layout, which enables a particularly meaningful spatial comparison. While additional companies that met the primary inclusion criterion (i.e., having been designed by the same author) were approached, not all granted permission for survey implementation. Therefore, the final selection represents a balance between conceptual relevance, contextual control, and empirical feasibility.
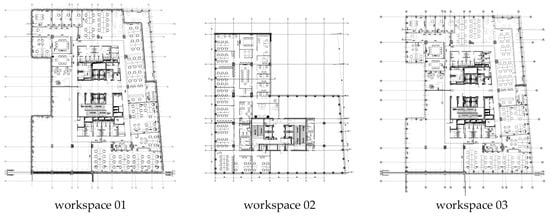
Figure 1.
Organizational structure and spatial typology of analyzed workspaces. Source: Authors.
2.2.2. Research Sample
The research sample consisted of a total of 124 respondents, among whom gender data were collected for 86 participants (56% identified as female). Respondents were surveyed from three different workspaces, with the following structure: 49 employees from the first workspace (Fercam, out of a total of 70 employees, i.e., 70%), 37 from the second (UB Connect, out of 80 employees, i.e., 46%), and 38 from the third (Medigroup, out of 130 employees, i.e., 29%). Different modes of workspace usage (permanent desk, occasional visits, and hybrid work) are further described in the case study analysis.
Prior to deployment, the questionnaire was informally pre-tested with colleagues experienced in workplace research to ensure clarity, contextual appropriateness, and technical functionality. Minor wording adjustments were made without altering the original constructs.
2.2.3. Data Collection Procedure
The survey was conducted online using the platform soscisurvey.de. Respondents first answered demographic questions, followed by the items from the Workspace Characteristics Scale (WCS) and the Workspace Satisfaction Scale (WSS), and finally, general questions. The WCS and WSS items were mixed and presented in random order. The questionnaire took up to 15 min to complete, and no formal compensation was provided for participation. No personal or identifiable data were collected from respondents, ensuring complete anonymity. The survey was conducted between 4 March and 15 March 2024.
The questionnaire was distributed via email to all employees in the three participating companies by either the HR manager or the company director, whose role was limited strictly to logistical facilitation. The invitation included clear information about the purpose of the research, ensured voluntary participation, and contained an informed consent statement. Neither the HR managers nor the company directors had access to the responses or any aspect of the implementation or results.
While this approach helped protect participant anonymity and minimize response or social desirability bias, it is acknowledged that the need to obtain company-level approval and the presence of organizational hierarchies may represent a potential source of sampling-related limitations.
2.3. Questionnaire Analysis
The data from the WCS and WSS were processed in four iterations, using IBM SPSS v26 software for each round. Each iteration involved conducting a multiple regression analysis with the WCS subscale scores as predictor variables and the overall WSS score as the criterion variable. An “enter all together” method was applied in all regression models.
The first iteration included the complete dataset, combining responses from all three workspaces. The remaining three iterations involved separate analyses for each individual workspace: iteration two presented results for the first workspace, iteration three for the second, and iteration four for the third workspace.
Due to the shortened version of the questionnaire used in Workspace 3—MediGroup, the predictor variables in iterations one and four differ to those in iterations two and three. Specifically, iterations one and four were conducted using the modified scales, while iterations two and three used the original version (see Instrument Sections).
It is important to note that the results from iterations two, three, and four are not statistically comparable, as the statistical significance of differences between the models was not tested. Although this limits statistical conclusions regarding differences between the workspaces, it does not prevent interpreting the models through a case study methodology.
To ensure the reliability of the regression models, multicollinearity was assessed by calculating Variance Inflation Factor (VIF) scores for all predictor variables. All VIF values were below the commonly accepted threshold of 5, indicating acceptable collinearity levels. Additionally, standardized beta coefficients (β) are reported in the result tables to indicate the relative strength of each predictor.
To evaluate the internal consistency of the measurement instruments, Cronbach’s alpha was calculated for the full dataset. The WCS showed strong internal reliability (α = 0.857), while the WSS achieved a similarly robust reliability score (α = 0.871). These results confirm that both scales meet the accepted threshold of 0.70, supporting the reliability of the instruments applied in the study.
Demographic and general question data were processed using basic frequency and percentage calculations.
3. Results
3.1. Models for Predicting Workspace Satisfaction
3.1.1. Iteration 1: Synthesis Sample
Iteration 1 included data from all respondents (a total of 124 cases), and the modified WCS (28 items) was used. A multiple regression model was created with 11 predictor variables and 1 criterion variable. The set of 11 predictors explained 82.8% of the variance in the criterion variable (R2adj = 0.828).
The significant predictors identified were aesthetics (β = 0.474), a sense of belonging (β = 0.194), and flexibility (β = 0.141), all showing a positive relationship with the criterion variable. This indicates that respondents who gave higher ratings on these subscales reported greater satisfaction with their workspace.
Standardized beta coefficients, as well as the original correlation coefficients between each predictor and the criterion variable, are presented in Table 1.

Table 1.
First iteration model parameters.
3.1.2. Iteration 2: Fercam
Iteration 2 included data from respondents in Workspace 1—Fercam (49 cases in total), using the original version of the WCS. A multiple regression model was created, including 12 predictor variables and 1 criterion variable. This set of 12 predictors explained 68.1% of the variance in the criterion variable (R2adj = 0.681).
The only statistically significant predictor was aesthetics (β = 0.558), which showed a positive relationship with the criterion variable. This indicates that respondents who rated the aesthetics of their workspace also more highly reported greater satisfaction on the WSS.
Standardized beta coefficients, as well as the original correlation coefficients between each predictor and the criterion variable, are presented in Table 2.
Table 2.
Second iteration model parameters.
3.1.3. Iteration 3: UB Connect
Iteration 3 included data from respondents in Workspace 2—UB CONNECT (a total of 37 cases), using the original WCS. A multiple regression model was created, consisting of the same 12 predictor variables and 1 criterion variable as in Iteration 2. This set of 12 predictors explained 81.4% of the variance in the criterion variable (R2adj = 0.814).
A large number of variables emerged as significant predictors: distance (β = 0.296), open view (β = 0.236), a sense of belonging (β = 0.785), flexibility (β = 0.314), aesthetics (β = 0.334), dignity (β = –0.282), spaces for focused work (β = 0.425), and spaces for creative work (β = –0.444).
The most influential predictor was a sense of belonging, while the weakest was open view. The directions of the standardized beta coefficients suggest that respondents who perceived their workspace as offering greater distance, more open views, a stronger sense of belonging, greater flexibility, stronger aesthetic influence, and more spaces for focused work reported higher levels of workspace satisfaction. In contrast, a stronger protection of dignity and a higher number of spaces for creative work showed a negative association with workspace satisfaction in Workspace 2.
Standardized beta coefficients, as well as the original correlation coefficients between each predictor and the criterion variable, are presented in Table 3.
Table 3.
Third iteration model parameters.
3.1.4. Iteration 4: Medigroup
Iteration 4 included data from respondents in Workspace 3—MEDIGROUP (a total of 38 cases) and used the modified WCS, as in Iteration 1, which included all respondents. A multiple regression model was created with 11 predictor variables and 1 criterion variable, consistent with the structure of Iteration 1.
This set of 11 predictors explained 93.7% of the variance in the criterion variable (R2adj = 0.937). The variables that emerged as significant predictors were a sense of belonging (β = 0.382), flexibility (β = 0.248), spaces for creative work (β = 0.234), and dignity (β = 0.181).
All of the significant predictor variables were positively associated with the criterion score, suggesting that respondents who expressed stronger agreement with the items in these subscales tended to report higher satisfaction with their workspace.
Standardized beta coefficients, as well as the original correlation coefficients between each predictor and the criterion variable, are presented in Table 4.
Table 4.
Fourth iteration model parameters.
3.2. General Insights: Attitudes Toward Workspace and Work Performance
In addition to the WCS and WSS, respondents answered seven general questions. The responses were analyzed across all three workspaces. The first four questions were formulated as rating-scale items, where respondents were asked to indicate their level of agreement on a scale from 1 to 10—with 1 indicating complete disagreement and 10 indicating complete agreement. The remaining three questions were multiple-choice items.
Responses to the first four items are presented in Table 5.
Table 5.
Distribution of respondents’ rating on four items of general questions.
The first item, “A high-quality workspace significantly affects my job satisfaction and work efficiency”, was strongly endorsed: over 30% of respondents selected the highest rating (10), while 86.3% responded on the positive end of the scale (6 or higher).
The second item also showed a strong positive trend, with 76.6% of respondents choosing a score of 6 or above. Notably, the proportion of extremely positive responses was slightly lower, while moderate positive ratings increased.
A shift occurred with the third item, “The appearance of the workspace influences my decision to work in a given company”, where only 47.6% of respondents positioned themselves on the positive side of the scale. The remainder leaned toward the negative, and there was a near-equal distribution between minimum and maximum agreement—suggesting ambivalence or divided opinion.
The fourth item, “Connection to nature, more greenery, and natural materials would help improve my work performance”, received the strongest endorsement: 77% of respondents selected scores on the positive end of the scale, with 33.9% giving the maximum score (10), indicating a high valuation of biophilic design elements.
Responses to the fifth general question (multiple choice) are presented in Table 6, while results for the sixth and seventh general questions—also multiple choice—were analyzed separately for each workspace and are summarized in Table 7.
Table 6.
Responses to the fifth general question.
Table 7.
Responses to the sixth and seventh general questions.
When comparing average scores on the shortened WSS, Workspace 1 showed the highest overall satisfaction, while Workspace 3 had the lowest. To statistically examine these differences, a univariate analysis of variance (ANOVA) was conducted, with workspace as the independent variable (three levels: Workspaces 1, 2, and 3), and the WSS score as the dependent variable. The results of the ANOVA revealed a significant difference among the three workspaces, F(2, 121) = 7.492, p < 0.001, accounting for approximately 11% of the variance in workspace satisfaction.
Additional questions (K1–K4), posed only to respondents in Workspaces 1 and 2, are synthesized in Table 8.
Table 8.
Responses to the additional questions.
4. Discussion
4.1. Comparative Insights: Original Correlations Between Spatial Characteristics of the Workspace
The diagram (Figure 2) presents a comparative insight into the original correlations (i.e., the correlations between each independent variable and the dependent variable without controlling for the influence of other predictors—low correlations: r < 0.3, moderate: 0.31 < r < 0.7, and high: r > 0.71—demonstrate a remarkably strong relationship across nearly all predictor variables—spatial elements) between spatial characteristics of the workspace—understood as experiential features or properties—and the perceived quality of work life across the three distinct workplace environments (W1, W2, and W3) and a synthetic sample (S).
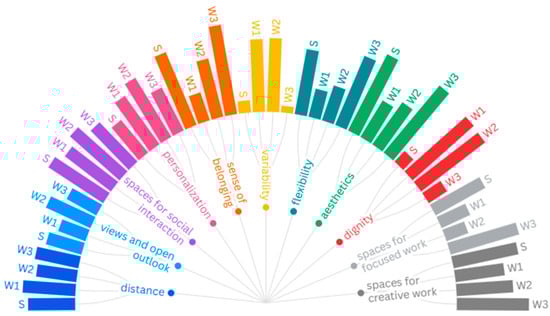
Figure 2.
Comparative insights into original correlation of spatial characteristics of the workspace (features or properties) for Workspace 1 (W1), Workspace 2 (W2), Workspace 3 (W3), and the synthesis sample (S).
Several key observations emerge from the cross-insight. Attributes such as distance, views and open outlook, flexibility, and aesthetics demonstrate consistent relevance across all four datasets (W1, W2, W3, and S), highlighting their foundational role in shaping employee satisfaction. These variables are not only frequently represented but also exhibit robust correlation strength, indicating their stability as predictors across differing organizational typologies of workspace and spatial settings. Among these, aesthetic preference shows the strongest influence (β = 0.474).
Each workspace exhibits distinct emphases: (1) Workspace 1 is more strongly associated with distance, views, and aesthetics, suggesting a spatial layout conducive to individual focus and perceptual comfort, (2) Workspace 2 (W2) shows the most diverse profile, with relevance extending to spaces for creative work, personalization, dignity, and the sociological dimension—reflecting the complex demands of hybrid, team-based environments that combine autonomy with social dynamics—and (3) Workspace 3 (W3) places emphasis on a sense of belonging, spaces for focused work, and flexibility, indicating the importance of concentration and psychological safety in service-oriented settings.
Additionally, it is worth noting that W1 and W3 share a matching structural layout as both are situated within the same office complex and follow a comparable architectural configuration. This spatial congruence may partially explain the similarity in the prominence of certain predictors such as distance, flexibility, and focused work zones observed across their datasets. In contrast, W2, which features a distinct enclosed-office typology, demonstrates a more diversified set of significant predictors, including creative zones and dignity, likely reflecting its differentiated spatial logic and hybrid organizational practices. These structural differences underscore the nuanced ways in which workspace typology interacts with organizational routines and user needs, reinforcing the importance of context-specific interpretations when evaluating spatial determinants of satisfaction.
The inclusion of the sociological dimension reveals moderate correlations in W2 and in the synthetic sample, indicating its relevance in organizations with stronger relational cultures. Although not among the most dominant predictors, it adds important nuance by capturing the symbolic and interpersonal dynamics of space. Conversely, attributes such as variability, spaces for social interaction, personalization, and dignity show lower correlation frequencies across the datasets. While these may enhance satisfaction in particular cultural or operational contexts, they do not emerge as universal determinants of QWL. Their weaker representation suggests that they may function as contextual amplifiers rather than foundational drivers of satisfaction.
Although some variables, such as personalization, variability, dignity, and spaces for social interaction, appeared with lower correlation frequencies across the datasets, this does not negate their theoretical relevance. Their weaker statistical representation may stem from contextual and organizational constraints that limit their expression or perception. For example, personalization may be constrained in flexible or standardized desk-sharing environments, reducing its salience for respondents. Similarly, the sociological dimension—which showed moderate correlations in W2 and in the synthetic sample but was excluded from the analysis in W3 due to company-imposed limitations—was not consistently significant in predictive models. Importantly, while the sociological dimension was removed, the subscale related to spaces for social interaction was retained and considered particularly relevant, as it captures spatially anchored opportunities for informal encounters and collective use, thereby maintaining a link to the social affordances of space.
The synthesis sample consolidates the cross-contextual relevance of aesthetics, flexibility, distance, and a sense of belonging, reaffirming their dominant role in shaping employee satisfaction. It also reflects the moderate recognition of the sociological dimension, further validating the idea that spatial quality is both functional and relational. This confirms that while organizational cultures and spatial policies vary, certain spatial features consistently underpin user satisfaction and perceived performance across settings.
4.2. Synthesis of Key Insights: General Reflections on Workspace Satisfaction and Design Implications
The responses to the general value-based questions confirm that over 50% of employees across all three workspaces rated their agreement with the following statement a score of 8 to 10: “A high-quality workspace significantly impacts my job satisfaction and work efficiency”. However, workspace quality was not considered a decisive factor in choosing to work for a specific company.
An exceptionally high percentage (33.9% rating it 10) agreed that “Connection to nature within the workspace, more greenery, and natural materials would help me achieve better work outcomes”. This result provides a clear design directive for future spatial planning.
Questions 6 and 7, related to office type and the percentage of time required for team vs. focused work, did not yield directly analyzable insights in relation to workspace satisfaction. However, they proved useful as a pilot tool for future surveys. Interestingly, a large portion of employees in all three workspaces indicated the need for 20–50% of the workday to be dedicated to focused work (44.9%, 40.5%, and 34.2%, respectively). Meanwhile, teamwork needs exceeding 50% of work time were reported by 42.9% of respondents at Fercam and 27–29% in the other two spaces. This aligns with the previously identified connection between higher satisfaction and a greater need for teamwork.
Focused work may be supported not only through isolated physical spaces but also via communication rules within defined zones. However, for social interaction, a designated and supportive environment is essential. While this study does not explore Questions 6 and 7 in detail per workspace, the results suggest that sector-based analysis could support the further reconfiguration or redesign of working environments.
Workspace influence on performance and satisfaction is clearly substantial, even if not a primary criterion in job selection. The findings suggest that it is crucial to foster a sense of belonging (feeling at home, safe, and part of the organization), flexibility (in time, location, and communication), and aesthetics (orderly, harmonious, and pleasant spaces with coordinated colors, materials, and furniture). Meanwhile, variability (i.e., the ability to choose different work zones depending on task type) showed the least importance across the sample.
The strong demand for team collaboration indicates that more team-oriented spaces are needed or that seating arrangements (e.g., clusters, team-based layouts) should be aligned with actual team dynamics. The activity-based working model—where workspace changes depending on task—has not yet been adopted in the corporate systems surveyed. It is recommended that such models be introduced first through corporate procedures, and only then reflected spatially.
The survey results show that dignity was neither perceived as threatened nor as a significant factor influencing satisfaction. This may reflect the relatively egalitarian and non-intrusive nature of contemporary workspaces, which tend to ensure equitable access and reduce surveillance.
Although anecdotal conversations with employees suggested that personalization would be important, the survey did not confirm this. In none of the three workspaces did personalization emerge as a significant factor influencing satisfaction, even though it appeared somewhat relevant in Workspace 2 based on the raw correlation.
Only 5.6% of respondents gave a score below 5 to the statement that “A high-quality workspace significantly impacts my satisfaction and work efficiency,” supporting the theoretical premise that workspace design contributes positively to user satisfaction and perceived performance.
4.3. Limitations and Future Directions
This study offers a multifaceted contribution to the growing literature on user satisfaction in workspaces, both conceptually and methodologically. Conceptually, it advances existing research landscape by operationalizing spatial constructs through a multidimensional QWL framework. While previous studies (presented in the introductory section) have typically focused on isolated dimensions—such as physical–spatial arrangements (spatial practice) [7,10,11], managerial planning and control (representations of space) [9], or user perceptions and emotional responses (representational spaces) [5,8]—this research integrates all three into a unified model grounded in Lefebvre’s triadic conception of space. The application of the WCS across three diverse organizational settings provides new insights into how specific spatial features—such as distance, flexibility, aesthetics, and a sense of belonging—consistently correlate with perceived satisfaction.
Importantly, this study also identifies spatial variables—such as personalization, dignity, and variability—that, despite strong theoretical relevance, did not emerge as statistically significant predictors in all contexts. These findings nuance prevailing assumptions in the literature and suggest that such attributes function more as contextual amplifiers rather than universal determinants of satisfaction, particularly in flexible or standardized work environments.
Methodologically, this study contributes by introducing a validated and theoretically grounded scale (WCS), which was tested for internal consistency (Cronbach’s α = 0.857) and paired with the WSS (Cronbach’s α = 0.871). This study also openly acknowledges and discusses key methodological limitations, including differences in questionnaire versions and the non-inclusion of certain subscales in Workspace 3 due to organizational constraints. Rather than compromising the study’s integrity, this transparent treatment of limitations provides a precise methodological framework for future researchers and supports reproducibility and critical engagement with the model in other empirical contexts.
While this study was conducted within a uniform cultural and legislative context (Serbia), which facilitated internal coherence across cases, this also imposes certain limitations on its external validity. Organizational and spatial experiences are shaped by broader socio-cultural norms, which may vary across regions and sectors. Although the spatial variables used are derived from interdisciplinary frameworks and not specific to the Serbian context, caution should be exercised when generalizing the findings. Future studies are encouraged to apply the proposed model in different cultural and organizational environments to assess its broader applicability and identify potential context-specific adaptations.
5. Conclusions
The objective of this survey was to examine the relationship between specific spatial elements and satisfaction with work life and perceived effectiveness. The results underscore a strong connection not only to spatial attributes, but also to organizational identity. Workspaces that embody the values of the organization (through aligned messages, codes, and materials) and that are designed through an integrated approach—one that synthesizes cultural, sociological, and psychological dimensions into an aesthetically and materially coherent environment—have a higher potential to foster satisfaction, effectiveness, and productivity. Such spaces succeed in realizing their full potential by forming a two-way relationship with their users.
A key research direction for future studies could be examining the balance between flexibility and belonging. For instance, one could investigate how options for spatial and temporal flexibility relate to psychologically measured feelings of organizational belonging.
Finally, a significant challenge of survey-based research lies in the interdisciplinary complexity of the topic. Influences from various management models, organizational cultures and structures, team dynamics, and employees’ current psychological and work status all interact with the perception of satisfaction and effectiveness at the moment of response, potentially introducing variability that cannot be easily controlled within a single survey.
Looking ahead, this research affirms the need to place users at the center of workspace design—moving beyond efficiency metrics to embrace spatial strategies that reflect organizational values and support diverse modes of work. As hybrid and flexible work models continue to reshape organizational cultures and employee expectations, spatial design must evolve accordingly—bridging physical form and lived experience. Recognizing space as a socially constructed and symbolically mediated entity is essential for designing work environments aligned with organizational structures and contemporary work practices.
Author Contributions
Conceptualization, V.K.; methodology, V.K.; validation, A.M.; formal analysis, V.K.; investigation, V.K. and A.M.; resources, V.K.; writing—original draft preparation, A.M.; writing—review and editing, V.K.; visualization, A.M. All authors have read and agreed to the published version of the manuscript.
Funding
This research received no external funding.
Institutional Review Board Statement
This study did not require ethical approval. Questionnaires were conducted with clear clarification on the study rationale, full respect of the participants’ anonymity, and in accordance with the Code of Conduct for Scientific Research (21 February 2018, National Council for Scientific and Technological Development, Serbia) and the Code of Professional Ethics at the University of Belgrade (10 July 2016, Gazette of the University of Belgrade, No. 193).
Informed Consent Statement
Informed consent was obtained from all subjects involved in the study.
Data Availability Statement
The original contributions presented in the study are included in the article, and further inquiries can be directed to the corresponding author.
Acknowledgments
The authors would like to express their sincere gratitude to the management teams of the three participating companies (Fercam, UB Connect, and Medigroup) for their valuable support and collaboration throughout the research process. Our special thanks also go to all employees who generously contributed their time and insights by participating in the questionnaire. Their engagement was essential to the success of this study.
Conflicts of Interest
Author Vesna Krizmanić was employed by the Archinova Architecture Company. The remaining authors declare that the research was conducted in the absence of any commercial or financial relationships that could be construed as a potential conflict of interest.
Abbreviations
The following abbreviations are used in this manuscript:
| QWL | Quality of Work Life |
| WCS | Workspace Characteristics Scale |
| WSS | Workspace Satisfaction Scale |
Appendix A
The following questionnaire was administered to participants in this study. It comprises four sections: general respondent information (Appendix A.1), the Workspace Satisfaction Scale (WSS) (Appendix A.2), and the Workspace Characteristics Scale (WCS) (Appendix A.3), and general attitudes toward workspace values and needs (Appendix A.4). Participants were asked to respond using a Likert scale (1–10) unless otherwise noted. Note: The modified version of the scale (used in the third workspace) does not include the following items: K1–K4 (from Section 2), 3.1–3.4, 6.3, 7.3, 8.1, 8.2, 10.1, and 10.2 (from Section 3), and Q.1, Q.3, Q.4, and Q.9 (from Section 4).
Appendix A.1. General Respondent Information
To understand respondents’ background and organizational context.
- Company name and location
- Position in company hierarchy (Top management; Middle management; Employee; Independent expert; Entry-level)
- Department or division within the company
- Gender
- Professional field
- Level of education
- Total years of work experience
- Years of experience in the current company
- Psychological profile: I consider myself an introvert, extrovert, or neither
- Current type of workspace:
- Individual office for one person
- Shared office for 2–8 employees
- Open-plan office with assigned desk
- Open-plan office with unassigned desks (hot-desking)
Appendix A.2. Workspace Satisfaction Scale (WSS)
To evaluate how satisfied participants are with their workspace and its influence on work quality. Please rate the following statements on a scale from 1 (strongly disagree) to 10 (strongly agree):
- R.1. The workspace fully supports the requirements of my job
- R.2. I feel comfortable and at ease in my workspace
- R.3. I perform well in my current workspace
- R.4. I am satisfied with the aesthetic elements of the workspace
Additional questions on general job satisfaction (beyond spatial context):
- K.1. Overall, how satisfied are you with your job (excluding spatial aspects)?
- K.2. The company’s values align with my own
- K.3. I am satisfied with social relationships within the company
- K.4. I feel respected and valued in the organization
Appendix A.3. Workspace Characteristics Scale (WCS)
To examine the influence of physical and perceptual features of the workspace. Please rate the following statements on a scale from 1 (strongly disagree) to 10 (strongly agree):
- 1. Distance from colleagues(1—Too close/10—At a comfortable distance)1.1. The physical distance between me and my coworkers at my workstation is comfortable.1.2. Sometimes I feel that the proximity of colleagues bothers me during work.1.3. Conversations or noise from coworkers disrupt my work performance.
- 2. View—Visual openness(1—No view or visually closed/10—Visually open view)2.1. I have an open view toward other parts of the workspace or the outside.2.2. My direct line of sight is blocked by a wall or partition.
- 3. Sociological dimension of the space(1—I do not enjoy in-person interaction/10—I enjoy in-person interaction)3.1. I feel good when I have regular face-to-face contact with colleagues.3.2. Virtual meetings and online collaboration can fully replace physical presence.3.3. I would still come to the office primarily for social interaction, even if my tasks could be done remotely.3.4. My colleagues and I create the atmosphere of the workplace and bring life to the space.
- 4. Informal social spaces(1—Not needed/10—Very much needed)4.1. The workspace should offer more spaces for informal interaction with coworkers and clients.4.2. I enjoy spending time with colleagues even outside of work.4.3. I am comfortable holding meetings in informal areas, not just in formal meeting rooms.
- 5. Personal space and personalization(1—I do not need to personalize/10—Personalization is essential)5.1. I need personal space in the workplace to feel more comfortable.5.2. I enjoy personalizing my workspace with decorations or objects.5.3. When I can design my environment the way I like, it positively affects my performance. (scale 1–5)
- 6. Sense of belonging(1—I do not feel I belong/10—I strongly feel I belong)6.1. My workspace allows me to feel like part of the organization.6.2. I feel “at home” in my current workspace.6.3. I feel safe and secure in my workplace.
- 7. Spatial variability (within the office)(1—I dislike switching spaces/10—I enjoy variability)7.1. I appreciate being able to choose among different types of work areas depending on the task.7.2. I feel more productive when I have a fixed desk.7.3. When I change my workspace, it takes time to adapt and resume work.
- 8. Flexibility of work (outside the office)(1—No flexibility/10—Full flexibility)8.1. I have the option to work from various locations beyond the office (e.g., home or third spaces).8.2. I have flexible working hours.8.3. The workspace allows me to quickly reach colleagues needed for communication.
- 9. Aesthetic preference(1—Poor aesthetics/10—Excellent aesthetics)9.1. My workspace gives me a sense of clarity, order, and coherence.9.2. I find the color palette, furniture, and materials aesthetically pleasing.9.3. My workspace feels cheerful and pleasant.9.4. My workspace is tidy, without clutter or excess papers and materials.
- 10. Equality and control (dignity)(1—The space undermines dignity/10—The space supports dignity)10.1. I feel constantly monitored in my workspace.10.2. I feel my workspace is worse than the spaces of my colleagues.10.3. I have no control over who enters my workspace.10.4. My workspace is arranged so that colleagues can see what I am doing on my computer.
- 11. Spaces for quiet and focused work(1—I cannot concentrate/10—I can fully concentrate)11.1. I can focus and work quietly in my current workspace.11.2. I have access to another space where I can isolate myself to work quietly if needed.
- 12. Spaces for creative work and inspiration(1—The space is not stimulating/10—Very stimulating)12.1. I get my best ideas in this workspace.12.2. I need spaces that support creativity and inspiration at work.12.3. My workspace is a source of inspiration.
Appendix A.4. General Attitudinal Questions
Evaluation of value-based positions and individual needs regarding workspace design.
Please rate each of the following statements on a scale from 1 to 10 (1—strongly disagree, 10—strongly agree):
- Q.1. The workspace and office building reflect the company’s image and should embody its values.
- Q.2. A high-quality workspace significantly impacts my satisfaction and work efficiency.
- Q.3. Being surrounded by positive, hardworking colleagues in my work environment helps me achieve better results.
- Q.4. Employees who are higher in the company hierarchy should have better workspaces and working conditions.
- Q.5. A chaotic workspace leads to chaotic work results.
- Q.6. The appearance of the workspace influences my decision to work for a particular company.
- Q.8. Connection to nature in the workspace—more greenery and natural materials—would help me achieve better work outcomes.
- Q.9. Workplace flexibility is important to me—I want to choose when and where I work.
- Q.10. If I could choose, I believe I would achieve the best work results and personal satisfaction in:A. A private officeB. An office shared with up to 6 employeesC. An open-plan office with my own designated deskD. An open-plan office with shared desks and full flexibility (no assigned desk)E. The type of office does not affect my work performance or satisfaction
- Q.11. Quiet, undisturbed time for focused work is essential to me in the workplace. Please indicate what percentage of your total work time you need for focused work:0–20% of total work time20–50% of total work time50–80% of total work time80–100% of total work time
- Q.12. For teamwork with colleagues in a shared physical workspace, I personally need:0–20% of total work time20–50% of total work time50–80% of total work time80–100% of total work time
References
- Castells, M. The Rise of the Network Society, 2nd ed.; John Wiley & Sons: Chichester, UK, 2011. [Google Scholar]
- Lefebvre, H. The Production of Space; Blackwell: Oxford, UK, 1991. [Google Scholar]
- Parker, S.K.; Turner, N. Work Design and Individual Work Performance: Research Findings and an Agenda for Future Inquiry. In Psychological Management of Individual Performance; John Wiley & Sons: Chichester, UK, 2002; pp. 69–93. [Google Scholar]
- Hackman, J.R.; Oldham, G.R. Work Redesign; Addison-Wesley: Reading, MA, USA, 1980. [Google Scholar]
- Warr, P.; Nielsen, K. Wellbeing and Work Performance. In Handbook of Well-Being; DEF Publishers: Salt Lake City, UT, USA, 2018. [Google Scholar]
- Windlinger, L. Complex Effects of Work and Office Design. In Proceedings of the EFMC, Zürich, Switzerland, 26–27 June 2007; pp. 91–98. [Google Scholar]
- Veitch, J.A.; Charles, K.E.; Farley, K.M.; Newsham, G.R. A Model of Satisfaction with Open-Plan Office Conditions: COPE Field Findings. J. Environ. Psychol. 2007, 27, 177–189. [Google Scholar] [CrossRef]
- Xie, J.; Sawyer, A.O.; Ge, S.; Li, T. Subjective Impression of an Office with Biophilic Design and Blue Lighting: A Pilot Study. Buildings 2023, 13, 42. [Google Scholar] [CrossRef]
- Binyaseen, A.M. Office Design Features and Future Organizational Change toward Supporting Sustainability. Buildings 2024, 14, 260. [Google Scholar] [CrossRef]
- Schaumann, D. Human Behavior Adaptability in Responsive Buildings: An Exploratory Study in Workplace Settings. Buildings 2024, 14, 1830. [Google Scholar] [CrossRef]
- Fisher, A.; Ucci, M.; Smith, L.; Sawyer, A.; Spinney, R.; Konstantatou, M.; Marmot, A. Associations between the Objectively Measured Office Environment and Workplace Step Count and Sitting Time: Cross-Sectional Analyses from the Active Buildings Study. Int. J. Environ. Res. Public Health 2018, 15, 1135. [Google Scholar] [CrossRef] [PubMed]
- Zhuang, D.; Zhao, X.; Gan, V.J.; Yang, Y.; Shi, X. Comparative Investigation of Office Layout Influences on Occupant Satisfaction from Priori and Posteriori Perspectives. Buildings 2022, 12, 1327. [Google Scholar] [CrossRef]
- Sundstrom, E. Work Places. The Psychology of the Physical Environment in Offices and Factories; Cambridge University Press: Cambridge, UK, 1986. [Google Scholar]
- Kupritz, V.W. Privacy in the Workplace: The Impact of Building Design. J. Environ. Psychol. 1998, 18, 341–356. [Google Scholar] [CrossRef]
- Knight, C.; Haslam, A.H. Your Place or Mine? Organizational Identification and Comfort as Mediators of Relationships between the Managerial Control of Workspace and Employees’ Satisfaction and Well-being. Br. J. Manag. 2010, 21, 717–735. [Google Scholar] [CrossRef]
- Nikolaeva, R.; Russo, S.D. Office Design and Dignity at Work in the Knowledge Economy. In Dignity and the Organization; Palgrave Macmillan: London, UK, 2016; pp. 197–220. [Google Scholar]
- Hodson, R. Dignity at Work; Cambridge University Press: Cambridge, UK, 2001. [Google Scholar]
- Varghese, S.; Jayan, C. Quality of Work Life: A Dynamic Multidimensional Construct at Work Place–Part II. Guru J. Behav. Soc. Sci. 2013, 1, 91–104. [Google Scholar]
- Hackman, J.R.; Oldham, G.R. Motivation through the Design of Work: Test of a Theory. Organ. Behav. Hum. Perform. 1976, 16, 250–279. [Google Scholar] [CrossRef]
- Abdullah, N.A.C.; Zakaria, N.; Zahoor, N. Developments in Quality of Work-Life Research and Directions for Future Research. SAGE Open 2021, 11. [Google Scholar] [CrossRef]
- Efraty, D.; Sirgy, M.J. The Effects of Quality of Working Life (QWL) on Employee Behavioral Responses. Soc. Indic. Res. 1990, 22, 31–47. [Google Scholar] [CrossRef]
- Baba, V.V.; Jamal, M. Routinization of Job Context and Job Content as Related to Employees’ Quality of Working Life: A Study of Canadian Nurses. J. Organ. Behav. 1991, 12, 379–386. [Google Scholar] [CrossRef]
- Hart, P.M. Predicting Employee Life Satisfaction: A Coherent Model of Personality, Work, and Nonwork Experiences, and Domain Satisfactions. J. Appl. Psychol. 1999, 84, 564. [Google Scholar] [CrossRef]
- Igbaria, M.; Parasuraman, S.; Badawy, M.K. Work Experiences, Job Involvement, and Quality of Work Life among Information Systems Personnel. Manag. Inf. Syst. Q. 1994, 18, 175–201. [Google Scholar] [CrossRef]
- World Health Organization. WHOQOL: Measuring Quality of Life; WHO: Geneva, Switzerland, 1994. [Google Scholar]
- Almarshad, S.O. A Measurement Scale for Evaluating Quality of Work Life: Conceptualization and Empirical Validation. Trends Appl. Sci. Res. 2015, 10, 143. [Google Scholar] [CrossRef][Green Version]
- Othman, A.; Mok, C.L. Relationship between Quality of Work Life (QWL) and Job Satisfaction: A Case Study of Enterprise “XYZ” in Malacca. In Proceedings of the International Conference on Human Capital Development (ICONHCD 2009), Kuantan, Pahang, Malaysia, 25–27 May 2009. [Google Scholar]
- Haristianti, V.; Raja, T.M. Implementation of a Biophilic Design Approach in Office Space Design as an Attempt to Increase Employee Well-Being. KnE Soc. Sci. 2025, 10, 32–39. [Google Scholar] [CrossRef]
- Shirvanisaadatabadi, E.; Gharaei, A. The Relationship between Architects’ Quality of Work Life and Their Productivity: A Case Study. J. Sustain. Dev. 2025, 8, 60–70. [Google Scholar] [CrossRef]
- Vischer, J.C.; Wifi, M. The Effect of Workplace Design on Quality of Life at Work. In Handbook of Environmental Psychology and Quality of Life Research; Springer International Publishing: Cham, Switzerland, 2016; pp. 387–400. [Google Scholar]
- Dávalos Quevedo, M.V.; Luna-Navarro, A.; Pottgiesser, U.; Blum, U. Methods and Approaches for Evaluating Occupant Satisfaction with Office Space Design: A Systematic Review. Ergonomics 2025, 1–21. [Google Scholar] [CrossRef]
- Baharetha, S.; Hassanain, M.A.; Alshibani, A.; Ouis, D.; Gomaa, M.M.; Ezz, M.Z. A Post-Occupancy Evaluation Framework for Enhancing Resident Satisfaction and Building Performance in Multi-Story Residential Developments in Saudi Arabia. Architecture 2025, 5, 8. [Google Scholar] [CrossRef]
- Borsos, Á.; Zoltán, E.S.; Pozsgai, É.; Cakó, B.; Medvegy, G.; Girán, J. The Comfort Map—A Possible Tool for Increasing Personal Comfort in Office Workplaces. Buildings 2021, 11, 233. [Google Scholar] [CrossRef]
- Song, G.; Zhu, S. Interior Design Assessment System Based on Computer Vision and Multimedia. Comput.-Aided Des. Appl. 2024, 21, 264–278. [Google Scholar] [CrossRef]
- Ezz, M.S.; Mahdy, M.A.F.; Baharetha, S.; Hassanain, M.A.; Gomaa, M.M. Post Occupancy Evaluation of Architectural Design Studio Facilities. Front. Built Environ. 2025, 21, 1549313. [Google Scholar] [CrossRef]
- Bodin Danielsson, C.; Theorell, T. Office Design’s Impact on Psychosocial Work Environment and Emotional Health. Int. J. Environ. Res. Public Health 2024, 21, 438. [Google Scholar] [CrossRef] [PubMed]
- Jacobi, S.L.; Bjørner, T. Architects’ Perception of Quality of Life—Impact, Practice, and Barriers. Architecture 2024, 4, 267–280. [Google Scholar] [CrossRef]
- Batuchina, A.; Medžiūnienė, I.; Lecaj, R. Multidimensional Scale of Meaningful Work: Construction and Validation. Front. Psychol. 2025, 16, 1578825. [Google Scholar] [CrossRef]
- Soundarya Priya, M.G.; Anandh, K.S. Exploring the Determinants of Quality of Work Life in the Construction Industry: A Quantitative Approach. Buildings 2024, 14, 1607. [Google Scholar] [CrossRef]
- Tsakonas, K.G. Measuring the Value of Workspace Architectural Design: Construction of the Workspace Communication Suitability Index (WOCSIT). Ph.D. Thesis, Massachusetts Institute of Technology, Cambridge, MA, USA, 2008. [Google Scholar]
- Wijesooriya, N.; Brambilla, A.; Markauskaite, L. Biophilic Quality Matrix: A Tool to Evaluate the Biophilic Quality of a Building during Early Design Stage. Clean. Prod. Lett. 2025, 8, 100094. [Google Scholar] [CrossRef]
- Vande Moere, A.; Arko, S.; Drasilova, A.S.; Ondráček, T.; Pigliautile, I.; Pioppi, B.; Pisello, A.L.; Prochazka, A.J.; Roncancio, P.A.; Schaumann, D.; et al. The Adaptive Workplace: Orchestrating Architectural Services around the Wellbeing of Individual Occupants. arXiv 2024, arXiv:2403.16595. [Google Scholar]
- dos Santos Ribeiro, E.; da Silva, E.K.V.; de Albuquerque Jatoba, L.; Andrade, W.N.; Miranda, L.N. Quality of Life at Work of Nurses in Public Hospital Institutions. Enfermería Glob. 2021, 20, 489–501. [Google Scholar]
- Walke, F.; Aden, A.; Winkler, T.J. Work System Quality Assessment: A TIHPS Grounded Measurement Model. In Proceedings of the 57th Hawaii International Conference on System Sciences, Honolulu, HI, USA, 3–6 January 2024. [Google Scholar]
- Voigt, J.; Hohn, J.; Mut, E.; Schreiber, C.; Geisler, S.M.; Pinta, P.S.; Hamm, A.; Stutzer, F.; Kosakyan, H.; Burkhardt, J.-M.; et al. Conceptional Framework for the Objective Work-Related Quality of Life Measurement through Multimodal Data Integration from Wearables and Digital Interaction. In Proceedings of the 19th Conference on Computer Science and Intelligence Systems (FedCSIS), Belgrade, Serbia, 8–11 September 2024; pp. 61–68. [Google Scholar]
- Berber, N.; Slavić, A.; Gašić, D. Employees’ Work–Life Balance in the Contemporary Business Environment: Evidence from Serbia. In Proceedings of the XIX International May Conference on Strategic Management—IMCSM24 Proceedings, Bor, Serbia, 31 May 2024; pp. 24–37. [Google Scholar]
- Štěpánek, M. Regional Differencies in Quality of Working Life in the Czech Republic. Časopis výzkumu a aplikací v profesionální bezpečnosti 2022, 15. Available online: https://www.josra.cz/vydani/clanek/regional-differencies-in-quality-of-working-life-in-the-czech-republic (accessed on 1 May 2025).


Disclaimer/Publisher’s Note: The statements, opinions and data contained in all publications are solely those of the individual author(s) and contributor(s) and not of MDPI and/or the editor(s). MDPI and/or the editor(s) disclaim responsibility for any injury to people or property resulting from any ideas, methods, instructions or products referred to in the content. |
© 2025 by the authors. Licensee MDPI, Basel, Switzerland. This article is an open access article distributed under the terms and conditions of the Creative Commons Attribution (CC BY) license (https://creativecommons.org/licenses/by/4.0/).