Abstract
The analysis of the vulnerability of vernacular buildings to climatic hazards is nowadays a subject of significant importance due to the consequences of climate change. This study assesses the vulnerability of vernacular buildings to three climatic hazards (heavy rains, strong winds and high heat) in the Kara region to identify the vulnerable parts of these constructions that require reinforcement. It is based on PTVA (Papathoma Tsunami Vulnerability Assessment), a multi-hazard analysis methodology, which uses vulnerability indicators. It focuses on the Kabiyè and Nawdeba peoples, who are the major ethnic groups in the region. Focus groups with the population, interviews with professionals and a series of surveys of 125 households in the visited territories enabled us to identify, firstly, the types of vernacular constructions in the region, the climatic hazards that occur there and the indicators that affect the vulnerability of the constructions. Secondly, we calculated the vulnerability index for each type of construction to the three climatic hazards. The vulnerability index of Kabiyè vernacular architecture (KVA) to heavy rain, high heat and strong wind is 0.379, 0.403 and 0.356, respectively. The Nawdéba vernacular architecture (NVA) vulnerability score is 0.359 for heavy rain, 0.375 for high heat, and 0.316 for strong wind. The index of vulnerability to heavy rain, high heat and strong wind for contemporary architecture (CA), as we term the current state of evolution of these two forms of architecture, is 0.499, 0.522 and 0.456, respectively. This study reveals that contemporary architecture (CA) in the Kara region, regardless of the type of hazard considered, is the most vulnerable construction model in the region. It also highlights the indicators that accentuate the vulnerability of vernacular constructions. Regardless of the type of construction, special attention must be paid to features such as roof style (roof slope, shape and material) and building style (form and state of maintenance of the building) to increase the resilience of buildings to climatic hazards.
1. Introduction
In recent years, natural disasters, including heavy rains, strong winds and high heat, have become more and more recurrent and violent around the world [1,2]. “Climate collapse has begun”. This was the message of the United Nations Secretary-General, Antonio Guterres, in September 2023 [3]. Through its publications, the Intergovernmental Panel on Climate Change [4] continues to warn about the increasing frequency and severity of extreme weather events, which have become inevitable due to the impact of human activity on the climate. Anthropogenic factors, including rapid population growth, rapid urbanization and the effects of climate change, are fundamentally the causes of these natural disasters [4]. Referring to the EM-DAT Natural Disaster Database [2], in 2023, natural disasters resulted in the deaths of 86,473 people worldwide and affected 93.1 million people. Economic losses during the same period amounted to USD 202.7 billion. The climate situation in Africa is equally deplorable, with the continent bearing the brunt of the consequences of natural disasters. In September 2024, climate analysis showed that most countries in the West African subregion are facing heavy rainfall, causing rivers to overflow. During this period, rainfall amounts in the Sahel region are generally 120 to 600% higher than the average for the 1991–2020 reference period [5].
In Togo, the examination of meteorological data over a considerable period (1961–2018) has indisputably highlighted a climate evolution characterized by marked spatio-temporal variability throughout the country. Temperatures are on an upward trend, with an increase of between 0.8 °C and 1.2 °C depending on the latitude of the country [6]. More specifically, in the Kara region, the data obtained from The National Meteorological Agency of Togo (ANAMET), over the period of 1990–2023, reflect a clear increase in the average temperature from 27 °C in the decade 1990–1999 to 28 °C in the years 2000–2023. As it pertains to precipitation, there is a general downward trend across the country, with variations in the reduction ranging from 15 mm to 98 mm of rainfall. Despite this decrease, Togo has been prone, in recent years, to excessive rainfall concentrated in short periods, causing flooding throughout the country [7]. According to data provided by the National Civil Protection Agency (ANPC), in 2021, the Kara region, specifically, suffered heavy torrential rains, resulting in considerable material damage, injuries and loss of life. In total, there was 1 death and a total of 213 victims, including 2 injured people. This toll becomes higher when it comes to strong winds. They resulted in 3697 victims, including 10 injured people, in the region during the same year [8]. During the same period, numerous school buildings also suffered significant damage, including the disintegration of metal roofs. In 2023, no less than 1144 buildings were affected (buildings damaged, collapsed or cracked) by climate hazards. In addition to floods, storms or strong winds and rising temperatures, this change in the climate also generates significant climatic phenomena such as drought, seasonal disruption, poor rainfall distribution and coastal erosion. These climatic phenomena inflict damage on infrastructure and equipment in both rural and urban areas, leading to a growing interest in comprehending and analyzing the physical vulnerability of the built environment, particularly vernacular constructions. Referring to the International Committee of Vernacular Architecture (CIAV), vernacular architecture is architecture of popular inspiration that develops its own characteristics in a specific region, using local materials, construction techniques and traditional forms of that region [9]. This study therefore focuses on the physical vulnerability of vernacular architecture in the Kara region to three climatic hazards, namely, heavy rainfall, strong winds and high heat. In Togo, the majority of scientific work, in particular the work of P.AAWI [10], de S. Bilabena [11], de S. Coffi [12], N. Jans et al. [13], K. Edjame [14], and K. Gbafa [15], and government programs [6,7,8,16,17], focus more on the vulnerability of social groups, their territory (environment and culture) and their economic activities to the dangers induced by climatic hazards. These studies do not consider the physical vulnerability of buildings to climatic hazards. In the area of physical vulnerability, the most common methods used to measure it differ enormously and relate to unique climate risks [18]. However, some scientific authors, such as S. Greiving et al. [9], M. Kappes et al. [19] and M. Marzocchi et al. [20], stressed the importance of a multi-hazard approach in assessing physical vulnerability. This approach makes it possible to take into account all natural hazards in a given region [19]. Unlike the single-risk analysis, the multi-hazard approach provides a formal framework for comparing and classifying various types of hazards [20].
In this study, we adopt an indicator-based multi-hazard analysis methodology called PTVA (Papathoma Tsunami Vulnerability Assessment) [21] to analyze the physical vulnerability of vernacular architecture in the Kara region to three types of climatic hazards (heavy rain, high winds and high heat). Thus, this study is sequenced in four parts. In the first, an analysis of the study area will be carried out in order to determine relevant climatic hazards and their impact on vernacular constructions. The second part will be devoted to the selection of indicators (characteristics of the building) that impact the vulnerability of vernacular constructions to these climatic hazards. The calculation of the vulnerability of buildings through the physical vulnerability index (PVI) will be presented in the third part. Finally, the fourth part of this study will propose possible orientations for decision makers to improve the resilience of vernacular constructions in the Kara region to these hazards.
2. Literature Review
Nowadays, assessment of the vulnerability of the built environment to hazards is a topic that is becoming increasingly important due to the impacts of climate change. Most authors with training in natural or technical science define vulnerability as the extent or degree of loss a group of elements in a region experiences due to a hazardous event. It can be measured on a scale of 0 (no loss) to 1 (total loss) [22]. Other authors, such as J. Birkmann [23] or M.S. Kappes [18], argue that vulnerability should not be limited to the magnitude of losses, but rather should describe the degree to which human behavior or a social and physical environment is susceptible or resistant to an impact. From this viewpoint, the assessment of vulnerability concentrates on identifying indicators of vulnerability that influence and modify the vulnerability of a risk-exposed element. Three main methods are frequently used to study physical vulnerability: vulnerability curves, damage matrices and vulnerability indicators. Vulnerability curves are very common among engineers. They are specific to a construction category and establish a link between the intensity of a hazard and the expected damage or the cost of this damage in relation to the total value at risk. The disadvantage of this approach is that it focuses on a single characteristic of the building, particularly the type of construction, at the expense of other factors influencing the vulnerability of the elements exposed to risks, such as the number of floors, the presence of windows or the age of the structure [18]. As for damage matrices, they express in a matrix the combination of the levels of damage caused by each level of hazard. The disadvantage of this approach is that it often relies on a vague description of the building typology. It only considers a limited number of parameters influencing vulnerability like vulnerability curves [24]. Therefore, neither of these two approaches provides guidance on risk reduction. The vulnerability indicator approach is an alternative solution that considers all climate risks in a given region, and several parameters influencing the vulnerability of the element subject to the risks. In the socio-economic sector, this approach is widespread. Authors such as Cutter et al. [1] and Collins et al. [25] have adopted this approach to assess spatial vulnerability using biophysical and social indicators. With regard to the physical vulnerability of buildings to climatic hazards, the work of Granger et al. [26] represents an example of the application of vulnerability indicators. Granger et al. put into perspective the physical characteristics of buildings and their relative vulnerability to climatic hazards. Puissant et al. [27] have also adopted vulnerability indicators to study the potential for landslide degradation on exposed features in a given space. Another example of the application of vulnerability indicators is the Papathoma Tsunami Vulnerability Assessment (PTVA) method [28]. This method uses a set of indicators to assess the physical vulnerability of an element to climate risks. The PTVA method was initially designed to analyze the vulnerability of buildings located in coastal regions prone to tsunamis and then adapted to consider flooding in mountainous areas [29]. This approach was subsequently modified to assess the vulnerability of buildings to forest fires [21]. More recently, Papathoma-Köhle, M. et al. [30] have adopted this approach to assess the vulnerability of buildings to meteorological hazards such as strong winds, heavy rainfall and hail. As part of our study, the PTVA methodology was adopted to analyze the physical vulnerability of buildings in the Kara region to climatic hazards (heavy rain, strong winds and high heat).
3. Materials and Methods
To analyze the physical vulnerability of vernacular architecture in the Kara region, we opted, in light of the literature review, for the PTVA method. This method relies on four fundamental steps (Figure 1):
- Step 1: Identification of the climatic hazards of the study area and their impact on buildings:
This stage is devoted to the characteristics of the study area, the different typologies of vernacular constructions and the climatic hazards that occur there.
- Step 2: Identification of indicators that affect the vulnerability of buildings to climatic hazards and the collection of data for these indicators:
Based on extensive documentation and data collected from ANPC, this step identifies and justifies the indicators influencing the physical vulnerability of vernacular buildings to climate hazards.
- Step 3: Calculation of the vulnerability of buildings through the physical vulnerability index (PVI):
This step is based on the judgment of experts (builders and trainers from local chambers of trade) to score the indicators and the analytical hierarchy process (AHP) to carry out the weighting of the indicators. The AHP is a method that uses criteria to compare decisions in pairs to calculate the weight of different factors. The physical vulnerability index is calculated by aggregating these indicators.
- Step 4: Considering the overall vulnerability to climatic hazards for the resilience of buildings:
This last step provides some solution approaches to improve the resilience of vernacular constructions in the Kara region to these three climatic hazards.
Figure 1 depicts the work process and the following paragraphs explain each step of the method.
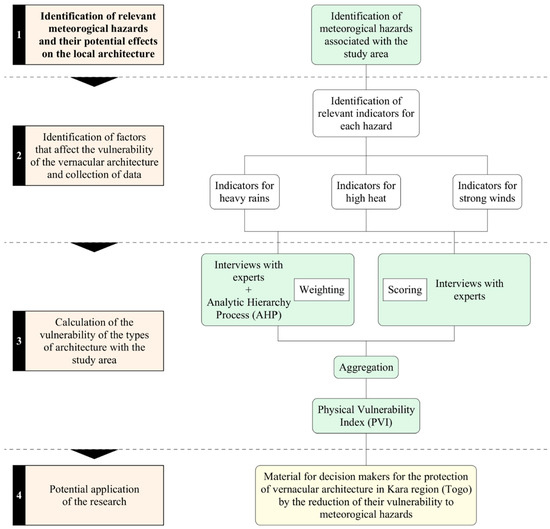
Figure 1.
Different steps of the PTVA method.
3.1. Step 1: Identification of the Climatic Hazards of the Study Area and Their Impact on the Buildings
3.1.1. Study Area
The Kara region, located in northern Togo, is one of the country’s five regions. According to the coordinates of the WGS84 global ellipsoid, the Kara region lies between 9°25′ and 10°10′ north latitude and between 0°15′ and 1°30′ east longitude (Figure 2). It covers a total area of 11,490 km2, which is equivalent to about 20.50% of the national territory [8]. The Kara region is bordered to the south by the Central region and to the north by the Savannah region. It also shares borders with Ghana to the west and Benin to the east. The Kara region is characterized by a humid tropical climate of the Sudano-Guinean type, with an alternation between a dry season extending from November to March and a rainy season for the rest of the year. The region has an average annual rainfall of between 1000 and 1500 mm (Figure 3), with insignificant local variations. Average monthly temperatures in the Kara region range from 25 °C to 31 °C (Figure 4) [8]. Figure 5, from Climate Consultant version 6.0, illustrates the psychrometric diagram that outlines the different design strategies recommended to ensure optimal comfort in the Kara region.
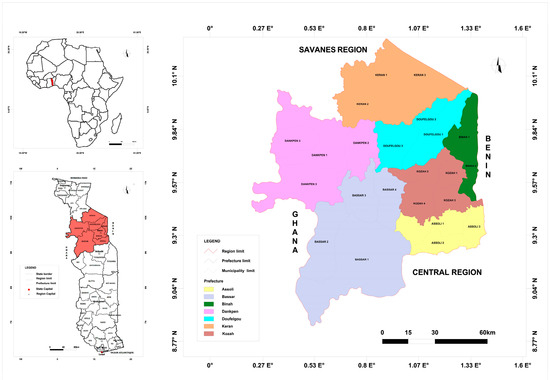
Figure 2.
Map of the Kara region.

Figure 3.
Precipitation trend in Kara region. Source: National Meteorological Agency of Togo (ANAMET).
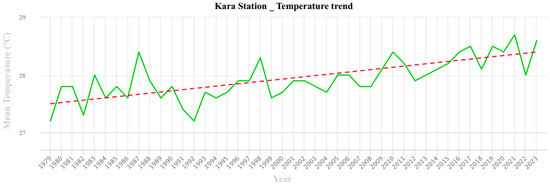
Figure 4.
Temperature trend in Kara region. Source: National Meteorological Agency of Togo (ANAMET).
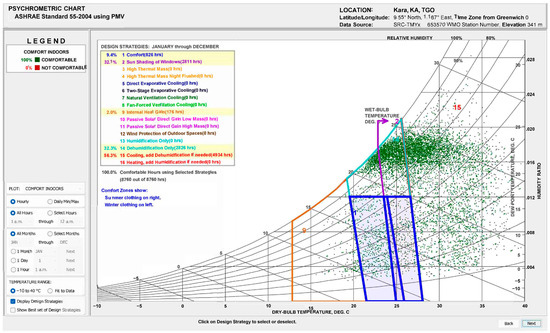
Figure 5.
Psychrometric graph of the Kara region plotted through Climate Consultant.
3.1.2. Vernacular Architecture in the Kara Region
The Kara region consists of seven prefectures: Kozah, Assoli, Bassar, Binah, Dankpen, Doufelgou and Kéran. This region, rich in its diverse cultural heritage, is home to several ethnic groups. There are the Kabiyè, Logba (a branch of the Kabyé group), Lamba, Tamberma, Sombas, Nawdéba, Kotokoli/Tém, Konkomba and Bassar. All these groups have set up an architecture of outstanding structural and formal richness, harmonizing perfectly with the local environment. In the Kara region, about 60% of the houses are of the traditional type [31]. Due to the ethnic and cultural diversity of this region, a comprehensive analysis of each form of architecture is impractical, as many houses from different ethnic groups display similar characteristics. However, the region is mainly dominated by the Kabiyè ethnic group (50.39%, including the Lamba people, a sub-group of the Kabiyè) and the Nawdéba (11.03%) [32], which together constitute more than half of the population of the Kara region. We will focus our analysis on the most expressive housing models of these two ethnic groups, i.e., Kabiyè vernacular architecture (KVA) and Nawdéba vernacular architecture (NVA). We will extend our study to the contemporary result of their evolution, called contemporary architecture (CA) for the purpose of this study.
Data Sampling and Processing
To carry out this study, we have used a mixed-method approach, i.e., qualitative and quantitative, emphasizing the analysis of existing literature and the collection of data in the field. The literature review, conducted through books, articles, and government publications, facilitated the analysis of similar studies on vernacular architecture. Initially, the research conducted by Annalisa Caimi [33] and that of Mathilde Chamodot and Basile Cloquet [34] laid the foundations for a participatory approach to the analysis of vernacular architecture. This methodology is based on 7 analysis techniques, namely mapping, direct observation, guided tours, community interviews, individual interviews with occupants, interviews with professionals, focus groups and technical surveys. At this stage, the questionnaire examines traditional architecture through four dimensions: natural environment, housing, knowledge and skills, and resources. The data obtained in the villages were organized and summarized in a tabular manner. Subsequently, to determine the vulnerability of vernacular constructions, surveys were carried out among the target populations through focus groups involving village chiefs, household leaders and local craftsmen from the villages studied. The data collected contributed to the establishment of vulnerability indicators, the notation (scoring and weighting) of which was possible thanks to interviews conducted with various professionals, such as technical managers of municipalities, architects registered with the Order of Architects of Togo (ONAT), technical agents of the regional branch of the ANPC, and trainers from the chambers of trade in the region studied. In the surveys, we used a purposive sampling method to interview those most likely to report specific information. The prefectures of Kozah, Binah and Doufelgou were studied. The Kabiyè and Nawdéba peoples, the main ethnic groups in the region, occupy these prefectures. They have about 452,749 inhabitants in total, of which the population living in authentic vernacular buildings is estimated at 781 according to the municipalities. The 5th RGPH stated that, on average, there are five people per household. It can therefore be considered that the study area has about 156.20 households. To calculate the sample size, we applied Slovin’s formula: n = N/(1 + N·e2), with n the sample size needed, N (156.20) the surveyed households of the villages visited, and e (4%) the tolerated margin of error. We visited 125 people in total. Table 1 presents the total number of people surveyed in each region.

Table 1.
Sampling of the study area.
4. Analysis and Results
4.1. Analysis of Vernacular Architecture in the Kara Region
4.1.1. Kabiyè Vernacular Architecture (KVA)
- Description
The Kabiyè people are the predominant ethnic group in the Kara region [35]. The Kabiyè reside mainly in the mountains of the prefectures of Kozah and Binah. The KVA is dispersed due to the people’s management of agricultural land, with an average distance of 50 to 100 m between dwellings in a neighborhood. The buildings barely emerge into the landscape and remain identifiable thanks to the preserved trees nearby, which provide them with shade. People often construct KVA on valley peaks and slopes to enhance occupant safety [36]. The KVA serves three main functions: first, it is a dwelling place for both the living and the spirits, but it also serves as a refuge for animals and a reserve of crops [36]. The KVA consists of round huts, separated from each other and organized in an almost circular unit. The walls of the huts are made of beaten earth, topped with a conical straw roof, overflowing on the perimeter of the walls to protect them from the weather. A fence connects the huts to each other, allowing access to the enclosure through a single entrance, the vestibule hut.
- Way of living
The KVA usually consists of a vestibule, the father’s room, the mother’s room, the children’s dormitory, the granaries and the animal pens, all arranged around a central courtyard (Figure 6 and Figure 7). The entrance to the house is through the vestibule, often the most important room on the property. The vestibule is a versatile space for welcoming guests, settling conflicts, and storing and sheltering animals. In the plots, all the huts open onto a central courtyard used as a place for grouping and drying. The adults each have their own room. Usually, a low terrace for daytime activities separates the women’s room from the outside [36]. Children grow up alongside their mothers before later joining their own huts. Fetishes also find their place in the KVA, because a space is reserved for them, especially for the practice of ancestor worship. All crops are stored in sturdy granaries and the spaces below are often set up for poultry. The sanitary areas contain only a shower and a urinal. They are often arranged between two huts, with openings at the bottom of the fence wall to drain sewage to the manure pits. For other needs, a space is set up outside the concessions. For children, a small hole is made in the women’s hut with ash to collect urine during the night (Figure 8 and Figure 9). Electricity is provided by oil lanterns that illuminate the spaces. The many reserves available in the region ensure the supply of water to households [36].
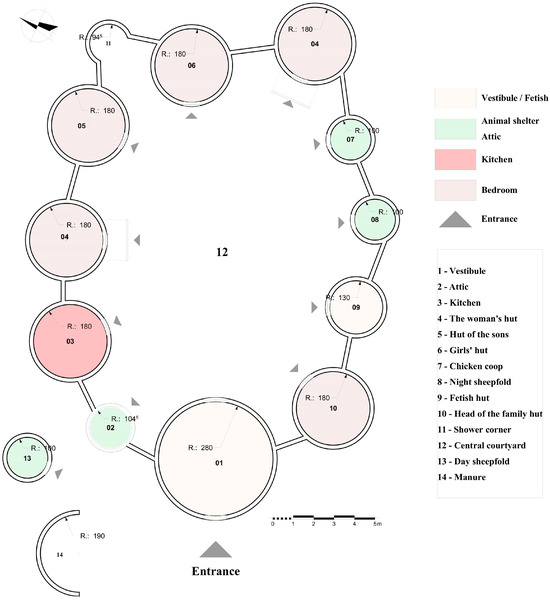
Figure 6.
Model plan of a concession in Kabiyè territory.
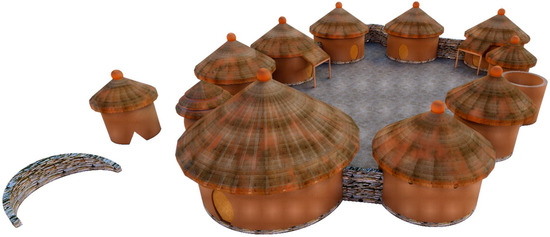
Figure 7.
Three-dimensional view of a concession in Kabiyè territory.
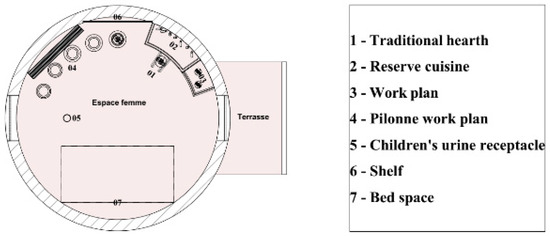
Figure 8.
Typical plan of the layout of the woman’s hut.
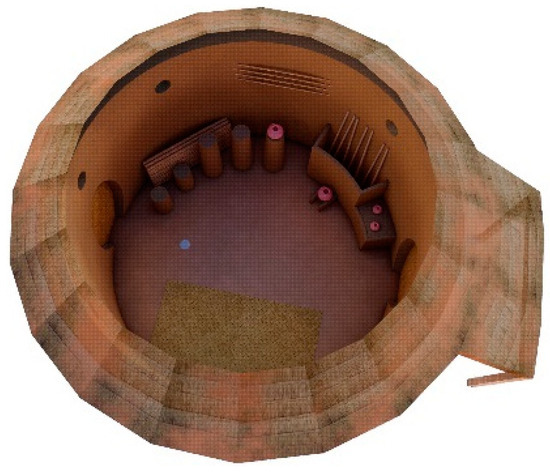
Figure 9.
Three-dimensional view of the inside of the woman’s hut.
- Materials and construction system
The KVA, often carried out during the dry season, is a collective work involving men, women and children. The earth from the excavations is sorted, mixed with water and then pounded with the feet until it is good for construction. To make the foundation, this prepared earth, stocked for a few days, is then alternated with rows of stones found nearby. The foundation is on average 30 cm wide and 20 to 30 cm deep and its height, which varies according to the relief, can measure up to 40 cm. At this stage, a one-week break is respected so that the foundation can dry and strengthen before starting to raise the walls. The wall is made using the Bauge technique [37] with 20 × 30 cm clods of earth arranged on top of each other. Every 3 layers, a pause is respected to let the wall harden. The windows, in the form of small round or triangular openings, are erected at a height of one and a half meters and allow hot air to be evacuated. All the huts have an oval-shaped door made of plant material (mats made of palm ribs tied together by strands of raffia or bark), which gives access to the central courtyard. The framework is made of ronier trunks, locally called “ocker”, thinning wood stems, and hard or soft bamboo stems (raffia). Vegetable straw stubble, specifically Kessi and Kingbala varieties, is woven into bundles 4 to 5 m long for the cover. Raffia or sisal fibers and young palm veins form the braid, which also serves to secure the thatch to the framework. A clay pot gathers the straw strands at the top of the conical roof. To make the walls watertight, successive layers of the «néré» juice pod and a solution based on cow or ox dung is used to finely treat the walls and floors. Occasionally, the huts, particularly those of the women and the vestibule, are adorned with shards of pottery or cowrie shells [36]. A flat stone and a removable straw lid allow the attics to be closed. The creation of a vernacular habitat among the Kabiyè requires an average of 3 to 4 weeks.
4.1.2. Nawdéba Vernacular Architecture (NVA)
- Description
The Nawdéba people, in terms of demography, are the second most populous in the Kara region. The Nawdéba reside in the prefecture of Doufelgou. Among the Nawdéba, the vernacular dwelling can be made of earth, as among the Kabiyè, but also entirely of stone. It is the only location in the region where this type of all-stone house can be found (Figure 10 and Figure 11). Like that of the Kabiyè, Nawdéba vernacular architecture is scattered. It consists of several round huts organized in a circular fashion and connected by a fence wall. The huts feature entirely stone walls, crowned by a conical straw roof with a perimeter overhang for weather protection.
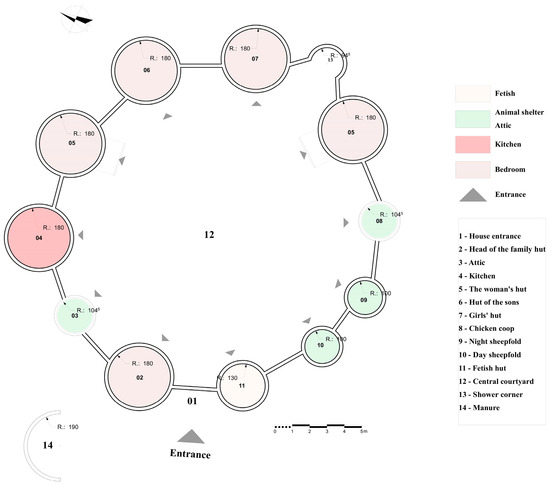
Figure 10.
Model plan of a concession in Nawdéba territory.
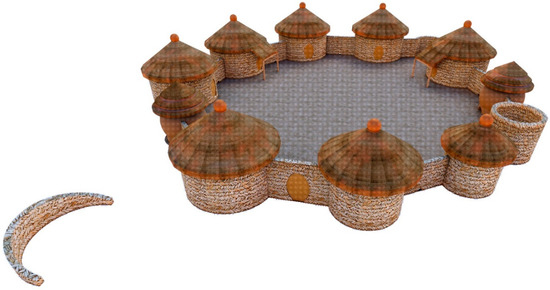
Figure 11.
Three-dimensional view of a concession in Nawdéba territory.
- Way of living
The NVA is structured to meet the functional and social needs of its residents. It consists of two sections. The first, called the HAGA, is the family living area, while the second, called the WAGU, serves as a crop drying area and a gathering space for family gatherings and handicraft activities (Figure 8) [38]. Among the Nawdeba, the vestibule is absent, and the concession is accessed via a main entrance that opens onto the central courtyard, thus optimizing access and circulation between the huts. In the home, the layout of the huts illustrates the social and family structure, and the distribution of spaces is based on social status, age and sex. The head of the family and his wives each have their own space. The children stay with their mothers until they reach the age to have their own dormitory. Each woman has her own kitchen in an enclosed space, but they like to cook outside, in the WAGU space. The crops are stored in large, raised granaries, and chicken coops are built underneath. Open-air sheepfolds are also set up for livestock farming. The relationship between the habitat and traditional beliefs is justified by the presence of ancestral places of worship in the concessions. The bathrooms contain a shower and a urinal and are between two boxes, so that the wastewater is conveyed to manure pits. Toilets are located outside the concessions. The concessions do not benefit from lighting or water supply. Oil lanterns provide lighting, while natural water reserves or community wells provide water.
- Materials and construction system
The Nawdeba mainly use stones to build their habitat. These stones come from the White Mountains, which are rich in quartzites and micaceous schists [38]. The community constructs some huts using lateritic stones, sand and a rare clay that results from rock decay. The construction takes place in the dry season and involves the whole community, i.e., men, women and children. Habitat construction begins with site selection and preparation. Then, the trenches, 30 cm wide and 20 and 30 cm deep, are made to accommodate a foundation made of layers of stones and clay soil specially prepared. The height of the foundation depends on the relief and can reach 60 cm. Following a one-week break, a 40 cm thick wall composed of stone (micaceous schist or lateritic stone) is built without formwork but with rigor in the arrangement of the stones to guarantee optimal stability. Daily practices, particularly the organization of plant fibers during hat manufacture, influence the layout of the walls. The openings, sometimes absent in some huts, are small and located right below the roof to limit heat input and optimize shade inside. The doors made from plant materials such as bamboo or woven straw all open onto the central courtyard. Trunks of a ronier tree known locally as «cocker» are used to make the framework. This wooden structure supports a thatched roof made of vegetable straw. The straw, previously dried and meticulously woven into bundles of 4 to 5 m long using raffia or sisal fibers and young palm veins, is attached to the framework using raffia fiber ropes. To finalize the work, a clay pot is attached to gather the ends of the straw. Women are often responsible for finishing the floor and walls. After preparing the surfaces (tamping the soil), they apply successive layers of juice from the «néré» pod and a solution based on cow or ox dung to the soil to protect it from moisture. A mixture of straw and clay from termite mounds is used in the construction of granaries, as is the case among the Kabiyè. The construction of a Nawdéba vernacular dwelling requires a month of work due to the robustness of the stone material.
4.1.3. Evolution from Vernacular Architecture to Contemporary Architecture (CA)
Vernacular housing in the Kara region is facing profound changes characterized by architectural simplification and standardization. The new vernacular practices referred to as “contemporary architecture” for the purpose of this study neglect vernacular construction values in favor of imported construction techniques. Rectangular or square huts dominate this contemporary architecture (Figure 12). Metal roofs, such as those made of corrugated sheet metal with a low slope, are increasingly being adopted (Figure 13). Wooden trusses are gradually giving way to the metal framework. Instead of waterproof solutions based on néré or cow dung, tar and oil are used to protect the walls. Materials like sheet metal or steel are gradually replacing wooden doors and windows. The foundations (concrete footings and pre-columns) are made with cement blocks. Today, the Bauge technique is no longer seen as relevant. The houses of the less wealthy are made of mud bricks with a thickness of 10 to 15 cm, while those of the wealthy are built with cement bricks of the same thickness. Spaces of secondary importance, such as kitchens, barns and attics, retain their traditional location, form and materials. Sanitary facilities consisting of ECOSAN or VIP (Ventilated Improved Pit) showers and toilets are now available in dealerships. The vestibule hut, which is an important element of traditional architecture, is no longer present in new constructions. The settlements maintain a central courtyard for crop drying, but rectangular arrangements replace the circular hut organization. There is also a slackening characterized by the poor quality of the finishes of new constructions. The decorations on the facades of women’s huts have completely disappeared. According to the respondents, these changes aim to make buildings more resistant to bad weather, offer the possibility of building at any time of the year, reduce the frequency of maintenance work and speed up the implementation of habitats. Thus, the construction of a contemporary house requires about 10 days.
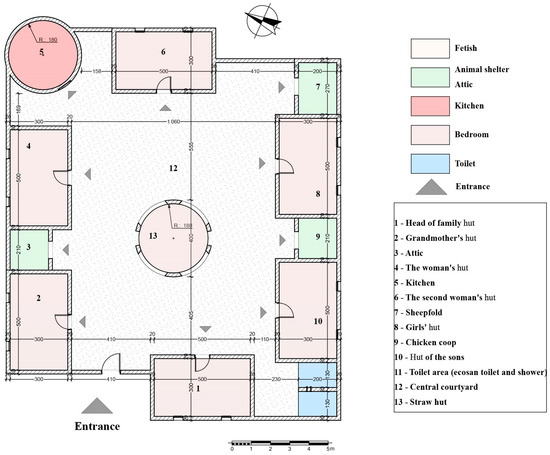
Figure 12.
Model plan of contemporary architecture.
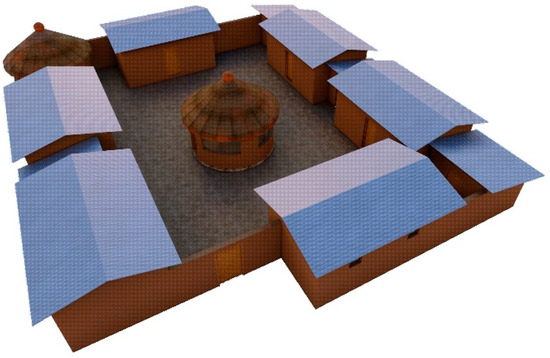
Figure 13.
Three-dimensional view of contemporary architecture.
The summary of the architectural typologies in the Kara region are presented in the Table 2.

Table 2.
Synthesis of construction systems in the Kara region.
4.2. Climate Hazards and Impacts on Vernacular Architecture in the Kara Region
Based on data from the First Communication on Adaptation to Climate Change (PCACC) [6], the Kara region faces several climatic risks, including strong winds, heavy rains and high heat.
- High heat
High heat results in high temperatures. Each year, the Kara region experiences this phenomenon, with temperatures reaching up to 39.5 °C in certain locations, as per data sourced from ANAMET. High temperatures have detrimental effects on buildings. They can accelerate the degradation process of building materials. Prolonged exposure to high temperatures generates differential thermal expansions that lead to embrittlement and degradation of materials such as concrete, metal and wood [39]. Temperature fluctuations present a challenge for metal roofing systems and metal finishing elements. Metal roofs that are subject to temperature variations can expand and contract, causing leaks and water infiltration. This incessant cycle of expansion and contraction can lead to the appearance of cracks in the structure of the building over the years.
- Strong winds
The strong winds frequently observed in the Kara region, according to ANAMET data, reach speeds between 100 and 115 km/h [6]. These destructive winds are responsible for soil degradation caused by wind erosion, the removal of constructions’ roofs and the falling of trees, sometimes on habitats, thus causing considerable damage. For example, in the Kara region, the strong winds of 2021 led to 3697 reported disasters, of which 10 people were injured. During this same period, school buildings frequently suffered extensive damage, including damage to their metal roofs [8].
- Heavy rains
The phenomenon of heavy rainfall is characterized by the sudden arrival of excessively heavy precipitation concentrated over short periods, often leading to heavy runoff and flooding. In Togo, according to ANAMET data, heavy rains are generally those with an intensity exceeding 50 mm to 100 mm in 24 h. In the Savannah region, for example, rainfall with an intensity of more than 96.83 mm per day is considered a hazard with a significant risk of flooding [40]. The phenomenon of heavy rains destroys the fragile foundations and walls of houses without waterproofing or overhanging roofs. In 2021, the Kara region was affected by heavy rains, causing considerable material damage to infrastructure, crops and homes. Injuries and deaths were also recorded. In short, there was 1 death and 213 people were affected, including 2 injuries.
4.3. Step 2: Identification of Indicators That Affect the Vulnerability of Buildings to Climatic Hazards and the Collection of Data Against These Indicators
An analysis of the data collected from ANPC, coupled with in-depth documentation of the effects of climatic hazards (strong wind, heavy rain, and high heat) on building structures, was carried out to choose the indicators presented in Table 3. In more detail, the following indicators are considered:

Table 3.
Indicators of vulnerability to different types of climatic hazards.
4.3.1. High Heat Hazard Indicator
- Roof Material: Metal roofs, in prolonged contact with high temperatures, expand and contract, especially in the attachment areas, which are often subject to leaks and water infiltration. The temperature and humidity of the surrounding air influence the strength of the wood material. The strength of a wood component decreases when the air temperature exceeds 35 °C and its humidity level is below 10% [39].
- Length of overhang: The roof overhang provides protection against solar radiation [41]. It creates shade on the upper half of facades exposed to sunlight.
- Elevation material: Elevation walls exposed to high temperatures are subject to differential thermal expansion, leading to cracks on facades, in general, but also on concrete elements. There are cracks in the metal components contained in the walls, which are often subject to expansion. Earthen walls are often subject to hygrometric changes in line with temperature variations. Exposing cement-stabilized and compacted rammed earth samples to dry–wet cycles leads to a reduction in compressive strength [42]. It is therefore conceivable that temperature variations can also weaken destabilized raw earth walls.
- Resistance of plastering materials: Differential thermal expansion induced by high temperatures creates cracks in the plaster. In addition, the quality of the coating can reduce temperatures on surfaces. Walls with white paint are about 3 °C cooler than those with gray paints [43].
- Building shape: The shape of the building is important, and can limit the surfaces in contact with the outside. In this sense, the compact form proves to be the most effective in minimizing the surface area of the envelope exposed to the sun’s rays [44].
- Building maintenance status: Repair work on the damage to the walls and roof elements increases the building’s resistance to high temperatures.
4.3.2. Heavy Rain Hazard Indicator
- Roof material: The roof serves as the primary barrier between buildings and the weather. Leakage zones on the roof promote the infiltration of rainwater, causing damage to the interior of buildings [45]. The wood and vegetation cover are putrescible in contact with the weather. Macroscopic examination revealed various types of deterioration caused by weathering, fungal organisms and insect pests [46].
- Roof slope: A roof with a low inclination does not facilitate the drainage of rainwater. Water tends to stagnate on the roof, which increases the risk of infiltration into the roof components. Low-slope roofs are among the building components most vulnerable to heavy rainfall [47].
- Roof shape: The shape of the roof is an essential element of the building when it comes to heavy rain. Pyramid-shaped roof provides protection and safety against weather hazards.
- Length of overhang: Although they are protective for facades, they also suffer considerable damage, especially when they are not reinforced.
- Foundation height: The presence and height of the foundation are important elements to consider with regard to heavy rainfall. The good-height foundations made with embankments ensure better waterproofing of the building. Runoff water easily invades homes with low foundations.
- Foundation material: Prolonged contact with water accentuates the vulnerability of the foundation structure materials [48]. A longer immersion time leads to the degradation of the foundation materials.
- Elevation material: Unprotected earthen walls easily erode during severe weather, and are often carried away by runoff. In addition, due to the phenomenon of capillary rise, the diffusion of moisture through the walls leads to degradation of materials by mold formation and detachment of plaster [48]. Runoff water can also damage the walls of a building due to impacts from floating debris such as tree trunks. A standard masonry wall is at risk of collapsing when the difference in water level between the inside and the outside reaches or exceeds one meter [48].
- Waterproofing of intersections on the building: Points of fixation on the roof and joints at doors and windows are most often vulnerable during bad weather.
- Presence and state of gutter: The gutter, when present and functional, ensures the evacuation of water on the roof and prevents waterfalls on the facades.
- Resistance of plastering materials: The quality of the coating or plastering can reduce infiltration when heavy rainfalls occur. Solutions based on néré and cow dung, for example, improve the waterproofing of walls against moisture.
- Window type: Windows, when exposed, are subject to water infiltration during severe weather. Water intrusion from shuttered windows is reduced by 77–87% compared to unprotected windows [49].
- Building maintenance status: Regular building maintenance, including roof repairs and wall waterproofing, improves the weatherproofing of buildings.
4.3.3. Strong Wind Hazard Indicator
- Roof shape: The behavior of the roof in relation to winds varies depending on its shape. In tropical areas, the pyramidal roof undergoes small uplifts compared to the gable and the hipped roofs [45].
- Roof material: The characteristics of the roof, including material, thickness, type of fastening and arrangement, determine its resistance to strong winds.
- Roof slope: Lightweight construction with a double-pitched roof and gable wall is the most vulnerable to high winds. Hipped roofs with a slope of 25 to 40 degrees provide better resistance to strong winds [50].
- Length of overhang: Strong winds often cause the eaves of buildings to fail. Unreinforced roof overhangs on gable roofs experience extremely high local suction when exposed to strong winds [51].
- Elevation material: Wind can damage the walls of a building due to the impacts of objects that can fall or float, such as tree trunks or branches.
- Height of the building: Strong winds affect high-rise buildings more than low-rise buildings. In high-rise buildings, it is possible to observe an increase in wind pressure of up to 30% [52].
- Building shape: Aerodynamic shapes reduce the resistance forces of high winds by limiting the surfaces of contact with the outside. In this way, winds can easily go around the building without obstacles.
- Window type: Failure of the window devices (type and fixing of windows) leads to high interior pressures, causing damage to other parts of the structure, such as the roof being exposed and the framework being destroyed [53].
- Windows material: Wind-blown debris frequently damages single-pane louvered windows, aggravating the damage inside the building [54].
- Construction typology: The construction typology indicator measures the degree of use of materials to obtain the best resistance to hazards. Depending on the study area, we opt for three construction methods: the monolithic envelope, the mixed envelope (load-bearing framework plus infill) and the masonry structure plus infill.
- Building maintenance status: Regular maintenance of each part of the structure, from structural work to finishing work, improves the resistance of buildings to strong winds.
4.4. Step 3: Calculation of the Vulnerability of Buildings Through the Physical Vulnerability Index (PVI)
4.4.1. Scoring of Indicators
The selection of indicators makes it possible to determine the physical characteristics (shape of the building, materials, slope of the roof, etc.) of the types of vernacular constructions studied. Discussions with experts on the impact of each feature on the physical vulnerability of buildings led to the assignment of scores, as shown in Table 4, Table 5, Table 6, Table 7, Table 8 and Table 9. We assign a higher score to features that increase a building’s vulnerability than those that reduce it. The scoring of each indicator ranges from 0.1 to 1. For instance, the «flat roof» characteristic, according to the regional multi-hazard contingency plan of the Kara region [8], increases the building’s vulnerability and receives a score of 1. According to the same source, the “conical roof” feature reduces the vulnerability of buildings and gets a score of 0.2.
- Scoring of indicators for the severe rain hazard

Table 4.
Scoring grid for indicators for the severe rain hazard.
Table 4.
Scoring grid for indicators for the severe rain hazard.
| Indicators | Scoring | ||||||||||
|---|---|---|---|---|---|---|---|---|---|---|---|
| 1 | Roof material | Metal roof | Reinforced concrete slab | Clay slab | Clay tile | Straw | |||||
| Score | 0.1 | 0.2 | 0.3 | 0.4 | 0.5 | 0.6 | 0.7 | 0.8 | 0.9 | 1 | |
| 2 | Roof shape | Conical | Pyramidal | Gable roof | Multi-slope roof | Hangar | Flat roof | ||||
| Score | 0.1 | 0.2 | 0.3 | 0.4 | 0.5 | 0.6 | 0.7 | 0.8 | 0.9 | 1 | |
| 3 | Roof slope | 21–30° and >30° | 11–20° | 0–10° | |||||||
| Score | 0.1 | 0.2 | 0.3 | 0.4 | 0.5 | 0.6 | 0.7 | 0.8 | 0.9 | 1 | |
| 4 | Length of overhang | >50 cm | 25–50 cm | 10–25 cm | No overhang | ||||||
| Score | 0.1 | 0.2 | 0.3 | 0.4 | 0.5 | 0.6 | 0.7 | 0.8 | 0.9 | 1 | |
| 5 | Foundation height | Built on piles | 45–80 cm | 30–45 cm | 10–30 cm | 0–10 cm | <0 cm | No basement | |||
| Score | 0.1 | 0.2 | 0.3 | 0.4 | 0.5 | 0.6 | 0.7 | 0.8 | 0.9 | 1 | |
| 6 | Foundation material | Lateritic stone, or schist | Cement blocks and concrete | Raw mud | |||||||
| Score | 0.1 | 0.2 | 0.3 | 0.4 | 0.5 | 0.6 | 0.7 | 0.8 | 0.9 | 1 | |
| 7 | Elevation material | Lateritic stone or schist | Cement Block | Earthen wall | Raw mud | ||||||
| Score | 0.1 | 0.2 | 0.3 | 0.4 | 0.5 | 0.6 | 0.7 | 0.8 | 0.9 | 1 | |
| 8 | Waterproofing of intersections on the building | Good | Normal | Bad | No waterproofing of intersections | ||||||
| Score | 0.1 | 0.2 | 0.3 | 0.4 | 0.5 | 0.6 | 0.7 | 0.8 | 0.9 | 1 | |
| 9 | Presence and state of gutter | Good | Normal | Bad | No gutter | ||||||
| Score | 0.1 | 0.2 | 0.3 | 0.4 | 0.5 | 0.6 | 0.7 | 0.8 | 0.9 | 1 | |
| 10 | Resistance of plastering materials | Stone surface | Nere juice and cow dung | Cement plaster and paint | Plastering in earthen | ||||||
| Score | 0.1 | 0.2 | 0.3 | 0.4 | 0.5 | 0.6 | 0.7 | 0.8 | 0.9 | 1 | |
| 11 | Windows type | Sliding window | Casement windows | Louvers | |||||||
| Score | 0.1 | 0.2 | 0.3 | 0.4 | 0.5 | 0.6 | 0.7 | 0.8 | 0.9 | 1 | |
| 12 | Building maintenance status | Preventive maintenance | Corrective maintenance | Curative maintenance | |||||||
| Score | 0.1 | 0.2 | 0.3 | 0.4 | 0.5 | 0.6 | 0.7 | 0.8 | 0.9 | 1 | |
 | |||||||||||

Table 5.
Rating of the indicators for the severe rain hazard.
Table 5.
Rating of the indicators for the severe rain hazard.
| 1 | 2 | 3 | 4 | 5 | 6 | 7 | 8 | 9 | 10 | 11 | 12 | ||
|---|---|---|---|---|---|---|---|---|---|---|---|---|---|
| Roof material | Roof shape | Roof slope | Length of overhang | Foundation height | Foundation material | Elevation material | Waterproofing of intersections on the building | Presence and state of gutter | Resistance of plastering materials | Windows type | Building maintenance status | ||
| KVA | Scoring | Straw | Conical | 21–30° | 25–50 cm | 30–45 cm | Stone | Earthen wall | No waterproofing of intersections | No gutter | Nere juice and cow dung | Casement windows | Corrective maintenance |
| Total | 0.7 | 0.2 | 0.2 | 0.4 | 0.3 | 0.1 | 0.5 | 1 | 1 | 0.3 | 0.4 | 0.5 | |
| (5.6) | |||||||||||||
| NVA | Scoring | Straw | Conical | >30° | 25–50 cm | 45–80 cm | Stone | Stone wall | No waterproofing of intersections | No gutter | Stone surface | Casement windows | Corrective maintenance |
| Total | 0.7 | 0.2 | 0.2 | 0.4 | 0.2 | 0.1 | 0.1 | 1 | 1 | 0.1 | 0.4 | 0.5 | |
| (4.9) | |||||||||||||
| CA | Scoring | Metal roof | Gable roof | 11–20° | 25–50 cm | 45–80 cm | Cement blocks and concrete | Cement Block | No waterproofing of intersections | Bad | Cement plaster and paint | Casement windows | Curative maintenance |
| Total | 0.2 | 0.5 | 0.6 | 0.4 | 0.2 | 0.4 | 0.4 | 1 | 0.8 | 0.6 | 0.4 | 0.9 | |
| (6.4) |
- Rating of indicators for the high heat hazard

Table 6.
Scoring grid for indicators for the high heat hazard.
Table 6.
Scoring grid for indicators for the high heat hazard.
| Indicators | Scoring | ||||||||||
|---|---|---|---|---|---|---|---|---|---|---|---|
| 1 | Roof material | Metal roof | Reinforced concrete slab | Clay slab | Clay tile | Straw | |||||
| Score | 0.1 | 0.2 | 0.3 | 0.4 | 0.5 | 0.6 | 0.7 | 0.8 | 0.9 | 1 | |
| 2 | Length of overhang | >50 cm | 25–50 cm | 10–25 cm | No overhang | ||||||
| Score | 0.1 | 0.2 | 0.3 | 0.4 | 0.5 | 0.6 | 0.7 | 0.8 | 0.9 | 1 | |
| 3 | Elevation material | Lateritic stone or schist | Cement Block | Earthen wall | Raw mud | ||||||
| Score | 0.1 | 0.2 | 0.3 | 0.4 | 0.5 | 0.6 | 0.7 | 0.8 | 0.9 | 1 | |
| 4 | Resistance of plastering materials | Stone surface | Nere juice and cow dung | Cement plaster and paint | Plastering in earthen | ||||||
| Score | 0.1 | 0.2 | 0.3 | 0.4 | 0.5 | 0.6 | 0.7 | 0.8 | 0.9 | 1 | |
| 5 | Building shape | Round hut | Rectangular hut | ||||||||
| Score | 0.1 | 0.2 | 0.3 | 0.4 | 0.5 | 0.6 | 0.7 | 0.8 | 0.9 | 1 | |
| 6 | Building maintenance status | Preventive maintenance | Corrective maintenance | Curative maintenance | |||||||
| Score | 0.1 | 0.2 | 0.3 | 0.4 | 0.5 | 0.6 | 0.7 | 0.8 | 0.9 | 1 | |
 | |||||||||||

Table 7.
Rating of indicators for the high heat hazard.
Table 7.
Rating of indicators for the high heat hazard.
| 1 | 2 | 3 | 4 | 5 | 6 | ||
|---|---|---|---|---|---|---|---|
| Roof material | Length of overhang | Elevation material | Resistance of plastering materials | Building shape | Building maintenance status | ||
| KVA | Scoring | Straw | 25–50 cm | Earthen wall | Nere juice and cow dung | Round hut | Corrective maintenance |
| Total | 0.7 | 0.4 | 0.5 | 0.3 | 0.2 | 0.5 | |
| (2.6) | |||||||
| NVA | Scoring | Straw | 25–50 cm | Stone wall | Stone surface | Round hut | Corrective maintenance |
| Total | 0.7 | 0.4 | 0.1 | 0.1 | 0.2 | 0.5 | |
| (2.0) | |||||||
| CA | Scoring | Metal roof | 25–50 cm | Cement Block | Cement plaster and paint | Rectangular hut | Curative maintenance |
| Total | 0.2 | 0.4 | 0.4 | 0.6 | 0.7 | 0.9 | |
| (3.2) |
- Scoring of indicators for high wind hazard

Table 8.
Scoring grid for indicators for severe wind hazard.
Table 8.
Scoring grid for indicators for severe wind hazard.
| Indicators | Scoring | ||||||||||
|---|---|---|---|---|---|---|---|---|---|---|---|
| 1 | Roof material | Metal roof | Reinforced concrete slab | Clay slab | Clay tile | Straw | |||||
| Score | 0.1 | 0.2 | 0.3 | 0.4 | 0.5 | 0.6 | 0.7 | 0.8 | 0.9 | 1 | |
| 2 | Roof shape | Conical | Pyramidal | Gable roof | Multi-slope roof | Hangar | Flat roof | ||||
| Score | 0.1 | 0.2 | 0.3 | 0.4 | 0.5 | 0.6 | 0.7 | 0.8 | 0.9 | 1 | |
| 3 | Roof slope | 21–30° and >30° | 11–20° | 0–10° | |||||||
| Score | 0.1 | 0.2 | 0.3 | 0.4 | 0.5 | 0.6 | 0.7 | 0.8 | 0.9 | 1 | |
| 4 | Length of overhang | >50 cm | 25–50 cm | 10–25 cm | No overhang | ||||||
| Score | 0.1 | 0.2 | 0.3 | 0.4 | 0.5 | 0.6 | 0.7 | 0.8 | 0.9 | 1 | |
| 5 | Elevation material | Lateritic stone or schist | Cement Block | Earthen wall | Raw mud | ||||||
| Score | 0.1 | 0.2 | 0.3 | 0.4 | 0.5 | 0.6 | 0.7 | 0.8 | 0.9 | 1 | |
| 6 | Windows type | Sliding window | Casement windows | Louvers | |||||||
| Score | 0.1 | 0.2 | 0.3 | 0.4 | 0.5 | 0.6 | 0.7 | 0.8 | 0.9 | 1 | |
| 7 | Windows material | Metal | Wood | Sheet metal | Single Glazing/Naco | ||||||
| Score | 0.1 | 0.2 | 0.3 | 0.4 | 0.5 | 0.6 | 0.7 | 0.8 | 0.9 | 1 | |
| 8 | Building maintenance status | Preventive maintenance | Corrective maintenance | Curative maintenance | |||||||
| Score | 0.1 | 0.2 | 0.3 | 0.4 | 0.5 | 0.6 | 0.7 | 0.8 | 0.9 | 1 | |
| 9 | Building shape | Round hut | Rectangular hut | ||||||||
| Score | 0.1 | 0.2 | 0.3 | 0.4 | 0.5 | 0.6 | 0.7 | 0.8 | 0.9 | 1 | |
| 10 | Construction typology | Monolithic envelope (stone) | Concrete structure and cement block filling | Monolithic envelope (earthen) | |||||||
| 0.1 | 0.2 | 0.3 | 0.4 | 0.5 | 0.6 | 0.7 | 0.8 | 0.9 | 1 | ||
| 11 | Height of the building | Single story | Two-story | ||||||||
| 0.1 | 0.2 | 0.3 | 0.4 | 0.5 | 0.6 | 0.7 | 0.8 | 0.9 | 1 | ||
 | |||||||||||

Table 9.
Scoring of indicators for severe wind hazard.
Table 9.
Scoring of indicators for severe wind hazard.
| 1 | 2 | 3 | 4 | 5 | 6 | 7 | 8 | 9 | 10 | 11 | ||
|---|---|---|---|---|---|---|---|---|---|---|---|---|
| Roof material | Roof shape | Roof slope | Length of overhang | Elevation material | Windows type | Windows material | Building maintenance status | Building shape | Construction typology | Height of the building | ||
| KVA | Scoring | Straw | Conical | 21–30° | 25–50 cm | Earthen wall | Casement windows | Wood | Corrective maintenance | Round hut | Monolithic envelope (earthen) | Single story |
| Total | 0.7 | 0.2 | 0.2 | 0.4 | 0.5 | 0.4 | 0.4 | 0.5 | 0.2 | 0.5 | 0.2 | |
| (4.2) | ||||||||||||
| NVA | Scoring | Straw | Conical | >30° | 25–50 cm | Stone wall | Casement windows | Wood | Corrective maintenance | Round hut | Monolithic envelope (stone) | Single story |
| Total | 0.7 | 0.2 | 0.2 | 0.4 | 0.1 | 0.4 | 0.4 | 0.5 | 0.2 | 0.1 | 0.2 | |
| (3.4) | ||||||||||||
| CA | Scoring | Metal roof | Gable roof | 11–20° | 25–50 cm | Cement Block | Casement windows | Metal | Curative maintenance | Rectangular hut | Concrete structure and cement block filling | Single story |
| Total | 0.2 | 0.5 | 0.6 | 0.4 | 0.4 | 0.4 | 0.3 | 0.9 | 0.7 | 0.3 | 0.2 | |
| (4.9) |
4.4.2. Weighting of Indicators Through the AHP Method and Calculation of the Vulnerability Index
AHP Method and Weighting of Indicators
The weighting of the indicators was carried out using the AHP method, developed by R.W. Saaty [55]. The AHP method represents one of the most widespread and appreciated participatory approaches for the weighting of indicators. The AHP method relies on a pairwise comparison methodology to determine a score that ranks each indicator. To reduce subjectivity in the weighting of the indicators, two series of interviews were organized. A first series of interviews was carried out with local professionals (technical managers of the municipalities and trainers from the chambers of trades of the regions studied). Subsequently, a second series of interviews was conducted with architects registered with the Order of Architects of Togo (ONAT) and the technical agents of the ANPC branch of the Kara region. These two rounds allowed experts to provide suggestions and recommendations on the importance of each indicator in building vulnerability. Based on the outcome of these interviews, we performed the pairwise analysis (AHP) of the indicators, which made it possible to assign the final weights for each indicator, as shown in the Table 10.

Table 10.
The weight of the indicators for each climatic hazard.
Vulnerability Index Calculation
After defining the weights for each indicator using the AHP method, the following equation was used for the calculation of the vulnerability index of each building type to each climatic hazard:
RVI: The physical vulnerability index;
: The weight of each indicator;
: The score of each indicator.
This vulnerability index (Figure 14) is not relative to the intensity of the danger but rather reflects the relative vulnerability of each type of building to climate hazards. The scoring and the weighting of indicators are presented in the following tables (Table 11, Table 12 and Table 13). The relative vulnerability index is detailed in Figure 15, Figure 16, Figure 17, Figure 18, Figure 19, Figure 20 and Figure 21.

Table 11.
Evaluation of the vulnerability index of building types to the hazard of heavy rain.
Table 11.
Evaluation of the vulnerability index of building types to the hazard of heavy rain.
| Heavy Rain | |||||||||||||
|---|---|---|---|---|---|---|---|---|---|---|---|---|---|
| Roof Material | Roof Shape | Roof Slope | Length of Overhang | Foundation Height | Foundation Material | Elevation Material | Waterproofing of Intersections | Presence and State of Gutter | Plastering Material | Windows Type | Building Maintenance Status | ||
| KVA | Weight | 0.17 | 0.17 | 0.24 | 0.04 | 0.06 | 0.08 | 0.03 | 0.01 | 0.04 | 0.01 | 0.02 | 0.12 |
| Score | 0.7 | 0.2 | 0.2 | 0.4 | 0.3 | 0.1 | 0.5 | 1 | 1 | 0.3 | 0.4 | 0.5 | |
| Weight × Score | 0.119 | 0.034 | 0.048 | 0.016 | 0.018 | 0.008 | 0.015 | 0.01 | 0.04 | 0.003 | 0.008 | 0.06 | |
| RVI | 0.379 | ||||||||||||
| NVA | Weight | 0.17 | 0.17 | 0.24 | 0.04 | 0.06 | 0.08 | 0.03 | 0.01 | 0.04 | 0.01 | 0.02 | 0.12 |
| Score | 0.7 | 0.2 | 0.2 | 0.4 | 0.2 | 0.1 | 0.1 | 1 | 1 | 0.1 | 0.4 | 0.5 | |
| Weight × Score | 0.119 | 0.034 | 0.048 | 0.016 | 0.012 | 0.008 | 0.003 | 0.01 | 0.04 | 0.001 | 0.008 | 0.06 | |
| RVI | 0.359 | ||||||||||||
| CA | Weight | 0.17 | 0.17 | 0.24 | 0.04 | 0.06 | 0.08 | 0.03 | 0.01 | 0.04 | 0.01 | 0.02 | 0.12 |
| Score | 0.2 | 0.5 | 0.6 | 0.4 | 0.2 | 0.4 | 0.4 | 1 | 0.8 | 0.6 | 0.4 | 0.9 | |
| Weight × Score | 0.034 | 0.085 | 0.144 | 0.016 | 0.012 | 0.032 | 0.012 | 0.01 | 0.032 | 0.006 | 0.008 | 0.108 | |
| RVI | 0.499 | ||||||||||||
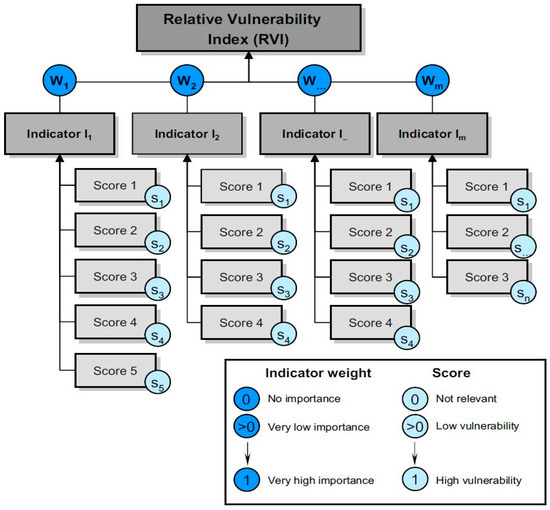
Figure 14.
Framework for calculating the vulnerability index.
- Vulnerability index of building type to the hazard of heavy rain
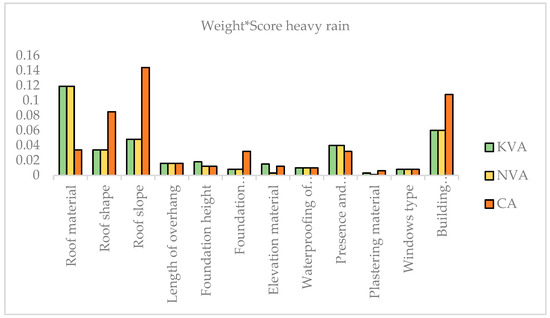
Figure 15.
Vulnerability index of building type to the hazard of heavy rain.
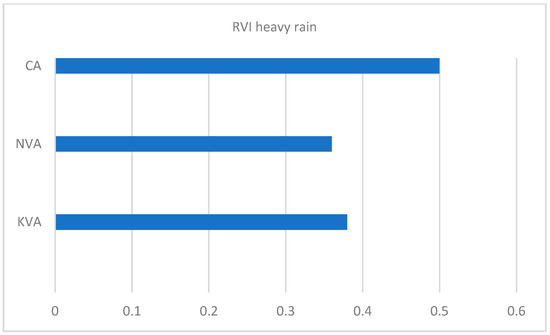
Figure 16.
Rating of the indicators of heavy rain hazard.
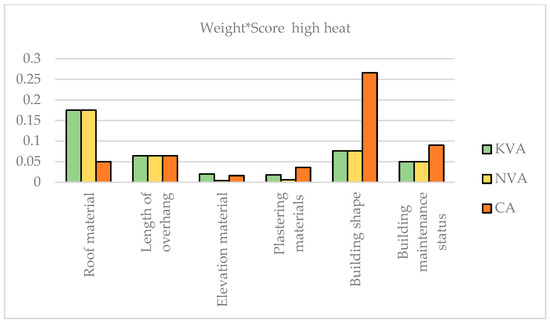
Figure 17.
Rating of the indicators of severe rain hazard.
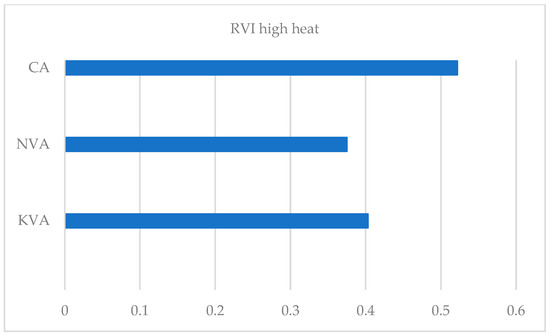
Figure 18.
Vulnerability index of building type to high heat hazards.
- Vulnerability index of building type to high heat hazards

Table 12.
Evaluation of the vulnerability index of building types to high heat hazards.
Table 12.
Evaluation of the vulnerability index of building types to high heat hazards.
| High Heat | |||||||
|---|---|---|---|---|---|---|---|
| Roof Material | Length of Overhang | Elevation Material | Plastering Materials | Building Shape | Building Maintenance Status | ||
| KVA | Weight | 0.25 | 0.16 | 0.04 | 0.06 | 0.38 | 0.1 |
| Score | 0.7 | 0.4 | 0.5 | 0.3 | 0.2 | 0.5 | |
| Weight × Score | 0.175 | 0.064 | 0.02 | 0.018 | 0.076 | 0.05 | |
| RVI | 0.403 | ||||||
| NVA | Weight | 0.25 | 0.16 | 0.04 | 0.06 | 0.38 | 0.1 |
| Score | 0.7 | 0.4 | 0.1 | 0.1 | 0.2 | 0.5 | |
| Weight × Score | 0.175 | 0.064 | 0.004 | 0.006 | 0.076 | 0.05 | |
| RVI | 0.375 | ||||||
| CA | Weight | 0.25 | 0.16 | 0.04 | 0.06 | 0.38 | 0.1 |
| Score | 0.2 | 0.4 | 0.4 | 0.6 | 0.7 | 0.9 | |
| Weight × Score | 0.05 | 0.064 | 0.016 | 0.036 | 0.266 | 0.09 | |
| RVI | 0.522 | ||||||
- Building type vulnerability index to strong wind hazards

Table 13.
Evaluation of the vulnerability index of building types to violent wind hazards.
Table 13.
Evaluation of the vulnerability index of building types to violent wind hazards.
| Windstorm | ||||||||||||
|---|---|---|---|---|---|---|---|---|---|---|---|---|
| Roof Material | Roof Shape | Roof Slope | Length of Overhang | Elevation Material | Windows Type | Building Shape | Height of the Building | Windows Material | Construction Typology | Building Maintenance Status | ||
| KVA | Weight | 0.11 | 0.22 | 0.15 | 0.22 | 0.03 | 0.02 | 0.04 | 0.04 | 0.02 | 0.07 | 0.07 |
| Score | 0.7 | 0.2 | 0.2 | 0.4 | 0.5 | 0.4 | 0.2 | 0.2 | 0.4 | 0.5 | 0.5 | |
| Weight × Score | 0.077 | 0.044 | 0.03 | 0.088 | 0.015 | 0.008 | 0.008 | 0.008 | 0.008 | 0.035 | 0.035 | |
| RVI | 0.356 | |||||||||||
| NVA | Weight | 0.11 | 0.22 | 0.15 | 0.22 | 0.03 | 0.02 | 0.04 | 0.04 | 0.02 | 0.07 | 0.07 |
| Score | 0.7 | 0.2 | 0.2 | 0.4 | 0.1 | 0.4 | 0.2 | 0.2 | 0.4 | 0.1 | 0.5 | |
| Weight × Score | 0.077 | 0.044 | 0.03 | 0.088 | 0.003 | 0.008 | 0.008 | 0.008 | 0.008 | 0.007 | 0.035 | |
| RVI | 0.316 | |||||||||||
| CA | Weight | 0.11 | 0.22 | 0.15 | 0.22 | 0.03 | 0.02 | 0.04 | 0.04 | 0.02 | 0.07 | 0.07 |
| Score | 0.2 | 0.5 | 0.6 | 0.4 | 0.4 | 0.4 | 0.7 | 0.2 | 0.3 | 0.3 | 0.9 | |
| Weight × Score | 0.022 | 0.11 | 0.09 | 0.088 | 0.012 | 0.008 | 0.028 | 0.008 | 0.006 | 0.021 | 0.063 | |
| RVI | 0.456 | |||||||||||
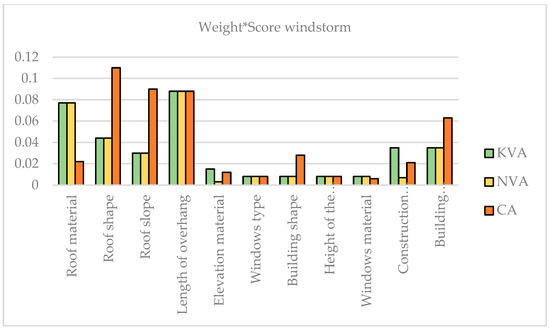
Figure 19.
Scoring of strong wind hazard indicators.
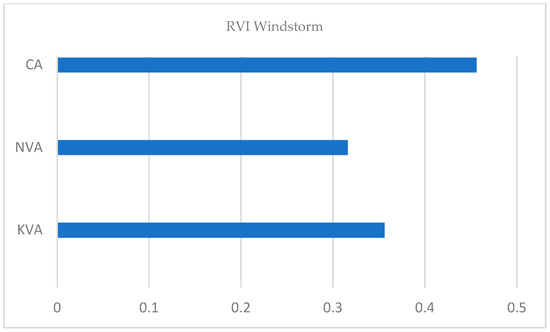
Figure 20.
Vulnerability index of building type to violent wind hazard.
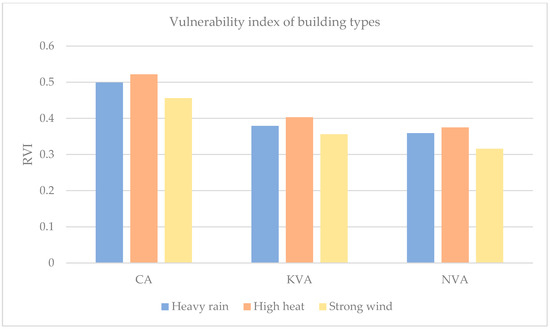
Figure 21.
Vulnerability index by type of building to climatic phenomena.
5. Discussions
Step 4: Considering Global Vulnerability to Climatic Hazards for Building Resilience
- Vulnerability to the hazard of heavy rain
Referring to Table 11, the vulnerability index for the heavy rain hazard is 0.499 for CA, 0.359 for NVA and 0.379 for KVA. This means that CA is the most vulnerable form of architecture to the hazard of heavy rain, unlike NVA, which is the least vulnerable form of architecture to this type of hazard. Figure 13 reveals that the indicators roof slope, roof shape, roof material and the state of maintenance of the building influence this vulnerability. Low-pitched roofs make it difficult to drain rainwater. These results are in agreement with the work of Sebastian Golz et al. [47], who have shown that the roof slope is an important parameter that influences the vulnerability of a construction to the risk of heavy rain, as it modifies the way rainwater flows or stagnates on the roof surface. Sebastian Golz et al. also explained that areas where a sloped roof intersects or covers are the most vulnerable to the hazard of heavy rain, as they are points of water infiltration inside buildings. Building vulnerability also heavily depends on the state of maintenance. According to Sebastian Golz et al., heavy rains cause only minimal damage to well-maintained buildings that do not have construction defects. The presence of construction defects and lack of maintenance are the main causes of damage following heavy rains. This idea is also shared by M.H. Spekkers et al. [45], whose work has shown that old buildings with a deterioration in construction materials are the most vulnerable to the risk of heavy rain. The material of the roof is a factor that also influences the vulnerability of the building to the risk of violent rain. According to M. Kherais et al. [56,57], the variation in humidity levels affects the wooden structures of the building. They argue that areas with a hot and humid climate, with temperatures exceeding 23 °C and relative humidity exceeding 42%, promote the proliferation of fungi in the wood. These fungi cause the wood to degrade, reduce its strength and rigidity, and alter its fracture behavior.
- Vulnerability to the high heat hazard
As shown in Table 12, the vulnerability index to the high heat hazard is 0.522 for CA, 0.375 for NVA and 0.403 for KVA. This explains why CA is also the most vulnerable form of architecture to the hazard of high heat, unlike NVA, which is the least vulnerable form of architecture to this type of hazard. Figure 15 reveals that the indicators building shape and roof materials influence this vulnerability. Whether the roof is made of plant material or metal, the high heat hazard leads to differential thermal variations, which are often the cause of internal forces likely to damage the structures. This observation on metal structures is in line with the heatwave hazard sheet of the “Bat-ADAPT” tool of the Sustainable Real Estate Observatory (OID), which explains that, under the effect of heat waves, metal components, particularly metal roofs, undergo expansion phenomena that can deteriorate their structure. As far as wooden structures are concerned, M. Kherais et al. [56,57] have proven through their work that temperature and humidity variations affect structures, in particular the wooden frameworks of the building. Through their work, they explain that the resistance of a structure or part of a wooden structure decreases when the air temperature exceeds 35 °C and its humidity level is less than 10%. Other authors, notably Ranta-Maunus [58], argue that continuous exposure to temperatures exceeding 60 °C leads to damage to wood materials and a decrease in their strength. The shape of the building is also an important parameter that influences its vulnerability to a high heat hazard. The work of M. Butera et al. [44] has shown that the compact configuration, precisely the circular shape, is the most suitable for reducing the surface area of the envelope subjected to solar rays.
- Vulnerability to strong wind hazards
As showed in Table 13, the vulnerability index to strong wind hazard is 0.456 for CA, 0.316 for NVA and 0.356 for KVA. This explains why CA is the most vulnerable form of architecture to the hazard of high heat, unlike NVA, which is the least vulnerable form of architecture to this type of hazard. Figure 18 reveals that the indicators roof material, roof shape, roof slope, roof overhang and state of maintenance of the building influence this vulnerability. These results are in agreement with the work of A. Keote et al. [50], who have shown that the architectural characteristics (shape and dimensions) of a building, its type of roof and the roof’s slope are important factors in assessing the maximum wind speed in the event of a collapse. For these authors, gable roofs are more vulnerable to strong wind hazards because of their large surface area exposed to uplift forces. At wind speeds above 38 m/s, gable roofs are prone to damage. Compared to exposed surfaces, steeply pitched conical or pyramidal roofs are subject to low uplift pressures and are therefore less vulnerable to this hazard. For Jagbir Singh et al. [59], when exposed to strong winds, roofs with a slope of 0–10° are subject to high pressures, whereas roofs with a slope of 15–20° are subject to moderate pressures and can be a good solution to improve the resistance to strong wind for rectangular constructions. These authors also demonstrated that roofs with steep slopes (30°, for example) are effective in resisting strong winds. Xiao-kun Jing et al. [51] explained that the characteristics of the roof, including the material, thickness and method of fastening, are factors that can compromise its resistance to strong winds. Xiao-kun Jing et al. also identified overhangs, roof corners and attachment points as critical areas that increase the vulnerability of buildings to high winds. This observation is also shared by the regional multi-hazard contingency plan of the Kara region [8], which considers the low-sloped roof as a factor that accentuates the vulnerability of the building. The state of maintenance is also an important influencing parameter to be taken into account in the vulnerability of buildings to the phenomenon of strong winds. Well-maintained buildings that do not have construction defects are the most resistant to climatic phenomena.
The study of the vulnerability of vernacular constructions in the Kara region (Table 14) reveals that CA, given its characteristics in terms of roof style (slope, shape and material of the roof) and building style (form and state of maintenance of the building), is the type of building most vulnerable to climate hazards (heavy rain, high heat and strong wind). When these weather events, such as heavy rain and strong winds, occur simultaneously or sequentially, they often create a cumulative vulnerability that differs from the simple sum of the vulnerability indexes of these two separate events. However, the resulting analysis of the overall vulnerability poses a technical challenge that cannot be solved using the approach taken in this study. Therefore, our study focuses on the vulnerability of each type of construction, calculating a relative vulnerability index, which is essentially an absolute score reflecting the element at risk confronted to the climatic phenomenon.

Table 14.
Vulnerability assessment of vernacular architecture in the Kara region using the PTVA method.
6. Significance, Limits and Future Developments of the Study
The study of the physical vulnerability of buildings to weather hazards, based on vulnerability indicators, is still in its infancy. It is therefore important to specify in our study the limitations we faced. One of the major limitations is the lack of measurement of the intensity of climatic hazards. The indicators developed for this study relate only to the characteristics of the element subject to climate risk and not to the climate risk itself. Characteristics such as intensity, variation over time or the occurrence of climatic hazards could not be defined in our study. More research is needed to improve the methodology in this regard. Dall’Osso [60] et al. took this parameter into account in their study on the analysis of the vulnerability of buildings to tsunamis. Another limitation concerns the choice and rating of indicators. Laboratory experiments can be used to better assess different parts of buildings and to refine the selection of indicators. To ensure the accuracy of the methodology over a wide area, the evaluation of indicators could involve a larger number of local participants and experts from different countries and fields. In addition, a greater number of indicators need to be taken into account, including those relating to the immediate surroundings of buildings, such as protection from dense vegetation or other structures, and the presence of moving objects in the immediate vicinity. It should also be noted that the simultaneous or successive effect of climatic phenomena generates a cumulative vulnerability that differs from the simple sum of the vulnerability index of these distinct climatic phenomena. The resulting analysis of the overall vulnerability is a technical challenge that cannot be solved by the approach taken in this study. Apart from these limitations, this study offers a few advantages that are worth mentioning in our article. Local populations, on the basis of the results of this study, can easily identify, according to the physical characteristics of their construction, the parts vulnerable to climatic hazards. They can also initiate work to strengthen these vulnerable parts at their level. This study can also guide local decision-makers to initiate construction projects that are resilient to climate hazards.
7. Conclusions
This study uses PTVA (Papathoma Tsunami Vulnerability Assessment), a multi-hazard analysis methodology based on indicators, to analyze the physical vulnerability of vernacular architecture in the Kara region to three types of climatic hazards (heavy rainfall, high winds and extreme temperatures). The calculation of the vulnerability index reveals that contemporary architecture, whatever the type of hazard considered, is the most vulnerable building model. The indicators that accentuate this vulnerability, whatever the type of construction, relate to characteristics such as roof style (slope, shape and material of the roof) and building style (shape and state of maintenance of the building). These building elements need to be carefully selected to improve the resilience of constructions to climatic phenomena. This study could therefore be of great importance to local decision-makers, enabling them to opt for solutions that reduce the vulnerability of future constructions while guaranteeing greater resilience. Local homeowners can also act directly on their buildings by reinforcing vulnerable parts such as the roof. In this respect, CA can draw inspiration from the technical options, in terms of roof style or building style, developed by KVA and NVA to reduce its vulnerability. These technical options should also draw on green technologies to create safer, more resilient living environments tailored to the needs of today’s social groups.
Author Contributions
Conceptualization, M.Y.A. and E.K.A.D.; methodology, M.Y.A., E.K.A.D. and Y.D.; software, M.Y.A. and E.K.A.D.; formal analysis, Y.D. and P.V.G.; investigation, M.Y.A., D.K.G. and E.K.A.D.; resources, M.Y.A., D.K.G.; data curation, M.Y.A.; writing—original draft preparation, M.Y.A. and E.K.A.D.; writing—review and editing, M.Y.A., Y.D. and E.K.A.D.; visualization, M.Y.A. and E.K.A.D.; supervision, Y.D. and P.V.G. All authors have read and agreed to the published version of the manuscript.
Funding
This work was supported by the World Bank through the Regional Center of Excellence on Sustainable Cities in Africa (CERViDA-DOUNEDON), funding number IDA 5360 TG.
Data Availability Statement
Data are contained within the article.
Acknowledgments
The authors would like to thank the World Bank and the University of Lomé (UL) via the Regional Center of Excellence for Sustainable Cities in Africa (CERViDA-DOUNEDON) for their financial contributions and scientific supervision.
Conflicts of Interest
The authors declare no conflict of interest.
References
- Cutter, S.L.; Boruff, B.J.; Shirley, W.L. Social Vulnerability to Environmental Hazards. Soc. Sci. Q. 2003, 84, 242–261. [Google Scholar] [CrossRef]
- CRED. 2023_EMDAT_Annual Reports; CRED: Bengaluru, India, 2023; Available online: https://files.emdat.be/reports/2023_EMDAT_report.pdf (accessed on 13 October 2024).
- Le Monde. L’Été 2023 a Été le Plus Chaud Jamais Mesuré dans le Monde, Selon l’Observatoire Européen Copernicus. 2023. Available online: https://www.lemonde.fr/planete/article/2023/09/06/l-ete-2023-a-ete-le-plus-chaud-jamais-mesure-dans-le-monde-selon-l-observatoire-europeen-copernicus-l-effondrement-climatique-a-commence-affirme-le-secretaire-general-des-nations-unies_6188057_3244.html (accessed on 12 October 2024).
- Stocker, T.F.; Qin, D.; Plattner, G.-K.; Tignor, M.M.B.; Allen, S.K.; Boschung, J.; Nauels, A.; Xia, Y.; Bex, V.; Midgley, P.M. Contribution du Groupe de Travail I au Cinquième Rapport d’Évaluation du Groupe d’Experts Intergouvernemental sur l’Évolution du Climat. Available online: https://www.climate-chance.org/bibliotheque/5eme-rapport-devaluation-les-elements-scientifiques-resume-a-lintention-des-decideurs/ (accessed on 14 October 2024).
- Centre Climatique Régional Afrique de l’Ouest et Sahel—AGRHYMET CCR-AOS Note Spéciale sur la Situation des Inondations au Sahel, No. 1 Août 2024. 2024. Available online: https://agrhymet.cilss.int/2024/08/22/note-speciale-sur-la-situation-des-inondations-au-sahel/ (accessed on 14 October 2024).
- Republique Togolaise. Première Communication Relative à l’Adaptation aux Changements Climatiques au Togo 2023. Available online: https://unfccc.int/sites/default/files/ACR/2023-08/togo-ad-comm-fr.pdf (accessed on 15 October 2024).
- Republique Togolaise. Ministère de la Santé Plan National d’Adaptation du Secteur de la Sante aux Effets des Changements Climatiques (PNAS). 2011. Available online: https://www.giz.de/en/downloads/plan-national-dadaptation-dusecteur-de-la-sante.pdf (accessed on 16 October 2024).
- ANPC TOGO. Plan Regional de Contingence Multirisques: Region de la Kara. Available online: https://anpctogo.tg/plans/ (accessed on 30 September 2024).
- Greiving, S.; Fleischhauer, M.; Lückenkötter, J. A Methodology for an Integrated Risk Assessment of Spatially Relevant Hazards. J. Environ. Plan. Manag. 2006, 49, 1–19. [Google Scholar] [CrossRef]
- Aawi, P. Contribution à l’Étude de la Vulnérabilité de l’Agriculture dans le Nord du Togo. Le Cas de la Préfecture de la Kozah. Ph.D. Thesis, Université de Lomé (UL), Lomé, Togo, 2012. [Google Scholar]
- Bilabena, S.; Anika, E.K.; Ekoue, A.G.; Agbekodo, E.S.; Kossi-Titrikou, K. Le Vecu des Changements Climatiques dans la Communaute Rurale d’Ekpui dans le Sud-Est du Togo. Available online: https://revues.acaref.net/wp-content/uploads/sites/3/2022/04/Salamatou-BILABENA-TITRIKOOU-KOMI.pdf (accessed on 16 October 2024).
- Coffi, S.V.E.L.S. Vulnérabilité de la Production du Manioc aux Changements Climatiques et Priorité d’adaptation dans les Agglomérations Frontalières Benin Togo (Vallée Du Mono, Afrique de l’ouest). EPRA Int. J. Res. Dev. IJRD 2023, 7, 1. [Google Scholar]
- Jans, N.; Laurent, P.-J.; Leneer, P.D.; Henin, V. Impact du Changement Climatique sur les Agriculteurs du Nord du Togo, et les Adaptations de Ceux-ci Face à ce Changement. Available online: https://louvaincooperation.org/sites/default/files/2020-08/132.MEMOIRE%20DERNIERE%20VERSION%20RAFIA%20LC..pdf (accessed on 16 October 2024).
- Edjame, K. Approche Géophysique de Définition du Climat du Littoral Océanique et du Bas-Togo. 2011. Available online: https://www.revues-ufhb-ci.org/fichiers/FICHIR_ARTICLE_1169.pdf (accessed on 16 October 2024).
- Gbafa, K.S.; Tiem, S.; Kokou, K. Characterization of Rainwater Drainage Infrastructure in the City of Lomé (Togo, West Africa). Eur. Sci. J. ESJ 2017, 13, 478. [Google Scholar] [CrossRef][Green Version]
- FAOLEX. Plan National d’Adaptation aux Changements Climatiques du Togo (PNACC). 2018. Available online: https://www.fao.org/faolex/results/details/fr/c/LEX-FAOC192045/ (accessed on 16 October 2024).
- Ministère de l’Environnement et des Ressources Forestières. Plan d’Action National d’Adaptation aux Changements Climatiques (PANA). Available online: https://faolex.fao.org/docs/pdf/Tog184779.pdf (accessed on 27 September 2024).
- Kappes, M.S.; Papathoma-Köhle, M.; Keiler, M. Assessing Physical Vulnerability for Multi-Hazards Using an Indicator-Based Methodology. Appl. Geogr. 2012, 32, 577–590. [Google Scholar] [CrossRef]
- Kappes, M.; Keiler, M.; Glade, T. From Single- to Multi-Hazard Risk Analyses: A Concept Addressing Emerging Challenges. In Proceedings of the International Conference Mountain Risks: Bringing Science to Society, Firenze, Italy, 24–26 November 2010; p. 356. Available online: https://www.researchgate.net/publication/260692785_From_Single-_to_Multi-Hazard_Risk_analyses_a_concept_addressing_emerging_challenges (accessed on 14 October 2024).
- Marzocchi, W.; Mastellone, M.L.; Di Ruocco, A.; Novelli, P.; Roméo, E.; Gasparini, P. Principles of Multi-Risk Assessment: Interaction Amongst Natural and Man-Induced Risks|PDF|Risk|Hazards. Available online: https://www.scribd.com/document/616732015/DOC-2 (accessed on 14 October 2024).
- Papathoma-Köhle, M.; Schlögl, M.; Garlichs, C.; Diakakis, M.; Mavroulis, S.; Fuchs, S. A Wildfire Vulnerability Index for Buildings. Sci. Rep. 2022, 12, 6378. [Google Scholar] [CrossRef] [PubMed]
- Papathoma-Köhle, M.; Kappes, M.; Keiler, M.; Glade, T. Physical Vulnerability Assessment for Alpine Hazards: State of the Art and Future Needs Future Needs. Natural Hazards. Nat. Hazards 2012, 58, 645–680. [Google Scholar] [CrossRef]
- Birkmann, J. Indicators and Criteria for Measuring Vulnerability: Theoretical Bases and Criteria. In Measuring Vulnerability to Natural Hazards; UNU-Press: Tokyo, Japan, 2006. [Google Scholar]
- Menoni, S.; Delmonaco, G.; Galderisi, A.; Ceudech, A. Harmonised Hazard, Vulnerability and Risk Assessment Methods Informing Mitigation Strategies Addressing Land-Use Planning and Management. 2006. Available online: https://www.academia.edu/72885534/Harmonised_hazard_vulnerability_and_risk_assessment_methods_informing_mitigation_strategies_addressing_land_use_planning_and_management (accessed on 18 October 2024).
- Collins, T.W.; Grineski, S.E.; de Lourdes Romo Aguilar, M. Vulnerability to Environmental Hazards in the Ciudad Juárez (Mexico)–El Paso (USA) Metropolis: A Model for Spatial Risk Assessment in Transnational Context. Appl. Geogr. 2009, 29, 448–461. [Google Scholar] [CrossRef]
- Granger, K.; Jones, T.; Leiba, M.; Scott, G. Community Risk in Cairns: A Multi-Hazard Risk Assessment. Aust. J. Emerg. Manag. 1999, 14, 25–26. [Google Scholar]
- Puissant, A.; Malet, J.; Maquaire, O. Mapping Landslide Consequences in Mountain Areas: A Tentative Approach with a Semi-Quantitative Procedure. 11 September 2006. Available online: https://www.semanticscholar.org/paper/Mapping-landslide-consequences-in-mountain-areas%3B-a-Puissant-Malet/46f7af7f48af364fa6323115410086a7e3999e93 (accessed on 18 October 2024).
- Papathoma-Köhle, M.; Dominey-Howes, D. Tsunami Vulnerability Assessment and Its Implications for Coastal Hazard Analysis and Disaster Management Planning, Gulf of Corinth, Greece. Nat. Hazards Earth Syst. Sci. 2003, 3, 733–747. [Google Scholar] [CrossRef]
- Papathoma-Köhle, M.; Schlögl, M.; Fuchs, S. Vulnerability Indicators for Natural Hazards: An Innovative Selection and Weighting Approach. Sci. Rep. 2019, 9, 15026. [Google Scholar] [CrossRef] [PubMed]
- Papathoma-Köhle, M.; Ghazanfari, A.; Mariacher, R.; Huber, W.; Lücksmann, T.; Fuchs, S. Vulnerability of Buildings to Meteorological Hazards: A Web-Based Application Using an Indicator-Based Approach. Appl. Sci. 2023, 13, 6253. [Google Scholar] [CrossRef]
- l’Institut National de la Statistique et des Études Économiques et Démographiques (INSEED) Résultats Finaux du 5e Recensement Général de la Population et de l’Habitat (RGPH-5) de Novembre 2022. Available online: https://inseed.tg/depliant-et-communique-rgph/ (accessed on 26 September 2024).
- Tata, P.K. Approche Sociologique des Causes Internes du sous-Développement: La Politique de «l´Authenticité Africaine » et Paupérisation—Cas des Cérémonies Funéraires Traditionnelles des Kabiyè au Togo. Available online: https://www.researchgate.net/publication/283658049_APPROCHE_SOCIOLOGIQUE_DES_CAUSES_INTERNES_DU_SOUS_DEVELOPPEMENT_LA_POLITIQUE_DE_L_AUTHENTICITE_AFRICAINE_ET_PAUPERISATION_-_CAS_DES_CEREMONIES_FUNERAIRES_TRADITIONNELLES_DES_KABIYE_AU_TOGO (accessed on 28 September 2024).
- Caimi, A. Cultures Constructives Vernaculaires et Résilience: Entre Savoir, Pratique et Technique: Appréhender le Vernaculaire en Tant que Génie du Lieu et Génie Parasinistre. Version 1. Ph.D. Thesis, Université de Grenoble, Grenoble, France, 2014. Available online: https://theses.hal.science/tel-01148207 (accessed on 25 September 2024).
- Chamodot, M.C.; Cloquet, B. Modes d’Habiter, Cultures Constructives et Habitat de Demain au Pays Dogon; Version 1; Architecture, Aménagement de l’Espace. Master’s Thesis, École Nationale Supérieure d’Architecture de Grenoble, Grenoble, France, 2008. Available online: https://dumas.ccsd.cnrs.fr/dumas-03196898 (accessed on 25 September 2024).
- Gayibor, N.L.; Barbier, J.-C.; Marguerat, Y. Le Peuplement du Togo: État Actuel des Connaissances Historiques; Universite du Benin: Lome, Togo, 1996; Available online: https://horizon.documentation.ird.fr/exl-doc/pleins_textes/divers19-12/010009851.pdf (accessed on 3 September 2024).
- Sauvaget, C. Boua, Village de Koude, un Terroir Kabye (Togo Septentrional) [Etude d’Une Petite Region: Environnement Physique, Population, Agriculture, Migrations]. 1981. Available online: https://agris.fao.org/search/en/providers/123819/records/64735c2c53aa8c896308d258 (accessed on 3 September 2024).
- Moriset, S. Entretien des Sikien (Togo, Koutammakou): Cahier de Recommandations; CRAterre; Gouvernement de la Norvège; UNESCO; DPC-Togo; Ecole du Patrimoine Africain; Ecole Africaine des Métiers de l’Architecture et de l’Urbanisme; Version 1; Centre de la Construction et du Logement de Cacavéli: Lome, Togo, 2022; ISBN hal-03550868. Available online: https://hal.science/hal-03550868 (accessed on 28 September 2024).
- Tcham, B. Mythes d’Autochtonie et Histoire: Le Cas des Nawdeba. Available online: http://greenstone.lecames.org/cgi-bin/library?e=d-01000-00---off-0revu--00-1--0-10-0---0---0prompt-10---4-------0-0l--11-hi-50---20-about---01-2-1-00-0-0-11-1-0windowsZz-1253-00&a=d&c=revu&cl=CL2.15.9 (accessed on 29 September 2024).
- Fleury, F.; Arab, N.; Kabra, L.S. Les impacts du changement climatique sur l’architecture dans la Métropole Rouen Normandie. Rapport du GIEC Local pour la Métropole Rouen Normandie. Available online: https://shs.hal.science/halshs-03562554v1 (accessed on 21 October 2024).
- Koungbanane, D.; Zahiri, E.-P.; Sourou, H.; Totin Vodounon, H.; Amoussou, E.; Lare, L.; Djan, H.; Koubodana, N. Analyse Fréquentielle et Détermination des Seuils Pluvio-Hydrologiques de Risques d’Inondation dans le Bassin-Versant de l’Oti au Togo. 2020. Available online: https://www.researchgate.net/publication/363535702_Analyse_frequentielle_et_determination_des_seuils_pluvio-hydrologiques_de_risques_d’inondation_dans_le_bassin-versant_de_l’Oti_au_Togo (accessed on 22 October 2024).
- Joffroy, T.; Misse, A.; Celaire, R.; Rakotomalala, L. Architecture Bioclimatique et Efficacité Énergétique des Bâtiments au Sénégal; Version 1; CRAterre: Villefontaine, France, 2017; ISBN hal-02025559. Available online: https://hal.science/hal-02025559 (accessed on 26 September 2024).
- Hakimi, A.; Ouissi, H.; El kortbi, M.; Yamani, N. A Wetting-Drying Test for Cement-Stabilised Compressed Earth Blocks. Mater. Struct. 1998, 31, 20–26. [Google Scholar] [CrossRef]
- Givoni, B.; Hoffman, M.E. Effect of Building Materials on Internal Temperatures. 1968. Available online: https://search.worldcat.org/title/Effect-of-building-materials-on-internal-temperatures/oclc/9245620 (accessed on 23 October 2024).
- Butera, F.; Adhikari, R.; Aste, N. Conception Architecturale Durable en Milieu Tropical Principes et Applications Pour l’Afrique de l’Est. 2015. Available online: https://www.researchgate.net/publication/304538583_CONCEPTION_ARCHITECTURALE_DURABLE_EN_MILIEU_TROPICAL_Principes_et_applications_pour_l%27Afrique_de_l%27Est (accessed on 23 October 2024).
- Spekkers, M.H.; Kok, M.; Clemens, F.H.L.R.; ten Veldhuis, J.A.E. Decision-Tree Analysis of Factors Influencing Rainfall-Related Building Structure and Content Damage. Nat. Hazards Earth Syst. Sci. 2014, 14, 2531–2547. [Google Scholar] [CrossRef]
- Tirak Hizal, K. Species and Deterioration of Woods Used in a Traditional Turkish House. BioResources 2023, 19, 872–885. [Google Scholar] [CrossRef]
- Golz, S.; Naumann, T.; Neubert, M.; Günther, B. Heavy Rainfall: An Underestimated Environmental Risk for Buildings? E3S Web Conf. 2016, 7, 08001. [Google Scholar] [CrossRef]
- Salagnac, J.L.; Dorothée, M.; Florence, C.; Delpech, P.; Axès, J.-M. CSTB—Impacts des Inondations sur le Cadre Bâti et ses Usagers, Rapport Final. 2014. Available online: https://www.researchgate.net/publication/278629997_CSTB_-_Impacts_des_inondations_sur_le_cadre_bati_et_ses_usagers_rapport_final (accessed on 23 October 2024).
- Vutukuru, K.S.; Moravej, M.; Elawady, A.; Chowdhury, A.G. Holistic Testing to Determine Quantitative Wind-Driven Rain Intrusion for Shuttered and Impact Resistant Windows. J. Wind. Eng. Ind. Aerodyn. 2020, 206, 104359. [Google Scholar] [CrossRef]
- Keote, S.; Singh, R.; Kumar, D. Construction of Low Rise Buildings in Cyclone Prone Areas and Modification of Cyclone. J. Energy Power Sources 2015, 2, 247–252. [Google Scholar]
- Jing, X.; Li, Y. Wind Tunnel Tests for Wind Pressure Distribution on Gable Roof Buildings. Sci. World J. 2013, 2013, 396936. [Google Scholar] [CrossRef] [PubMed]
- Mironova, J. Wind Impact on Low-Rise Buildings When Placing High-Rises into the Existing Development. IOP Conf. Ser. Mater. Sci. Eng. 2020, 890, 012055. [Google Scholar] [CrossRef]
- Minor, J.E. Lessons Learned from Failures of the Building Envelope in Windstorms. J. Archit. Eng. 2005, 11, 10–13. [Google Scholar] [CrossRef]
- Ginger, J.; Henderson, D.; Holmes, J.; Edwards, M. Housing Damage in Windstorms and Mitigation for Australia. Int. Assoc. Wind. Eng. 2010, 2020, 1–18. [Google Scholar]
- Saaty, R.W. The Analytic Hierarchy Process—What It Is and How It Is Used. Math. Model. 1987, 9, 161–176. [Google Scholar] [CrossRef]
- Kherais, M.; Csébfalvi, A.; Len, A. Moisture Content Changing of a Historic Roof Structure in Terms of Climate Effects. Pollack Period. 2022, 17, 141–146. [Google Scholar] [CrossRef]
- Kherais, M.; Csébfalvi, A.; Len, A.; Fülöp, A.; Pál-Schreiner, J. The Effect of Moisture Content on the Mechanical Properties of Wood Structure. Pollack Period. 2024, 19, 41–46. [Google Scholar] [CrossRef]
- Ranta-Maunus, A. Effects of Climate and Climate Variations on Strength. In Timber Engineering; Thelandersson, S., Larsen, H., Eds.; John Wiley & Sons Ltd.: West Sussex, England, 2003; pp. 153–167. Available online: https://www.wiley.com/en-us/Timber+Engineering-p-9780470844694 (accessed on 23 October 2024).
- Singh, J.; Roy, A.K. Effects of Roof Slope and Wind Direction on Wind Pressure Distribution on the Roof of a Square Plan Pyramidal Low-Rise Building Using CFD Simulation. Int. J. Adv. Struct. Eng. 2019, 11, 231–254. [Google Scholar] [CrossRef]
- Dall’Osso, F.; Gonella, M.; Gabbianelli, G.; Withycombe, G.; Dominey-Howes, D. A Revised (PTVA) Model for Assessing the Vulnerability of Buildings to Tsunami Damage. Nat. Hazards Earth Syst. Sci. 2009, 9, 1557–1565. [Google Scholar] [CrossRef]
Disclaimer/Publisher’s Note: The statements, opinions and data contained in all publications are solely those of the individual author(s) and contributor(s) and not of MDPI and/or the editor(s). MDPI and/or the editor(s) disclaim responsibility for any injury to people or property resulting from any ideas, methods, instructions or products referred to in the content. |
© 2025 by the authors. Licensee MDPI, Basel, Switzerland. This article is an open access article distributed under the terms and conditions of the Creative Commons Attribution (CC BY) license (https://creativecommons.org/licenses/by/4.0/).