Abstract
Traditional damage detection methods of prestressed concrete box girder bridges have low efficiency and cannot quantify the structure’s internal damage. We used an inversion method and a falling weight deflectometer to estimate the mechanical parameters of prestressed box girder bridges. A finite element model of the bridge dynamics under impact loading was established. A perturbation-based update was conducted, and a multi-parameter inversion algorithm was constructed. The measured data were used for the efficient identification of the bridge’s elasticity modulus and the prestressing tensile force. The theoretical validation indicated a high modeling accuracy and inversion efficiency, with a convergence accuracy within 1%. The initial value had a minimal influence on the inversion results. The engineering application showed that the maximum error of the elastic modulus between the inversion and the rebound methods was 1.55%. The loss rates of the deck slab’s elastic modulus and the prestressing force obtained from the inversion were 4.39% and 7.64%, respectively. The proposed method provides a new strategy for evaluating damage to prestressed box girder bridges.
1. Introduction
Prestressed concrete (PC) box girder bridges are a core component of modern transportation infrastructure due to their excellent load-bearing performance and large span range. The number of highway bridges in China was 1,079,300 at the end of 2023, with a length of 95,288,200 linear meters, ranking first in the world [1]. Prestressed box girder bridges are important types of modern bridges due to their many advantages, such as their fast construction speed, wide span range, low cost, and environmental protection [2]. However, as the bridges’ service life and traffic load increase, they become prone to the cracking of the bridge body, deflection in the middle of the span, and the loss of prestressing force. Studies have shown that the stiffness degradation caused by early damage and prestressing failure results in a vicious cycle, threatening the bridges’ safe operation [3]. Traditional inspection methods, such as dynamic and static load tests, have a low efficiency and high costs and interfere with traffic. Nondestructive testing techniques, such as ultrasonic wave analysis, are not suitable for quantitative damage assessment [4]. Therefore, a rapid and accurate identification method for the structural mechanical parameters is required to improve bridge health monitoring.
The dynamic response testing of bridge structures has become a hot research topic in China and internationally [5,6]. Environmental vibration testing has been widely used for structural health inspections. This method involves the excitation of the structure using natural conditions and is a convenient test method. Zeng et al. [7] proposed a method using the distributed strain modal difference as a damage indicator to identify multiple damage areas on the main box girders of cable-stayed bridges. They analyzed the influence of environmental vibration and used statistical trend analysis and a probabilistic confidence criterion [8]. However, this method suffered from a low level of randomness and an inability to control the excitation energy [9], making it difficult to obtain the bridge’s higher-order vibration modal characteristics. Thus, the method’s accuracy and sensitivity in structural parameter identification were insufficient for complex working conditions. Therefore, scholars used the vehicle load as an excitation source to identify bridge damage based on the vibration response. Qi et al. [10] identified the dynamic characteristics of PC box girder bridges using vehicle vibration responses. They established a constraint equation to simulate the coupled vibration of the vehicles and the bridge. The first three orders of frequency information were extracted using the Fourier transform, enabling the accurate identification of the bridge’s dynamic characteristics. Kunaratnam et al. [11] proposed a time-domain method to determine the reaction force of PC box girder bridges using moving load identification. They established load shape functions using Lagrange polynomial interpolation, significantly reducing the computational effort and improving the accuracy of identifying the prestressing and moving load. Shock vibration testing is another widely adopted vibration testing method for structural health monitoring. A transient shock load is applied to the bridge, and the dynamic responses are obtained to identify damage [12]. The falling weight deflectometer (FWD) is a widely used non-destructive road testing and evaluation device. It simulates moving loads and has a high speed and accuracy. Researchers have recently used it for bridge inspections. Huang et al. [13] utilized an FWD for the rapid detection of transverse link damage and to estimate transverse stiffness by measuring the dynamic displacement and using finite element modeling. Onishi et al. [14] conducted an impact dynamic test on a concrete bridge using an FWD to determine the relationship between the acceleration and the measured displacements at the test locations and external points. They evaluated the effectiveness of the FWD for the quantitative characterization of bridge performance and condition. However, this technique has several shortcomings in applied research, especially for prestressed box girder bridges, and its applicability for assessing damage to the deck slab and entire bridge and the loss of the prestressing force has not been sufficiently verified.
Structural parameter inversion is a critical research direction in bridge health monitoring. It is used to invert the key structural parameters using mechanical response data. Since its development in the 1970s, forward and inverse analyses have been used, resulting in two technical routes: an analytical method and a numerical method. The analytical method is applicable to simple structures, whereas the numerical method has become the mainstream means of identifying the structural parameters of complex bridges due to its versatility [15].
Artificial neural networks and intelligent optimization algorithms are widely used to correct parameters in analytical models due to their strong function approximation capacity. Attalla et al. [16] systematically investigated artificial neural networks for the parameter correction of models of structural dynamics. They focused on structural model parameter optimization and found that artificial neural networks’ strong learning and nonlinear mapping abilities made them suitable for engineering parameter correction. Ataeid et al. [17] utilized an artificial neural network algorithm for structural parameter inversion to analyze the responses of a single-span railroad bridge. They established a multilayer perceptron model to predict the bridge’s dynamic response under known loads. Cui [18] used static load test data and a hybrid optimization algorithm consisting of a genetic algorithm and a neural network to estimate the bending stiffness of beam and bridge segments. The method was used to identify the structural parameters of in-service reinforced concrete bridges and assess their damage. Jung et al. [19] proposed a hybrid genetic algorithm (HGA) to optimize the parameters of a bridge’s finite element model. It combined the global optimization ability of the genetic algorithm with the local search characteristics of the improved Nelder–Mead simplex method. The researchers identified the bridge’s structural stiffness and mass by establishing an objective function. However, this method requires a high data volume, a long training time, and significant computational resources. Many data points are required for the iteration, resulting in low computational efficiency. The parameter correction method is applicable to improve the above methods. It iteratively corrects the model parameters by calculating the sensitivity matrix between the structural responses and the design parameters to minimize the objective function. Matthew et al. [20] proposed a finite element model correction method based on frequency domain decomposition (FDD) and ambient vibration testing. This approach utilizes the modal characteristics of prestressed box girder bridges for identification and model correction to invert the bridge’s damage parameters efficiently. Lin et al. [21] proposed an objective function incorporating frequency and vibration mode correlation, a real number-coded genetic algorithm, and an environmentally excited modal test to optimize the finite element model of prestressed box girder bridges. The accuracy of the modified model was confirmed by validating the higher-order modal parameters. The method proved reliable for bridge damage analysis. However, since the model correction involves complex optimization calculations, it remains a crucial challenge to construct an effective objective function to describe the structural damage characteristics accurately and select appropriate parameters for model updating to ensure the effective identification of structural damage [22].
This study proposes a mechanical parameter inversion method for prestressed box girder bridges using an FWD. A dynamic finite element model of the bridge under impact loading is established. A perturbation-based update is conducted to perform parameter optimization, and the FWD data are used to identify the bridge’s structural mechanical parameters. The objectives are to (1) establish a dynamic finite element model of prestressed box girder bridges, (2) develop a multi-parameter inversion algorithm that uses robust initial values to identify the parameters systematically, and (3) provide a new nondestructive test method using parameter inversion to estimate bridge parameters in practical applications.
2. Finite Element Simulation of Prestressed Box Girder Bridge
2.1. Overview of Objectives
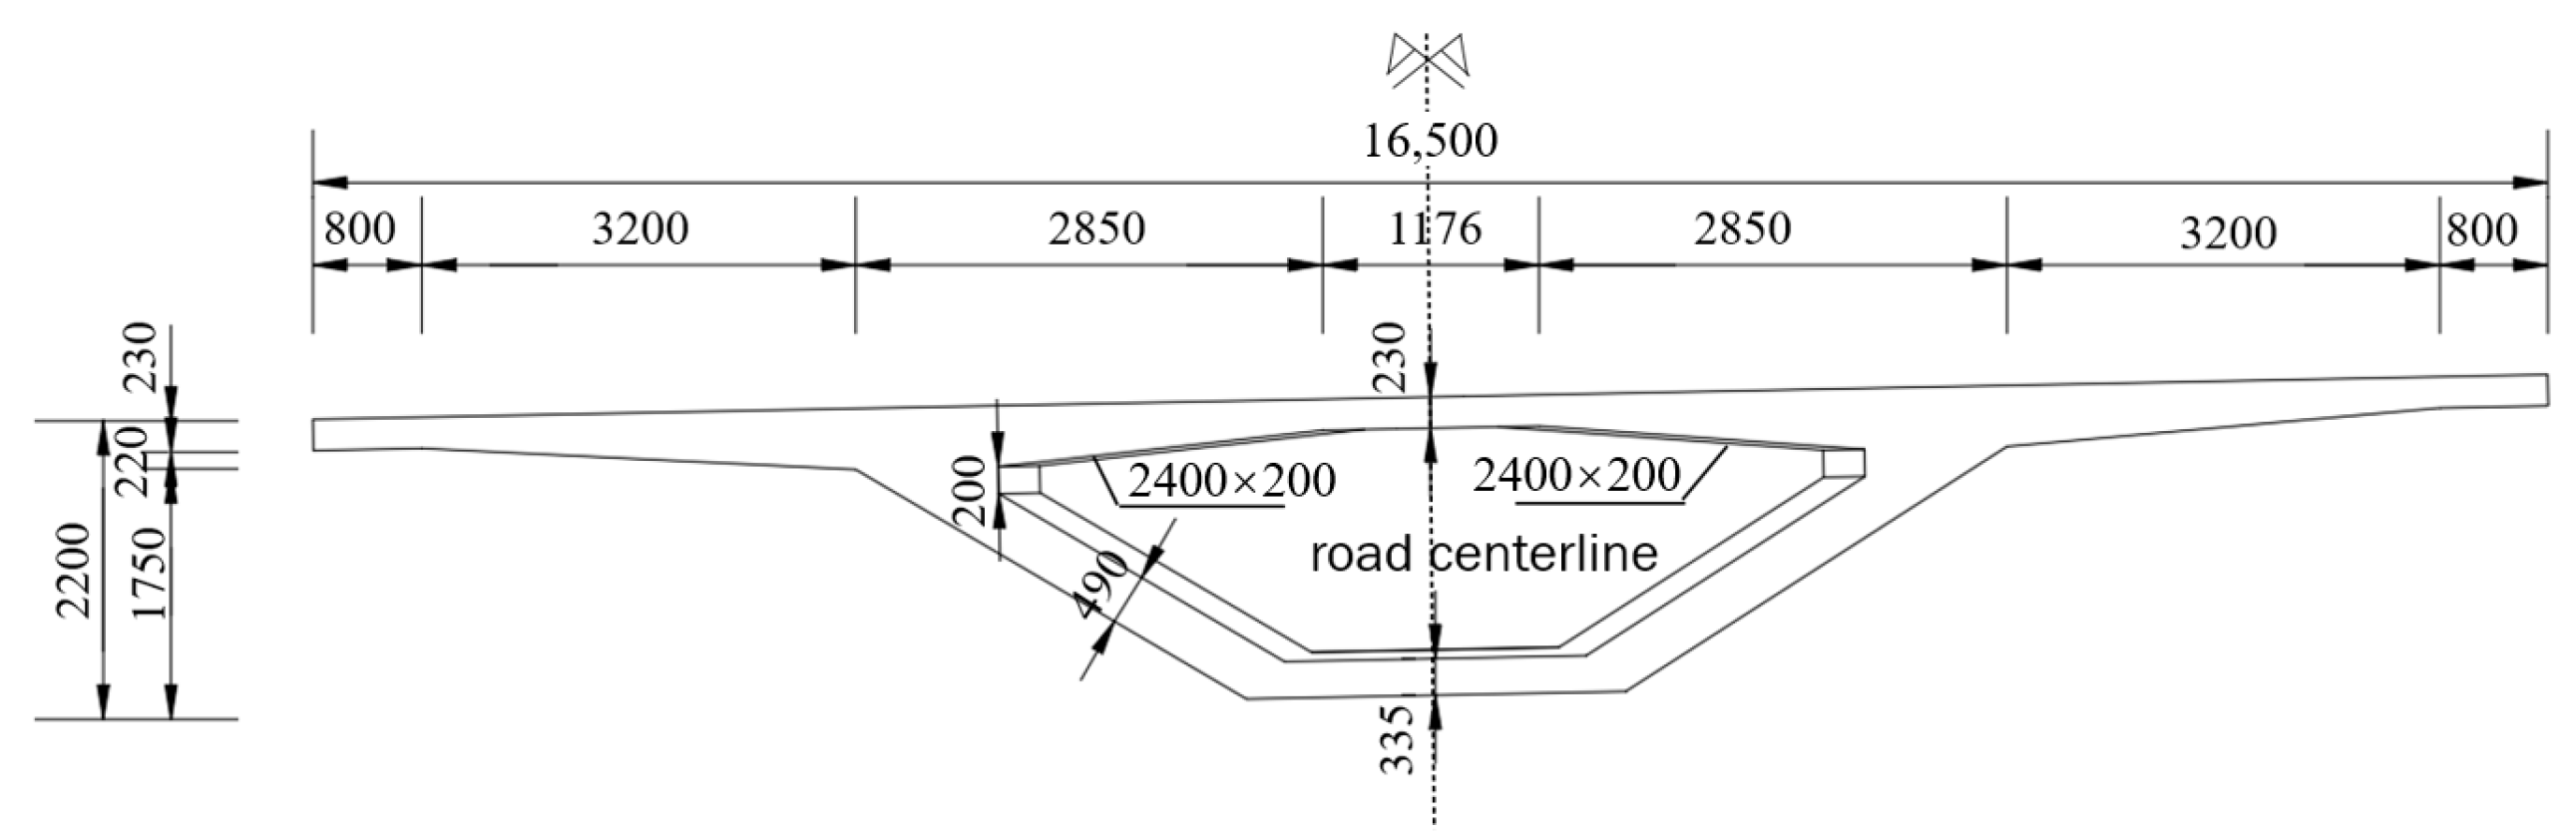
A one-link, three-span-girder, equal-cross-section prestressed box girder bridge was used as an example. The pile identification numbers are designated as 14Z015 to 14Z018. The length of the side span and the middle span was 43 m. The middle and side piers of the main girder and the top of pier No.0 were cast in place, and the middle and side spans consisted of 14 precast blocks, which were precast with C60 concrete. The main girder was a prestressed box girder with a single box, a single chamber, and an equal-beam-height inclined web. The width of the single box girder was 16.5 m, the width of the bottom plate was 2.8 m, the length of the cantilever was 4.0 m, and the height of the box girder was 2.2 m. The precast sections consisted of transition and standard sections. There were two 2.9 m long transition sections near the top of the pier. The first transition section had a web thickness of 0.6 m transitioning to 0.49 m, a bottom plate thickness of 0.4 m transitioning to 0.335 m, and a top plate thickness of 0.23 m. The second transition section had a web thickness of 0.49 m transitioning to 0.38 m, a bottom plate thickness of 0.335 m transitioning to 0.27 m, and a top plate thickness of 0.23 m. The length of the standard sections was 2.9 m, the length of the cantilever was 4.0 m, and the height of the box girder was 2.2 m. The prefabricated sections consisted of transition and standard sections. The length of the standard section was 2.9 m and 2.4 m, the thickness of the web was 0.38 m, the thickness of the bottom plate was 0.27 m, and the thickness of the top plate was 0.23 m. The box girder had a longitudinal and transverse bi-directional prestressing system. The longitudinal systems were prestressed, and the transverse systems had a class B prestressing design. The prestressed strand was 21φs 5.2, 19φs 15.2, 17φs 15.2, 12φs 15.2, and 17φs 15.2, and the thickness of the top plate was 0.23 m. The box girder had a longitudinal and transverse two-way prestressing system. The tensioning under the anchors was 1395 (1305) MPa, and the joints were made of epoxy resin and densely coated built-up key teeth. The specific structural layout of the bridge is shown in Figure 1 and Figure 2.
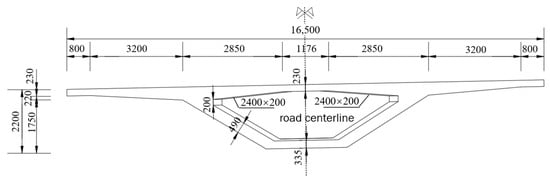
Figure 1.
Main girder mid-span cross-section layout (unit: mm).
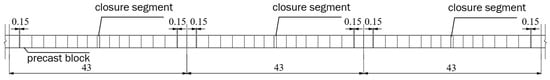
Figure 2.
Section girder bridge profile (unit: m).
2.2. Finite Element Simulation
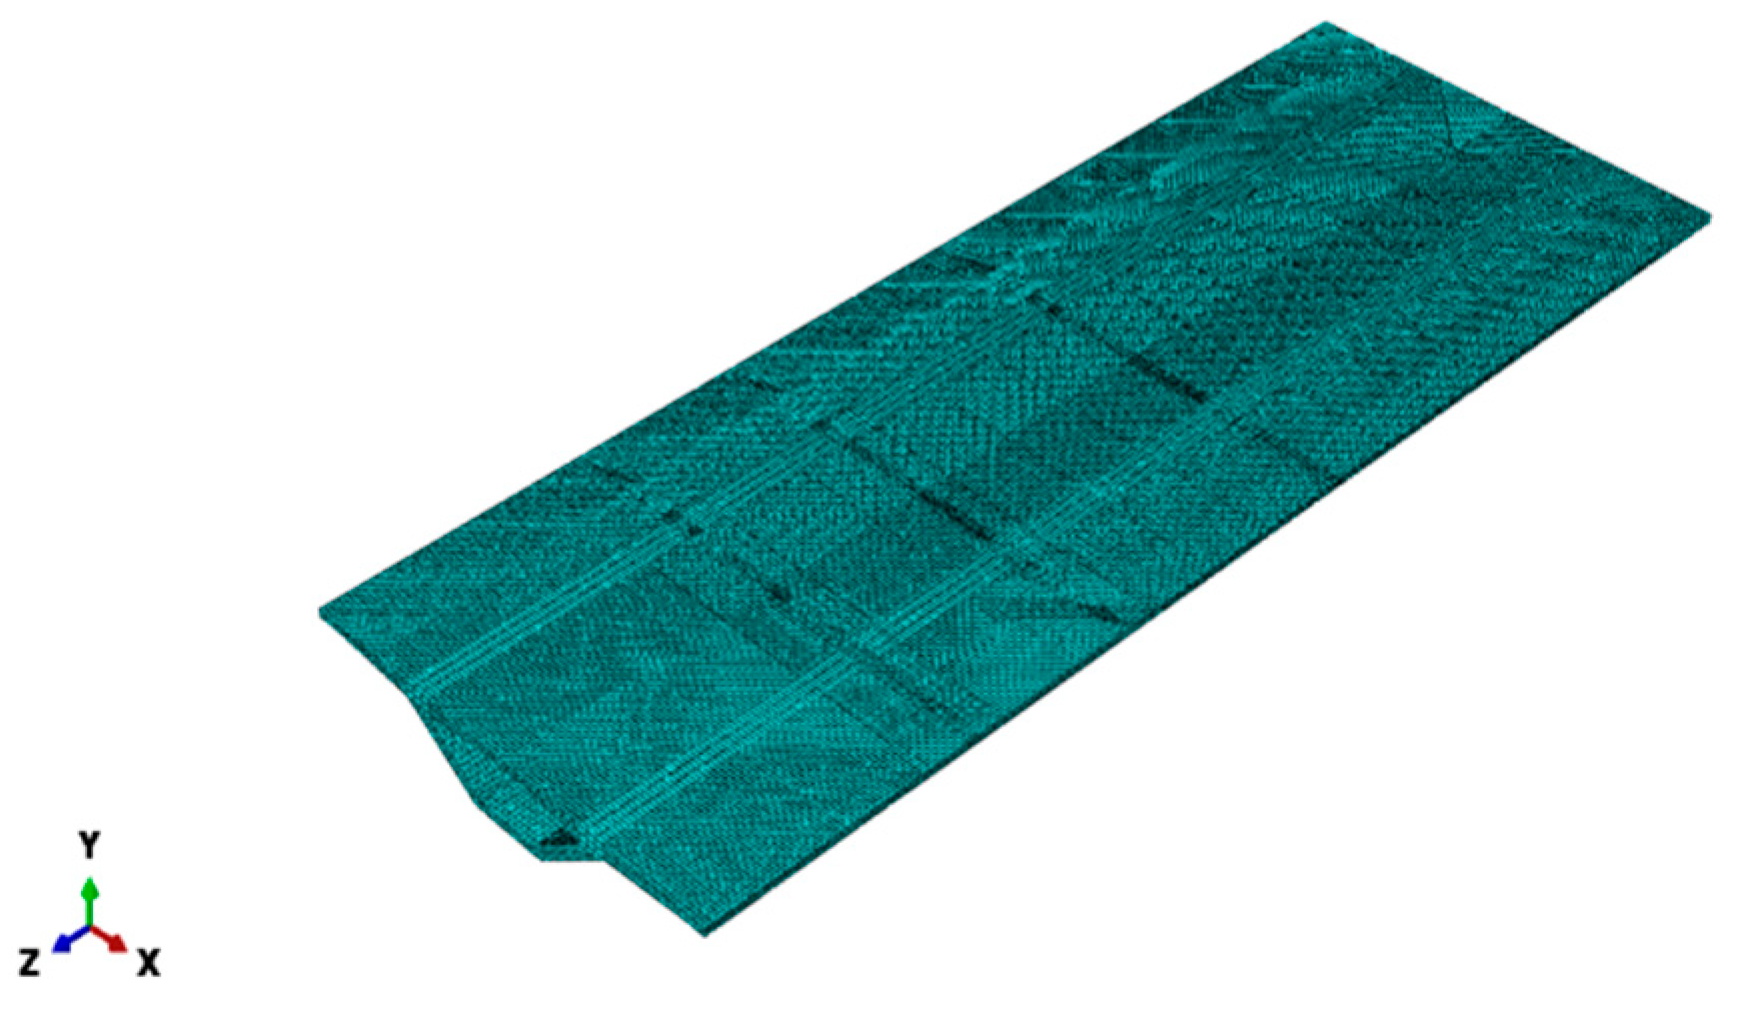
ABAQUS 2021 software was used to establish the finite element model of the bridge, and the main girder, asphalt, and prestressing tendons were modeled with C3D8R and T3D2 elements, respectively [23]. Structured mesh delineation was used, and the irregular area of the model was divided to obtain a finer mesh. Global seeding was used, and the beam segments were locally refined. The grid size was 0.2 × 0.2 m at the measurement points of the FWD and 0.1 m on the main span of the asphalt pavement. Grid encryption was used for the concrete beam. The model consisted of 301,820 nodes and 204,635 cells. The finite element model of the box girder bridge is shown in Figure 3.

Figure 3.
Model of the box girder bridge.
The location of the glued joints was simulated using the local cohesive finite element method with a finite interface thickness [24]. It simulates gluing beam segments by inserting 1 mm thick cohesive cells between the prefabricated segments and assigning epoxy resin material properties. The material parameters are listed in Table 1, Table 2 and Table 3. Based on fundamental frequency calculation results, Rayleigh damping was adopted for all bridge structural components with the damping ratio set as 0.03.

Table 1.
Material properties of main beam members.
Table 2.
Material properties of prestressing tendons.
Table 3.
Segmental epoxy adhesive joints’ performance indicators.
The X-direction of the model was the cross-section direction, the Z-direction was the travel direction, and the downward Y-direction was the bridge’s depth. We used the cooling method to apply the prestressing force and embedded units in the interaction module to simulate the interaction between the prestressing tendons and concrete and ensure high computational efficiency [25]. The interaction model between the prestressing tendons and concrete is shown in Figure 4. Since the bridge was a continuous girder bridge, the bottom surface of block 0, which was cast in place, in the middle span was in contact with the abutment, resulting in full constraint. The remaining bearings were unidirectional movable bearings to constrain the displacements in the X- and Y-directions and the rotation in the X- and Z-directions [26]. The 3D model of the bridge is shown in Figure 5.
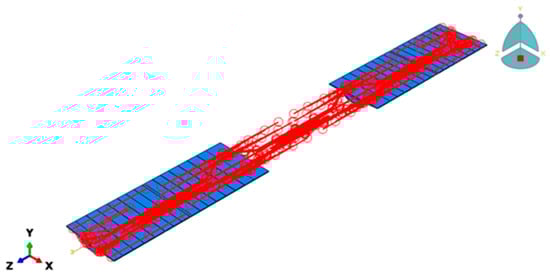
Figure 4.
Interaction between prestressing tendons and concrete.
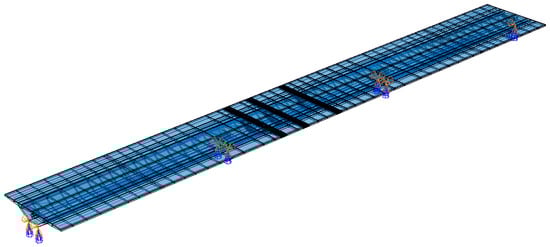
Figure 5.
Constraints of the bridge.
2.3. Model Validation
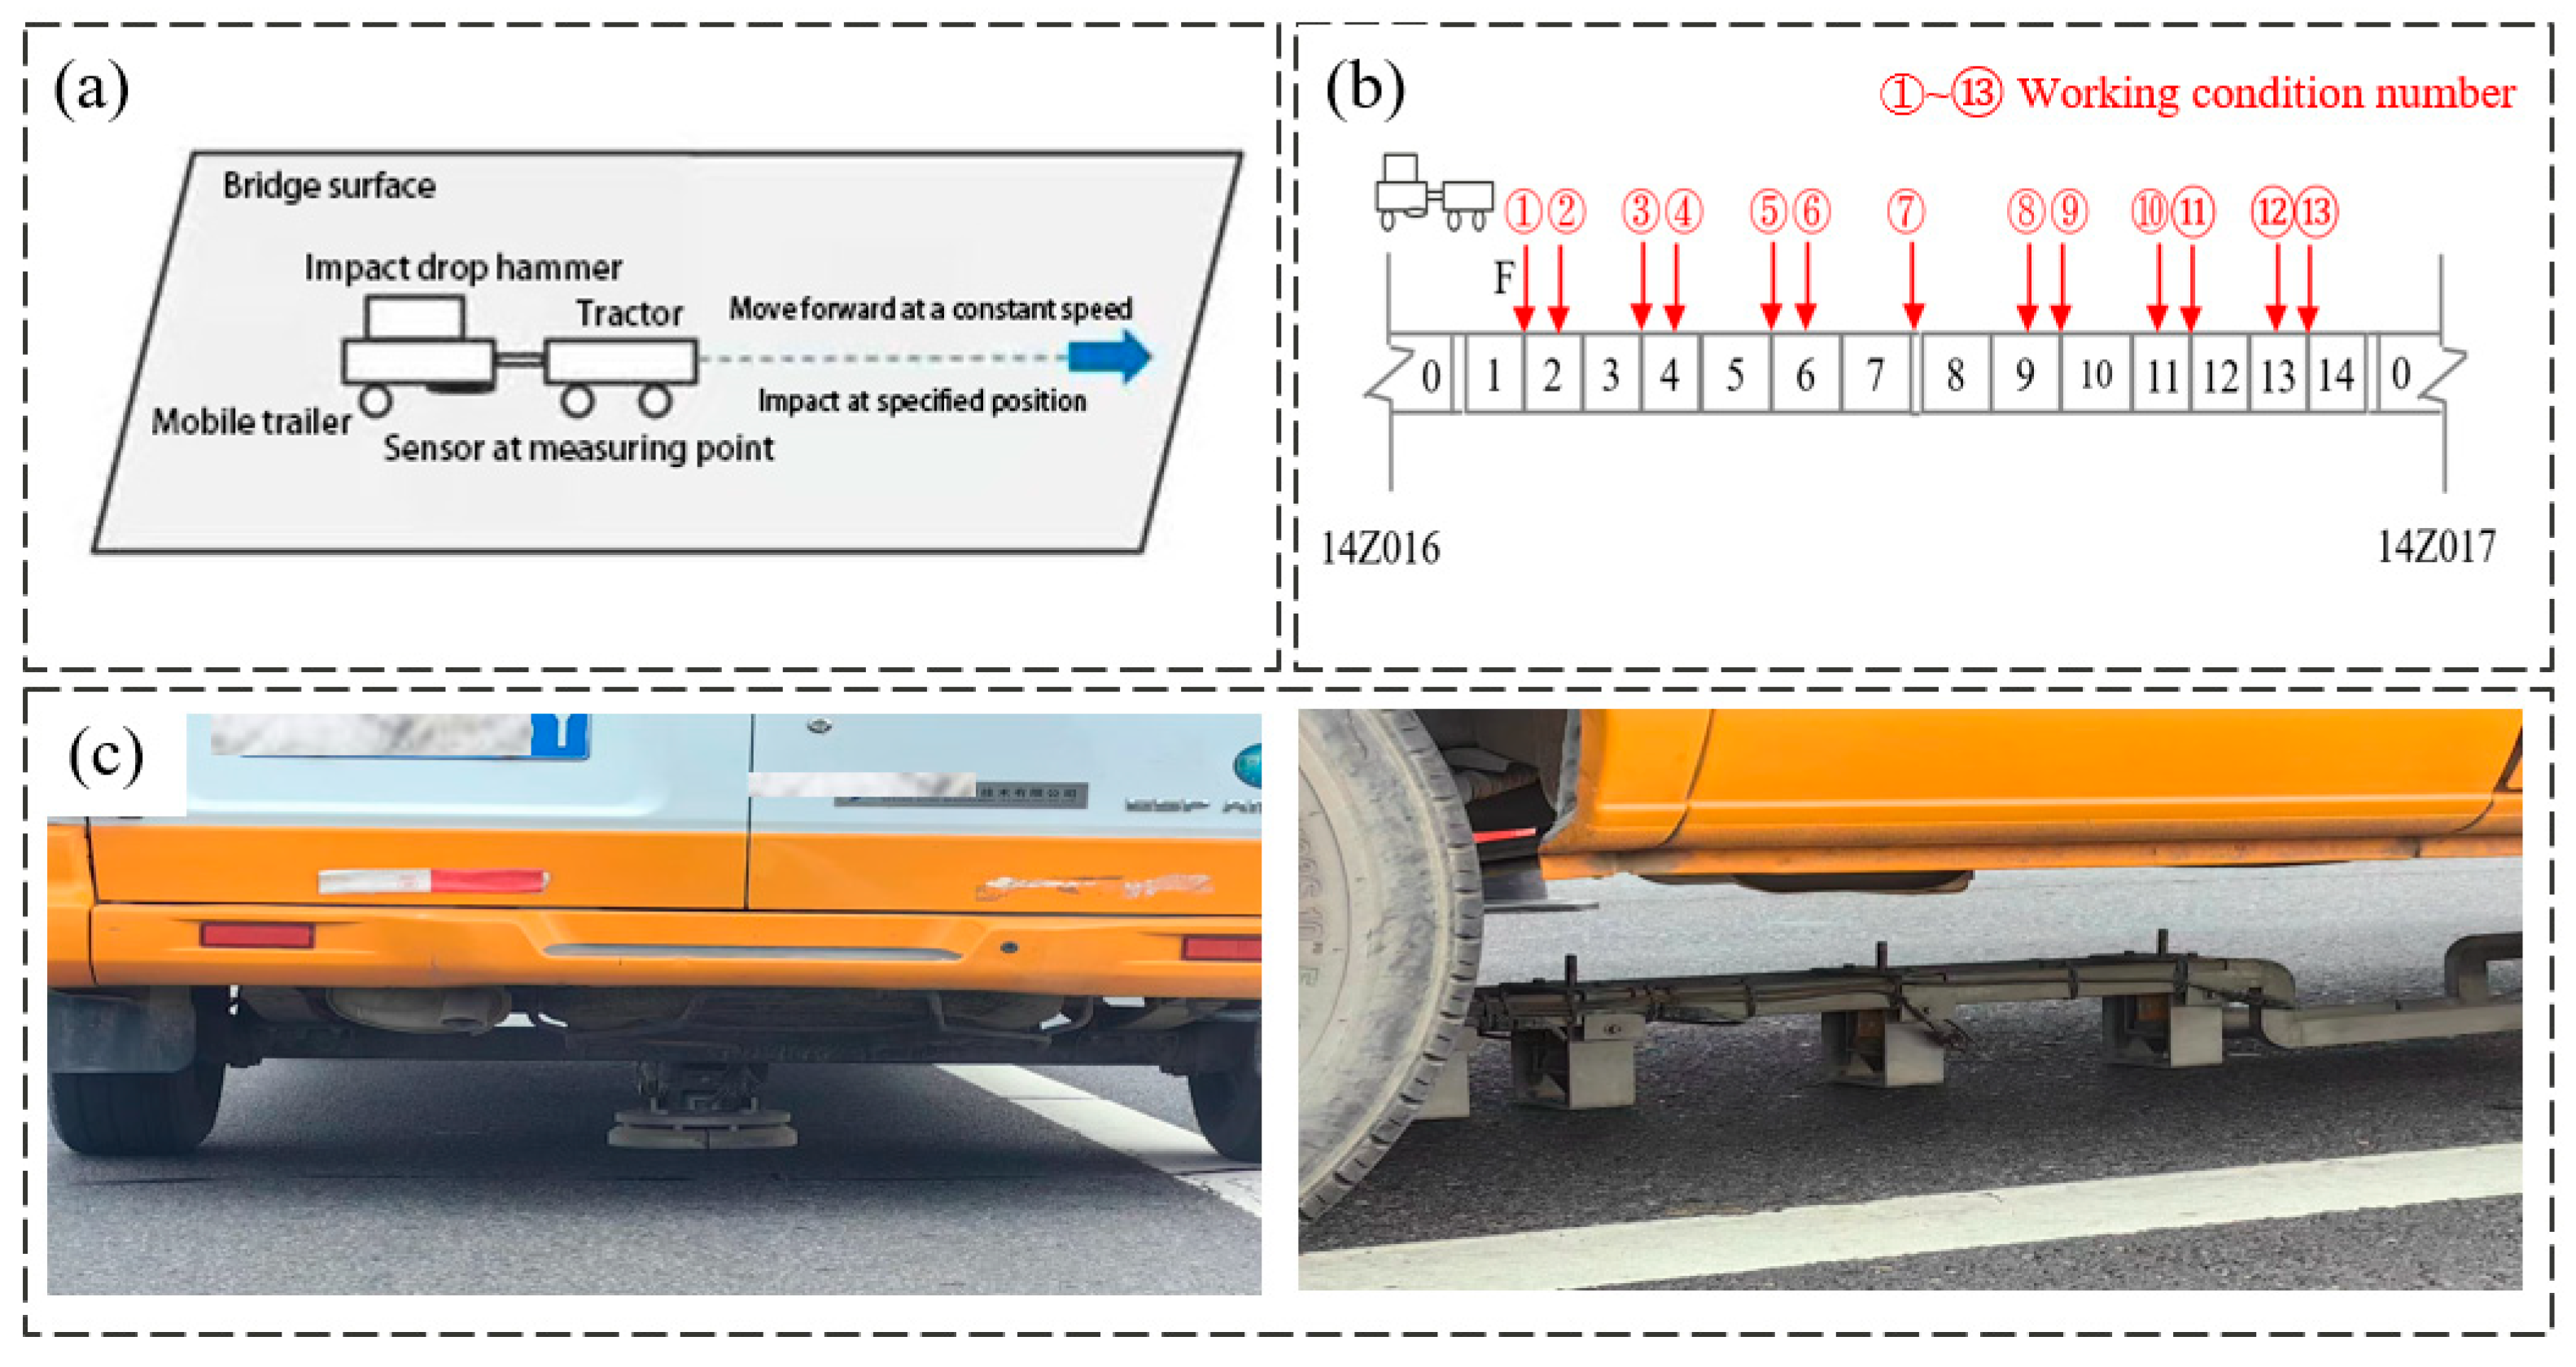
The finite element model was validated to ensure the accuracy and reliability of the bridge responses under dynamic loading. A dynamic load test of the prestressed box girder bridge was conducted. This study employed falling weight deflectometer (FWD) equipment to conduct dynamic drop weight impact tests on the main beams of prestressed box girder bridges. The test configuration is illustrated in Figure 6. During testing, the truck-mounted FWD system performed standardized impact tests (with a 50 kN magnitude and 30 ms half-sine pulse waveform) at predetermined measurement points. To minimize environmental noise interference, data acquisition was restricted to nighttime hours (23:00–02:00). Each measurement point received ≥3 impact repetitions, with collected data screened for validity. Structural dynamic response curves under different impact locations were subsequently determined.
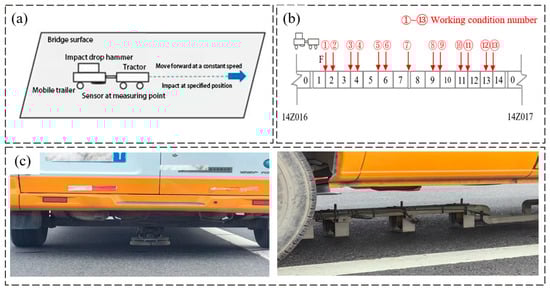
Figure 6.
Falling weight deflectometer (FWD) test: (a) Diagram of the inspection program; (b) Schematic of the working conditions at the FWD measurement point; (c) Schematic of the FWD test vehicle.
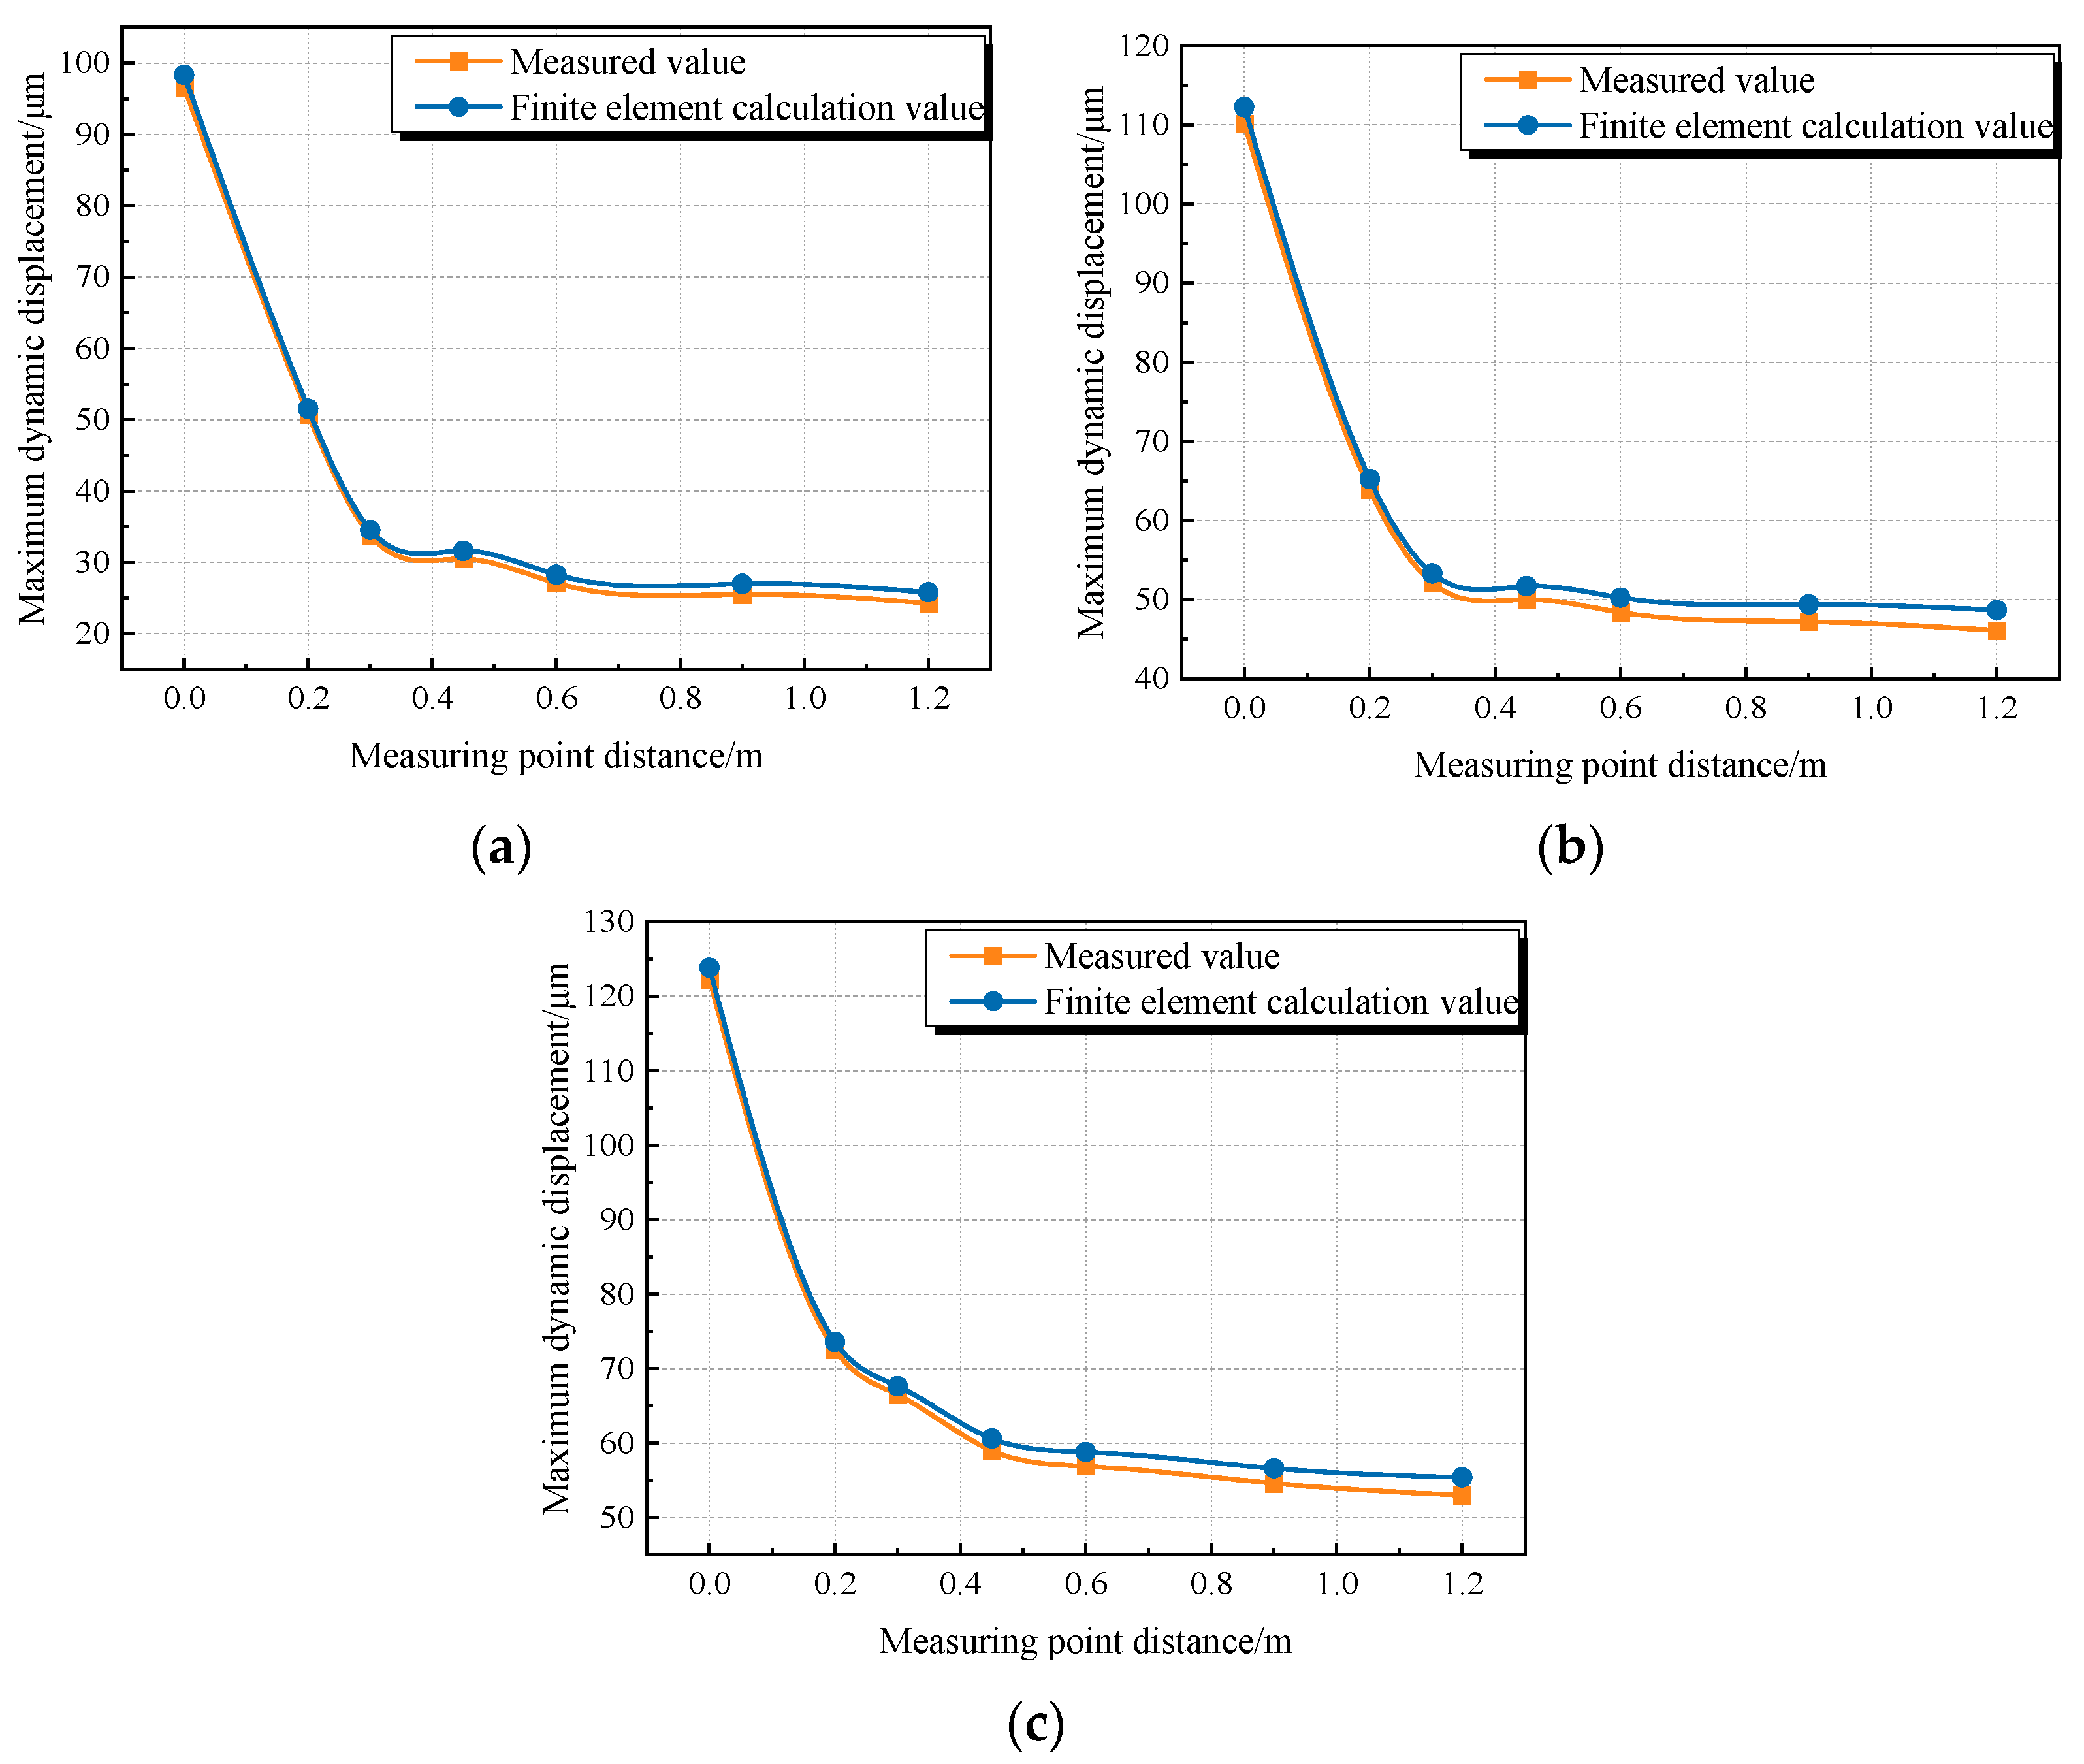
Three groups of data were randomly selected to calculate the maximum dynamic responses under the working conditions using the dynamic finite element method. The calculated and measured maximum dynamic responses are shown in Figure 7 and Table 4.
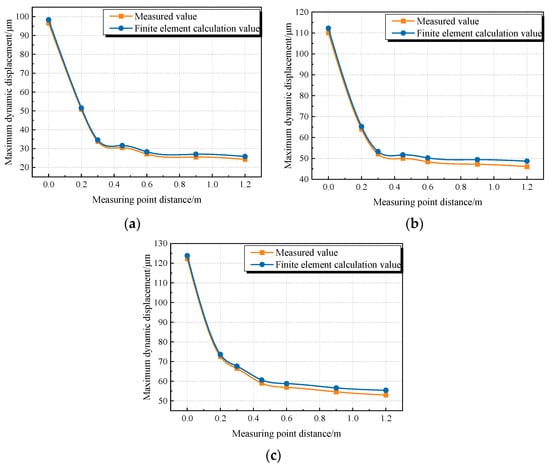
Figure 7.
Comparison of measured and calculated data. (a) Comparison of calculation results for Case 2. (b) Comparison of calculation results for Case 4. (c) Comparison of calculation results for Case 6.
Table 4.
Comparison of errors between measured and calculated results.
The dynamic responses of the bridge derived from the finite element method are in good agreement with the measured results under working and loading conditions. As the distance from the measurement point to the load increased, the relative error increased, and the maximum relative error was 6.22%. The numerical simulation results showed smooth curves, and the error was reasonable, indicating that the finite element model accurately reflected the stress–strain characteristics of the prestressed box girder bridge under impact loading [25]. Therefore, the finite element method was used to analyze the prestressed box girder bridge.
3. Inversion of the Bridge’s Mechanical Parameters
3.1. System Identification Methods
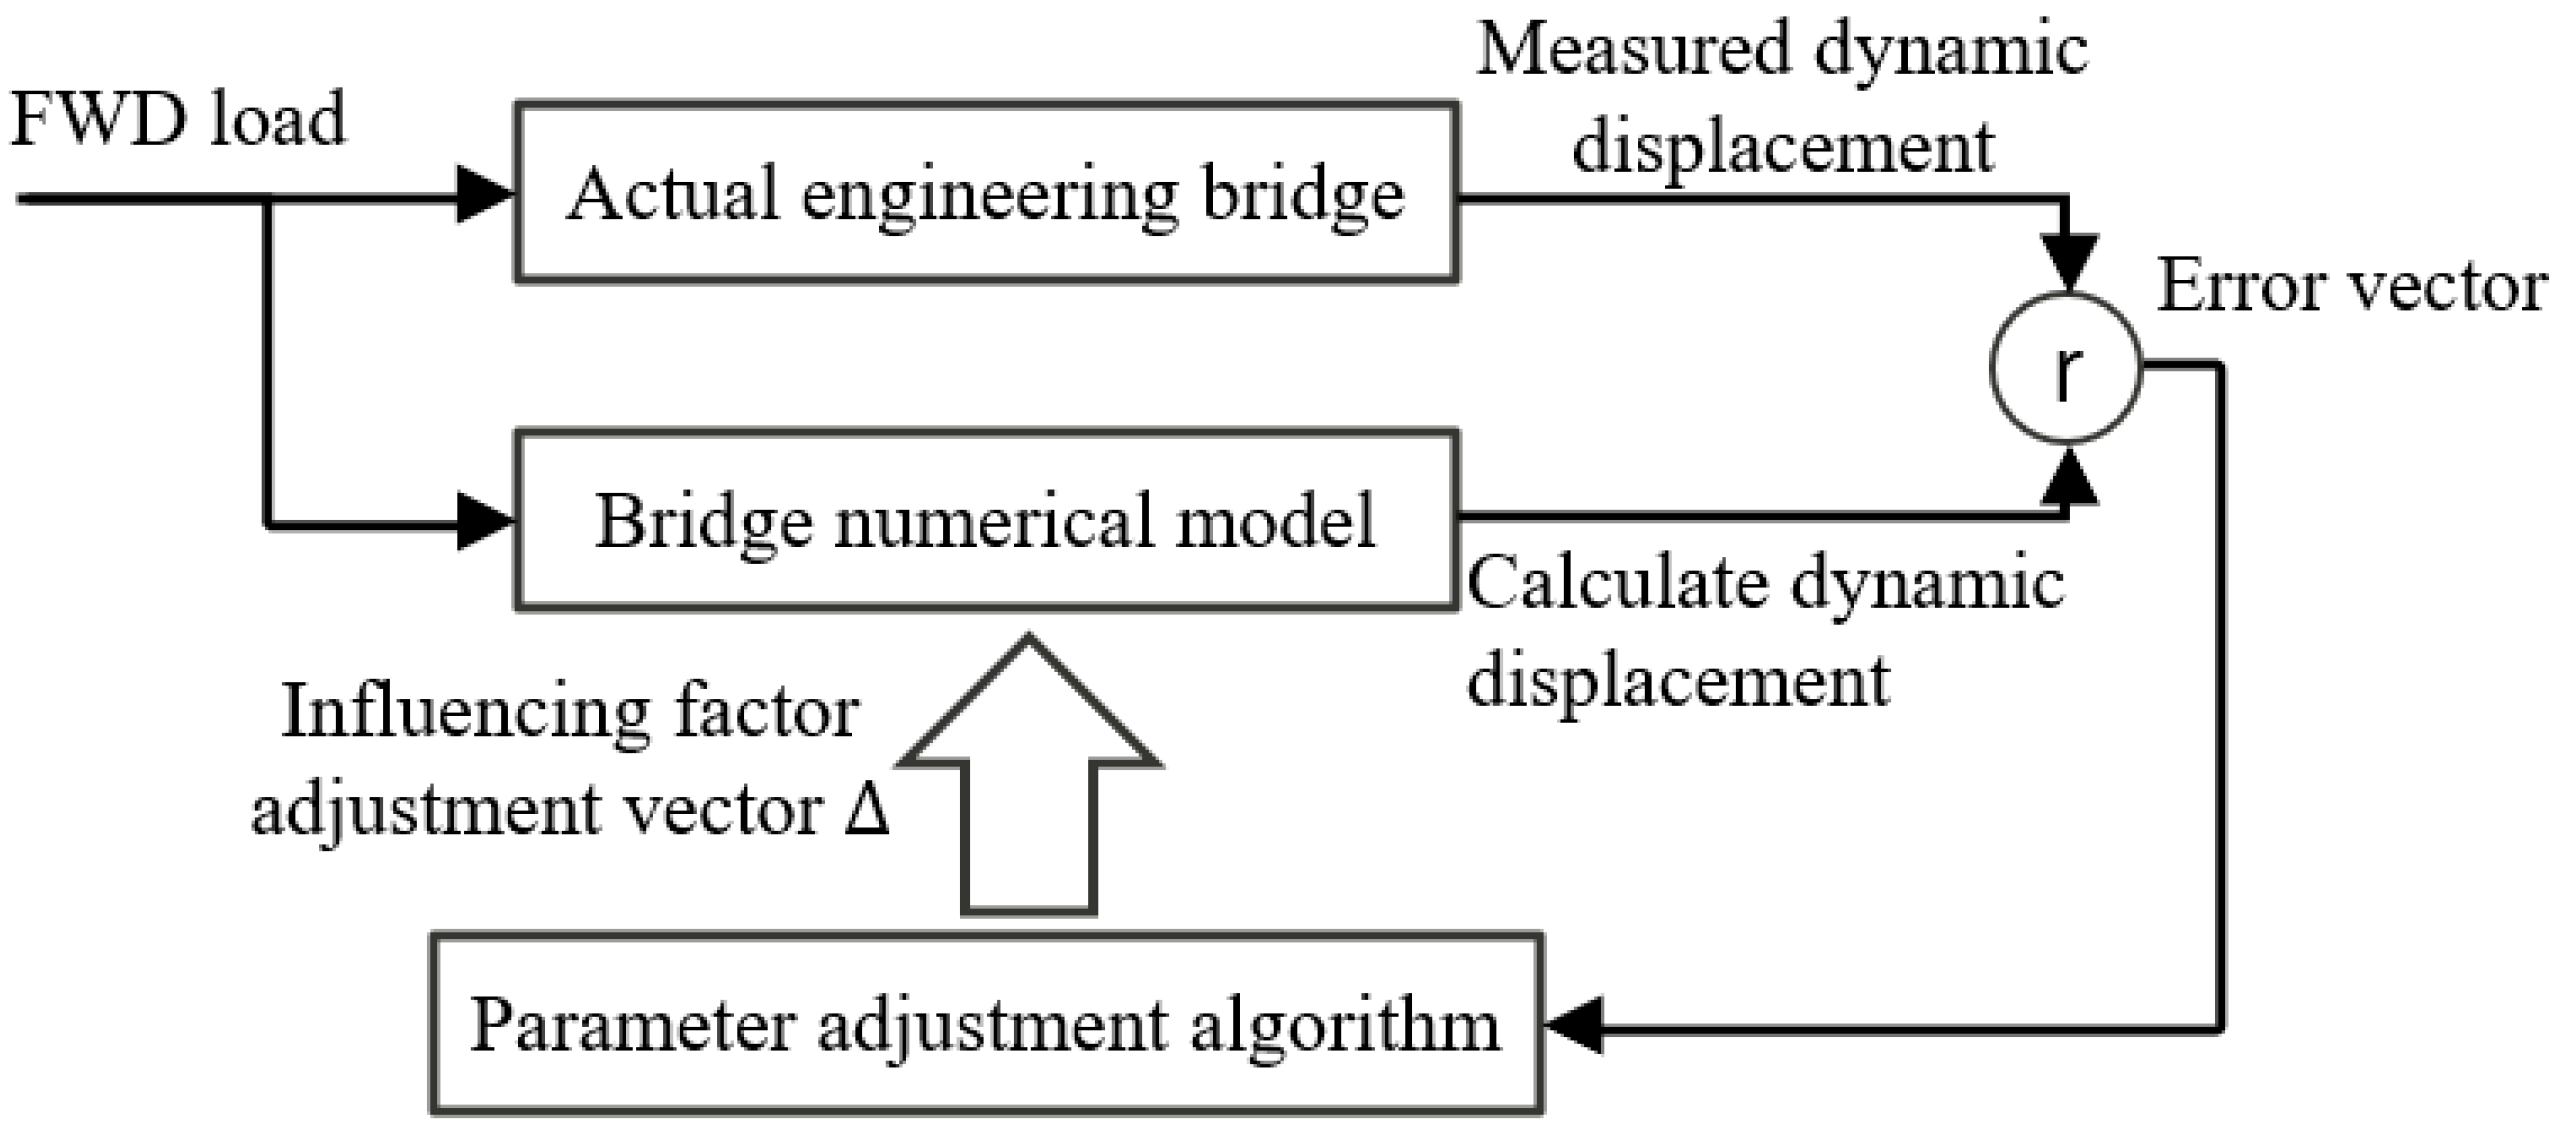
A system identification method was used to approximate the bridge system by establishing a mathematical model. It uses the input load and output response data to invert the structural damage parameters. The first step was to determine the initial values of the bridge’s physical parameters using engineering examples and a priori knowledge of the damage. The initial values of key parameters, such as the elasticity modulus and the prestress loss, were used to provide a benchmark framework for establishing the model. A mechanical orthotropic simulation was carried out using the finite element model to calculate the theoretical dynamic responses under the impact load and establish a relationship between the parameters and the dynamic behavior. The parameters were adjusted dynamically after a perturbation-based update to reduce the deviation between the theoretical and measured responses. Matrix decomposition was used for multi-parameter optimization until the convergence criterion was reached. The validity of the inversion results was determined using the model’s prediction accuracy. If the error exceeded the threshold, the iterative correction was repeated until the output parameters optimally matched the responses of the real system [27]. This closed-loop process integrated parameter initialization, forward calculation, dynamic optimization, and accuracy verification, resulting in a damage identification method with high levels of theoretical rigor and engineering practicality. The error between the model-derived and measured results was minimized using parameter adjustment algorithms. A flowchart of the system identification method is shown in Figure 8.
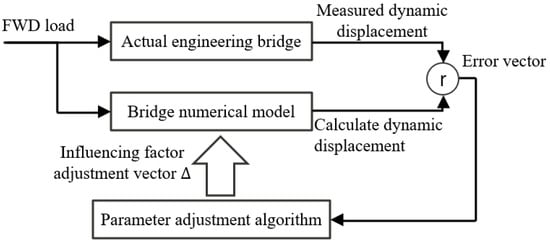
Figure 8.
Flowchart of system identification method.
3.2. Parameter Tuning Algorithm
- (1)
- Perturbation-based update [28]
The basic principle is as follows:
We assume that the mathematical model of the system with n parameters is as follows:
where f is the output function, Pi are the model parameters, and x and t are independent spatial and temporal variables. A small perturbation is applied to a function to be corrected using the Taylor series expansion. An order term model is retained for the inversion, and is the output of the system, i.e., the kinetic response during the FWD test for the latest parameter P. The error between the measured and calculated response is as follows:
where represents the error between the measured response and the model output for the spatial and temporal variables and , respectively, and is the amount of parameter tuning. If errors in the spatial and temporal values exist at , the following equation is used:
We divide both sides of the above equations by and use a dimensionless value to determine the error vector, sensitivity matrix, and parameter tuning vector, respectively:
Furthermore:
where r is the error vector, i.e., the difference between the model output and the actual output of the system; F is the sensitivity matrix, whose characteristic element Fkt reflects the sensitivity of the system output to the model parameters. If the analytical solution of Fkt is not available, the numerical solution can be used; α is the parameter adjustment vector.
The new model parameters are obtained by solving Equation (4) to obtain the parameter tuning vector α at each iteration:
where: —are the model parameters for the k+1st iteration;
—are the model parameters for the kth iteration;
—is the model parameter tuning vector for the kth iteration.
The iterative model parameters are updated using Equation (5) until the accuracy requirements are met.
- (2)
- Convergence criteria
The degree of match between the model and the actual system is assessed by calculating the convergence of the iteration results to determine whether the parameters approach the true values and ensure that the accuracy requirements are met. The convergence is evaluated by the total number of iterations (N). If the number of iterations exceeds 50 or 100, the iteration has not converged. The parameter tuning amount (PT) can also be used to determine the convergence [29]:
where: —denotes the model parameters obtained from the k+1st iteration;
—denotes the model parameters obtained from the kth iteration.
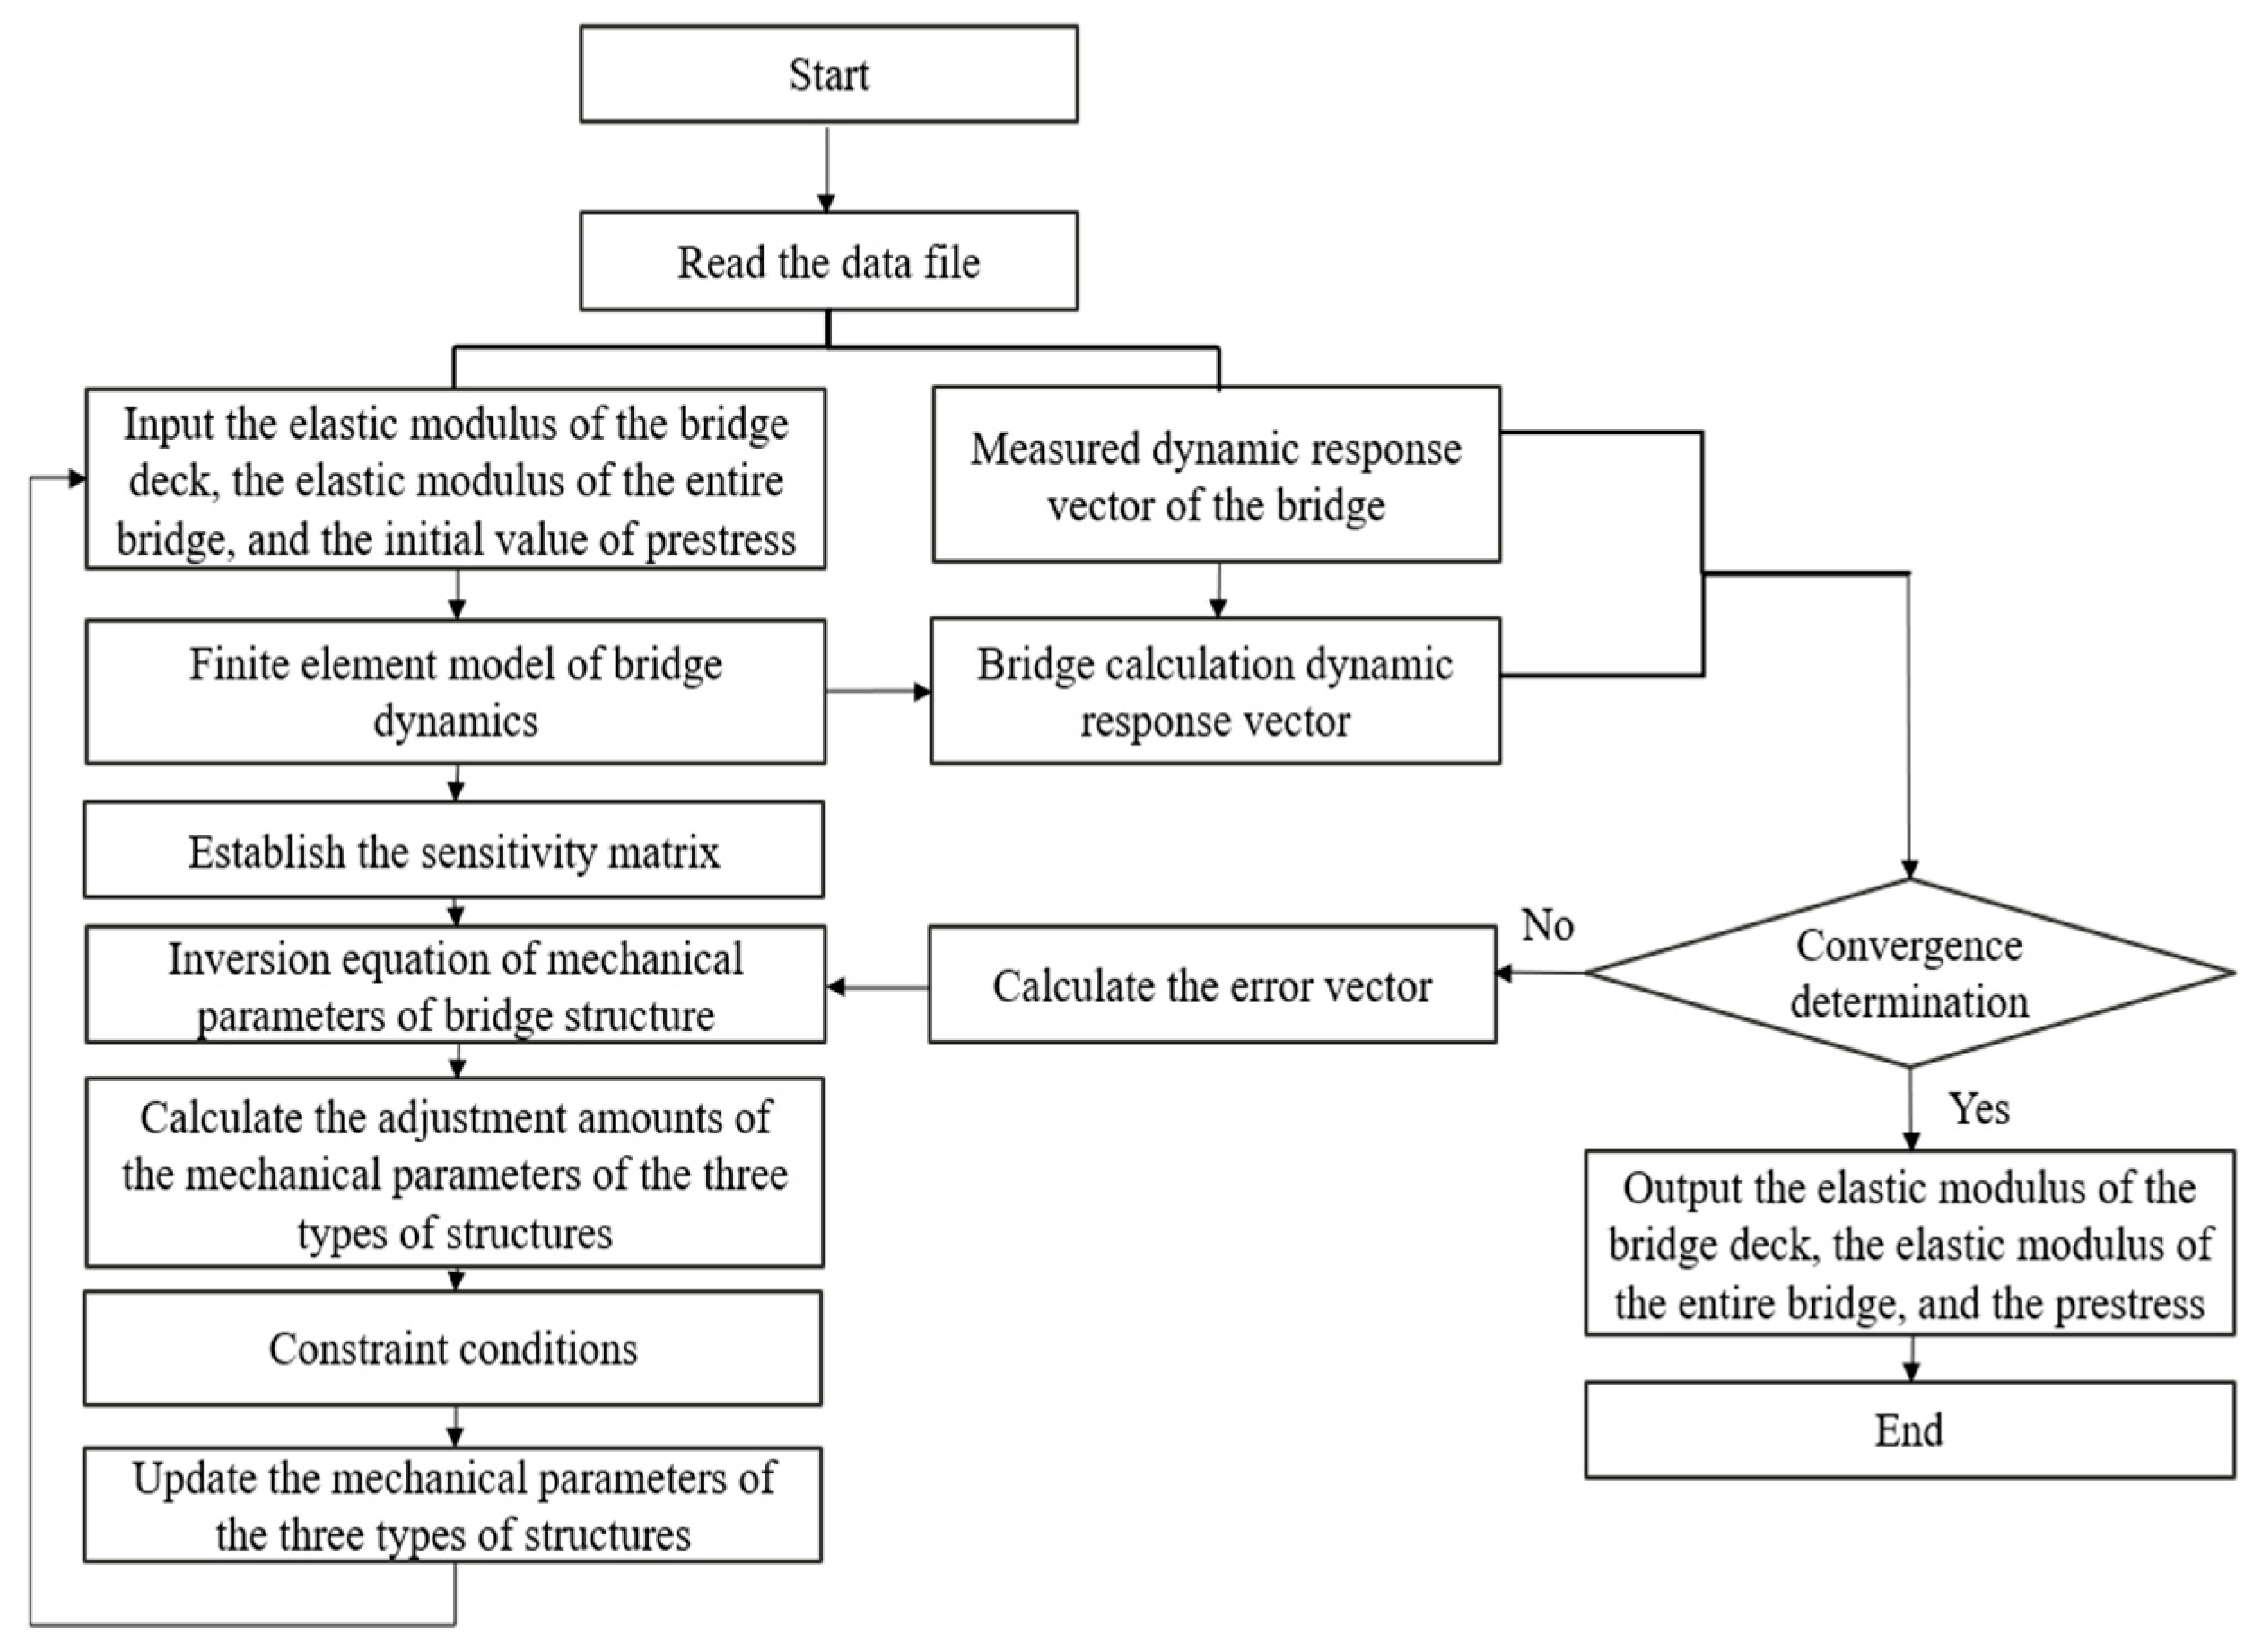
In summary, based on the newly established dynamic finite element model of prestressed box girder bridges and the theory of bridge mechanical property parameter inversion, a systematic parameter adjustment algorithm was used to conduct inversion analysis of the elastic modulus of the bridge deck, the elastic modulus of the entire bridge, and the prestress of prestressed box girder bridges using a drop hammer impact test. The flowchart of the rebound process is shown in Figure 9.
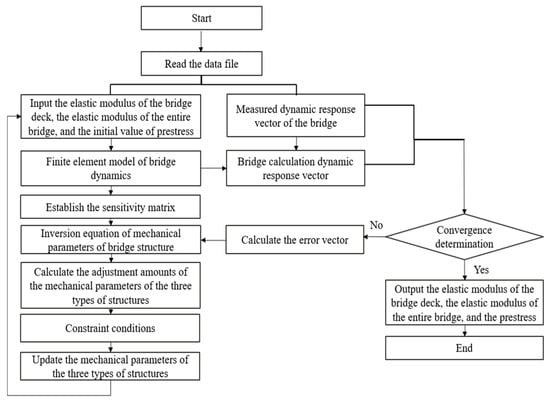
Figure 9.
Bridge structural mechanics parameter inversion framework.
3.3. Theoretical Assessment
Concrete cracking and mid-span deflection are typical damages to prestressed box girder bridges over long-term service. The mid-span region is the most prone to structural damage due to the maximum bending moment and shear force. We focused on three mechanical parameters that influence the impact resistance of bridges: (1) the elastic modulus of the bridge deck in the region of the FWD (reflecting the degradation of local stiffness), (2) the elastic modulus of the entire bridge outside the region of the FWD (reflecting the degradation of the bridge’s structural stiffness, and (3) the loss of the prestressing force (reflecting the degradation of the prestressing system). The reduction in the modulus of elasticity of the bridge deck plate reflects the stiffness degradation caused by local damage, such as concrete carbonation and microcrack extension, which significantly affects the stress distribution in the impact. The adjustment of the modulus of elasticity of the bridge reflects the contribution of the structural stiffness attenuation, which affects the propagation characteristics of impact vibration on the bridge. The loss of the prestressing force, a unique damage in prestressed bridges, reflects the reduction in the synergy between the tendons and the concrete. It affects the force distribution and the bridge’s deformation. A correlation between different damage types and dynamic characteristics can be established by systematically analyzing the influence of the three parameters on the impact dynamic response, providing a theoretical basis for the inversion of mechanical parameters and the damage identification of prestressed box girder bridges.
The following process was used to verify the accuracy of the proposed inversion method for the three mechanical parameters. We determined the value range of the parameters and utilized one group of parameters in the forward model. We used the dynamic finite element model to calculate the dynamic displacement response of the group of measurement points and extract the peak value. We assumed that the peak value was the benchmark value of the real test. We performed an inversion and iteration of the three parameters and compared the parameters derived from the inversion with those obtained from the forward model. The error between the two was compared to validate the proposed identification method.
The benchmark values of the parameters in the forward model were determined. The initial values of the damage indexes were obtained, and the iterative step size was 5% of the current value. We calculated the sensitivity matrix and solved the inversion equation using singular value decomposition (SVD) to obtain the parameter adjustment amount .
We used iterations to optimize . The parameter adjustments are listed in Table 5.
Table 5.
Dynamic responses for different structural parameters.
The average adjustment of the parameters after seven iterations was less than 1%, meeting the convergence criteria and indicating that the inversion reached a stable state. The relative errors of the elasticity modulus of the bridge deck plate and the entire bridge, as well as the prestressing force, were 0.11%, 0.73%, and 0.30%, respectively. The results met the accuracy requirements, proving that the proposed inversion method accurately described the structural parameters of the prestressed box girder bridges.
The initial values in the system identification inversion method have a significant impact on the accuracy and convergence of the inversion results. The degree of deviation of the initial values from the true values often affects the inversion stability and final results. Therefore, the convergence of the inversion algorithm must be systematically examined using different initial values.
The mean absolute error (MAE) was used to measure the deviation between the inversion value and the design value and assess the accuracy of model data. It is calculated as follows:
Table 6 lists the inversion results for different initial values. Convergence occurred in a specific range for different initial values. The average error for identifying the elastic modulus of the bridge deck plate was the smallest (0.23%), and that for identifying the elastic modulus of the entire bridge was the largest (0.65%). All errors were below 1%, indicating the method had high levels of accuracy and stability for the structural parameter inversion of prestressed box girder bridges.
Table 6.
Inversion results of bridge structural parameters.
4. Engineering Applications of Inversion of Bridge Mechanical Parameters
We applied the proposed system identification method on a real bridge. Due to the complexity of the damage mechanism of prestressed box girder bridges, it was necessary to cross-validate the elastic modulus and prestressing parameters obtained from the inversion with measured data to establish a relationship between the theoretical model and engineering practice. A prestressed box girder bridge was selected, and the engineering applicability of the inversion method was systematically verified using an FWD test. The structural damage was determined based on the parameter evolution.
4.1. Localized Strength Testing of Real Bridges
A nondestructive FWD test was used to determine the material properties of the target bridge and establish a correlation between the inversion parameters and the solid structure. A concrete strength test of the target bridge was performed as follows. We selected test zones in the FWD impact area in the span of the main girder and in the main stress parts of the bridge. An HT-225T rebound tester manufactured by Beijing Haichuang High-Tech Co., Ltd. in Beijing, China was used. The test area was 20 cm × 20 cm, and 16 test points were used in each zone.
We determined the thickness of the carbonation layer to assess the effect of the carbonation depth on the beam’s compressive strength. A hole with a diameter of 15 mm and a depth slightly larger than the carbonation depth was drilled into the concrete at the measurement point. After removing the particles from the hole, a phenolphthalein ethanol solution with a concentration of 1–2% was dripped into the holes. The boundaries between the carbonized and non-carbonized regions inside the holes and the carbonization depth were measured with an accuracy of 0.5 mm.
According to the requirements of the “Technical Procedures for Testing the Compressive Strength of Concrete using the Rebound Method” [29], the measured data were processed. The definition of the concrete elastic modulus in China’s highway bridge regulations is as follows:
The concrete strength is listed in Table 7.
Table 7.
Results of concrete strength testing using the rebound method.
The concrete strengths of the deck slab and the entire bridge were 54.1 MPa and 56.6 MPa, respectively. We used the empirical equations to calculate the concrete’s elasticity modulus according to China’s highway bridge design specification [30]. These values were 0.52 × 10 4 MPa and 3.55 × 10⁴ MPa, respectively, for the deck slab and the entire bridge within the FWD’s area of impact.
4.2. Engineering Applications of the Proposed Method
4.2.1. Finite Element Modeling of Real Bridges
The span of the bridge was 20.62 m + 33.0 m + 25.5 m, with a length of 79.12 m. The bridge cross-section was 12.75 m wide. It had a single box and three chambers. C50 concrete was used for the superstructure, C30 concrete was utilized for the substructure, and the thickness of the decking was 0.1 m. Finite element analysis software was used to establish a dynamic finite element model of the bridge. The X-axis was the travel direction, the Y-axis was the longitudinal direction, and the Z-axis was the transverse direction of the bridge. The global grid size was 0.2 m. The grid was refined (0.1 m) and encrypted within the range of the FWD measurement points to improve the computational accuracy. We used 202,458 nodes and 132,472 elements. The material parameter values were based on the design data. The modulus of elasticity of the deck slab and the entire bridge was 3.65 × 10⁴ MPa, the Poisson’s ratio was 0.2, and the density was 2.42 g/cm3. The tensile stress of the prestressed tendons was 1395 MPa. The boundary conditions of the model were based on the constraints of the girder bridge (Figure 10).
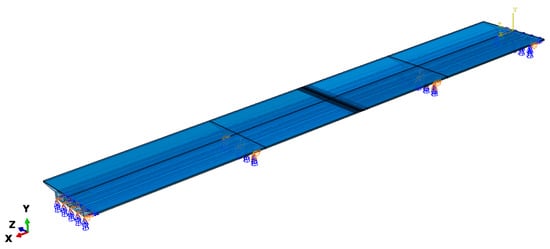
Figure 10.
Constraints on the bridge.
4.2.2. Identification of the Bridge’s Structural Parameters
Table 8 compares the results obtained from the inversion and the measured values. The fitted curves of the dynamic deflection (bending settlement) are plotted in Figure 11.
Table 8.
Comparison of inversion results and measured values.
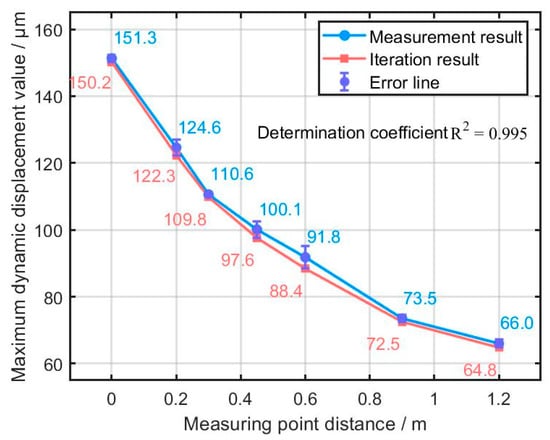
Figure 11.
Fitted curve of dynamic deflection.
The final iteration results are consistent with the measured results, indicating the high accuracy of the proposed inversion method. The error is small. It is the largest for the elastic modulus of the bridge (1.55%) and the smallest for the elastic modulus of the bridge deck plate (0.86%). The errors are below 5%, meeting the accuracy requirements of engineering applications.
The loss rate of the mechanical properties of the structural layers was calculated by comparing the inversion values with the design values.
Table 9 indicates that the loss rate of the elasticity modulus of the bridge deck plate is 4.39%, and that of the bridge is 1.24%. Consistent with the on-site inspection results, the bridge’s structural performance is good. There were some cracks or surface abrasion in local areas and the partial carbonization of some concrete surfaces. However, the depth of carbonization did not exceed the thickness of the protective layer of steel reinforcement; thus, these minor damages did not affect the bridge’s load-bearing performance. The results confirm the bridge’s stability. The prestress loss rate was 7.64%, which is reasonable. Although some prestress loss has occurred, it is within the allowable range. Based on the quantitative analysis results, we recommend local repairs of the honeycomb-pockmarked areas of the deck slabs, fixing the minor cracks of the bridge, and monitoring the prestressing condition regularly to ensure the bridge’s long-term safe operation.
Table 9.
Prestress loss.
5. Conclusions
A dynamic finite element model of a prestressed box girder bridge under impact loading was established, and model validation was carried out. We utilized the system identification method and proposed a structural parameter inversion method to estimate the bridge’s parameters. This method can rapidly identify the elastic modulus of the deck plate and the bridge, as well as the prestressing and other damage parameters. The following conclusions were obtained:
- (1)
- A dynamic finite element model of a prestressed box girder bridge under impact loading was established. The results of ABAQUS 2021 numerical calculations were compared with the measured dynamic responses of the bridge. The modeling method demonstrated a high computational accuracy and accurately reflected the dynamic characteristics of the prestressed box girder bridge. The proposed method can be applied to other box girder bridges;
- (2)
- We utilized an FWD test to obtain data to compare with the proposed method. Structural parameter inversion was used to determine the mechanical parameters, such as the elastic modulus of the deck plate and the prestressing tension force. The theoretical validation results showed that the method had a high computational accuracy and good convergence stability. The maximum relative error of the inversion results was 0.73%. The initial value had a minimal impact on the results, and the theoretical convergence accuracy was within 1%;
- (3)
- A field experiment was conducted to apply the proposed inversion and assess the damage of a prestressed box girder bridge. The maximum error of the elastic modulus between the inversion and rebound methods was 1.55%, indicating sufficient accuracy. The loss rates of the deck slab’s elastic modulus and the prestressing force obtained from the inversion were 4.39% and 7.64%, respectively. The proposed method provides a new approach for evaluating the damage to prestressed box girder bridges.
The dynamic loads of moving vehicles, ambient temperature, and humidity affect the FWD test results. Thus, factors affecting the results should be considered to improve the inversion accuracy. The method can be applied to other prestressed bridges, such as prestressed T-girder bridges, to verify its universality and provide broader technical support for bridge health inspection and assessment.
Funding
The authors are grateful for the financial support from the Key Research Projects of Higher Education Institutions in Henan Province (24A560021 (Pan Guo)), the Henan Post-doctoral Foundation (202102015 (Pan Guo)), and the Science and Technology Program Project of Housing and Urban-Rural Development in Henan Province (Project No. HNJS-2024-K29 (Yijun Chen)).
Conflicts of Interest
Author Yijun Chen was employed by the company Henan Central Construction Engineering Co., Ltd. The remaining authors declare that the research was conducted in the absence of any commercial or financial relationships that could be construed as a potential conflict of interest.
References
- Ministry of Transportation and Communications. Statistical Bulletin of Transportation Industry Development in 2023. China Transportation News, 18 June 2024. [Google Scholar]
- Ghafur, H.; Omar, Q. Shear strength of joints in precast posttensioned segmental bridges during 1959–2019, review and analysis. Structures 2019, 20, 527–542. [Google Scholar]
- Li, S.; Xu, L.; Ma, Y.; Cheng, X. Structural modulus inversion of asphalt paving retrofitting on old concrete slabs with resonant crushed petrochemical base based on FWD dynamic bending basin. J. Cent. South Univ. (Nat. Sci. Ed.) 2020, 51, 2277–2288. [Google Scholar]
- Li, F.; Cai, Y. Application of falling hammer type bending sedimentometer in bridge evaluation. Eng. Mech. 1999, 3, 318–322. [Google Scholar]
- Stochino, F.; Bedon, C.; Sagaseta, J.; Honfi, D. Robustness and Resilience of Structures under Extreme Loads. Adv. Civ. Eng. 2019, 2019, 4291703. [Google Scholar] [CrossRef]
- Ahmed, H.; La, M.H.; Gucunski, N. Review of Non-Destructive Civil Infrastructure Evaluation for Bridges: State-of-the-Art Robotic Platforms, Sensors and Algorithms. Sensors 2020, 20, 3954. [Google Scholar] [CrossRef]
- Zeng, X.; Xu, Z. A damage identification strategy for large-span cable-stayed bridges based on statistical trends of distributed strain modal residuals. Vib. Shock. 2013, 32, 78–81. [Google Scholar]
- Kim, J.T.; Ryu, Y.S.; Cho, H.M.; Stubbs, N. Damage identification in beam-type structures: Frequency-based method vs mode-shape-based method. Eng. Struct. 2003, 25, 57–67. [Google Scholar] [CrossRef]
- Zhao, L.; Kim, C.W.; Goi, Y.; Takemura, K. Vibration-Based Damage Detection for a Prestressed Concrete Box Girder by Means of Subspace Analysis. ASCE-ASME J. Risk Uncertain. Eng. Syst. Part A Civ. Eng. 2021, 7, 2376–7642. [Google Scholar] [CrossRef]
- Qi, X.; Yang, X.; Wang, S.; Ding, X.; Xiao, Z. Frequency identification of continuous girder bridge based on vehicle response. Ind. Build. 2021, 51, 150–155. [Google Scholar]
- Jeyamohan, K.; Chan, T.H.; Nguyen, K.D.; Thambiratnam, D.P. Prestress force and moving force identification in prestressed concrete bridges via Lagrangian polynomial-based load shape function approach. J. Civ. Struct. Health Monit. 2024, 15, 575–596. [Google Scholar] [CrossRef]
- Catbas, N.F.; Brown, L.D.; Aktan, E.A. Use of Modal Flexibility for Damage Detection and Condition Assessment: Case Studies and Demonstrations on Large Structures. J. Struct. Eng. 2006, 132, 1699–1712. [Google Scholar] [CrossRef]
- Huang, J. Application of Drop Hammer Bending Counters in Bridge Damage Identification. Master’s Thesis, Dalian University of Technology, Dalian, China, 2005. [Google Scholar]
- Onishi, H.; Shimizu, N.; Santo, T.; Miyamura, M. Development of new structural health monitoring method for bridge decks based on small FWD system. In Lifecycle of Civil Engineering Systems; Taylor & Francis: Oxfordshire, UK, 2014; pp. 355–360. [Google Scholar]
- Fan, S.Y.; Li, Z.H. Dual-unit substructure method for identification of physical parameters of bridge structures. Eng. Mech. 2007, 24, 68–72. [Google Scholar]
- Atalla, M.; Inman, D. On Model Updating Using Neural Networks. Mech. Syst. Signal Process. 1998, 12, 135–161. [Google Scholar] [CrossRef]
- Ataei, S.; Aghakouchak, A.A.; Marefat, M.S.; Mohammadzadeh, S. Sensor fusion of a railway bridge load test using neural networks. Expert Syst. Appl. 2005, 29, 678–683. [Google Scholar] [CrossRef]
- Cui, J. Research on Bridge Structural Parameter Identification Technology Based on Genetic Optimization Neural Network Algorithm. Master’s Thesis, Zhengzhou University, Zhengzhou, China, 2006. [Google Scholar]
- Jung, D.; Kim, C. FE model updating based on hybrid genetic algorithm and its verification on numerical bridge model. Struct. Eng. Mech. 2009, 32, 667–683. [Google Scholar] [CrossRef]
- Hiatt, M.; Mathiasson, A.; Okwori, J.; Jin, S.S.; Shang, S.; Yun, G.J.; Caicedo, J.; Christenson, R.; Yun, C.B.; Sohn, H. Finite Element Model Updating of a PSC Box Girder Bridge Using Ambient Vibration Test. Adv. Mater. Res. 2010, 168–170, 2263–2270. [Google Scholar] [CrossRef]
- Lin, X.; Zhang, L.; Guo, Q.; Qin, B. Modification of dynamic finite element model for prestressed continuous box girder bridges. J. Civ. Environ. Eng. 2012, 34, 32–38. [Google Scholar]
- Zhang, H.; Li, D.; Li, H. Progress in finite element model correction research: From linear to nonlinear. Adv. Mech. 2019, 49, 542–575. [Google Scholar]
- Zivaljic, N.; Nikolic, Z.; Smoljanovic, H.; Munjiza, A. Numerical simulation of reinforced concrete structures under impact loading. Mater. Werkst. 2019, 50, 599–610. [Google Scholar] [CrossRef]
- Zhao, L.; Wu, W.; Zhang, X.; Li, L.; Guo, P.; Yang, S.; Cai, Y. Dynamic Load Identification on Prefabricated Girder Bridges Based on a CNN and Dynamic Strain Data. Buildings 2024, 14, 2809. [Google Scholar] [CrossRef]
- Li, F.; Zhang, W.; Ni, J. Study on seismic performance of reinforced concrete frame structure with embedded steel plates. Build. Struct. 2020, 50, 106–113. [Google Scholar]
- Han, Y.; Zhou, Z.; Zhang, Y.; Wang, X.; Zhou, W. Dynamic Deflection Simulation of Bridge in Driving Process Based on ABAQUS Software. Technol. Earthq. Disaster Prev. 2023, 18, 118–126. [Google Scholar]
- Yang, C.; Sun, D.; Zhang, C. (Eds.) System Identification and Adaptive Control; Chongqing University Press: Chongqing, China, 2003. [Google Scholar]
- Cai, Y. Inverse Analysis of Dielectric Properties of Layered Nonuniform Media. Ph.D. Thesis, Dalian University of Technology, Dalian, China, 2008. [Google Scholar]
- JGJ/T 23-2011; Technical Specifications for Testing Compressive Strength of Concrete Using the Rebound Method. China Architecture & Building Press: Beijing, China, 2011.
- JTG D62-2004; Design Specification for Highway Reinforced Concrete and Prestressed Concrete Bridges and Culverts. Ministry of Transportation of the People’s Republic of China: Beijing, China, 2013.


Disclaimer/Publisher’s Note: The statements, opinions and data contained in all publications are solely those of the individual author(s) and contributor(s) and not of MDPI and/or the editor(s). MDPI and/or the editor(s) disclaim responsibility for any injury to people or property resulting from any ideas, methods, instructions or products referred to in the content. |
© 2025 by the authors. Licensee MDPI, Basel, Switzerland. This article is an open access article distributed under the terms and conditions of the Creative Commons Attribution (CC BY) license (https://creativecommons.org/licenses/by/4.0/).