Article

Evaluation of Air Voids in Concrete Based on Cross-Section Images of Its Test Specimens

1
Department of Mining Engineering and Education, Dnipro University of Technology, 49005 Dnipro, Ukraine
2
Department of the Theory of Wave Processes and Optical Systems of Diagnostics, Karpenko Physico-Mechanical Institute of the NAS of Ukraine, 79060 Lviv, Ukraine
3
Department of Software, Lviv Polytechnic National University, 79013 Lviv, Ukraine
4
Department of Computer Sciences, University of Lodz, 90236 Lodz, Poland
5
Department of Computerized Engineering, Ivano-Frankivsk National Technical University of Oil and Gas, 76019 Ivano-Frankivsk, Ukraine
*
Authors to whom correspondence should be addressed.
Buildings 2025, 15(13), 2241; https://doi.org/10.3390/buildings15132241
Submission received: 21 May 2025 / Revised: 19 June 2025 / Accepted: 23 June 2025 / Published: 26 June 2025
(This article belongs to the Section Building Materials, and Repair & Renovation)

Abstract

Concrete is a material that is widely used in construction and other industries due to its strength and durability. Many characteristics of concrete that are important for its operation, in particular crack resistance, frost resistance, and water resistance, directly depend on the distribution structure and percentage of air voids in concrete. The problem of assessing air voids in concrete based on images of sections of their test samples is considered, the solution of which is relevant for determining the grade of concrete during non-destructive testing of building structures and critical infrastructure facilities. A three-dimensional modelling of the distribution of air voids in concrete was carried out based on a uniform distribution for different air content percentages, which made it possible to substantiate the reliability of assessing the three-dimensional distribution of air voids from two-dimensional images. A method for assessing air content based on the Otsu segmentation-method with subsequent filtering out by geometric shape has been developed. It was tested on real images of sections of test concrete samples. The presented results of experimental studies demonstrate an increase in the reliability of air voids segmentation in images of cross-sections of concrete test specimens using the proposed method, and make it possible to state that the percentage of air voids can indicate concrete strength.

1. Introduction

Concrete, as a universal and durable building material, is widely used in industry to manufacture building structures, reinforced concrete structures, and concrete products, as well as monolithic and reinforced concrete structures [1,2,3]. The main components of concrete are cement, sand, aggregate, and water, the ratio of which determines the grade of the concrete mix and its class. Stabilizers, plasticizers, water repellents, and other chemical and active mineral additives are added to their composition to obtain strong, durable concrete mixtures with the necessary performance properties [4,5]. At the same time, it should be noted that the porosity of concrete is not only a characteristic of its structure, but also one factor that determines its mechanical behaviour under load. Studies [6,7,8,9] have shown that even single voids or microcracks can significantly change the limit state of structures.
Important characteristics of concrete, such as crack resistance, frost resistance, and water resistance, directly depend on the distribution structure and percentage of air voids in concrete [10,11]. Air voids in concrete are formed naturally due to physicochemical processes during solidification or air entrapment during mixing, due to the addition of air-entraining and micro-gas-forming additives. As stress absorbers in concrete, the optimal content and uniform distribution of air voids help slow down microcrack formation at the precritical failure stage [12]. In general, recognizing the spatial architecture of structurally heterogeneous natural and artificial composite structures is an urgent problem of modern materials science. These tasks include the analysis of the porosity of rocks and bone tissue [13,14] and the study of the behaviour of materials with globular [15] and elongated [16,17] inclusions, in particular, polymer-filled concrete [18]. It is also important to determine the porosity in the near-surface regions of oxidized valve group metals from images of flat grinds [19,20,21,22], as well as to study the uneven concentration of voids and inclusions in functionally gradient materials [23,24]. No less important is the information on concrete porosity for using injection technologies to renovate building structures with macroscopic damage [25,26,27,28,29,30].
Therefore, estimating the air content in concrete is important and relevant. The research aimed to estimate the size of air voids in concrete and their size distribution. To achieve this goal, the following tasks had to be solved:
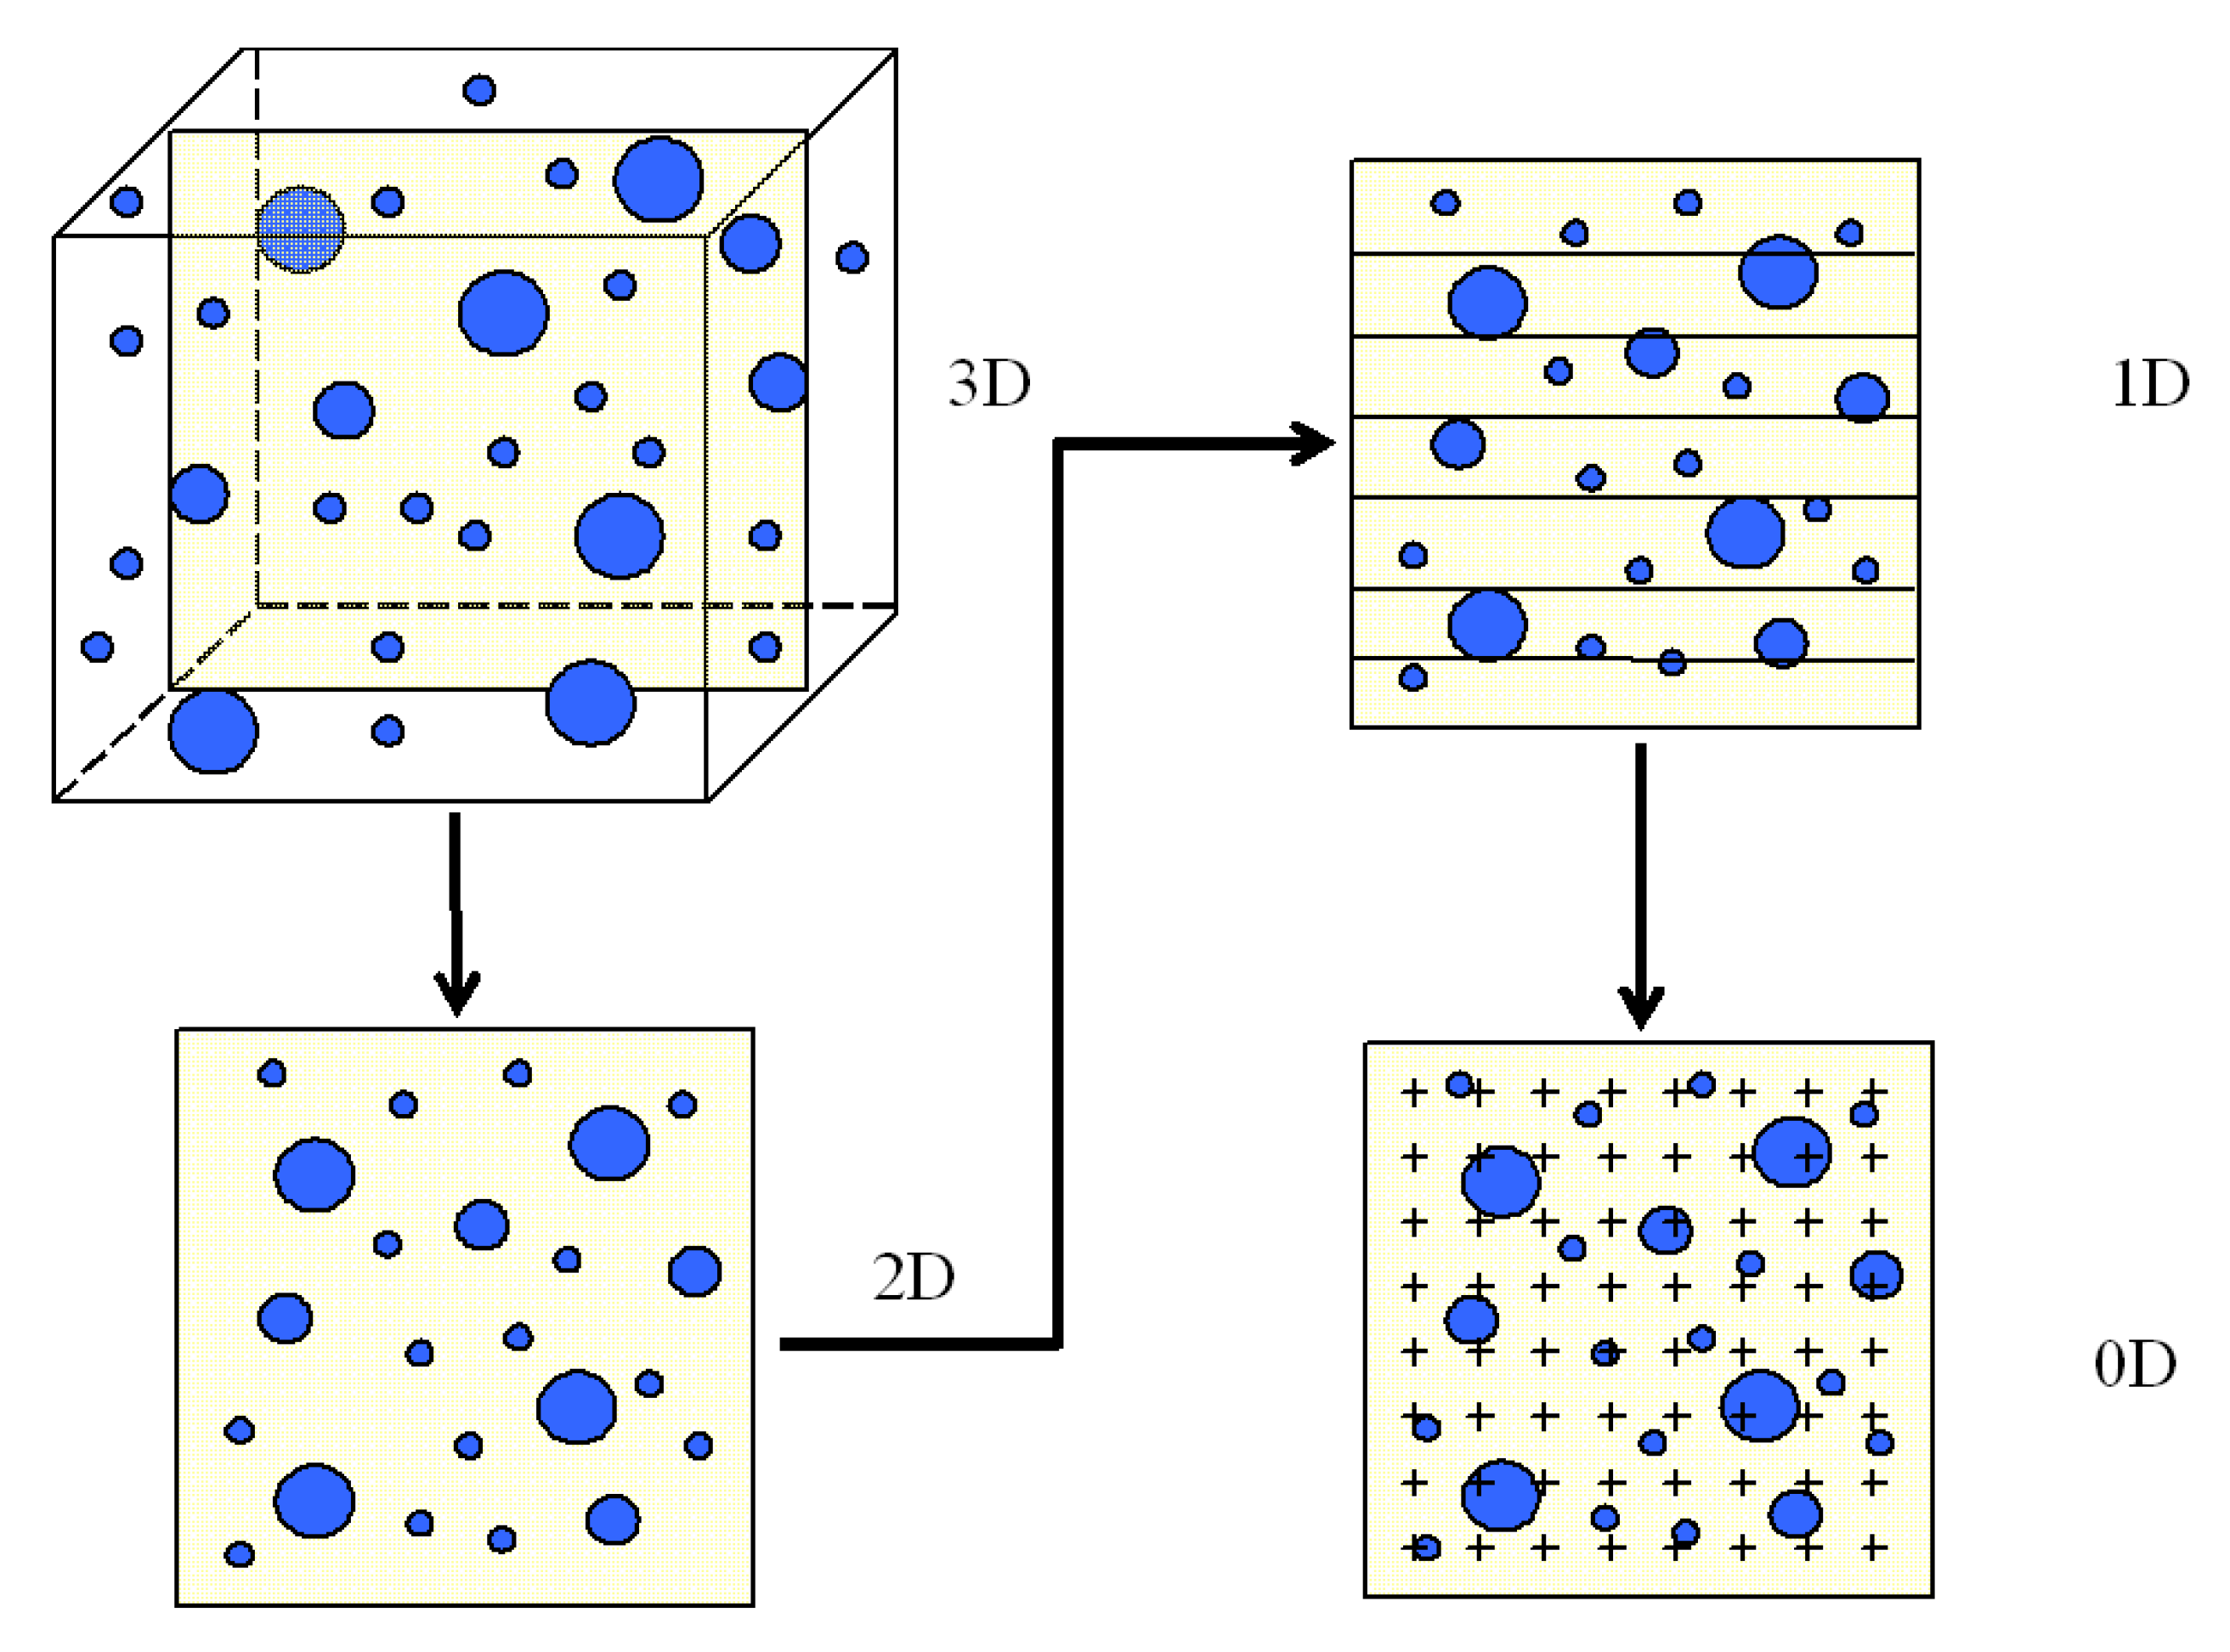
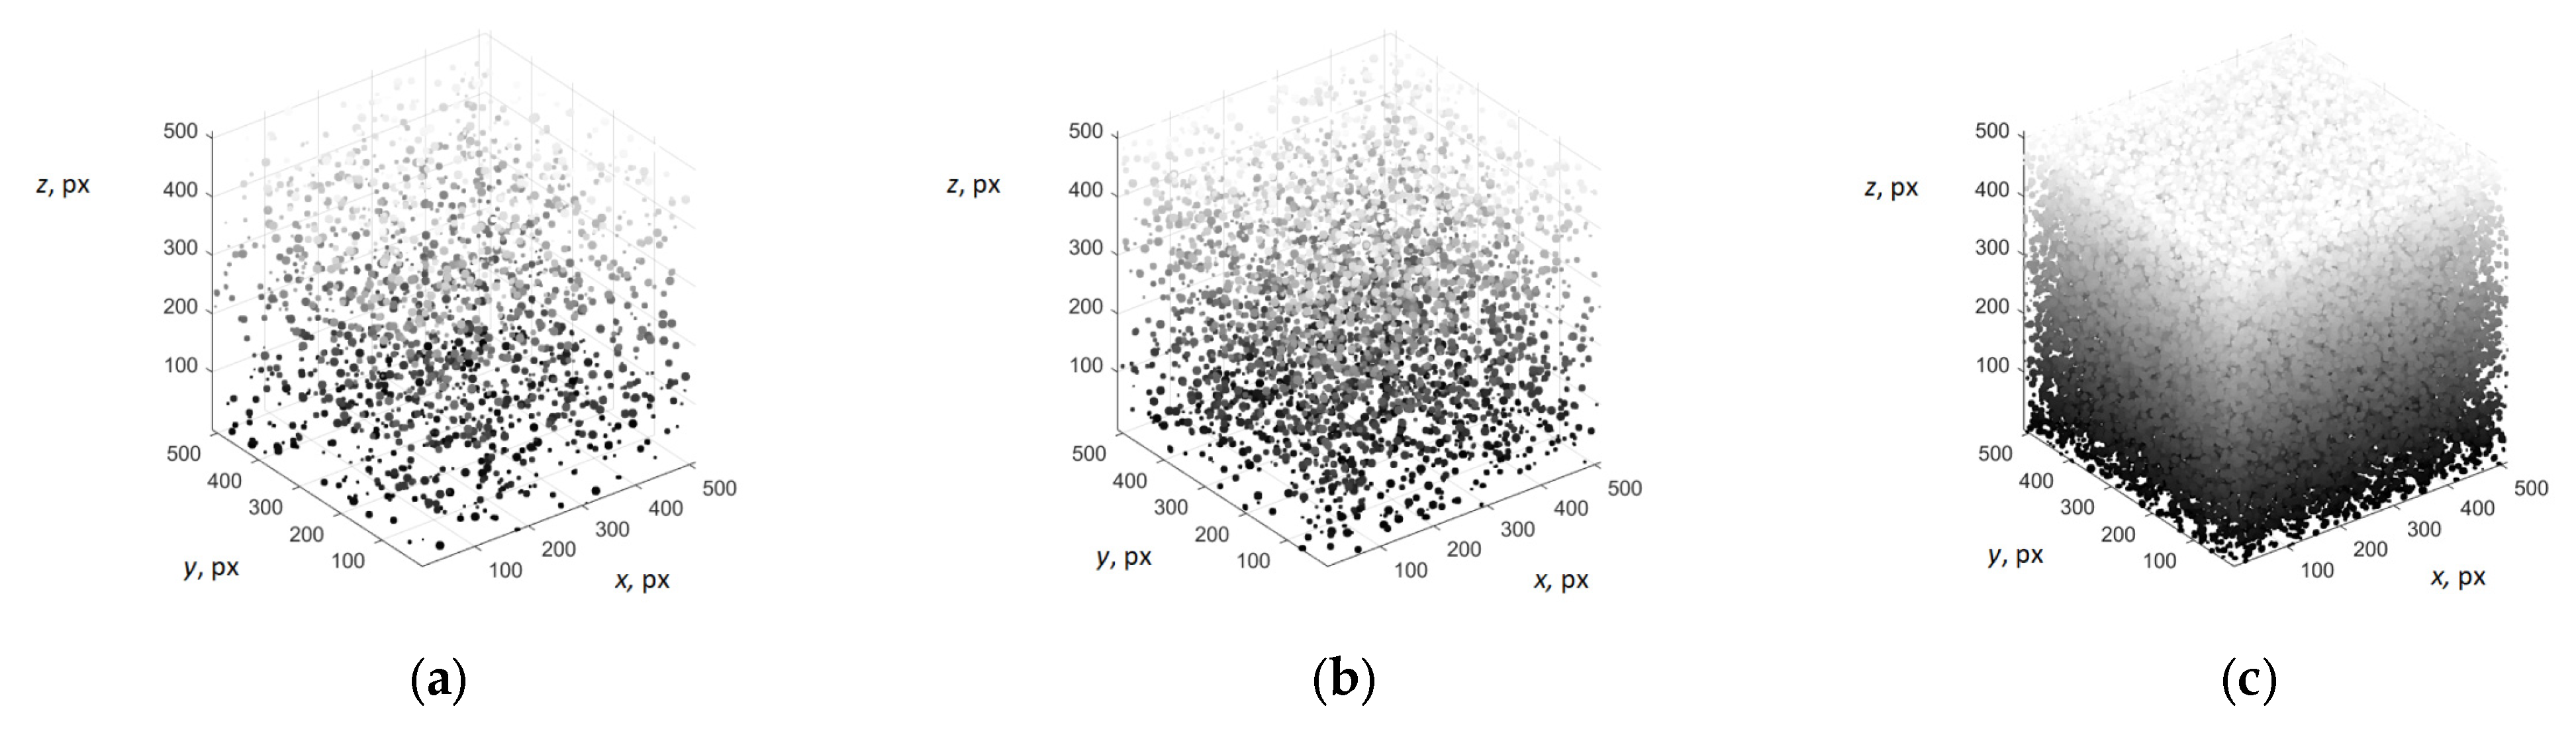
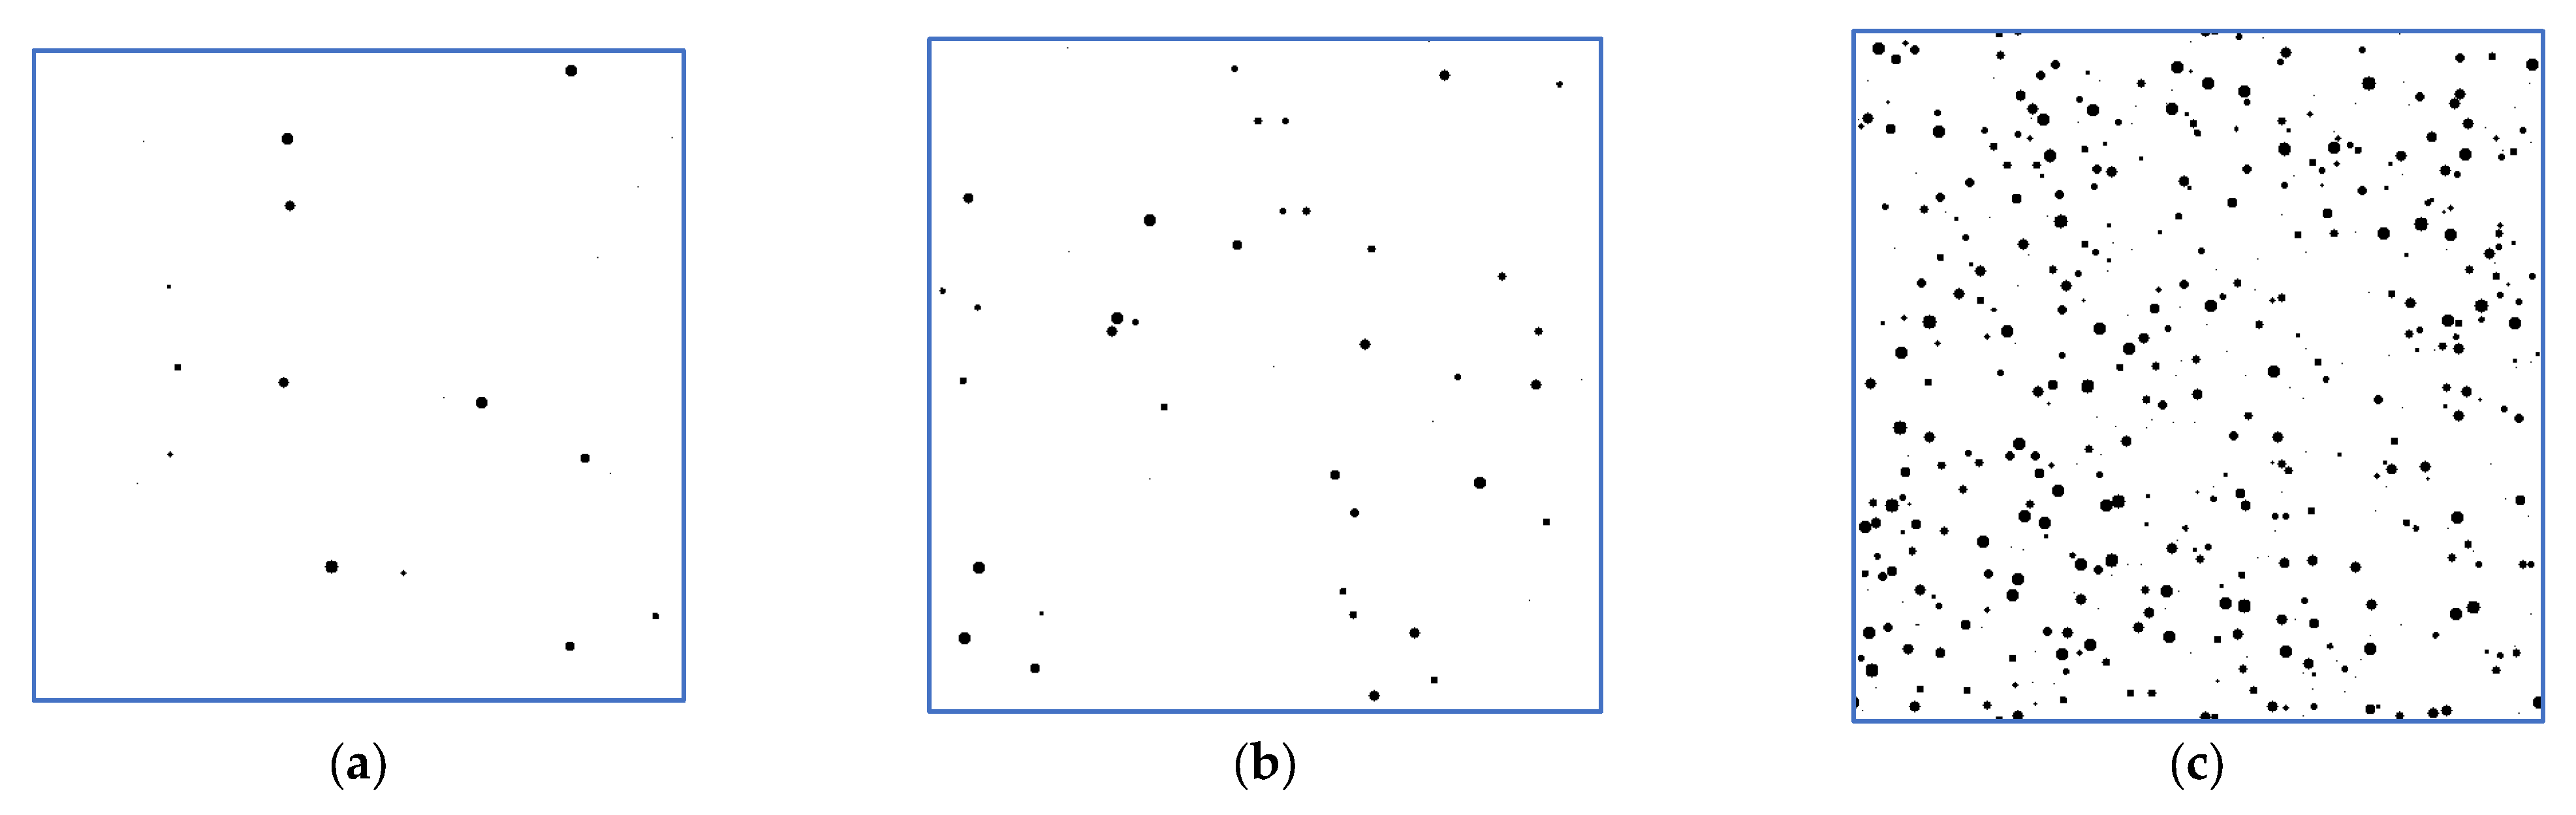
to perform a three-dimensional modelling of the distribution of air voids in concrete, to study the distribution of voids estimated from two-dimensional sections and thus justify the estimation of the three-dimensional distribution from two-dimensional images;
to develop a method for segmenting air voids in the images of sections of concrete test specimens.
It should be noted that this study does not explore how the environmental factors affect the air void formation and concentration during the curing period.

2. The Literature Review

Let us look at the primary methods of studying porosity by image analysis. Optical non-destructive testing methods, such as ultrasonic, magnetic, radiographic, etc., are widely used to determine the condition of concrete products, buildings, and structures, particularly critical infrastructure. The simplicity and accessibility of modern means of obtaining images in digital form and the development of methods for their processing stimulate their all-round application in various branches of industry, science, and technology, including construction for assessing the roughness, porosity, structural state, and homogeneity of hardened cement-based mortars.
Concrete surface images of different scales are used in [31,32,33,34] to determine micro- and macro-voids. To achieve minor errors, it is essential to obtain high-quality images. Therefore, the authors of the aforementioned papers pay special attention to sample surface preparation (grinding and polishing) and apply additional image processing algorithms that increase their contrast. An important step is the selection of the binarization threshold, the main image processing parameter on which the reliability of void detection largely depends. In particular, in the paper [34], the Otsu automatic threshold binarization algorithm was used at the beginning of processing and then its value was adjusted manually. The methods for contrasting voids in images, such as painting the surface with black paint and applying fine white powder that accumulates in the voids, are also described.
The emergence of simple image registration and processing methods has significantly simplified the possibility of practical use of the stereological method [35] for establishing quantitative indicators of the volume distribution and void size in concrete. It is assumed that the voids have a convex shape [36]. The advantage of this approach is the fundamental ability to quantify both open and closed voids. An analysis of the errors that arise when applying stereological methods to estimate the equivalent void diameter in a volume from two-dimensional images is given in [37]. In general, the techniques developed in metallography are successfully used to study various characteristics of concrete, particularly the effect of the size of coarse aggregate on its frost resistance [38].
The above works do not establish a link between the number and size of voids and concrete strength. In addition, the authors focus solely on determining the quantitative indicators of spherical voids, which are typical for concrete foamed with special additives. Implementing the above approaches requires lengthy surface preparation, which is extremely difficult to provide.
The possibility of determining the strength of concrete based on the texture of images (percentage of aggregate, cement matrix, and macrovoids) was shown in [39], where images obtained with a digital camera were used, and in [40], where images obtained with an electron microscope were used. In the study [39], a relationship between the parameters obtained by digital image processing methods and the compressive strength of concrete was established based on regression analysis. Such methods make it possible to evaluate the characteristics of concrete based on empirical knowledge and preliminary data obtained in the laboratory.
A description of various image processing methods used to determine the composition of multiple components of hardened concrete can be found in [41,42]. Evaluation of the dependence of the strength of foamed concrete on the number of voids and the deviation of their size from sphericity was investigated in [43]. Optimization of technological modes of forming voids of a given size and number in foamed concrete is used in the construction of tunnels described in [44].
The results of recently published works confirm the relevance of research in obtaining information about concrete based on the analysis of its surface images. For example, in [45], voids of various sizes were detected by neural networks based on the processing of concrete surface images and the authors assessed the quality of concrete by their relative area and maximum diameter. Using image analysis methods, they studied the properties of cement stone formed in new concrete compositions with additives of natural lime materials. They found an almost linear dependence of their strength on the number of voids [46].
The presence of voids in the concrete structure is one of the critical factors affecting its strength. Even a small number of voids can significantly affect the strength of concrete. Therefore, detecting voids in concrete should be given considerable attention. Detecting them is complicated because the voids do not differ in colour characteristics from the conditional background, so their detection requires additional manipulations with concrete samples.
The 2016 version of ASTM C 457, “Standard Test Method for Microscopic Determination of Parameters of the Air-Void System in Hardened Concrete”, includes a contrast enhancement procedure [47]. This standard describes the procedure of determining the parameters of the air-void system in hardened concrete through microscopic examination. The parameters are air content, specific surface, void frequency, spacing factor, and paste-air ratio. It includes linear-traverse method, modified point-count method, and contrast enhanced method. The procedures require a skilled and experienced operator to use a microscope to fulfil the necessary measurements. Studies show that the amount of air and the size distribution of air voids are essential for the frost resistance of concrete [48]. According to a study by Mehta and Monteiro [49], a 5% increase in the presence of air voids reduces the strength of concrete by 25%.
The cross-sectional area of the concrete can be analysed by linear analysis (1D). The development of automated image analysis methods allows data from a polished concrete cross-section to be obtained in three ways: point analysis (0D), linear analysis (1D), and cross-sectional analysis (2D) [38] (see Figure 1).
Wolter et al. [50] used close-range photogrammetry to automate the analysis of air voids in hardened concrete without contrast enhancement. First, polished flat concrete sections with different air contents (void numbers) were analysed using photogrammetry. Then, classical and contrast enhancement techniques were applied to the same flat sections. The method based on photogrammetry showed some potential, but the smallest air voids could not be detected during the research. This requires a higher camera resolution and/or noise reduction techniques.
Warren [51] used turpentine and fluorescent dye No. 5GA (Magnaflux Corporation) to fill the voids of the concrete. The surface was photographed under ultraviolet light and the void sizes were manually determined.
The authors of [38] used a fluorescent powder to fill air voids for better contrast and to facilitate the separation of voids from the background. Then, using ultraviolet light to highlight the air voids and conventional light to detect the aggregate particles, six images of 30 × 80 mm in size with a resolution of 3.4 μm/pixel were taken for each concrete section. The paper presents a comparative analysis of the air void structure parameters obtained from actual concrete samples, including the aggregate-air-paste system. These characteristics were obtained in three ways:
(1)
Based on significant simplifications adopted in the Powers model and the linear analysis method.
(2)
By the Philleo method [52]. The method proposed by Philleo requires only knowledge of the total air volume in the paste and the number of voids per unit volume of the paste.
(3)
Using a method that takes into account, in addition to the actual structure of air voids and aggregate grains, surface measurements.
The differences in the results for the three methods analysed indicate that the approach based on the influence of aggregate and air voids on the structure is more accurate than the other approaches. The authors believe that a better description of the void structure parameters will allow them to be more accurately related to the freeze-thaw resistance of concrete.
Schouenborg et al. [53] analysed the basic methods for estimating air content:
  • The line-traverse method records the number and lengths of chords longer than 0.008 mm of air voids along a set of test lines (traverses). The ratio of the total length of the chords to the length of the test lines determines the air content in the test sample.
  • The modified method of counting points calculates the number of void fragments that cross the traverse lines and the frequency with which equidistant points (index points) fall on the voids. This method does not provide a distribution of voids by size.
The basic formula for calculating air void content is as follows:
V l = l l l t o t · 100 % ,
where l l is the length of the chords in the air voids and l t o t is the total length of the test lines.
The distribution of air voids by size is calculated as follows:
n d , j = 2 π · n a , j j a j n a , j + 1 j + 1 a j + 1 ,
where n d , j is the number of air voids per volume with class size d j ,   d j + 1 ; n a , j is the number of chords in the voids per unit length with class size d j ,   d j + 1 ; j = d j + 1 d j ,   a j = d j + 1 + d j / 2 .
The air content with a class diameter d j ,   d j + 1   is calculated by the formula
V l , j = π 6 · n d , j a j 3 .
3.
Contrast enhancement techniques—image processing methods that increase images’ local or global contrast.
Molendowska [54] studied the effect of image quality on the results of determining the parameters of air voids in concrete. The focus was on technical aspects of preparing a scanned image of a concrete surface, which was then subjected to two-dimensional surface analysis. Image processing aimed to separate connected voids and eliminate various aggregate and cement mortar defects. The specific void surface area was determined using the equivalent diameter or perimeter of the air void as the basis of the calculation. The three-dimensional distribution of air voids was reconstructed using the Schwarz–Saltikov method based on 2D measurements. The results of the 2D method were compared with the results of the linear displacement method (1D) by EN 480-11 (“Additives to concrete, mortar and liquid cement mortar. Test methods.”). The tests confirm the need for image correction before measurement. Comparative tests showed a good correspondence between the parameters of the air void system determined by 2D analysis and the chord length method according to EN 480-11. The NIS-Elements program was used to analyse the input image. Lines were drawn along the image and the chord lengths were measured manually using the NIS-Elements tool. NIS-Elements records the chord lengths and allows you to export the recorded data to a spreadsheet. When input data such as paste volume and total line length are added, the calculations are completed according to EN 480-11. The NIS-Elements program separates the voids in the clusters automatically or manually using image editing tools. During the analysis, three options for separating air voids were adopted: no separation, automatic separation, and manual separation.
Ojala et al. [37] investigated the estimation of air voids in concrete by digital image analysis combined with the Schwarz–Saltikov transform. The results show that their combination estimates the air content with greater accuracy than without the Schwarz–Saltikov transform; the correlation between the air content obtained by the digital image analysis method and the thin section method is as good as the correlation between the pressure saturation method and the thin section method. The voids on the surfaces were filled with epoxy paste with blue pigment. Excess epoxy was removed by sanding with 60, 120, 200, and 400 grit abrasive papers. The maximum sanding height was limited to 0.2 mm. All the voids thus appeared perfectly blue, while the rest of the area remained unchanged (i.e., the cement stone and aggregate were visible). The surface roughness is significant, as any surface defect can be mistaken for an air void and thus cause a significant error. An Epson Perfection V370 Photo flatbed scanner (Shinjuku, Tokyo, Japan) digitized the surfaces. A 70 × 70 mm square scanning area was chosen to cover the samples’ circular cross-sections. It turned out that 1200 dots per inch (DPI) provided the optimal spatial resolution and speed during the scanning process, corresponding to 0.021 mm/pixel.
Digital image processing, in particular the method of multiclass level-grid segmentation, provides effective detection of defects in complex textures [55]. In [56], such approaches were used to identify dimples in fractographic images, and in [57], to determine damage zones in a non-metallic brake pad material, similar to the problem of detecting voids in concrete.
Threshold segmentation methods based on the Otsu method are widely used in investigations of porosity. Rezaei et al. recognized the single-threshold and two-threshold Otsu algorithms as the best among global threshold methods when studied the effectiveness of different thresholding techniques in segmenting micro CT images of porous carbonates to estimate porosity [58]. Many modifications of the Otsu method take into account the features of the segmentation problem being solved. For example, the authors introduce three weighting factors (the fitting curve slope of the mineral content, Otsu threshold, and the approximate percentage of the region of interest in the image) to obtain an improved MP-Otsu [59]. Further 3D fracture model of the coal is reconstructed from the CT image via the developed MP-Otsu and then the permeability is calculated [60]. Otsu segmentation can be applied not only to grayscale images or RGB colour model images, Chengzhen et al. for example developed a multi-stage adaptive Otsu thresholding algorithm working with the HSV colour model and combining segmentation using adaptive thresholds in the Hue (H) channel, complemented by Otsu thresholding in the Saturation (S) and Value (V) channels for void segmentation in rock thin-section images [61].
In general, the literature review shows the relevance of studying the composition and properties of cement mixtures. It substantiates the feasibility of studying air voids in concrete using digital images of the surfaces of sections of concrete test specimens. The problem of correlation between the percentage of voids by area in two-dimensional images of cross-sections and the volume air content in a three-dimensional sample remains open. The novelty of this study is the modelling of a concrete cube with different percentages of air content and the analysis of its cross-sectional images to validate the estimation of the volume air content from two-dimensional cross-sectional images.

3. Materials and Methods

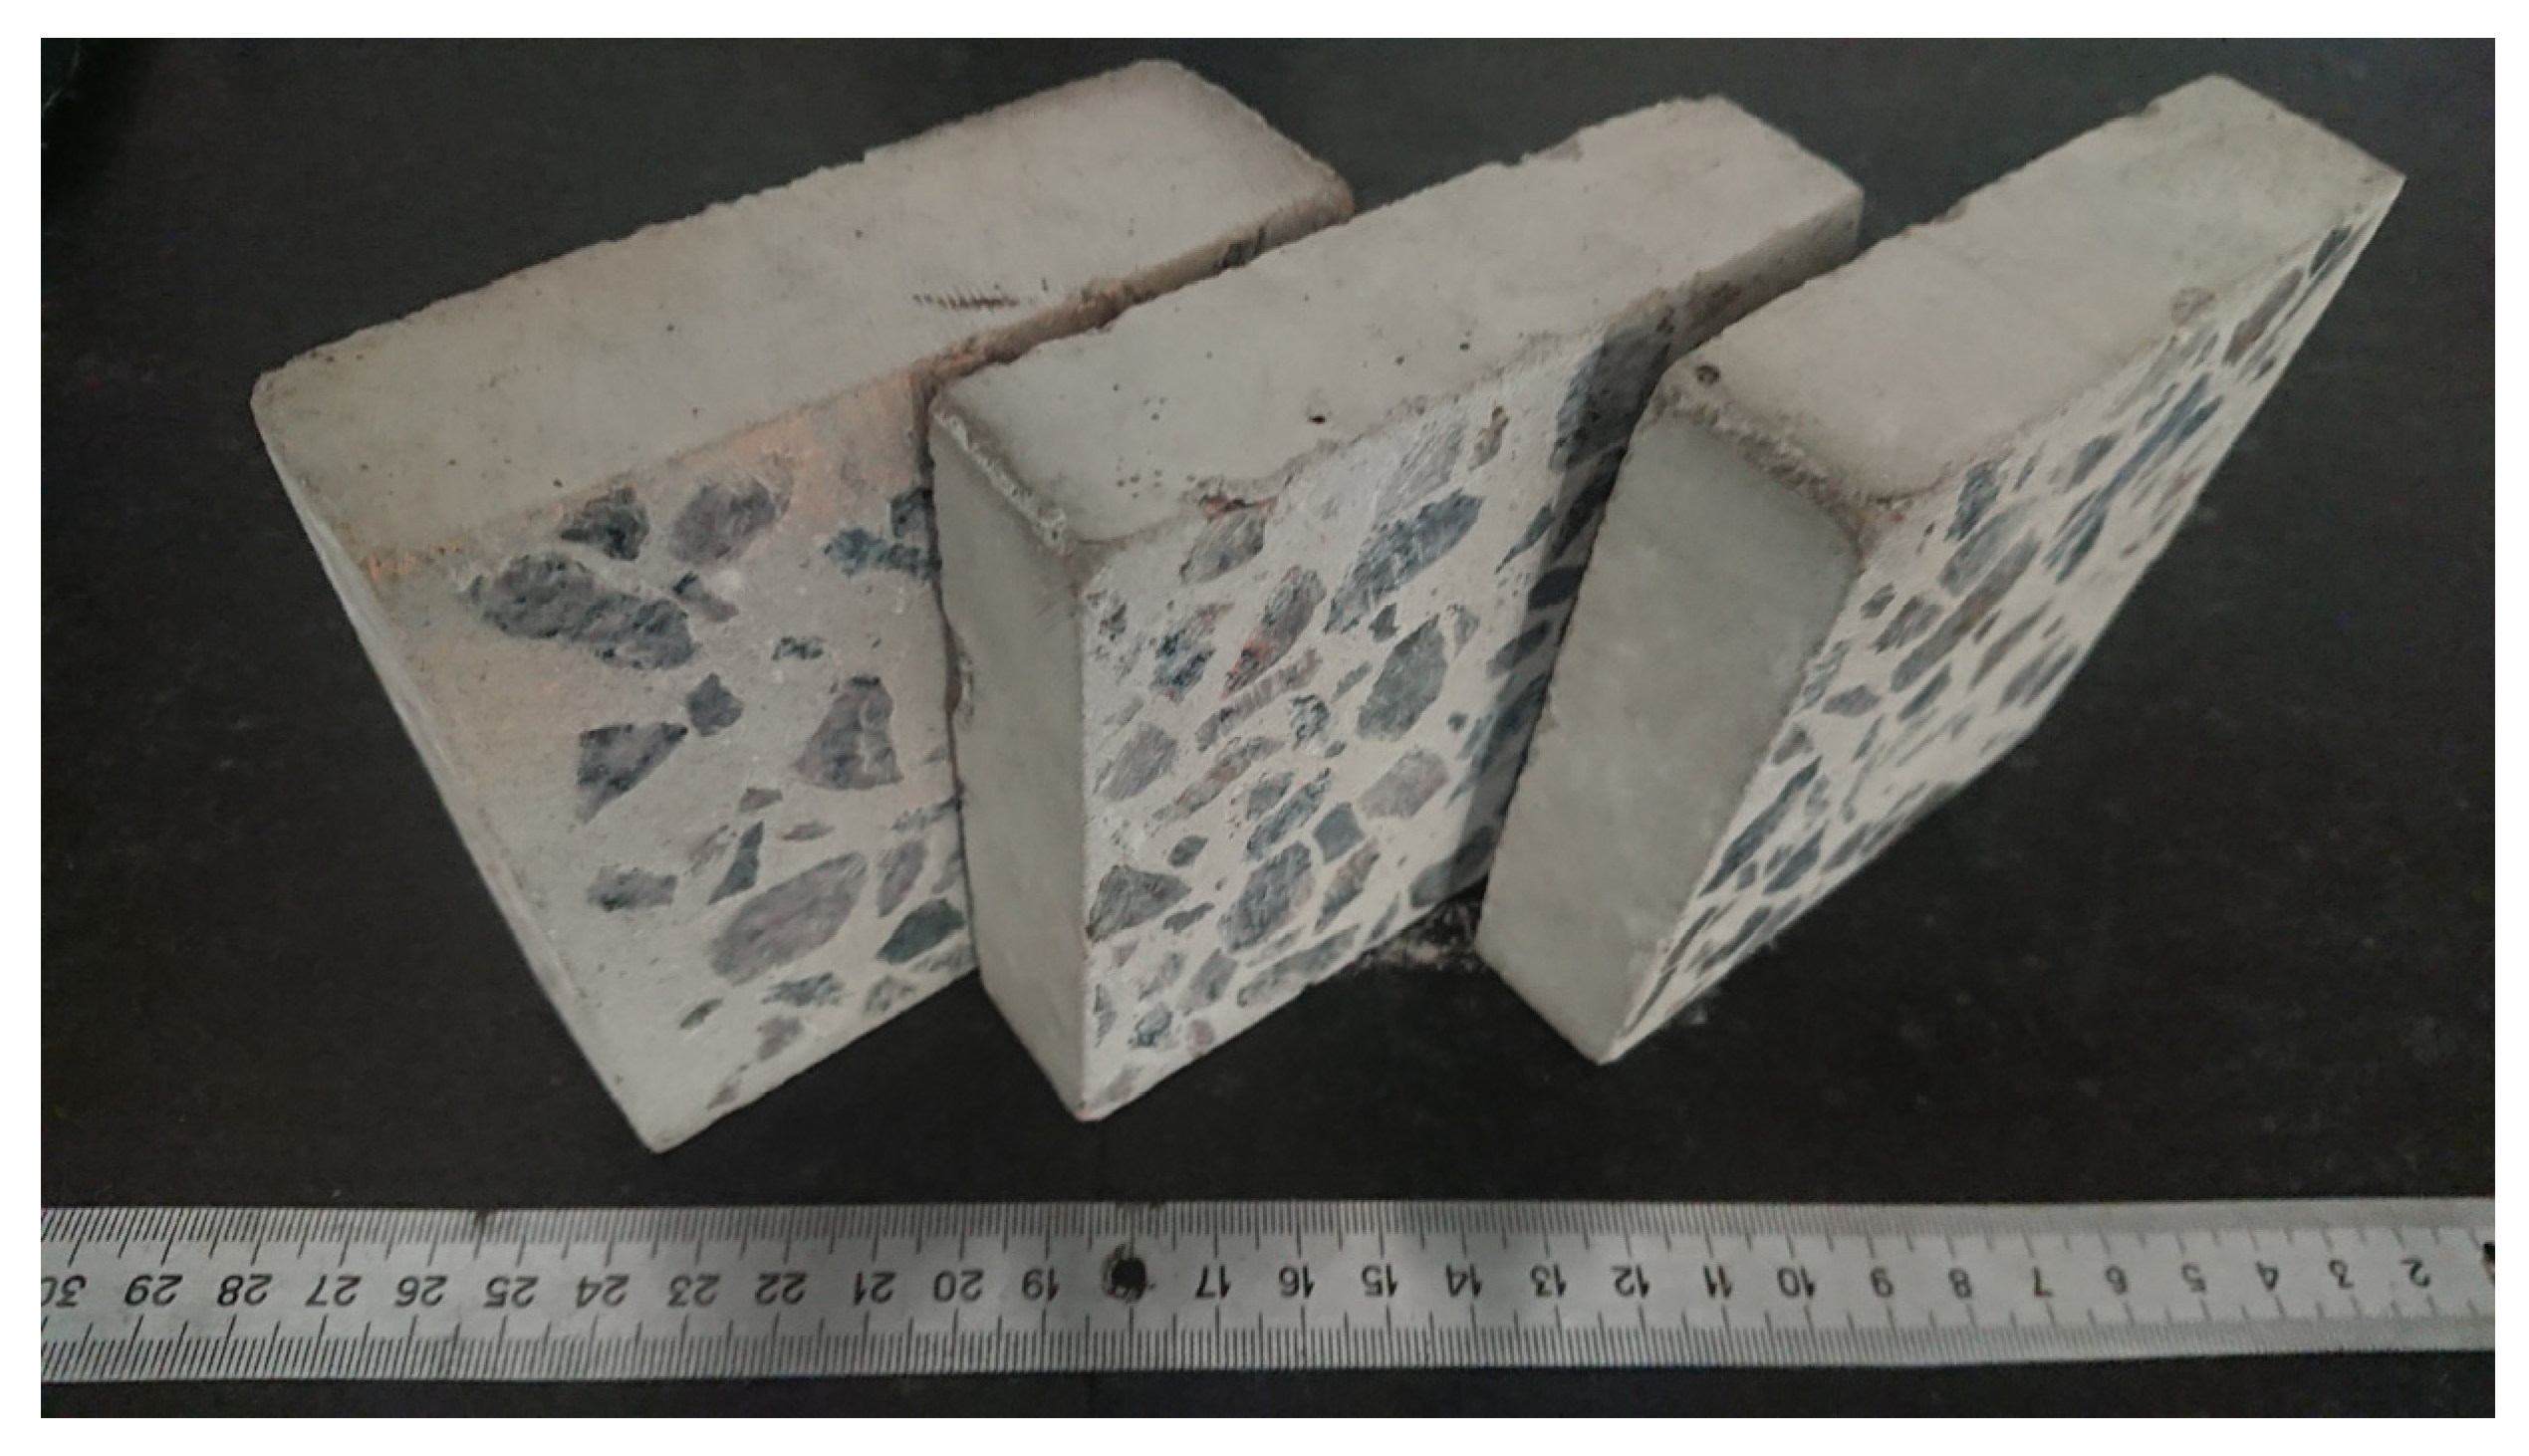
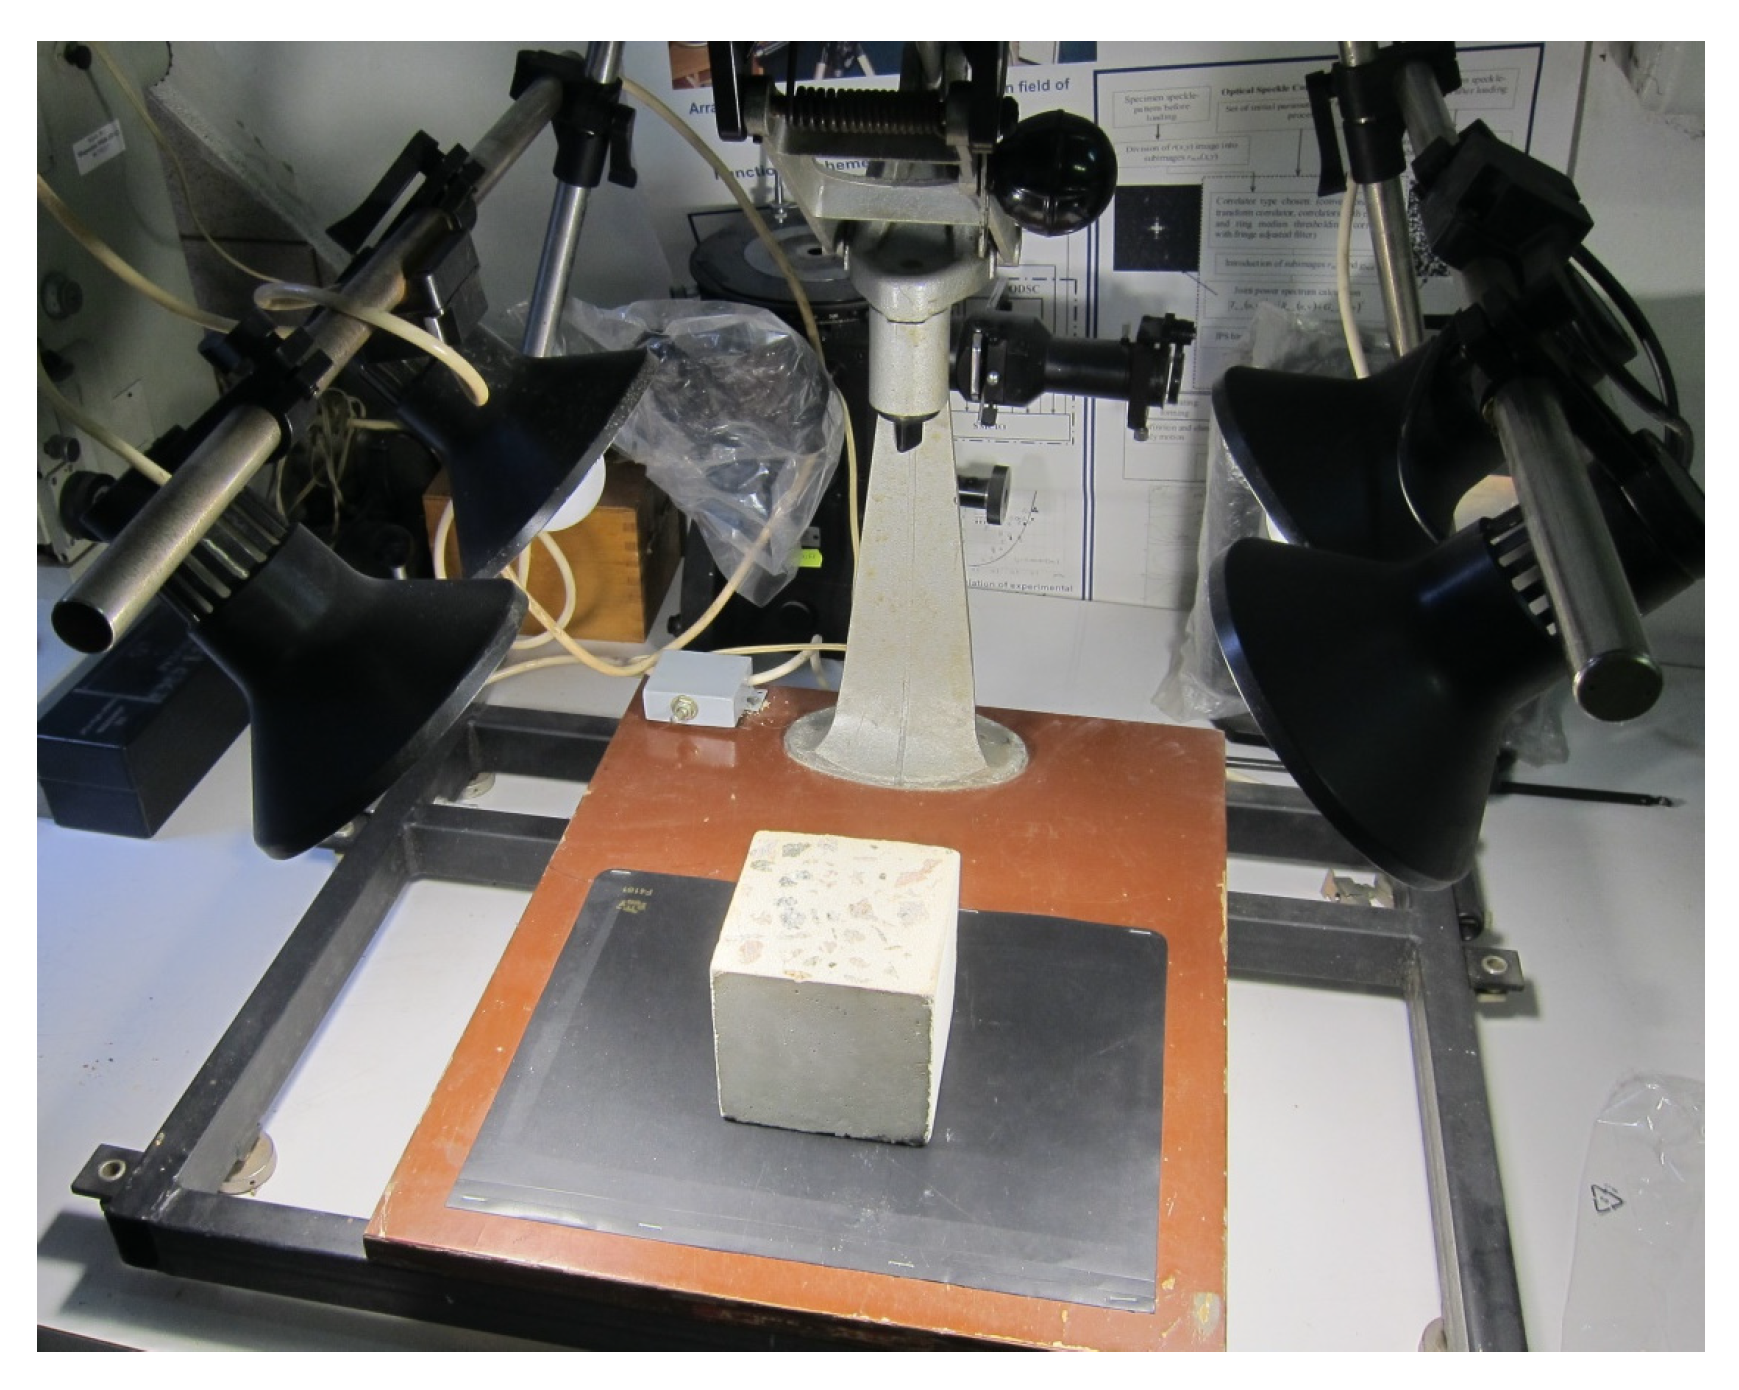
3.1. Materials and Equipment Used in the Experiment

The concrete test specimens were made by Sika-Ukraine LLC (Kyiv, Ukraine) in a cubic shape measuring 10 × 10 × 10 cm using standard technology by simply mixing the components. The concrete solution was poured into steel molds and vibro-compacted. The concrete had hardened for 1 month at room temperature of approximately 22 °C and 80% humidity; afterwards, it was tested. The quantitative composition of the concrete test samples is given in Table 1.
Test sections from cubic samples of 10 × 10 × 10 cm were obtained by cutting on a grinding machine equipped with a diamond wheel. The quality of surface treatment is very important because any surface defect can be mistaken for an air void and thus causes a significant error. So, to achieve a flat surface, each sample was carefully polished on Struers LaboPol-5 grinding machine (Struers ApS, Ballerup, Denmark) using successively finer silicon carbide grinding paper 320 grit (40.5 mkm), then 400 grit (25.8 mkm), and finally 600 grit (15.3 mkm). Compressed air was used to remove dust from the specimen between each polishing stage. The polishing time on each step was between 5 and 10 min. The grinding pressure was increased from 30 N to 100 N in 10 N step. As mentioned, the polishing procedure in this study was stopped at grit 600 because the surfaces at the end of this step had a good quality. Sections of a concrete test sample are demonstrated in Figure 2.
The distribution of voids in concrete was evaluated on sections of cubic test specimens of 10 × 10 × 10 cm made of concrete of different grades (C10, C15, C20, C25, and C30).
Images of the concrete specimen cross-sections surfaces were recorded with a digital camera NIKON D-7000 (Nikon Corporation, Tokyo, Japan) with a Nikon NIKKOR Z 50 mm f/1.8 lens (Nikon Corporation, Tokyo, Japan) mounted on the developed laboratory setup with the ability to change its height from the specimen surface. Illumination was provided by four identical LED light sources placed on each side of the sample at a low height, which makes it possible to use their combinations to obtain images of sections of concrete test specimens at different angles of light incidence. The scale of the images was 30 μm/pixel, which allowed to obtain clear images on which voids with a size of 90 μm and more can be detected. The images acquisition was carried out in an optical laboratory, which excluded any influence of uncontrolled natural light. The resulting images are suitable for several methods for detecting voids in concrete. A photo of the laboratory setup is shown in Figure 3.
During the research, one part of the concrete samples of each brand was tested for compression to obtain the actual value of concrete strength [62] and the other part was cut and photographed to determine the quantitative void size. The cube samples were tested, stored in a positive temperature dry room, and manufactured more than 4 months before the experiment. A total of six specimens of each composition were tested. Three control samples of each concrete grade were tested by the standard method of pressing by ASTM International, C39/C39M: “Standard Test Method for Compressive Strength of Cylindrical Concrete Specimens” [63]. The residual strength of concrete was determined, taking into account a correction factor based on the geometric dimensions of the cube:
R = 0.95 F / S ( M P a ) ,
where F is the crushing force (N) and S is the cube face area (mm2). The remaining cubes of different compositions were cut into three parts, thus obtaining four cut surfaces per sample and photographed after polishing.

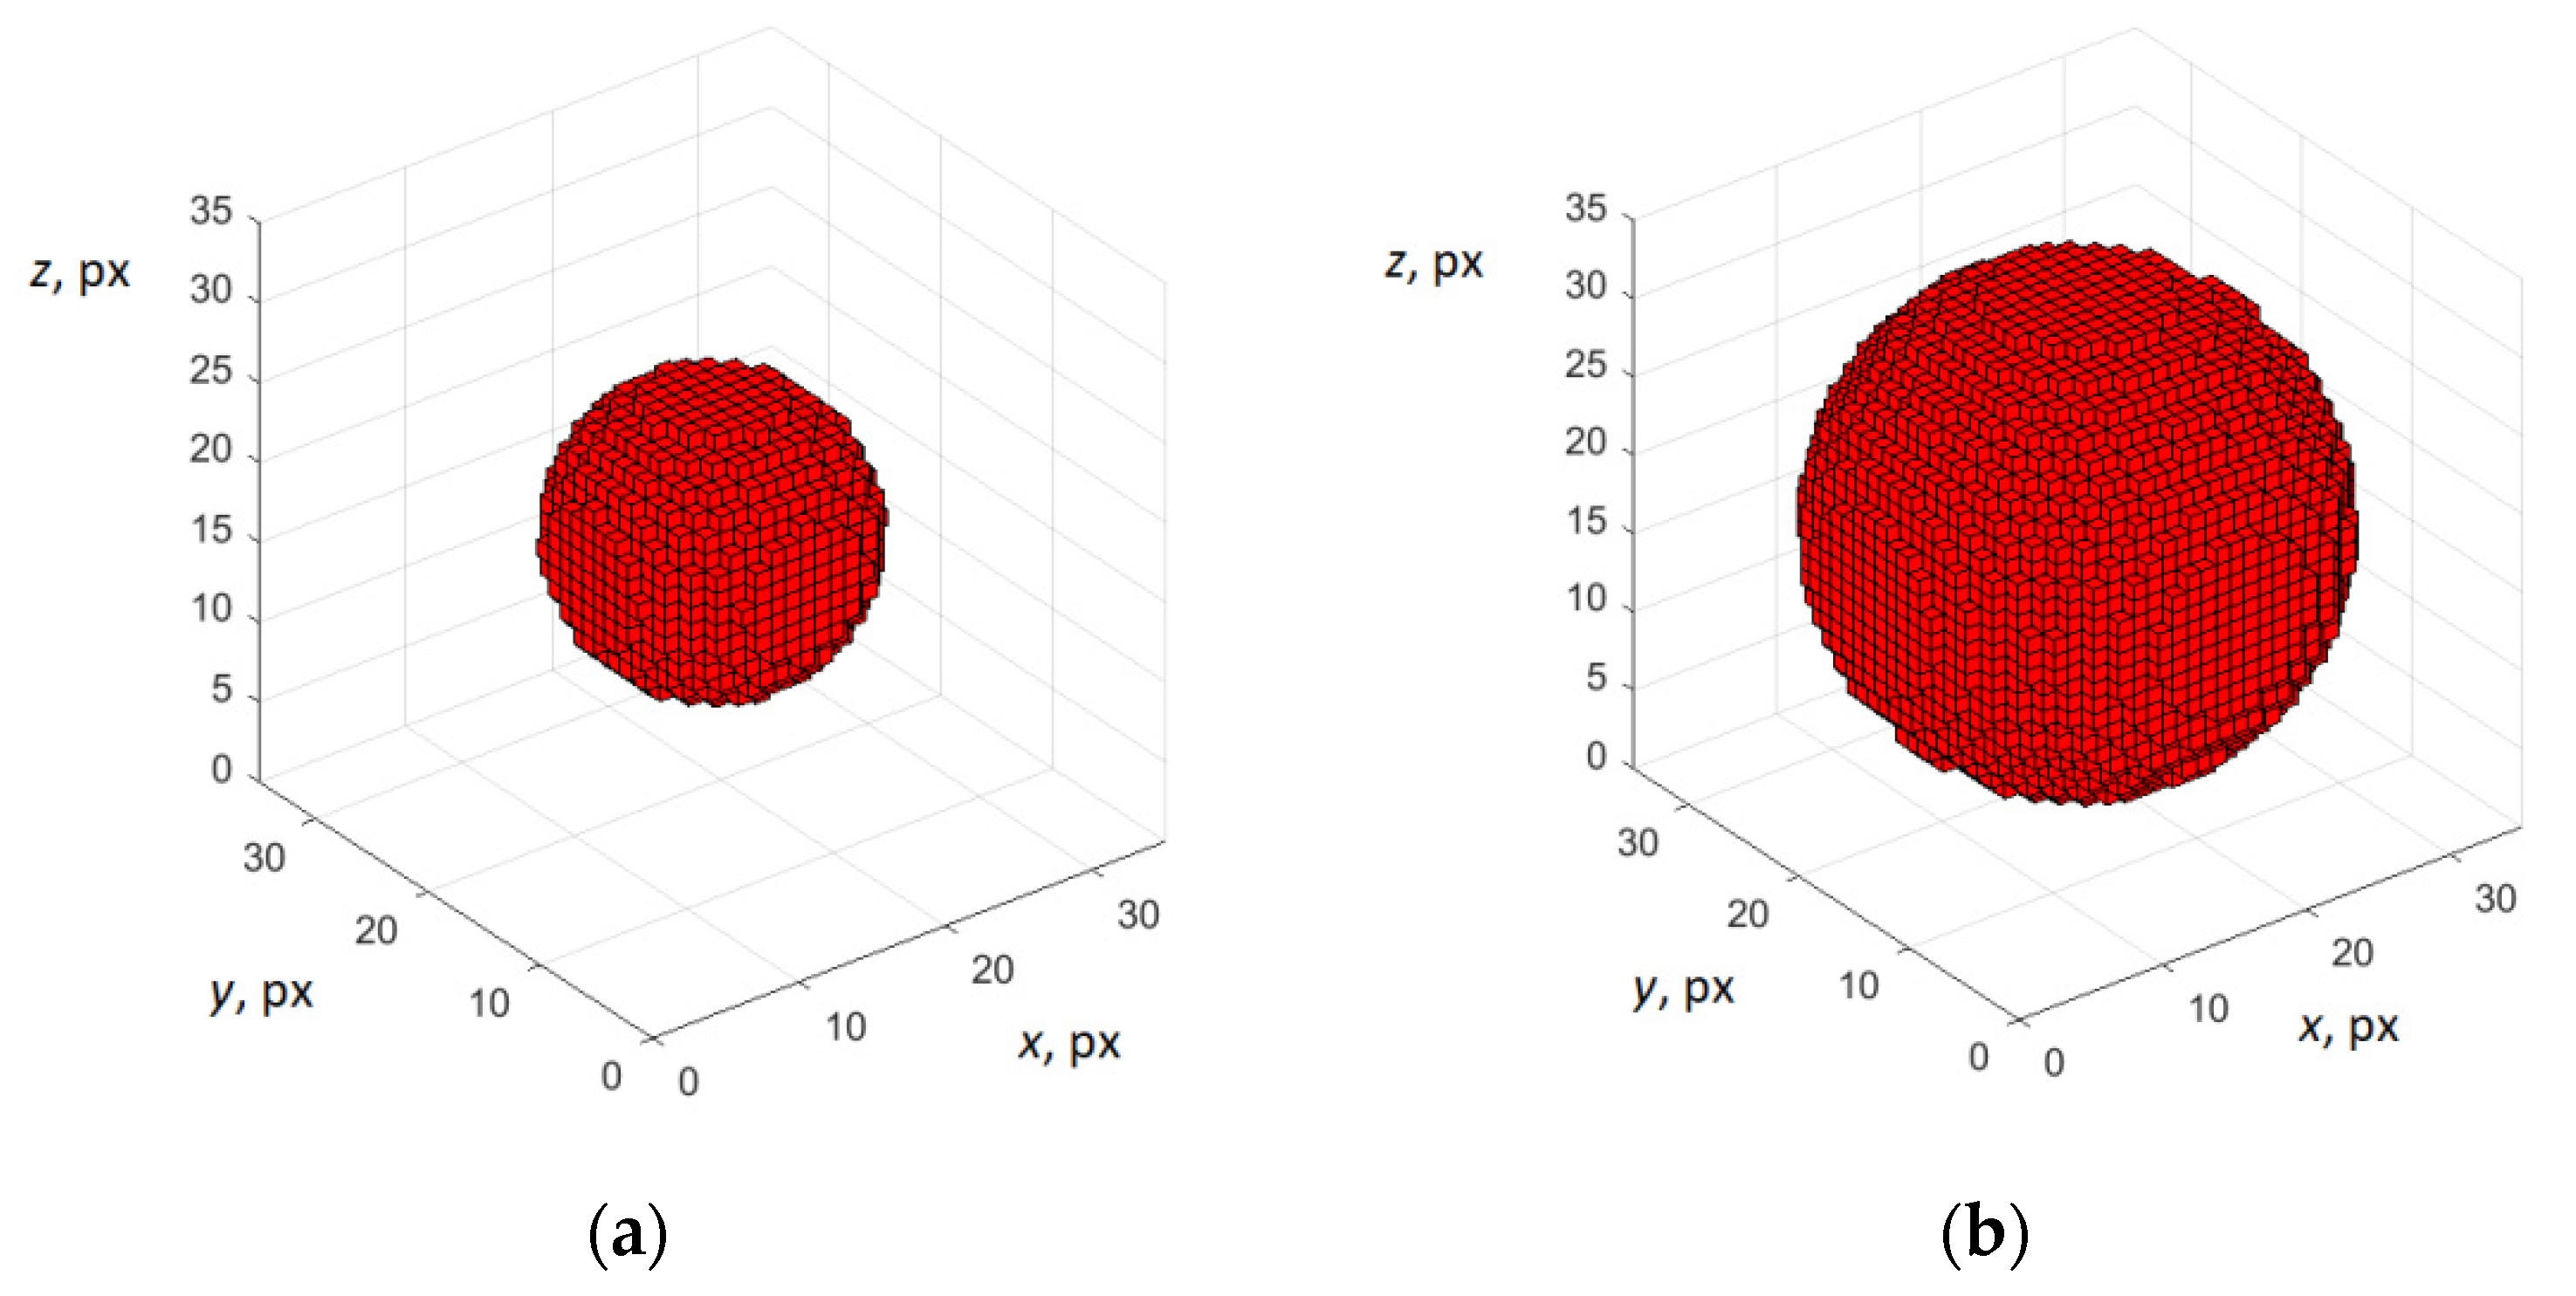
3.2. Methods of Modelling Air Voids in Concrete

The volumetric concentration of air voids is an informative feature that correlates with the concrete grade. To estimate the volumetric concentration of voids by sections, 3D modelling of voids was performed. We modelled a cube of size 512 × 512 × 512 pixels with spheres of different diameters to simulate voids. In Figure 4, the modelled voids of two different sizes are demonstrated.
Next, we modelled the voids in a concrete cube based on a uniform distribution for different volume concentrations. This is a limitation, as voids can form clusters or chains. Modelling such void co-location may be the subject of further research. The modelled distribution with different sizes of air voids in concrete cube and air content of 0.25% (a), 0.5% (b), and 5% (c) is demonstrated in Figure 5. By analysing the images of the slices of the modelled cube, it is possible to calculate the air content by cross-sectional area. Ten images of slices of modelled cubes were analysed in this experiment. Cross-sections of a fragment of modelled cube with air content of 0.25% (a), 0.5% (b), and 5% (c) are demonstrated in Figure 6. Results of modelling air voids in concrete are discussed in Section 3.1.

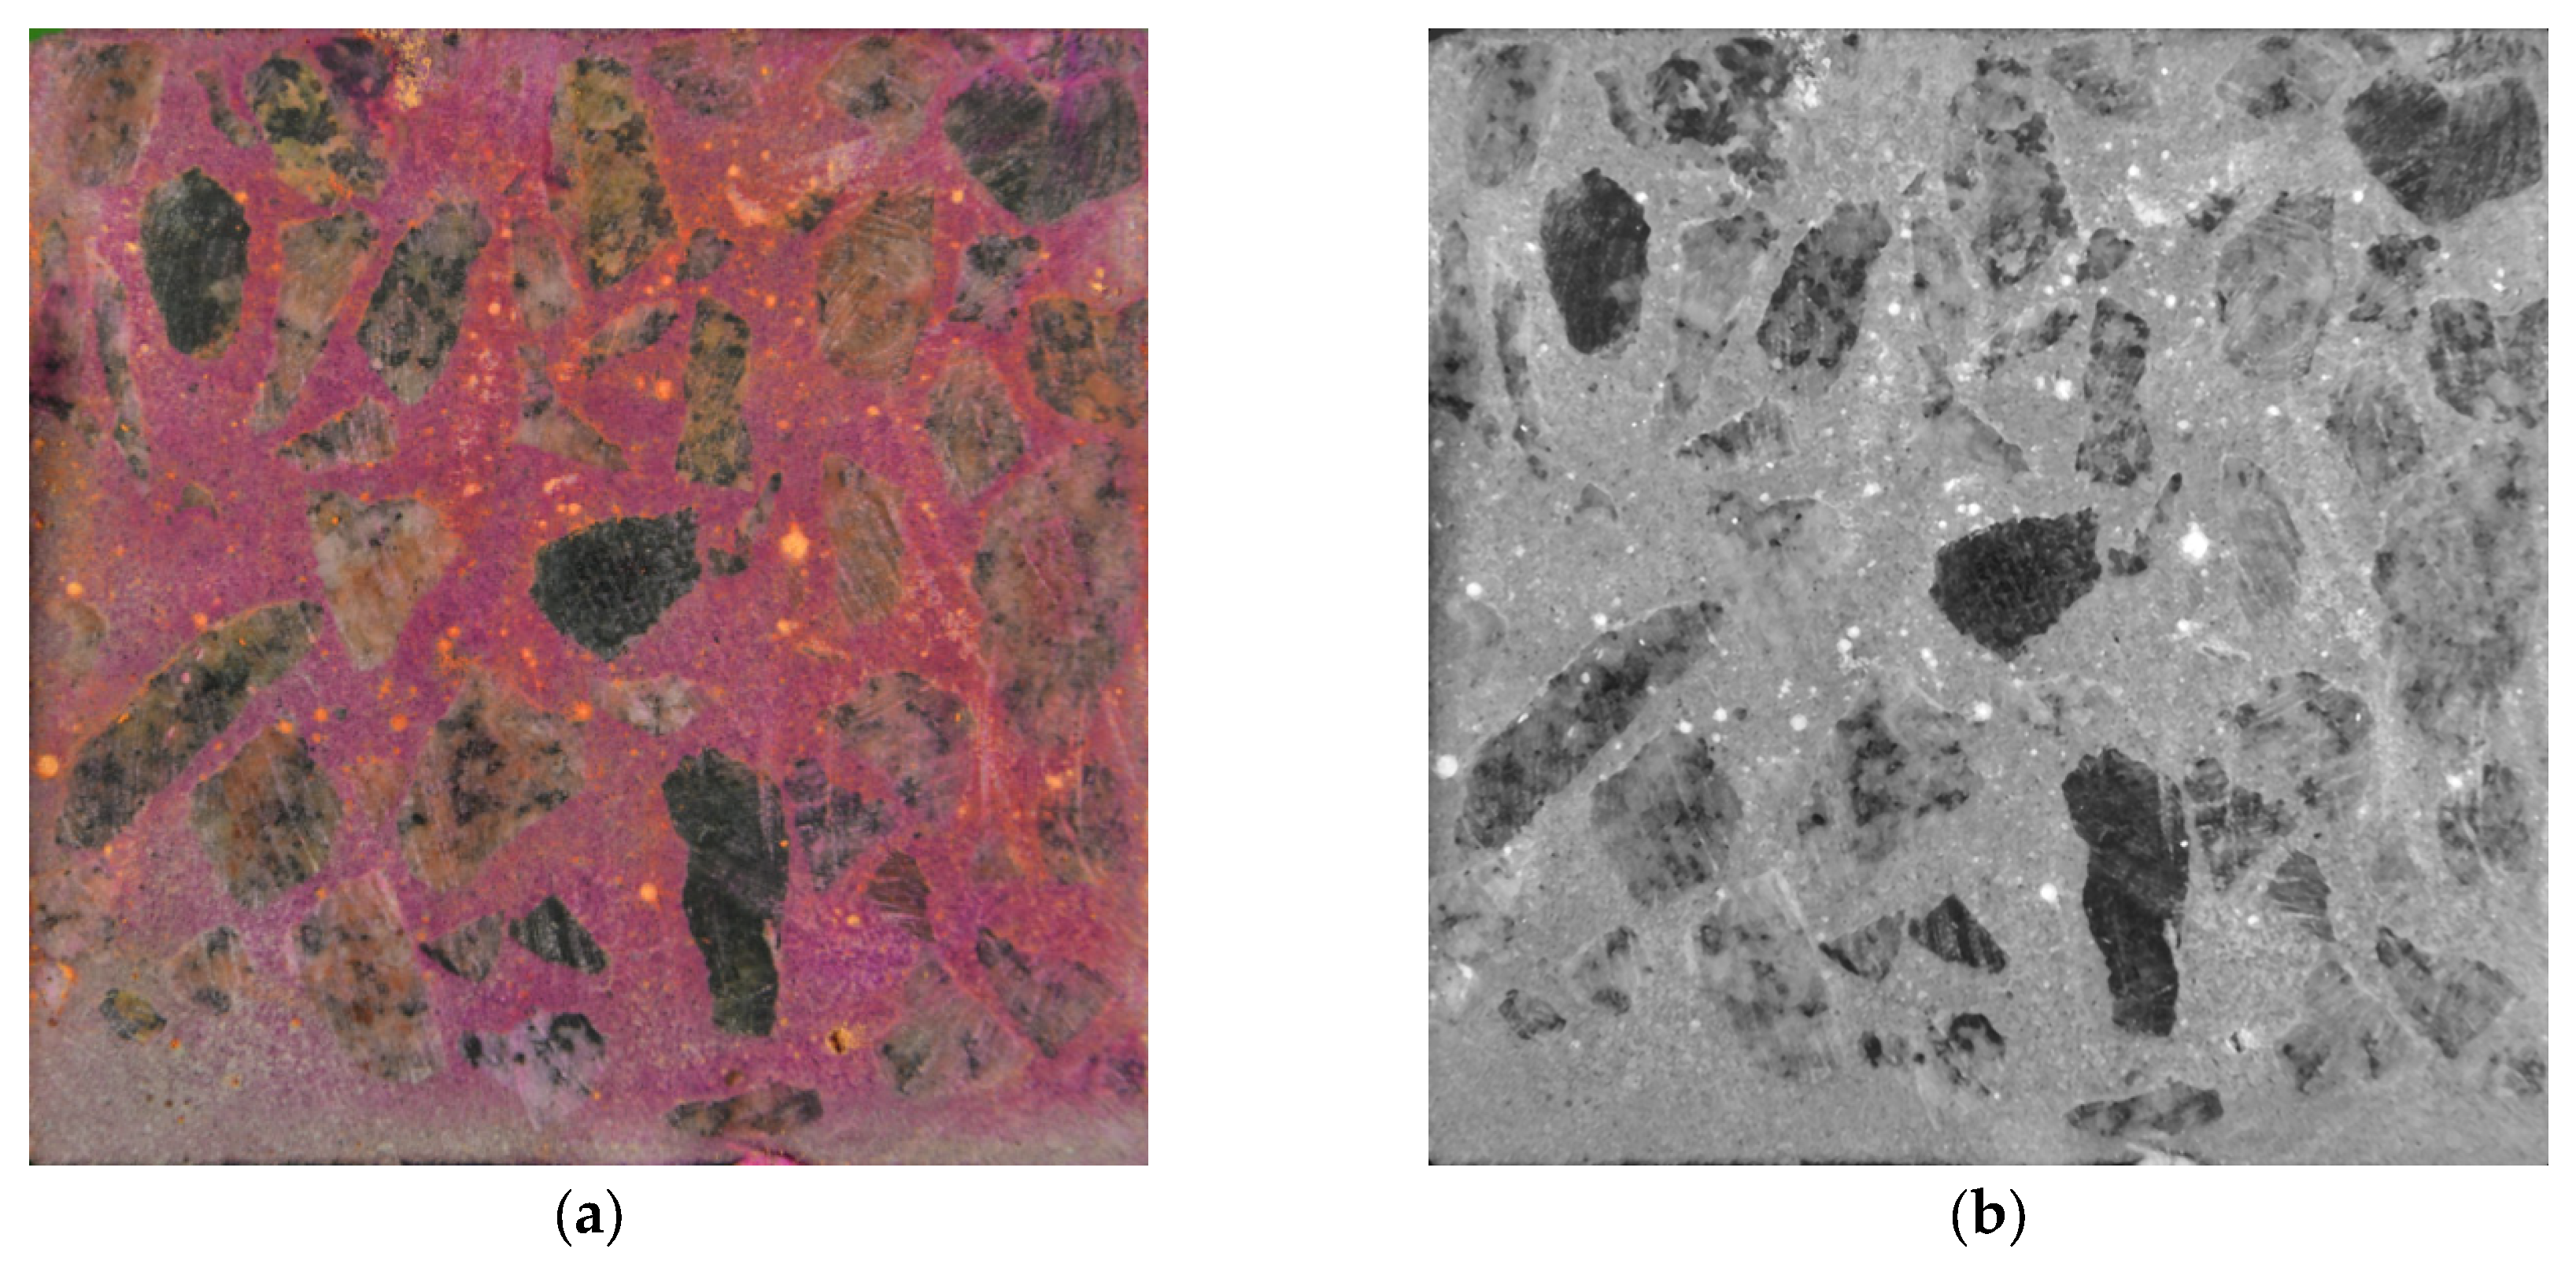
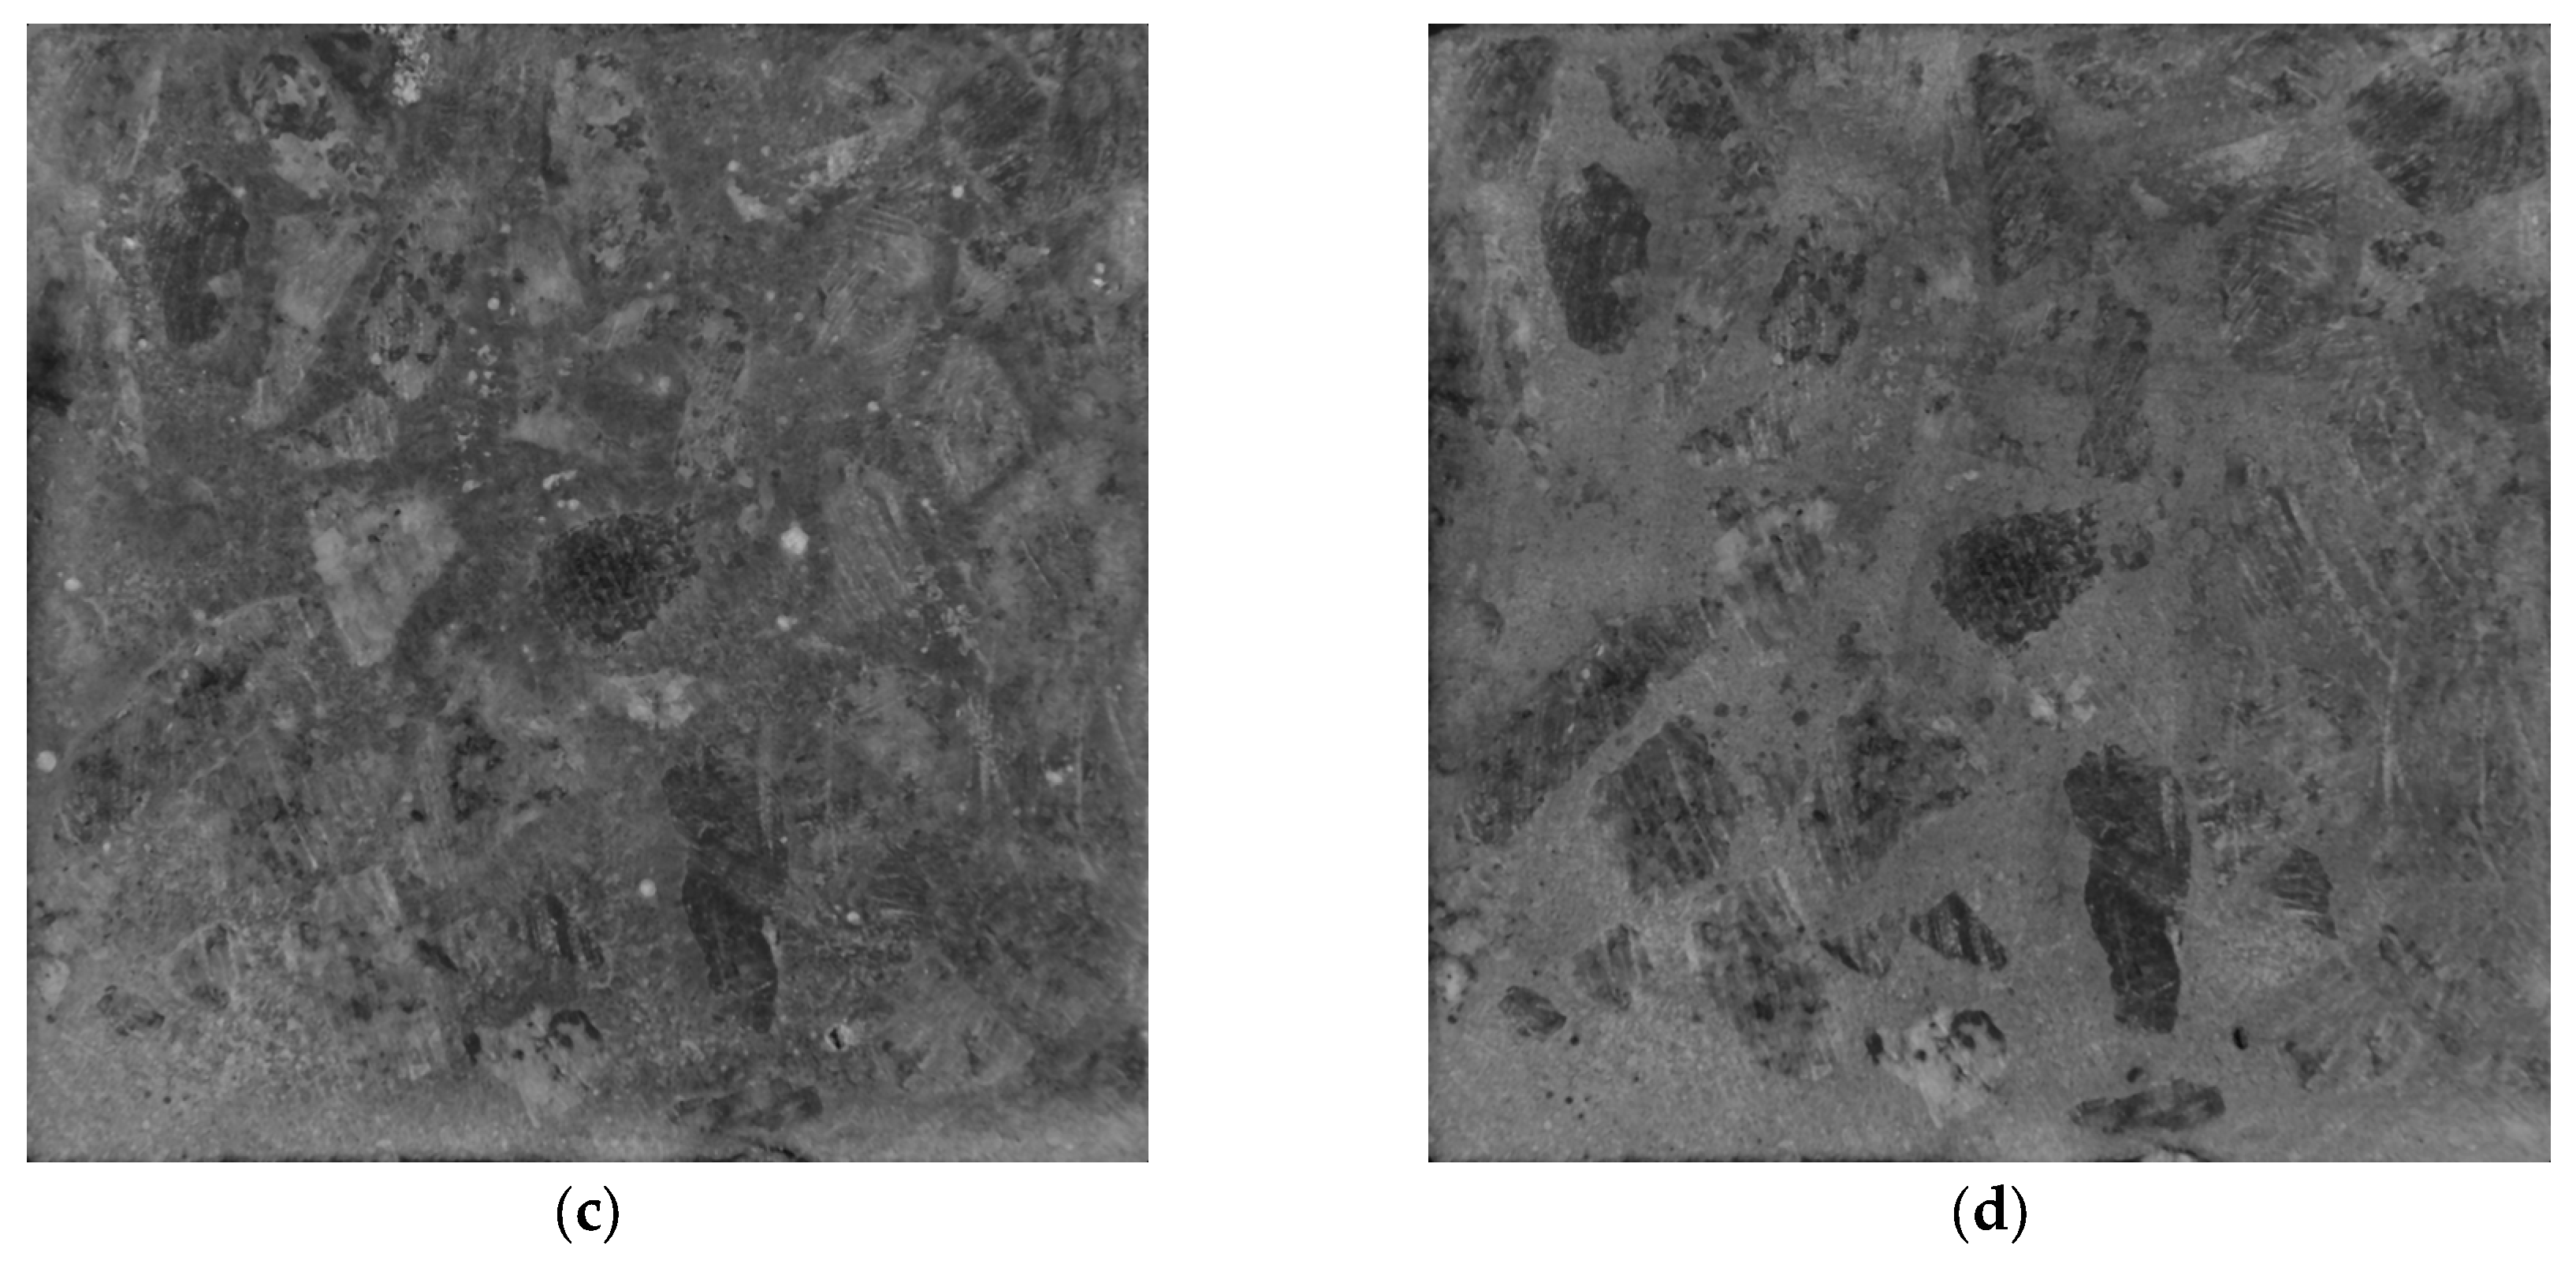
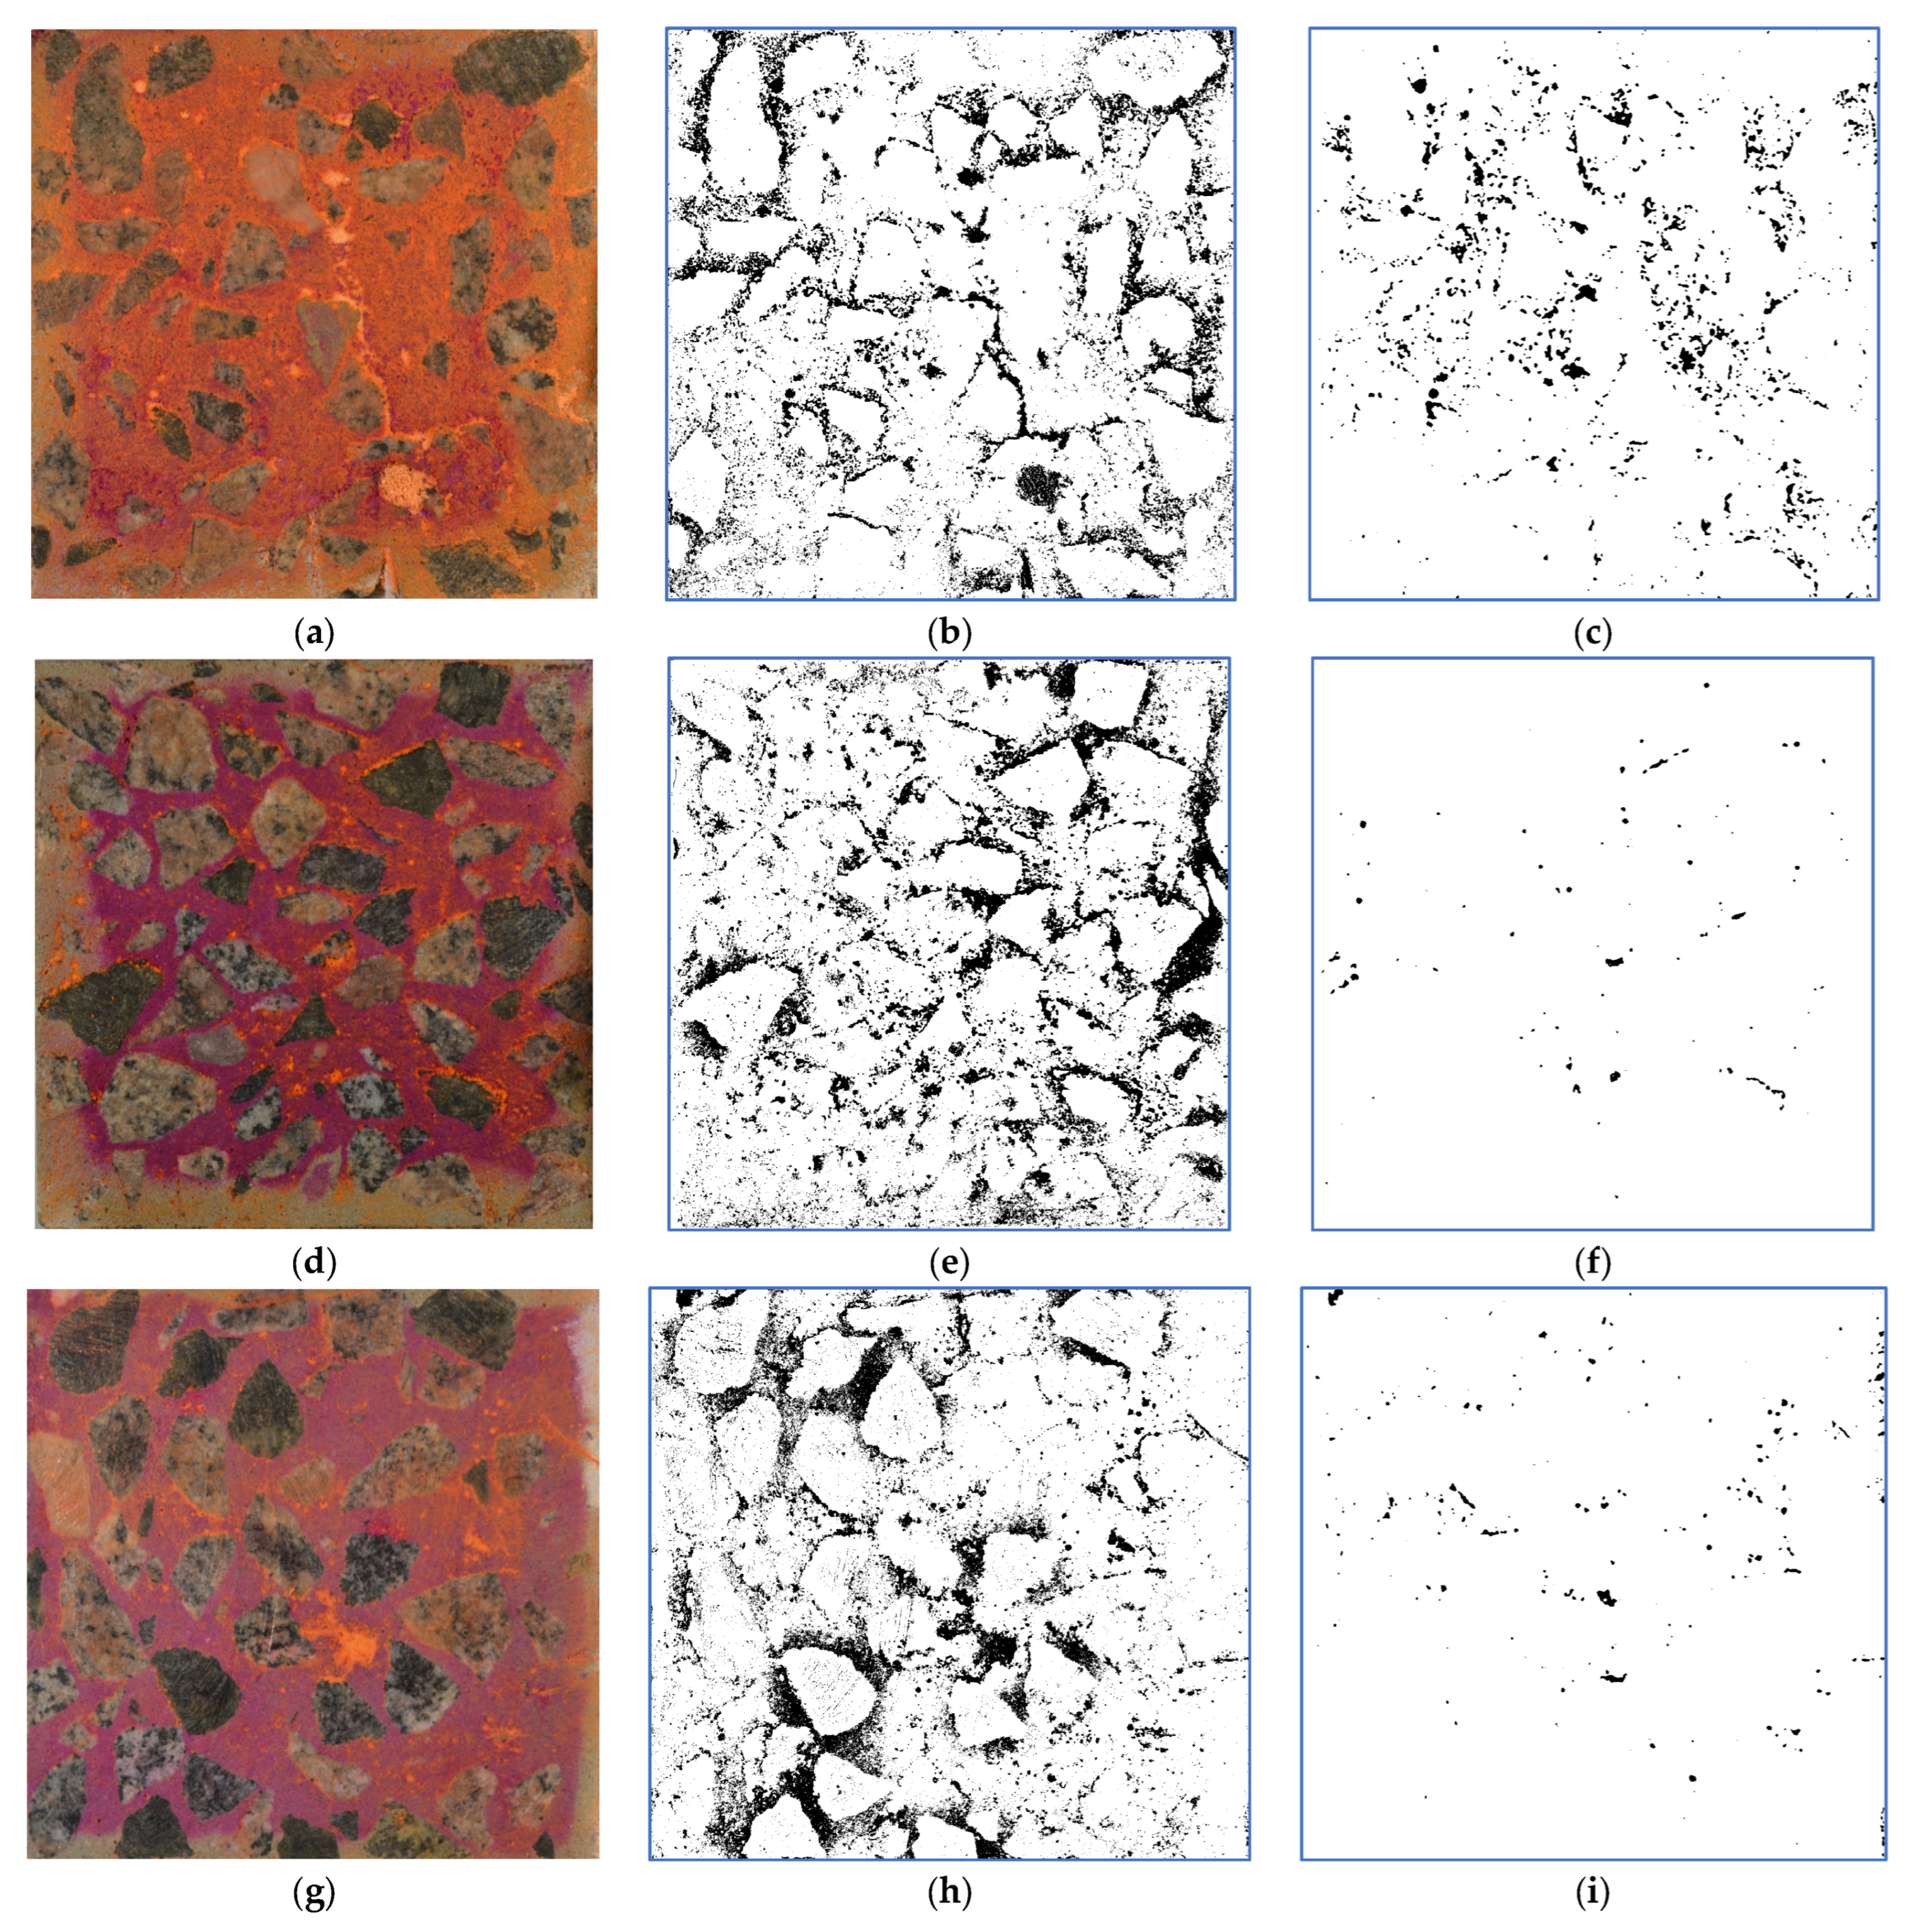
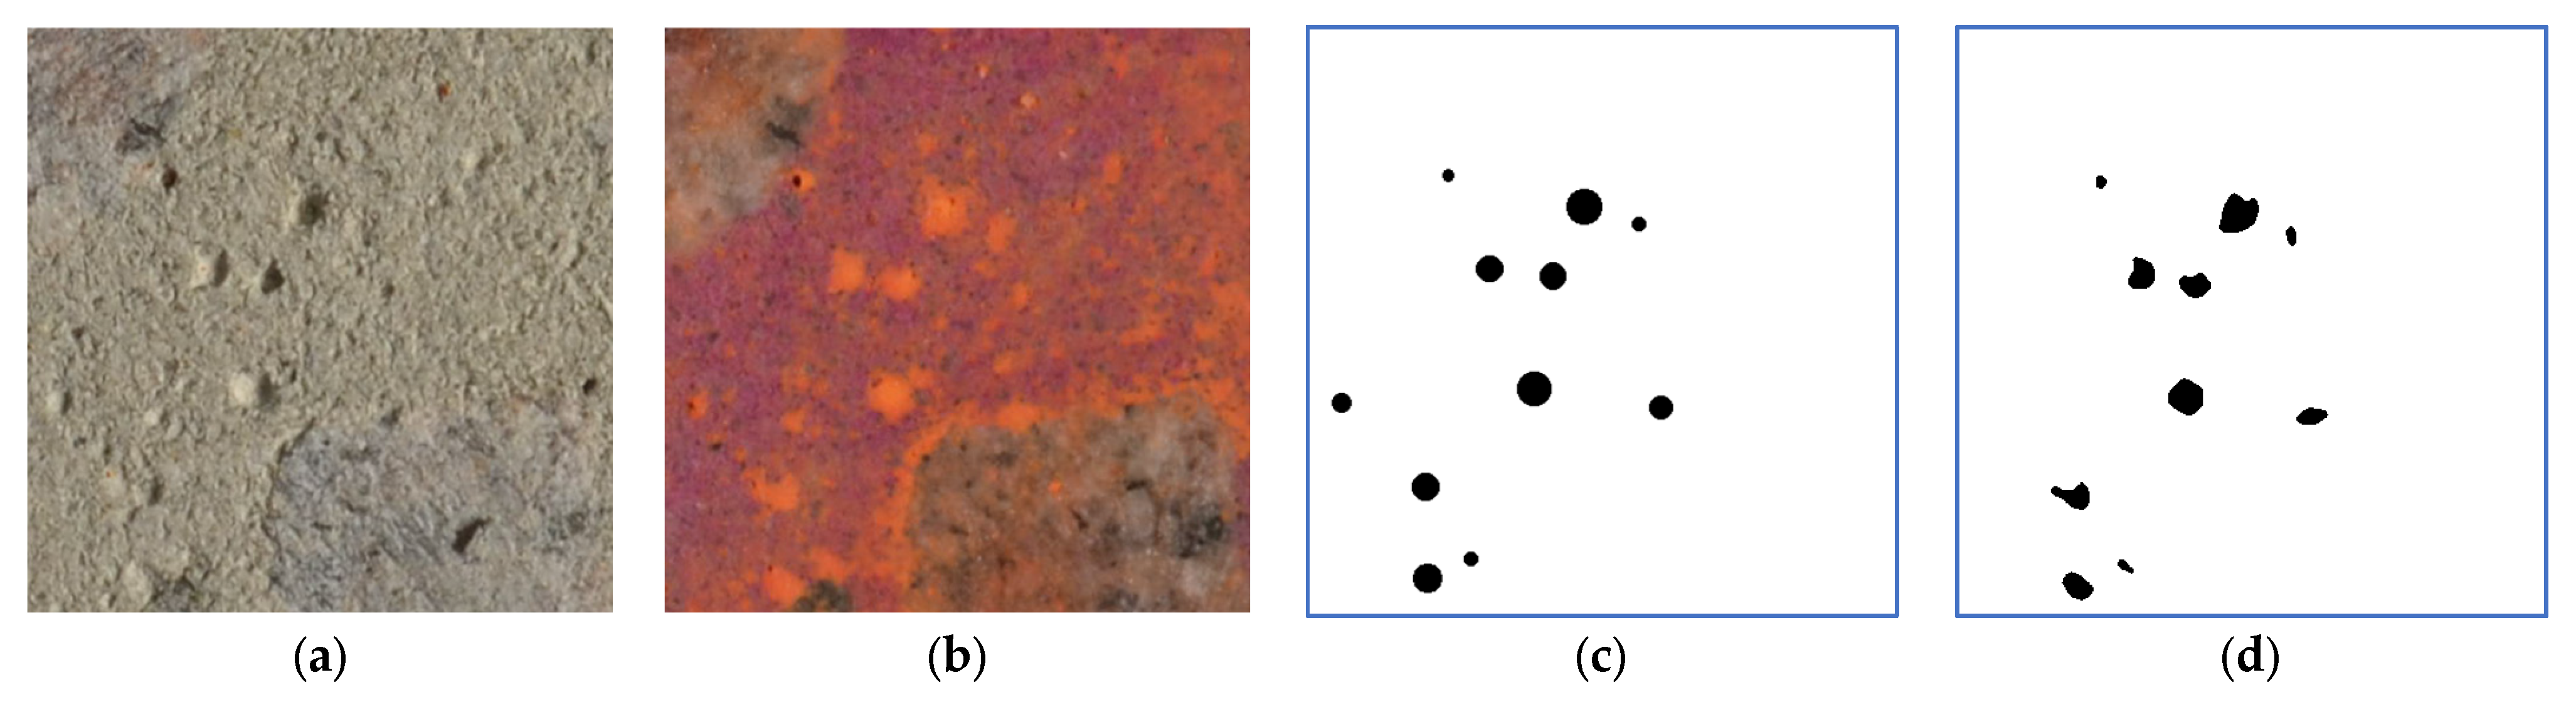
3.3. Method for Segmentation of Concrete Voids on Digital Images of Test Specimen Sections

The concrete samples were pretreated with several reagents to increase the contrast of various concrete components. The 1% solution of phenolphthalein C20H14O4 of reagent grade purity (Sphera Sim, Lviv, Ukraine) and the 5% solution of sodium hydroxide NaOH (Sphera Sim, Lviv, Ukraine) were used. Contrasting calcium carbonate (orange chalk) was used to fill the air voids. Next, the filler (chalk) was removed from the smooth surface of the concrete section. Thus, the contrasting filler remained only in the air voids and areas around the aggregates. This allowed for the enhancement of the visibility of air voids in the images maximizing the distinction between filled voids and background and prevent intensity overlaps between voids and aggregates and further application of an image segmentation technique. When processing an image of a surface of a concrete test specimen, the RGB image model was used. This model allows us to process the image’s red, green, and blue channels separately. The R image component of the RGB colour model was the most relevant for detecting voids, so it was used for further processing. In Figure 7, the initial image of the surface of a 10 × 10 cm concrete test specimen of C30 grade (a), as well as its red R (b), green G (c), and blue B (d) components of the RGB colour model are shown. If necessary, before applying the segmentation stage directly, in some instances it is advisable to perform pre-processing of the image to increase its contrast, improve its quality [64], restore colours [65], and highlight contours [66].
We used the statistical method of segmentation by Otsu [67] in the R component. The Otsu method was chosen because it shows good results if the histogram has a bimodal distribution, i.e., it has two distinct peaks, indicating the existence of two classes of values in the data. The method is based on the within class variance minimization. It can be used when the object area is smaller in comparison with the background region. The threshold level T* is calculated by maximizing the variance between classes:
T * = arg m a x σ b 2 T ,
where
σ b 2 T = P 0 T ( μ 0 T μ ) 2 + P 1 T ( μ 1 T μ ) 2 ,
P 0 T , P 1 T are cumulative probabilities, μ 0 T , μ 1 T   are mean values, and σ 0 2 T , σ 1 2 T are variances of the two classes. Next, we use an ellipse approximation of each object to reject elongated shapes. Note that the cumulative probabilities in Formula (5) can be interpreted in the general case as functions described in [68,69,70,71].
The advantage of the proposed method is its simplicity of use for processing images of concrete cross-sections. Increasing the contrast between the background and air voids by surface treatment and using the R component as the most relevant part of the image allows us to apply a segmentation method that does not require additional parameters or training.

4. Results and Discussion

Diagnosing concrete based on the analysis of its structure is essential for assessing the condition of an existing structure and for the initial selection of concrete composition. Samples can be cut out of the concrete structure or made in the laboratory as test specimens. In both cases, preparation for testing is essential when examining samples. Grinding should be performed similarly for all specimens using the same auxiliary materials. The phenolphthalein solution and chalk should also be applied in the same way. This will ensure reliable results of computer image analysis. The qualitative results obtained as segmented voids on the images and the quantitative results in size, distribution, and other indicators are essential for concrete quality diagnostics.

4.1. Results of Modelling Air Voids in Concrete

Modelling air voids in concrete was performed according to the method described in Section 3.2. Table 2 estimates the void concentration by cross-sectional area of the modelled concrete cube with air content of 0.25%. The estimated particle concentration by area ranges from 0.17% to 0.46%. The average concentration by area is equal to 0.29.
Table 3 estimates the void concentration by cross-sectional area of the modelled concrete cube with air content of 0.5%. The estimated particle concentration by area ranges from 0.37% to 0.72%. The average concentration by area is equal to 0.54.
Table 4 estimates the void concentration by cross-sectional area of the modelled concrete cube with air content of 5%. The estimated particle concentration by area ranges from 4.4% to 5.19%. The average concentration by area is equal to 4.88.
Thus, the above results of modelling voids in a cube of concrete based on a uniform distribution for different volumetric concentrations make it possible to justify estimating the volumetric distribution of air voids from two-dimensional images of the surfaces of concrete sections.

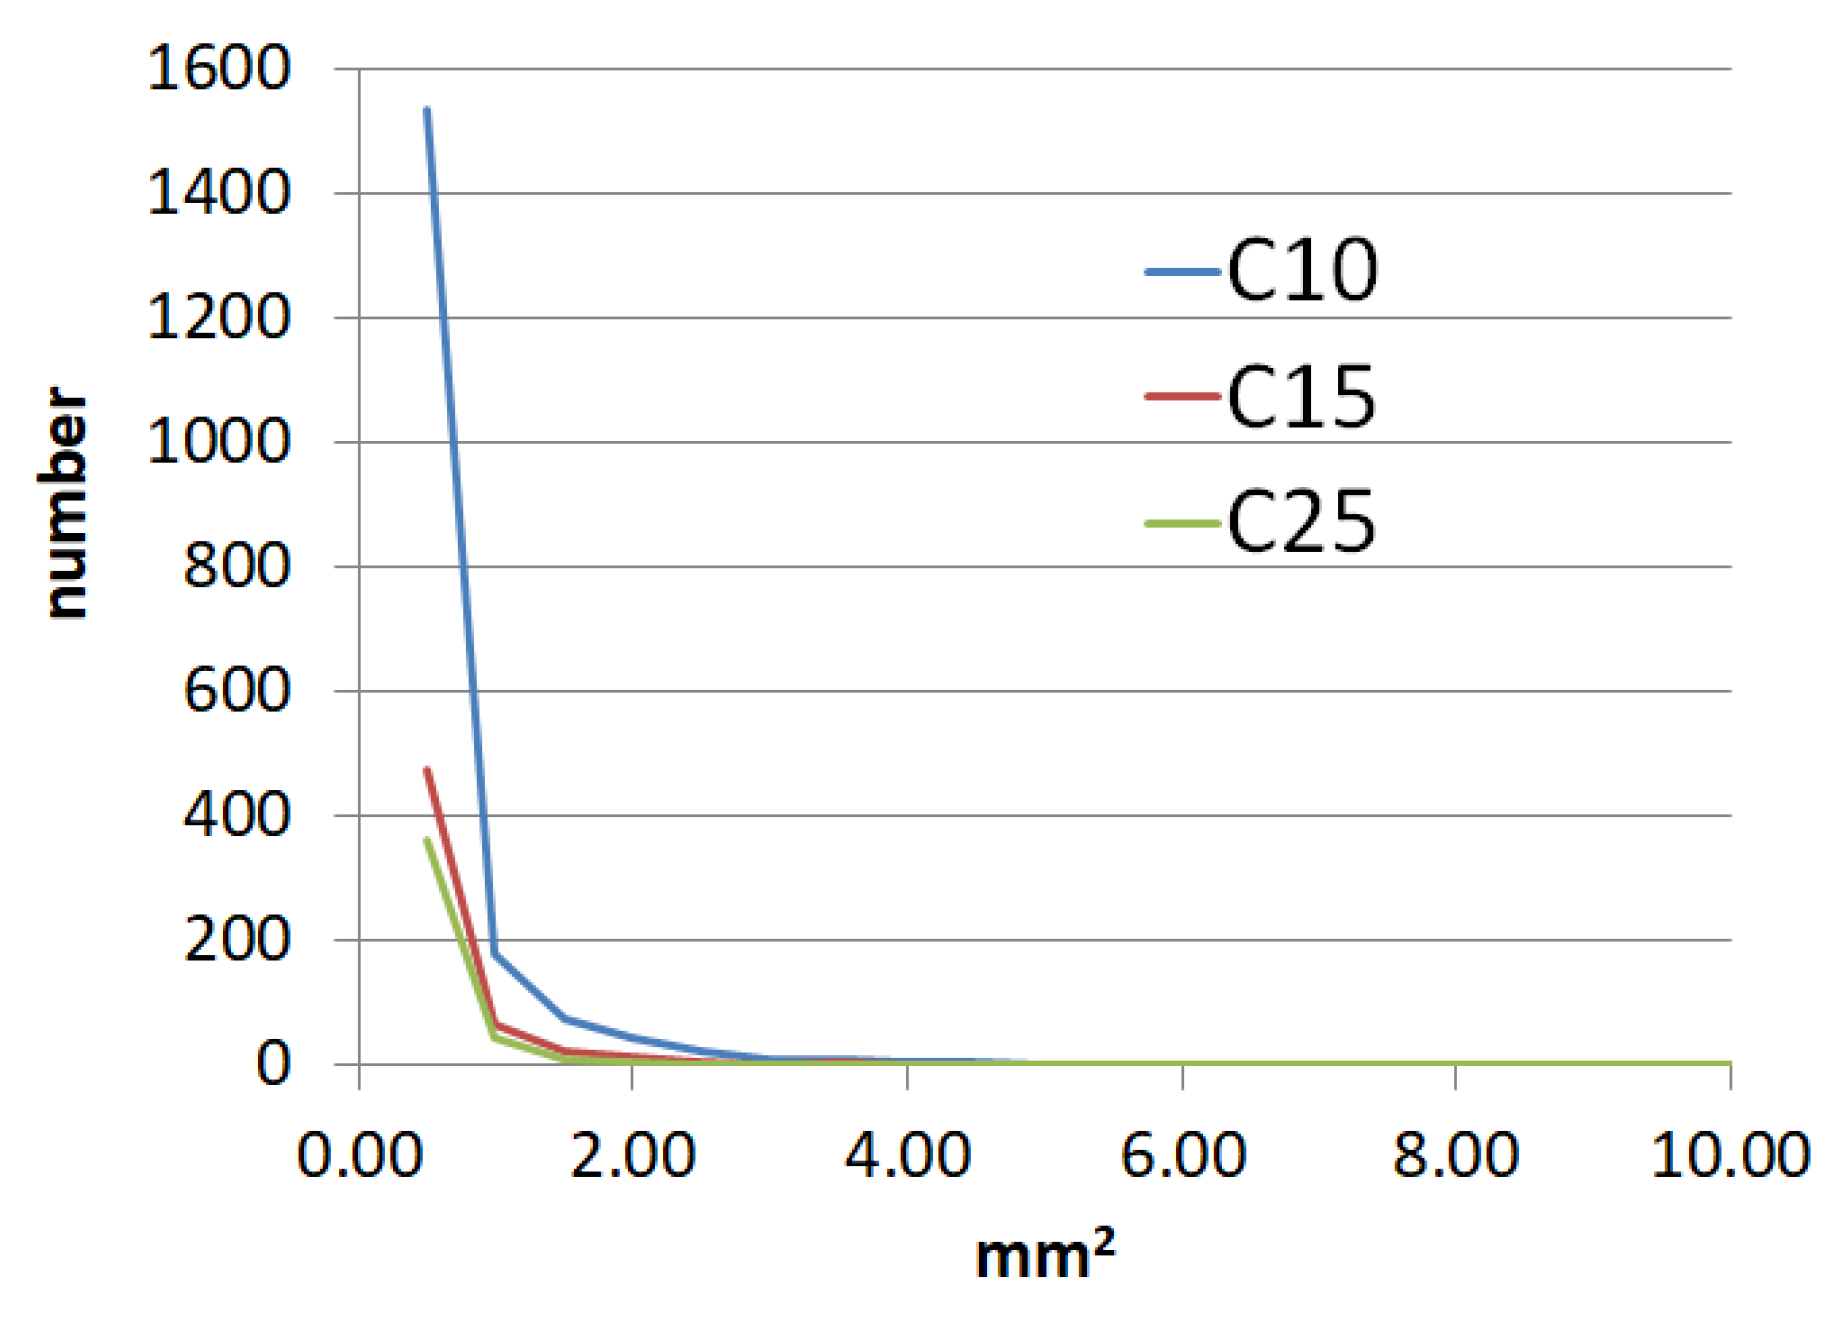
4.2. Results of Concrete Void Segmentation from Digital Images of Test Specimen Sections

The results of the experiments are shown in Figure 8 and Figure 9. In particular, Figure 8 shows the input images (a), (d), and (g) of C10, C15, and C25 grades, respectively, and the results of segmentation of cement stone (background) and voids (object) by known adaptive thresholding method [72]—(b), (e), (h) and by our method proposed in Section 3.3—(c), (f), (i). Figure 8 shows graphs of the void size distribution for test samples of concrete of different grades—C10, C15, and C25. The average percentage of voids by cross-section of test concrete cube, the average rate of aggregate, and the average compressive strength of concrete according to experiments are shown in Table 5.
Results of the experiment for a number of samples were compared to ground truth data of an expert in the non-destructive testing. Figure 10 presents the example of the comparison of segmentation obtained by the proposed method and air void detection provided by an expert for image fragment with air void cluster of the test sample C25 (Figure 8g).
It should be noted that when an air void’s edge was crumbled or irregular, an expert extrapolated the round contour of the air void. The criterion for the validity of void segmentation is an error in air content assessment. We can conclude that the performance of the proposed method closely resembles the results from an expert by comparing the segmentation results. The error of the proposed method is 0.11%, according to quantitative analysis. This assessment of the accuracy validates the effectiveness of the proposed method of concrete void segmentation from digital images of test specimen sections.
Several works are investigating the usefulness of image analysis for characterizing air-void systems in concrete [73,74,75,76,77]. Modelling of air voids in concrete cube made it possible to compare the experimental and modelled surface layers and further predict the properties of such concrete. Analysis of modelled layers emphasized the necessity of averaging the estimated air content on larger concrete surfaces. It also showed a minor estimation error for the model with a higher air content. Estimating the rate of voids and analysing the surface of concrete samples can determine the features that correlate with the concrete grade.
Analysing the results of air void concentration, one can see a decrease in the average air void concentration in the sections of stronger concrete grades.
The procedure for determination of parameters of the air-void system in hardened concrete described in ASTM C457 [47] is a tedious and time-consuming process. The differences in methods, equipment, and concrete cube preparation quality are the factors that contribute to variation in air void measurements, in addition to operator skills and training. The proposed method analyses the entire surface of the concrete section (2D), as opposed to the linear-traverse method (1D) [47]. It can also be used in fields without the traversing devices described in this standard.
According to the general concepts of stress concentration in solids, it is important to note that the strength characteristics of a porous body are influenced not only by the size of the voids, but also by the relative position of the voids (the closer the worse), i.e., the percentage of voids inversely correlates with the strength of concrete, which has been empirically confirmed. The shape of the defects is also of great importance: globular defects are acceptable, flattened crack-like defects are unacceptable.
The results of studies [78] indicate that with an increase in the content of GO graphene oxide reinforcing agent, the amount of PVP dispersant increases simultaneously, which leads to the formation of too much gas during the dispersion process, and, accordingly, to the formation of too many voids, which reduces the flexural strength of concrete. In addition, randomly distributed voids and water have a significant impact on the strength of reinforced concrete specimens. It was found that at temperatures below 600 °C, water evaporates and new voids are formed, which also causes significant fluctuations in compressive strength.
In general, applying image processing methods to concrete surface images to determine their characteristics, particularly strength, is a promising area of research. The advantage of the proposed method is that due to the surface treatment of the concrete sample and the use of the R component of the image, the Otsu method can be used, which has no additional parameters. The results obtained in this work can be used to develop a methodology for assessing the strength of concrete in operating structures based on images of its surface. To do this, it will be necessary to accumulate a larger dataset of photos of the concrete surface of real operating structures. In further research, we plan to analyse the difference in air void content in test samples of concrete of different grades with concrete of the corresponding grades after operation and to analyse the component composition of concrete.

5. Conclusions

Modern approaches to the image-based assessment of air voids on concrete surfaces are analysed. It is shown that the problem of segmentation of the air voids and determining their percentage in concrete is relevant and essential for assessing the characteristics of concrete. The voids in a concrete cube were modelled based on a uniform distribution for different volume air content. They showed an increase in the accuracy of estimation for a higher percentage of air content with the same number of slices. This made it possible to compare experimental and modelled surface layers and further predict the properties of such concrete.
A method of image processing of concrete test cube sections for void segmentation was developed based on the Otsu method, with subsequent analysis and segregation by geometric shape. The results of experimental studies of the proposed method on authentic images of sections of test concrete samples of different grades are presented. We obtained the air content percentages for concrete grades C10, C15, and C25 equal to 4.28%, 1.22%, and 0.65%, respectively. The results make it possible to assert that the air content correlates with the concrete strength.
The proposed methodology after accumulating a sufficient amount of experimental data can be used along with other non-destructive methods to determine the strength of concrete in products and structures.
A certain limitation of the proposed method is the assumption of a uniform distribution of air voids, as voids can form clusters or chains. Modelling such void co-location may be the subject of further research. Also, the limitation is the need to analyse more sections for the samples with air content of less than 0.5%.
In the future, we plan to test the proposed technique on existing reinforced concrete structures to predict concrete strength. Extending the method to other types of concrete requires additional research. We also plan to assess void frequency, spacing factor, void chains, and clusters.

Author Contributions

Conceptualization, I.I. and R.V.; methodology, I.I., R.V., T.M., O.B., and Y.I.; software, I.I.; validation, I.I., R.V., O.B., T.M., and T.V.; formal analysis, I.I., R.V., O.B., and T.M.; investigation, V.L., O.B., T.M., and L.R.; resources, R.V. and L.R.; data curation, I.I., Y.I., O.M., and L.R.; writing—original draft preparation, I.I., R.V., O.B., T.M., and L.R.; writing—review and editing, V.L., I.I., R.V., O.B., T.M., and L.R.; visualization, R.V. and T.M.; supervision, I.I., T.V., and L.R.; project administration, V.L., R.V., T.V., and L.R.; funding acquisition, R.V. and T.V. All authors have read and agreed to the published version of the manuscript.

Funding

This research was funded by the National Academy of Sciences of Ukraine under grant number 0124U000947.

Data Availability Statement

The data are contained within this article.

Acknowledgments

The authors sincerely thank and honour the Armed Forces of Ukraine, whose efforts enabled the completion and publication of this article. For providing of concrete samples used in this research, the authors thank Sika-Ukraine LLC, Kyiv, Ukraine. The team of authors expresses their gratitude to the reviewers for valuable recommendations that have been taken into account to improve significantly the quality of this paper.

Conflicts of Interest

The authors declare no conflicts of interest.

References

  1. Song, Q.; Zou, Y.; Bao, J.; Zhang, P. Disposal of Solid Waste as Building Materials: A Study on the Mechanical and Durability Performance of Concrete Composed of Gold Tailings. J. Mater. Res. Technol. 2024, 30, 2111–2124. [Google Scholar] [CrossRef]
  2. Hao, Y.; Yang, G.; Liang, K. Development of Fly Ash and Slag Based High-Strength Alkali-Activated Foam Concrete. Cem. Concr. Compos. 2022, 128, 104447. [Google Scholar] [CrossRef]
  3. Shamrai, V.; Leonets, I.; Melnyk-Shamrai, V.; Patseva, I.; Naumov, Y. Reuse of Stone Working Enterprise Slurry in Geopolymer and Concrete Products. Min. Miner. Depos. 2024, 18, 10–17. [Google Scholar] [CrossRef]
  4. Hossain, M.S.; Panov, V.; Choi, S.; Yun, K.K. Durability Performance of Cement Mortar Incorporating Water-Repellent Admixtures. Constr. Build. Mater. 2024, 440, 137262. [Google Scholar] [CrossRef]
  5. Arifin, D.N.; Sanwani, E. Potential Utilization of Natural Zeolite, Fly Ash and Rice Husk Ash for Geopolymer Concrete Production. Min. Miner. Depos. 2023, 17, 86–92. [Google Scholar] [CrossRef]
  6. Golewski, G.L. The Phenomenon of Cracking in Cement Concretes and Reinforced Concrete Structures: The Mechanism of Cracks Formation, Causes of Their Initiation, Types and Places of Occurrence, and Methods of Detection—A Review. Buildings 2023, 13, 765. [Google Scholar] [CrossRef]
  7. Shats’kyi, I.P.; Makoviichuk, M.V. Analysis of the limiting state of cylindrical shells with cracks with regard for the contact of crack lips. Strength Mater. 2009, 41, 560–564. [Google Scholar] [CrossRef]
  8. Shats’kyi, I.P.; Makoviichuk, M.V. Contact Interaction of Crack Lips in Shallow Shells in Bending with Tension. Mater. Sci. 2005, 41, 486–494. [Google Scholar] [CrossRef]
  9. Du, J.; Wang, J.; Fu, Z. Influence of Interaction between Microcracks and Macrocracks on Crack Propagation of Asphalt Concrete. Materials 2024, 17, 2877. [Google Scholar] [CrossRef]
  10. Liu, K.; Fu, K.; Sang, Y.; Yang, Y.; Zou, C.; Xie, T.; Zhao, X. Frost Resistance of Recycled Aggregate Concrete: A Critical Review. J. Build. Eng. 2024, 90, 109450. [Google Scholar] [CrossRef]
  11. Tolubaev, K.; Zhautikov, B.; Zobnin, N.; Dairbekova, G.; Kabieva, S.; Al-Kasasbeh, R. Electron Microscopy of Non-Monocrystalline Magnetron Sputtered Silicon Thin Films Containing Fibrous Nanosilicon. Eng. J. Satbayev Univ. 2024, 146, 18–24. [Google Scholar] [CrossRef]
  12. Solodkyy, S.; Markiv, T.; Sobol, K.; Hunyak, O. Fracture properties of high-strength concrete obtained by direct modification of structure. MATEC Web Conf. 2017, 116, 01016. [Google Scholar] [CrossRef]
  13. Fredrich, J.T.; Menéndez, B.; Wong, T.F. Imaging the pore structure of geomaterials. Science 1995, 268, 276–279. [Google Scholar] [CrossRef]
  14. Pelekhan, B.; Dutkiewicz, M.; Shatskyi, I.; Velychkovych, A.; Rozhko, M.; Pelekhan, L. Analytical Modeling of the Interaction of a Four Implant-Supported Overdenture with Bone Tissue. Materials 2022, 15, 2398. [Google Scholar] [CrossRef]
  15. Kolesov, V.S.; Vlasov, N.M.; Tisovskii, L.O.; Shatskii, I.P. The stress-deformation state of an elastic half-space with a spheroidal thermal inclusion. Int. Appl. Mech. 1992, 28, 426–434. [Google Scholar] [CrossRef]
  16. Kundrat, M.M. Local fracture of an orthotropic matrix with a linear inclusion. Int. Appl. Mech. 1996, 32, 631–638. [Google Scholar] [CrossRef]
  17. Shats’kyi, I.P.; Kundrat, A.M. Longitudinal shear of a body with mutually immobile rigid collinear inclusions. Mater. Sci. 2004, 40, 376–382. [Google Scholar] [CrossRef]
  18. Velychkovych, A.; Ropyak, L.; Dubei, O. Strength Analysis of a Two-Layer PETF-Concrete Column with Allowance for Contact Interaction between Layers. Adv. Mater. Sci. Eng. 2021, 2021, 4517657. [Google Scholar] [CrossRef]
  19. Ropyak, L.; Shihab, T.; Velychkovych, A.; Bilinskyi, V.; Malinin, V.; Romaniv, M. Optimization of plasma electrolytic oxidation technological parameters of deformed aluminum alloy D16T in flowing electrolyte. Ceramics 2023, 6, 146–167. [Google Scholar] [CrossRef]
  20. Simchen, F.; Sieber, M.; Kopp, A.; Lampke, T. Introduction to plasma electrolytic oxidation—an overview of the process and applications. Coatings 2020, 10, 628. [Google Scholar] [CrossRef]
  21. Student, M.M.; Ivasenko, I.B.; Posuvailo, V.M. Influence of the porosity of a plasma-electrolytic coating on the corrosion resistance of D16 alloy. Mater. Sci. 2019, 54, 899–906. [Google Scholar] [CrossRef]
  22. Ropyak, L.; Shihab, T.; Velychkovych, A.; Dubei, O.; Tutko, T.; Bilinskyi, V. Design of a Two-Layer Al–Al2O3 Coating with an Oxide Layer Formed by the Plasma Electrolytic Oxidation of Al for the Corrosion and Wear Protections of Steel. Prog. Phys. Met. 2023, 24, 319–365. [Google Scholar] [CrossRef]
  23. Naebe, M.; Shirvanimoghaddam, K. Functionally graded materials: A review of fabrication and properties. Appl. Mater. Today 2016, 5, 223–245. [Google Scholar] [CrossRef]
  24. Shatskyi, I.; Makoviichuk, M.; Ropyak, L.; Velychkovych, A. Analytical model of deformation of a functionally graded ceramic coating under local load. Ceramics 2023, 46, 1879–1893. [Google Scholar] [CrossRef]
  25. Panasyuk, V.V.; Sylovanyuk, V.P.; Marukha, V.I. Injection Technologies for the Repair of Damaged Concrete Structures; Springer: Dordrecht, The Netherlands, 2014. [Google Scholar] [CrossRef]
  26. Shatskyi, I.; Kurtash, I. Strength of plate with the filled crack under multiparameter loading. Procedia Struct. Integr. 2018, 13, 1482–1487. [Google Scholar] [CrossRef]
  27. Suprun, V.Y.; Marukha, V.I.; Sylovaniuk, V.P. Recycling Technologies for Polyurethane Wastes (A Survey). Mater. Sci. 2022, 57, 755–764. [Google Scholar] [CrossRef]
  28. Shats’kyi, I.P. Limiting equilibrium of a plate with partially healed crack. Mater. Sci. 2015, 51, 322–330. [Google Scholar] [CrossRef]
  29. Dalyak, T.M.; Shatsky, I.P. On brittle fracture of a body with partial healed star-shaped crack. Bull. Taras Shevchenko Natl. Univ. Kyiv Phys. Math. 2023, 2, 100–103. [Google Scholar] [CrossRef]
  30. Stankevych, V.Z.; Zhbadynskyi, I.Y.; Babyak, M.O. Dynamic Strength of an Elastic Matrix with a Partially Healed Crack. In Proceedings of the 2024 IEEE 29th International Seminar/Workshop on Direct and Inverse Problems of Electromagnetic and Acoustic Wave Theory (DIPED), Tbilisi, Georgia, 11–13 September 2024; pp. 240–243. [Google Scholar] [CrossRef]
  31. Nemati, K.M.; Stroeven, P. Stereological analysis of micromechanical behavior of concrete. Mater. Struct. 2001, 34, 486–494. [Google Scholar] [CrossRef]
  32. Head, M.K.; Buenfeld, N.R. Confocal imaging of porosity in hardened concrete. Cem. Concr. Res. 2006, 36, 896–911. [Google Scholar] [CrossRef]
  33. Shamrai, V.; Melnyk-Shamrai, V.; Leonets, I.; Korobiichuk, V.; Lutsenko, S. Quality Index Control for Building Products Made of Natural Facing Stone. Min. Miner. Depos. 2023, 17, 12–21. [Google Scholar] [CrossRef]
  34. Fonseca, P.C.; Scherer, G.W. An image analysis procedure to quantify the air void system of mortar and concrete. Mater. Struct. 2015, 48, 3087–3098. [Google Scholar] [CrossRef]
  35. Stroeven, P. Application of various stereological methods to the study of the grain and the crack structure of concrete. J. Microsc. 1976, 107, 313–321. [Google Scholar] [CrossRef]
  36. Elsen, J.; Lens, N.; Vyncke, J.; Aarre, T.; Quenard, D.; Smolej, V. Quality assurance and quality control of air entrained concrete. Cem. Concr. Res. 1994, 24, 1267–1276. [Google Scholar] [CrossRef]
  37. Ojala, T.; Chen, Y.; Punkki, J.; Al-Neshawy, F. Characteristics of Entrained Air Voids in Hardened Concrete with the Method of Digital Image Analysis Coupled with Schwartz-Saltykov Conversion. Materials 2021, 14, 2493. [Google Scholar] [CrossRef]
  38. Wawrzeńczyk, J.; Kozak, W. A method of analyzing the porous microstructure in air-entrained concrete on the basis on 2D image analysis. Procedia Eng. 2015, 108, 102–107. [Google Scholar] [CrossRef]
  39. Başyiğit, C.; Comak, B.; Kilincarslan, S.; Uncu, İ.S. Assessment of concrete compressive strength by image processing technique. Constr. Build. Mater. 2012, 37, 526–532. [Google Scholar] [CrossRef]
  40. Guo, L.; Wang, W.; Zhong, L.; Guo, L.; Zhang, F.; Guo, Y. Texture analysis of the microstructure of internal curing concrete based on image recognition technology. Case Stud. Constr. Mater. 2022, 17, e01360. [Google Scholar] [CrossRef]
  41. Mayercsik, N.P.; Felice, R.; Ley, M.T.; Kurtis, K.E. A probabilistic technique for entrained air void analysis in hardened concrete. Cem. Concr. Res. 2014, 59, 16–23. [Google Scholar] [CrossRef]
  42. Mandziy, T.S.; Ivasenko, I.B.; Berehulyak, O.R.; Vorobel, R.A.; Maksymenko, O.P.; Ivanytskyi, Y.L. Optimization method for segmentation of concrete components in digital images of test sample sections. Inf. Extr. Process. 2022, 50, 62–68. [Google Scholar] [CrossRef]
  43. Ghahremani, G.; Bagheri, A.; Zanganeh, H. The effect of size and shape of pores on the prediction model of compressive strength of foamed concrete. Constr. Build. Mater. 2023, 371, 130720. [Google Scholar] [CrossRef]
  44. Trussell, N.; Stangeland, M.; Gaute, H.; Snyder, K.I.; Endrerud, P.E.; Jacobsen, S. Anisotropy and macro porosity in wet sprayed concrete: Laminations, fibre orientation and macro pore properties measured by image analysis, PF test, water penetration and CT scanning. Constr. Build. Mater. 2023, 389, 131715. [Google Scholar] [CrossRef]
  45. Wei, W.; Ding, L.; Luo, H.; Li, C.; Li, G. Automated bughole detection and quality performance assessment of concrete using image processing and deep convolutional neural networks. Constr. Build. Mater. 2021, 281, 122576. [Google Scholar] [CrossRef]
  46. Wei Chong, B.; Othman, R.; Jaya, R.P.; Shu Ing, D.; Li, X.; Wan Ibrahim, M.H.; Abdullah, M.M.A.B.; Sandu, A.V.; Płoszaj, B.; Szmidla, J.; et al. Image Analysis of Surface Porosity Mortar Containing Processed Spent Bleaching Earth. Materials 2021, 14, 1658. [Google Scholar] [CrossRef]
  47. C 457-16; Standard Test Method for Microscopical Determination of Parameters of the Air-Void System in Hardened Concrete. ASTM international: West Conshohocken, PA, USA, 2016.
  48. Powers, T.C. The air requirement of frost resistant concrete. Proc. Highw. Res. Board 1949, 29, 184–211. Available online: https://onlinepubs.trb.org/Onlinepubs/hrbproceedings/29/29-010.pdf (accessed on 20 May 2025).
  49. Mehta, P.K.; Monteiro, P.J.M. Concrete: Microstructure, Properties, and Materials, 4th ed.; McGraw-Hill Education: New York, NY, USA, 2014; ISBN 9780071797870. [Google Scholar]
  50. Wolter, S.; Uhre, F.A.H.; Hasholt, M.T.; Dahl, V.A.; Anton, F. Air void analysis of hardened concrete by means of photogrammetry. Constr. Build. Mater. 2019, 226, 953–964. [Google Scholar] [CrossRef]
  51. Warren, C. Determination of Properties of Air Voids in Concrete. Bulletin No. 70; Highway Research Board: Washington, DC, USA, 1953; pp. 1–10. Available online: http://onlinepubs.trb.org/Onlinepubs/hrbbulletin/70/70-001.pdf (accessed on 20 May 2025).
  52. Philleo, R.E. A Method for Analyzing Void Distribution In Air-Entrained Concrete. CCA 1983, 5, 128–130. [Google Scholar] [CrossRef]
  53. Schouenborg, B.; Lindqvist, J.; Sandström, M. Air and air void structures in concrete—General overview and picture atlas. Nordtest project 1121-93. In Engineering; Swedish National Testing and Research Institute: Borås, Sweden, 1995; p. 50. Available online: https://www.diva-portal.org/smash/get/diva2:961912/FULLTEXT01.pdf (accessed on 20 May 2025).
  54. Molendowska, A.; Wawrzeńczyk, J.; Kowalczyk, H. Development of the Measuring Techniques for Estimating the Air Void System Parameters in Concrete Using 2D Analysis Method. Materials 2020, 13, 428. [Google Scholar] [CrossRef]
  55. Rahman, M.M.; Rahman, S.; Bhatt, S.; Faezipour, M. A Systematic Review on Advancement of Image Segmentation Techniques for Fault Detection Opportunities and Challenges. Electronics 2025, 14, 974. [Google Scholar] [CrossRef]
  56. Vorobel, R.; Student, O.; Ivasenko, I.; Maruschak, P.; Krechkovska, H.; Zvirko, O.; Berehulyak, O.; Mandziy, T.; Tsybailo, I.; Solovei, P. Development of a method for computer processing of fractographic images to assess the cohesion of inclusions to the matrix in the weld metal after its operational degradation and hydrogenation. Materialia 2024, 34, 102074. [Google Scholar] [CrossRef]
  57. Mandziy, T.; Ivasenko, I.; Berehulyak, O.; Vorobel, R.; Bembenek, M.; Kryshtopa, S.; Ropyak, L. Evaluation of the Degree of Degradation of Brake Pad Friction Surfaces Using Image Processing. Lubricants 2024, 12, 172. [Google Scholar] [CrossRef]
  58. Rezaei, F.; Izadi, H.; Memarian, H.; Baniassadi, M. The effectiveness of different thresholding techniques in segmenting micro CT images of porous carbonates to estimate porosity. J. Pet. Sci. Eng. 2019, 177, 518–527. [Google Scholar] [CrossRef]
  59. Wang, G.; Chen, X.; Han, D.; Qin, X.; Feng, J. Research on threshold segmentation algorithm of coal CT images based on improved Otsu. Coal Sci. Technol. 2021, 49, 264–271. [Google Scholar] [CrossRef]
  60. Wang, G.; Chen, X.; Liu, J.; Zhang, Z.; Huang, Q.; Xu, H. Characterization of coal permeability considering fracture shape using the MP-Otsu threshold segmentation algorithm. J. Ind. Saf. 2024, 1, 100021. [Google Scholar] [CrossRef]
  61. Yu, C.; Wu, W.; Zheng, J.; Zeng, W.; Zheng, D.; Li, Z.; Chen, C.; Wang, S. A multi-stage adaptive Otsu thresholding algorithm for pore segmentation in rock thin-section images. Earth Sci. Inform. 2025, 18, 239. [Google Scholar] [CrossRef]
  62. Ivanytskyi, Y.L.; Blikharskyi, Z.Y.; Maksymenko, O.P.; Panchenko, O.V.; Blikharskyi, Y.Z. Development of the Methodology for Monitoring the Technical State of Bridge Structures and Establishment of Safe Operating Period. Mater. Sci. 2024, 59, 711–719. [Google Scholar] [CrossRef]
  63. C39/C39M; Standard Test Method for Compressive Strength of Cylindrical Concrete Specimens. ASTM International: West Conshohocken, PA, USA, 2016.
  64. Berehulyak, O.; Vorobel, R.; Ivasenko, I. Color Image Enhancement by Logarithmic Transformation in Fuzzy Domain. In Proceedings of the IEEE 2nd Ukraine Conference on Electrical and Computer Engineering (UKRCON), Lviv, Ukraine, 2–6 July 2019; pp. 1147–1151. [Google Scholar] [CrossRef]
  65. Mandziy, T.; Ivasenko, I.; Berehulyak, O.; Vorobel, R. Influence of Colour Restoration on Rust Image Segmentation. In Proceedings of the IEEE 3rd Ukraine Conference on Electrical and Computer Engineering (UKRCON), Lviv, Ukraine, 26–28 August 2021; pp. 68–73. [Google Scholar] [CrossRef]
  66. Javorskyj, I.; Yuzefovych, R.; Lychak, O.; Matsko, I. Hilbert transform for covariance analysis of periodically nonstationary random signals with high-frequency modulation. ISA Trans. 2024, 144, 452–481. [Google Scholar] [CrossRef]
  67. Otsu, N. A threshold selection method from gray-level histograms. IEEE Trans. Syst. Man Cybern. 1979, 9, 62–66. [Google Scholar] [CrossRef]
  68. Kuryliak, A.; Skaskiv, O.; Bandura, A. Arbitrary Random Variables and Wiman’s Inequality. Axioms 2024, 13, 739. [Google Scholar] [CrossRef]
  69. Kuryliak, A. Wiman’s type inequality for entire multiple Dirichlet series with arbitrary complex exponents. Mat. Stud. 2023, 59, 178–186. [Google Scholar] [CrossRef]
  70. Bandura, A.I. Composition of entire functions and bounded L-index in direction. Mat. Stud. 2017, 47, 179–184. [Google Scholar] [CrossRef]
  71. Bandura, A.I.; Skaskiv, O.B. Analytic functions in the unit ball of bounded L-index: Asymptotic and local properties. Mat. Stud. 2017, 48, 37–73. [Google Scholar] [CrossRef]
  72. Bradley, D.; Roth, G. Adapting Thresholding Using the Integral Image. J. Graph. Tools 2007, 12, 13–21. [Google Scholar] [CrossRef]
  73. Pleau, R.; Pigeon, M.; Laurencot, J.L. Some findings on the usefulness of image analysis for determining the characteristics of the air-void system on hardened concrete. Cem. Concr. Compos. 2001, 23, 237–246. [Google Scholar] [CrossRef]
  74. Yuan, J.; Wu, Y.; Zhang, J. Characterization of air voids and frost resistance of concrete based on industrial computerized tomographical technology. Constr. Build. Mater. 2018, 168, 975–983. [Google Scholar] [CrossRef]
  75. Tao, J.; Gong, H.; Wang, F.; Luo, X.; Qiu, X.; Huang, Y. Automated image segmentation of air voids in hardened concrete surface using photometric stereo method. Int. J. Pavement Eng. 2022, 23, 5168–5185. [Google Scholar] [CrossRef]
  76. Wang, Z.; Xie, J.; Gao, L.; Liu, Y.; Tang, L. Three-dimensional characterization of air voids in porous asphalt concrete. Constr. Build. Mater. 2021, 272, 121633. [Google Scholar] [CrossRef]
  77. Liu, Z.; Hansen, W.; Meng, B. Characterisation of air-void systems in concrete. Mag. Concr. Res. 2016, 68, 178–186. [Google Scholar] [CrossRef]
  78. Yan, J.; Wang, J.; Chen, H.; Xiang, P. High Temperature Exposure Assessment of Graphene Oxide Reinforced Cement. Front. Mater. 2022, 9, 786260. [Google Scholar] [CrossRef]
Figure 1. Methods for measuring the characteristics of air voids in the concrete sample.
Buildings 15 02241 g001
Figure 2. Image of a sections of a concrete test sample.
Buildings 15 02241 g002
Figure 3. Laboratory setup used for capturing images.
Buildings 15 02241 g003
Figure 4. Examples of modelled voids as spheres of diameter 17 pixels (a) and 29 pixels (b).
Buildings 15 02241 g004
Figure 5. Modelling of air voids in a concrete cube with air content of 0.25% (a), 0.5% (b), and 5% (c).
Buildings 15 02241 g005
Figure 6. Cross-sections of a cube with modelled air voids from Figure 4a with air content of 0.25% (a), from Figure 4b with air content of 0.5% (b) and with air content of 5% (c).
Buildings 15 02241 g006
Figure 7. Image of the surface of a 10 × 10 cm2 concrete test specimen of C30 grade after the pre-treatment described above, which clearly shows voids filled in orange chalk (a) and components R (b), G (c), B (d) of the RGB colour model.
Buildings 15 02241 g007aBuildings 15 02241 g007b
Figure 8. Segmentation results of cement stone (background) and voids (object): (a,d,g)—input images of the surface of a 10 × 10 cm concrete test sample of C10, C15, and C25 grades, respectively, after the pre-treatment described above, which clearly shows voids filled in orange chalk; (b,e,h)—segmentation results by known adaptive thresholding method, (c,f,i) segmentation results by proposed method.
Buildings 15 02241 g008
Figure 9. Graphs of void size distribution for concrete test specimens of C10, C15, and C25 grades.
Buildings 15 02241 g009
Figure 10. Quantitative assessment of the accuracy of the proposed segmentation method in comparison with the expert evaluation of voids on the example of the fragment of images of the section surface of a 10 × 10 cm concrete test sample of C25 grades: (a)—fragment of the initial image; (b)—same fragment after pre-treating with reagents (Figure 8g); (c)—ground truth segmentation of image in (a) by an expert, air content is equal to 1.66%; (d) –segmentation of image in (b) by proposed method, air content is equal to 1.55%.
Buildings 15 02241 g010
Table 1. Concrete compositions per m3.
Concrete GradeMobility ClassCement CEM II/A-LL 42.5, PC “Ivano-Frankivskcement”, Ivano-Frankivsk, Ukraine, kgSand *
(Kovalska, Rozvadiv, Lviv region, Ukraine), kg
Crushed Stone Fraction (15–20 mm), kgWater, kg
C10S42307401170200
C152807001160200
C203106901150200
C253506701140205
C303906451140210
* Sand moisture content 3.5%.
Table 2. Estimating of air content by area for 10 cross-sectional images of a modelled concrete cube with a proportion of air voids of 0.25% of the volume.
Section Number12345678910Averaged
Number of void pixels4888227093071210601907634434567668
Air content, %0.190.310.270.120.460.230.350.240.170.220.29
Table 3. Estimating of air content by area for 10 cross-sectional images of a modelled concrete cube with a proportion of air voids of 0.5% volume.
Section Number12345678910Averaged
Number of void pixels9641688133713671889153013771377119013251404
Air content, %0.370.640.510.520.720.580.530.530.450.510.54
Table 4. Estimating of air content by area for 10 cross-sectional images of a modelled concrete cube with a proportion of air voids of 5% volume.
Section Number12345678910Averaged
Number of void pixels12,80111,54513,10713,34313,07612,43312,09913,60813,12312,18912,801
Air content, %4.884.455.094.994.744.625.195.014.654.88
Table 5. Evaluation of concrete components by analysing the surface of its sections and determining the compressive strength of concrete.
Concrete GradeAverage
Air Content for the Sample, %
Average Percentage of Aggregate for the Samples, %The Average Compressive Strength of Concrete According to Experiments, MPaConcrete Specific Density, kg/m3
C104.2842.5013.302275
C151.2247.0021.702300
C250.6544.5036.102370
Disclaimer/Publisher’s Note: The statements, opinions and data contained in all publications are solely those of the individual author(s) and contributor(s) and not of MDPI and/or the editor(s). MDPI and/or the editor(s) disclaim responsibility for any injury to people or property resulting from any ideas, methods, instructions or products referred to in the content.

