
Theoretical Study on Impact of Solar Radiation Heat Gain on Thermal Comfort and Energy Efficiency in Glass Curtain Wall Buildings Based on PMV Index

Abstract
1. Introduction
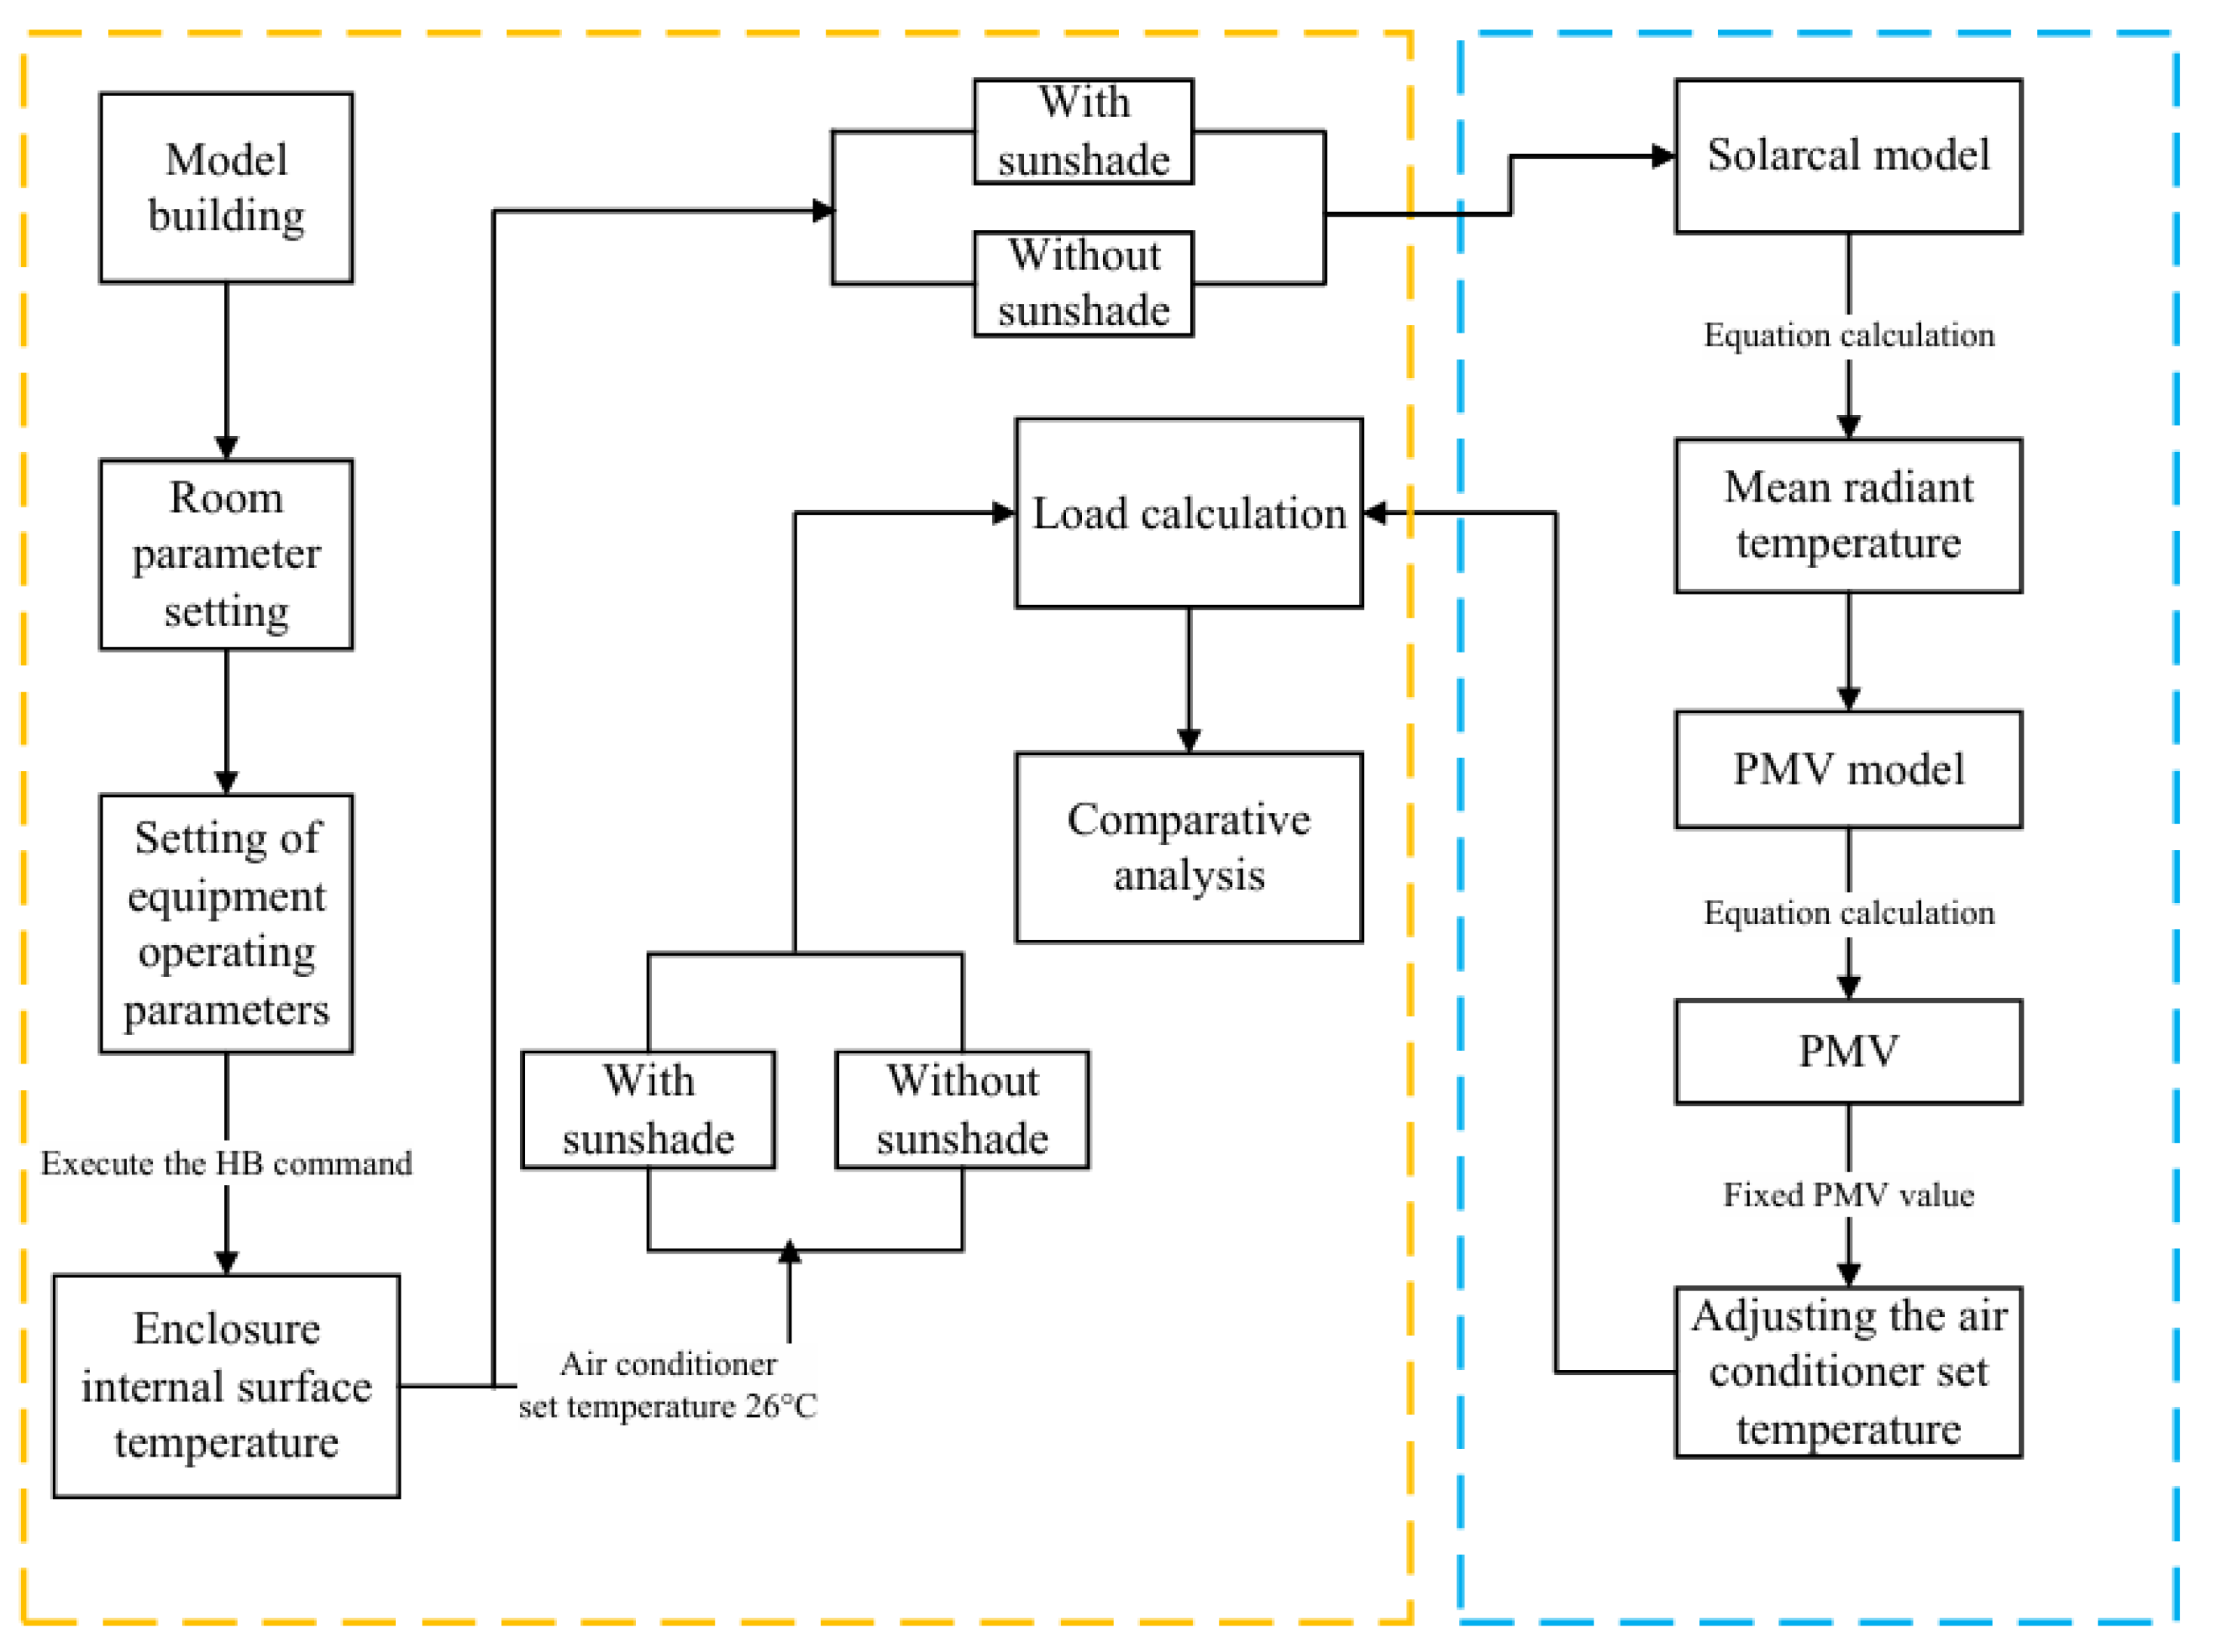
2. Research Methods
2.1. Simulation Tool
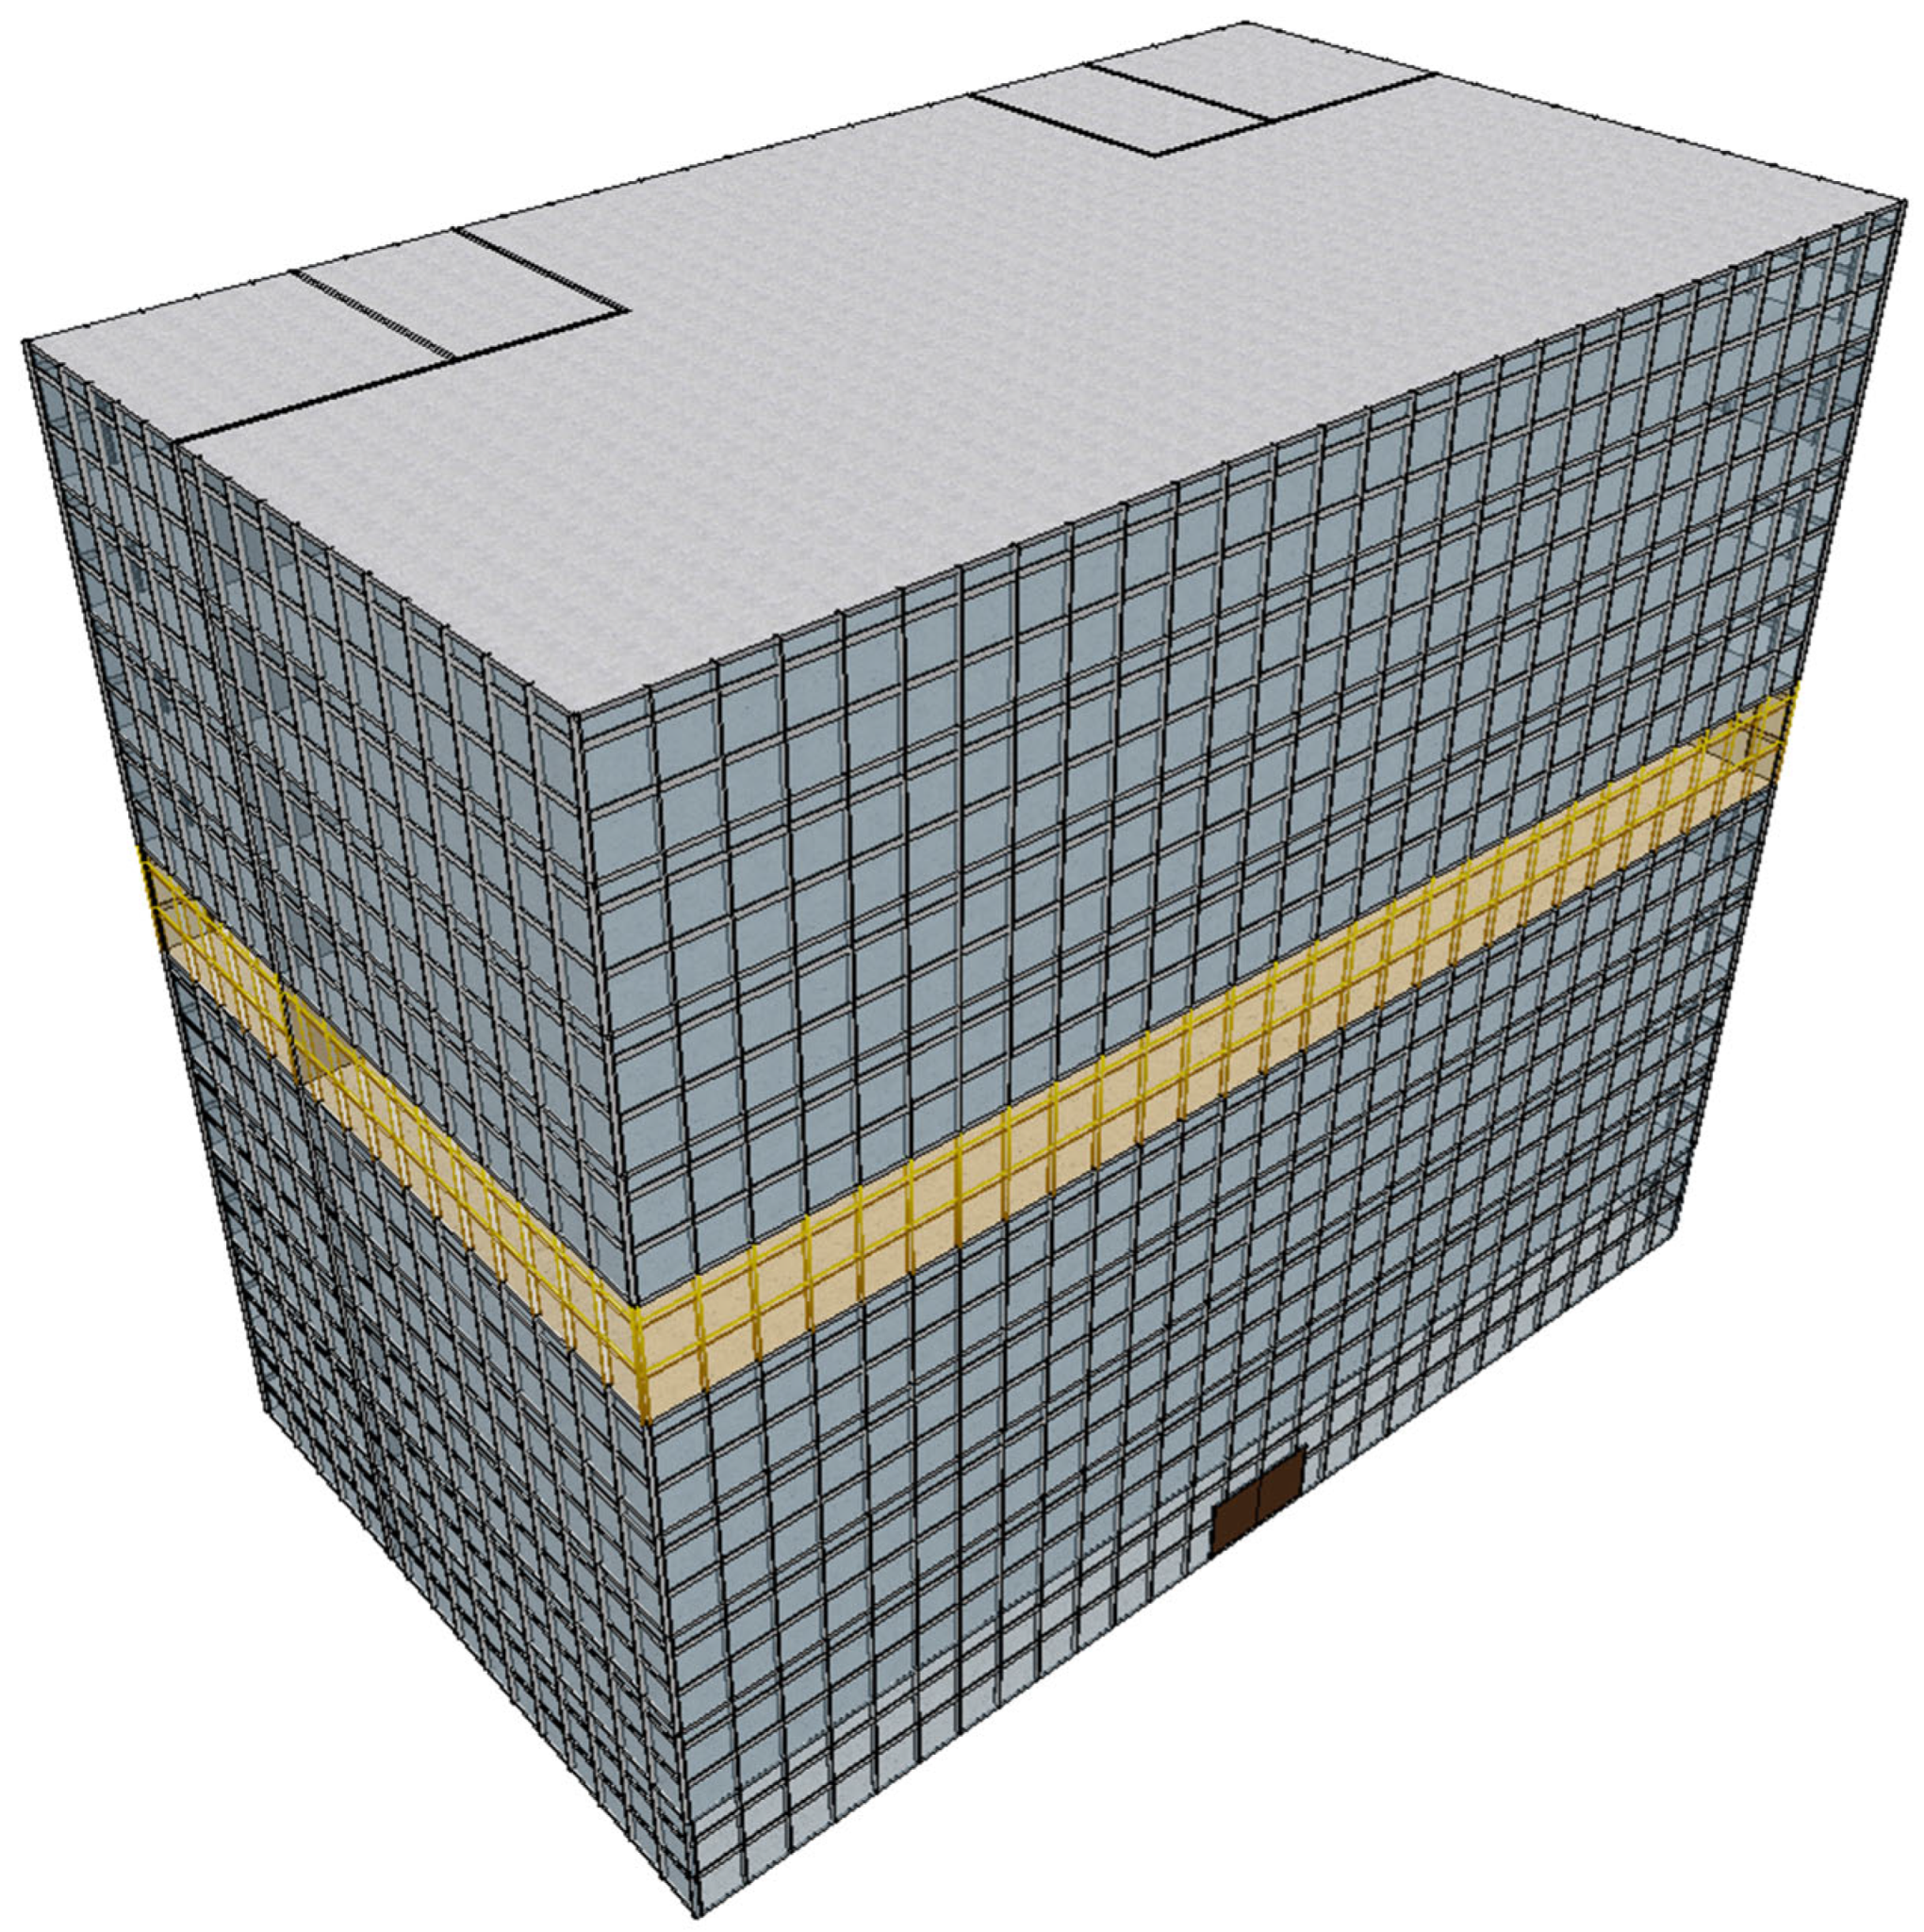
2.2. Building Model
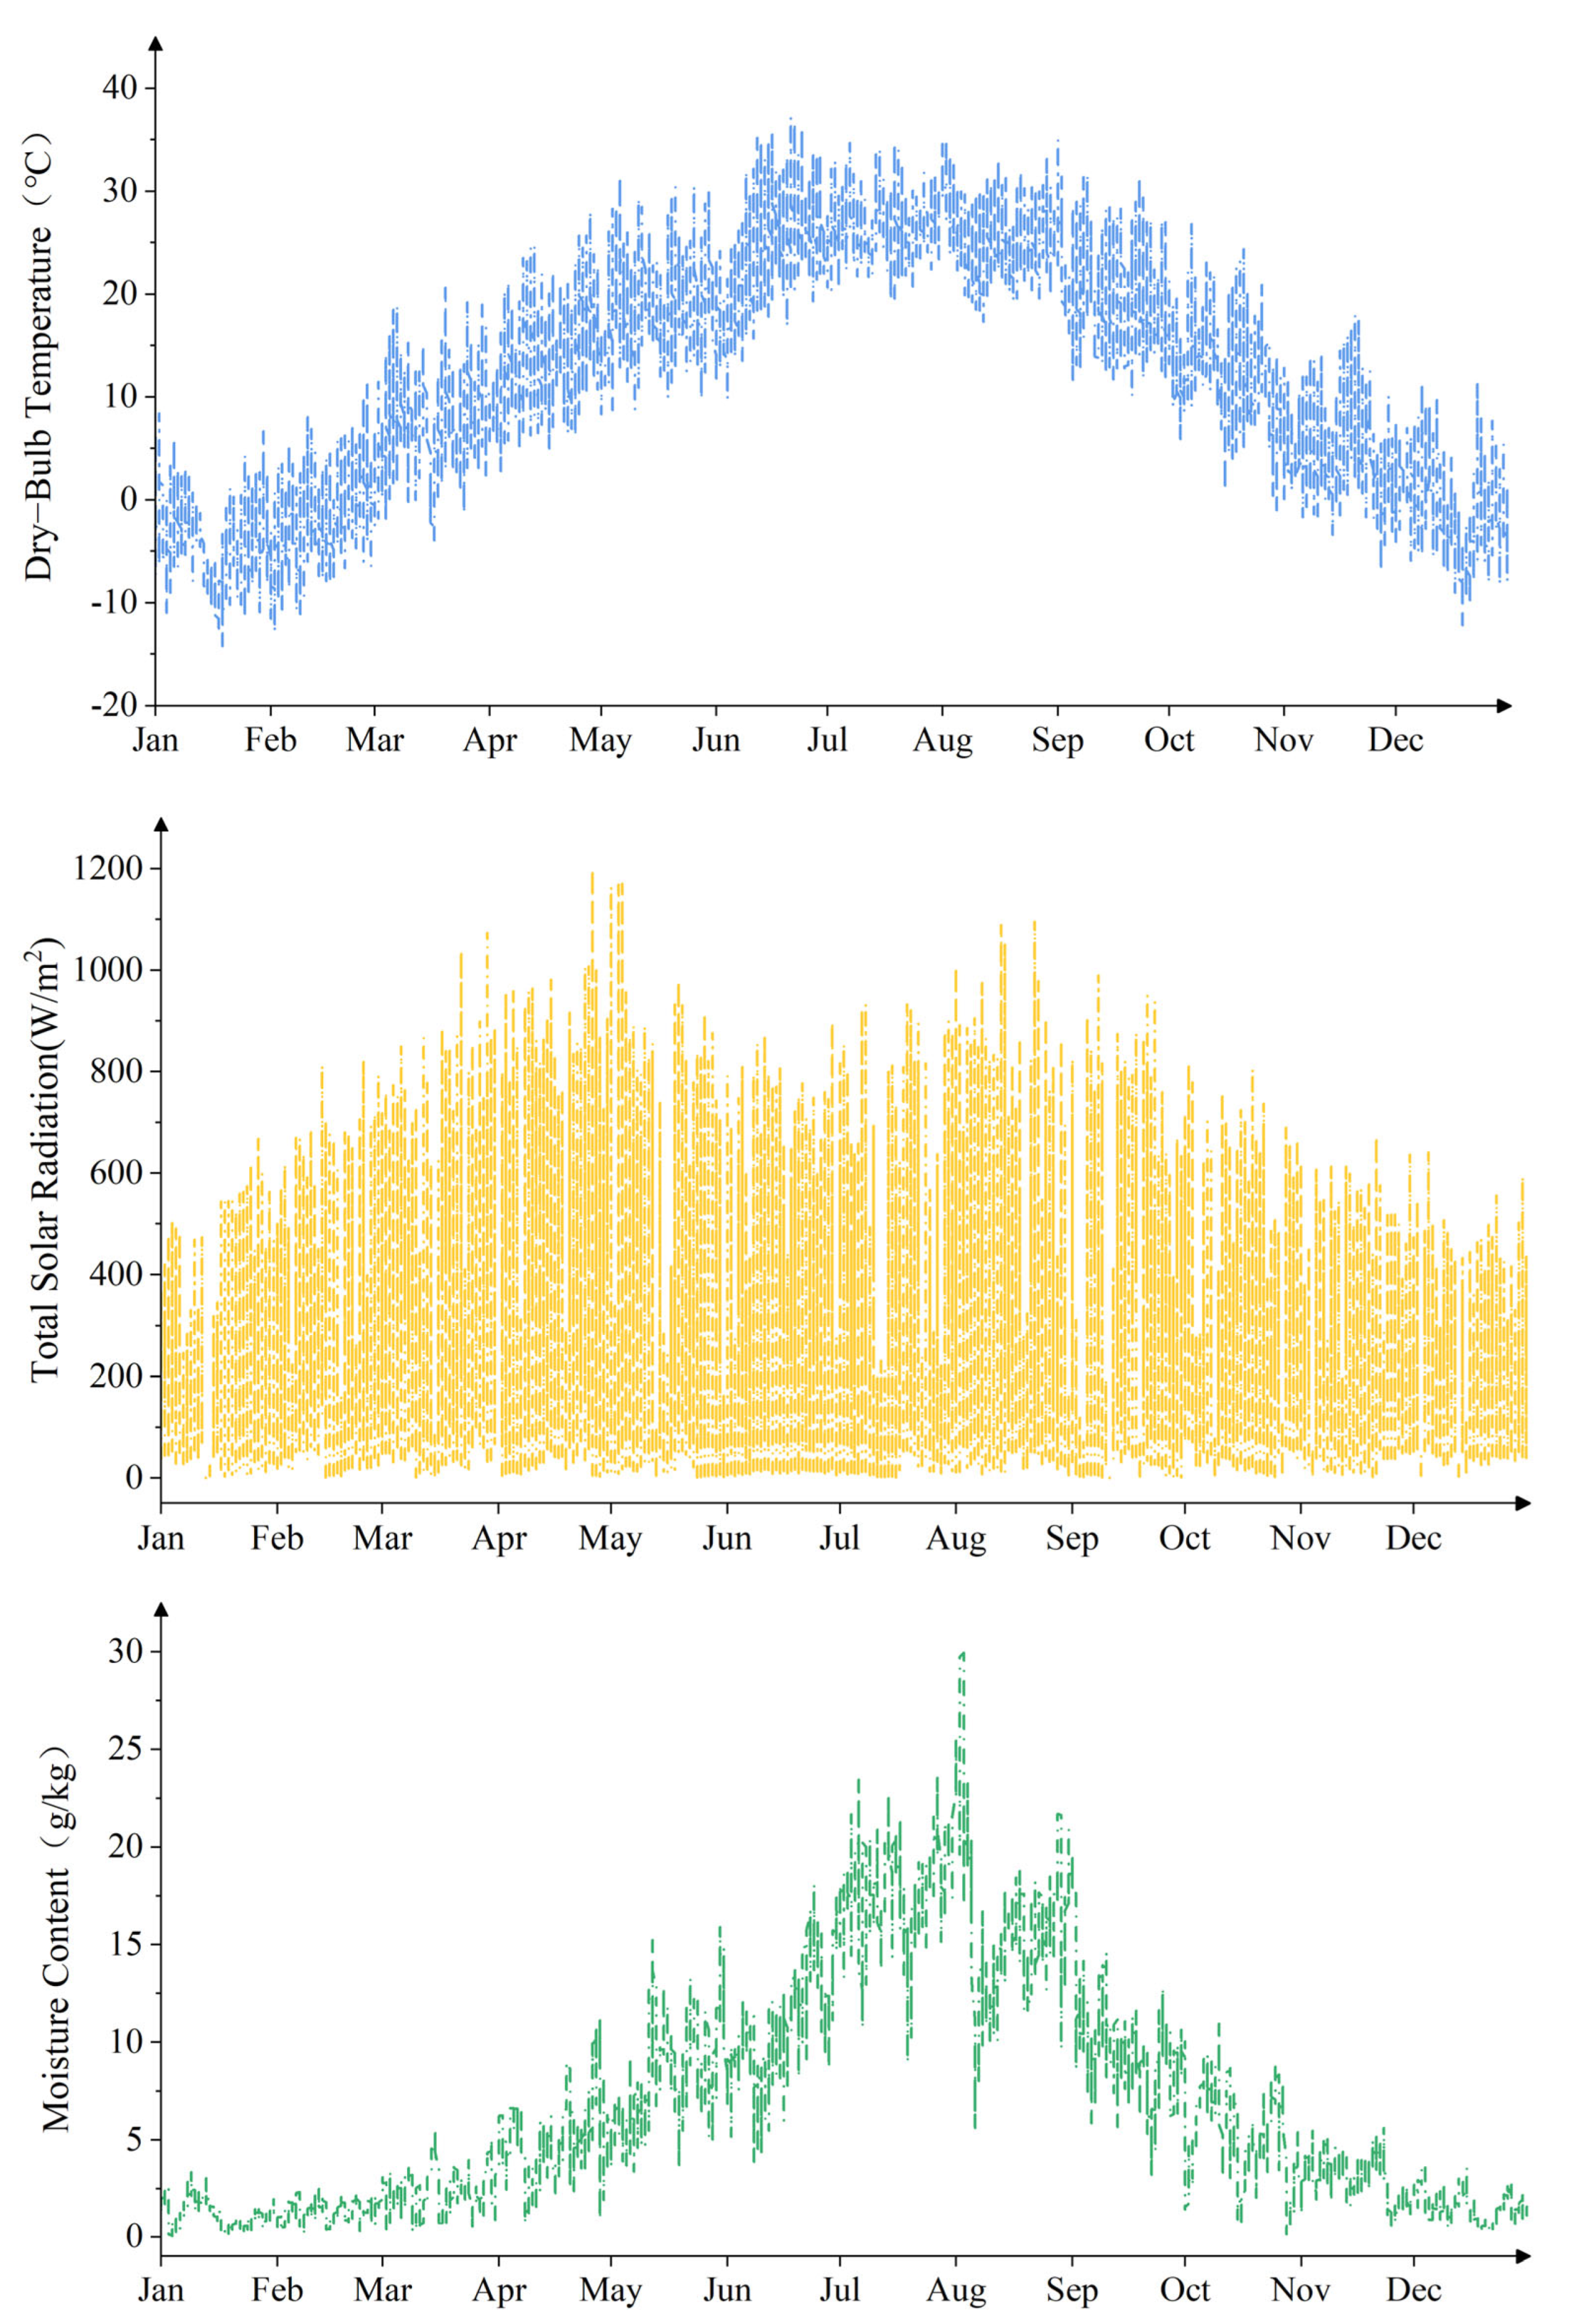
2.3. Calculation Parameters
2.4. Thermal Comfort Model
2.5. Working Condition Setting
- (1)
- Simulation without Shading
- (2)
- Simulation with Shading
3. Results and Discussion
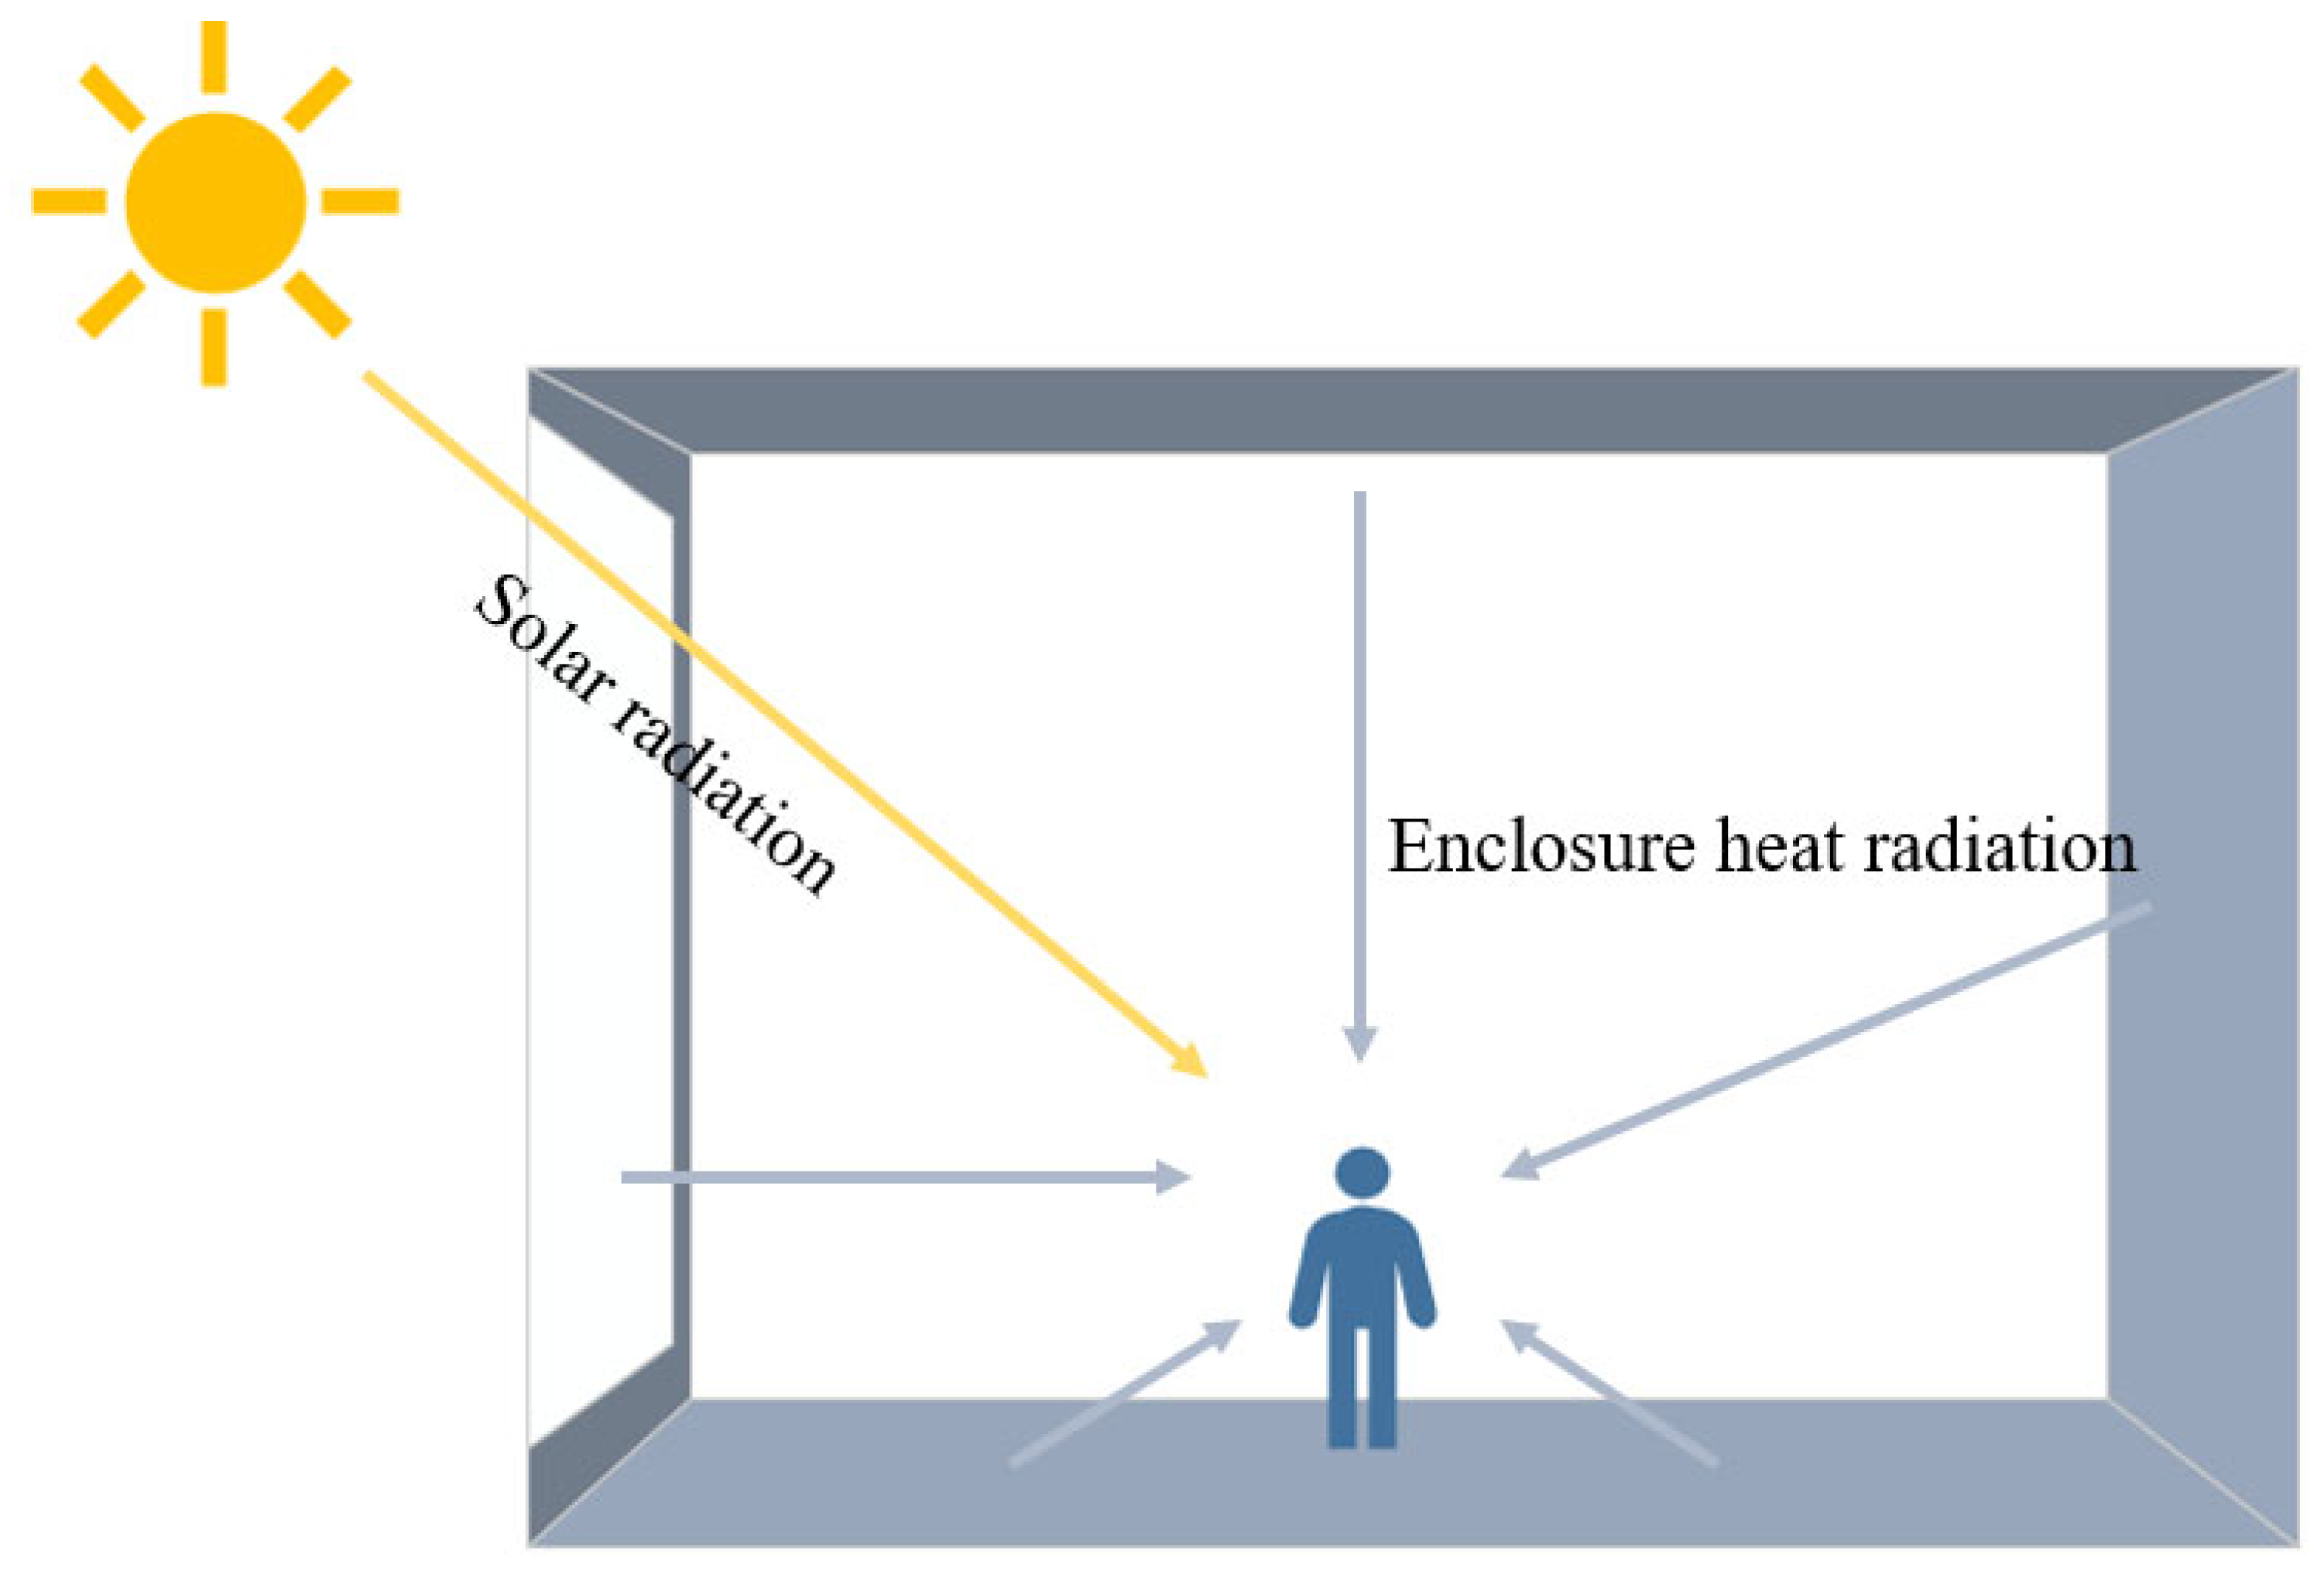
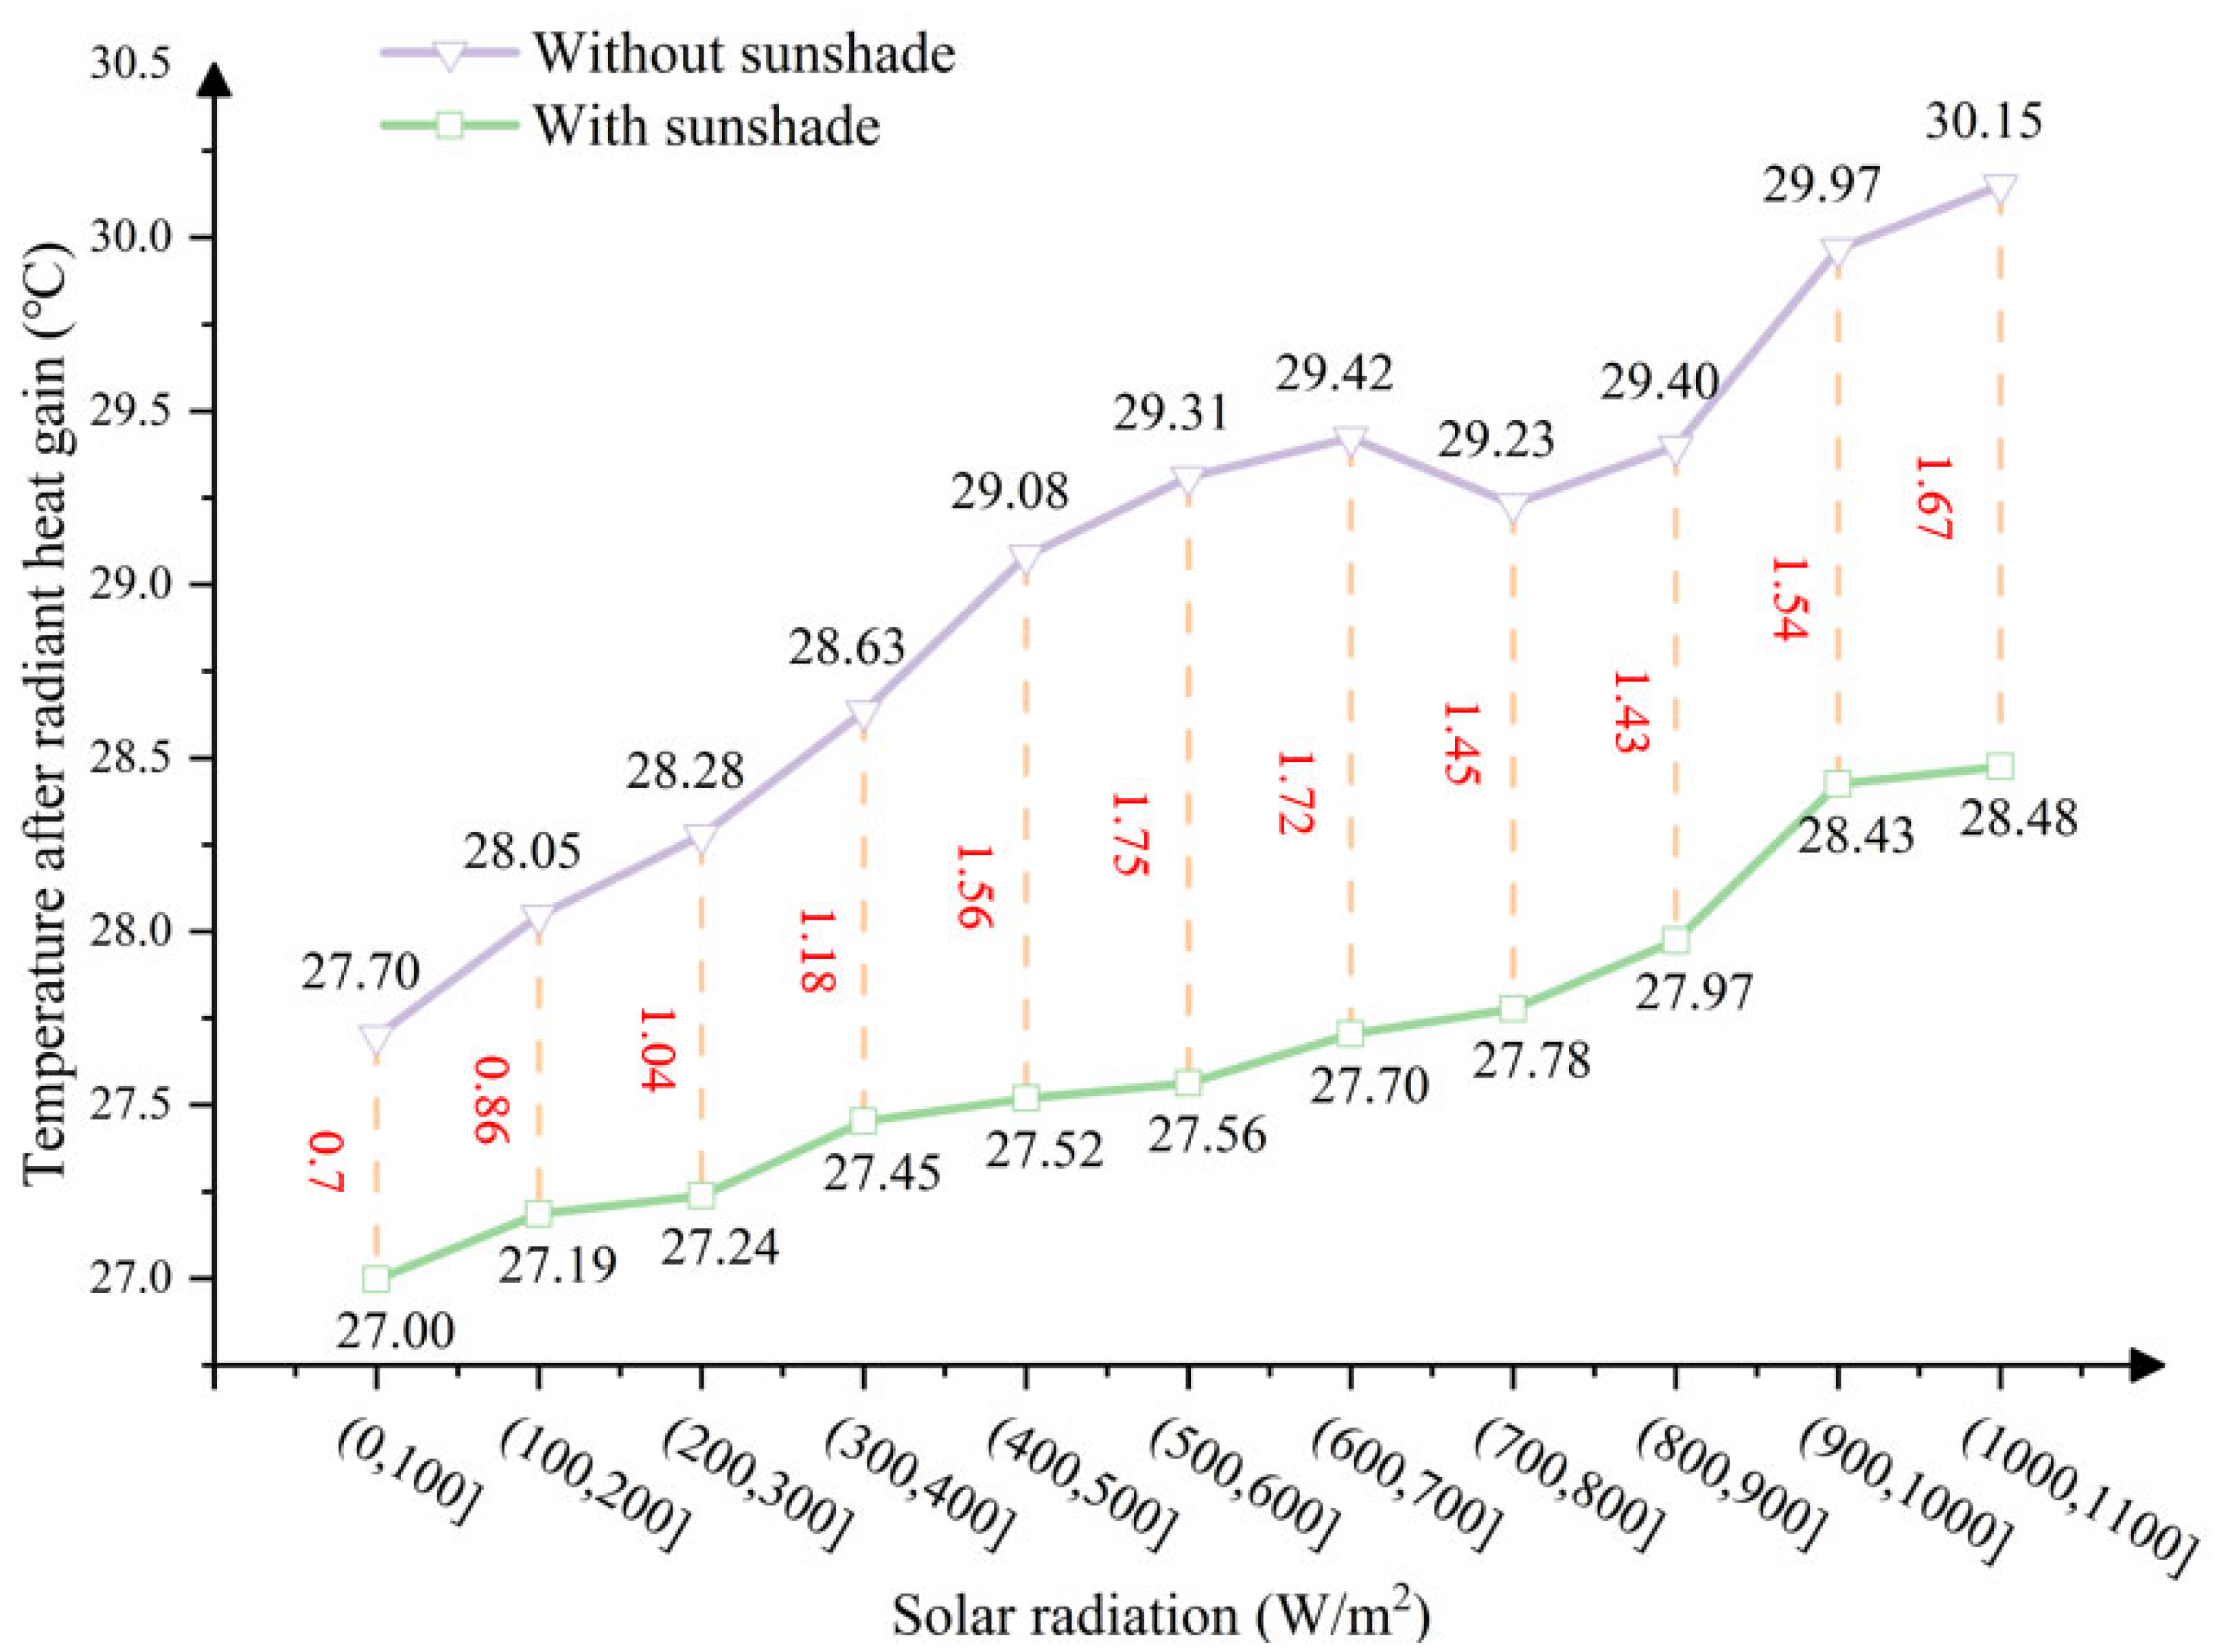
3.1. Influence of Solar Heat Gain on MRT Based on Thermal Comfort
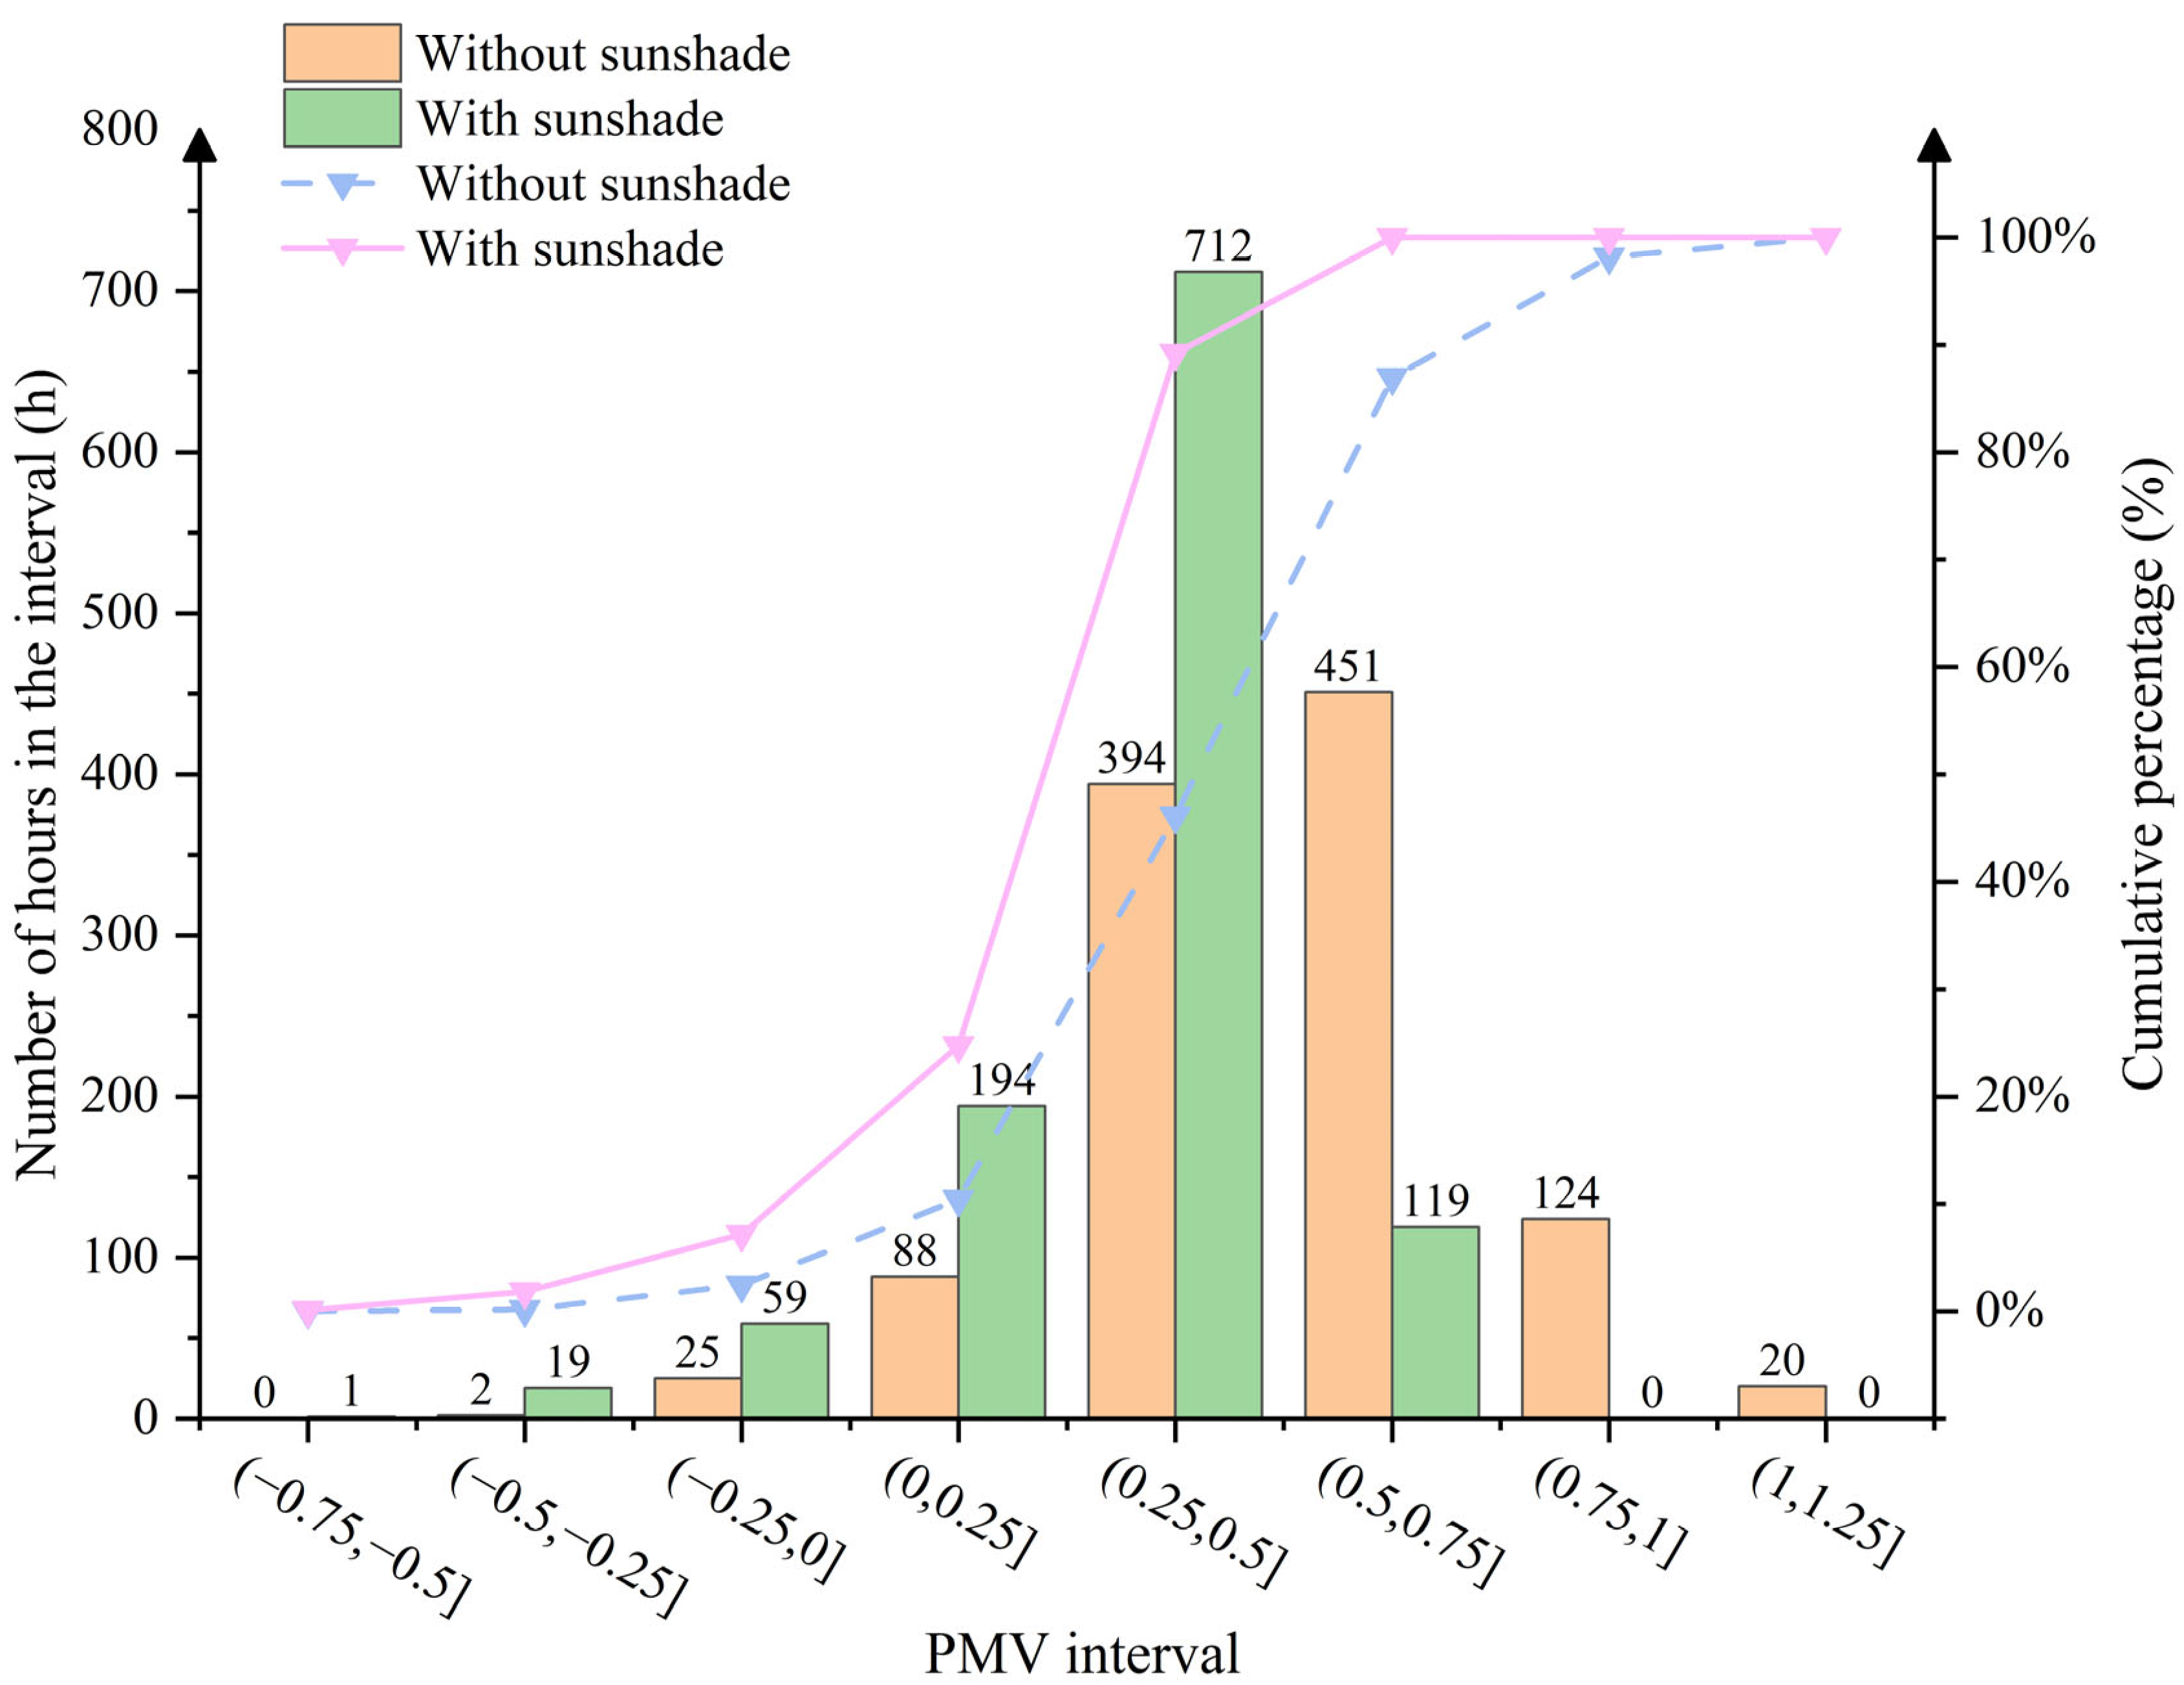
3.2. Influence of Solar Heat Gain on PMV Values Based on Thermal Comfort
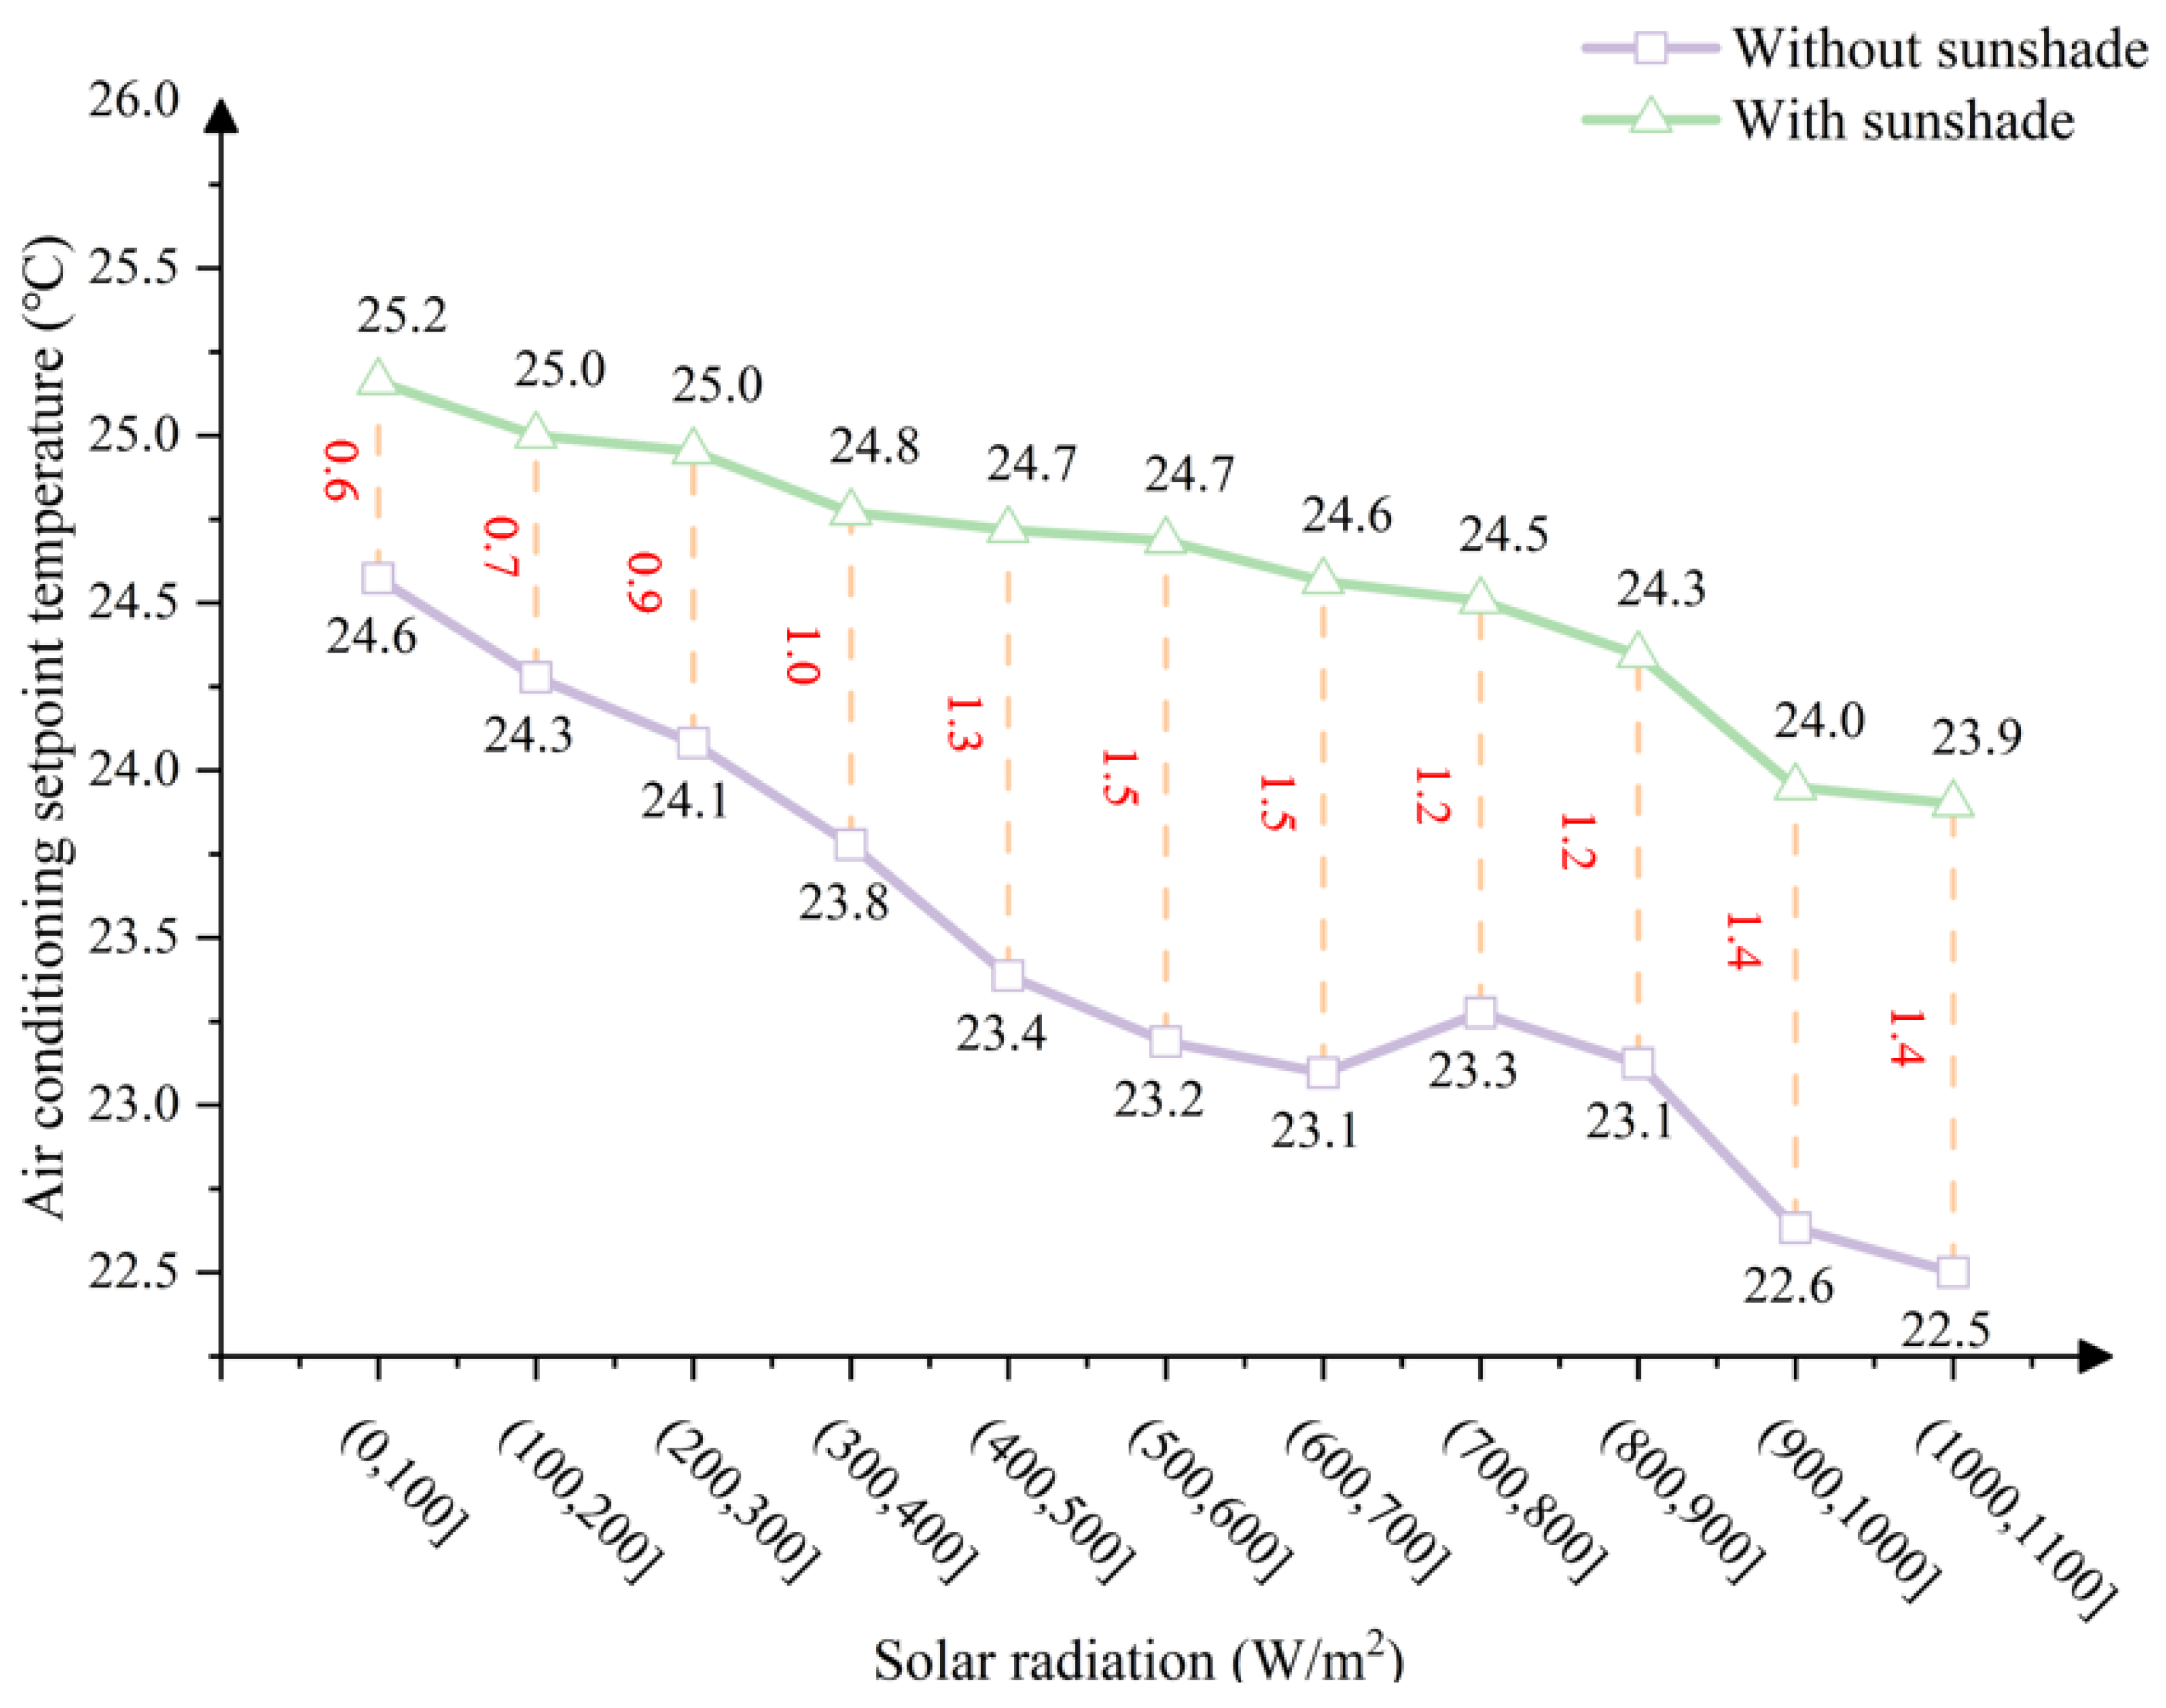
3.3. Influence of Solar Heat Gain on Air Conditioning Set Temperature Based on Thermal Comfort
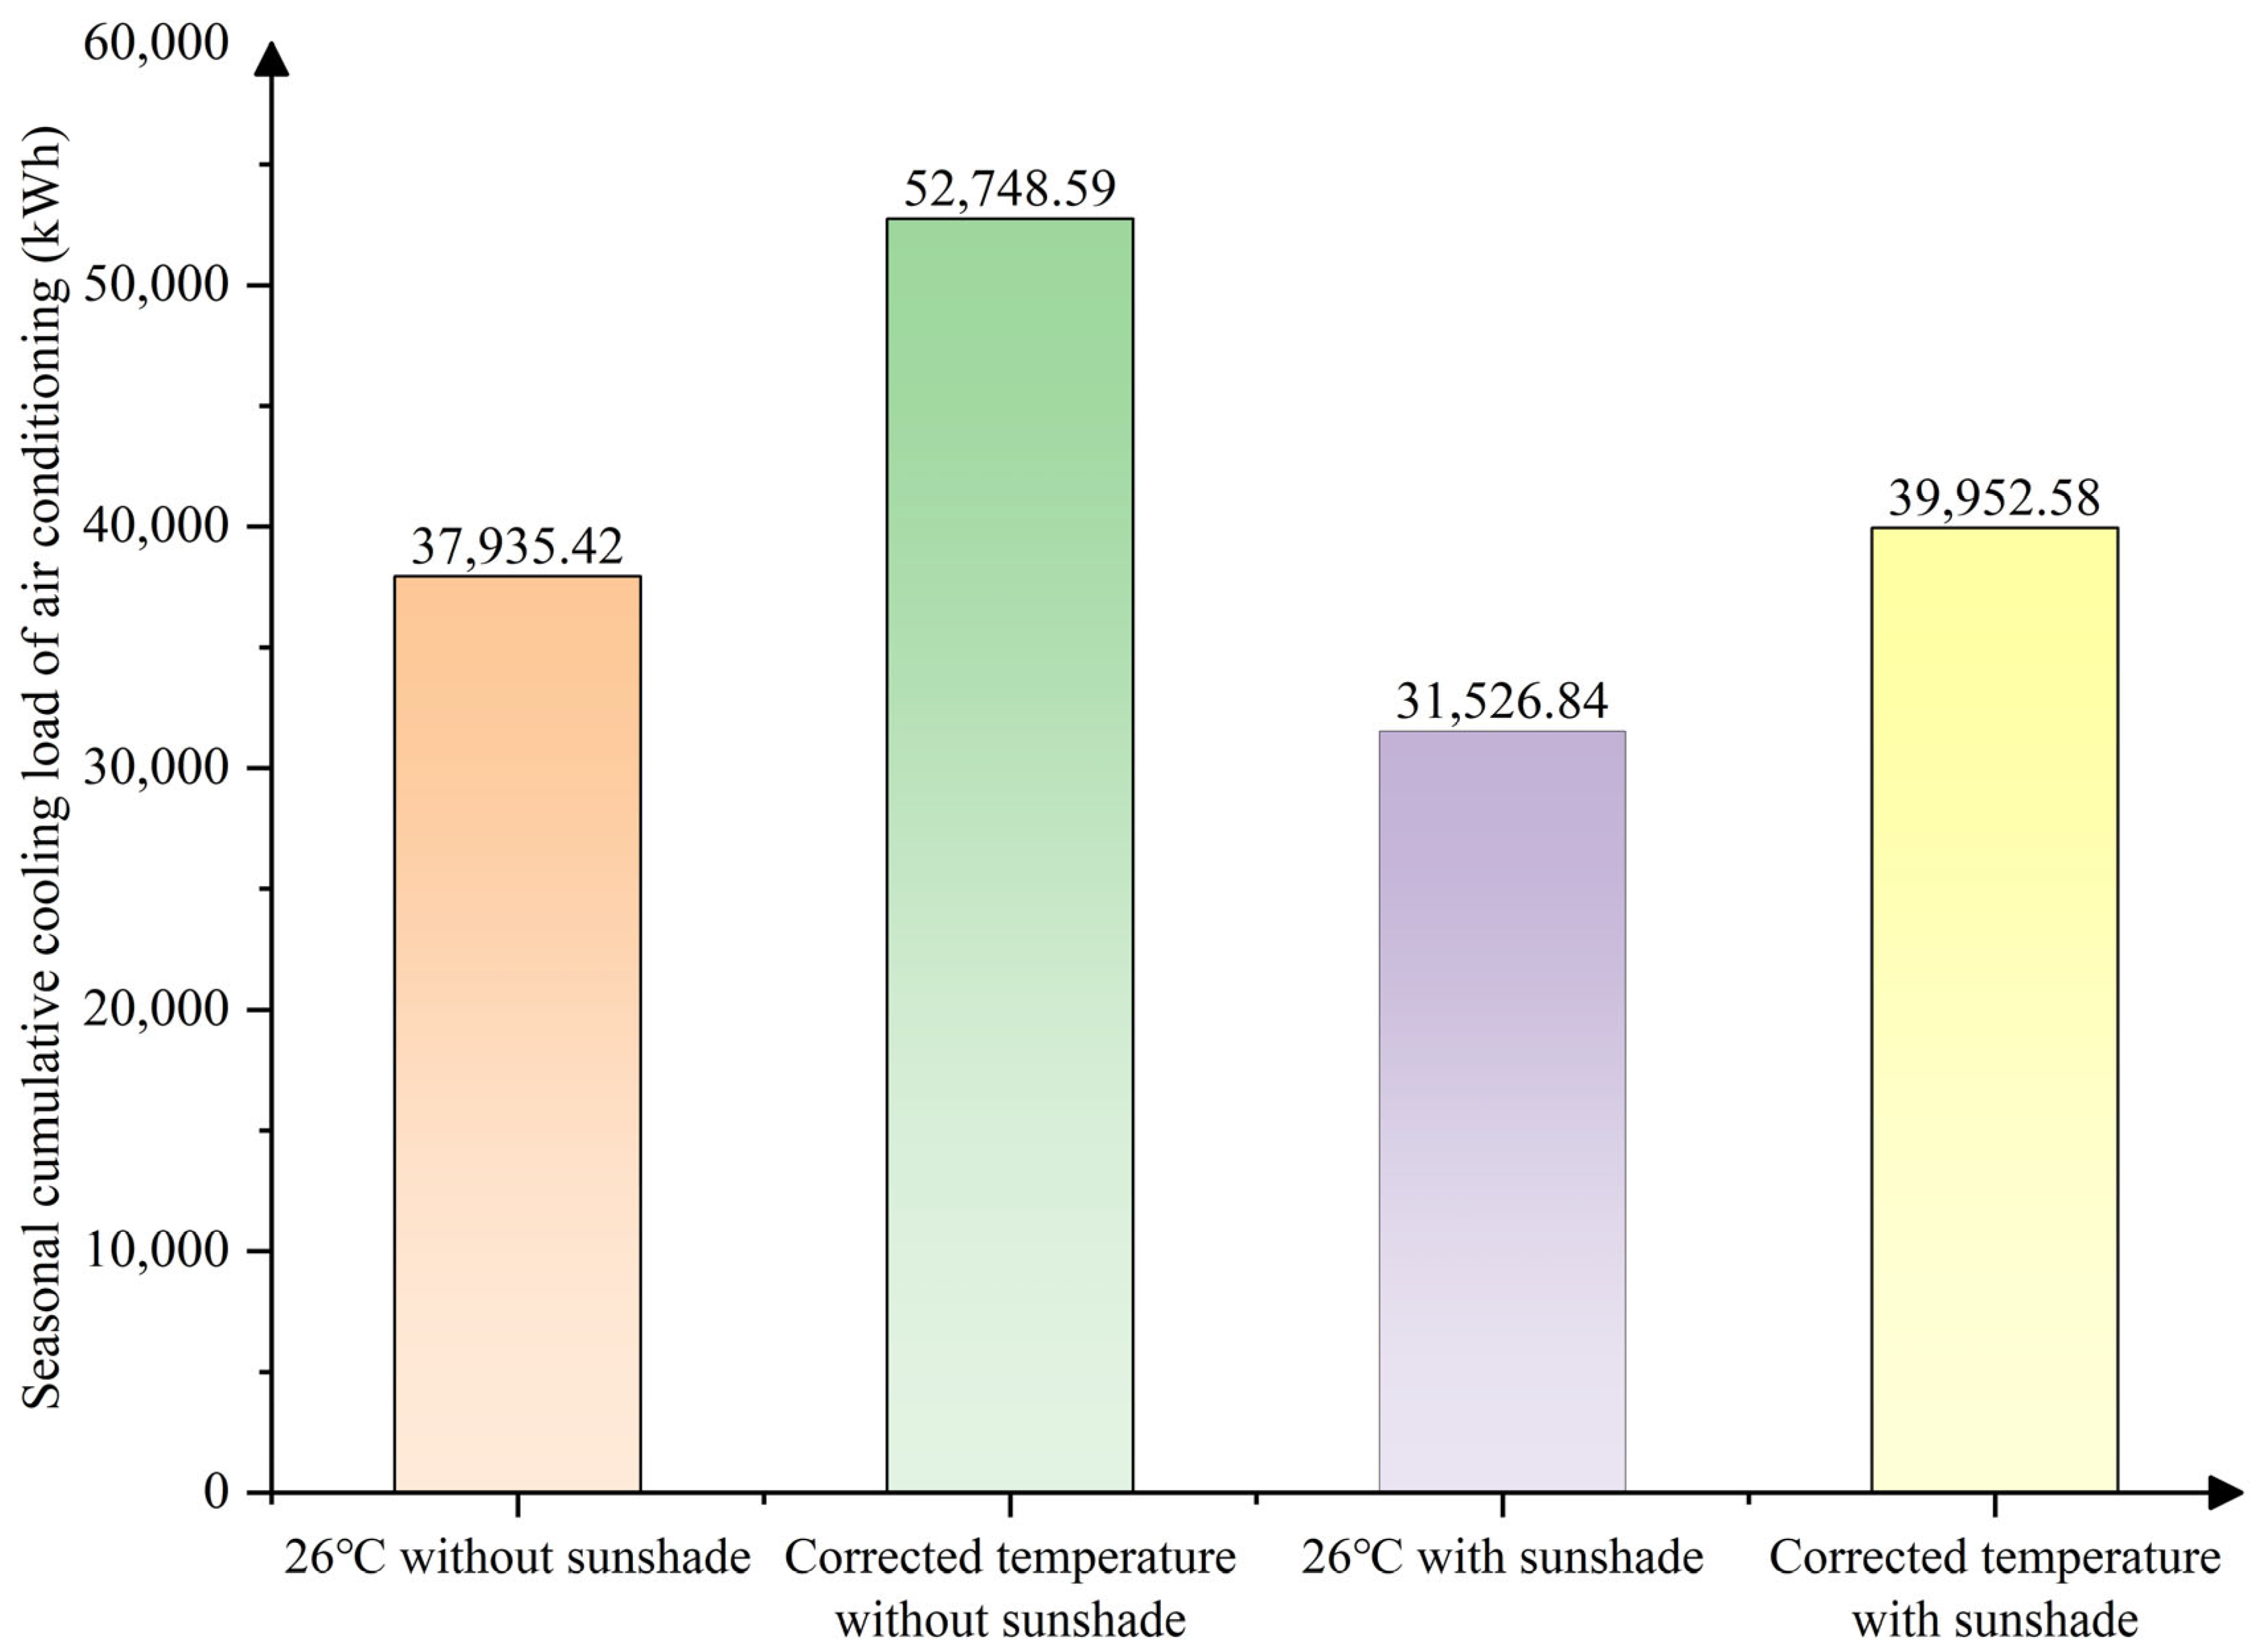
3.4. Influence of Solar Heat Gain on Air Conditioning Energy Consumption Based on Thermal Comfort
- (1)
- Under constant temperature settings, the cumulative cooling load decreases to 31,526.84 kWh, representing a reduction of approximately 16.89% compared to that of the no-curtain condition.
- (2)
- With corrected temperature adjustment, the cumulative cooling load further decreases, achieving a reduction of approximately 24.26% compared to that of the no-curtain condition.
4. Conclusions
- (1)
- Dynamic temperature adjustment is critical for thermal comfort
- (2)
- Solar heat gain necessitates lower temperature settings
- (3)
- Solar heat gain is a major factor influencing air conditioning energy consumption
Author Contributions
Funding
Data Availability Statement
Acknowledgments
Conflicts of Interest
Abbreviations
| PMV | predicted mean vote |
| MRT | mean radiant temperature °C |
| ERF | effective radiant field W/m2 |
| SHARP | solar horizontal angle relative to front of person ° |
| SHGC | solar heat gain coefficient |
| SET | standard effective temperature °C |
| feff | fraction of body exposed to sun |
| Esolar | total shortwave solar radiant flux W/m2 |
| αSW | shortwave radiation absorptivity |
| αLW | long-wave radiation absorptivity |
| Ediff | diffuse component of shortwave solar radiant flux W/m2 |
| Edir | direct beam component of shortwave solar radiant flux W/m2 |
| hr | radiation heat transfer coefficient W/m2 K |
| ERFsolar | effective radiant field solar component W/m2 |
| fsvv | fraction of sky vault exposed to body |
| Tsol | glazing solar transmittance |
| Idiff | diffuse solar beam intensity W/m2 |
| Erefl | reflected component of shortwave solar radiant flux W/m2 |
| ITH | total horizontal solar beam intensity W/m2 |
| Rfloor | floor reflectivity |
| Ap | projected area m2 |
| fbes | fraction of body exposed to sun |
| Ta | air temperature °C |
References
- Zhou, K.; Shi, J.-L.; Fu, J.-Y.; Zhang, S.-X.; Liao, T.; Yang, C.-Q.; Wu, J.-R.; He, Y.-C. An Improved YOLOv10 Algorithm for Automated Damage Detection of Glass Curtain-Walls in High-Rise Buildings. J. Build. Eng. 2025, 101, 111812. [Google Scholar] [CrossRef]
- Su, M.; Jie, P.; Zhu, S.; Li, P.; Gao, N.; Causone, F.; Wu, X.; Yang, X.; Shi, X. Evaluating the Thermal Environment of a Large Atrium in an Office Building Using Computational Fluid Dynamics. J. Build. Eng. 2025, 100, 111754. [Google Scholar] [CrossRef]
- Pan, J.; Li, N.; Zhang, W.; He, Y.; Hu, X. Investigation Based on Physiological Parameters of Human Thermal Sensation and Comfort Zone on Indoor Solar Radiation Conditions in Summer. Build. Environ. 2022, 226, 109780. [Google Scholar] [CrossRef]
- GB 50736-2012; Design Code for Heating Ventilation and Air Conditioning of Civil Buildings. China Architecture & Building Press: Beijing, China, 2015.
- Ji, Y.; Song, J.; Shen, P. A Review of Studies and Modelling of Solar Radiation on Human Thermal Comfort in Outdoor Environment. Build. Environ. 2022, 214, 108891. [Google Scholar] [CrossRef]
- Mamani, T.; Herrera, R.F.; Muñoz-La Rivera, F.; Atencio, E. Variables That Affect Thermal Comfort and Its Measuring Instruments: A Systematic Review. Sustainability 2022, 14, 1773. [Google Scholar] [CrossRef]
- Park, K.-Y.; Woo, D.-O. PMV Dimension Reduction Utilizing Feature Selection Method: Comparison Study on Machine Learning Models. Energies 2023, 16, 2419. [Google Scholar] [CrossRef]
- Kim, S.-K.; Ryu, J.-H.; Seo, H.-C.; Hong, W.-H. Understanding Occupants’ Thermal Sensitivity According to Solar Radiation in an Office Building with Glass Curtain Wall Structure. Buildings 2022, 12, 58. [Google Scholar] [CrossRef]
- Tse, W.L.; Chan, W.L. A Distributed Sensor Network for Measurement of Human Thermal Comfort Feelings. Sens. Actuators Phys. 2008, 144, 394–402. [Google Scholar] [CrossRef]
- Hwang, R.-L.; Fang, P.-L.; Chen, W.-A. Impact of Solar Radiation on Indoor Thermal Comfort near Highly Glazed Façades in a Hot-Humid Subtropical Climate: An Experimental Evaluation. Build. Environ. 2023, 243, 110725. [Google Scholar] [CrossRef]
- Li, G.; Liu, D.; Hu, A.; Yan, Q.; Ma, L.; Tang, L.; Wu, X.; Wang, J.; Wang, Z. Effect of Solar Radiation on Human Thermal Sensation and Physiological Parameters in a Convection–Radiation Air Conditioning Environment. Build. Simul. 2024, 17, 1359–1377. [Google Scholar] [CrossRef]
- Hwang, R.-L.; Chen, W.-A. Creating Glazed Facades Performance Map Based on Energy and Thermal Comfort Perspective for Office Building Design Strategies in Asian Hot-Humid Climate Zone. Appl. Energy 2022, 311, 118689. [Google Scholar] [CrossRef]
- Nie, J.; Pang, Y.; Wang, C.; Zhang, H.; Yin, K. Theoretical Study on the Relationship of Building Thermal Insulation with Indoor Thermal Comfort Based on APMV Index and Energy Consumption of Rural Residential Buildings. Appl. Sci. 2021, 11, 8565. [Google Scholar] [CrossRef]
- Sun, H.; Cui, X.; Sun, S.; Tian, Y.; Xu, W. Temperature Distribution and Energy Saving Effect of Glass House with Low-E Insulating Glass. Build. Energy Effic. 2007, 201, 36–38. (In Chinese) [Google Scholar]
- Zhang, C.; Li, D.; Yang, R.; Hu, W.; Liu, C. The Study on Indoor Thermal Environment of The Three Layers Glass Curtain Wall Filled With Silica Aerogel and Phase Change Materials. J. Eng. Thermophys. 2023, 44, 2560–2566. (In Chinese) [Google Scholar]
- Li, J.; Wang, H.; Zhang, F.; Zhuang, X. Study on the Influence of Indoor Thermal Environment Control on Thermal Comfort and Energy Consumption in Winter. Build. Sci. 2023, 39, 40–50. (In Chinese) [Google Scholar]
- Tian, Y.; Huang, Q.; Wang, T. Comparative Field and Simulation Study on the Effects of Window Area on Indoor Thermal Comfort. Build. Sci. 2022, 38, 84–91. (In Chinese) [Google Scholar]
- Landuyt, L.; De Turck, S.; Laverge, J.; Steeman, M.; Van Den Bossche, N. Balancing Environmental Impact, Energy Use and Thermal Comfort: Optimizing Insulation Levels for The Mobble with Standard HVAC and Personal Comfort Systems. Build. Environ. 2021, 206, 108307. [Google Scholar] [CrossRef]
- Chen, Y.; Li, M.; Lu, J.; Chen, B. Influence of Residential Indoor Environment on Quality of Life in China. Build. Environ. 2023, 232, 110068. [Google Scholar] [CrossRef]
- Mazzeo, D.; Matera, N.; Cornaro, C.; Oliveti, G.; Romagnoni, P.; De Santoli, L. EnergyPlus, IDA ICE and TRNSYS Predictive Simulation Accuracy for Building Thermal Behaviour Evaluation by Using an Experimental Campaign in Solar Test Boxes with and without a PCM Module. Energy Build. 2020, 212, 109812. [Google Scholar] [CrossRef]
- Nie, W.-S.; Sun, T.; Ni, G.-H. Spatiotemporal Characteristics of Anthropogenic Heat in an Urban Environment: A Case Study of Tsinghua Campus. Build. Environ. 2014, 82, 675–686. [Google Scholar] [CrossRef]
- Zhu, D.; Hong, T.; Yan, D.; Wang, C. A Detailed Loads Comparison of Three Building Energy Modeling Programs: EnergyPlus, DeST and DOE-2.1E. Build. Simul. 2013, 6, 323–335. [Google Scholar] [CrossRef]
- Feng, C.; Ma, F.; Wang, R.; Xu, Z.; Zhang, L.; Zhao, M. An Experimental Study on the Performance of New Glass Curtain Wall System in Different Seasons. Build. Environ. 2022, 219, 109222. [Google Scholar] [CrossRef]
- Kong, X.; Liu, S.; Yang, H.; Zhong, Y.; Qi, C. An Experimental Study of All-Season Operation Strategy for a Respiration-Type Double-Layer Glass Curtain Wall System in Cold Zone of China. Build. Environ. 2016, 97, 166–176. [Google Scholar] [CrossRef]
- GB 50189-2015; Design Standard for Energy Efficiency of Public Buildings. China Architecture & Building Press: Beijing, China, 2012.
- GB/T 50034-2024; Standard for Lighting Design of Buildings. China Architecture & Building Press: Beijing, China, 2024.
- Wang, H.; Huang, C.; Liu, Z.; Tang, G.; Liu, Y.; Wang, Z. Dynamic Evaluation of Thermal Comfort Environment of Air-Conditioned Buildings. Build. Environ. 2006, 41, 1522–1529. [Google Scholar] [CrossRef]
- Van Hoof, J. Forty Years of Fanger’s Model of Thermal Comfort: Comfort for All? Indoor Air 2008, 18, 182–201. [Google Scholar] [CrossRef]
- Xu, J. Discussion on the Application Range of the PMV Equation. J. Civ. Environ. Eng. 2005, 27, 13–18. (In Chinese) [Google Scholar]
- Zheng, H.; Yu, K. An Optimization Control Method of IEH Considering User Thermal Comfort. Energies 2024, 17, 948. [Google Scholar] [CrossRef]
- Zomorodian, Z.S.; Tahsildoost, M. Assessment of Window Performance in Classrooms by Long Term Spatial Comfort Metrics. Energy Build. 2017, 134, 80–93. [Google Scholar] [CrossRef]
- He, Y.; Arens, E.; Li, N.; Wang, Z.; Zhang, H.; A, Y.; Yuan, C. Modeling Solar Radiation on a Human Body Indoors by a Novel Mathematical Model. Build. Environ. 2021, 187, 107421. [Google Scholar] [CrossRef]
- Arens, E.; Hoyt, T.; Zhou, X.; Huang, L.; Zhang, H.; Schiavon, S. Modeling the Comfort Effects of Short-Wave Solar Radiation Indoors. Build. Environ. 2015, 88, 3–9. [Google Scholar] [CrossRef]
- Wang, H.; Lu, Y.; Tian, X.; Zhang, B.; Wang, M.; Zhou, W.; Gao, J. A Radiative Heat Network Method for Accurate Indoor Radiant Field and Thermal Comfort Evaluation. Appl. Therm. Eng. 2025, 268, 125910. [Google Scholar] [CrossRef]
- Kheybari, A.G.; Gutai, M.; Mok, B.; Cavana, G. Thermal Comfort of Standard and Advanced Glazed Building Envelopes. Energy Build. 2025, 329, 115211. [Google Scholar] [CrossRef]
- Tartarini, F.; Schiavon, S.; Cheung, T.; Hoyt, T. CBE Thermal Comfort Tool: Online Tool for Thermal Comfort Calculations and Visualizations. SoftwareX 2020, 12, 100563. [Google Scholar] [CrossRef]
- Song, B.; Yang, L.; Bai, L. Field Experimental Study of the Impact of Solar Radiation on the Thermal Comfort of Occupants near the Glazing Area in an Office Building. Energy Build. 2025, 332, 115422. [Google Scholar] [CrossRef]
- Yu, C.; Pan, W. Inter-Building Effect on Building Energy Consumption in High-Density City Contexts. Energy Build. 2023, 278, 112632. [Google Scholar] [CrossRef]


| Envelope Structure | Thickness and Materials (From Outside to Inside) | Heat Transfer Coefficient (W/m2·K) | Thermal Resistance Values (m2·K/W) |
|---|---|---|---|
| External Wall | 20 mm Cement Sand Mortar + 25 mm Cement Fiber Board + 100 mm Cellular Concrete + 240 mm Heavy Sand Clay Brick | 0.90 | 0.95 |
| Internal Wall | 8 mm Gypsum Board + 60 mm Polystyrene Foam Plastic + 10 mm Gypsum Board + 240 mm Heavy Sand Clay Brick | 1.5 | 0.43 |
| Curtain Wall | Low-E Coated Double Glazing (Low Emissivity) [6 (Low-E) + 9 + 6] | 2.1 | 0.48 |
| Roof | 20 mm Cement Sand Mortar + 200 mm Cellular Concrete + 130 mm Reinforced Concrete + 15 mm Cement Mortar | 0.81 | 0.098 |
| Floor Slab | 25 mm Cement Mortar + 200 mm Reinforced 20 mm Cement Sand Mortar + 80 mm Reinforced Concrete + 20 mm Cement Sand Mortar | 3.0 | 1.1 |
| Parameters | Outdoor Air Temperature (°C) | Heat Transfer Coefficient (W/m2·K) | Indoor Air Temperature (°C) | Relative Humidity (%) |
|---|---|---|---|---|
| Inputs | Dynamically meteorological of DeST | Table 1 | Summer: 26 °C | Summer: 50% |
| Winter: 20 °C | Winter: 30% |
| Room | The Maximum Power of the Lights (W) | The Maximum Power of the Equipment (W) | Personnel Heat Load (W) | Personnel Wet Load (kg/hr) | Maximum Number of Occupants in the Room (Per) |
|---|---|---|---|---|---|
| Office | 18 | 13 | 66 | 0.102 | 40 |
| Toilet | 5 | 0 | 61 | 0.109 | 8 |
| Stairwell | 5 | 0 | 58 | 0.184 | 8 |
| Time Period | Personnel, Lighting, and Equipment Operating Hours (Working Days) | Personnel, Lighting, and Equipment Operating Hours (Non-Working Days) | Air Conditioning Runtime |
|---|---|---|---|
| 0:00–8:00 | OFF | OFF | OFF |
| 8:00–12:00 | ON (100%) | ON (30%) | ON (100%) |
| 12:00–13:00 | ON (30%) | ON (10%) | ON (100%) |
| 13:00–17:00 | ON (100%) | ON (30%) | ON (100%) |
| 17:00–18:00 | ON (50%) | ON (20%) | ON (100%) |
| 18:00–20:00 | ON (10%) | ON (10%) | ON (100%) |
| 20:00–0:00 | OFF | OFF | OFF |
| Parameters | Air Temperature (°C) | Mean Radiant Temperature (°C) | Air Speed (m/s) | Relative Humidity (%) | Metabolic Rate (met) | Clothing Level (clo) |
|---|---|---|---|---|---|---|
| Inputs | 26 °C | Temperature as affected by solar heat gain | 0.1 | 50 | 1.1 | 0.5 |
Disclaimer/Publisher’s Note: The statements, opinions and data contained in all publications are solely those of the individual author(s) and contributor(s) and not of MDPI and/or the editor(s). MDPI and/or the editor(s) disclaim responsibility for any injury to people or property resulting from any ideas, methods, instructions or products referred to in the content. |
© 2025 by the authors. Licensee MDPI, Basel, Switzerland. This article is an open access article distributed under the terms and conditions of the Creative Commons Attribution (CC BY) license (https://creativecommons.org/licenses/by/4.0/).
Share and Cite
Chen, H.; Nie, J.; Liu, Y.; Li, Y. Theoretical Study on Impact of Solar Radiation Heat Gain on Thermal Comfort and Energy Efficiency in Glass Curtain Wall Buildings Based on PMV Index. Buildings 2025, 15, 2228. https://doi.org/10.3390/buildings15132228
Chen H, Nie J, Liu Y, Li Y. Theoretical Study on Impact of Solar Radiation Heat Gain on Thermal Comfort and Energy Efficiency in Glass Curtain Wall Buildings Based on PMV Index. Buildings. 2025; 15(13):2228. https://doi.org/10.3390/buildings15132228
Chicago/Turabian StyleChen, Haoyu, Jinzhe Nie, Yuzhe Liu, and Yuelin Li. 2025. "Theoretical Study on Impact of Solar Radiation Heat Gain on Thermal Comfort and Energy Efficiency in Glass Curtain Wall Buildings Based on PMV Index" Buildings 15, no. 13: 2228. https://doi.org/10.3390/buildings15132228
APA StyleChen, H., Nie, J., Liu, Y., & Li, Y. (2025). Theoretical Study on Impact of Solar Radiation Heat Gain on Thermal Comfort and Energy Efficiency in Glass Curtain Wall Buildings Based on PMV Index. Buildings, 15(13), 2228. https://doi.org/10.3390/buildings15132228