Abstract
Water ingress and penetration of aggressive fluids undermines the integrity of many concrete structures. For this reason, optimal performance of such structures up to their designed life cannot be guaranteed. This study introduces nano silicon as an alternative waterproofing admixture for increasing life span of cementitious materials, due to its non-vulnerability to deterioration, which is common to traditional surface coating solutions. Therefore, nano silicon was characterized using Field Emission Scanning Electron Microscope (FESEM), Energy Dispersion Spectroscopy (EDS), Fourier Transform Infrared Spectroscopy (FTIR), X-ray Diffraction (XRD), and surface Zeta potential. The Central Composite Design (CCD) tool was adopted to plan the experiment and further used to model the relationship between experimental variables and experimental response. The model was found to be nonlinear quadratic based on Analysis of Variance (ANOVA). Also, the validity of the model was evaluated and found to have accurate prediction with mean absolute percentage error (MAPE) of 1.62%. The optimum mix ratio necessary to increase resistance to capillary water absorption was established at a nano silicon dosage of 6.6% by weight of cement and w/c of 0.42. In conclusion, the overall results indicate that resistance to capillary water absorption was increased by 62%. Furthermore, while gas permeability was reduced by 31%, on the other hand, volume of water permeable voids decreased by 10%.
1. Introduction
Concrete is the most commonly and widely used material in the construction industry other than water. However, despite being rigid, it is a porous material that interacts with the environment through network of interconnected pores [1]. Consequently, these pores make it vulnerable to penetration of water, acidic gas, water vapor, dissolved ions, and other aggressive fluids. Therefore, exposure to water undermines the performance of concrete structures [2,3]. And consequently, lots of cost is required for maintenance of such structures as asserted by [4,5,6,7]. Proportion of mixing ingredients can affect the extent of water-resistance and porosity of concrete [1,8]. Also, quantity and the distribution of interconnected pores within the concrete matrix significantly influence the permeability and, thus, affects its life span [9]. To this effect, ref. [10] reported that use of waterproof concrete plays a critical role in improving the performance of concrete infrastructure by extending their service life. According to [11], waterproof material should not absorb more than 2.5% moisture as compared to a reference or a control sample. While [12] set aside 50%, on the other hand, ref. [13] asserted that there is no widely acknowledged and globally adopted criteria for rating water resistance penetration. Alternatively, ref. [14] recommends that waterproof concrete is one that prevents passage of water from one plane to another. For this reason, different studies adopted different techniques to develop waterproof concrete using many tests methods for rating water resistance [15]. Different test methods adopted are the permeability test, water absorption by immersion test, capillary water absorption test, porosity test, pore size distribution tests, volume of water permeable voids, water penetration depth, gas permeability test, and water vapor transmission rate. On the other hand, the use of an external membrane, surface coating, and integral mixing are the techniques for developing waterproof concrete. In the method of external membrane, sheets of polymers are usually overlaid on the concrete surface as well as bridge deck [15,16,17]. The surface coating technique involves spraying of waterproof solutions on the exposed surface of concrete. However, due to vulnerability of both methods occasioned by weather variation, their long-term protective effect cannot be guaranteed [9,18,19,20].
The integral mixing method involves the addition of a water repellent admixture during mixing of concrete; thus, it is exclusively for new concrete structures. Previous studies reported the use of water repellent admixtures for integral mixing in concrete structures [21,22]. However, some of these admixtures did not significantly reduce capillary water absorption of cement-based materials [23]. In addition, there is limited information regarding the use of nano materials as water repellent admixtures and their influence on other important transport properties such as gas permeability, volume of water permeable voids, porosity, and water vapor transmission rate. In the recent time, due to the potential for development of a more durable concrete material, application of nanotechnology in the area of construction engineering has received considerable attention [24,25,26,27,28,29]. Therefore, in view of the need to increase the level of alternatives to the existing waterproofing admixtures, some nano materials were applied to reduce water transport properties in concrete [30,31,32]. Worthy of note also, nano silicon was previously characterized for some special application [33]. However, up to now, there has been limited information on the use of hydrophobic nano silicon as a cement-based water repellent admixture.
Previously, ref. [23] used an adaptive neural fuzzy inference system to develop a multivariate linear prediction model. In this regard, water absorption of a concrete was predicted based on experimental inputs. However, there was a limited number (5) of experimental runs in the investigation. Also, their study did not optimize the amount of waterproofing admixture necessary to obtain best result. Furthermore, in this regard, many studies focus on conventional approach using one-variable-at-a-time in the optimization of water repellent admixtures [34,35,36,37]. And one major setback of this conventional approach is that it tends to ignore the influence due to mutual interaction of water cement ratio and other important variables on transport properties of concrete. In addition, prediction model by [23] assumed linear relation between water absorption and factors influencing the response. This assumption is not true since water absorption graphs versus time present a curvilinear relationship. Therefore, the relationship will be more appropriately represented by using quadratic polynomial. Hence, nonlinear multivariate technique is employed in this study to incorporate and model the relationship between water absorption, the nano silicon admixture, and water cement ratio and, thus, establish the optimum mix ratio. Therefore, Response Surface Methodology (RSM) is used to plan the experiment. In this case, experimental outputs are used as inputs to establish a mathematical model, which is empirical in nature. Previously, the RSM tool was used to model and optimize nonlinear chemical processes [36,37,38,39]. To minimize number of experimental runs and, thus, avoid waste of materials and other resources during laboratory works, the Central Composite Design (CCD) method is the most appropriate when using the RSM tool. However, to date, there is not much information regarding the application of RSM in the optimization of water repellent admixture. Also, this study introduces a nano silicon as a new construction material in the construction industry.
It is obvious from previous studies that the conventional approach in the optimization of water repellent admixtures using one variable at a time was the common practice. On the other hand, this study tries to address this gap by employing nonlinear multivariate technique to establish the optimum mix ratio. Interestingly, the interactive effect of experimental independent variables on the experimental response (dependent variables) which cannot be established using traditional approach can now be presented.
The aim of this study is to establish waterproofing performance of cementitious material modified with nano silicon. Therefore, it is the objective of this study to characterize nano silicon for integral mixing in cement mortar as waterproofing agent. It is also the objective of this study to model the relationship between nano silicon admixture, water cement ratio and capillary water absorption. In addition, the study intends to establish the optimum mix ratio, and in order to have minimum number of experimental runs and, thus, to reduce waste of materials, CDD is currently adopted to optimize the processes. Finally, the waterproofing mechanism of nano silicon-based mortar would be established using the microstructure test.
2. Materials and Methods
2.1. Materials
Ordinary Portland Cement, which conforms to the [40] requirement for Type 1 cement, was used in this experiment. Also, river sand in conformity with [41] was used throughout the experiment. In addition, tap water was used throughout for mixing and curing of mortars as well as other tests on the specimens. Furthermore, nano silicon was obtained from Astree Company Limited, Kaohsiung City, Taiwan. It is a synthetic material produced for special application as glass coating material.
2.2. Characterization of Nano Silicon
Physical and chemical characterization of nano silicon was conducted to ascertain conformity with established standards as well as the literature and, thus, to ensure that there is no wide variation in general characteristics. To this effect, chemical composition, morphological features, material structure, particle size distributions were established using EDS, FESEM, XRD, and Image-J Software (version 1.54k), respectively. In order to investigate and establish potential of mechanical bonding between cement hydration product, nano silicon and surface charge were determined using Zeta potential. In addition, chemical characterizations due to organic functional groups bonded to nano silicon were identified using FTIR. All of the tests’ methods were conducted in both the Faculty of Civil Engineering and the central research laboratories of Universiti Teknologi Malaysia (UTM).
2.2.1. Energy Dispersive X-Ray Spectroscopy
Elemental compositions were determined using FESEM-EDX equipment. In this regard, SupraTM 35 VP FESEM operating at 10 kV was used. The sample was spread on aluminum coin. It was then subjected to sputtering and gold coating. The sputter uses argon and a small electric current. On the other hand, the gold coating provides continuous electrical path between the stub surfaces at any of the sample’s likely surface that might be exposed to the electron beam. This helps in carrying away the charging electron.
2.2.2. Field Emission Scanning Electron Microscope
To identify the shape of the particles, method previously used by [42] is adopted in this study. In this regard, imaging of sample (nano silicon) was conducted using ultra-high resolution Field Emission Scanning Electron Microscope (FESEM-Zeisis SUPRA TM 35 vp) with accelerating voltage of 5 to 10 Kv. This is paramount in explaining the behavior of nano silicon. The sample was sprayed on a holder and then later taken for sputtering and gold coating using Bio “RAD Polaran Division” SEM sputter coater model system by placing it in the small vacuum chamber of the sputtering coater. The gold coating essentially provides a continuous electrical path between the sub surfaces at any of the sample’s likely surface that might be exposed to the electron beam. This helps in carrying away the charging electron. The sputter uses argon and a small electric current. The data were collected and analyzed using FESEM micrograph.
2.2.3. X-Ray Diffraction
An X-ray Diffractometer was used to carry out the structure test on the nano silicon sample. In this regard, D8 Advance, Bruker X-ray diffractometer With Cu and Kɑ radiation (λ = 1.54 Å) was used in the scanning of the sample over the range of 10° to 70° (2θ) with a step of 0.020° and time per step of 15.4 s. The crystalline phase in the sample was observed using an auto match software attached to the equipment. The data were then analyzed using Analytical X’Pert HighScore Plus (version 4.9.0)
2.2.4. Image-J Software
Particle size distribution analysis of the nano silicon image was conducted using Image-J Software according to the procedure adopted by [43,44]. In this regard, the image plugging was performed to extract the dimension from digital images of disjoint particles. This was, however, after identifying their shapes using FESEM and, thus, establish the particle size distribution. The software was set to a scale, and then the images were adjusted to their threshold, after which they were then subjected to the water shading process. In this process, the boundaries of any agglomerated particles are distinguished and, thus, separated. To this effect, particle size ranging from maximum, minimum, and the mean were computed.
2.2.5. Surface Charge (Zeta Potential)
To investigate and establish potential of adsorption between nano silicon and cement hydration products, surface ionization was ascertained using Zeta potential. The procedure used by [45] is adopted in this study. To this effect, Zeta potential (Malvern) equipment was used to confirm the surface charges on the nano silicon as well as on the cement mortar hydration product, respectively. The cuvette was filled with the prepared samples and inserted in the Zetasizer equipment. The spectrum of light was then passed through the sample. The data with respect to surface ionization were analyzed using the auto search software attached to the equipment. This displays the measurement data at three different points in the sample. Then the average value of the measurement for each sample is taken and recorded.
2.2.6. Fourier Transform Infrared Spectroscopy (FTIR)
To ascertain the presence of some organic functional groups attached to surface of silicon atom, the spectra of nano silicon were established according to procedure adopted by [46]. This was performed using the Perkin Elmer Instrument spectrometer. The spectra were found over the range of 400 to 4000 cm−1 at a resolution of 4 cm−1. The sample was prepared using a transparent disk (pellet). About 1 mg of the sample was mixed with a 100 mg of potassium bromide (KBr) in an agate mortar and then pressed. Nitrogen (N2) gas was used to purge the spectrometer.
2.3. Experimental Planning for Modeling and Optimization of the Mix Ratio
To model and establish the optimum mix ratio (in terms of nano silicon and w/c), necessary to increase water resistance, the experiment was planned using Response Surface Methodology (RSM). The mathematical relationship between factors (nano silicon and w/c) influencing the exact response (capillary water absorption) was developed based on theories that are appropriate and established by previous studies [47,48,49]. In this type of technique (RSM), experimental inputs are used to establish a mathematical model.
Accordingly, functional relationships between dependent and independent variables were established. In this regard, due to number of factors (xi, x2, …, xn) influencing the response (y), the relationship between the response and independent variables is often unknown. Consequently, a second order model was adopted to evaluate the relationship as prescribed by Equation (1).
where represents the coefficient of interaction parameter.
To determine the optimal conditions for the experimental response, mathematical function describing the response surface given in Equation (2) was differentiated and equated to zero. This is because the derivative of any function at maximum, minimum, or saddle point is zero.
y = b0 + b1x1 + b2x2 + b11x12 + b22x22 + b12x1x2
The derivative of the function with respect to first and second independent variables x1, x2, respectively, is given by Equations (3) and (4)
The solutions for Equations (3) and (4) provide the coordinates of points at minimum and maximum, which represent the values of x1 and x2.
Worthy of note also that CCD was previously adopted to model the relationship between the experimental variables (nano silicon and w/c) and the experimental responses (compressive strength and capillary water absorption) [50]. However, the last published research investigated and reported the model based on compressive strength only. On the other hand, as a buildup on previous work, this study pays attention to the other experimental variables and response (capillary water absorption), which were modeled and optimized. Therefore, the range of variables within the experimental domain was kept between bottom and higher limits. The higher limit of nano silicon addition was constrained to 10% by weight of cement, and the bottom limit was restrained at 0%. Also, while the higher limit of w/c was kept at 0.485 and in accordance with [51], the bottom limit was set at 0.4. These limiting values were used as inputs into the CDD tool to establish a second order model after which the coded variables were forced to range from −1 to + 1. This ensured that all the responses were affected more evenly. Likewise, the limits of experimental variables were forced to the range adopted and presented in Table 1 [50].

Table 1.
Experimental variables and their levels as adopted [50].
CCD suggested thirteen (13) different experiments with a different combination of variables as indicated in Table 2 [50]. Accordingly, the experiment was conducted for two factors and three levels.
Table 2.
Experimental Plan as adopted [50].
2.4. Preparation of Mix
All mixes were prepared using a mechanical mixer according to [52]. Therefore, 1:2.75 was used as the ratio of cement-to-aggregate. Firstly, nano silicon was sonicated together with the mixing water for about 5 min to ensure thorough dispersion. This was achieved using high intensity ultrasonic processor. In addition, the weighted cement and sand were thoroughly mixed to achieve homogenous mixture and then poured into the bowl. The remaining water was then added to already mixed cement and aggregate in the bowl. The mixer was operated at a low speed for about 30 s. The speed of the mixer was later adjusted to moderate, and the mixing continued for an additional 30 s. Subsequently, sonicated nano silicon was added to the wet mixture at a high speed and allowed to run for 90 s to ensure that a homogenous composite was achieved. All mortar parts adhered to the bowl and was scraped down into the batch. Finally, the mixer was also run for the 60 s at medium speed. The entire mixing time was kept at about 5 min and, consequently, many batches for the test specimens were produced, and the mix proportion conformed to [53]. For each batch, 100% OPC control mortar samples were produced, which are used as a basis for differentiation with nano silicon-based mortar. The influence of the mutual interaction due to nano silicon and w/c on the capillary water absorption was studied. Soon after the optimum mix ratio was established, other test methods conducted were the consistency test in accordance with [54], capillary water absorption according to [55], and volume of water permeable voids according to [56]. Furthermore, the gas permeability test was conducted according to [57]. Also, the microstructure test and XRD were conducted to establish waterproofing mechanism of nano silicon-based mortar.
2.4.1. Consistency Test
Immediately after mixing the specimen, the workability was tested in accordance with [53]. In this regard, the fresh mortar specimen was placed in the cone of the flow table in three compacted layers with the aid of a tamper. This was performed to ensure that the mold of flow table was uniformly filled. The excess mortar was cut-off with a trowel. Likewise, the tabletop was wiped dry after which the mold was lifted away. The flow table was then jerked vertically up and down 25 times within 15 s. After jolting, the spread of a fresh mortar specimen was measured at four different points of perpendicular crossing diameter of the mortar specimen, and the average value was taken at a tolerable error of about 11%.
2.4.2. Capillary Water Absorption
In this method, the susceptibility of water penetration into an unsaturated mortar specimen (at optimum mix ratio) due to capillary rise was measured. It was chosen because of its close relationship with concrete’s durability. The capillary water absorption characteristics were conducted in accordance with [55] and reported to the nearest 0.1 g cm−2. In this method, mortar cubes were dried in a ventilated oven for at least 24 h; at a temperature of 105 °C until two successive weights showed an increment of weight loss of not more than 0.2% of the last previously determined weight of the specimen. The length and the width of each specimen to the nearest 0.5 mm were measured using a caliper. Specimens were then weighed, and the mass was recorded as Wo. The cast samples were then partially submerged in water in an uptake container with their top face in contact with room temperature water. However, they were supported by a suitable device whose thickness was 3 mm and only covered no more than 10% of the area of the specimen’s test surface. The water level of the submerged specimens was kept at 3.5 mm from the top of the support device. To minimize evaporation, the container was completely covered throughout the experiment. The specimens were monitored within first 5 min to ensure that the water level was still adequate during the initial absorption phase. At an interval of 0.25 h, 1 h, 4 h, and 24 h, the weight in grams to the nearest 0.1 g was recorded as WT for each specimen, and T is the time of measurement in hours. However, each specimen was wiped with a moist cloth prior to weighing.
Equation (5) was adopted for data (water absorption in grams/100 cm2) analysis.
where
AT = (WT − W0) × 10,000/(L1 × L2)
WT = Weight of specimen at time T in grams to the nearest 0.1 g;
W0 = Initial weight of specimen at time T in grams to the nearest 0.1 g;
L1 = Average length of test surface of the mortar specimen cube in mm to the nearest 0.5 mm;
L2 = Average length of test surface of the mortar specimen cube in mm to the nearest 0.5 mm.
2.4.3. Volume of Water Permeable Voids
The volume of an interconnected network of pores was determined in accordance with [56] under laboratory conditions. In this method, the specimens were oven dried at a temperature of 105 °C for 24 h after which they were allowed to cool in a desiccator to a temperature of 20 to 25 °C. The specimens were weighed after cooling and then taken back to the oven for the second drying up to another 24 h and cooling again. This was repeated until when the difference between values obtained from two successive values was not more than 0.5% of the lesser value. This last value was recorded as WA. The specimen was then submerged in water at 20 °C for at least 48 h until two successive values of mass of the surface dried specimen at an interval of 24 h showed an increase in mass was not more than 0.5% of the lager value. This final mass was designated as WB. The specimen was then subsequently placed and boiled in water bath for 5 h, after which, it was allowed to cool by natural loss of heat for at least 14 h to a final temperature of 25 °C. The soaked and boiled surface dried specimen was weighed, and the mass was recorded as WC. After immersion, boiling, cooling, and weighing, the specimen was suspended by a wire, and the apparent mass was recorded as WD.
Equation (6) was adopted for the analysis of data volume of permeable voids
Vv = [(WC − WA)/(WC − WD)] × 100
In each case, the average value of three different specimens was taken and recorded.
2.4.4. Gas Permeability
Gas permeability through test specimens was determined based on laboratory conditions and in accordance with a standard procedure established by [57]. To determine the gas transport properties, high purity liquid methanol was used as a gas source. Samples of 50 mm × 50 mm × 50 mm size were dried in an oven at 105 °C for 24 h. They were then placed on top of a glass cell containing predetermined quantity of methanol and sealed with sealant to avert potential loss. The lower two-third of the glass was then submerged in a water bath. The temperature of the water bath was kept at 40 °C based on the recommendation of [47]. The variation in mass with time due to vaporization of methanol was recorded until a steady state mass loss was reached.
The data collected was analyzed using Equation (7) below.
Gas permeability could be analyzed using Equation (7) as recommended by [58].
where m* is the rate of mass loss of methanol gas (g/s);
K = α (L/A) × m*
α = 1.684 × 10⁻¹⁷ at a water bath temperature of 40 °C.
In each case, the average value of three different samples was taken and recorded.
3. Results and Discussion
3.1. Results
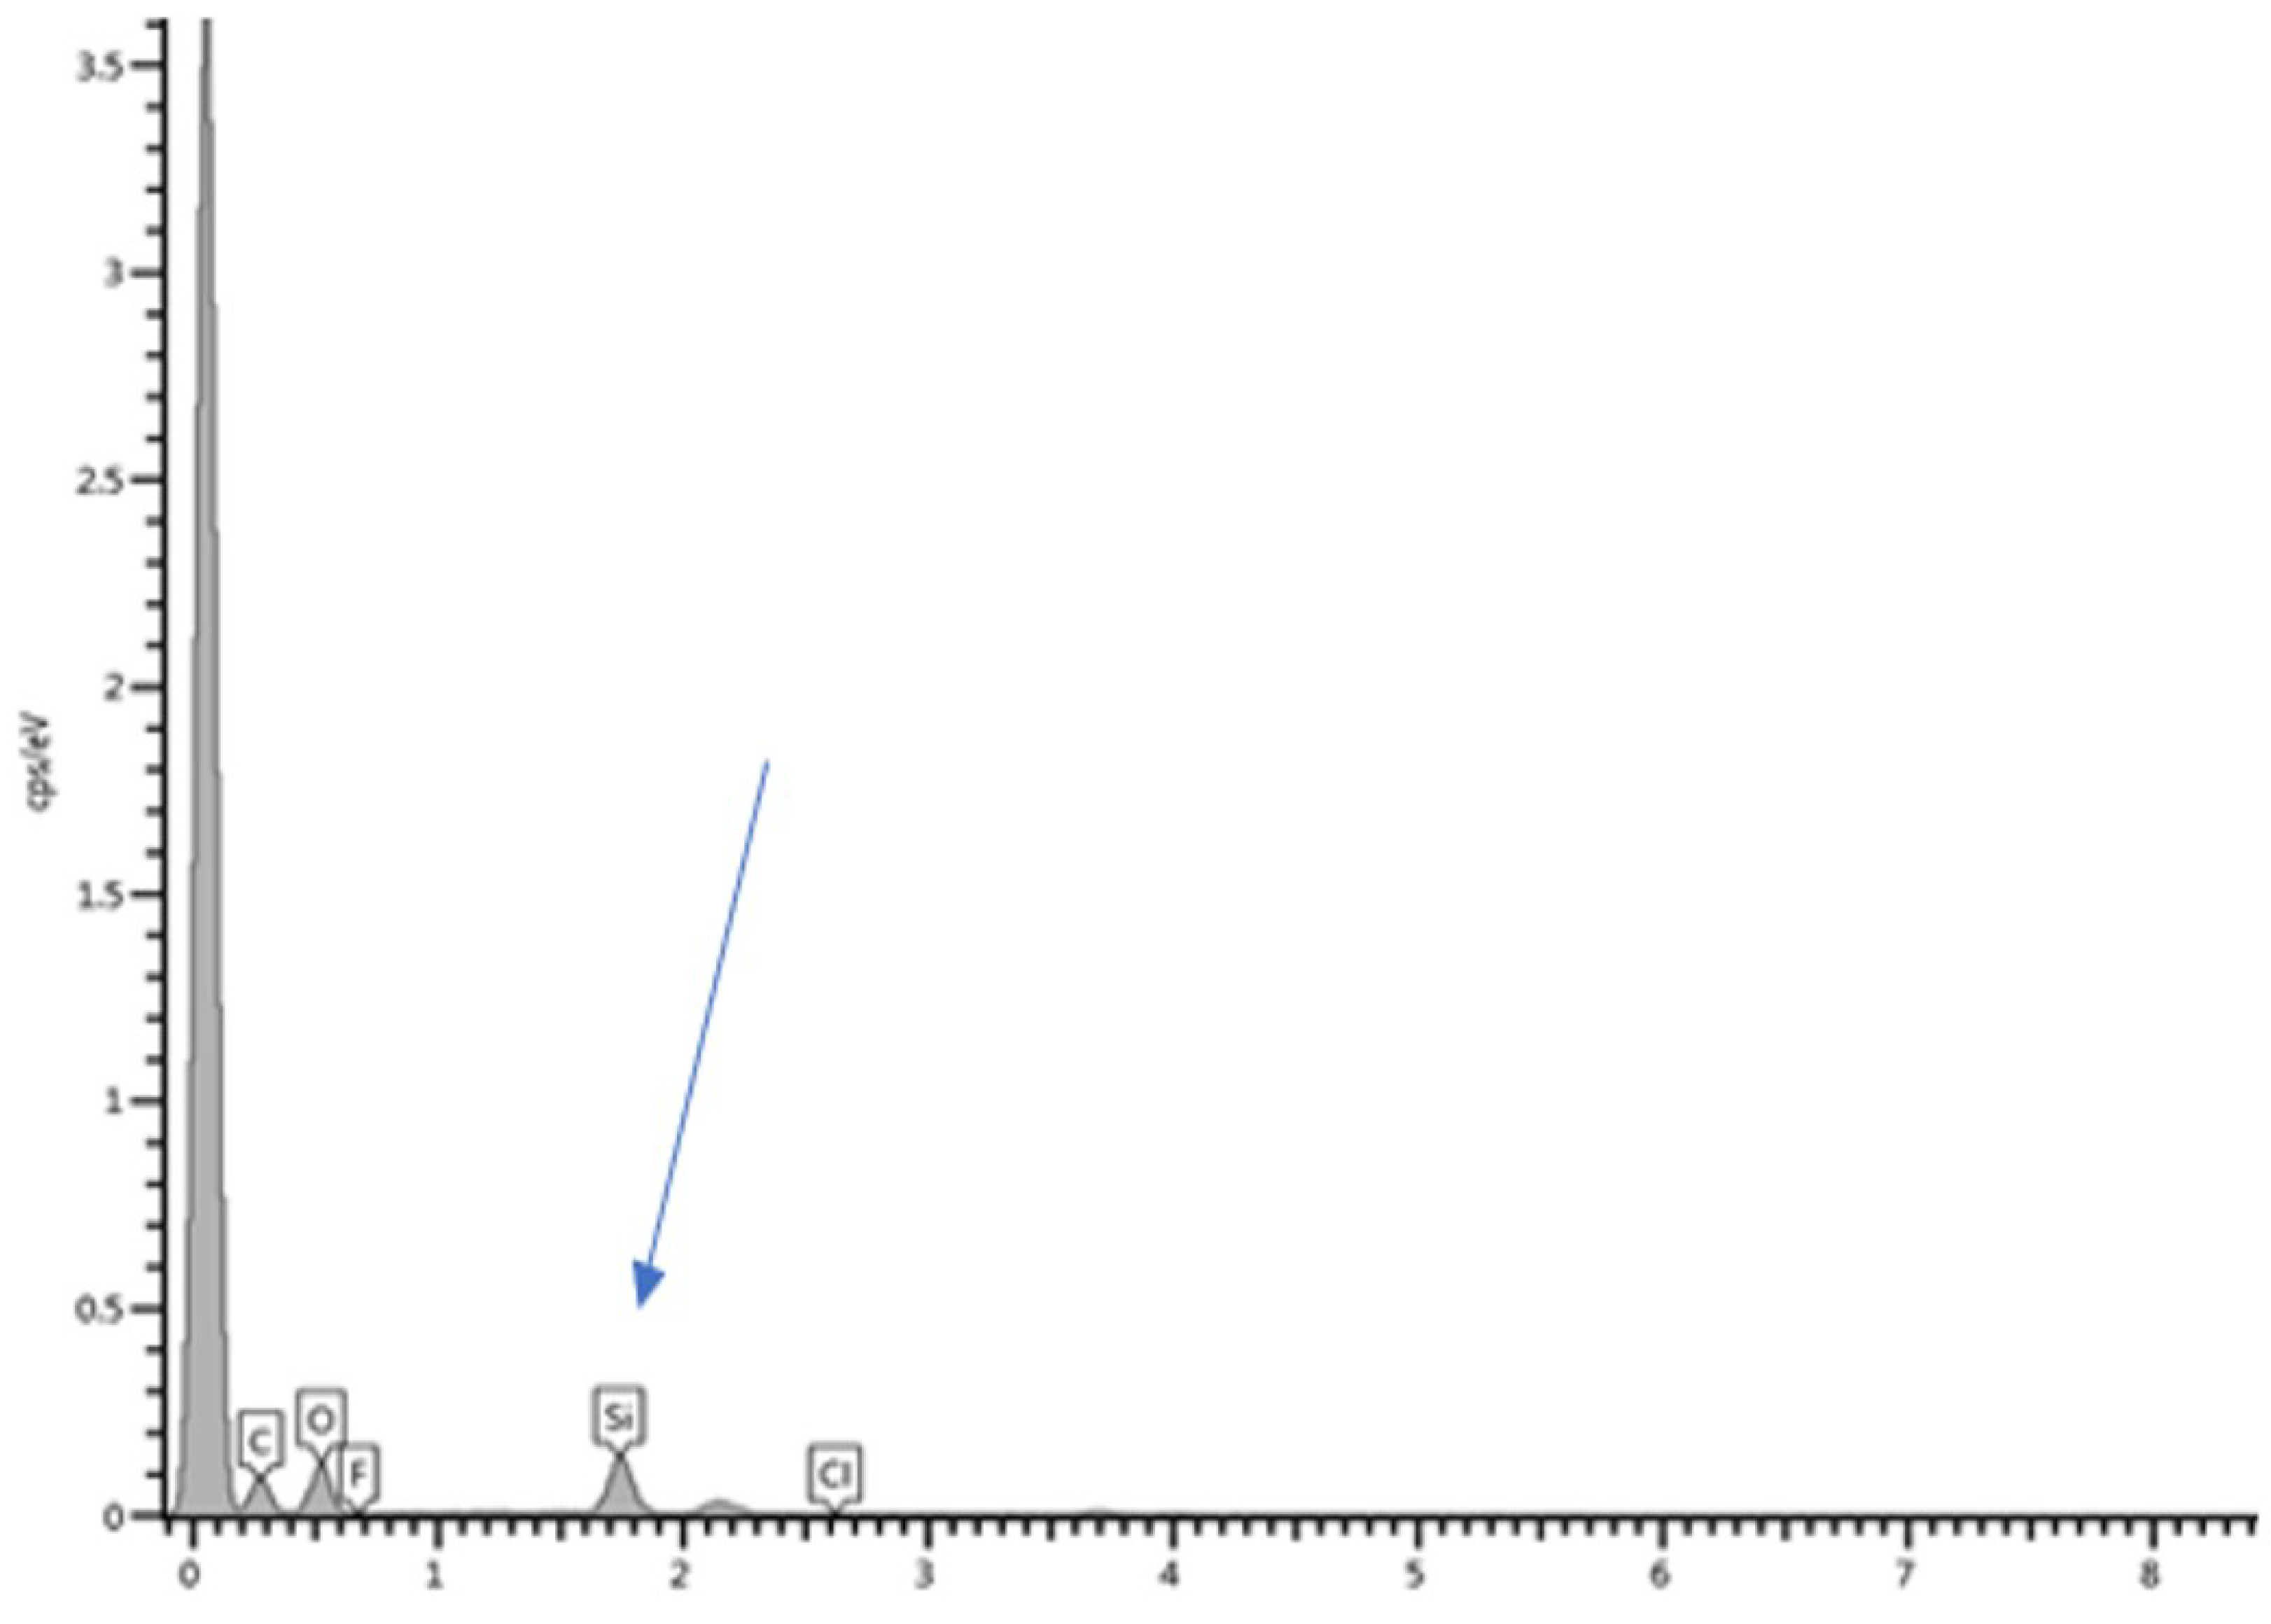
3.1.1. Energy Dispersive X-Ray Spectroscopy
Analysis of elements present in the nano silicon based on EDS was established as illustrated in Figure 1. This indicates spectra intensity of carbon (C), oxygen (O), fluorine (F), and chlorine (Cl) associated with silicon (Si). As can be seen using arrow from Figure 1, particles have a high content of silicon as depicted by the spectra intensity. This is evidently clear in the highest peak due to silicon. This is similar to the findings of [58]. On the other hand, Fluorine and chlorine were due to impurity as a result of cross-linking of alkyl-halogen functionalized particles.
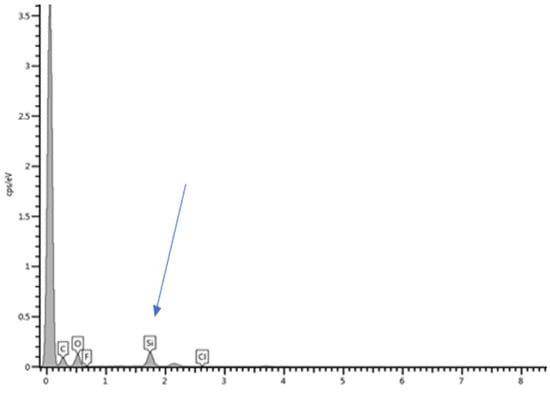
Figure 1.
EDX plot of spectra intensity versus X-ray energy of nano silicon.
3.1.2. Particle Morphology of Nano Silicon
The particle morphology of nano silicon is shown in Figure 2. As can be seen, it is obvious that nano silicon particles are crystalline materials, which vary from an irregular to a spherical shape, and this morphology is similar to the findings of [59]. This makes it suitable for application in cementitious materials.
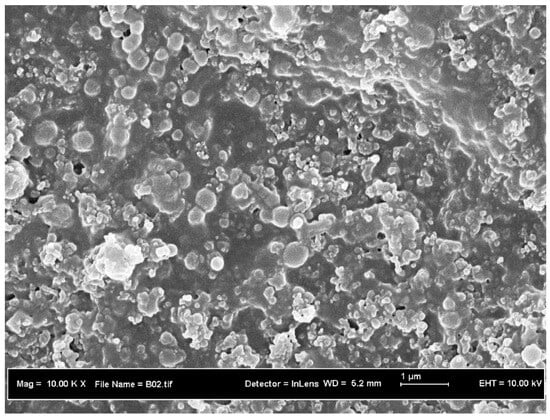
Figure 2.
FESEM image micrograph of nano silicon at 2500 × Mg.
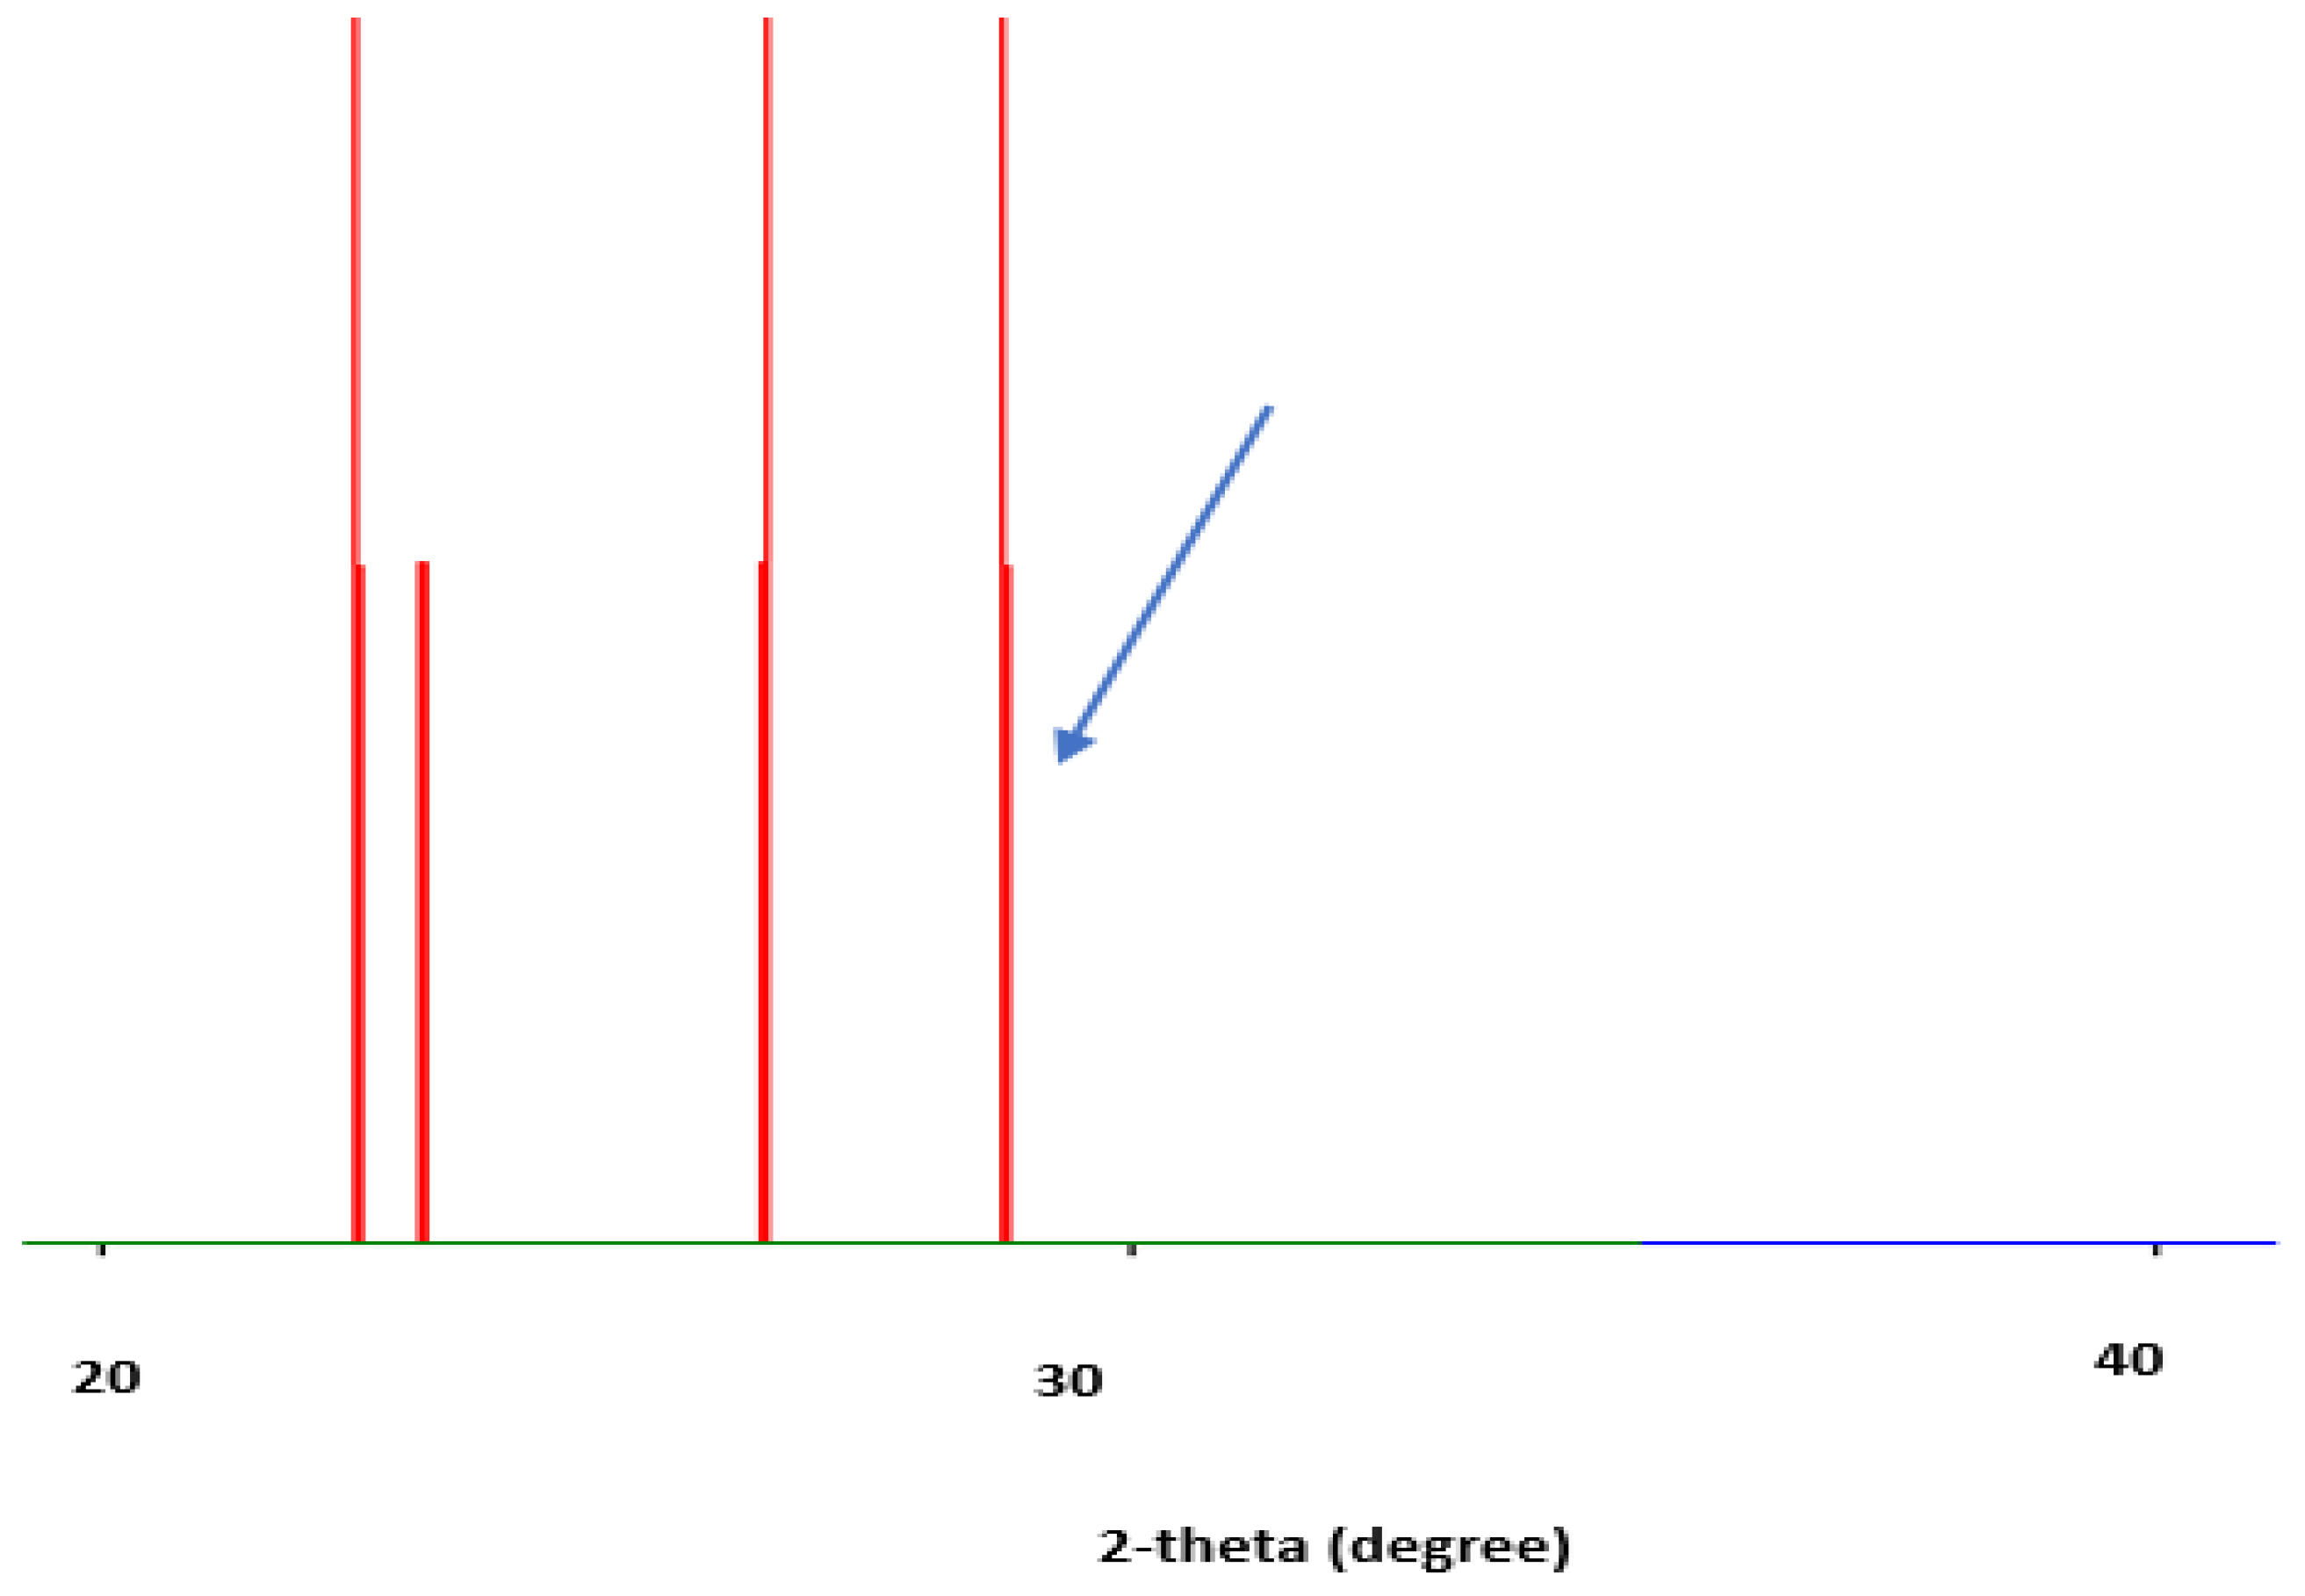
3.1.3. X-Ray Diffraction
The pattern of X-ray diffraction of nano silicon is depicted in Figure 3. It is obvious from this figure, narrow peak at 2θ = 28.7° confirmed the presence of nano silicon particles, which indicates crystalline materials with the equivalent corresponding orientation of (h, k, l) value at (1, 1, 1). This is comparable to findings of [10], where they reported very narrow peak due to highly crystalline structure of nano silicon particles. However, other peaks are suspected to be due to minor impurities or secondary phases such as residual reactants, oxides of silicon (SiO2) or byproduct from synthesis process, sample holder or polymorphic forms.
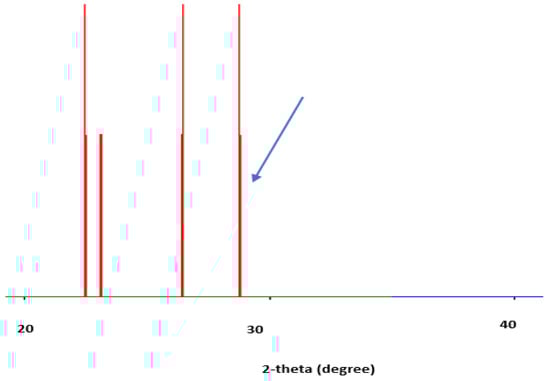
Figure 3.
XRD pattern of nano silicon particles.
3.1.4. Particle Size Distribution of Nano Silicon
As can be seen from Figure 4, the distribution pattern of nano silicon particles indicates variation from 1.0 nm up to the largest size of 3839 nm. Furthermore, the figure shows that the mean size is 360 nm, which is in accordance with the findings of [60,61]. This indicates well-graded and distributed nano silicon particles and, thus, it is suitable for thorough mixing with cementitious materials.
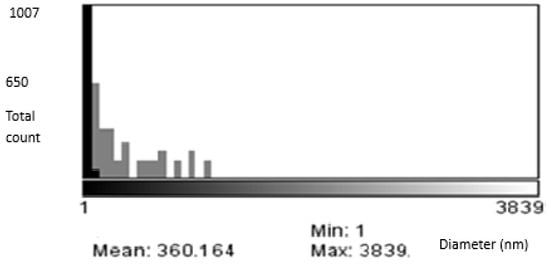
Figure 4.
Particle size distribution.
3.1.5. Surface Charge (Zeta Potential) of Nano Silicon
Table 3 shows the average values of surface charges for the nano silicon and OPC plain mortars, respectively. It is obvious from the table that while OPC plain mortar has a positive Zeta potential value of +0.744 mV, on the other hand, the magnitude of the Zeta potential for nano silicon was −0.0718, which has the opposite charge as compared to the plain mortar. This implies highly positive zeta potential of OPC, which can adsorb a great amount of negatively charged nano silicon. Consequently, this leads to the formation of mechanical bond with cement hydration product of plain mortar due to electrostatic force. This corroborated the finding of [62], where they established potential adsorption of superplasticizers by cement hydration product of a plain mortar.
Table 3.
Surface charge (Zeta Potential) values for nano silicon and OPC plain mortar, respectively.
3.1.6. Fourier Transform Infrared Spectroscopy
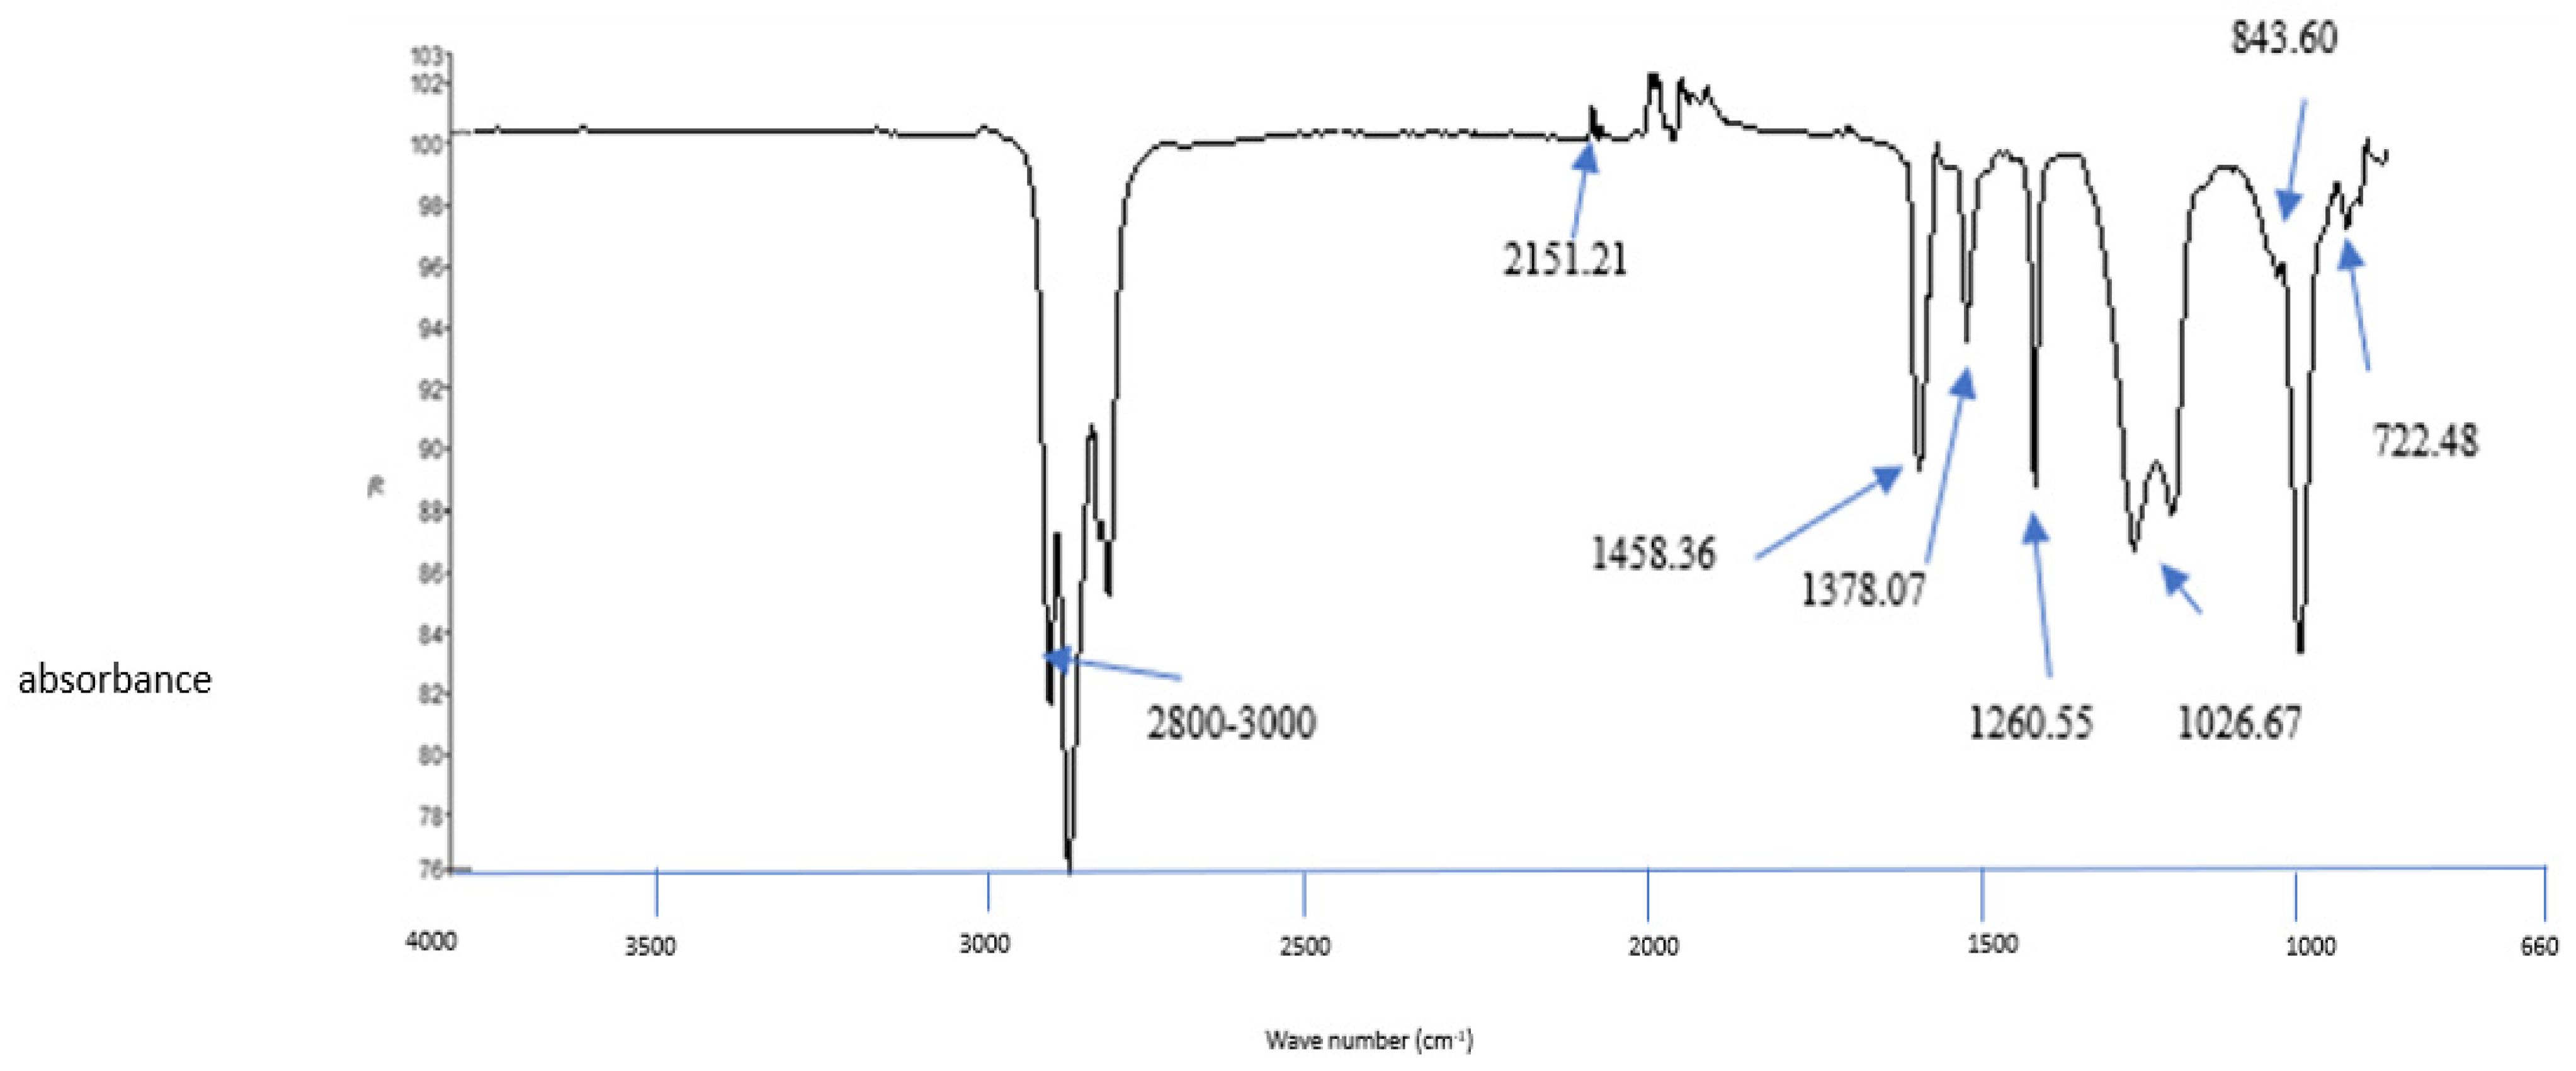
Figure 5 FTIR shows the spectra for Organic Functional (Bonding) groups attached to nano silicon. The figure indicates Si-C deformation vibration at 1260.55 cm−1 and stretching vibration at 843.60 cm−1. It also displays a peak for the C-H stretching band at 2800–3000 cm−1. Furthermore, the figure shows a CH2- deformation band at 1458.36 cm−1, C-CH3 symmetrical deformation band at 1378.07 cm−1, and -(CH2)4- skeletal vibration at 722.48 cm−1. Again, it indicates bands for Si-H stretching at 2151.21 cm−1, Si-O stretching modes including Si-O-Si, and Si-OH at 1026.67 cm−1. On the aggregate, these results indicate that the surface bonding groups attached to nano silicon are organic functional groups and, thus, make it a hydrophobic material with the ability to repel water. These are consistent and also similar to the findings of [63,64].
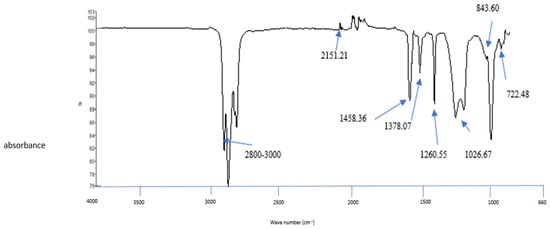
Figure 5.
FTIR Spectra of nano silicon.
3.1.7. Modeling and Optimization Experimental Variables (Nano Silicon, w/c Ratio and Capillary Water Absorption)
In this section, the experimental results, type of mathematical model, results of the ANOVA of the regression model, and plots of the residuals of the experimental responses are presented and discussed. Furthermore, results for the internally studentized residual and normal probability plots are discussed. In addition, the quadratic response surface plot in the optimization of variables is illustrated as a 3D graph, and thus, optimal regions necessary to achieve best experimental response are established using desirability plots. Table 4 shows the experimental results with respect to capillary water absorption.
Table 4.
Experimental Results for Capillary Water Absorption.
Table 4 indicates that capillary water absorption decreases with the increase in nano silicon dosage. Furthermore, capillary water absorption appears to decrease as the w/c decreases. Accordingly, this is in line with common theories that as w/c ratio decreases, water absorption and compressive strength increase. Likewise, this corroborated similar scenario and findings of [65,66,67] where certain additives were used as waterproofing admixtures for restoration of historical buildings. This accounted for improvement in hardened properties of cementitious materials.
3.1.8. Model Summary
The results for the mathematical relationship between nano silicon dosage, w/c ratio, and capillary water absorption are presented as model summary statistic in Table 5.
Table 5.
Model summary statistic for water absorption.
It is obvious from Table 5 that the relationship between nano silicon and capillary water absorption is described by the nonlinear multivariate quadratic model. This is evidently clear as values of both Adj R2 and predR2 are 0.9939 and 0.9800, respectively, and it is the best model maximizing the adjusted R2 (Adj R2) and Predicted R2 (predR2).
3.1.9. Analysis of Variance (ANOVA)
Results for the investigation using ANOVA of the nonlinear multivariate regression model are presented in Table 6. The significance of the models, the model terms, fitness, and desirability of models are discussed based on the ANOVA. The significant model terms are those with a value less than 0.05 for “Prob > F”.
Table 6.
Results for ANOVA of Response surface quadratic model (water absorption).
From Table 6. it is obvious that the model F-value is 393.26 and with “Prob > F” equals to 0.0001. It is interesting to note that significant model terms are those with a value less than 0.05 for “Prob > F”. Consequently, this implies that the model in its entirety is significant. Likewise, Table 6 indicates that significant terms of the model are A, B, AB, A2, and B2.
- Where A is the nano silicon dose;
B is the w/c;
AB represents the interaction between nano silicon and w/c.
Also, Table 6 shows that the most significant of all the model terms is A (nano silicon), with the highest F-value of 1503.79. This indicates that the influence of nano silicon on the experimental response (capillary water absorption) is more pronounced as compared to other model terms. Also, the “lack of fit F-value” is 3.71, which implies that lack of fit is not significant relative to pure error, and this is desirable. However, there is an 11.9% chance that for this “lack of fit value”, this large value could occur due to noise. Likewise, R2 is 0.9965, which converges to 1. Also, “Pred R-Squared” and “Adj R-Squared” are within a close range. Furthermore, adequate precision, which is a measure of signal-to-noise ratio was found to be 61.127. This is good because a value greater than 4 is always desirable. In the final analysis, this implies that the model is desirable and can, therefore, be adopted. This is because the predicted quadratic model is in good agreement due to convergence with the experimental responses.
Final nonlinear multivariate regression equations model for capillary water absorption is presented in Equation (8).
Capillary water absorption = 615.730 − 13.52A − 2496.25B + 13.92AB − 0.351A2 + 2883.66B2
3.1.10. Model Evaluation
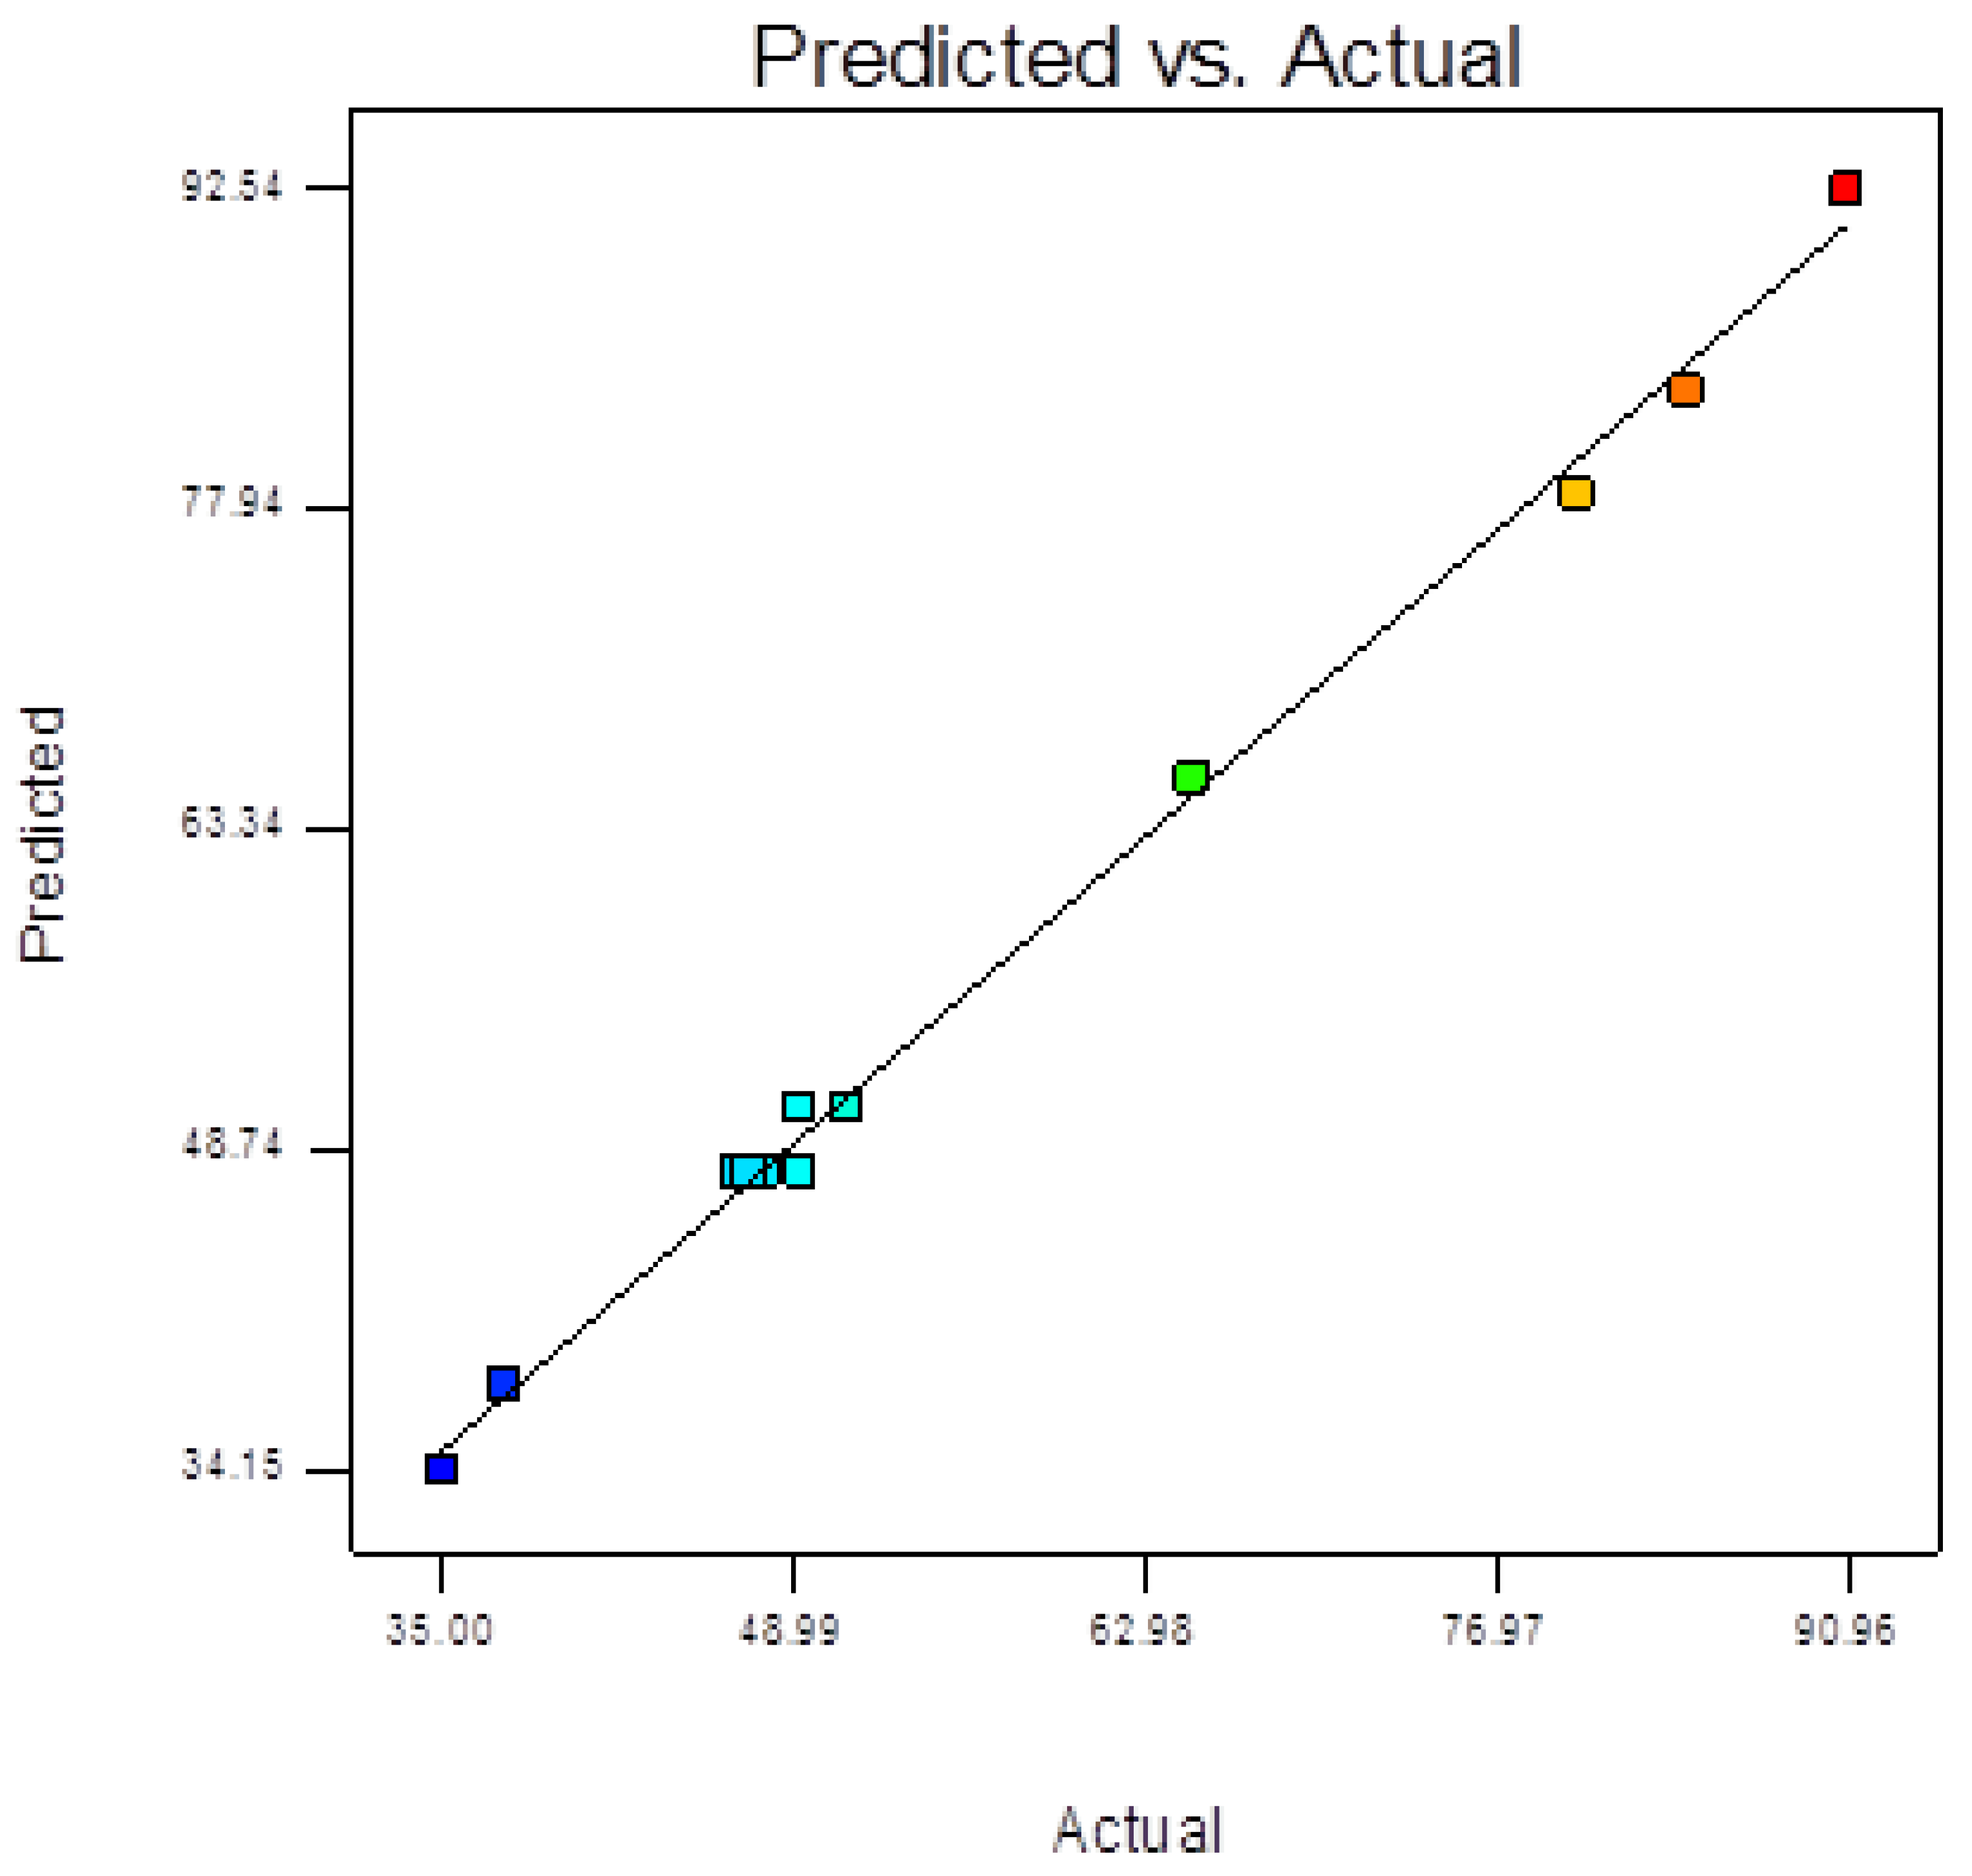
The diagnostic plot of comparison between predicted and experimental values of capillary water absorption is illustrated in Figure 6. It can be seen that the linear plot confirms that predicted values and actual results are consistent and in close agreement.
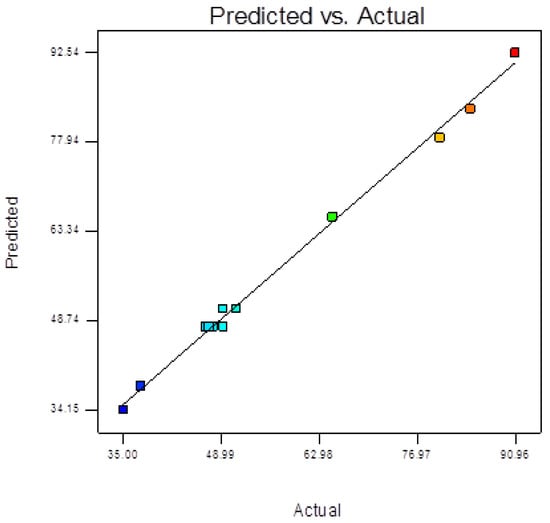
Figure 6.
Diagnostic plot of comparison between actual and predicted results water absorption.
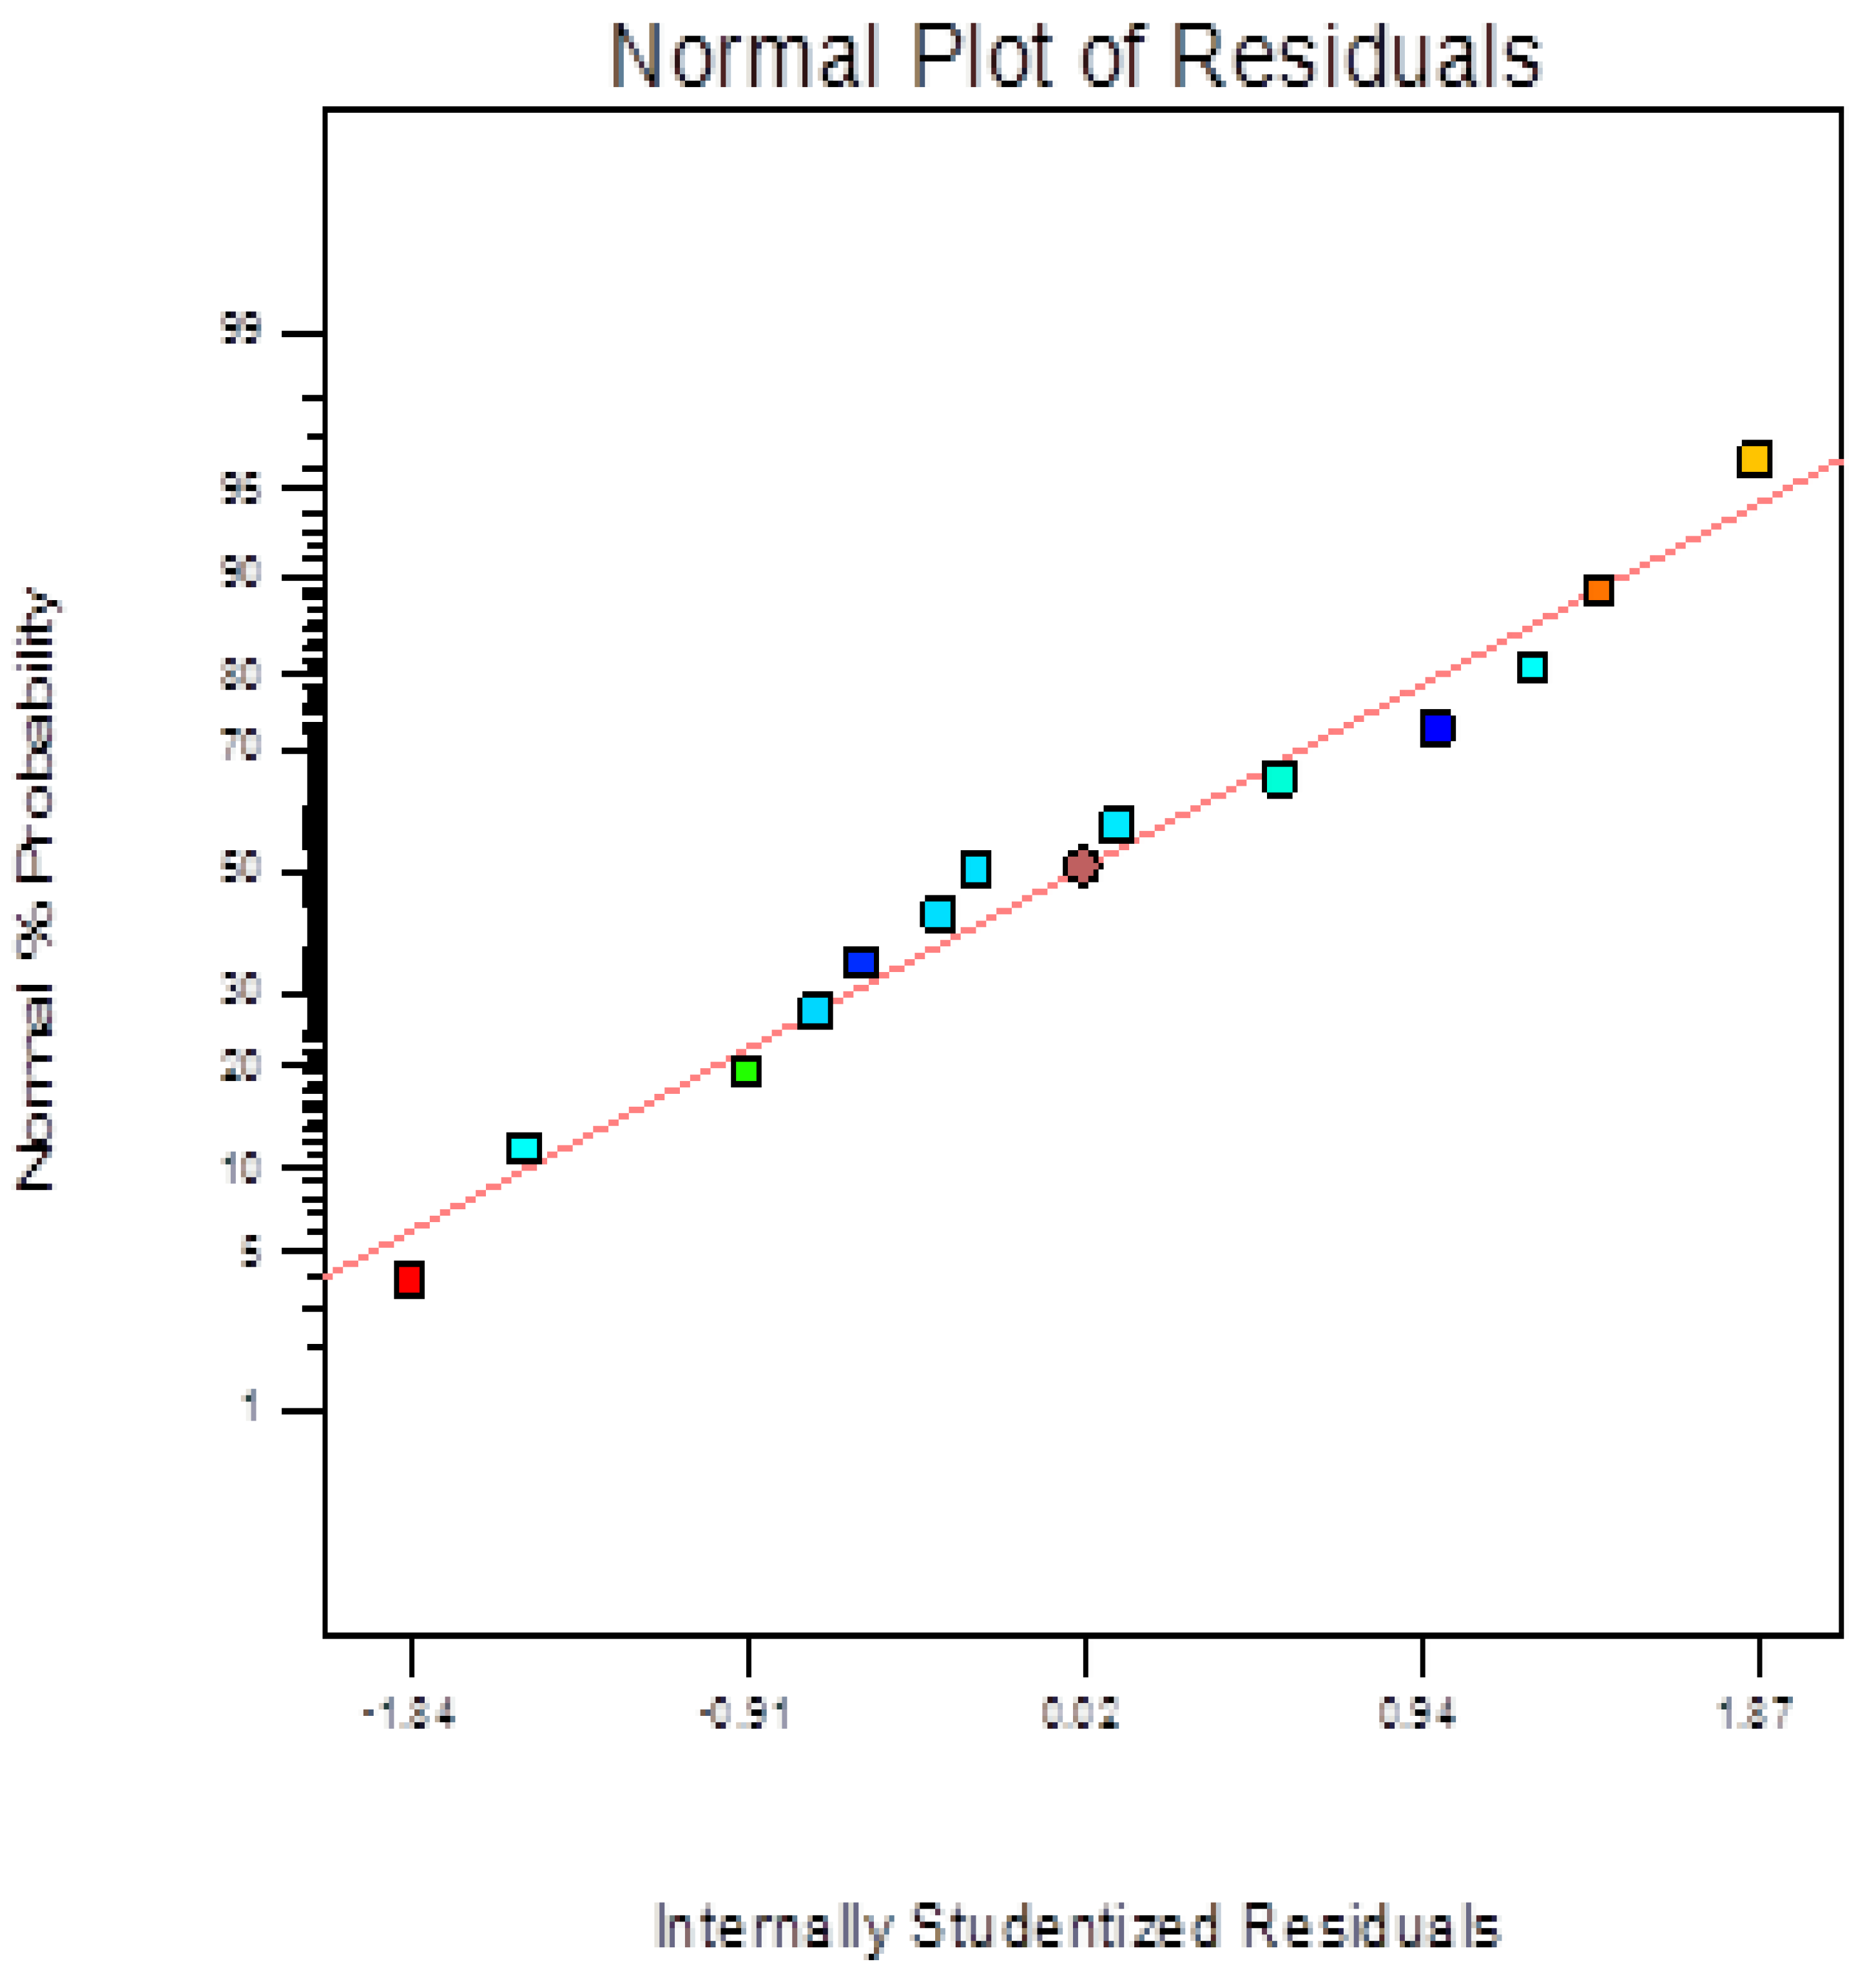
Further in this regard, the results of the evaluation of pure error in respect of capillary water absorption are presented in Figure 7. The figure illustrates the normal probability plots of normal and internally studentized residuals for capillary water absorption. It is obvious that errors are normally distributed due to residuals falling on a straight line.
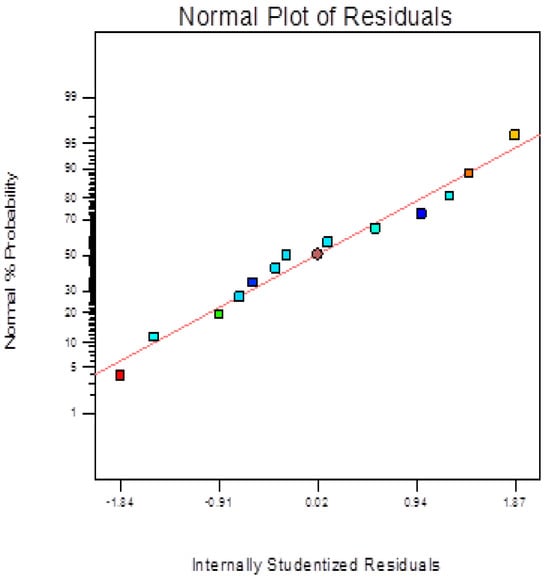
Figure 7.
Normal probability plot residual for water absorption.
Confirmation test results for the model were summarized and presented in Table 7 in this regard, and experimental results against predicted values for capillary water absorption of nano silicon-based mortar are shown.
Table 7.
Table of Predicted vs. Actual Results of Capillary Water Absorption.
Table 7 indicates that experimental results for capillary water absorption of mortar incorporating nano silicon converge and are within close range with predicted values. The table further shows that the model can make accurate predictions of data within the experimental boundary. To this effect, there is acceptable correlation between each predicted and experimental value. It can be seen that the mean absolute percentage error is 1.62%, thereby complying with the limiting value recommended by [68].
3.1.11. Three-Dimensional Response Surface Plot in the Optimization of Nano Silicon and w/c
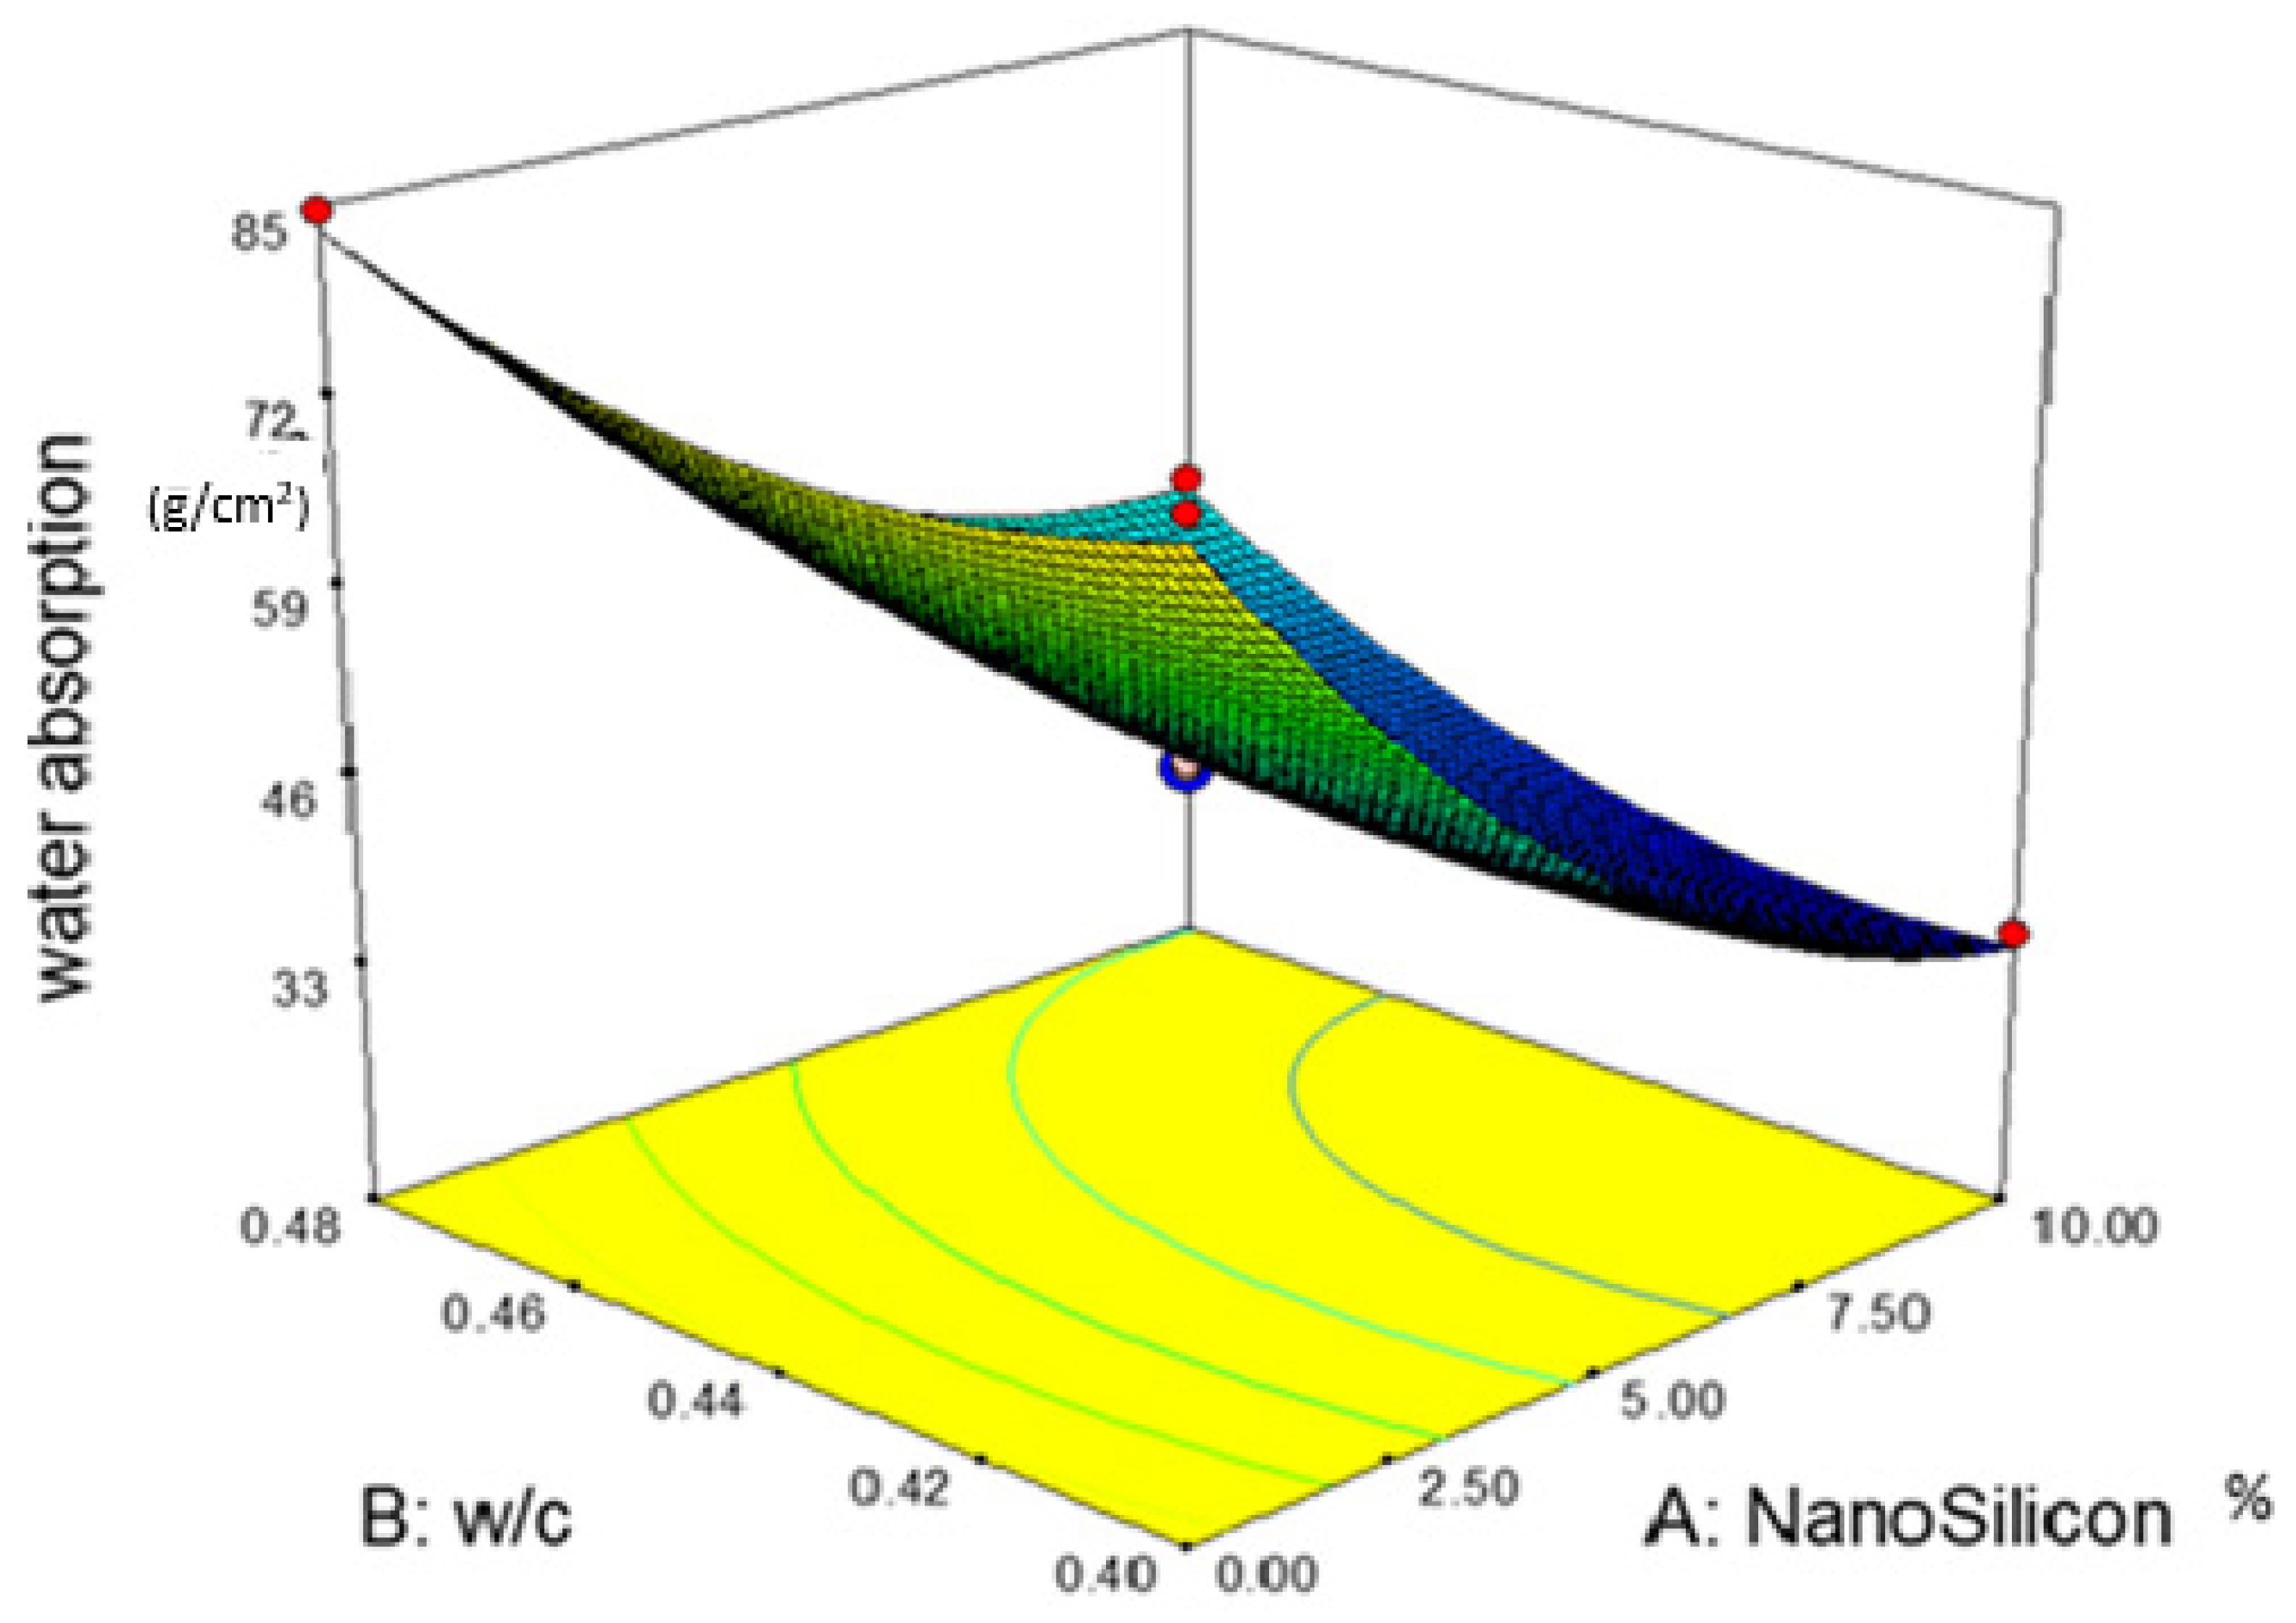
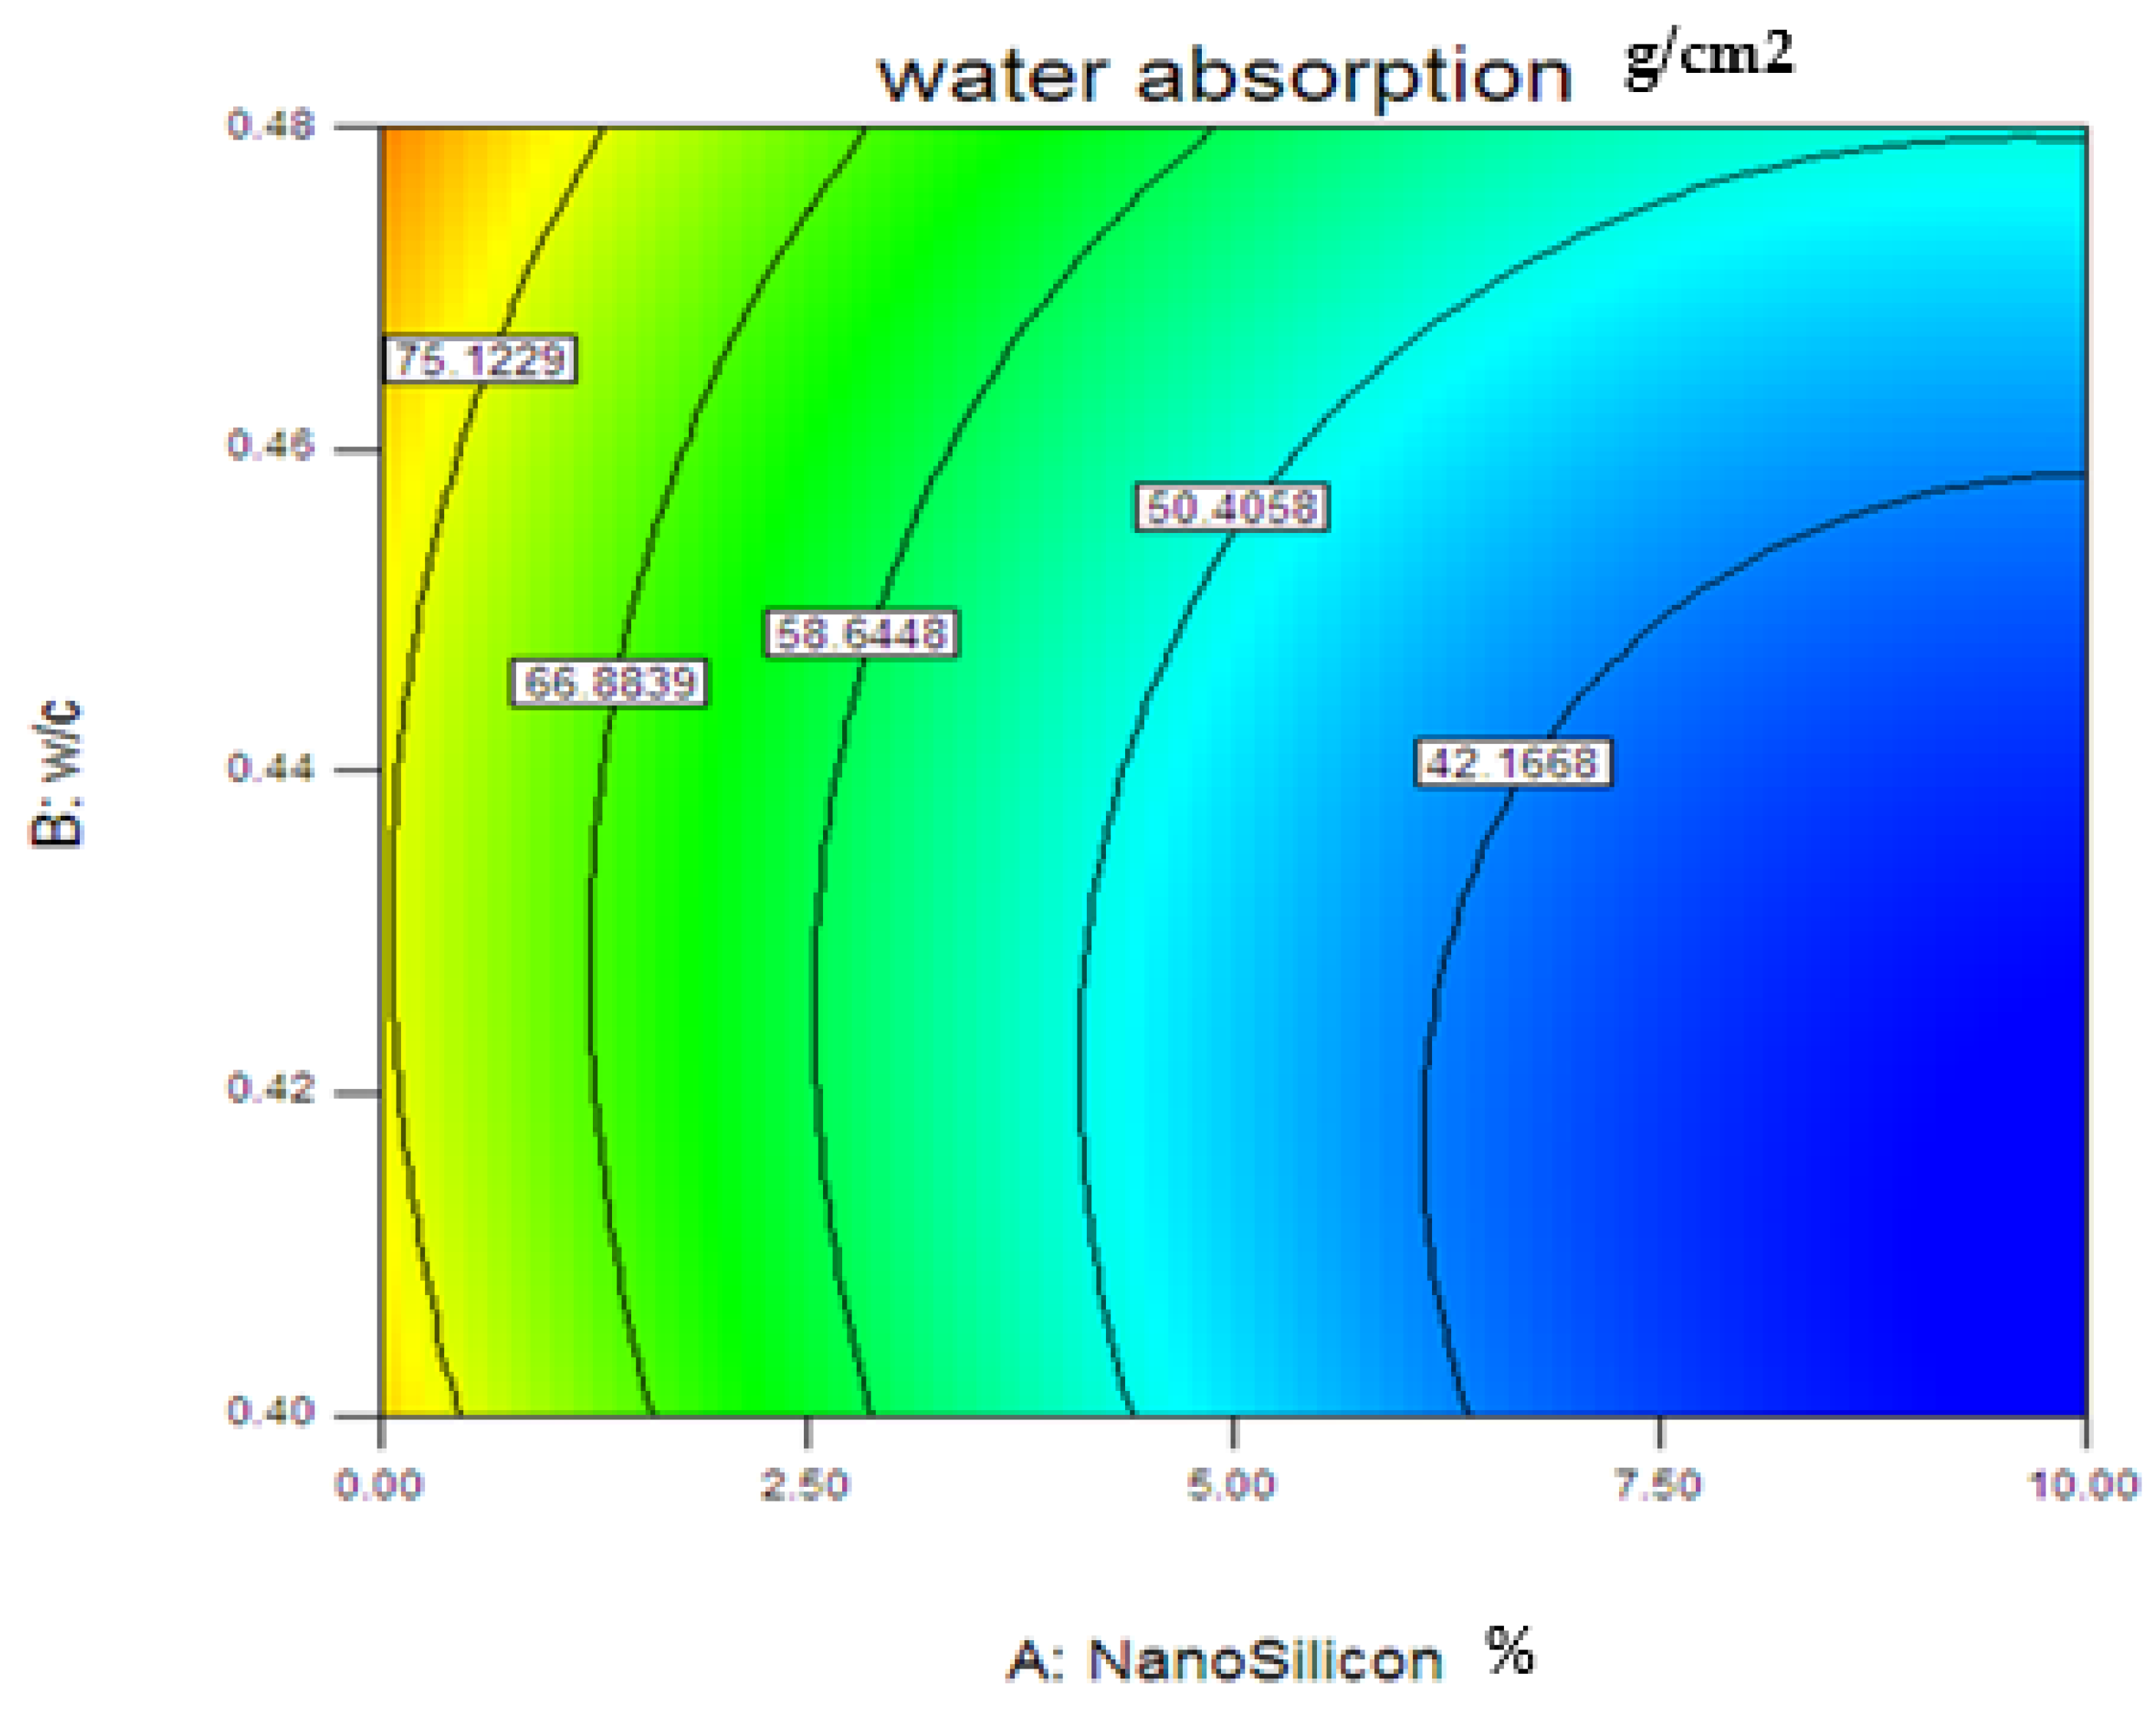
The influence of experimental variables (nano silicon and w/c) on capillary water absorption is illustrated in Figure 8. Interestingly, the figure depicts the influence of nano silicon and w/c on capillary water absorption characteristic of mortar. Furthermore, it portrays a curvilinear profile, which is consistent with the quadratic model fitted and presented in Equation (8). The figure further indicates that capillary water absorption decreases as the dosage of nano silicon increases. Also, capillary water absorption decreases with the decrease in w/c. More interestingly, Figure 8 confirms that the influence of nano silicon appears to be more significant as predicted by the model in the ANOVA Table 7 above.

Figure 8.
Three-Dimensional plot for Influence of nano silicon and w/c on capillary water absorption.
3.1.12. Desirability Plot
Desirability plot for the optimal region necessary to achieve minimum capillary water absorption of mortar incorporating nano silicon is illustrated in Figure 9. As can be seen, the cool blue color indicates higher desirability, while the green color favors lower desirability. In this regard, the optimum mix ratio of experimental variables was established at 6.6% nano silicon dosage and w/c ratio of 0.42.
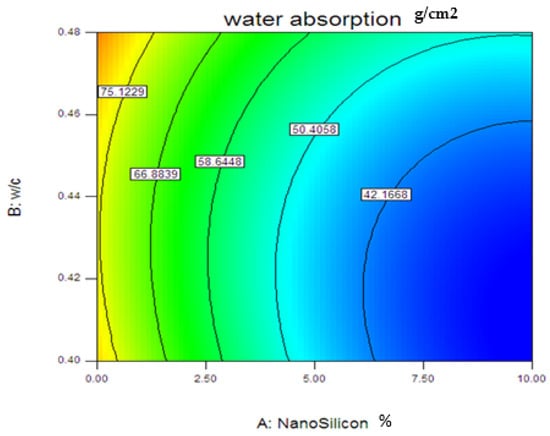
Figure 9.
Desirability plots for water absorption characteristics.
3.1.13. Consistency Test Result
Figure 10 shows that the slump of OPC- and nano silicon-based mortars at an optimum mix ratio (6.6% nano silicon dosage and w/c ratio of 0.42) are found to be 134 mm and 153 mm, respectively. This indicates a 14% increase in workability at optimum mix ratio. It is obvious that nano silicon admixture is more favorable in terms of achieving more workable cement-based materials than recently investigated hydrophobic admixtures [69,70].
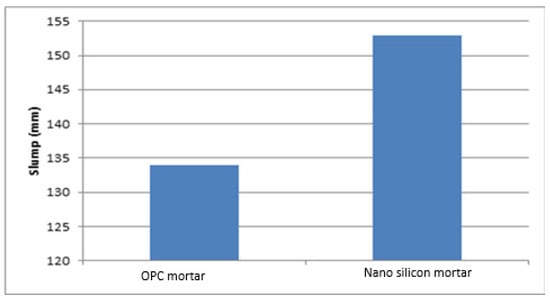
Figure 10.
Slump test result for OPC and nano silicon-based mortars.
3.1.14. Capillary Water Absorption of Mortar Incorporating Nano Silicon and OPC Mortar
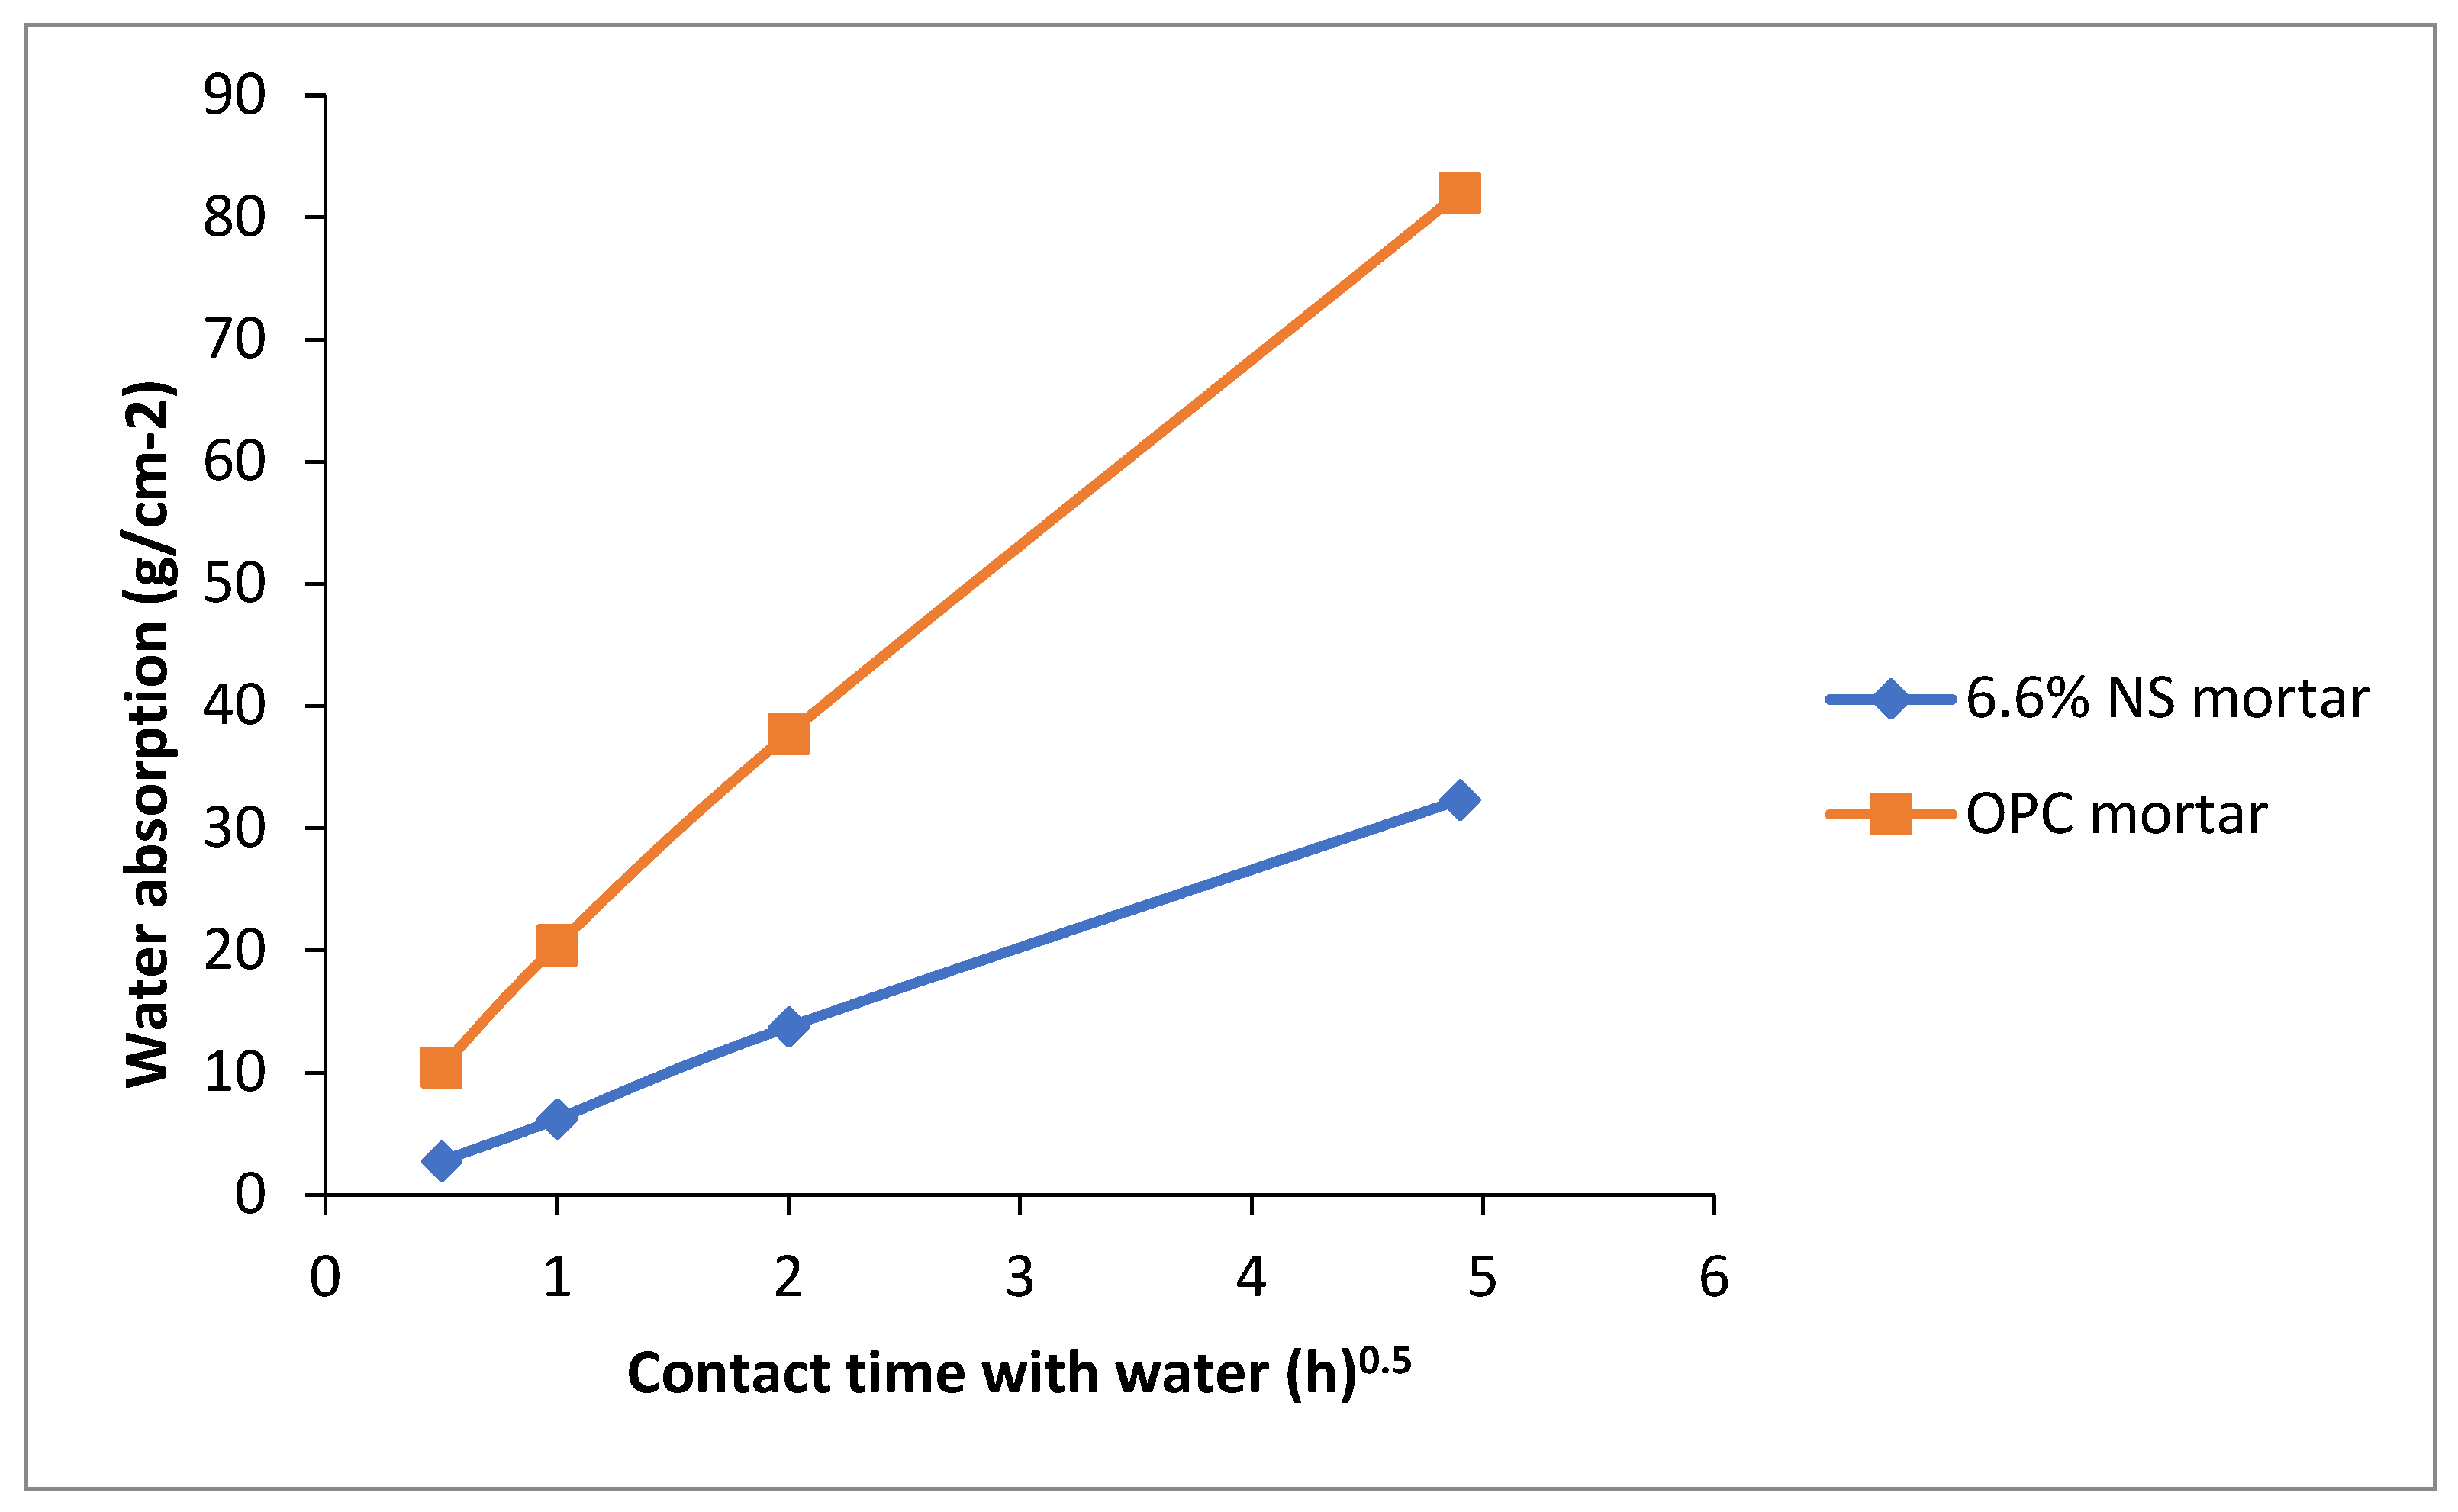
The capillary water absorption of cement mortar was determined to be 32 g/cm2 at optimum mix ratio, which is within the optimal region predicted to be 42.166 g/cm2 by the model. Furthermore, capillary water absorption characteristics of cement mortar at optimum mix ratio during the immersion for 24 h is presented graphically in Figure 11. As can be seen, capillary water uptake increases with the square root of time. Interestingly, the figure indicates that water resistance of mortar incorporating nano silicon was higher than that of the reference (OPC) sample. Moreover, it is obvious from the slopes that capillary absorption coefficients of OPC and mortar incorporating nano silicon were found to be 17 g/(cm2h0.5) and 7 g/(cm2h0.5), respectively. This implies that water resistance of mortar incorporating nano silicon expressed in percentage has increased to 62% as compared to control sample. This is due to the formation of hydrophobic crystalline thin film layer of nano silicon within the pore structure of the mortar matrix. Therefore, this proved to be good admixture with a better performance than crystalline and other nano-based water repellent admixtures previously reported by [31,71,72].
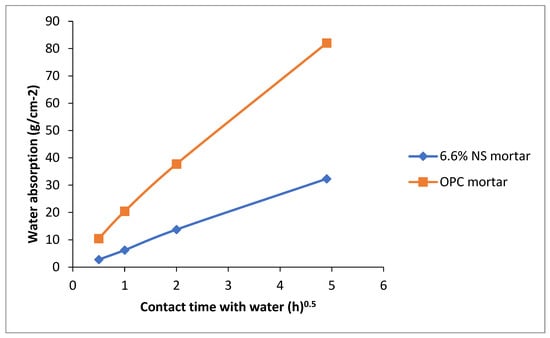
Figure 11.
Capillary water absorption of mortar incorporating nano silicon.
3.1.15. Volume of Water Permeable Voids
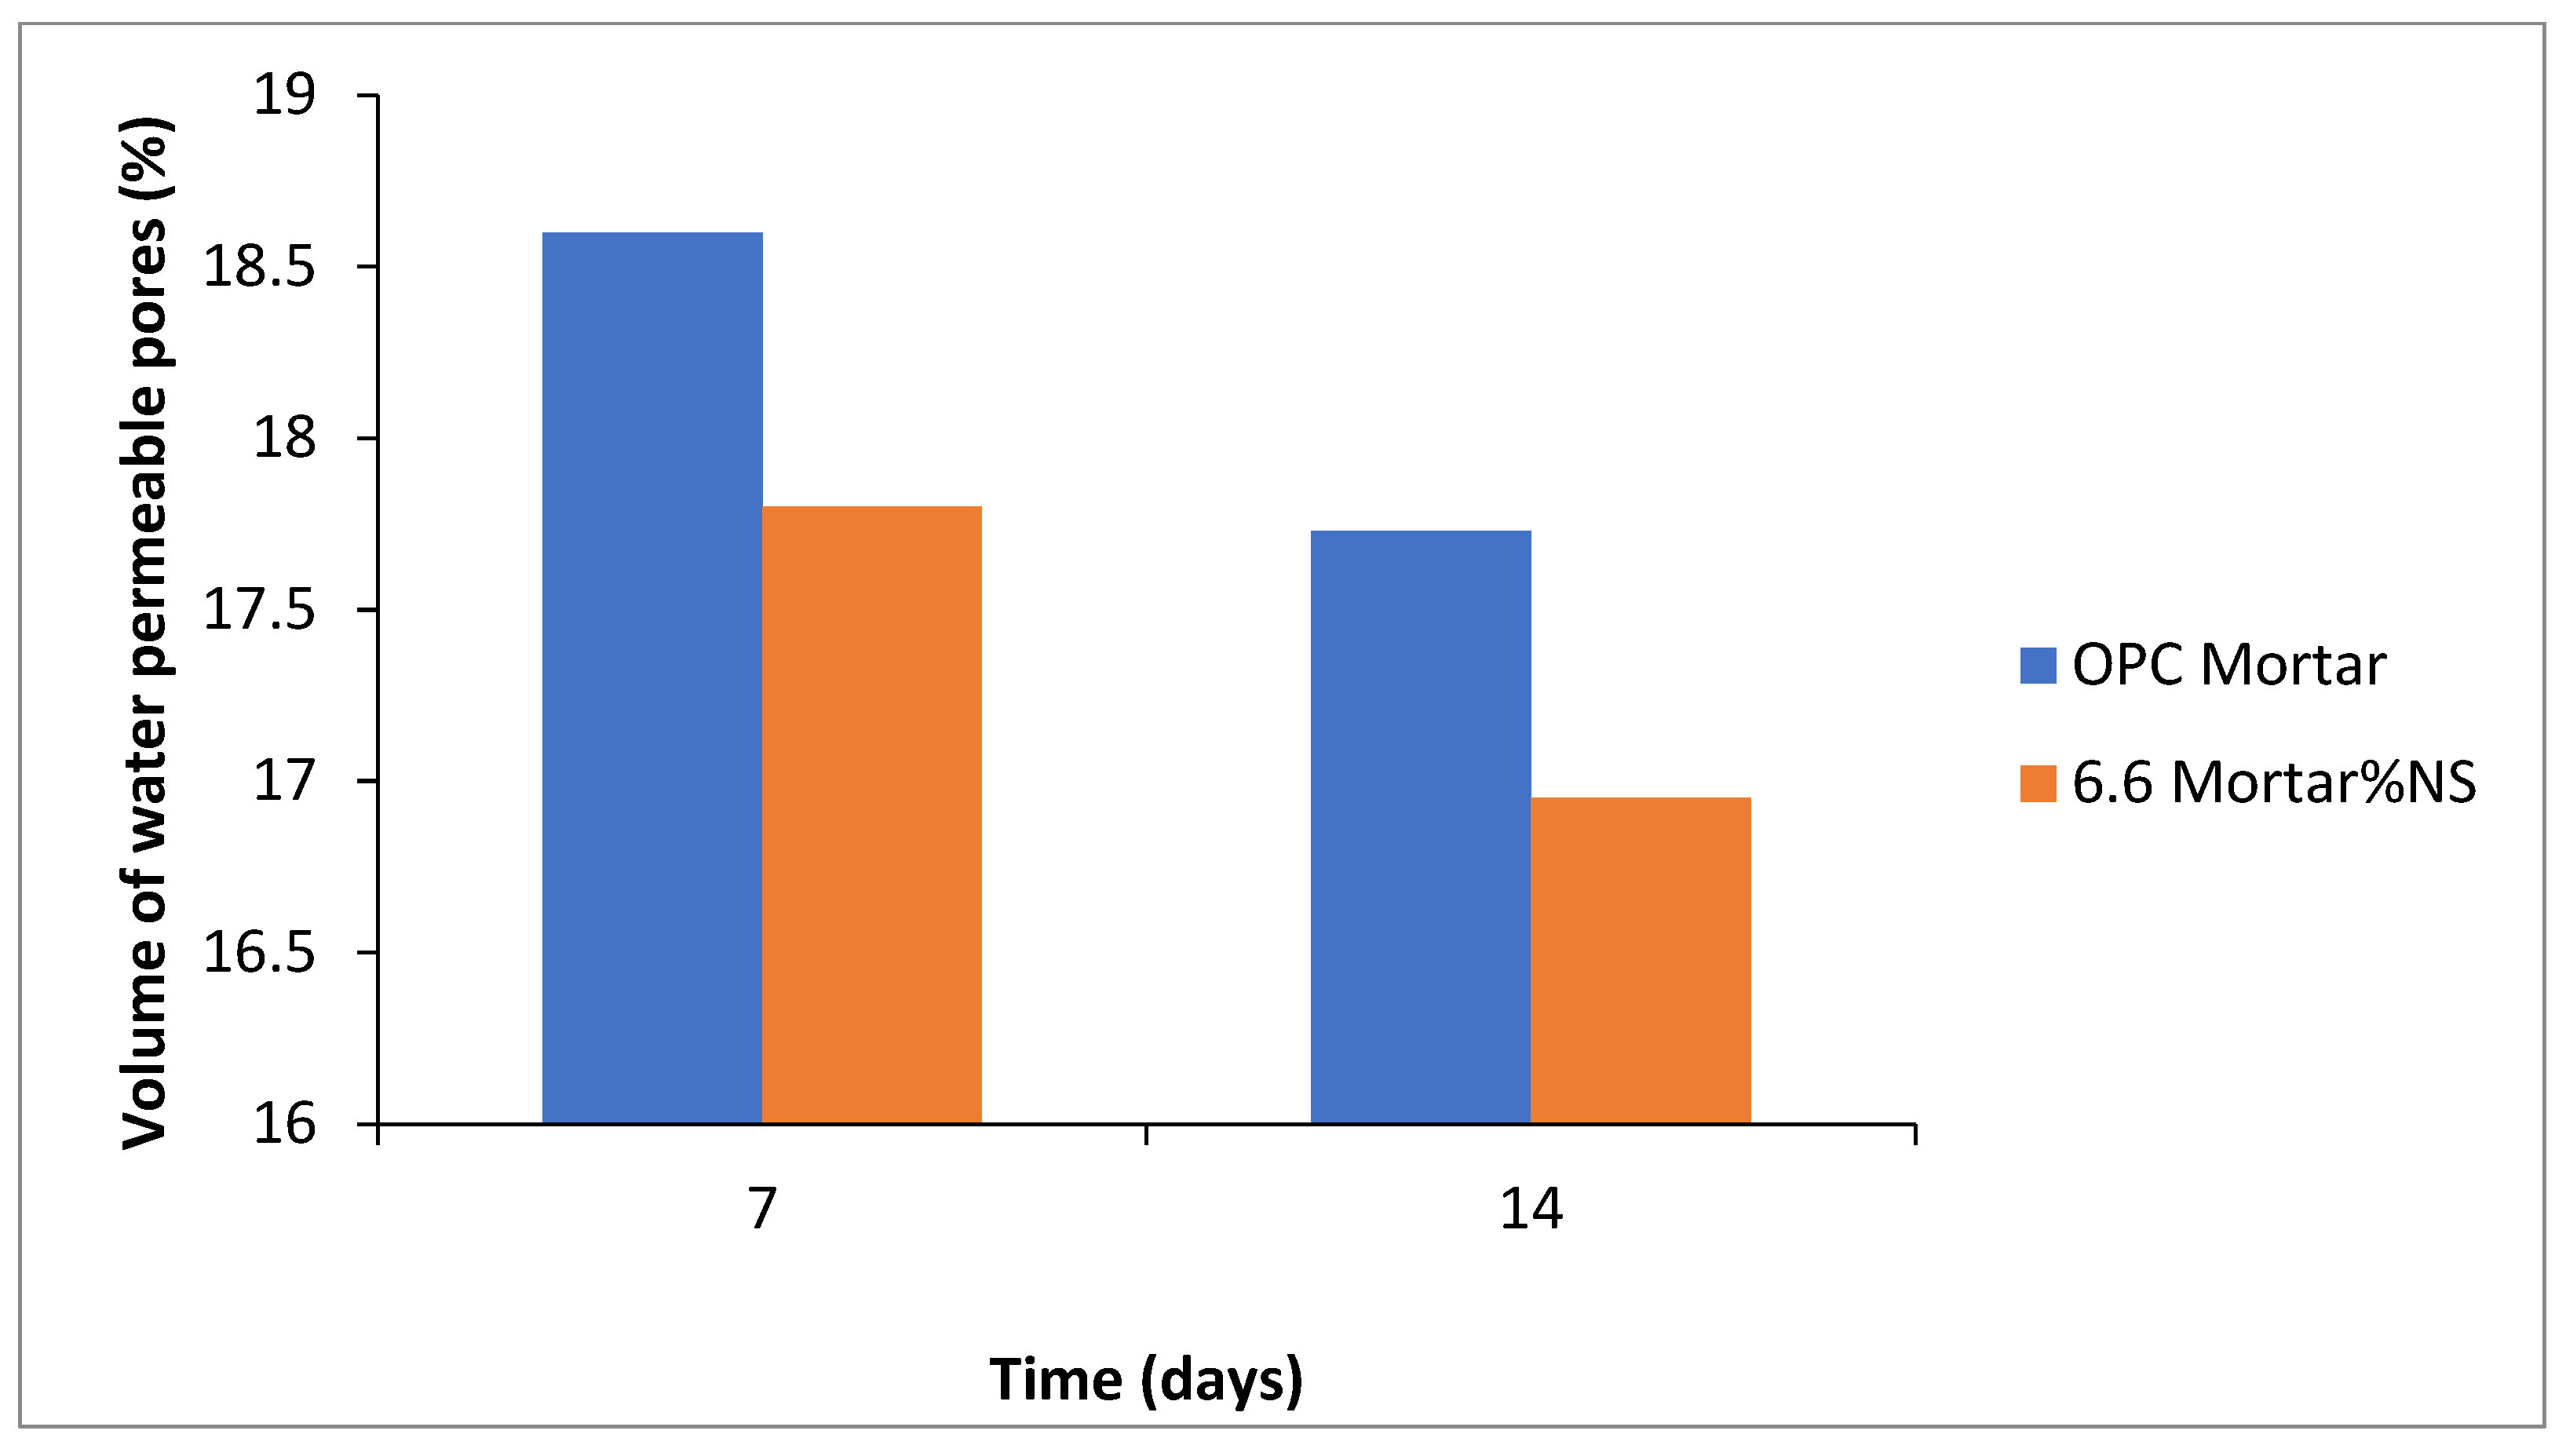
Figure 12 shows the change in volume of water permeable voids over the two distinct ages. This figure indicates that overall volume of water permeable voids decreases over time. And it is evidently clear that the water permeable voids of plain mortar expressed in percentage decreases from 18.6% at 7 days to 17.3% at 14 days. Likewise, that of mortar incorporating nano silicon decreases from 17.8% at 7 days to 16.9% at 14 days. Therefore, this trend shows that the volume of water permeable voids of mortar incorporating nano silicon is always lower as compared to plain mortar over the curing days. This implies a notable contribution of nano silicon water repellent admixture in reducing the volume of water permeable voids due to interconnected network of pores within the entire matrix of mortar specimen by up to 10%.
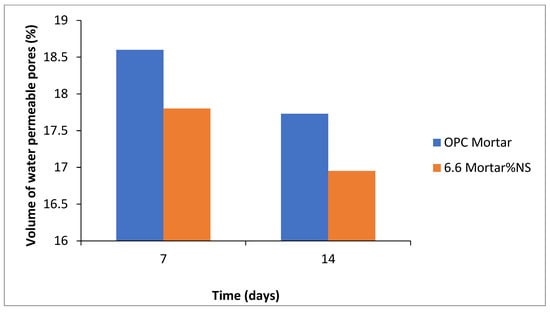
Figure 12.
Change in volume of water permeable voids of mortars with and without nano silicon over time.
3.1.16. Gas Permeability
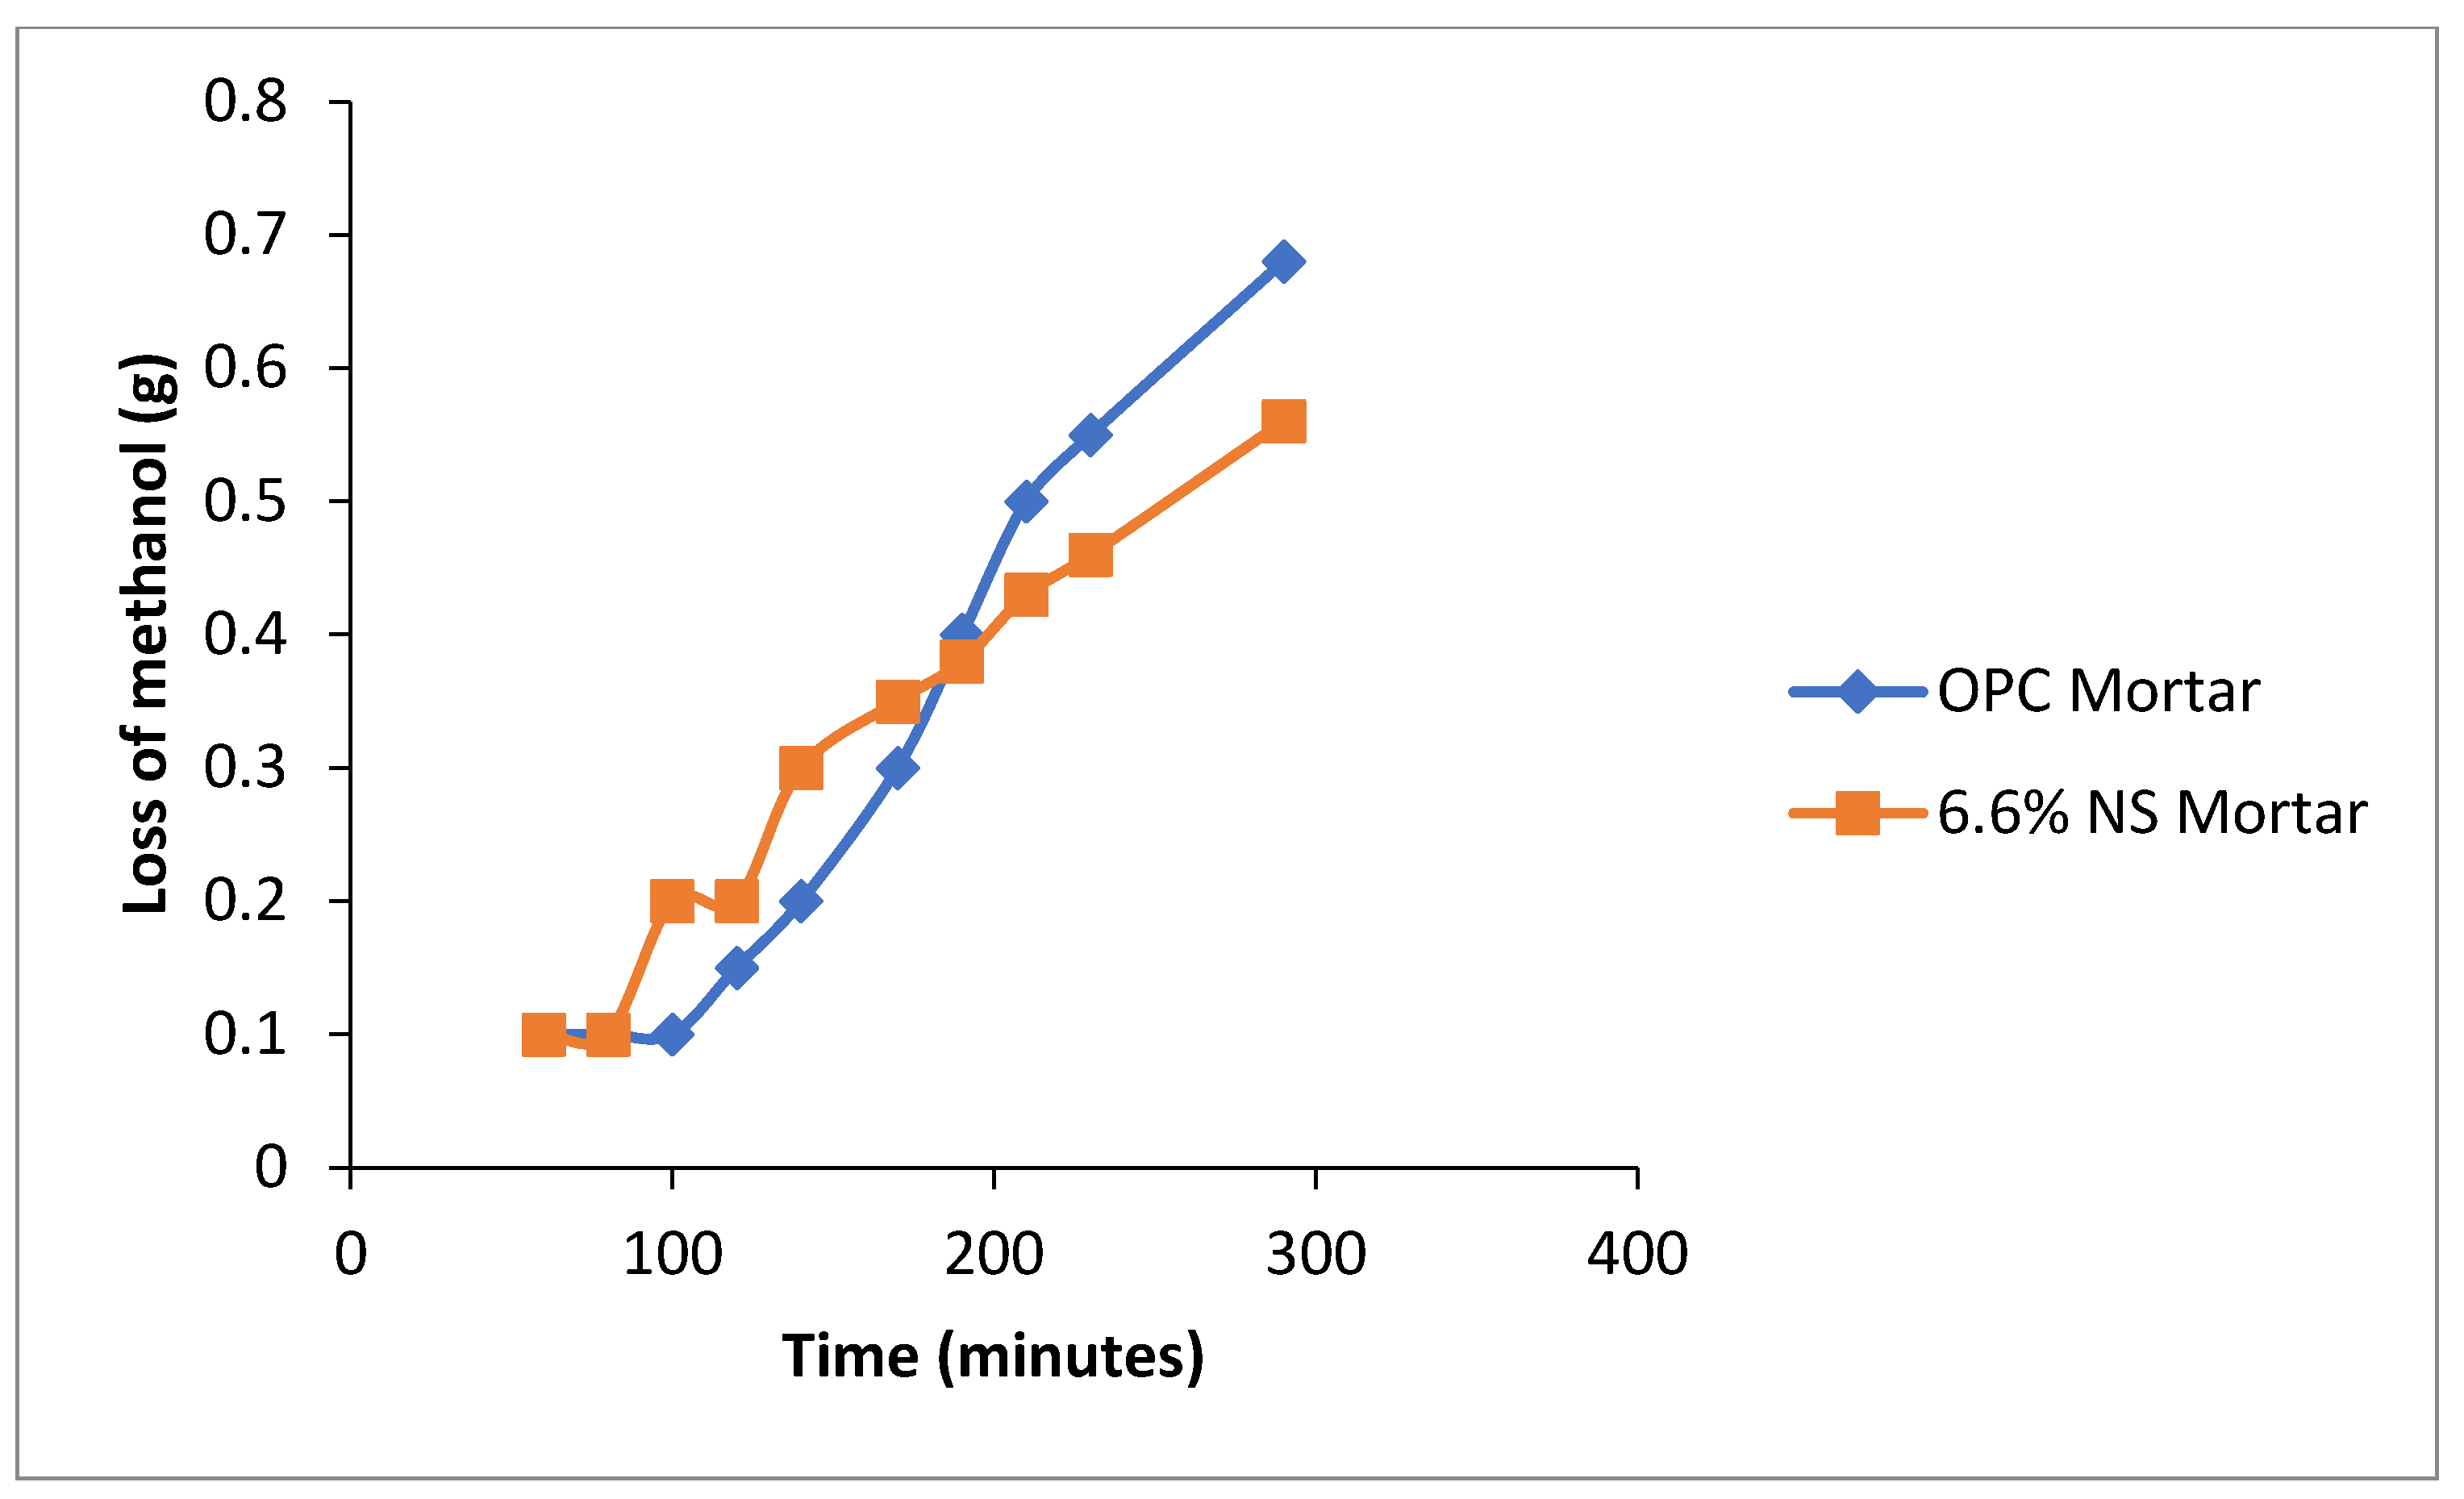
Figure 13 shows the trend in the flow of methanol gas with respect to both plain and nano silicon-based mortars. It can be seen that gas permeability increases with time. However, the pattern of the flow rate is not regular and, thus, unsteady up to around 190 min. It further highlights that nearly up to 100 min, gas permeability remains constant for both mortars, after which it increased with time throughout the testing period. Interestingly, it also shows that a linear fit between loss of methanol gas and time beyond 190 min confirmed steady flow of methanol gas. Therefore, gas permeability coefficients (K) for plain and nano silicon-based mortars were determined to be 1.30 × 10⁻²² gcm−1s−1 and 0.9 gcm−1s−1 × 10⁻²² from the figure, respectively. It is obvious that relative intrinsic permeability coefficient of mortar incorporating nano silicon expressed in percentage is 69%. This shows 31% increases in resistance to gas permeation as compared to plain mortar. Therefore, nano silicon appears to perform significantly much better than other nano based and crystalline waterproofing admixtures previously reported with just a maximum of 20% resistance to gas permeability [60]. However, ref. [73] previously established the potential of nano silica admixture to reduce water vapor transmission rate in cement-based materials, but their findings suggest that nano materials slightly affect water evaporation rate of concrete materials. Interestingly, most hydrophobic and crystalline admixtures for integral mixing were reported to have significantly reduced compressive strength of cement-based materials [72,73]. On the other hand, nano silicon admixture was found to have the least effect and, thus, reduced compressive strength by only 3% [50].
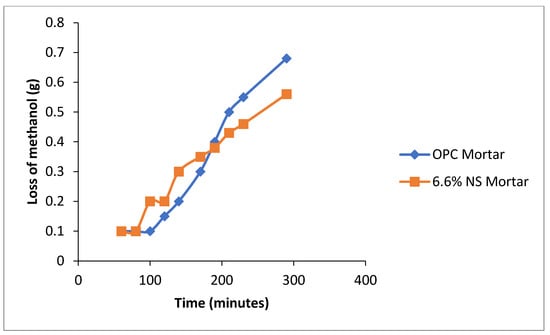
Figure 13.
Relationship between loss of methanol gas through mortars with and without nano silicon and time.
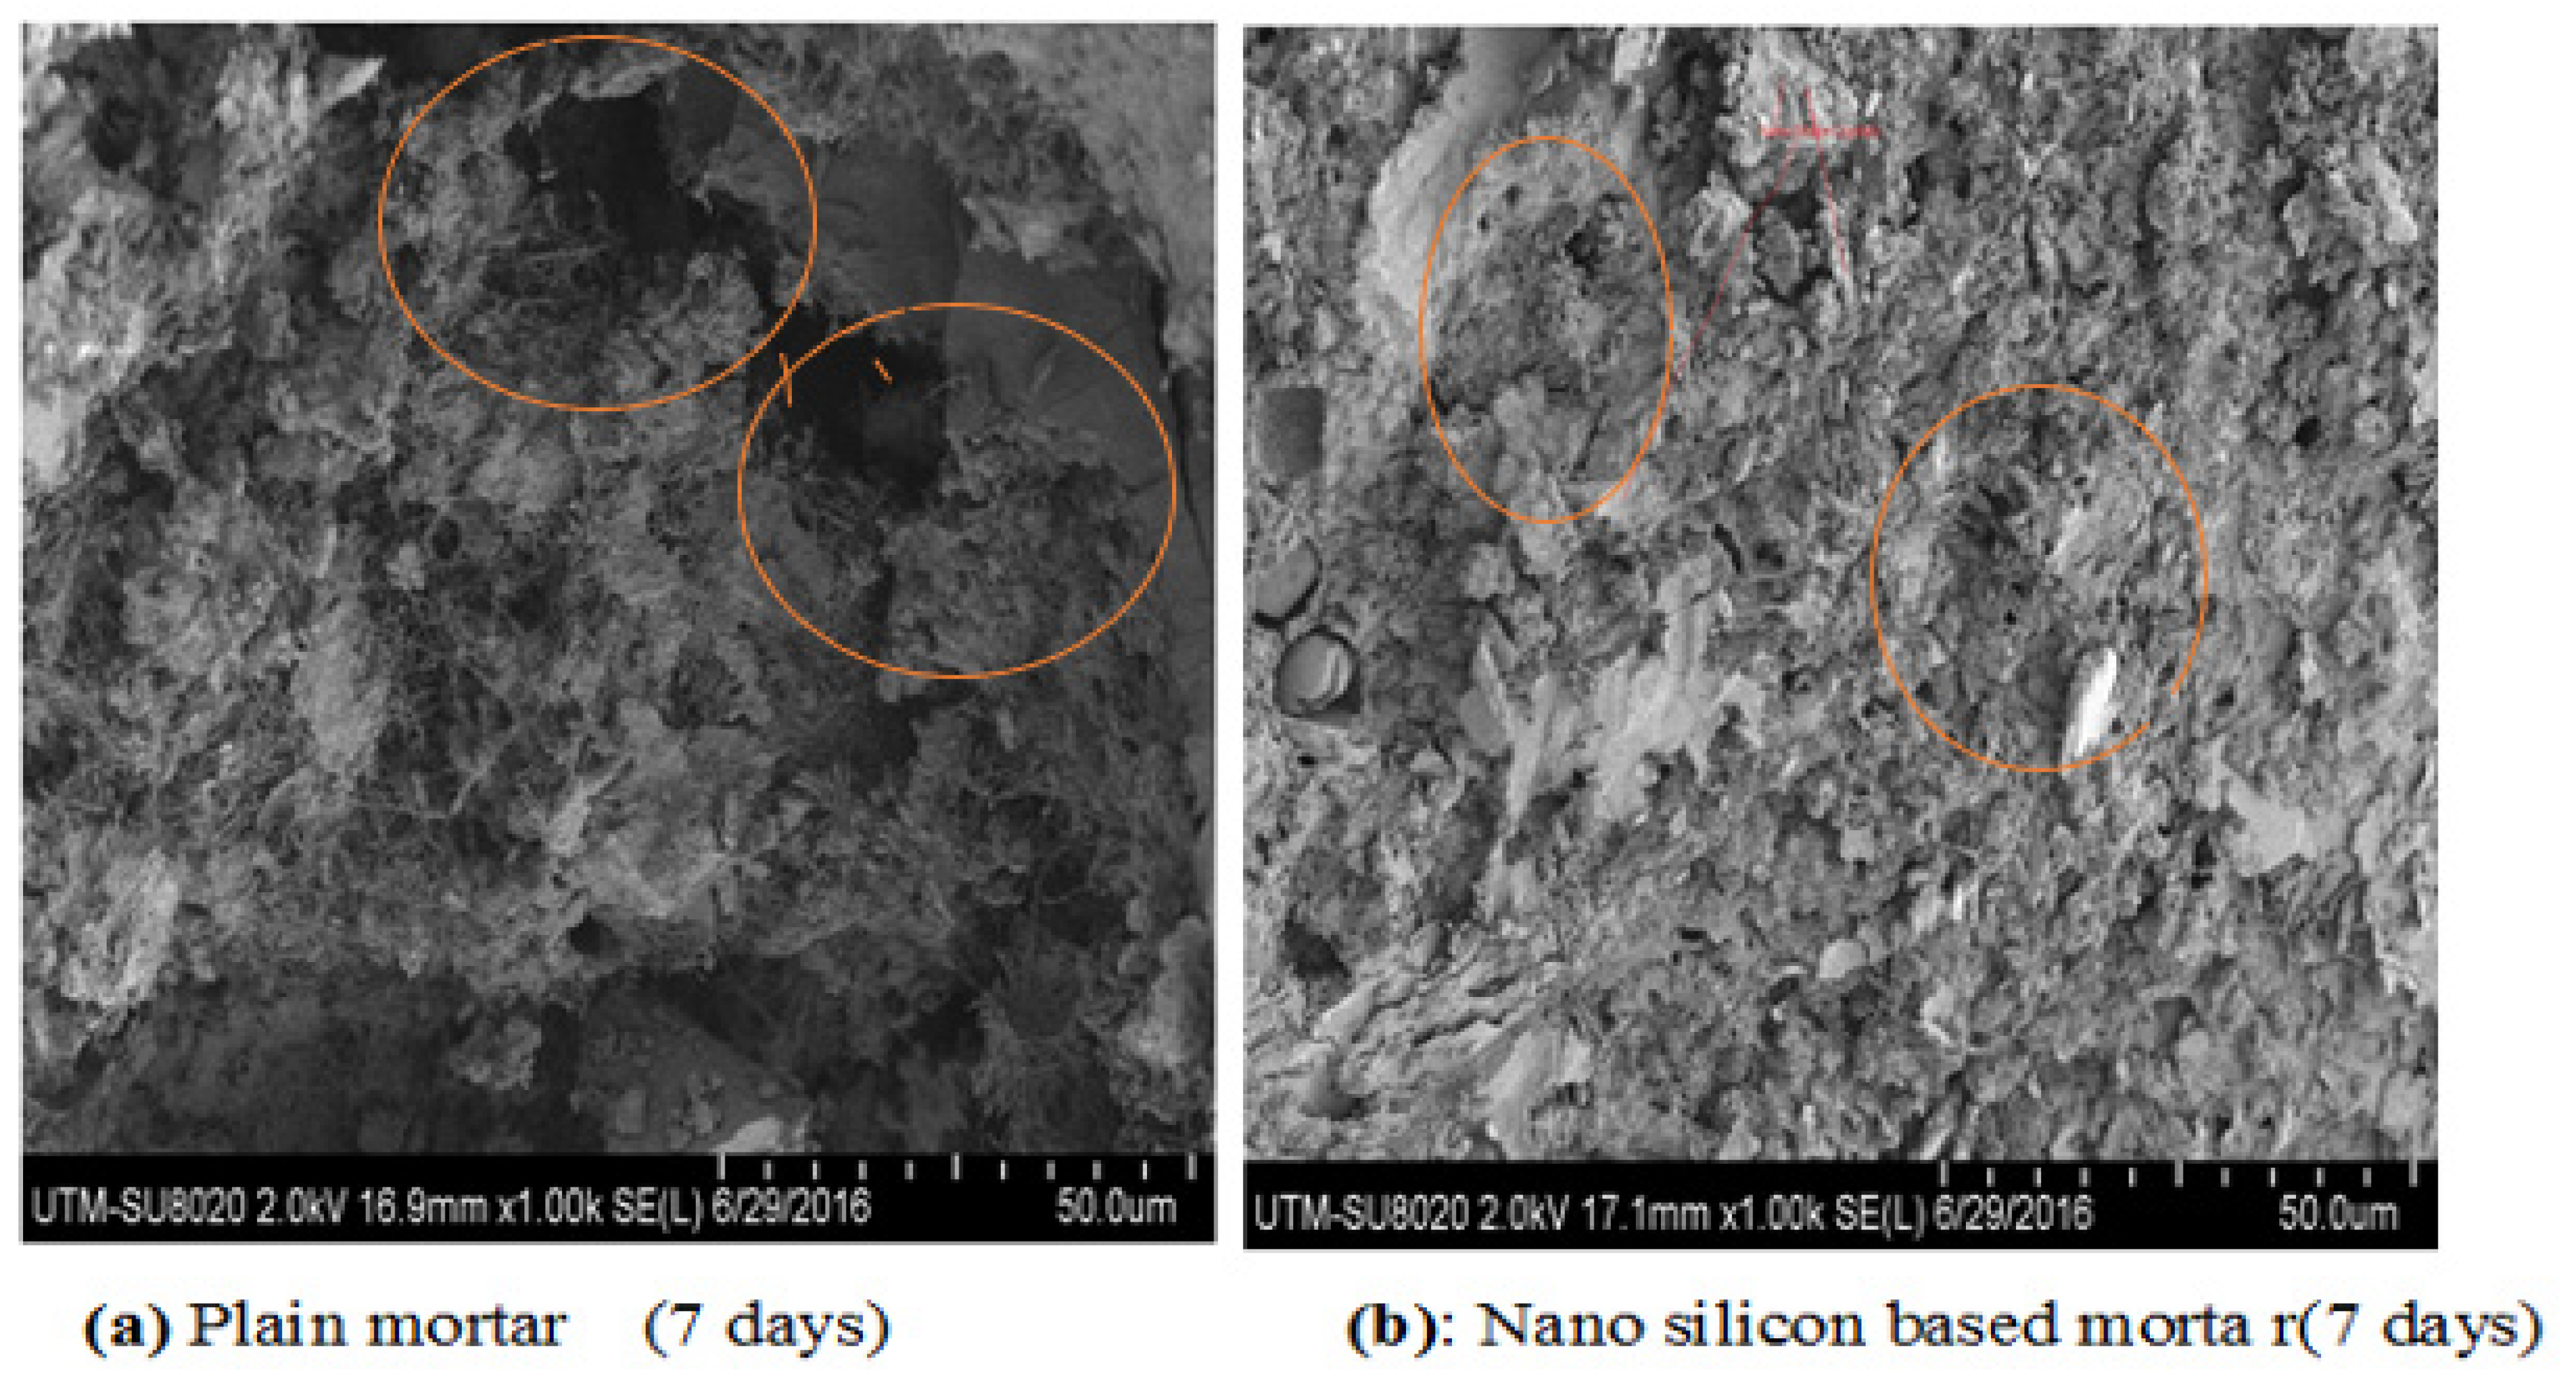
3.1.17. FESEM Micrograph
The FESEM micrographs of mortar incorporating nano silicon and OPC plain mortar are illustrated in Figure 14. The images of thin film layer of crystalline nano silicon crystal are visibly bound to the surface of the voids over the 7-day curing period. Consequently, this accounts for water repelling characteristics due to hydrophobic property. Likewise, it is obvious from Figure 14b that there are fewer voids as compared to reference mortar in Figure 14a. In this regard, pore filling effect of nano silicon crystals accounts for the reduction in the volume of nanometer size voids.
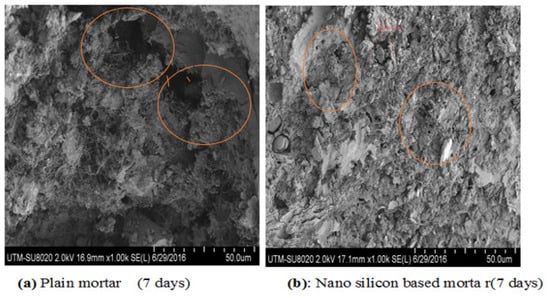
Figure 14.
FESEM image of mortar.
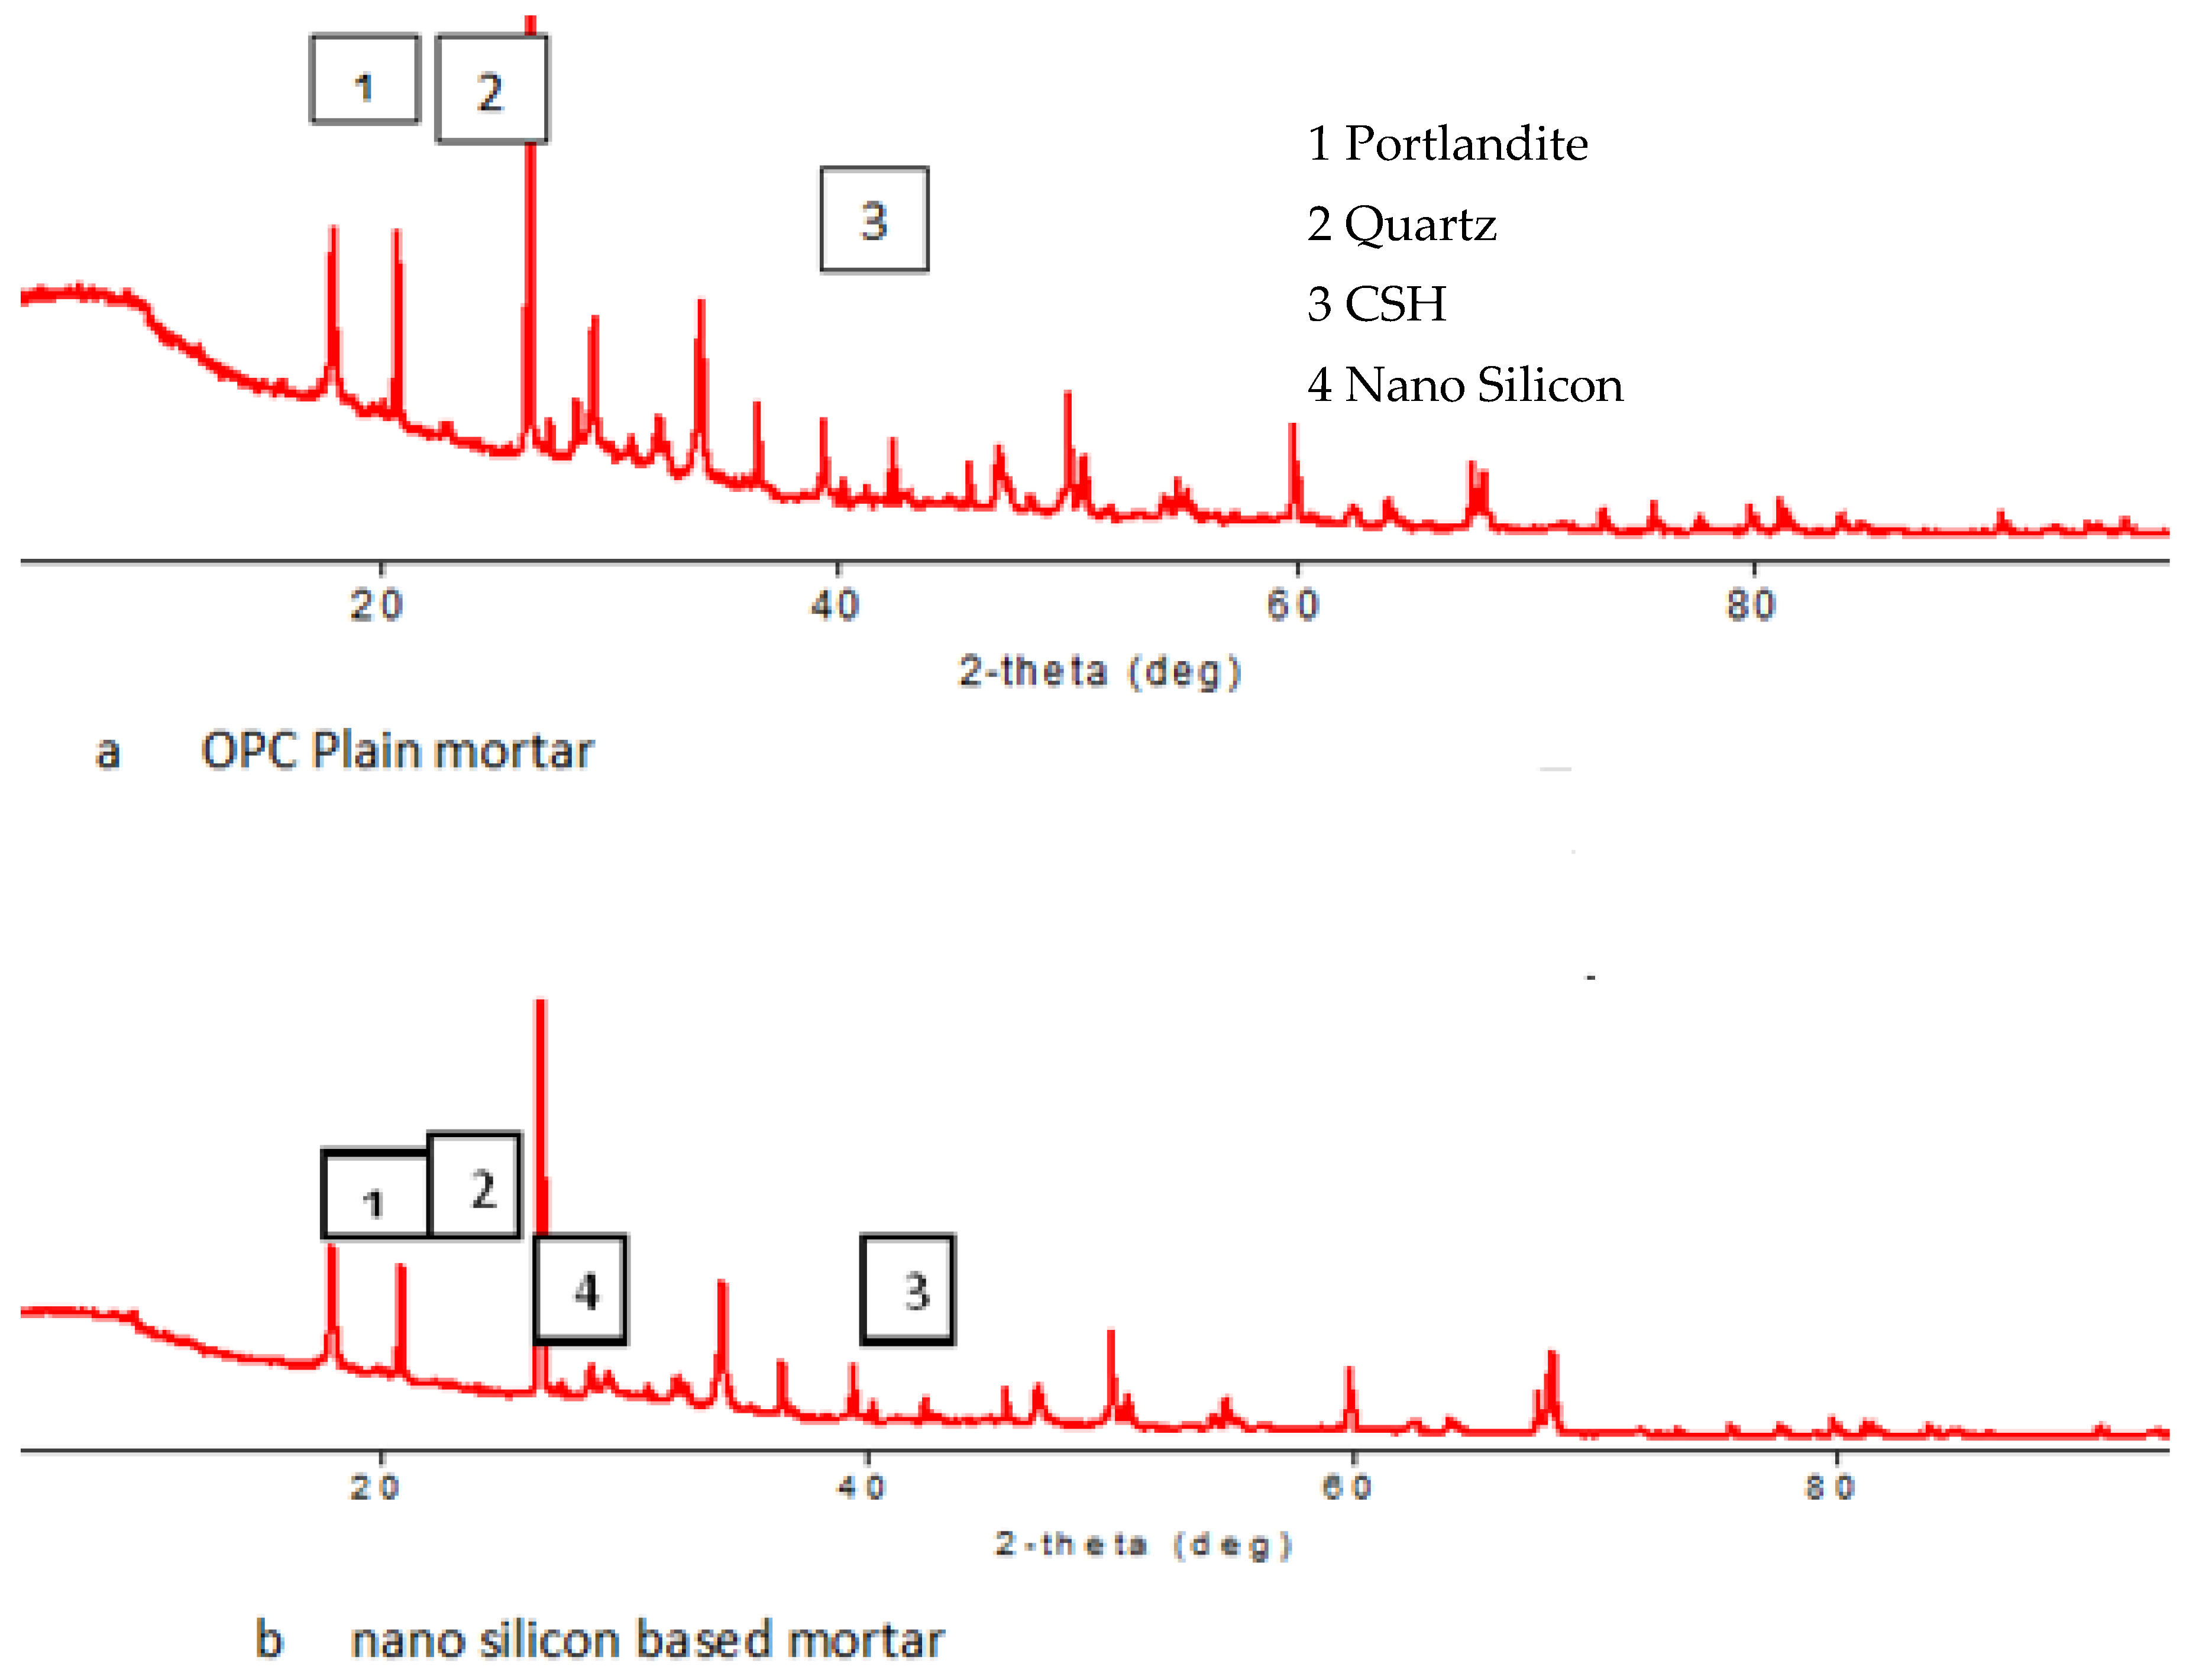
3.1.18. X-Ray Diffraction Result
The result of FESEM was validated using XRD and presented in Figure 15. The figure illustrates the XRD pattern of the specimen for plain and nano silicon-based mortars at 7 days. It is obvious from Figure 15a that there is no visible peak at 2θ = 28.7° for the plain mortar at the end of the seven days. On other hand, Figure 15b shows the presence of a narrow peak at 2θ = 28.7° and, thus, indicates the presence of nano silicon crystal within the pore structure of the mortar. Consequently, this established waterproofing mechanism of nano silicon-based mortar.
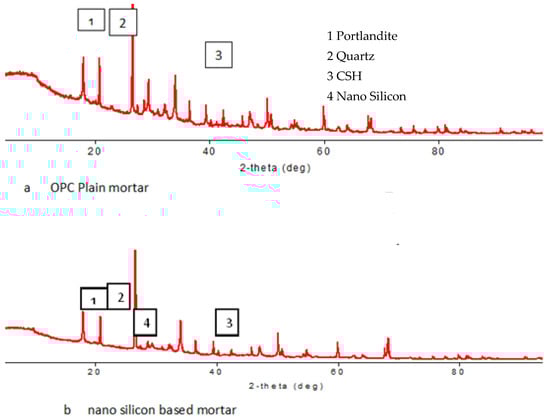
Figure 15.
XRD pattern of mortar after 7 days.
4. Conclusions
(i) Essential characteristics of nano silicon necessary to induce water-repelling properties in cement mortar were identified using EDS, FTIR, FESEM, XRD, and Zeta potential. The results indicated that nano silicon particles possessed special attributes, which make it suitable for application as an admixture for waterproofing of cement mortar.
(ii) A model for prediction of capillary water absorption in nano silicon-based mortar was developed with a mean absolute percentage error of 1.62%. The model indicated the mutual influence of nano silicon and w/c on capillary water absorption and other transport properties of cement mortar such as gas permeability and volume of water permeable voids. However, ANOVA indicates that the influence of nano silicon was found to be more significant as compared to w/c in terms of resistance to capillary water absorption. Additionally, the optimum mix ratio necessary to achieve the best response regarding capillary water absorption was established as 6.6% nano silicon dosage and w/c of 0.42. On the other hand, while resistance to gas permeability was found to be 31%, the decrease in volume of water permeable voids was only 10%.
(iii) A waterproofing mechanism is established using FESEM micrographs and is visibly due to the formation of hydrophobic thin film layer of nano silicon. Furthermore, in this regard, XRD results reaffirmed the crystallization of water repellent nano silicon layer within the pore structures of cement mortar.
5. Theoretical Implication
Theoretical implications of the findings suggest that instead of the traditional approach adopted by other researchers of optimizing one variable parameter at a time to predict water absorption, other tools such as central composite design (CCD) can be adopted to optimize multiple variables influencing water absorption characteristics of cement-based materials. In addition, nano silicon can be adopted as an additional alternative to the existing waterproofing admixtures and thus, expand the frontier of knowledge in this perspective.
6. Practical Implication
Practical implication of this work on the other hand suggests that integral mixing using nano silicon can be adopted to increase life span of cement-based materials. This is due to its non-vulnerability to deterioration, which is common for traditional surface coating materials. Interestingly, this approach does not require regular maintenance and can, thus, always be adopted where surface protection is practically impossible and/or, perhaps, too complex to execute.
7. Future Works
Future works will focus on further characterization using nuclear magnetic resonance (13CNMR) to reaffirm the presence of the organic functional group attached to the nano silicon already established using FTIR. In addition, elemental composition present in the nano silicon already established using energy dispersive x-ray (EDS) will be supported using point layered images analysis of EDS. Further in this regard, the influence of nano silicon on other transport properties of cement-based materials will be investigated and established. These parameters to investigate are the water vapor transmission rate, porosity, and pore size distribution. Additionally, synthetic nano silicon sample will be investigated further to ascertain the type of suspected minor impurities or secondary phases such as residual reactants, oxides (Sio2) and byproduct from synthesis process. sample holder, polymorphic forms responsible for other peaks in the XRD pattern.
8. Potential End Users
Potential end users of these findings include facilities predominantly located in the areas of high-water with persistent dampness, basements, and underground parking facilities.
Author Contributions
N.Z.M.: investigation, writing—original draft, writing—review & editing, formal analysis. M.Z.A.M.: methodology, funding acquisition, supervision, resources, project administration. A.K.: conceptualization, supervision, formal analysis, resources, project administration. A.S.: methodology, drafting of the original paper and writing—review & editing. R.M.: supervision, validation and approval for publishing. J.M.: design of the work, supervision, validation. M.M.A.: reviewing the work, interpretation of data and writing—review & editing. M.S.: reviewing the work, writing—review & editing, approval and accountable for all aspect of the work. All authors have read and agreed to the published version of the manuscript.
Funding
The authors would like to thank the Malaysian Ministry of Science, Technology, and Innovation (MOSTI) for funding this research project with E-Science grants (vote no. 4S042 and 4S123). The authors’ heartfelt immensly and thus, appreciation also goes to Research Management Center (RMC) of Universiti Teknologi Malaysia (UTM) for the PAS grants Q.J130000.2709.01K40 and Q.J130000.2709.01K41 as well as GUP grants Q.J130000.2609.10J83 and Q.J130000.2609.11J04. Further in this regard, authors extend their appreciation to the Tertiary Education Trust Fund of Nigeria.
Data Availability Statement
The original contributions presented in this study are included in the article. Further inquiries can be directed to the corresponding authors.
Acknowledgments
Authors also acknowledged the contribution of late Engr Bashir Yahya of mechanical Engineering Departmemt, Bayero University, Kano.
Conflicts of Interest
The authors declare no conflict of interest.
References
- De Schutter, G.; Audenaert, K. Evaluation of Water Absorption of Concrete as a Measure for Resistance Against Carbonation and Chloride Migration. Mater. Struct. 2004, 37, 591–596. [Google Scholar] [CrossRef]
- Liu, J.; Vipulanandan, C. Evaluating a Polymer Concrete Coating for Protecting Non-Metallic Underground Facilities from Sulfuric Acid Attack. Tunn. Undergr. Space Technol. 2001, 16, 311–321. [Google Scholar] [CrossRef]
- Chen, J.; Ummin, O.; Yu, T.; Qi, Y. Applications of Rayleigh Wave Detection Technique and Polymer Grouting Technology in Waterproof Construction. Appl. Mech. Mater. 2013, 405-408, 748–754. [Google Scholar] [CrossRef]
- Kenai, S.; Bahar, R. Evaluation and Repair of Algiers New Airport Building. Cem. Concr. Compos. 2003, 25, 633–641. [Google Scholar] [CrossRef]
- Lin, J.; Scott, D. Assessment of Significances of Building Failure Induced by Foundation Failure. In Building Integration Solutions, Proceedings of the Architectural Engineering Conference, Omaha Nebraska, NE, USA, 29 March–1 April 2006; American Society of Civil Engineers: Reston, VA, USA, 2006; pp. 1–13. [Google Scholar]
- Jumaat, M.Z.; Kabir, M.H.; Obaydullah, M. A Review of the Repair of Reinforced Concrte Beams. J. Appl. Sci. Res. 2006, 2, 317–326. [Google Scholar]
- Bhaskaran, R.; Palaniswamy, N.; Rengaswamy, N.S. A Review of Differing Approaches Used to Estimate the Cost of Corrosion (and Their Relevance in the Development of Modern Corrosion Prevention and Control Strategies). Anti-Corros. Methods Mater. 2013, 52, 29–41. [Google Scholar] [CrossRef]
- Naville, A. Properties of Concrete-Fourth and Final Edition; Pearson Education Limited: Essex, UK, 2002. [Google Scholar]
- Dai, J.; Akira, Y.; Wittmann, F.H.; Yokota, H.; Zhang, P. Water Repellent Surface Impregnation for Extension of Service Life of Reinforced Concrete Structures in Marine Environments: The Role of Cracks. Cem. Concr. Compos. 2010, 32, 101–109. [Google Scholar] [CrossRef]
- Zhu, Y.-G.; Kou, S.-C.; Poon, C.-S.; Dai, J.-G.; Li, Q.-Y. Influence of silane-based water repellent on the durability properties of recycled aggregate concrete. Cem. Concr. Compos. 2013, 35, 32–38. [Google Scholar] [CrossRef]
- National Cooperative Highway Research Program (NCHRP 244). Concrete Sealers and Protection of Bridge Structures; Transport Research Board: Washington, DC, USA; National Research Council: Ottawa, ON, Canada, 1981.
- German Committee of Reinforced Concrete (DAfStb). Guidelines for the Protection and Repair of Concrete Components. Part 3: Quality Assurance in Execution of the Works; Beuth Verlag GmbH: Berlin, Germany, 1991. [Google Scholar]
- Basheer, P.A.M.; Cleland, D.J.; Long, A.E. Surface Treatment for Concretes: Assessment Methods and Reported Performance. Constr. Build. Mater. 1997, 11, 413–429. [Google Scholar] [CrossRef]
- EN 14695:2010; Flexible Sheets for Waterproofing—Reinforced Bitumen Sheets for Waterproofing of Concrete Bridge Decks and Other Trafficked Areas of Concrete-Definitions and Characteristics. British Standards Institutition: London, UK, 2010.
- Muhammad, N.Z.; Keyvanfar, A.; Majid, M.Z.A.; Mirza, J.; Shafaghat, A. Waterproof Performance of Concrete: A Critical Review on Implemented Approaches. Constr. Build. Mater. 2015, 101, 80–90. [Google Scholar] [CrossRef]
- Zhou, Q.; Xu, Q. Experimental study of waterproof membranes on concrete deck: Interface adhesion under influences of critical factors. Mater. Des. 2009, 30, 1161–1168. [Google Scholar] [CrossRef]
- Liu, Y.; Wu, J.; Chen, J. Mechanical Properties of a Waterproofing Adhesive Layer Used on Concrete Bridges Under Heavy Traffic and Temperature Loading. Int. J. Adhes. Adhes. 2014, 48, 102–109. [Google Scholar] [CrossRef]
- Blight, G.E. A Study of Four Waterproofing Systems for Concrete. Mag. Concr. Res. 1991, 43, 197–203. [Google Scholar] [CrossRef]
- Suffian, A. Some Common Maintenance Problems and Building Defects: Our Experiences. Procedia Eng. 2013, 54, 101–108. [Google Scholar] [CrossRef]
- Pedrossa, A.; Del Rio, M. Synthetic Waterproofing Membranes and Auxiliary Separating Layers in The Inverted Flat Roof. Pressure Effect on The Degradation. Mater. De Constr. 2018, 68, e167. [Google Scholar] [CrossRef]
- Zhang, P.; Zhao, T.; Wittmann, F.H.; Li, S. Preparation and Characteristics of Integral Water Repellent Cement-Based Materials. Mater. Sci. Forum 2011, 675–677, 1189–1192. [Google Scholar] [CrossRef]
- Apay, A.C.; Ozgan, E.; Turgey, T.; Akyol, K. Investigation and Modeling the Effects of Waterproofing and Water Repellent Admixtures Dosages on the Permeability and Compressive strength of Concrete. Constr. Build. Mater. 2016, 13, 698–711. [Google Scholar] [CrossRef]
- Victoria, E.G.; Antonio, J.T.; Jose, M.S.; Marcos, L. Influence of Crystalline Admixtures on the Short-Term Behaviour of Mortars Exposed to Sulphuric Acid. Materials 2019, 12, 82. [Google Scholar]
- Ji, T. Preliminary Study on the Water Permeability and Microstructure of Concrete Incorporating Nano-SiO2. Cem. Concr. Res. 2005, 35, 1943–1947. [Google Scholar] [CrossRef]
- Florence, S.; Konstantin, S. Nanotechnology in Concrete—A Review. Constr. Build. Mater. 2010, 24, 2060–2071. [Google Scholar]
- Teizer, J.; Venugopal, M.; Teizer, W.; Felkl, J. Nanotechnology and Its Impact on Construction: Bridging the Gap Between Researchers and Industry Professionals. J. Constr. Eng. Manag. 2012, 138, 594–604. [Google Scholar] [CrossRef]
- Firoozi, A.A.; Taha, M.R.; Firoozi, A.A. Nanotechnology in Civil Engineering. Eloctronic J. Geotech. Eng. 2014, 19, 4673–4682. [Google Scholar]
- Woo, R.S.C.; Zhu, H.; Chow, M.M.K.; Leung, C.K.Y.; Kim, J. Science and Barrier performance of silane—Clay nanocomposite coatings on concrete structure. Compos. Sci. Technol. 2008, 68, 2828–2836. [Google Scholar] [CrossRef]
- Zhang, Z.; MacMullen, J.; Dhakal, H.N.; Radulovic, J.; Herodotou, C.; Totomis, M.; Bennett, N. Enhanced Water Repellence and Thermal Insulation of Masonry by Zinc Oxide Treatment. Energy Build. 2012, 54, 40–46. [Google Scholar] [CrossRef]
- Hou, P.; Cheng, X.; Qian, J.; Shah, S.P. Effects and Mechanisms of Surface Treatment of Hardened Cement-Based Materials with Colloidal nanoSiO2 and Its Precursor. Constr. Build. Mater. 2014, 53, 66–73. [Google Scholar] [CrossRef]
- Hou, P.; Cheng, X.; Qian, J.; Zhang, R.; Cao, W.; Shah, S.P. Characteristics of Surface-Treatment of Nano-SiO2 on the Transport Properties of Hardened Cement Pastes with Different Water-to-Cement Ratios. Cem. Concr. Compos. 2015, 55, 26–33. [Google Scholar] [CrossRef]
- Hallmann, S.; Fink, M.J.; Mitchell, B.S. Wetting Properties of Silicon films from Alkyl-Passivated Particles Produced by Mechanochemical Synthesis. J. Colloid. Interface Sci. 2010, 348, 634–641. [Google Scholar] [CrossRef] [PubMed]
- Vejmelková, E.; Konakova, D.; Cachova, M.; Kippert, M.; Cerny, R. Effect of Hydrophobization on the Properties of Lime–metakaolin Plasters. Constr. Build. Mater. 2012, 37, 556–561. [Google Scholar] [CrossRef]
- Nunes, C.; Slížková, Z. Hydrophobic Lime Based Mortars with Linseed Oil: Characterization and Durability Assessment. Cem. Concr. Res. 2014, 61–62, 28–39. [Google Scholar] [CrossRef]
- Novak, V.; Zach, J. The Effect of Hydrophobization on the Properties of Mortar MixturesIOP Conference Series. Mater. Sci. Eng. 2018, 385, 012040. [Google Scholar] [CrossRef]
- Shidar, M.R.; Golshan, A.; Izman, S.; Ghodsiyeh, D. The Application of Surface Response Methodology to the Pretreatment of WC Substrates Prior to Diamond Coating. J. Mater. Eng. Perform. 2013, 23, 13–24. [Google Scholar] [CrossRef]
- Shidar, M.R.; Izman, S.; Taheri, N.M.; Assadian, M.; AbdulKadir, M.R. Effect of Post-Treatment Techniques on Corrosion and Wettability of Hydroxyapatite CoatedCo-Cr-Mo Alloy. Arab. J. Sci. Eng. 2015, 40, 1197–1203. [Google Scholar] [CrossRef]
- Kabo, K.S.; Yacob, A.R.; Bakar, W.A.W.A.; Buang, N.A.; Bello, A.M.; Ruskam, A. BBD Optimization of K-ZnO Catalyst Modification Process for Heterogeneous Transesterification of Rice Bran Oil to Biodiesel. IOP Conf. Ser. Mater. Sci. Eng. 2015, 136, 012063. [Google Scholar] [CrossRef]
- Assadian, M.; Shidar, M.R.; Idris, M.H.; Izman, S.; Almosi, D.; Taheri, M.M.; Abdulkadir, M.R. Optimization of Electrophoretic Deposition Parameters in Coating Metallic Substarte by Hydroxyapatite Using Response Surface Metjhodology. Arab. J. Sci. Eng. 2015, 40, 923–933. [Google Scholar] [CrossRef]
- ASTMC150; Standard Specification for Portland Cement. American Society for Testing and Materials: West Conshohocken, PA, USA, 2012.
- ASTMC33; Standard Specification for Concrete Aggregates. American Society for Testing and Materials: West Conshohocken, PA, USA, 2013.
- Marimune, S.; Kotera, M.; Nishino, T.; Goto, K.; Hata, K. Poly(vinyl alcohol) Nanocomposites with Nanodiamond. Macromolecules 2011, 44, 4415–4421. [Google Scholar] [CrossRef]
- Bothun, G.D. Hydrophobic Silver nanoparticles Trapped in Lipid Bilayers: Size Distribution, Bilayer Phase Behavior, and Optical Properties. J. Nanobiotechnol. 2008, 6, 13. [Google Scholar] [CrossRef] [PubMed]
- Mazzol, A.; Favoni, O. Particle Size, Size Distribution and Morphological Evaluation of Airbone dust Particles of Diverse Woods by Scanning Electron Microscopy and Image Processing Program. Powder Technol. 2012, 225, 65–77. [Google Scholar] [CrossRef]
- Jiang, J.; Oberdörster, G.; Biswas, P. Characterization of Size, Surface Charge, and Agglomeration State of Nanoparticle Dispersions for Toxicological Studies. J. Nanoparticle Res. 2009, 11, 77–89. [Google Scholar] [CrossRef]
- Hallmann, S.; Fink, M.J.; Mitchell, B.S. Mechanochemical Synthesis of Functionalized Silicon Nanoparticles with Terminal Chlorine Groups. J. Mater. Res. 2011, 26, 1052–1060. [Google Scholar] [CrossRef]
- Bas, D.; Boyach, I.S. Modeling and Optimization I: Usability of Response Surface Methodology. J. Food Eng. 2007, 78, 836–845. [Google Scholar] [CrossRef]
- Ferreira, S.L.C.; Bruns, R.E.; Silve, E.G.; Pa Santos, W.N.; Quintella, C.M.; David, J.M.; Andrade, J.; Breitkreitz, M.C.; Jardim, I.C.S.F.; Neto, B.B. Statistical Designs and Response Surface techniques for the Optimization of Chromatographic System. J. Chromatogr. A 2007, 1158, 2–14. [Google Scholar] [CrossRef] [PubMed]
- Bezerra, M.A.; Santelli, R.E.; Oliveira, E.P.; Villar, L.S.; Escaleira, L.A. Response Surface Methodology (RSM) as a Tool for Optimization in Analytical Chemistry. Talanta 2008, 76, 965–977. [Google Scholar] [CrossRef] [PubMed]
- Muhammad, N.Z.; Keyvanfa, A.; Shafaghat, A.; Majid, M.Z.; Mirza, J.; Mccaffer, R.; Aliyu, M.M. Optimization of Nano Silicon for Integral Mixing in Cement Mortar: A Response Surface Methodology Approach. AIP Conf. Proc. 2020, 2284, 020009. [Google Scholar] [CrossRef]
- ASTMC109; Standard Test Methods for rate for Compressive Strength of Hydraulic Cement Mortars. American Society for Testing and Materials: West Conshohocken, PA, USA, 2012.
- ASTMC305; Standard Practice for Mechanical Mixing of Hydraulic Cement Pastes and Mortars of Plastic Consistency. American Society for Testing and Materials: West Conshohocken, PA, USA, 2014.
- ASTMC1437; Standard Test Methods for Flow of Hydraulic Cement Mortar. American Society for Testing and Materials: West Conshohocken, PA, USA, 2013.
- ASTMC1403C; Standard Test Methods for rate of Water Absorption for Masonry Mortars. American Society for Testing and Materials: West Conshohocken, PA, USA, 2013.
- ASTMC642; Standard Test Method for Density, Absorption, and Voids in Hardened Concrete. American Society for Testing and Materials: West Conshohocken, PA, USA, 2006.
- International Union of Testing and Research Laboratories for Materials and Structures. Penetration and Permeability of Concrete: Barrier to Organic Contaminating Liquids; RILEM Report; CRC Press: Boca Raton, FL, USA, 1997; p. 146. [Google Scholar]
- Alshamsi, A.M.; Imran, H.D.A. Development of a Permeability Apparatus for Concrete and Mortar. Cem. Concr. Res. 2002, 32, 923–929. [Google Scholar] [CrossRef]
- Karlina, A.I.; Karlina, Y.I.; Gladkikh, V.A. Analysis of Experience in the use of Micro-and nano Additives from Silicon Production Waste in Concrete Technologies. Minerals 2023, 13, 1525. [Google Scholar] [CrossRef]
- Han, B.; Yang, Z.; Shi, X.; Yu, X. Transport Properties of Carbon-Nanotube/Cement Composites. J. Mater. Eng. Perform. 2012, 22, 184–189. [Google Scholar] [CrossRef]
- Wang, H.; Xu, Z.; Fink, M.J.; Mitchell, B.S. Functionalized silicon nanoparticles from reactive cavitation erosion of silicon wafers. Chem. Commun. 2014, 51, 1465–1468. [Google Scholar] [CrossRef]
- Plank, J.; Hirsch, C. Impact of Zeta Potential of Early Cement Hydration Phases on Superplasticizer Adsorption. Cem. Concr. Res. 2007, 37, 537–542. [Google Scholar] [CrossRef]
- Rajagopalan, T.; Wang, X.; Lahlouh, B.; Ramkumar, C.; Dutta, P.; Gangopadhyay, S. Low Temperature Deposition of Nano Crystalline Silicon Carbide Films by Plasma Enhanced Chemical Vapor Deposition and Their Structural and Optical Characterization. J. Appl. Phys. 2003, 94, 5252–5260. [Google Scholar] [CrossRef]
- Ventolà, L.; Vendrell, M.; Giraldez, P.; Merino, L. Traditional Organic Additives Improve Lime Mortars: New Old Materials for Restoration and Building Natural Stone Fabrics. Constr. Build. Mater. 2011, 25, 3313–3318. [Google Scholar] [CrossRef]
- Klisińska-Kopacz, A.; Tišlova, R. Effect of Hydrophobization Treatment on the Hydration of Repair Roman Cement Mortars. Constr. Build. Mater. 2012, 35, 735–740. [Google Scholar] [CrossRef]
- Falchi, L.; Müller, U.; Fontana, P.; Izzo, F.C.; Zendri, E. Influence and Effectiveness of Water-Repellent Admixtures on Pozzolana–lime Mortars for Restoration Application. Constr. Build. Mater. 2013, 49, 272–280. [Google Scholar] [CrossRef]
- Kahir, U.; Fahmi, H.; Hakim, S.A.; Rohim, R. Forecasting Error Calculation with Mean Absolute Deviation and Mean Absolute Percentage Error. J. Phys. Conf. Ser. 2017, 930, 012002. [Google Scholar] [CrossRef]
- Liu, X.; Li, C.; Niu, Z.; Pang, Y.; Chen, M. Durability of cement mortar under sulphate partial immersion based on a novel hydrophobic agent. Case Stud. Constr. Mater. 2025, 22, 4575. [Google Scholar] [CrossRef]
- Sun, J.; Shi, C.; Li, P.; Li, A. Influence of Nanomodified Waterproofing Agent on the Performance of Rigid Waterproof Concrete in Underground Engineering. J. Nanomater. 2022, 2022, 2966551. [Google Scholar] [CrossRef]
- Liu, P.; Liu, M.; Sha, F.; Chen, Y.; Zhi, W.; He, S.; Yu, Z. Preparation and performance investigation of a high efficiency cement permeation type waterproofing materials. Constr. Build. Mater. 2023, 364, 130140. [Google Scholar] [CrossRef]
- Ayyoob, S.; Zaki, M.; Khan, M.S.; Khan, S.A.; Kamal, M.A. The Efficiency of Waterproofing Agents in Concrete: Assessment of Compressive Strength and Permeability. Am. J. Civ. Eng. Arch. 2022, 10, 137–146. [Google Scholar] [CrossRef]
- Cai, J.; Ran, Q.; Ma, Q.; Zhang, H.; Liu, K.; Zhou, Y.; Mu, S. Influence of a Nano-Hydrophobic Admixture on Concrete Durability and Steel Corrosion. Materials 2022, 5, 6842. [Google Scholar] [CrossRef]
- Du, H.; Du, S.; Liu, X. Effect of nano-silica on the mechanical and transport properties of lightweight concrete. Constr. Build. Mater. 2025, 82, 114–122. [Google Scholar] [CrossRef]
- Tittaralle F and Moriconi, G. The effect of silane-based hydrophobic admixture on corrosion of reinforcing steel in concrete. Cem. Concr. Res. 2008, 38, 1354–1357. [Google Scholar] [CrossRef]


Disclaimer/Publisher’s Note: The statements, opinions and data contained in all publications are solely those of the individual author(s) and contributor(s) and not of MDPI and/or the editor(s). MDPI and/or the editor(s) disclaim responsibility for any injury to people or property resulting from any ideas, methods, instructions or products referred to in the content. |
© 2025 by the authors. Licensee MDPI, Basel, Switzerland. This article is an open access article distributed under the terms and conditions of the Creative Commons Attribution (CC BY) license (https://creativecommons.org/licenses/by/4.0/).