Abstract
A straightforward and versatile numerical approach is proposed for the nonlinear analysis of single and double-curvature masonry structures. The method is designed to broaden accessibility to both experienced and less specialized users. Masonry units are discretized with elastic quadrilateral elements, while mortar joints are modeled with a combination of elastic orthotropic plate elements or shear panels and elastic perfectly brittle trusses (cutoff bars). This method employs the simplest inelastic finite element available in any commercial software to lump nonlinearities exclusively within the mortar joints. It effectively captures the failure of curved structures under Mode 1 deformation, reproducing the typical collapse mechanism of unreinforced arches and vaults via flexural plastic hinges. The proposed method is benchmarked through three case studies drawn from the literature, each supported by experimental data and numerical results of varying complexity. A comprehensive evaluation of the global force–displacement curves, along with the analysis of the thrust line and the evolution of nonlinearities within the model, demonstrates the effectiveness, reliability, and simplicity of the approach proposed. By bridging the gap between advanced simulation and practical application, the approach provides a robust tool suitable for a wide range of users. This study contributes to a deeper understanding of the behavior of unreinforced curved masonry structures and lays a base for future advancements in the analysis and conservation of historical heritage.
1. Introduction
Masonry arches and vaults are widespread in Eastern and Western historical buildings. Since, in most cases, they were constructed centuries ago, their structural assessment is essential to preserve them under both vertical and horizontal loads, as well as to design effective strengthening interventions.
Masonry curved structures were primarily designed to withstand gravity loads. Their load-bearing capacity derives more from geometric configuration than material strength. Nevertheless, the assessment of masonry constructions is complicated by their inherent heterogeneity. Indeed, masonry consists of units and binders with different mechanical, chemical, and physical properties, significantly based on locally sourced materials [1]. However, any type of masonry features a very low tensile strength and good resistance to compression.
After the elasticity theory, the fundamental principles of voussoir arch mechanics were first applied to masonry by Kooharian, Pippard [2,3], and Heyman [4]. They proposed the study of masonry voussoir arches through the application of Limit Analysis (LA) and the concepts of plastic hinges. Heyman developed his approach for masonry members on three hypotheses: (i) infinite compressive strength, (ii) no tensile resistance, and (iii) no sliding between voussoirs (infinite friction). According to these hypotheses, plastic hinges form where the line of thrust intersects the intrados or extrados of the arch. Collapse occurs when at least four hinges develop, making the stability of a masonry arch primarily a geometric issue.
Nowadays, in addition to classic LA, several methods and computational tools exist for assessing curved masonry structures. They are based on different theories and approaches, such as advanced LA methods, continuum (such as Finite Element—FE), and discrete element (DE) modeling techniques. These vary in complexity, computational time and accuracy, required user expertise, and market price. The optimal choice for the method depends on several factors, such as the structural features, the desired level of accuracy, the knowledge of the material properties, and the user’s experience.
Limit Analysis-based methods, easily spread among researchers, are still employed in studies like [5,6,7,8,9,10] to determine the ultimate load-bearing capacity of brick-made members. The related approaches are particularly effective in reproducing masonry flexural failure modes (the most frequent), assuming a perfectly rigid material (with no crushing in compression nor tensile cracks in the units). As a result, masonry is typically modeled as a no-tension material, ensuring a more conservative design. Both lower- and upper-bound formulations of LA efficiently estimate the structural ultimate capacity, identify the failure mechanisms, and locate the thrust lines [11,12,13,14]. Nevertheless, LA does not give any information on damage progression, post-peak softening, or displacement predictions. These limitations are generally accepted for arches, balanced by the advantages listed above. However, such drawbacks become crucial when a thorough safety assessment is needed. Therefore, despite its simplicity, limit analysis is generally unsuitable for estimating a single or double-curved structure residual capacity before collapse.
Over the past three decades, the refurbishment of existing buildings has gained prominence and introduced the need to enhance the load-bearing capacity of arches and vaults without altering their appearance [15,16,17,18,19,20,21]. Assessing the structural capacity and eventually designing effective strengthening interventions requires the use of numerical models capable of tracking inelastic strain progression and estimating displacements at collapse, in line with standard displacement-based design practices [22].
Recently, the FE method gained significant popularity for modeling masonry members too [23,24,25,26,27,28,29,30]. It typically employs a macro-modeling approach, representing masonry as an equivalent continuum and determining mechanical properties through experimental testing or homogenization techniques. User-friendly mesh generation tools in commercial software have expanded the use of FEM from research to engineering practice applications. However, several limitations persist, like the unrealistic isotropic and continuous material assumption, which cannot represent the actual heterogeneous and anisotropic nature of masonry composites. FE approach results are also heavily influenced by the accuracy of constitutive laws, material parameters, and boundary conditions. Additionally, such types of models are complex, mesh-dependent, and often require the implementation of ad-hoc constitutive laws [31].
On the other hand, DE models represent brickwork as an assembly of distinct units, following a micro-modeling approach. Mortar joints are modeled as zero-thickness interfaces between blocks, serving as primary zones for tensile and shear cracking. The interfaces are characterized by a nonlinear relationship between contact forces and relative displacements, while the blocks are typically treated as either rigid or elastic bodies. Nonlinear analyses are performed through an explicit time-domain integration procedure. While aptly capturing the relationship between geometry and mechanical properties of masonry members, DE computational demand often restricts its use for large-scale 3D structures and engineering applications [31,32,33,34,35,36].
In light of the aforementioned statements, according to the technical literature, an ideal numerical model for the stability assessment of masonry curved structures should reproduce the softening behavior (cracking) of mortar joints at least in Mode I (flexural plastic hinges). Therefore, cohesive-frictional models with tension and compression cutoff values shall be used to reproduce the strong non-linearity in the global response of voussoir arches or vaults. A tension cutoff is essential to reproduce cracking failure, with associated plastic strain, whereas a compression cap is not strictly required. Indeed, this can be beneficial for cases with evident material crushing.
Based on the above, a practical and versatile FE-based approach is proposed for the study of single- [37] and double-curvature [38,39] brickwork assemblies by employing the simplest non-linear truss elements available in any commercial software, namely Cutoff Bars (CoBs), thus avoiding the need for complex and expensive software tools. These elements can exhibit a post-elastic behavior, which can be either perfectly brittle or ductile, and require only basic material input. The mechanical parameters involved can be easily calibrated from standard laboratory tests or assumed from literature values, making the method accessible and applicable in real-world design contexts. Mortar joints, subjected to Mode I failure (typical of unreinforced curved members), are therefore modeled with a simplified 2D approach. Elasto-fragile axial CoBs (mutually parallel and passing through the joint thickness) are used to reproduce the flexural behavior of mortar joints, coupled with shear panels or elastic orthotropic elements. The units (bricks) are assumed linear elastic and meshed with four-node plate FEs [37].
By leveraging the widespread availability and simplicity of nonlinear truss formulations in commercial FE software, this approach enables the analysis of complex case studies using simple constitutive laws and a limited set of mechanical parameters. It also offers significant flexibility, supporting applications ranging from 2D to 3D problems, including arches and vaults with intricate geometries [38,40].
The paper is organized as follows: the approach is thoroughly discussed in Section 2; Section 3 benchmarks the procedure on two arches and one cloister vault for which various experimental and numerical data are available in the literature; finally, Section 4 reports the conclusions and possible future developments.
2. Modelling Approach
This section deals with the modeling and analysis of two arches and one vault in an FE environment. The method exploited here—as described in the introduction—uses CoBs to model the nonlinear behavior of brickwork joints and obtain a collapse mechanism governed by Mode I failure by incremental analysis. When the CoBs are loaded, they behave as elastic trusses until the axial force is within the predefined tensile and compressive strengths. Three types of CoB elements can be set in a standard FE software: (i) the tension CoB is active in tension up to the cutoff value and inactive in compression; (ii) the compression CoB reverses its activity in relation to the first type; and (iii) the tension–compression CoB, which is always active up to predetermined cutoff values. As soon as the axial force exceeds the strength limits, the elements behave either as elastic, perfectly plastic, or brittle. In the ductile case, the bar yields, entering a perfect plastic field and showing an infinite fracture energy (see Figure 1a). In the brittle case, the bar fails, ceasing to resist the axial load, and the axial force in the element drops to zero (see Figure 1b).
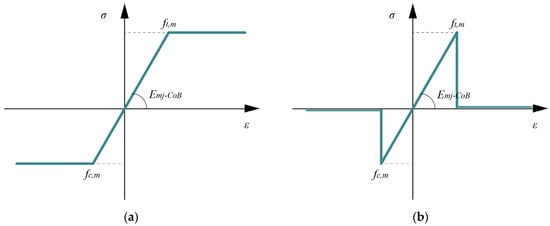
Figure 1.
Stress–strain (σ-ε) curves for CoBs perfectly (a) plastic and (b) brittle behavior.
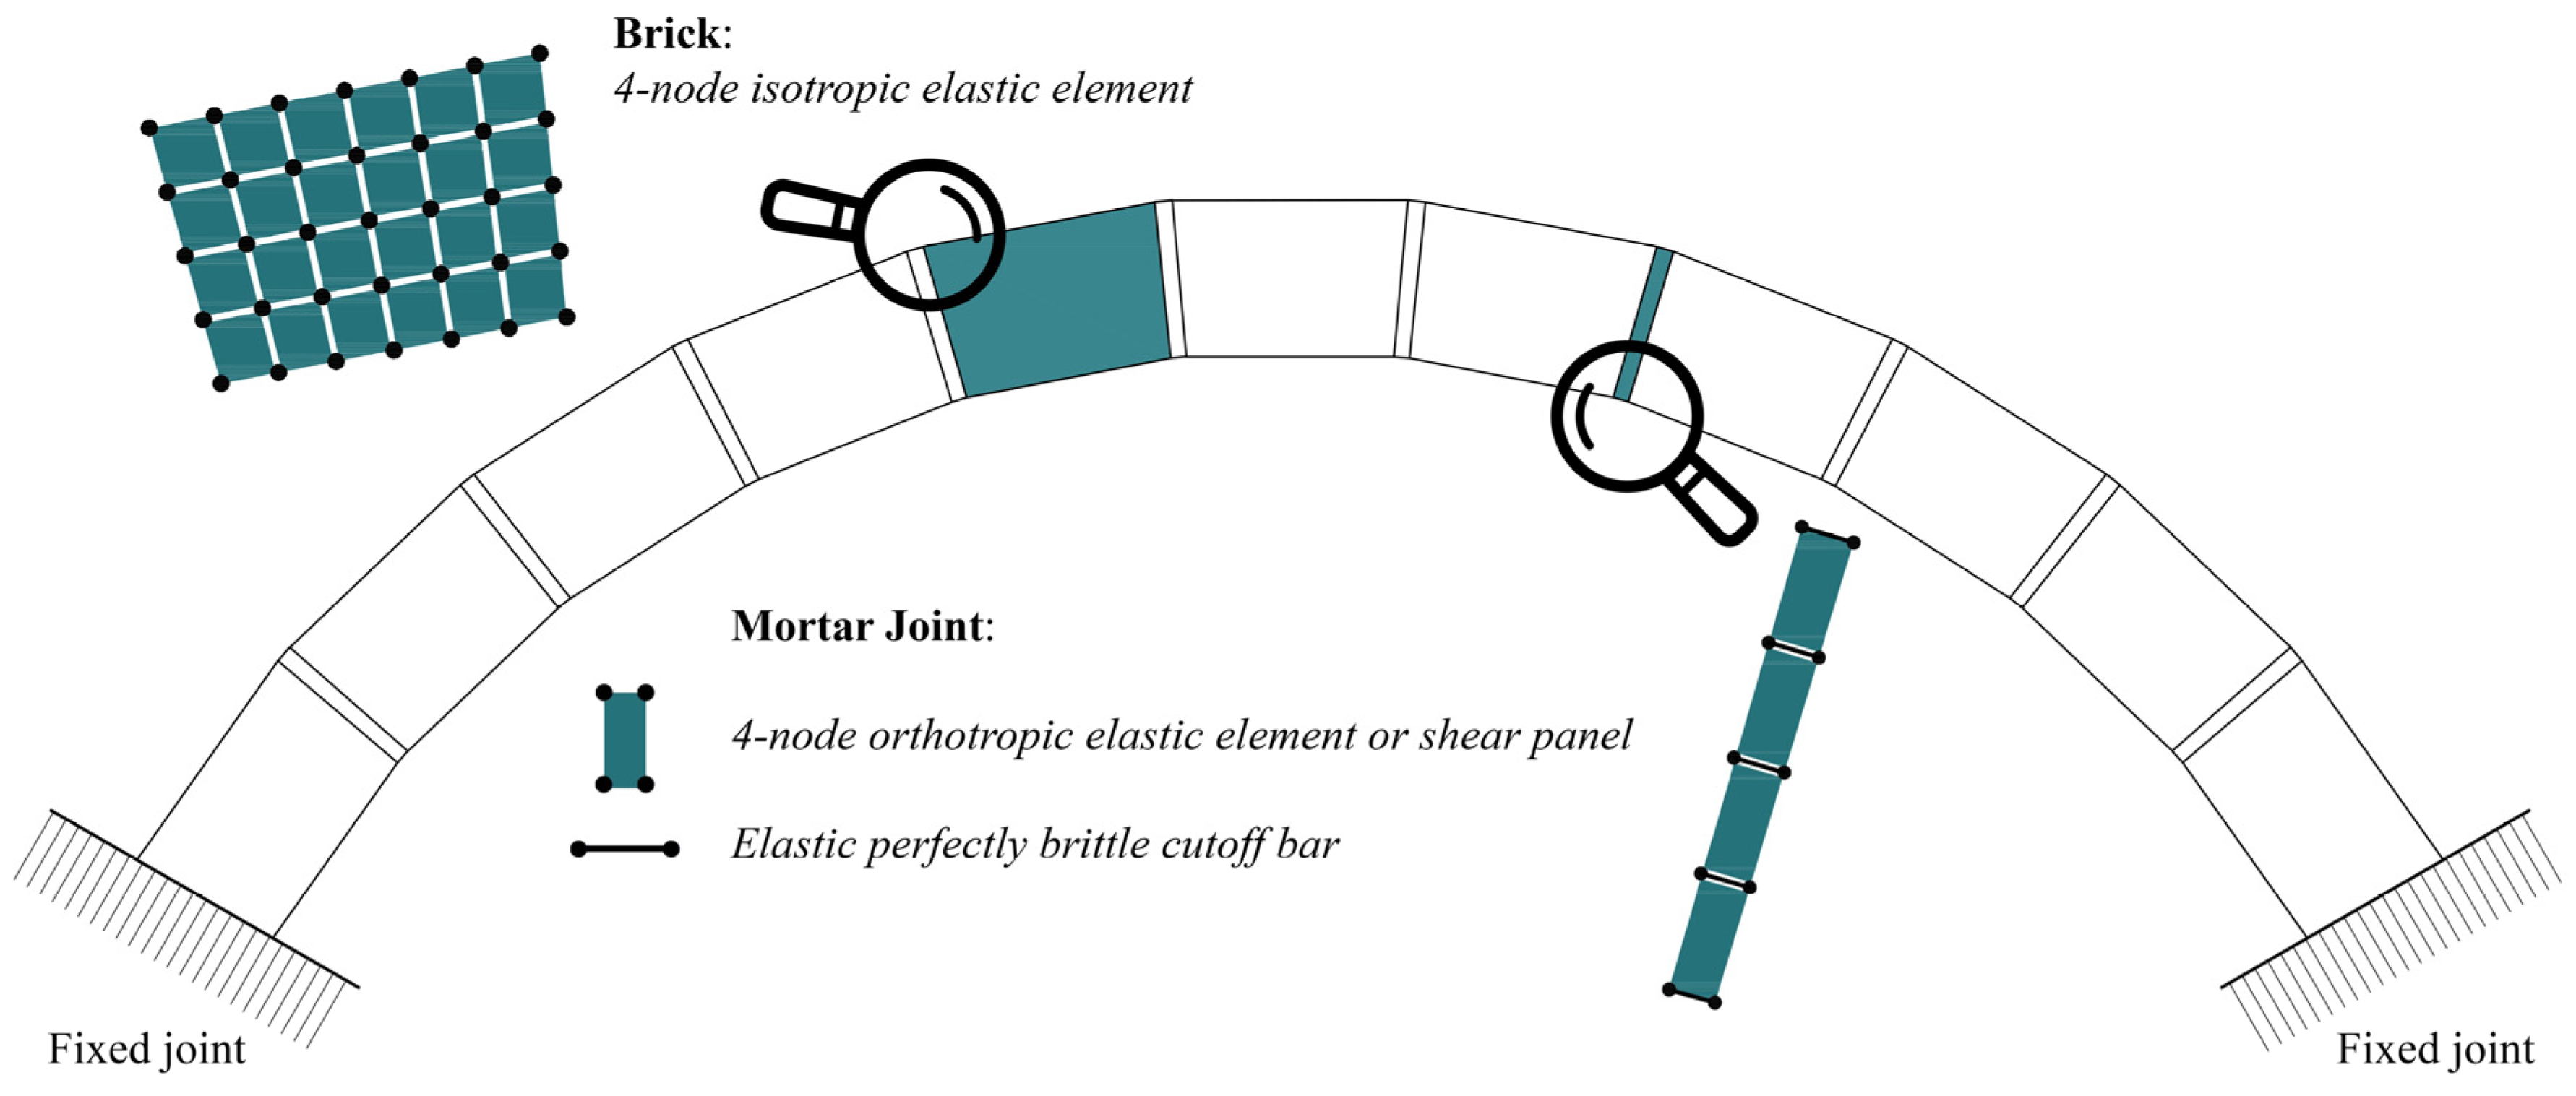
Such an FE procedure lumps the non-linearities of masonry exclusively inside the joints, i.e., in the axial CoBs, as deeply discussed in [37]. Hence, to pursue a pure Mode I failure, the structures are heterogeneously discretized with elastic bricks connected by nonlinear CoB joints (a scheme that represents the mesh in Figure 2).
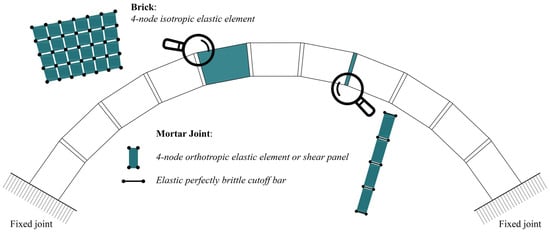
Figure 2.
FE model discretization of a sample arch.
For small structures or single members, brick elements may represent one or a couple of real bricks (see Section 3.1 and Section 3.2) and the joints mimic the real ones. In larger structural models (Section 3.3), elastic bricks may gather larger portions of masonry and joints become fictitious interfaces. Bricks are modeled with four-node elastic plane-strain elements, which require setting only the elastic modulus , Poisson’s ratio , and the material density .
Mortar joints are modeled, coupling axial CoBs (perpendicular to the joint main direction) with elastic orthotropic four-node plane-strain elements, with null Young’s modulus and non-zero shear modulus, or shear panels. If the user chooses orthotropic plate elements, the joint shear modulus ( should be defined, whereas in the case of shear panels, the shear modulus (), Poisson’s ratio , and the density shall be added. The useful CoB properties are the threshold values for tensile () and compressive () strength and Young’s modulus ().
The use of the aforementioned four-node elements coupled with CoBs enables the consideration of bending behavior only and excludes inelastic sliding. Indeed, this assumption agrees with the third of Heyman’s hypothesis, allowing for Mode I failure, characterized by the formation of flexural plastic hinges.
The modeling approach is tailored for the analysis of curved unreinforced masonry structures (arches and vaults), which typically fail in Mode I (flexural collapse). In this context, the damage evolution is captured through the progressive formation of flexural hinges at mortar joints, a feature described via brittle Cutoff Bars (CoBs) that deactivate once their tensile strength is exceeded. While this choice limits the ability to simulate diffuse cracking associated with more ductile behavior, it precisely captures the peak load of the structure, which is otherwise overestimated when perfectly ductile CoBs are used.
It is important to acknowledge the current limitations of the proposed modeling strategy. At this stage, the approach deliberately accounts only for Mode I (flexural) failure and neglects other possible mechanisms such as Mode II (sliding along joints) and Mode III (crushing of mortar). While this assumption is reasonable for unreinforced arches and vaults, it may limit applicability in cases of reinforced curved structures, different geometries (such as masonry walls), or various loading scenarios (e.g., masonry triplet test). Moreover, only non-linear static analyses can be addressed. Indeed, CoBs do not account for cumulated damage occurring when a non-linear dynamic analysis is performed. The extension of the modeling framework to Modes II and III, possible in principle, is planned for future works. Concerning the present model, the simplification aligns with the primary goal of developing a speedy and accessible tool for practitioners and researchers focused on structures where flexural failure is dominant.
Moreover, the model sensitivity to some of the involved mechanical parameters—especially the tensile strength of mortar joints or the backfill properties—suggests that, in the absence of experimental data, a preliminary sensitivity analysis is recommended to assess the robustness of the predictions.
3. Validation
The approach described in the previous section is applied to three benchmark structures, namely two arches and a cloister vault. The first benchmark, the Novi Ligure arch, is calibrated using the same mechanical parameters experimentally determined and reported in [41]. Similarly, the second benchmark, the Universidad del País Vasco arch, adopts material properties derived from experimental results presented in [42]. Given the reliability demonstrated by the approach in these first two cases, the third benchmark—representing the cloister vault of the former Monastery of Santa Maria della Pace—is calibrated using material parameters prescribed by technical Italian standards [43], consistent with a knowledge level LC1. The authors are currently preparing additional investigations aimed at reaching knowledge level LC2 for this case. The results obtained from the FE nonlinear analyses related to Novi Ligure and Universidad del Pais Vasco arches are compared to the experimental and numerical data available in the technical literature. These comparisons confirm the reliability of the approach, demonstrating satisfactory agreement between the FE models and experimental observations in both global and local behavior.
3.1. The Arch Tested in Novi Ligure
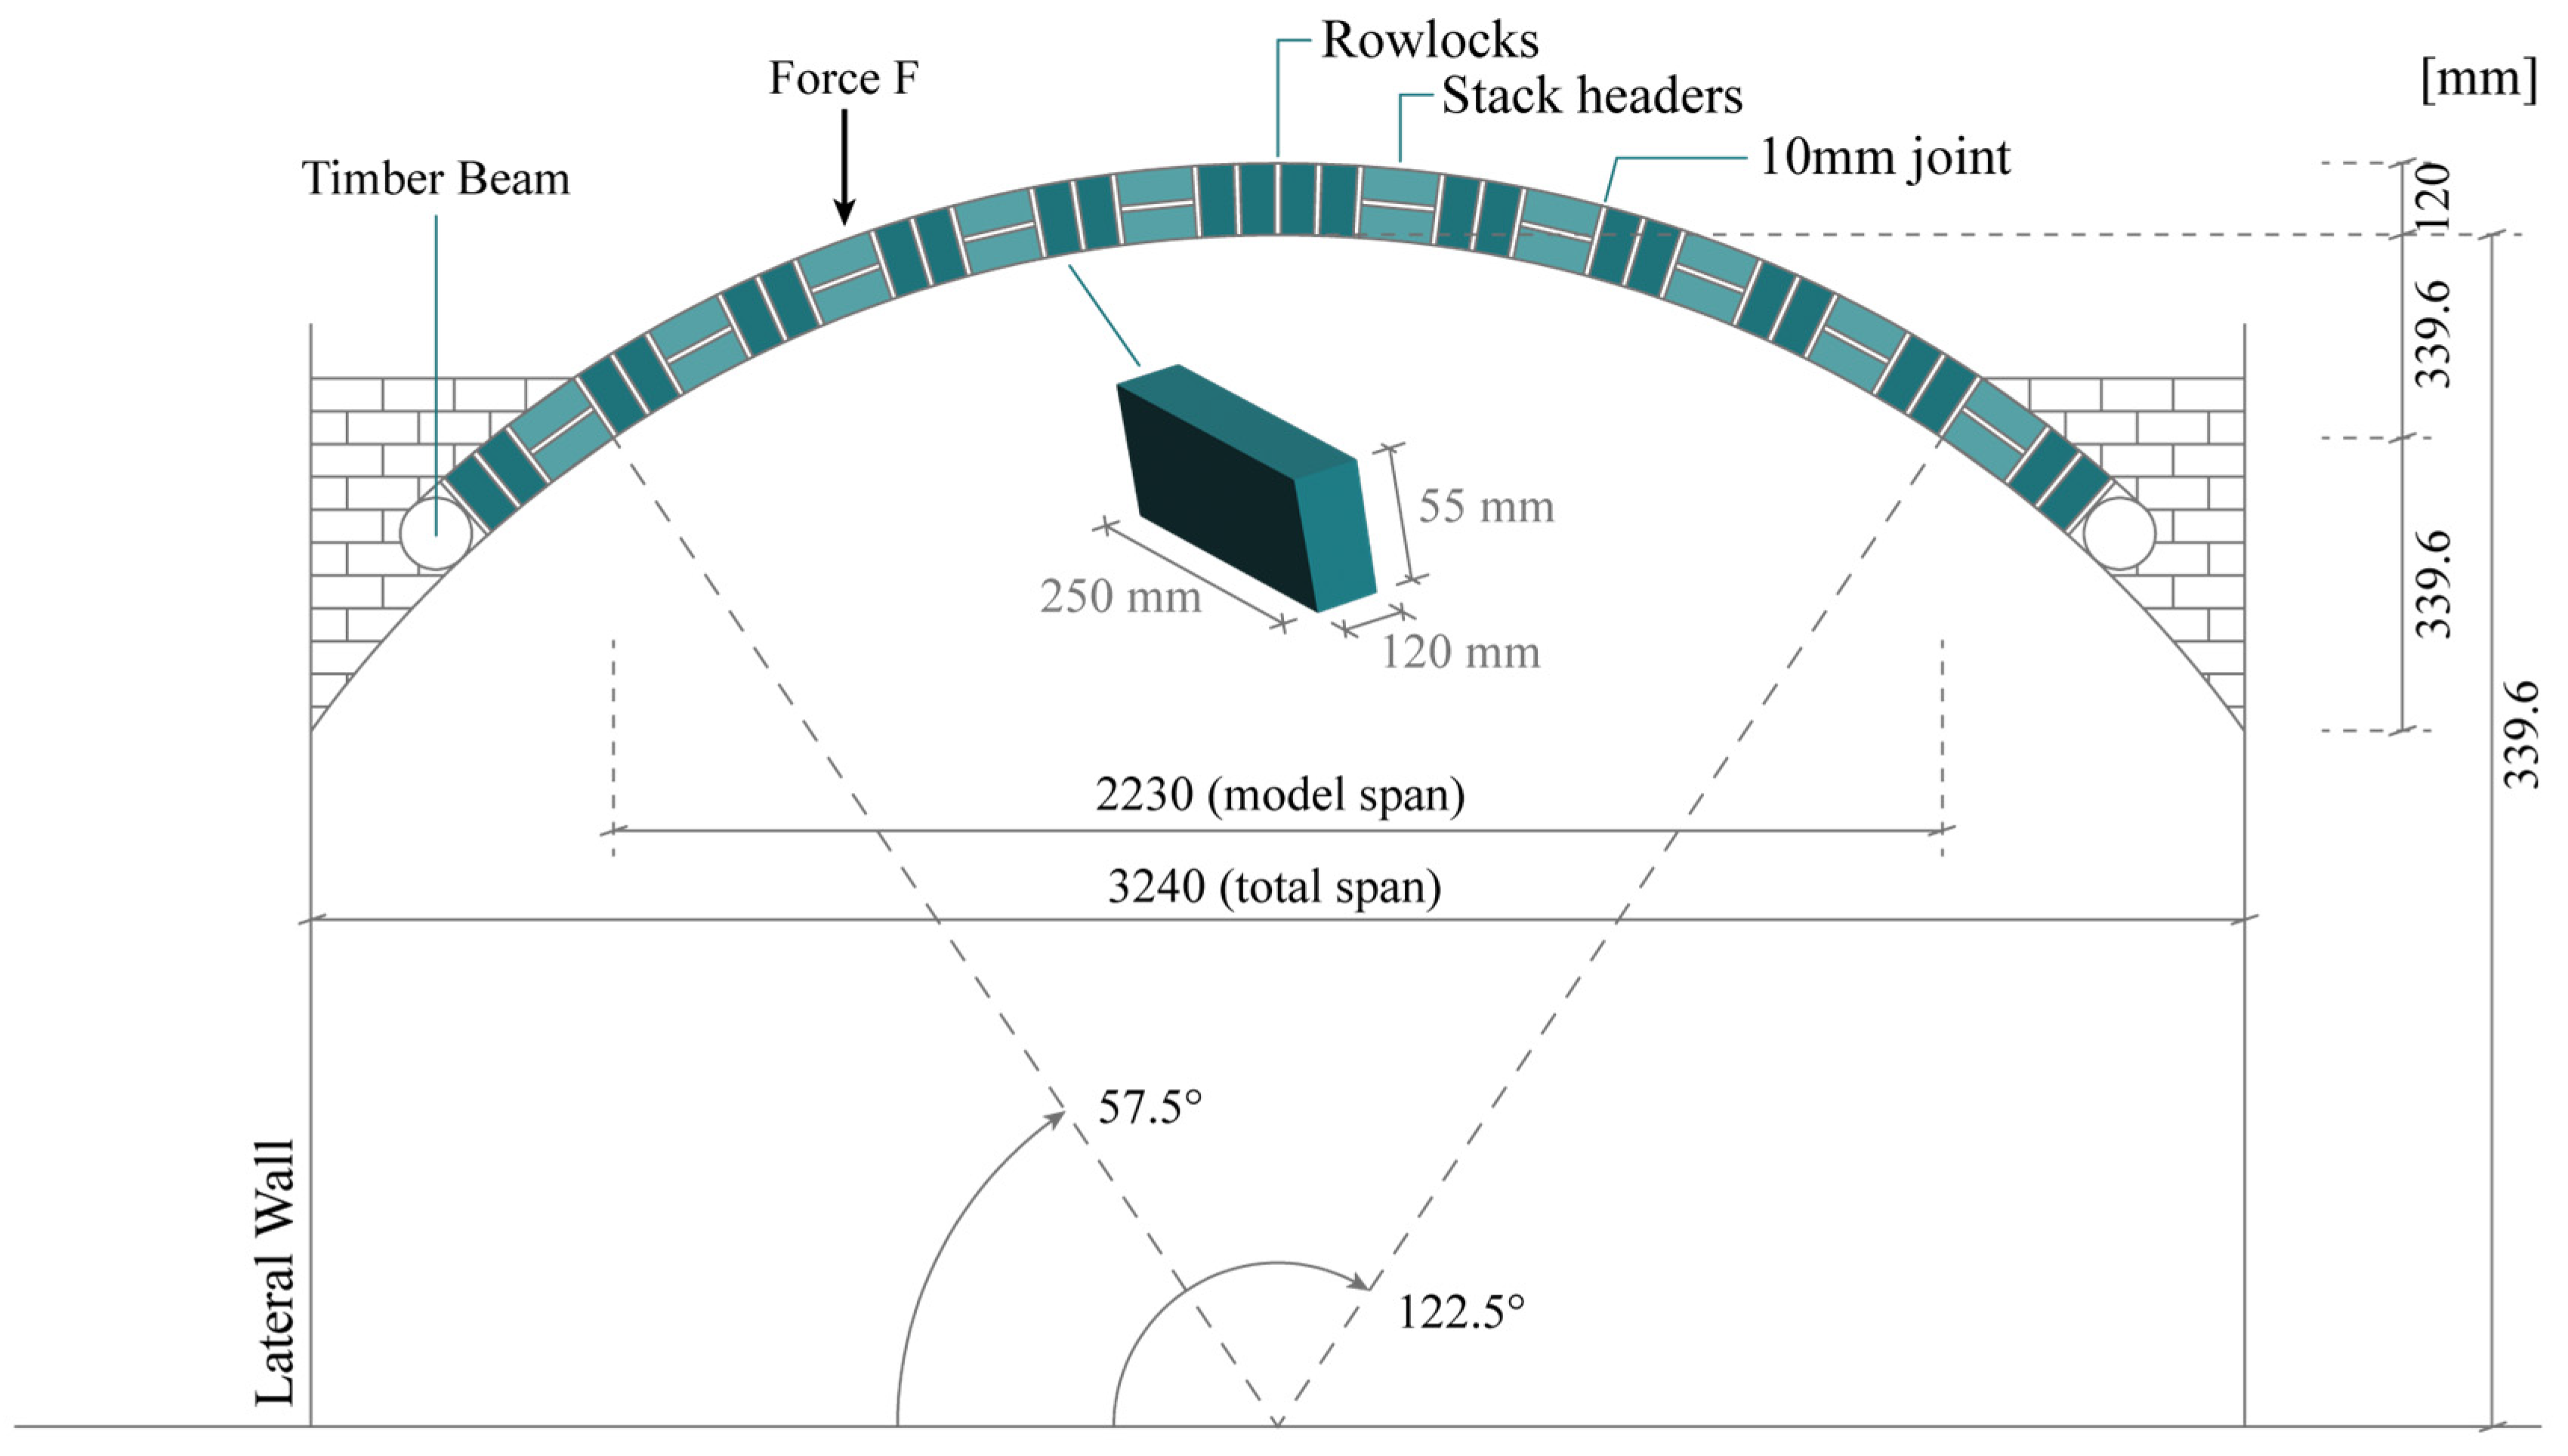
The ancient masonry arch represented in Figure 3 was built in the early 20th century in the countryside close to Novi Ligure, in the Piedmont region (northwestern Italy). The arch has a span of 2.55 m, a rise of 0.83 m, a depth of 0.25 m, and an in-plane thickness equal to 0.12 m. It was built with standard Italian clay bricks (55 × 120 × 250 mm3). Couples of rowlocks were laid alternately with pairs of header-oriented bricks, all bonded by lime mortar joints of 10mm circa. The arch was tested experimentally in [41] and analyzed numerically with an FE and lower-bound limit analysis model in [44].
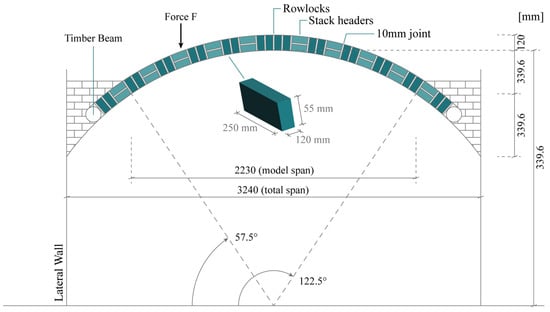
Figure 3.
Geometrical features of the arch tested in Novi Ligure.
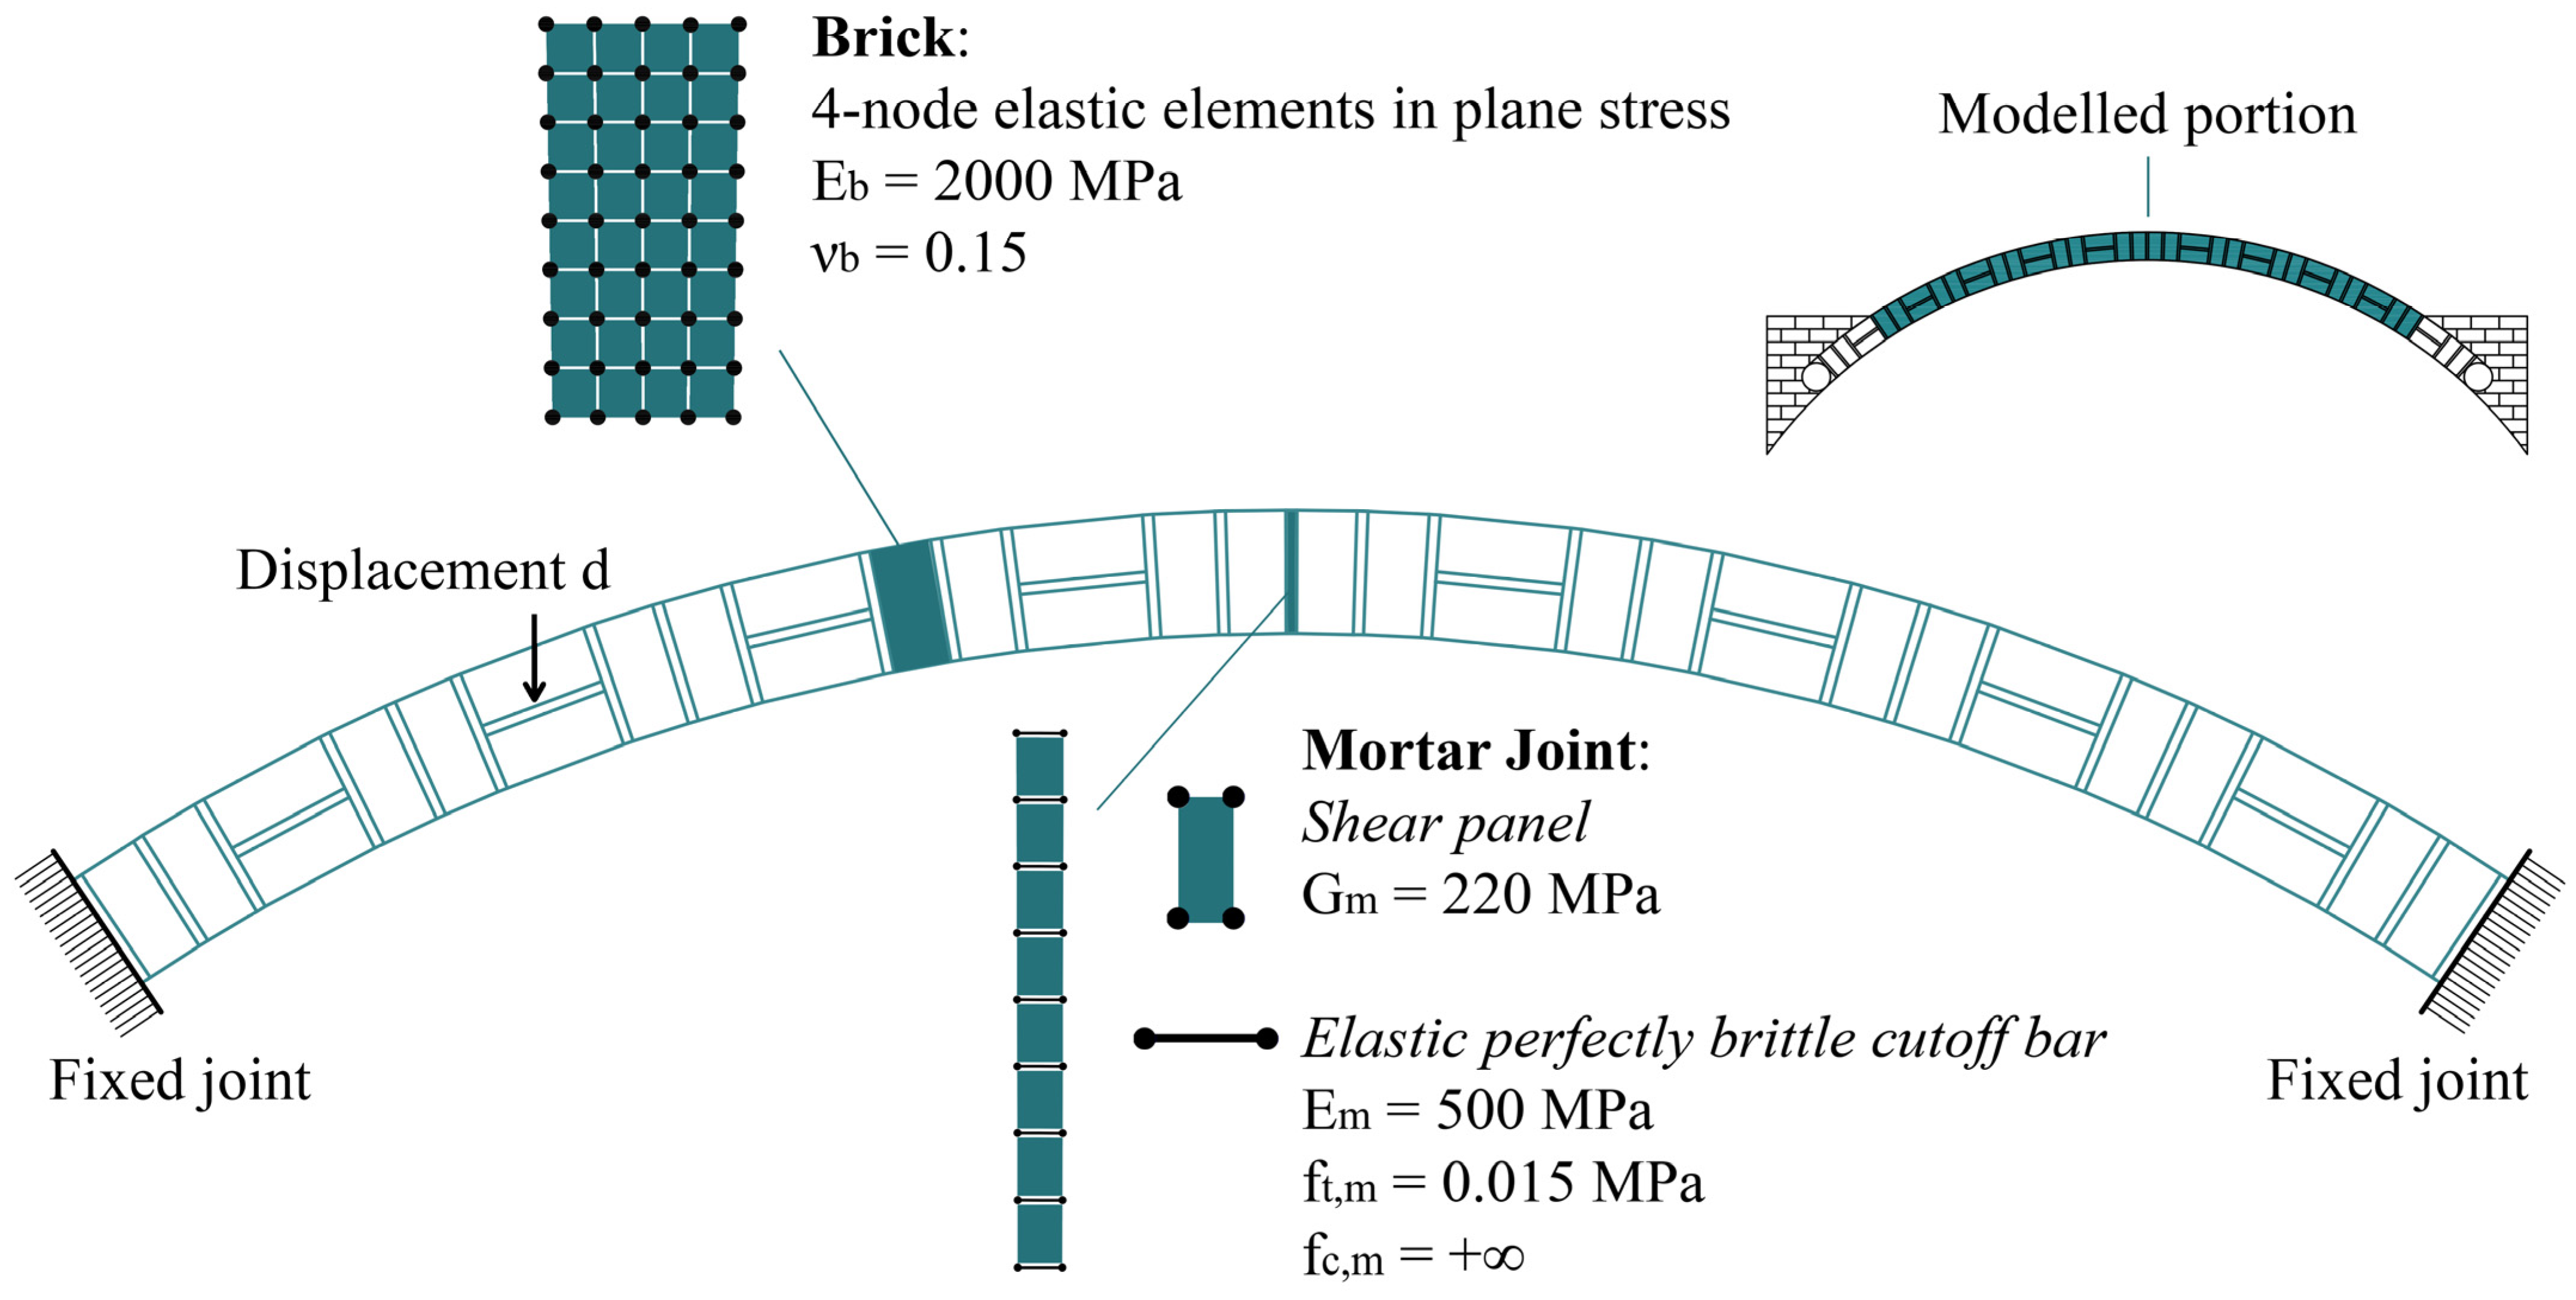
The numerical model of the arch accounts exclusively for Mode I failure. This is justified by the findings in [37], which demonstrated that, in the absence of reinforcement, the arch fails solely through the formation of flexural hinges, as also confirmed by the experimental results in [41]. For this reason, as previously specified, in the FE model, bricks are meshed with quadrilateral elastic elements, whereas shear panels and CoBs guarantee the formation of the expected mechanism. The detailed model configuration is depicted in Figure 4, together with the mechanical properties of the elements involved.
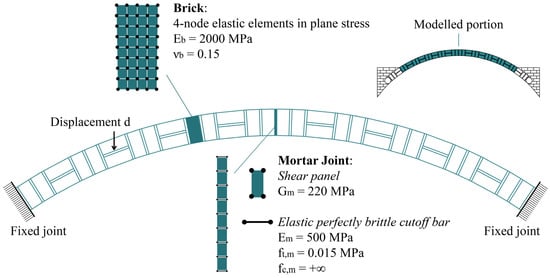
Figure 4.
Novi Ligure arch: FE model details with material properties.
Concerning the CoBs, the infinite compressive strength is assumed in line with Heyman’s first hypothesis, while the limited shear modulus and the tensile strength are calibrated as shown in [37] and according to the experimental data of [41].
The FE analysis is performed by applying the gravity loads, followed by an increasing vertical displacement. The point of application of the imposed displacement is consistent with the position of the vertical force applied during the tests, as represented in Figure 5. A displacement-controlled analysis is preferred over a force-controlled one, as it helps to prevent premature numerical instability, which is common when modeling materials with softening behavior. This approach offers a user-friendly alternative for users with less experience in advanced nonlinear numerical simulations.
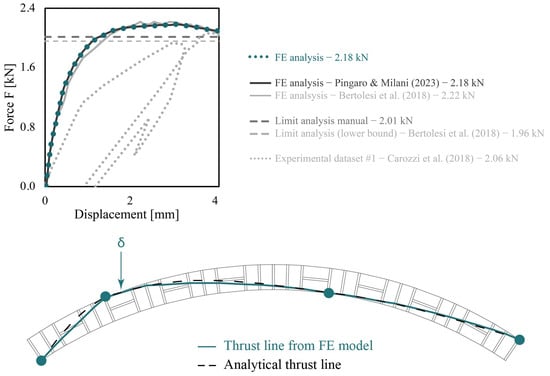
Figure 5.
Novi Ligure Arch: Comparison of numerical and experimental results, thrust line at failure, and location of plastic hinges [37,41,44].
A simplified model of the arch is assumed, and the sections at the springing are fixed (see Figure 4). Such an assumption is justified by the stiffness of the spandrels, which makes the springing of the arch negligible, as demonstrated in [44] and confirmed by the experimental results in [41].
The results of the nonlinear FE analysis are compared to both experimental [41] and previous numerical data [44] in terms of force–displacement curves, taking as a reference one of the three points at which LVDTs were installed (see Figure 5). As shown in Figure 5, the numerical results show good overall agreement with the experimental data, although some discrepancies appear during the initial loading phase. These differences may be attributed to several factors. In fact, the experimental results derived from a single test, and in situ conditions may have introduced variability and unforeseen deformations. Additionally, as the arch was an existing structure, some cracks already present in the mortar joints may have affected its elastic response. As expected, the load–displacement curve obtained from the proposed FE model, which accounts only for Mode I failure, coincides with the results in [37], where both Mode I and Mode II failures were allowed. It is worth noting that the FE simulation also provides valuable insights into both the location and sequence of hinge formation, which define the failure mechanism.
To evaluate the accuracy of the ultimate collapse load predicted by the numerical model, a manual kinematic limit analysis was performed, assuming preassigned hinge positions. The resulting collapse load is illustrated with a dark grey dashed constant line in Figure 5. For the sake of comparison, the collapse load obtained in [44] with lower bound limit analysis is indicated by a light grey dashed line. The agreement between the results is considered satisfactory.
To further quantify the consistency between the proposed FE model and the available data for the Novi Ligure arch, Table 1 summarizes the peak load values and percentage errors concerning both experimental and numerical results available in the literature. The proposed model shows excellent consistency, with a deviation of only +6% from the experimental value and perfect agreement with a previously published FE study. Compared to classic limit analysis methods (both manual and lower-bound), the proposed strategy provides comparable accuracy, while also enabling the prediction of displacement evolution, hinges formation sequence, and post-peak behavior—capabilities that traditional LA lacks. These results confirm the robustness of the method, particularly for structures dominated by Mode I failure mechanisms. However, the model still does not capture Mode II (sliding) or Mode III (crushing) phenomena, which should be considered in various loading conditions and different geometries.

Table 1.
Novi Ligure Arch: Peak load difference between the present model and the results from the literature.
The present numerical analysis also enables the determination of the thrust line in the post-processing phase, as shown in Figure 5. The expected four plastic hinges are identified: one at the extrados beneath the concentrated load, one for each springing (one at the extrados on the right and one at the intrados on the left), and a fourth located approximately one-quarter of the span on the right side of the keystone.
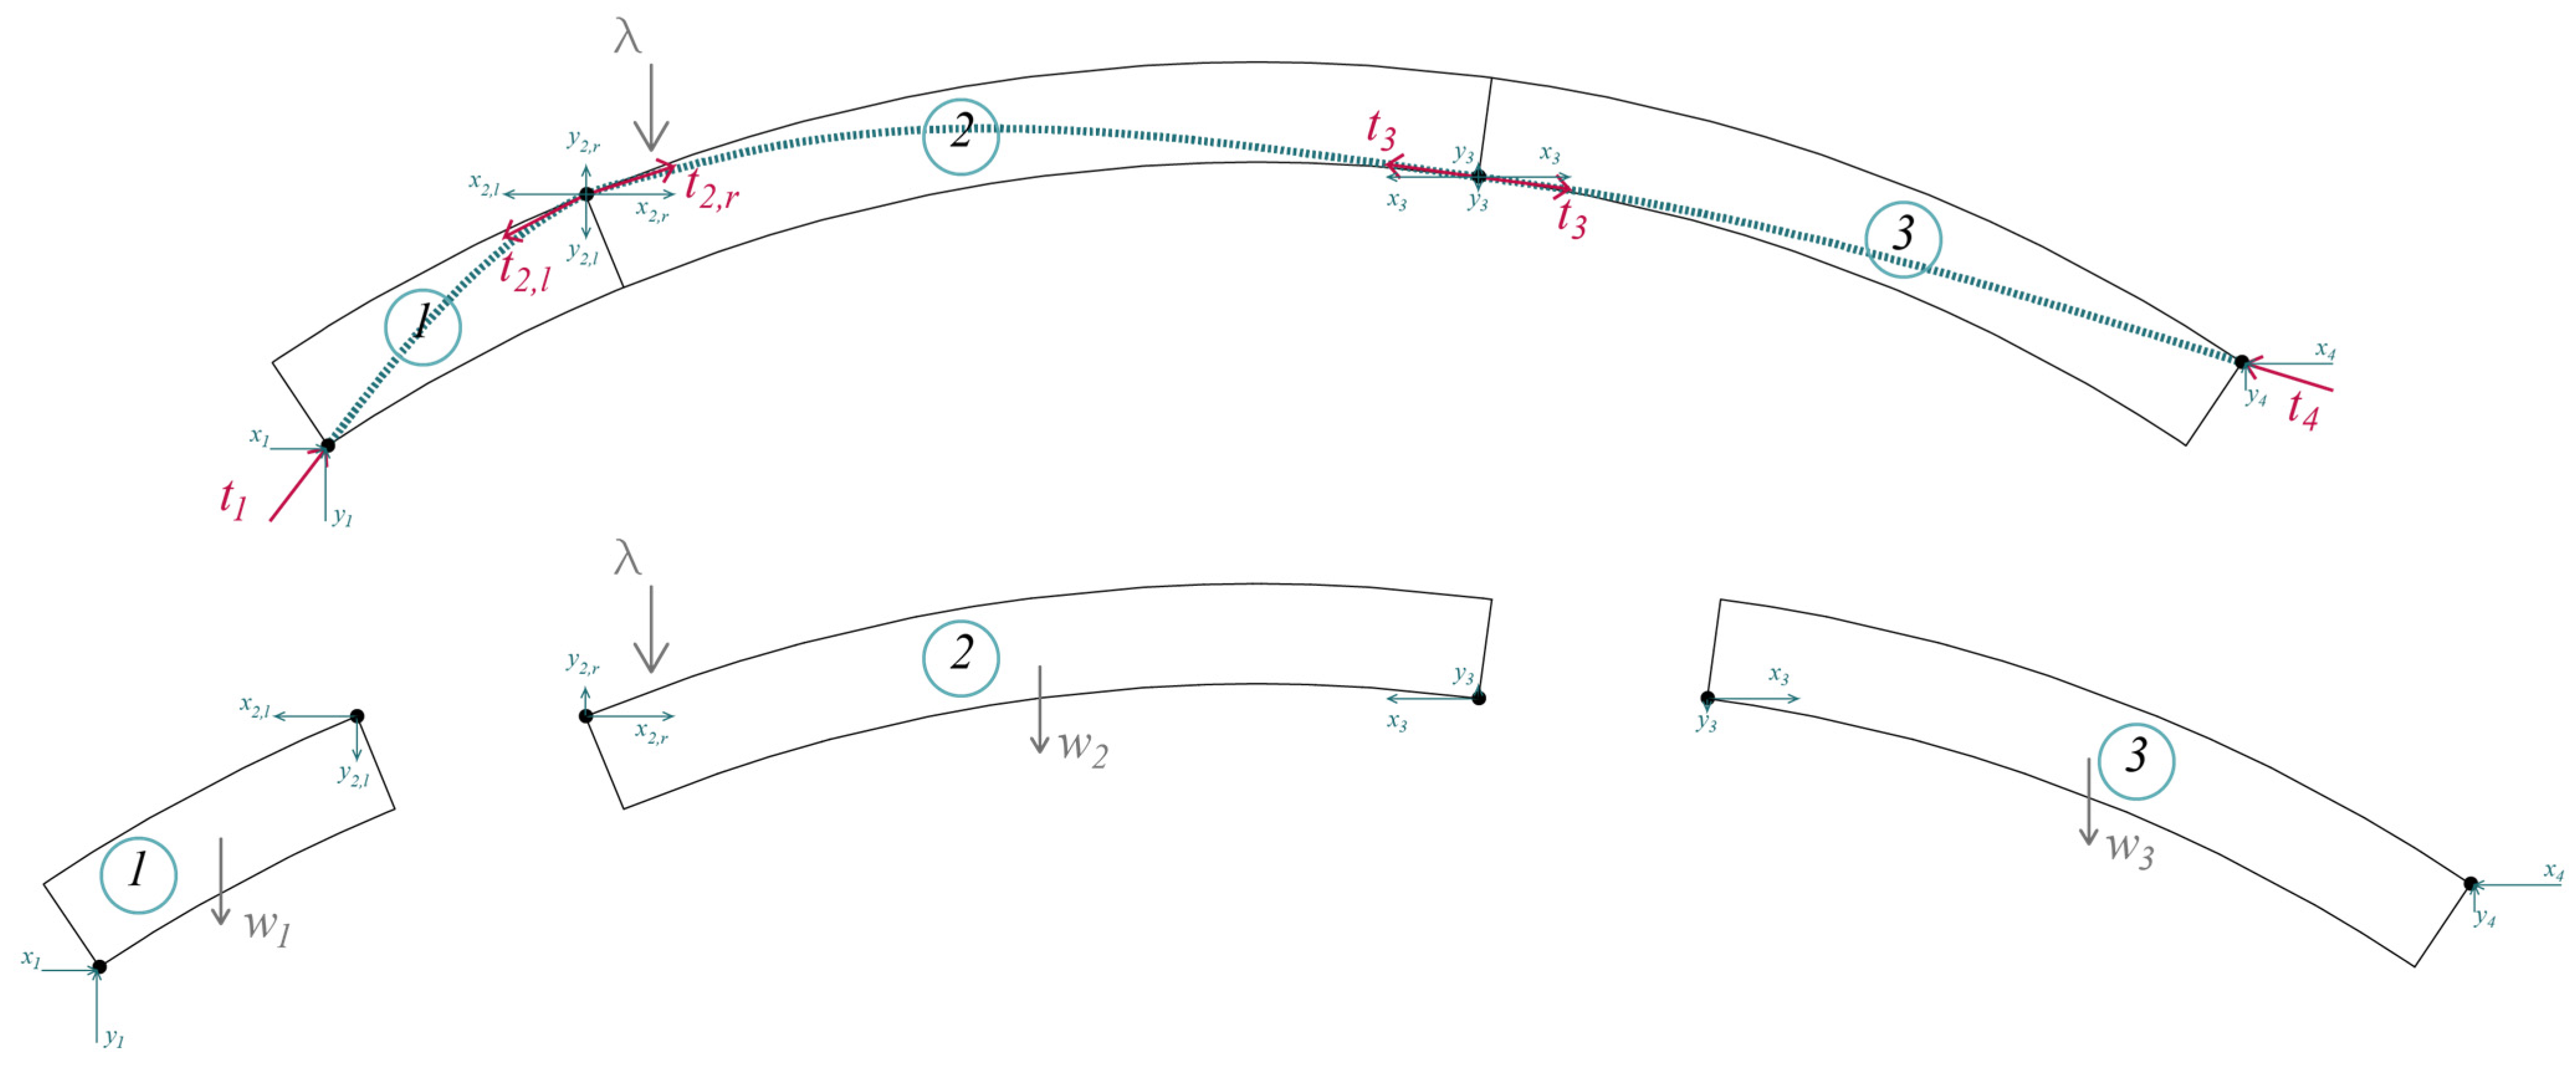
The thrust line is obtained through a post-processing procedure that integrates the axial forces in each Cutoff Bar across the area of its corresponding joint [37,41]. In fact, a weighted average based on the eccentricity of the axial forces is performed. This enables the reconstruction of the internal load path, consistent with the formation of plastic hinges. For comparison, a thrust line derived via analytical solution based on equilibrium between macroblocks is also plotted in black in Figure 5. As shown in Figure 6, the macroblocks are defined based on the hinge positions obtained from the FE analysis. For each macroblock, the corresponding equilibrium equations are formulated—two translational and one rotational—resulting in a total of nine equations. However, the unknowns depicted in Figure 6 amount to ten. Therefore, an additional equation is required, enforcing the condition that the vectors and , resulting from the sum of components , and , must be equal in magnitude and opposite in direction.
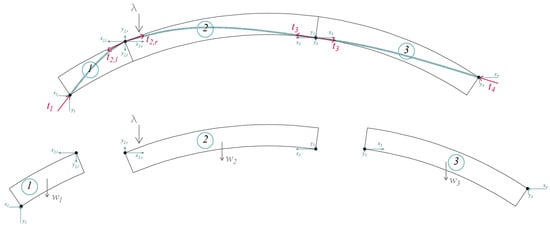
Figure 6.
Analytical procedure used to retrieve the thrust line.
In conclusion, both the thrust line and the collapse load obtained with the present FE model show good agreement with previous studies.
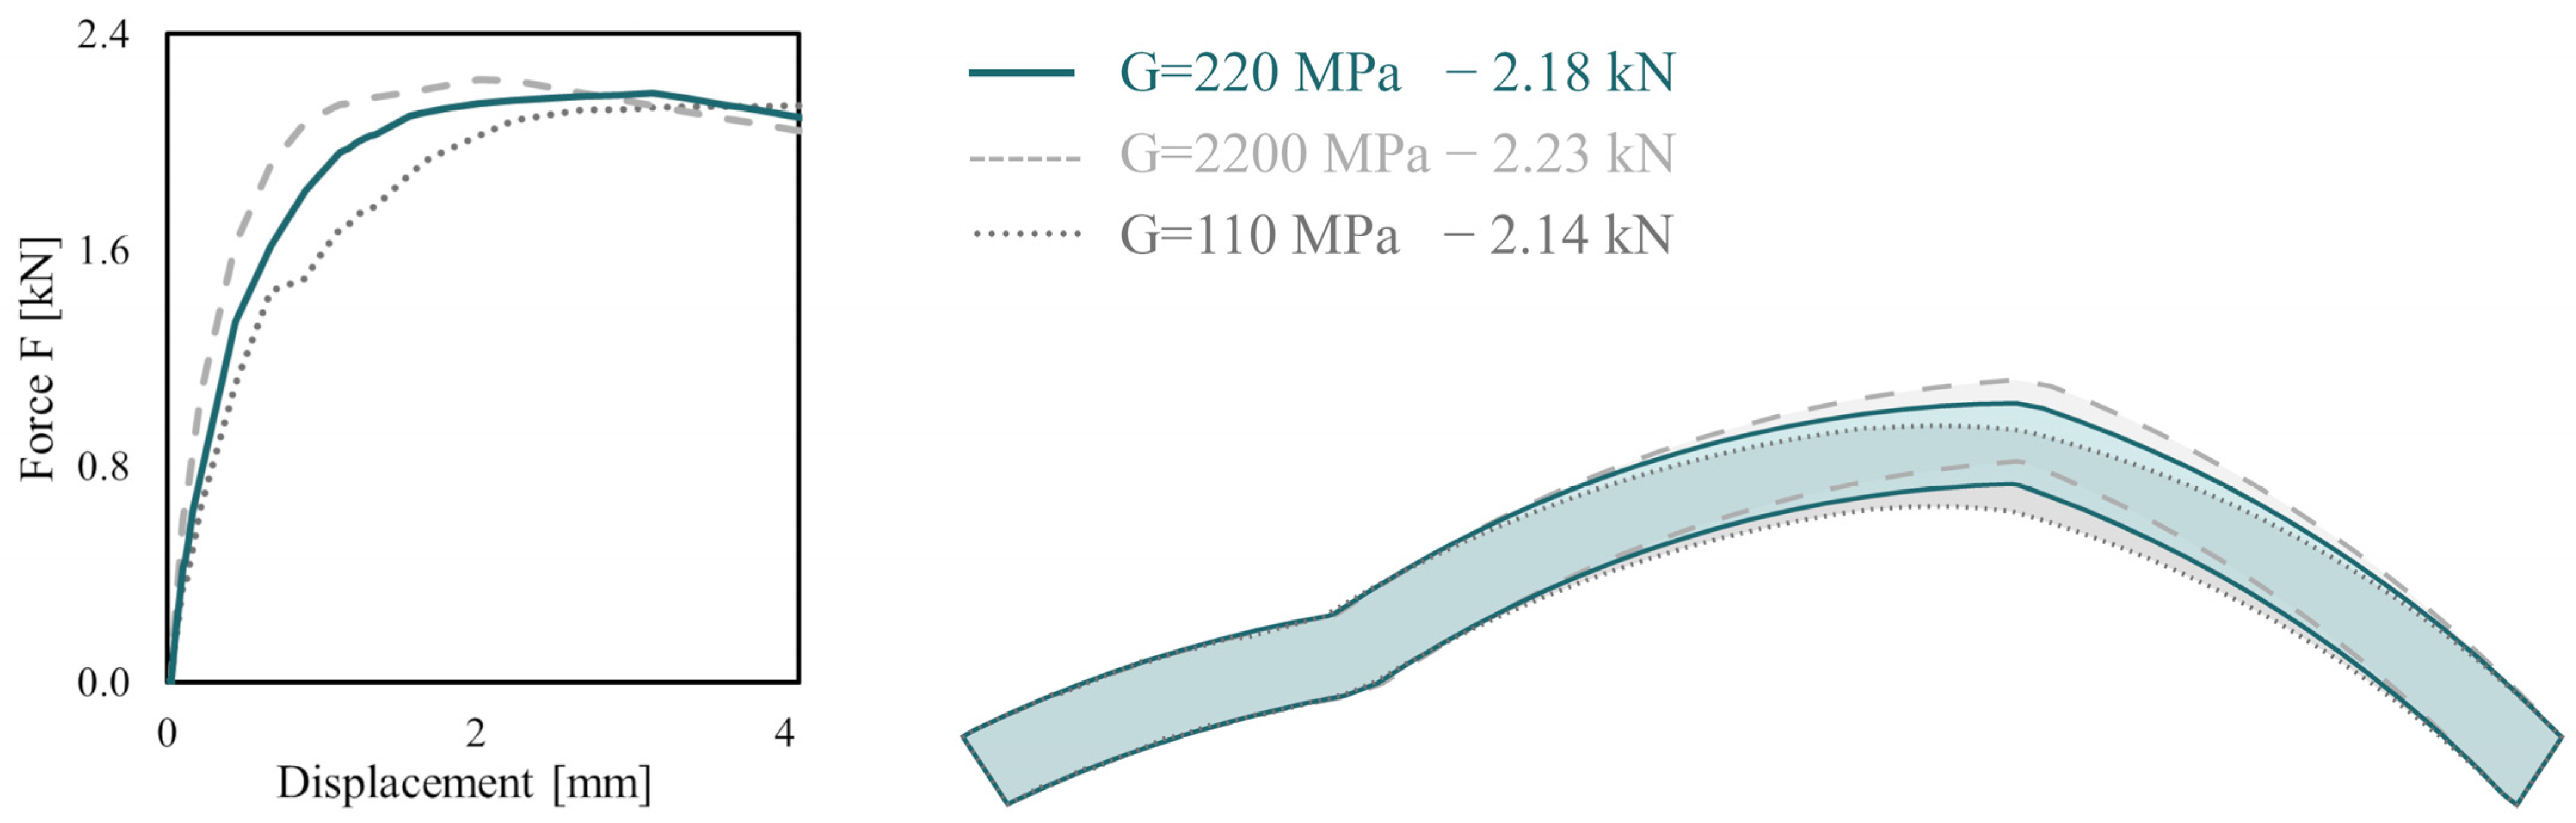
To assess how responsive the model is to the shear panel parameters, a sensitivity analysis is conducted on the shear modulus (G) of these elements. The structural capacity obtained using a shear modulus of 220 MPa is compared with the responses computed assuming G is equal to 10 times and 0.5 times the experimental value, with the elastic modulus of the CoBs adjusted accordingly. As shown in Figure 7, the shear modulus has a limited influence on the structural response in terms of load-bearing capacity. However, the initial elastic stiffness differs in the three cases, as expected. The failure mechanism remains unchanged, although some sliding is observed in the case with the lowest G value in the left portion of the arch. These results suggest that the shear panel parameters should be selected carefully to accurately capture the initial elastic stiffness of the structure. For this reason, a shear modulus of 220 MPa was adopted, in line with experimental data and the technical literature [41].
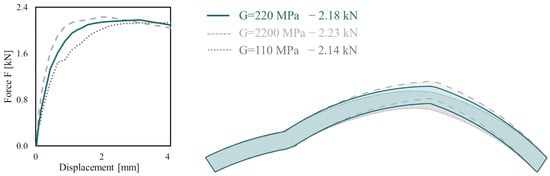
Figure 7.
Novi Ligure Arch: Sensitivity analysis of shear panel parameters.
3.2. The Arch Tested in the Universidad Del Pais Vasco
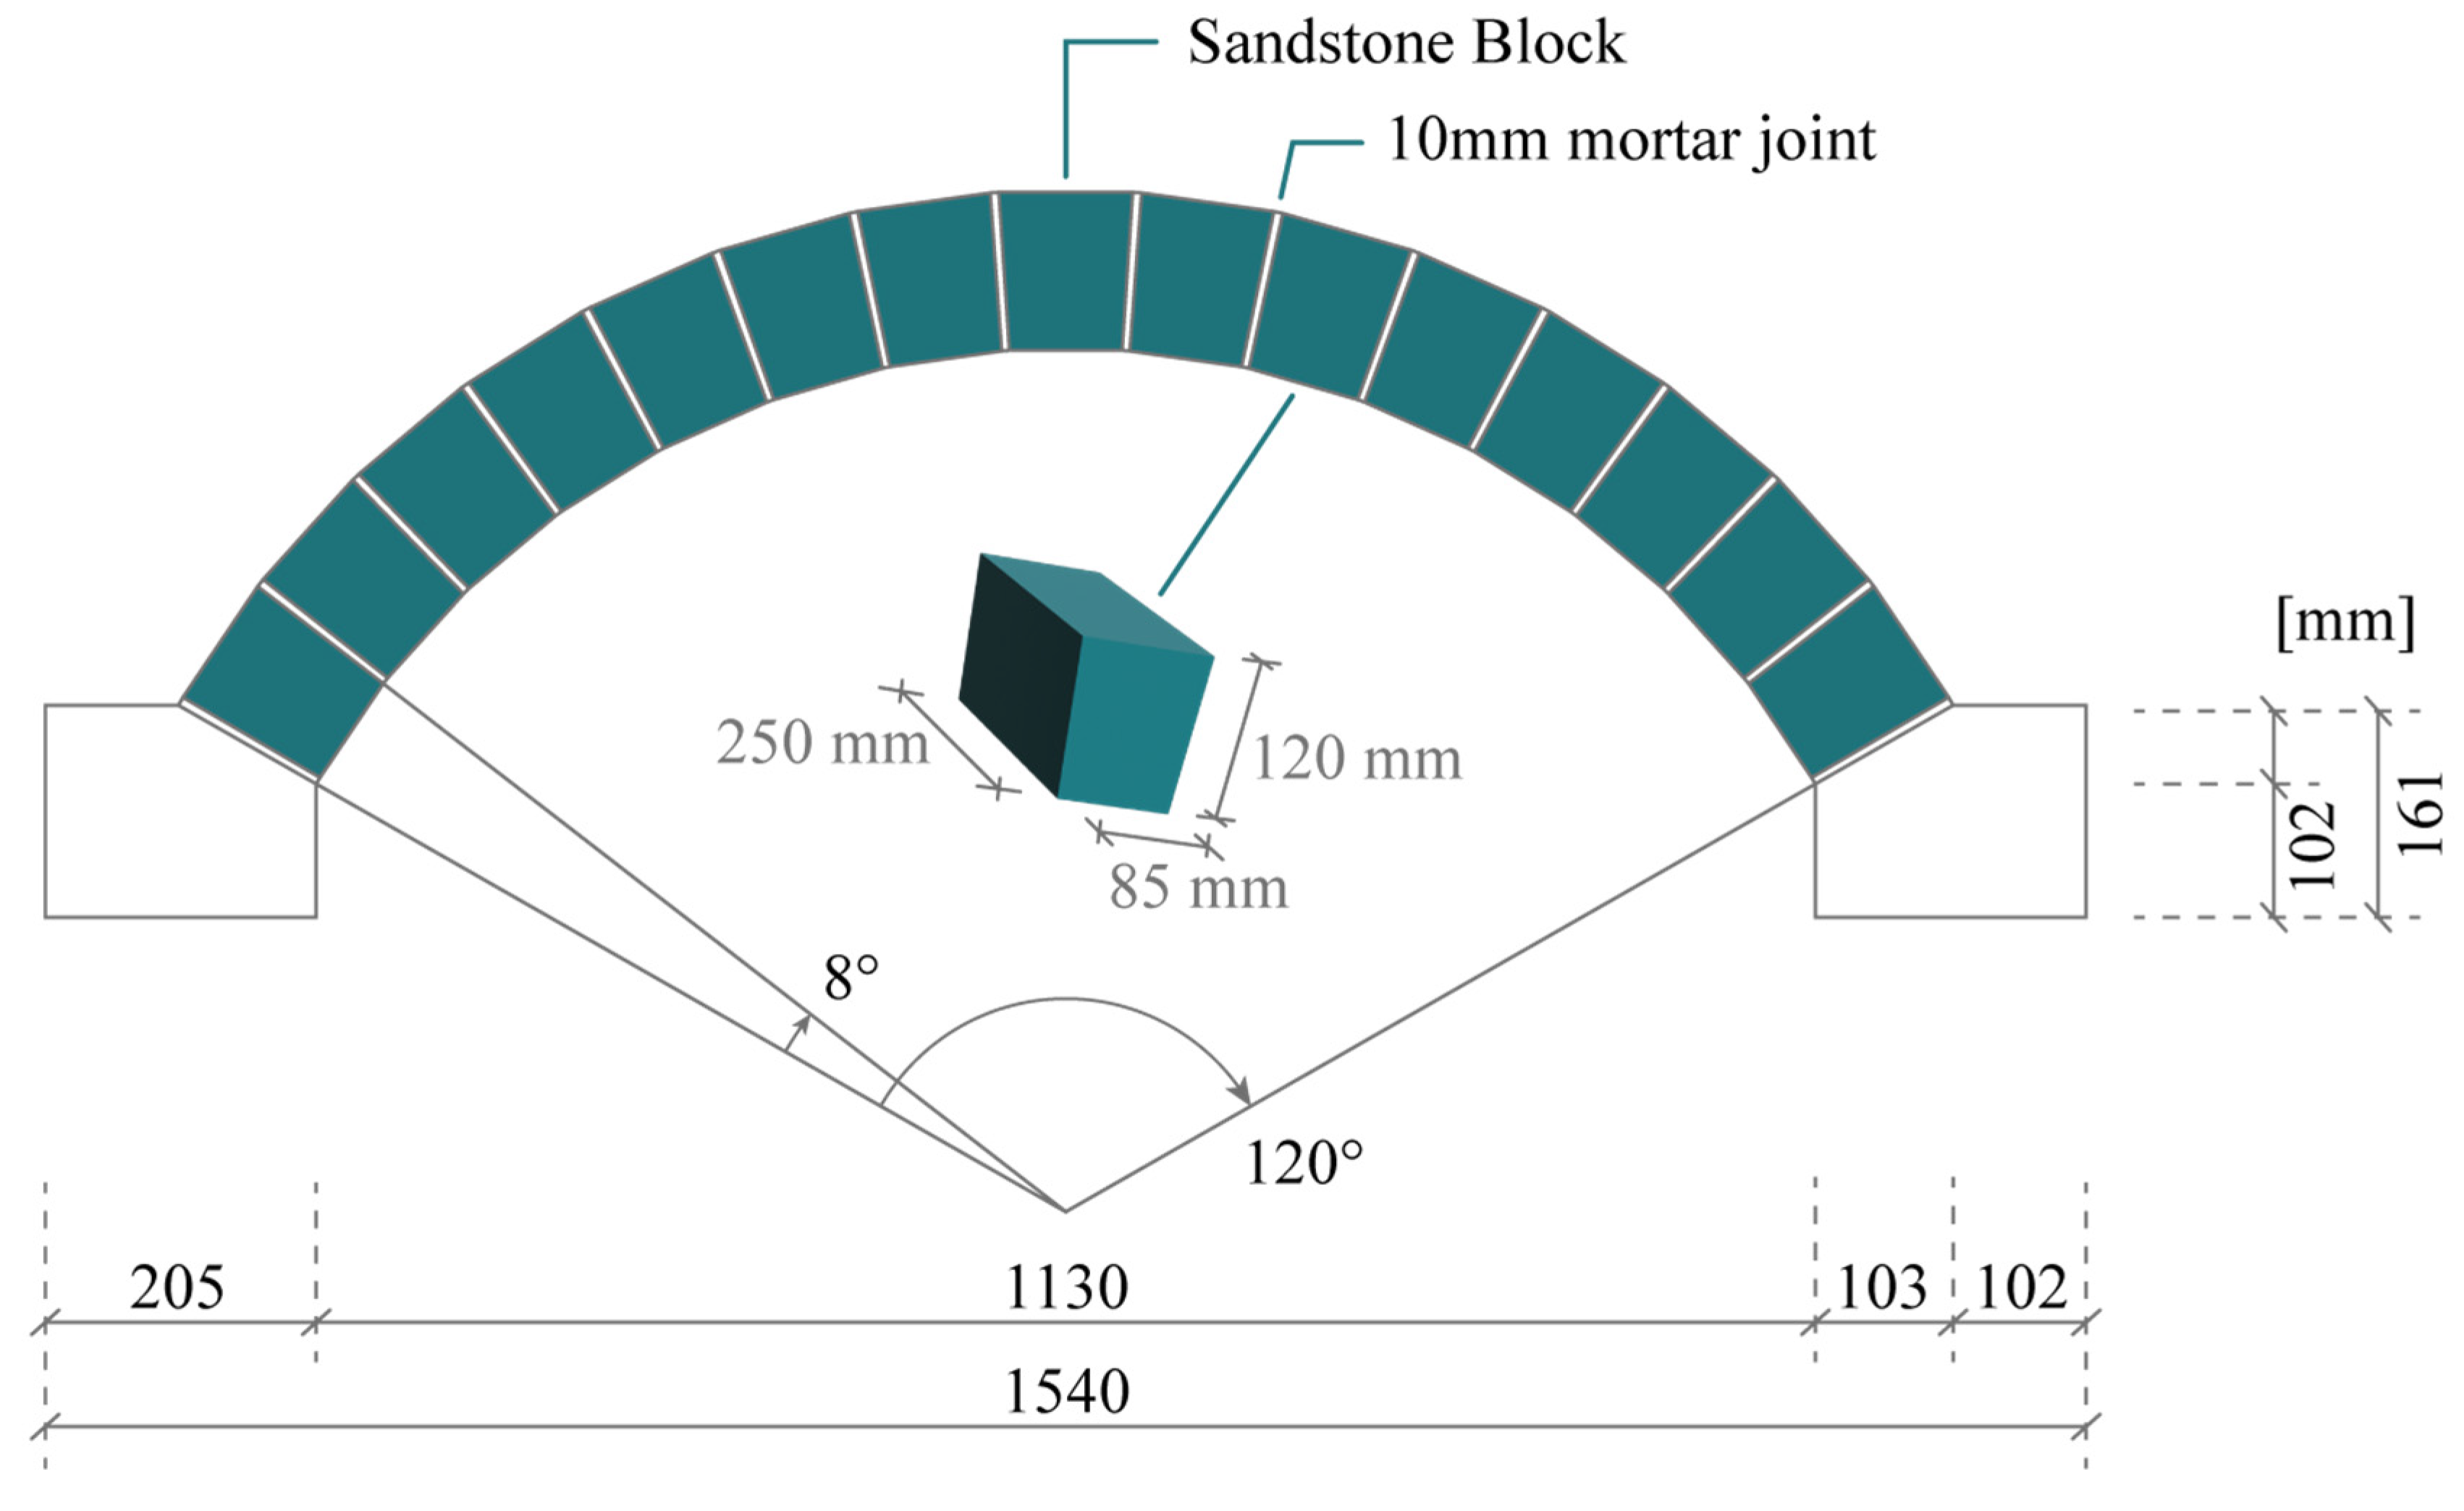
The second benchmark case concerns a laboratory arch tested at the Universidad del Pais Vasco in Spain [42,45]. The arch was assembled using sandstone blocks, specifically Arenisca de Aguilar, a material commonly employed in restoration works in the province of Palencia (Spain). The mortar was selected to perform similarly to that commonly used in the rehabilitation of ancient masonry structures. Figure 8 shows the arch in detail, with a span equal to 1.13 m, a rise of 0.44 m, a depth equal to 0.25 m, and an in-plane thickness of 0.12 m.
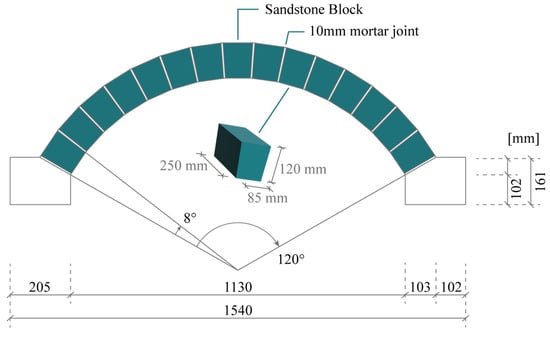
Figure 8.
Geometrical features of the masonry arch tested in the Universidad del Pais Vasco.
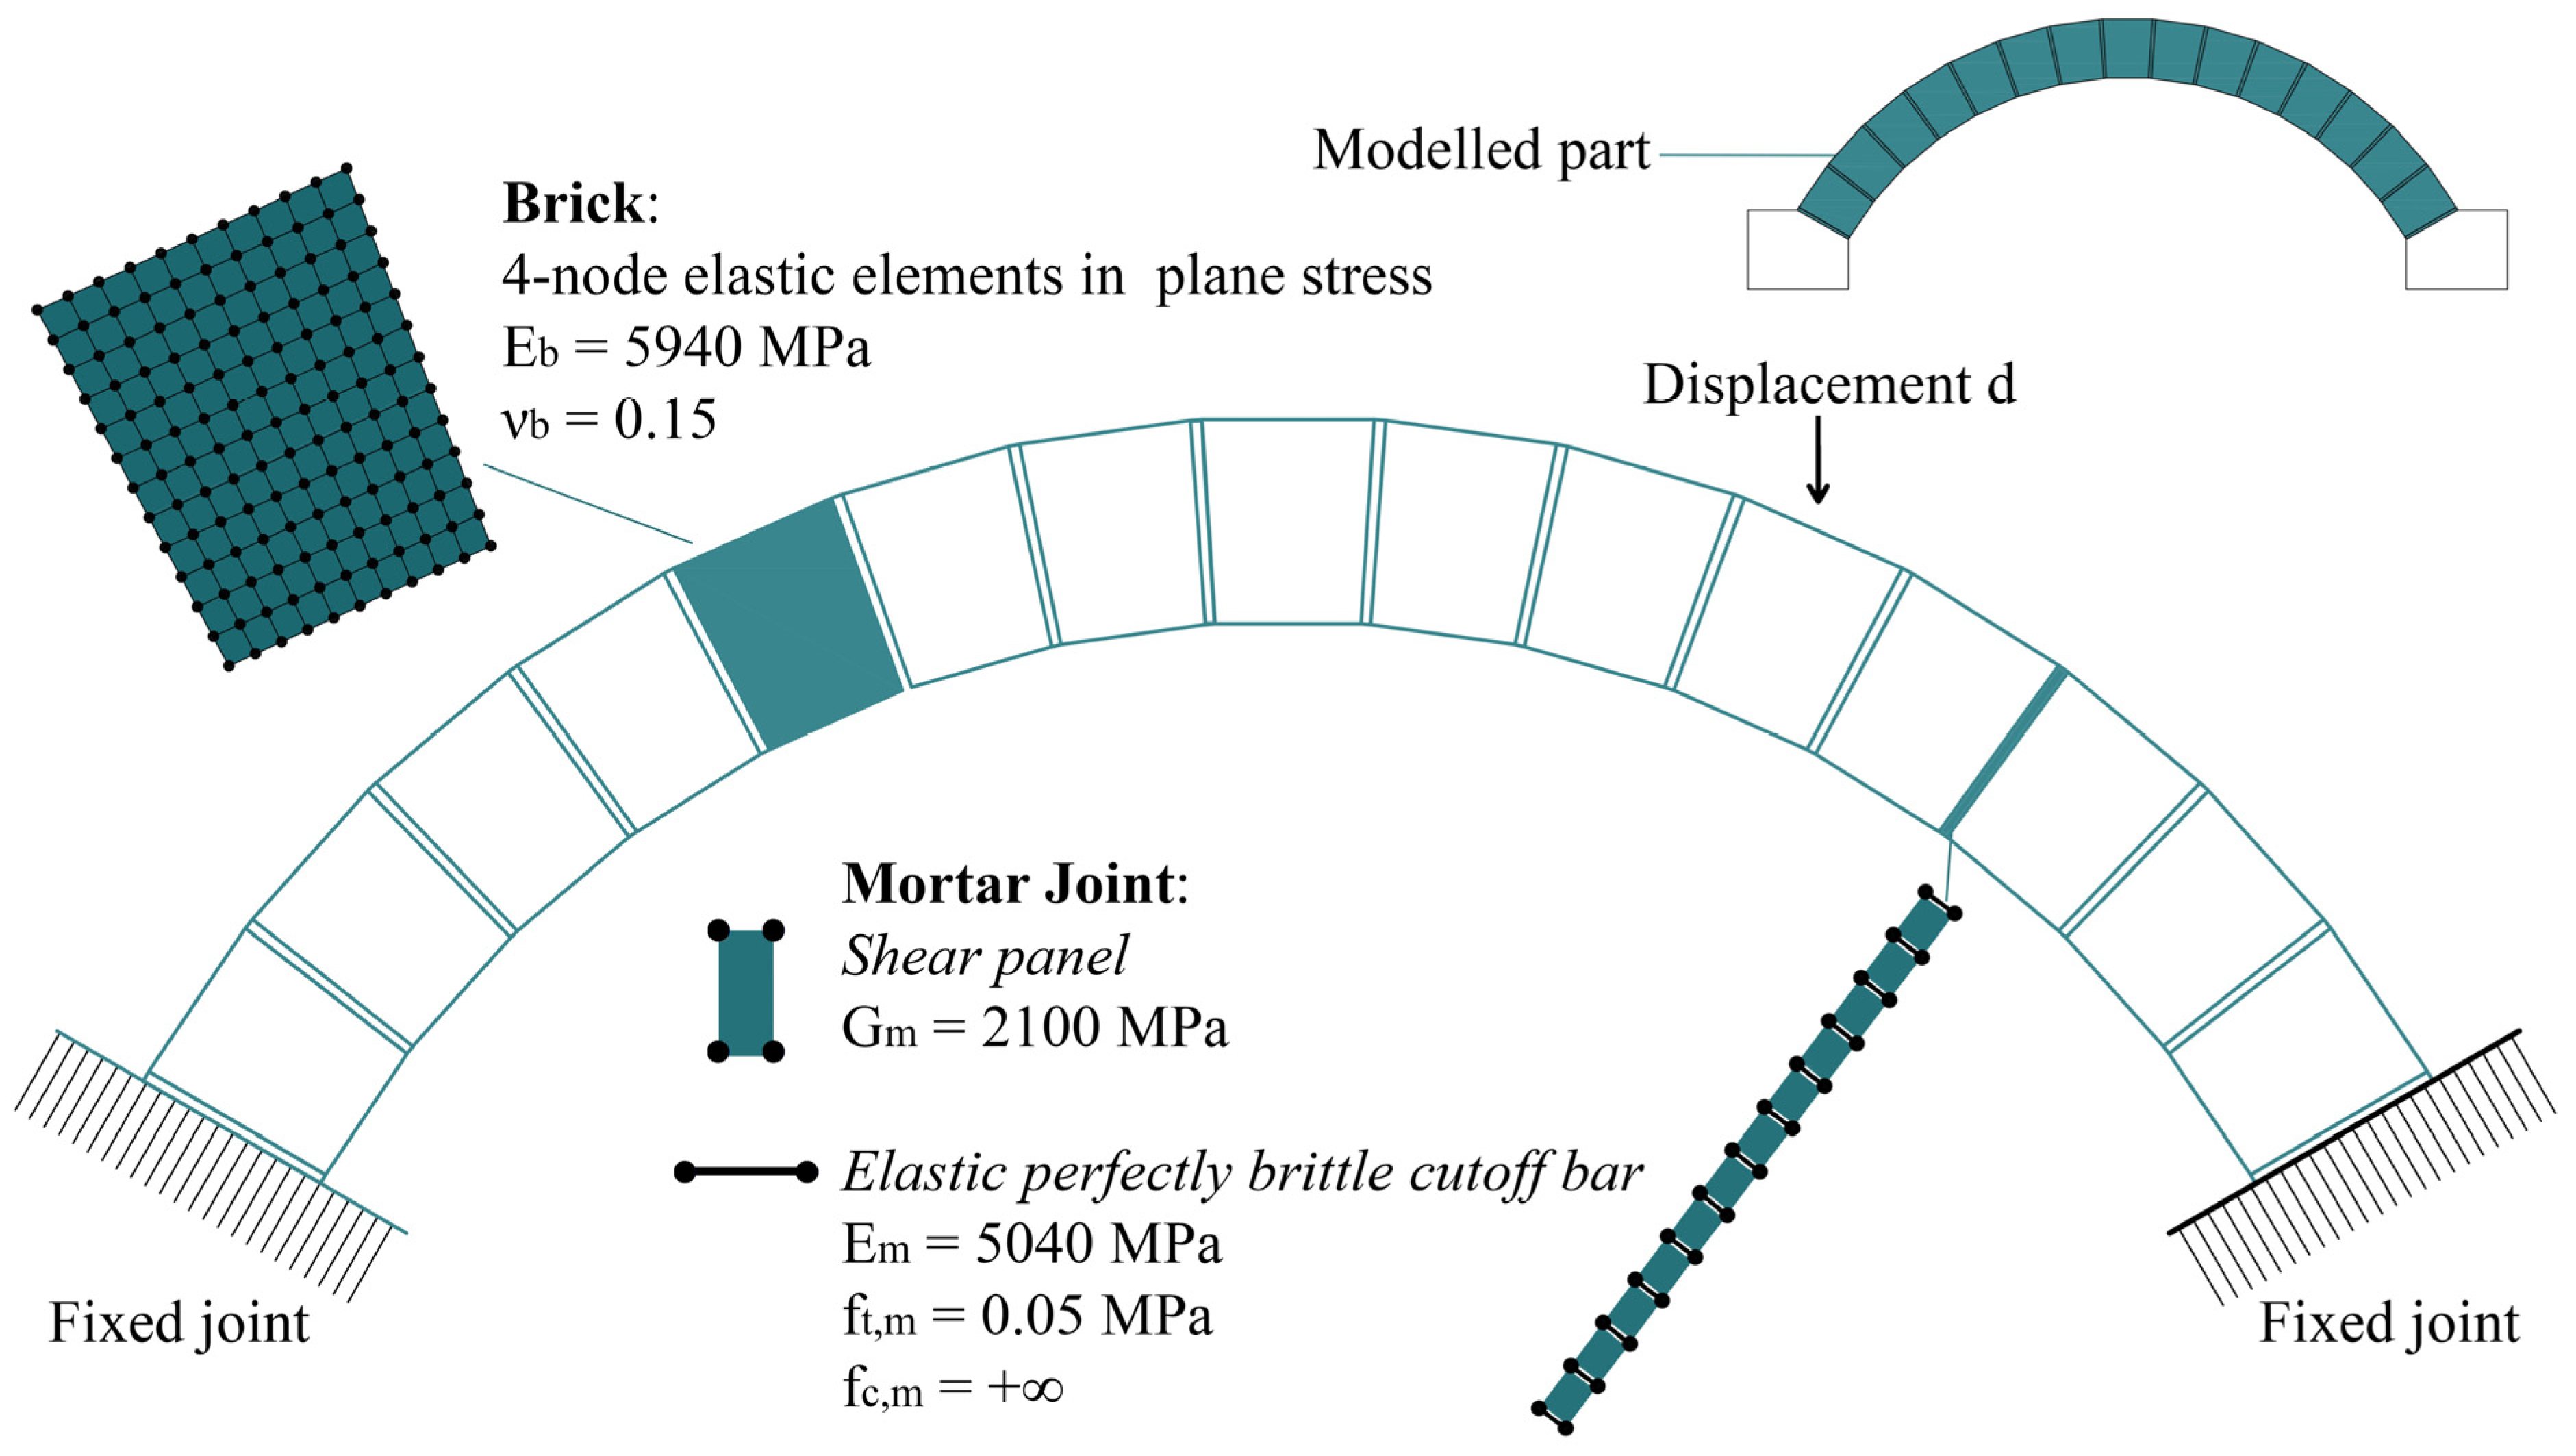
As for the previous case, the analysis tested the capacity of the model under gravity load, followed by an increasing vertical displacement. The displacement was applied at the same point as the vertical force F in the laboratory test, as depicted in Figure 9. Fixed constraints are assumed at the springing of the arch.
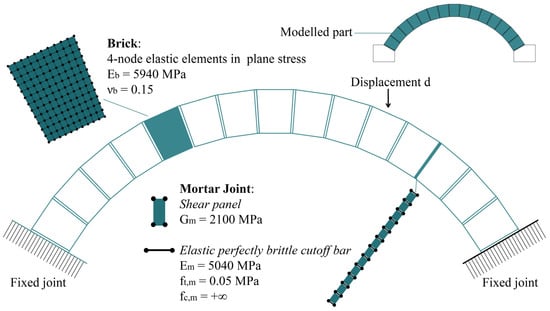
Figure 9.
Universidad del Pais Vasco arch: FE model details and material properties.
The FE model of the arch has been produced using four-node elastic elements for masonry blocks, while the mortar joints are modeled by sets of CoBs coupled with shear panels, allowing only failure Mode I. The mechanical properties adopted for this model are listed in Figure 9.
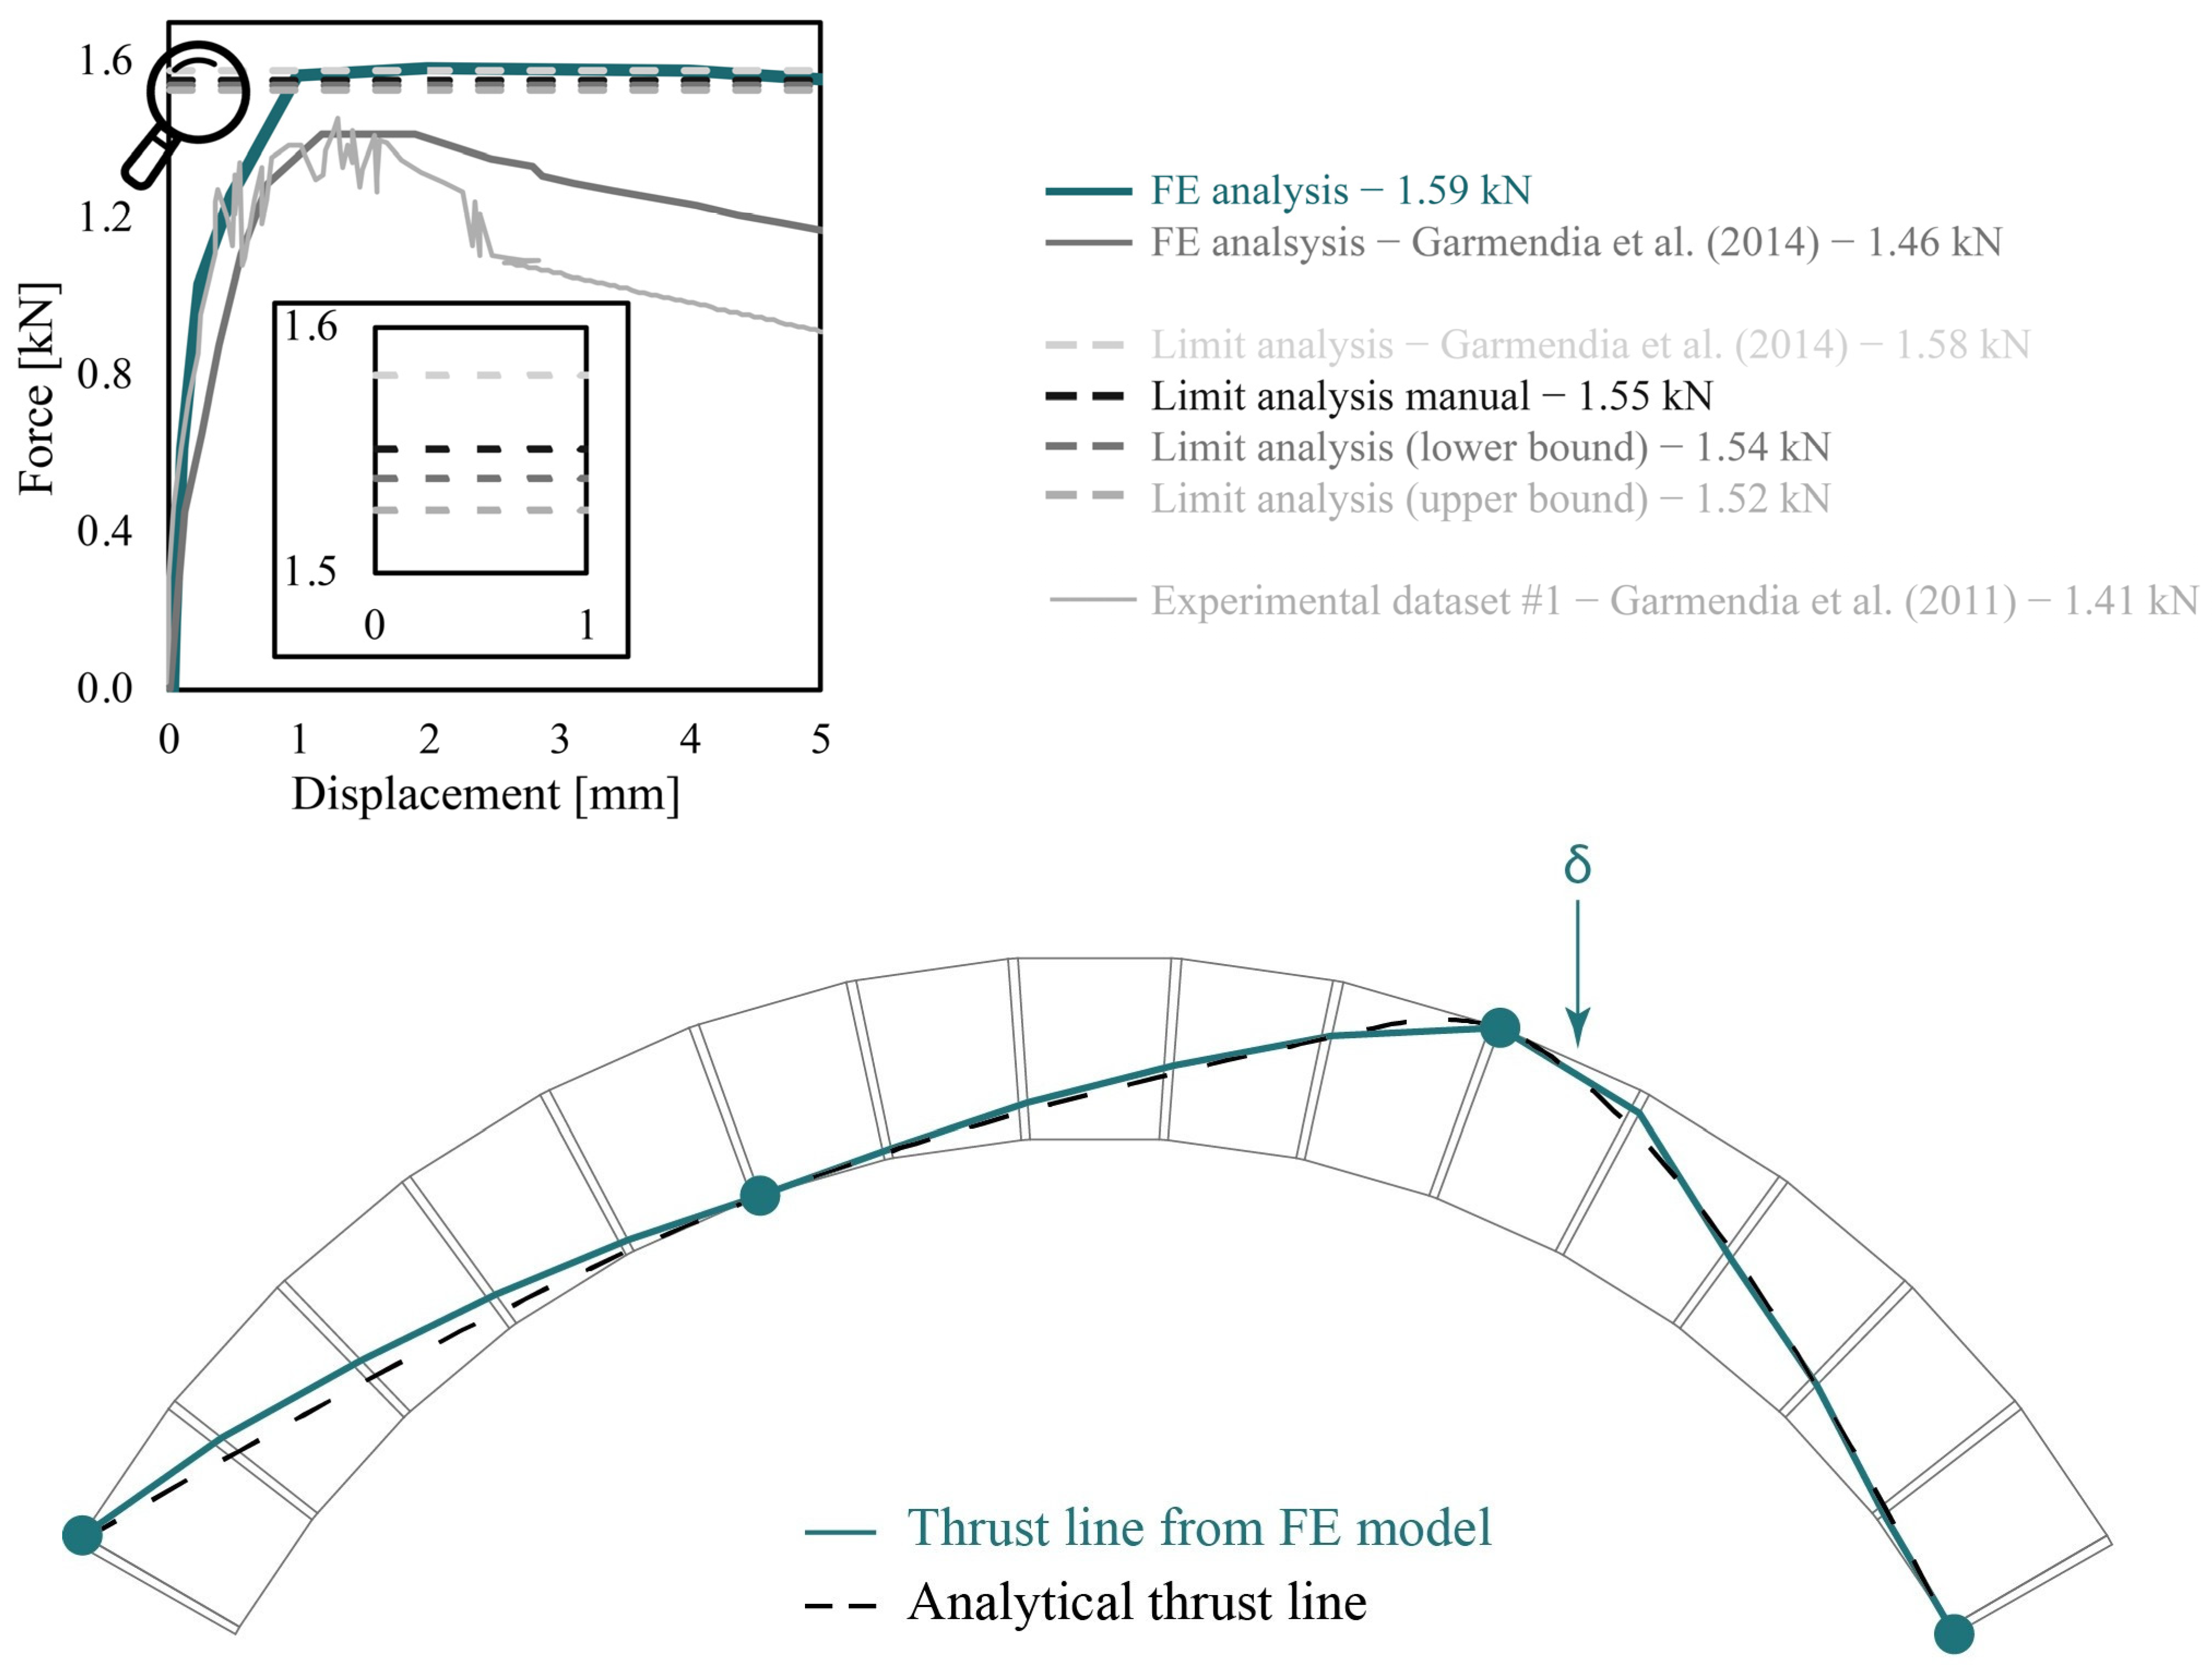
In Figure 10, the global load–displacement curve obtained from the non-linear FE analysis is compared with the experimental [42] and numerical results [45] in the literature. The proposed FE model shows good agreement with both references, particularly in terms of initial stiffness. As far as the collapse load is concerned, a discrepancy of about 12.8% and 8.9% is observed compared with the experimental and previous FE outcomes, respectively. This variation can be attributed to differences in the modeling approaches: in the present study, the sandstone blocks are assumed elastic, and the mortar joints are modeled using CoB interfaces with finite tensile strength. In [45], a Drucker–Prager criterion was applied to the stone blocks, and the joints were zero-thickness interfaces with finite tensile strength. The small differences between the numerical and experimental results may be explained by the limited reliability of the experimental curve, which comes from a single test.

Figure 10.
Universidad del Pais Vasco arch: Comparison of numerical and experimental results, thrust line at failure, and location of plastic hinges [42,45].
To further validate the findings, three additional analyses were performed: (i) manual, (ii) advanced lower bound, and (iii) upper bound Limit Analyses. The latter were carried out using the code developed in [46]. Figure 10 shows an almost perfect overlapping between the results obtained with the proposed FE model and the LA performed by the authors. Furthermore, a very similar collapse load was reported in [45] using the commercial software Ring 3.0 for LA.
To quantify the accuracy of the proposed model, Table 2 presents a comparison of the results in terms of peak load percentage error between this approach and previous experimental and numerical studies. The presented method yields a peak load of 1.59 kN, which is within +11% of the experimental reference and within 1–4% of results obtained from Limit Analysis approaches. This consistency highlights the model’s reliability even when applied to different materials and geometries. Notably, the present strategy achieves this accuracy while maintaining low computational demand and using a minimal number of input parameters. While more refined models may capture additional failure modes, the proposed FE strategy remains a valuable and efficient tool for evaluating the flexural capacity of unreinforced masonry arches in practical engineering contexts.
Table 2.
Universidad del Pais Vasco arch: Peak load difference between the present model and the results from the literature.
As for the Novi Ligure arch, the thrust line of the second case study (represented in Figure 10) is determined in the post-processing phase by integrating the axial forces at collapse within the joint CoBs. The location of the four plastic hinges aligns well with the LA results: one at the extrados of the arch under the applied load, two at the springing sections (one at the right intrados and one at the left extrados), and the last one at the intrados at about one-quarter of the span on the left side of the keystone. The thrust line obtained is compared with the one retrieved from the analytical formulation described in Section 3.1.
Among the arches analyzed in the present study, the one discussed in this section is the only example for which experimental validation has been carried out through a laboratory test. As such, the corresponding numerical model serves as the primary benchmark for assessing the accuracy and reliability of the proposed approach. In this context, the authors deemed it appropriate to perform a mesh sensitivity analysis to evaluate the influence of discretization refinement on the numerical predictions.
The reference mesh, illustrated in Figure 9, is composed of 12 × 10 finite elements per block. To explore the impact of mesh coarseness, two additional discretizations are implemented: one with 6 × 5 elements and another with 3 × 2 elements per block. The numerical results obtained from these three models are summarized in Figure 11, with a focus on peak load capacity and stiffness.
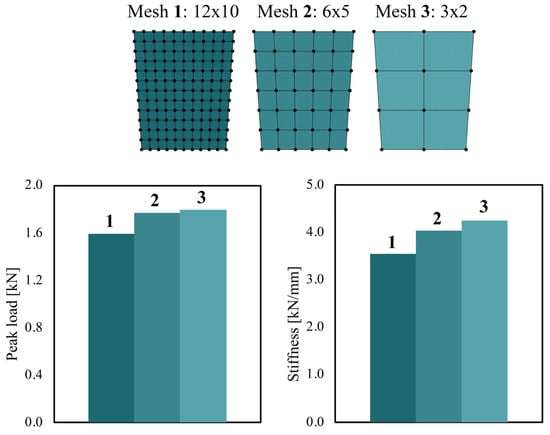
Figure 11.
Mesh sensitivity analysis: three different discretizations are compared—Mesh 1 (12 × 10 elements), Mesh 2 (6 × 5 elements), and Mesh 3 (3 × 2 elements)—in terms of peak load (left) and global stiffness (right).
The comparison reveals that the transition from the finest to the coarsest mesh leads to an increase of approximately 12.6% in peak load and 19.7% in stiffness. Despite these differences, the overall mechanical response remains consistent across the models, suggesting that the numerical approach is robust even with significantly simplified discretizations. These findings indicate that, for preliminary assessments or large-scale parametric studies, a coarser mesh may still yield sufficiently accurate results while substantially reducing computational costs.
3.3. The Cloister Vault of the Former Monastery of Santa Maria Della Pace
The case study examined in this section focuses on a masonry cloister vault built within a large urban aggregate in Piacenza (Emilia-Romagna region, Italy), specifically the former monastery of Santa Maria della Pace (see Figure 12). Originally constructed in the 16th century by Benedictine nuns, the building has been repurposed as a hospice. Despite various historical modifications, the original layout remained largely intact. The building consists of two levels organized around a central cloister and covered by cross vaults. It includes some portions regular in plan, such as a longitudinal block on the first floor (the original nuns’ dormitory) with a high central corridor that spans the entire length of the monastery. This corridor, with its interior walls taller than the perimeter ones, evokes the section of a basilica (see Figure 12a).
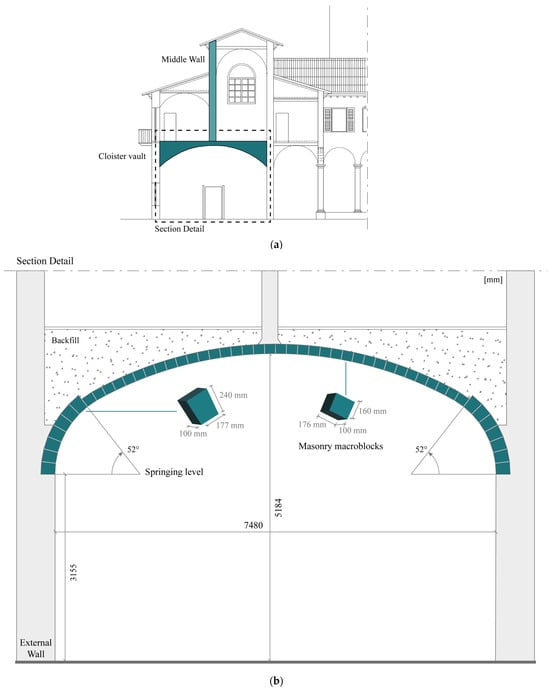
Figure 12.
Cloister vault in the former monastery of Santa Maria della Pace: (a) transversal section of the wing with basilica profile and location of the case study vault, (b) geometrical features of the vault and macroblocks of the model.
A comprehensive structural analysis of the entire complex was conducted in [47]. The present study focuses on one specific cloister vault with a polycentric profile identified as the most critical element from a static perspective. Located on the ground floor of the basilica-shaped block, the vault covers an area of about 16 × 8 m2 and supports a bearing wall on the first floor. As shown in Figure 12, the wall exerts a concentrated load in the mid-span of the vault. A detailed study on this cloister vault was conducted in [38], providing a static assessment and possible retrofitting interventions.
The Finite Element (FE) model proposed for arches is also suitable for modeling vaults (following the logic of the traditional slicing technique). The cloister vault under investigation is modeled in 2D (see Figure 13), allowing only vertical and horizontal nodal displacements, while the out-of-plane ones were restrained. In [38], this assumption was validated by comparing 2D FE analyses and full 3D advanced FE computations. In the present case, the plane-strain assumption is particularly appropriate due to the vault’s considerable longitudinal span (more than 15 m), enabling the central transversal section to be analyzed without considering longitudinal deformations.
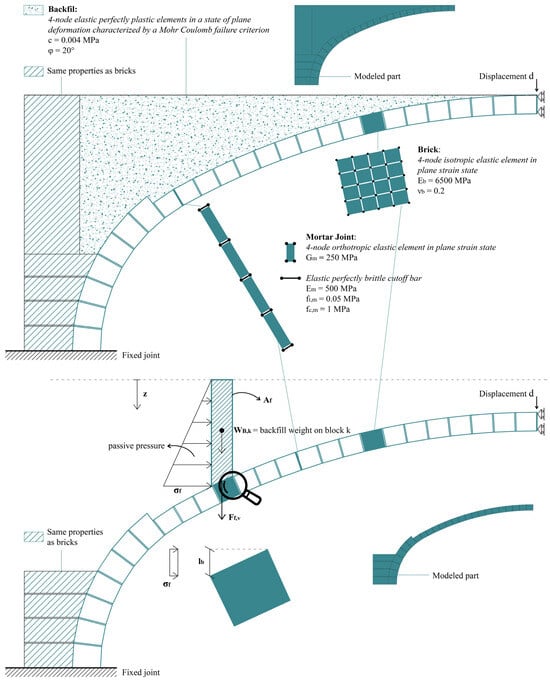
Figure 13.
The cloister vault in the former monastery of Santa Maria della Pace: FE models and material properties.
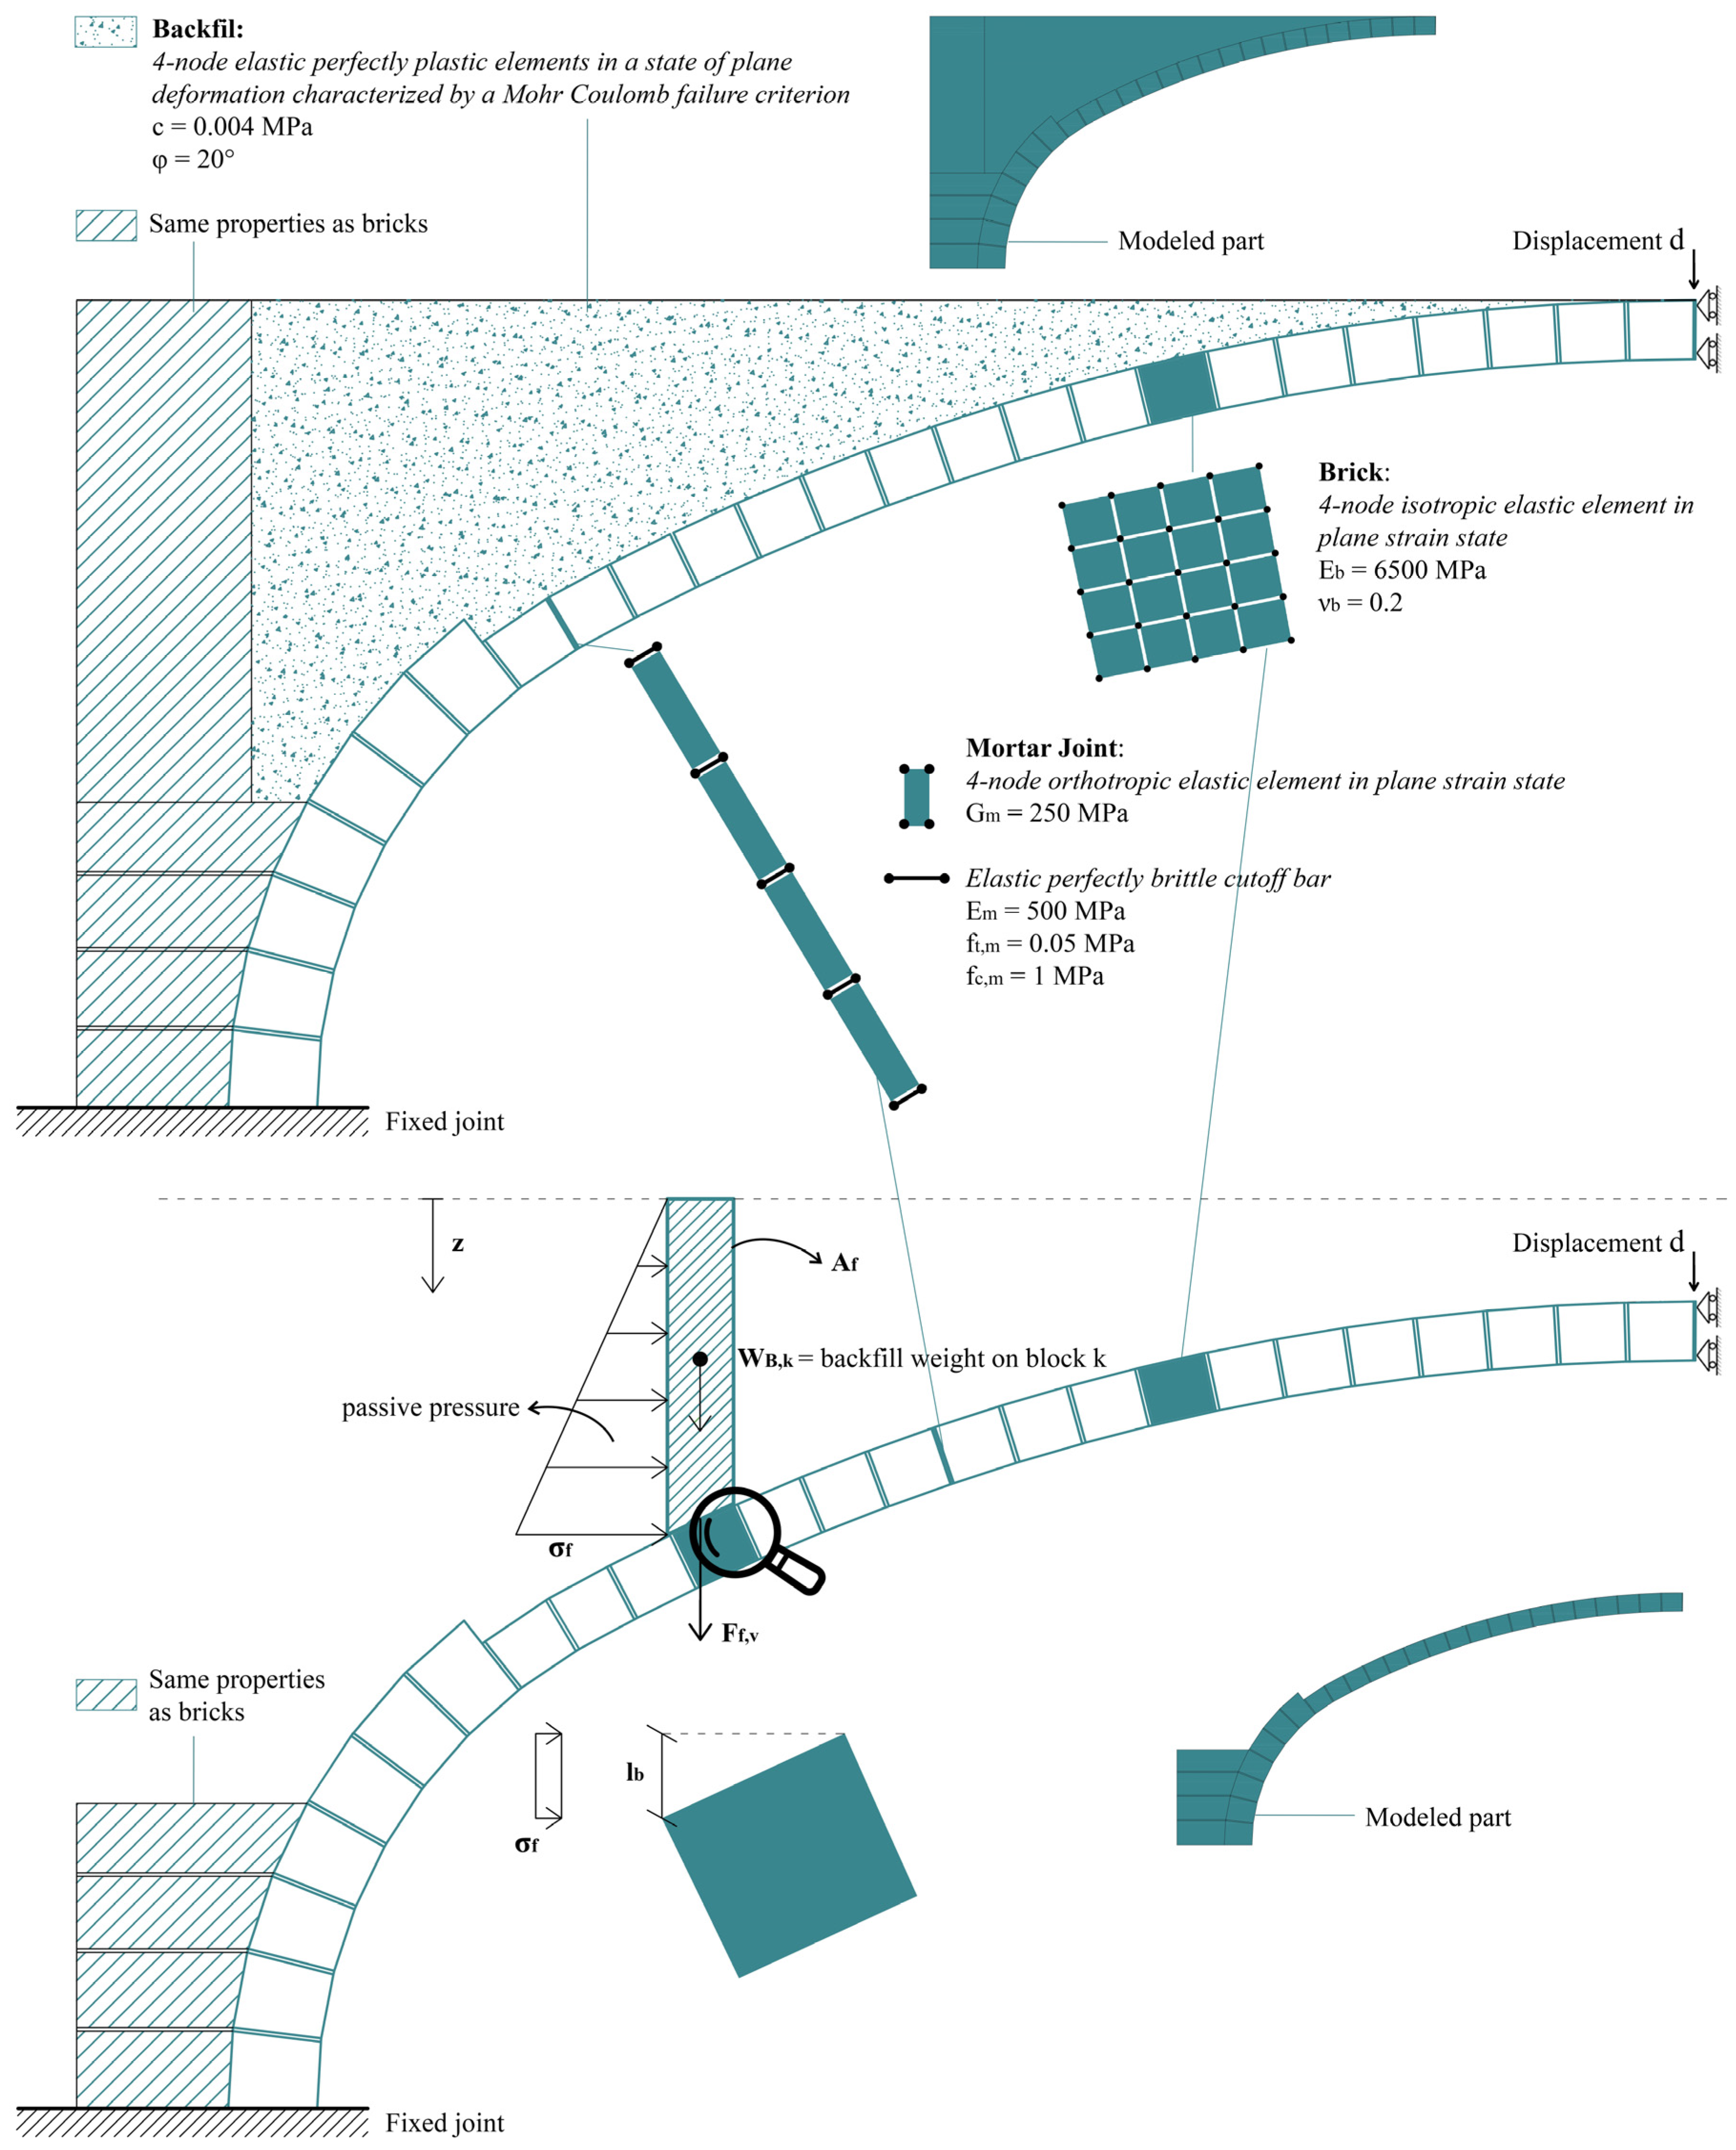
As shown in Figure 13, due to symmetry, the FE analyses are performed on one-half of the vault transverse section. The analysis begins with the application of self-weight, followed by the imposition of an incremental vertical displacement at the keystone. The section of the vault is discretized with 4-node shell elements (10cm thick plates) in plane-strain for bricks, while for mortar joints, axial Cutoff Bars (CoBs) are coupled with elastic orthotropic quadrilateral plane-strain elements, thus enabling deformations in Mode I only.
The backfill of the vault, which significantly enhances the load-bearing capacity [38], is modeled following two computational strategies, as shown in Figure 13. The first discretizes the filling with elastic perfectly plastic elements in a state of plane deformation characterized by a Mohr–Coulomb failure criterion. Instead, the second one assumes a set of equivalent horizontal and vertical forces following the procedure provided by [48], which adheres to standard geotechnics. According to the surveys on-site, the backfill is constituted by an incoherent material, therefore small values for the friction angle are assumed.
The mechanical properties assigned to the elements used in the models described above are listed in Figure 13.
Concerning the loading, it is assumed that the vault carries half of the weight of the roof pitches and the whole weight of the mid-span wall, as shown in Figure 12a. This weight is transformed into the point load acting on the keystone of the vault (Figure 14) and calculated as follows:
where is the height of the wall supported by the vault, with a thickness and a specific weight . The weight per square meter of the wooden roofs is assumed to be . Lastly, and are the lengths of the roof pitches, which load is carried by the middle wall.
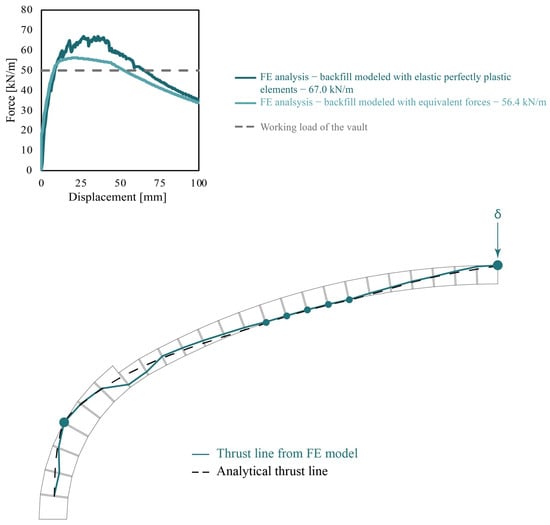
Figure 14.
Cloister vault of the former monastery of Santa Maria della Pace: Comparison of numerical results and actual load, thrust line at failure, and location of plastic hinges.
Figure 14 presents the global load–displacement curve, with a peak load of 67.0 kN/m and 56.4 kN/m, respectively, for the models with the backfill discretized with plate elements and equivalent concentrated forces. The last flexural plastic hinge forms at the springing, while the intermediate series of hinges indicates the formation of a smeared crack pattern at approximately one-third of the span (see Figure 14). As for the previous case studies, the resulting thrust line is compared to the one derived through the analytical approach detailed in Section 3.1.
In the absence of experimental evidence, for this specific case study, the analysis outcomes are compared with the actual vertical load on the vault. By comparing the acting load with the load–displacement curves in Figure 14, it becomes evident that the results obtained from the simplified FE model are reliable. Since the vault is still standing, it was expected that its collapse load would exceed the actual weight of superimposed structures. However, according to the analyses carried out in this study, the reserve capacity of such a structure appears to be limited. Hence, a small increase in the vertical load, for instance, due to snow load, may compromise structural safety or potentially lead to collapse.
Despite the reliability of the results obtained, in the absence of experimental validation, a preliminary sensitivity analysis is performed on the model considering the backfill as elastic perfectly plastic elements under plane strain conditions, governed by a Mohr–Coulomb failure criterion. As shown in Figure 15, the blue curves correspond to models with a uniform distribution of the backfill material, using friction angles of 20° (as in Figure 14) and 30°, representing loose and dense fine sand, respectively. The black curves refer instead to models with a non-uniform distribution of the backfill, as illustrated in the drawing at the bottom right of Figure 15. These models also adopt the same two friction angles (20° and 30°) as in the uniform case.
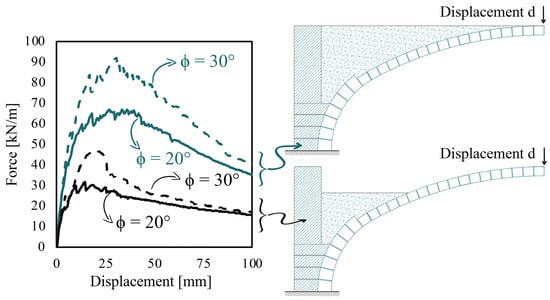
Figure 15.
Sensitivity analysis of the backfill. Models with uniformly distributed backfill (blue curves) assuming a friction angle of 30° (dense fine sand) and 20° (loose fine sand, also used in the main analysis), and models with non-uniformly distributed backfill (black curves) using the same friction angle values (30° and 20°).
The results indicate that not only the mechanical properties but also the geometry of the backfill significantly affect the model response. Specifically, compared to the model presented in Figure 14, the model with a 30° friction angle in Figure 15 shows a percentage increase of 37.31%.
Although it is reasonable to assume a uniform backfill distribution and in situ surveys reported in [38] confirm that the material consists of loose fine sand, the assumption of a 20° friction angle cannot be considered fully reliable. Additional in situ investigations and dedicated experimental tests would be necessary to accurately characterize the mechanical properties of the backfill and develop a model calibrated on experimentally derived parameters.
4. Conclusions
This study proposed and validated a simplified truss Finite Element modeling strategy for the structural analysis of masonry arches and vaults. The method, based on the combination of Cutoff Bars (CoBs) with elastic orthotropic elements (or shear panels) in standard FE models, effectively describes the failure mechanisms of historical curved structures. Such a strategy allows the prediction of flexural plastic hinge formation under Mode I failure. It leverages the use of the simplest nonlinear truss FEs available in low-cost commercial software. These elements are defined by a limited set of mechanical parameters and governed by simple constitutive models, which can be easily calibrated through standard laboratory tests or assumed from literature values, thus ensuring usability in common practice. In addition, by lumping the nonlinearity only at the mortar joints using such elements, the approach guarantees computational efficiency and can be applied to both 2D and 3D analyses, including arches and vaults with intricate geometries. Benchmark analyses on two experimental arch tests demonstrated the ability of the model proposed to predict the global load-displacement response, the ultimate load-bearing capacity, and the hinge formation sequence with good accuracy. The integration of CoB axial forces found at collapse enables the thrust line derivation in post-processing, in line with static Limit Analysis predictions. The application to a real-scale cloister vault further highlighted the flexibility of the method, confirming its reliability even in the absence of experimental data. Overall, the proposed FE strategy provides a valuable tool for the safety assessment and conservation of historical masonry structures, balancing simplicity and performance, thus being suitable for engineering practice. Nonetheless, it is important to recognize the current limitations of the modeling approach. At this stage, the strategy is formulated to capture only Mode I (flexural) failure, while neglecting other mechanisms such as sliding along joints (Mode II) and crushing of the mortar (Mode III). While this simplification is appropriate for unreinforced arches and vaults—where flexural behavior is typically dominant—it may restrict the applicability of the model in other contexts, such as reinforced structures, masonry walls, or under complex loading scenarios like cyclic or dynamic actions. Moreover, only static nonlinear analyses are currently supported, as the adopted Cutoff Bars (CoBs) do not capture cumulative damage effects arising in dynamic simulations. The extension of the framework to account for additional failure modes is planned in future developments. Additionally, it should be noted that the model predictions can be sensitive to certain mechanical parameters—particularly the tensile strength of the mortar joints and the mechanical characteristics of the backfill. In cases where experimental data are not available, it is recommended to perform preliminary sensitivity analyses to assess the robustness and reliability of the results.
Nevertheless, this modeling strategy is highly flexible. For example, Fiber-Reinforcer Polymer (FRP) or Fiber-Reinforced Cementitious Matrix (FRCM) systems can be easily incorporated into the model. If a perfect bond is assumed, the FRP or FRCM reinforcement can be discretized using elastic perfectly ductile CoBs connected to the extrados or intrados of the curved structure [38,39]. To account for debonding, these systems can instead be modeled using elastic plate elements coupled with two or three parallel CoBs at the interface (for FRP and FRCM, respectively), as demonstrated in [37,49,50]. Therefore, future developments of the work may include the integration of strengthening strategies either with standard or innovative techniques and the extension of the procedure even to complex case studies, such as double-curvature vaulted structures.
Additionally, ongoing developments are focusing on extending the applicability of the proposed modeling strategy to more complex or irregular geometries. In this context, recent implementations based on the Ruled Explicit Meshing (REM) tool and Elastic Body and Spring Models (EBSM) [51] have demonstrated promising results for the automated modeling of such configurations. Furthermore, the approach has shown effectiveness in simulating the effects of foundation settlements, as confirmed by a case study on the San Bassiano Church [52], where horizontal displacements were imposed at the springing to replicate differential settlement-induced damage.
Author Contributions
Conceptualization, N.P., M.B. and A.G.; methodology, N.P., M.B. and A.G.; software, N.P.; validation, N.P., M.B. and A.G.; formal analysis, N.P., M.B. and A.G.; investigation, N.P., M.B. and A.G.; resources, N.P., M.B. and A.G.; data curation, N.P., M.B. and A.G.; writing—original draft preparation, M.B.; writing—review and editing, N.P., M.B. and A.G.; visualization, N.P. and A.G. All authors have read and agreed to the published version of the manuscript.
Funding
This research received no external funding.
Data Availability Statement
Data will be made available on request.
Conflicts of Interest
The authors declare no conflict of interest.
References
- Pourfouladi, M.; Pingaro, N.; Valente, M. PoliBrick Plugin as a Parametric Tool for Digital Stereotomy Modelling. Comput. Struct. 2025, 311, 107722. [Google Scholar] [CrossRef]
- Kooharian, A. Limit Analysis of Voussoir (Segmental) and Concrete Archs. ACI J. Proc. 1952, 49, 317–328. [Google Scholar] [CrossRef]
- Pippard, A.J.S. The Approximate Estimation of Safe Loads on Masonry Bridges. In The Civil Engineer in War; Thomas Telford Ltd.: London, UK, 1948; pp. 365–372. [Google Scholar]
- Heyman, J. The Safety of Masonry Arches. Int. J. Mech. Sci. 1969, 11, 363–385. [Google Scholar] [CrossRef]
- O’Dwyer, D. Funicular Analysis of Masonry Vaults. Comput. Struct. 1999, 73, 187–197. [Google Scholar] [CrossRef]
- Foraboschi, P. Resisting System and Failure Modes of Masonry Domes. Eng. Fail. Anal. 2014, 44, 315–337. [Google Scholar] [CrossRef]
- Zizi, M.; Corlito, V.; Cacace, D.; De Matteis, G. Limit Analysis for Triumphal Arches in Masonry Churches: Case Study from L’Aquila 2009 and Central Italy 2016–17 Earthquakes; Springer: Berlin/Heidelberg, Germany, 2022; Volume 209 LNCE, ISBN 9783030907877. [Google Scholar]
- Milani, E.; Milani, G.; Tralli, A. Limit Analysis of Masonry Vaults by Means of Curved Shell Finite Elements and Homogenization. Int. J. Solids Struct. 2008, 45, 5258–5288. [Google Scholar] [CrossRef]
- Aita, D.; Milani, G.; Taliercio, A. Limit Analysis of Masonry Domes with Oculus and Lantern: A Comparison between Different Approaches. Math. Mech. Solids 2023, 30, 6–28. [Google Scholar] [CrossRef]
- Buzzetti, M.; Pingaro, N.; Milani, G. Automatic Detection of Local Collapse Mechanisms in Historical Masonry Buildings: Fast and Robust FE Upper Bound Limit Analysis. Eng. Fail. Anal. 2025, 170, 109310. [Google Scholar] [CrossRef]
- Nodargi, N.A.; Bisegna, P. A Unifying Computational Approach for the Lower-Bound Limit Analysis of Systems of Masonry Arches and Buttresses. Eng. Struct. 2020, 221, 110999. [Google Scholar] [CrossRef]
- Riveiro, B.; Solla, M.; De Arteaga, I.; Arias, P.; Morer, P. A Novel Approach to Evaluate Masonry Arch Stability on the Basis of Limit Analysis Theory and Non-Destructive Geometric Characterization. Autom. Constr. 2013, 31, 140–148. [Google Scholar] [CrossRef]
- Nela, B.; Jiménez Rios, A.; Pingaro, M.; Reccia, E.; Trovalusci, P. Limit Analysis of Locally Reinforced Masonry Arches. Eng. Struct. 2022, 271, 114921. [Google Scholar] [CrossRef]
- Papa, T.; Grillanda, N.; Milani, G. Three-Dimensional Adaptive Limit Analysis of Masonry Arch Bridges Interacting with the Backfill. Eng. Struct. 2021, 248, 113189. [Google Scholar] [CrossRef]
- Zampieri, P.; Simoncelo, N.; Tetougueni, C.D.; Pellegrino, C. A Review of Methods for Strengthening of Masonry Arches with Composite Materials. Eng. Struct. 2018, 171, 154–169. [Google Scholar] [CrossRef]
- Zampieri, P.; Piazzon, R.; Santinon, D.; Hofer, L.; Toska, K.; Faleschini, F.; Pellegrino, C.; Iacobini, F.; Vecchi, A.; Iodice, F.; et al. Intrados FRCM-Strengthening of a Masonry Bridge: Experimental and Analytical Investigations. Eng. Struct. 2025, 323, 119215. [Google Scholar] [CrossRef]
- Zampieri, P.; Piazzon, R.; Niero, L.; Pellegrino, C. Damaged Masonry Arch Bridges Strengthened with External Post-Tensioning: Experimental and Numerical Results. Eng. Struct. 2024, 318, 117929. [Google Scholar] [CrossRef]
- Ural, A.; Firat, F.K.; Tuğrulelçi, S.; Kara, M.E. Experimental and Numerical Study on Effectiveness of Various Tie-Rod Systems in Brick Arches. Eng. Struct. 2016, 110, 209–221. [Google Scholar] [CrossRef]
- Bertolesi, E.; Torres, B.; Adam, J.M.; Calderón, P.A.; Moragues, J.J. Effectiveness of Textile Reinforced Mortar (TRM) Materials for the Repair of Full-Scale Timbrel Masonry Cross Vaults. Eng. Struct. 2020, 220, 110978. [Google Scholar] [CrossRef]
- Tanriverdi, S. An Experimental and Numerical Study of the Strengthening of Masonry Brick Vaults. Structures 2023, 47, 800–813. [Google Scholar] [CrossRef]
- Varró, R.; Bögöly, G.; Görög, P. Laboratory and Numerical Analysis of Failure of Stone Masonry Arches with and without Reinforcement. Eng. Fail. Anal. 2021, 123, 105272. [Google Scholar] [CrossRef]
- European Committee for Standardization. Eurocode 6: Design of Masonry Structures; European Commission: Brussels, Belgium, 1996.
- Audenaert, A.; Fanning, P.; Sobczak, L.; Peremans, H. 2-D Analysis of Arch Bridges Using an Elasto-Plastic Material Model. Eng. Struct. 2008, 30, 845–855. [Google Scholar] [CrossRef]
- Gago, A.S.; Alfaiate, J.; Lamas, A. The Effect of the Infill in Arched Structures: Analytical and Numerical Modelling. Eng. Struct. 2011, 33, 1450–1458. [Google Scholar] [CrossRef]
- Kishen, J.M.C.; Ramaswamy, A.; Manohar, C.S. Safety Assessment of a Masonry Arch Bridge: Field Testing and Simulations. J. Bridge Eng. 2013, 18, 162–171. [Google Scholar] [CrossRef]
- Carini, A.; Genna, F. Stability and Strength of Old Masonry Vaults under Compressive Longitudinal Loads: Engineering Analyses of a Case Study. Eng. Struct. 2012, 40, 218–229. [Google Scholar] [CrossRef]
- Bacigalupo, A.; Brencich, A.; Gambarotta, L. A Simplified Assessment of the Dome and Drum of the Basilica of S. Maria Assunta in Carignano in Genoa. Eng. Struct. 2013, 56, 749–765. [Google Scholar] [CrossRef]
- D’Ayala, D.F.; Tomasoni, E. Three-Dimensional Analysis of Masonry Vaults Using Limit State Analysis with Finite Friction. Int. J. Archit. Herit. 2011, 5, 140–171. [Google Scholar] [CrossRef]
- Theodossopoulos, D.; Sinha, B.P.; Usmani, A.S.; Macdonald, A.J. Assessment of the Structural Response of Masonry Cross Vaults. Strain 2002, 38, 119–127. [Google Scholar] [CrossRef]
- Creazza, G.; Matteazzi, R.; Saetta, A.; Vitaliani, R. Analyses of Masonry Vaults: A Macro Approach Based on Three-Dimensional Damage Model. J. Struct. Eng. 2002, 128, 646–654. [Google Scholar] [CrossRef]
- Sarhosis, V.; De Santis, S.; de Felice, G. A Review of Experimental Investigations and Assessment Methods for Masonry Arch Bridges. Struct. Infrastruct. Eng. 2016, 12, 1439–1464. [Google Scholar] [CrossRef]
- Dimitri, R.; De Lorenzis, L.; Zavarise, G. Numerical Study on the Dynamic Behavior of Masonry Columns and Arches on Buttresses with the Discrete Element Method. Eng. Struct. 2011, 33, 3172–3188. [Google Scholar] [CrossRef]
- Giamundo, V.; Sarhosis, V.; Lignola, G.P.; Sheng, Y.; Manfredi, G. Evaluation of Different Computational Modelling Strategies for the Analysis of Low Strength Masonry Structures. Eng. Struct. 2014, 73, 160–169. [Google Scholar] [CrossRef]
- Lemos, J.V. Discrete Element Modeling of Masonry Structures. Int. J. Archit. Herit. 2007, 1, 190–213. [Google Scholar] [CrossRef]
- Janssen, H.J.M. Numerical studies with UDEC. In Structural Masonry: An Experimental/Numerical Basis for Practical Design Rules; Rots, J.G., Ed.; Balkema: Kalamazoo, MI, USA, 1997; pp. 96–106. Available online: https://research.tue.nl/en/publications/numerical-studies-with-udec (accessed on 29 April 2025).
- Sarhosis, V.; Sheng, Y. Identification of Material Parameters for Low Bond Strength Masonry. Eng. Struct. 2014, 60, 100–110. [Google Scholar] [CrossRef]
- Pingaro, N.; Milani, G. Simple Non-Linear Numerical Modelling of Masonry Arches Reinforced with SRG Using Elasto-Fragile and Elasto-Ductile Truss Finite Elements. Eng. Struct. 2023, 293, 116637. [Google Scholar] [CrossRef]
- Pingaro, N.; Buzzetti, M.; Milani, G. Advanced FE Nonlinear Numerical Modeling to Predict Historical Masonry Vaults Failure: Assessment of Risk Collapse for a Long Span Cloister Vault Heavily Loaded at the Crown by Means of a General-Purpose Numerical Protocol. Eng. Fail. Anal. 2025, 167, 109070. [Google Scholar] [CrossRef]
- Gandolfi, A.; Pingaro, N.; Milani, G. Simple Non-Linear Numerical Modelling for Unreinforced and FRP-Reinforced Masonry Domes. Buildings 2024, 14, 166. [Google Scholar] [CrossRef]
- Gandolfi, A.; Pingaro, N.; Milani, G. Elastic Body Spring Method (EBSM) for the Stability Analysis of the Global Vipassana Pagoda in Mumbai, India. Buildings 2025, 15, 653. [Google Scholar] [CrossRef]
- Carozzi, F.G.; Poggi, C.; Bertolesi, E.; Milani, G. Ancient Masonry Arches and Vaults Strengthened with TRM, SRG and FRP Composites: Experimental Evaluation. Compos. Struct. 2018, 187, 466–480. [Google Scholar] [CrossRef]
- Garmendia, L.; San-José, J.T.; García, D.; Larrinaga, P. Rehabilitation of Masonry Arches with Compatible Advanced Composite Material. Constr. Build. Mater. 2011, 25, 4374–4385. [Google Scholar] [CrossRef]
- Ministero delle Infrastrutture e dei Trasporti Decreto 17 Gennaio 2018—Aggiornamento Delle “Norme Tecniche per Le Costruzioni”. Gazzetta Ufficiale della Repubblica Italiana. 2018. Available online: http://www.gazzettaufficiale.it/eli/id/2018/02/20/18A00716/sg (accessed on 29 April 2025).
- Bertolesi, E.; Milani, G.; Carozzi, F.G.; Poggi, C. Ancient Masonry Arches and Vaults Strengthened with TRM, SRG and FRP Composites: Numerical Analyses. Compos. Struct. 2018, 187, 385–402. [Google Scholar] [CrossRef]
- Garmendia, L.; Marcos, I.; Garbin, E.; Valluzzi, M.R. Strengthening of Masonry Arches with Textile-Reinforced Mortar: Experimental Behaviour and Analytical Approaches. Mater. Struct. Mater. Constr. 2014, 47, 2067–2080. [Google Scholar] [CrossRef]
- Hua, Y.; Milani, G. Simple Modeling of Reinforced Masonry Arches for Associated and Non-Associated Heterogeneous Limit Analysis. Comput. Struct. 2023, 280, 106987. [Google Scholar] [CrossRef]
- Acito, M.; Buzzetti, M.; Cundari, G.A.; Milani, G. General Methodological Approach for the Seismic Assessment of Masonry Aggregates. Structures 2023, 57, 105177. [Google Scholar] [CrossRef]
- Gelfi, P. Role of Horizontal Backfill Passive Pressure on the Stability of Masonry Vaults / Zum Einfluss Des Passiven Druckes Aus Der Hinterfüllung Auf Die Stabilität von Gewölben Aus Mauerwerk. Restor. Build. Monum. 2002, 8, 573–590. [Google Scholar] [CrossRef]
- Pingaro, N.; Calabrese, A.S.; Milani, G.; Poggi, C. Debonding Sawtooth Analytical Model and FE Implementation with In-House Experimental Validation for SRG-Strengthened Joints Subjected to Direct Shear. Compos. Struct. 2023, 319, 117113. [Google Scholar] [CrossRef]
- Milani, G. Simple Model with In-Parallel Elasto-Fragile Trusses to Characterize Debonding on FRP-Reinforced Flat Substrates. Compos. Struct. 2022, 296, 115874. [Google Scholar] [CrossRef]
- Buzzetti, M.; Gandolfi, A.; Pingaro, N.; Milani, G. A New Advanced and Simple Procedure for the Nonlinear Static Analysis of Curved Masonry Structures. In International Conference on Protection of Historical Constructions; Springer: Cham, Switzerland, 2025; pp. 176–183. [Google Scholar]
- Pingaro, N.; Cardani, G.; Coronelli, D.; Milani, G. On the Stability of Masonry Arches Through Limit Analysis and a Nonlinear Finite Element-Based Method. In International Conference on Protection of Historical Constructions; Springer: Cham, Switzerland, 2025; pp. 201–208. [Google Scholar]


Disclaimer/Publisher’s Note: The statements, opinions and data contained in all publications are solely those of the individual author(s) and contributor(s) and not of MDPI and/or the editor(s). MDPI and/or the editor(s) disclaim responsibility for any injury to people or property resulting from any ideas, methods, instructions or products referred to in the content. |
© 2025 by the authors. Licensee MDPI, Basel, Switzerland. This article is an open access article distributed under the terms and conditions of the Creative Commons Attribution (CC BY) license (https://creativecommons.org/licenses/by/4.0/).