Article

Research on IFC-Based Tunnel Monitoring Information Integration and Visual Warning Scheme

1
Shaanxi Provincial Highway Bureau, Xi’an 710068, China
2
School of Highway, Chang’an University, Xi’an 710064, China
*
Author to whom correspondence should be addressed.
Buildings 2025, 15(13), 2221; https://doi.org/10.3390/buildings15132221
Submission received: 9 May 2025 / Revised: 8 June 2025 / Accepted: 12 June 2025 / Published: 25 June 2025
(This article belongs to the Section Building Structures)

Abstract

The Industry Foundation Class (IFC)-based sensor monitoring information expression mechanism is discussed, and an IFC-based tunnel entity definition and sensor monitoring information expansion method are proposed. Based on the existing IFC standards, by introducing the description dimensions of the tunnel’s spatial and geometric structure, the definition of IFC tunnel entities is creatively supplemented. For the first time, the expansion of IFCs in the field of tunnels is achieved, significantly expanding the boundaries of IFCs in complex underground engineering applications. The IFC-based tunnel monitoring information model is constructed using IfcSensor as the sensor entity and extending the sensor entity attribute set. Aiming at the problems of complicated tunnel monitoring data and difficult storage, this paper studies the tunnel monitoring information integration and visual early warning method based on IFCs. A Building Information Modeling (BIM)-based monitoring information integration system is developed, and the engineering application is carried out with the Jianyuan–Kaiyuan Road tunnel project in Xi‘an as a demonstration case. The advantages of BIM technology in a model visualization application are verified, and the risk perception and visual warning of tunnel construction are realized.

1. Introduction

In recent years, China’s economic construction has developed rapidly, and the construction of urban transportation infrastructure has been continuously promoted and optimized. While the coverage density of road infrastructure is greatly increased, the scale of tunnel construction is also increasing, which brings new challenges to tunnel construction. The demand for information and the digital development of tunnel construction monitoring is increasing. With the rise of BIM technology, the application of BIM technology in tunnel engineering construction simulation, data analysis, monitoring, and surveillance is becoming more and more mature, which provides strong technical support for the informatization and digitalization development of tunnel monitoring. However, a tunnel monitoring project needs the collaborative participation of design, construction, and monitoring. The data formats among different BIM software are not interoperable. When each participant uses different BIM software to carry out work, it is easy for monitoring data to be lost or incorrect during the information transmission process, which imposes adverse effects on data interaction and integration. In addition, the lack of unified management of a large number of redundant data also adversely affects the long-term storage of monitoring information. The IFC standard is the mainstream BIM data format standard in the engineering field, and it is also the most widely used BIM unified application standard. The IFC standard can effectively solve the problem of imperfect data expression between BIM models, improve the guarantee for the integrated management and visual early warning of tunnel monitoring information, and further enhance the risk perception of tunnel construction.
Domestic and foreign scholars have carried out a lot of research on the application of IFC standard. Ślusarczyk [1] proposed a file information extraction method based on IFC, and stored the information in the graphic database, and calculated the shortest path of the emergency route through the database system. Tibaut [2] studied the conversion method between the IFC and entity relationship, established a relational database based on the IFC information storage interaction, integrated the IFC model and database, and established an IFC information model containing the database. In order to solve the problems of missing information and false positives in IFC files during data interaction, Deng [3] proposed a data interaction operation method based on a data dictionary, established a multidisciplinary model using the BIM platform commonly used in IFC standards, and verified the feasibility of information model data based on the BIM platform with examples. In order to solve the problems of complex data structure definition and low storage efficiency in the IFC standard, Zeng [4] proposed a new data storage model based on IFC. This model uses the IFC XML format for data interaction. It has been verified by experiments that it can effectively manage and store IFC data. In view of the low efficiency of the BIM model–information interaction, Zhang [5] established the IFC data interaction system framework of a building structure, and verified its high efficiency in data interaction applications through building examples. The existing IFC standards have imperfect entity definitions. In order to meet the needs of special engineering projects, expanding the IFC standards is necessary, and domestic and foreign scholars have also carried out relevant research. Armbruster [6] extends the IFC standard based on the semantic model, studies sewage treatment plant planning based on BIM, and verifies the feasibility of IFC extension using IFC test software. Guan et al. [7] studied the physical structure of a substation under the IFC standard, established the IFC structure model of the substation portal frame, and constructed the data system model of the substation. The research results provide a new method for three-dimensional modeling and the data interaction application of a substation. Zhu [8] extended the IFC standard for the entity and attribute sets of the assembly model, and proposed the top-down design idea of the assembly model based on the IFC extension. Bao [9] integrated BIM technology with bridge detection, established an IFC model of bridge disease information, and realized multi-platform visual monitoring of the bridge disease model. Zhao et al. [10] described the tunnel structure based on the existing IFC standard, established the tunnel IFC information model through IFC entity expansion, established the tunnel parametric model based on BIM technology, and constructed the tunnel dynamic design information integration model. In terms of tunnel behavior, many techniques and methods have been studied and applied. Mobaraki and Vaghefi [11] numerically simulated the dynamic response of the Kobe subway tunnel under explosive loads using the finite element method (FEM) of LS-DYNA, and verified the model through empirical data in the TM5-855-1 code. The influences of the width and position of the protective barrier on the peak pressure, acceleration, and stress distribution of the tunnel was studied and analyzed, providing a reference for improving the anti-explosion performance of underground structures. Mobaraki et al. [12] proposed an observability technique for the identification of two-dimensional planar structure systems. This study linearizes the system of equations by introducing variable transformation, solving the nonlinear problem caused by unknown variables appearing in the numerators and denominators of the stiffness matrix in two-dimensional structure models, and providing a new method for parameter identification and the optimal design of complex structures such as tunnels and bridges.
In summary, the IFC standard cannot meet the specific needs of information expression in the field of tunnel construction monitoring at the current stage. On the one hand, the IFC support for tunnel engineering is low, and there are problems such as undefined tunnel entities and undescribed tunnel structures. On the other hand, the IFC expression of entities is not perfect enough, such as the definition of sensor entities in the IFC standard, but the types of sensor entities and monitoring information are incompletely described. In order to realize the integrated management of tunnel monitoring information and improve the digital application level of tunnel construction monitoring, this paper describes the tunnel entity from the perspective of the spatial structure and geometric structure in view of the imperfect definition of the sensor entity under the existing IFC standard, and realizes the expansion of IFC standard in the tunnel field. The sensor is extended by the extension method of the attribute set, and the construction method of a tunnel IFC model is studied. This study innovates by custom-developing IFC extensions for underground passage projects. While IFC4.3′s IfcBridge and prior tunnel models offer useful frameworks, the focus here is on the unique needs of underground passages. Unlike bridges, these passages involve complex 3D spatial curves and diverse cross-sectional forms. Accordingly, this study expands the attributes of IfcTunnel and IfcSensor. For IfcTunnel, attribute enrichment fully reflects the underground passage’s geometric, physical, and behavioral aspects. For IfcSensor, attribute extension sufficiently captures monitoring information. This approach addresses the limitations of current schemas in handling underground passage project complexity and provides a more accurate and detailed information model. Considering the characteristics of three-dimensional space curve distribution and complex cross-section form of tunnel engineering, the tunnel is divided into a main structure and auxiliary structure and the model of structural member family is established. Based on the Dynamo visual programming plug-in, the modeling script of the main structure and auxiliary structure of tunnel is created, and the parametric model of the tunnel based on BIM is established. Finally, based on the relational database, the monitoring information integration system is developed based on the Visual Studio platform, C# language and .NET framework. Taking the Jianyuan Road–Kaiyuan Road Tunnel Project in Xi‘an as the actual project, the IFC-based tunnel monitoring information model is established and the visual warning application is carried out.

2. Monitoring Data Preprocessing

When carrying out tunnel construction monitoring, the monitoring data are often affected by factors such as environment and instrument failure, resulting in gross errors or missing data, which reduce the reliability of the data and results. In order to ensure the accuracy and integrity of the monitoring data and provide an accurate data basis for the subsequent application of tunnel visual early warning, eliminating gross errors and interpolating the original monitoring data are necessary.
With the continuous advancement of tunnel construction time and processes, the tunnel excavation structure gradually enters a stable state, and the deformation tends to be stable. The periodic frequency of tunnel monitoring also gradually decreases with time until the end of monitoring. Taking the displacement sensor monitoring points at K0 + 625 of Kaiyuan Road–Jianyuan Road Tunnel Project as an example, the monitoring data from the first phase to the twenty-fourth phase are selected for a gross error elimination and interpolation calculation, and the monitoring data are shown in Table 1.

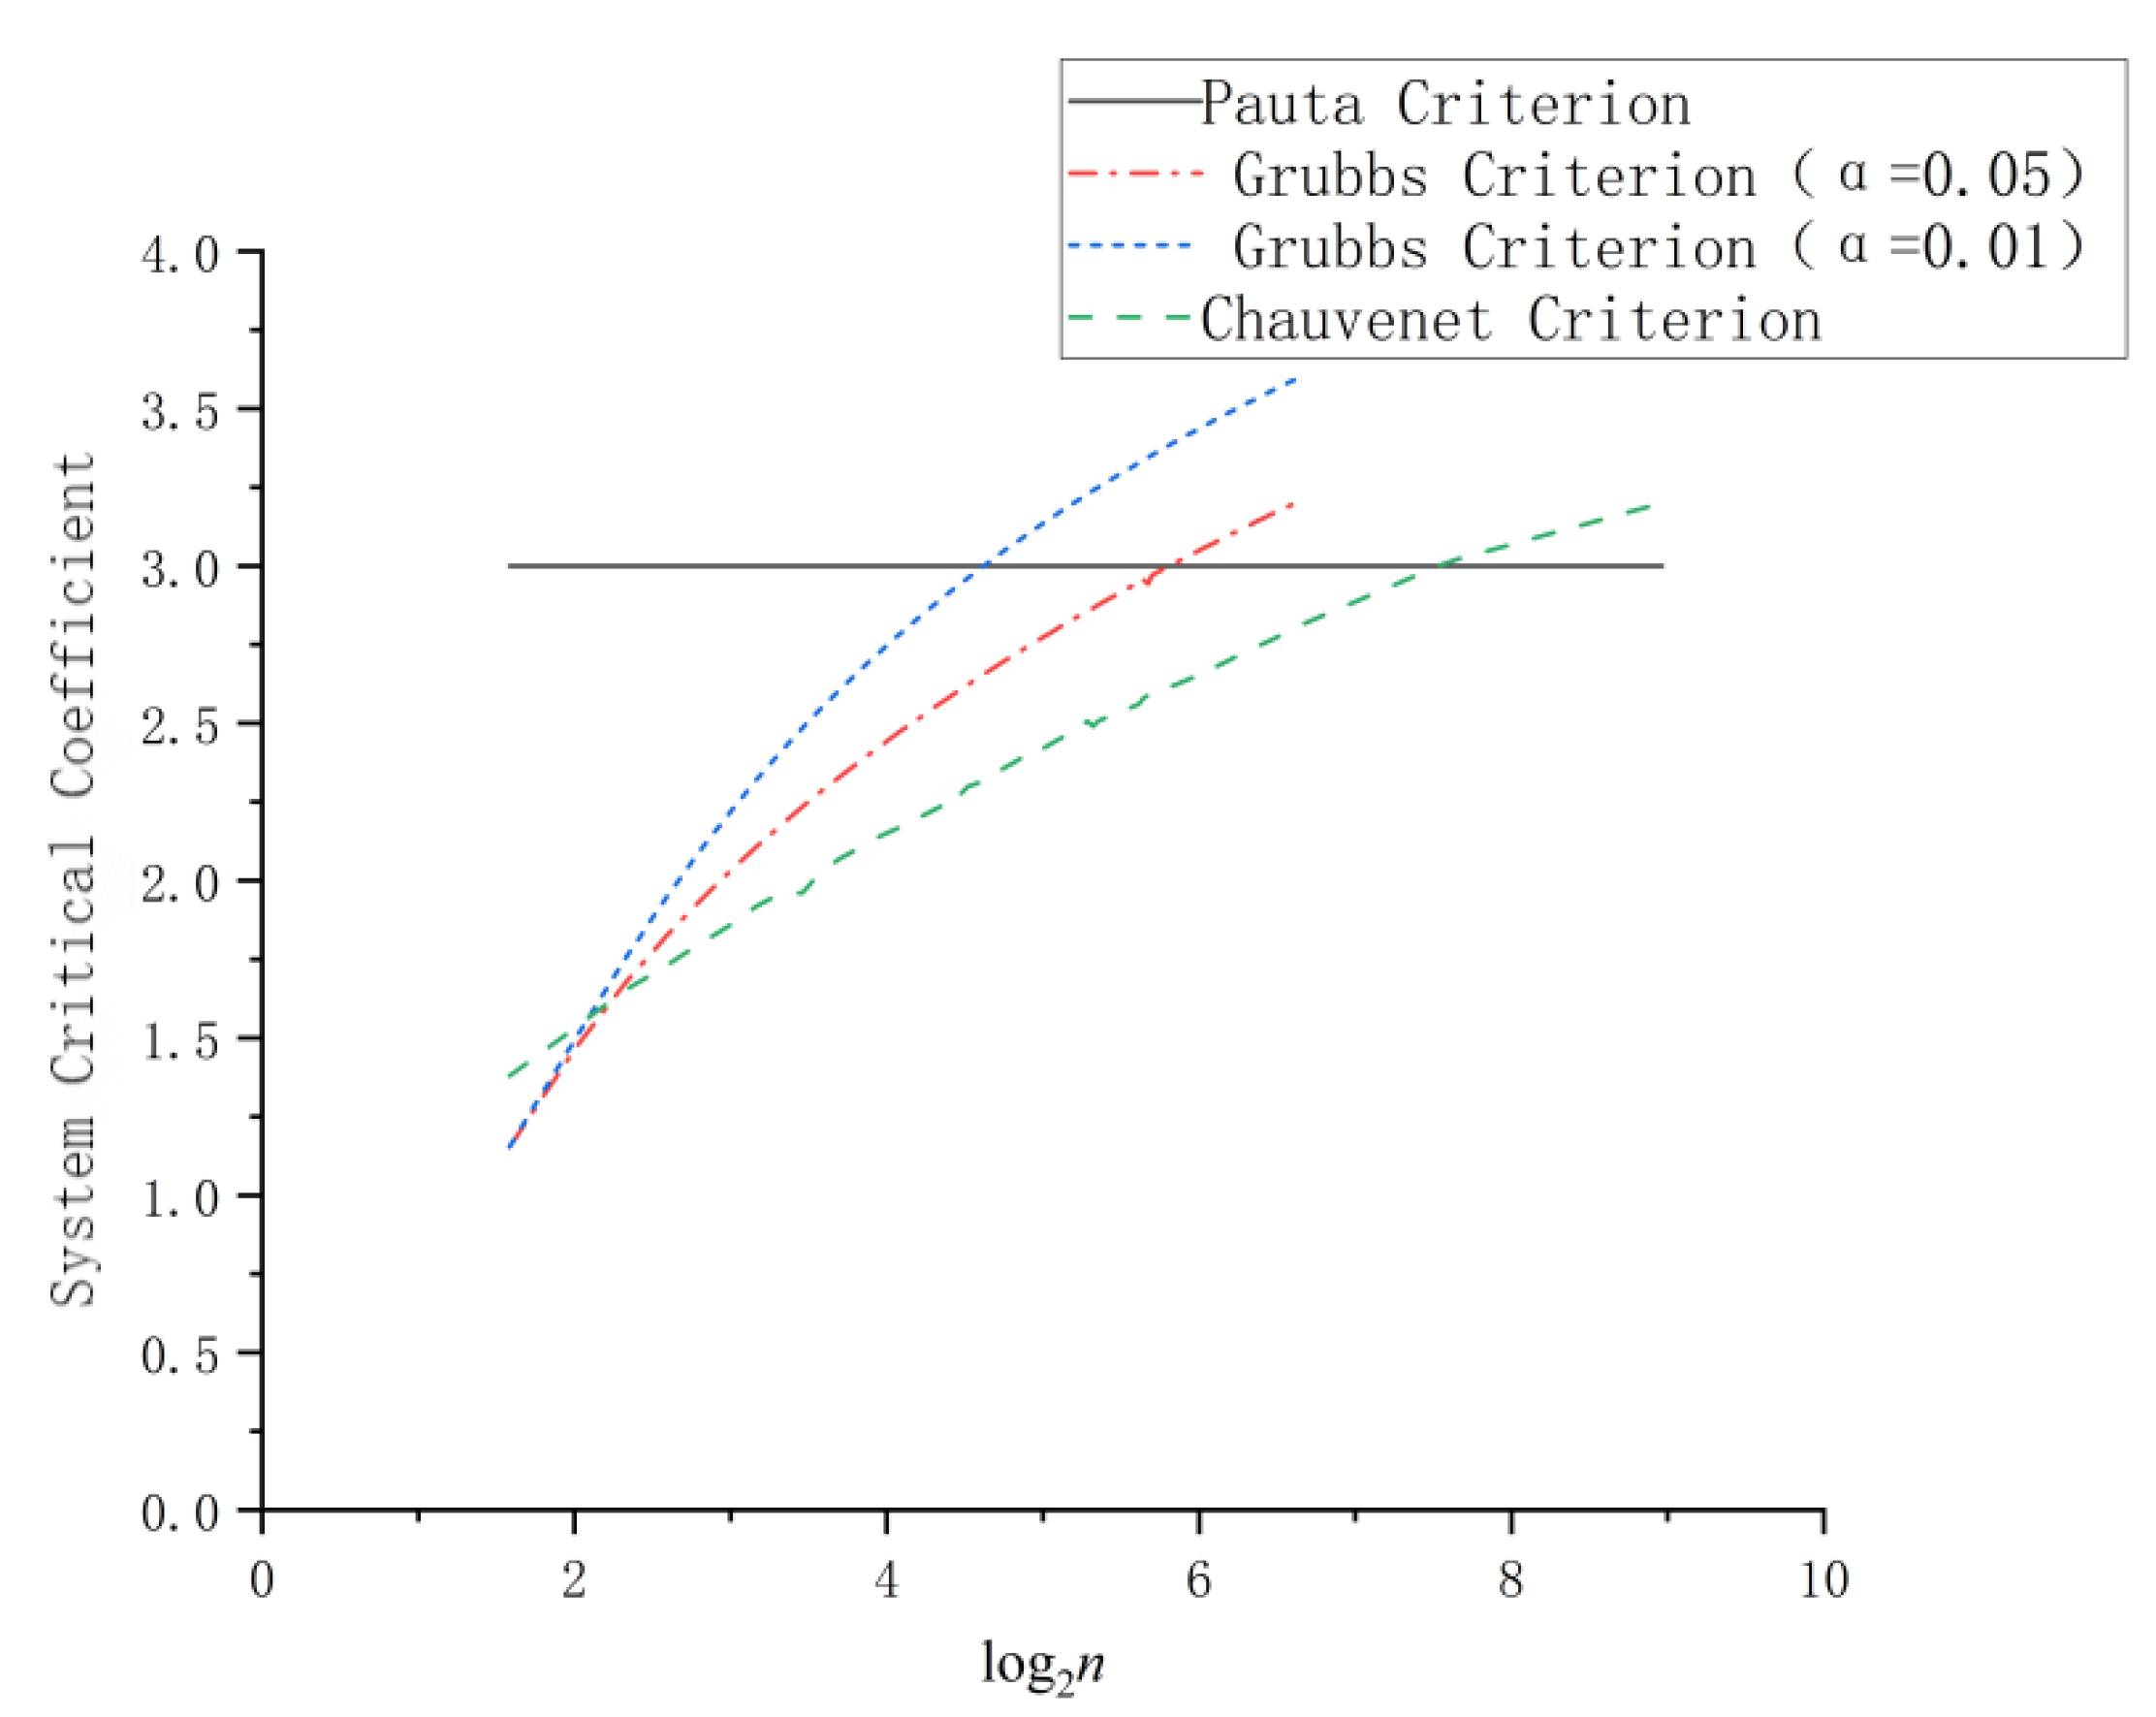
2.1. Gross Error Elimination

At present, the commonly used gross error elimination methods mainly include the Pauta criterion (3σ criterion), Dixon criterion, Grubbs criterion, and Chauvenet criterion. Among the four gross error elimination methods, except the Dixon criterion that uses the range ratio to detect outliers, the other three criteria can be summarized as follows: a set of monitoring data x1, x2, x3…, xn is calculated, and its residual v and standard deviation σ are obtained. If the residual vi of the i-th monitoring data satisfies |vi| > k σ, the monitoring value xi is considered to contain gross errors, where k is the statistical critical coefficient of the corresponding criterion. Figure 1 describes the relationship between the critical coefficients of the three criteria with the log function log2n of the sample number n as the X axis and the statistical critical coefficient as the Y axis.
The critical value of the Pauta criterion is 3σ, and three is now used as the critical coefficient index for analysis. It can be seen from Figure 1 that when the critical coefficient is three, the sample value corresponding to the Grubbs (α = 0.01) curve is n = 25, the sample value corresponding to the Grubbs (α = 0.05) curve is n = 56, and the sample value corresponding to the Chauvenet curve is n = 185. Three different sample values can be divided into four intervals for analysis.
(1) When 3 ≤ n < 25, the change rate of the Chauvenet curve is the lowest, the sensitivity is poor, and the critical coefficient is the smallest. The Chauvenet criterion tends to retain smaller monitoring data, but there is a normally distributed error with a large value in the monitoring data. In this case, the normal error will be eliminated as a gross error; so, the Chauvenet criterion should not be used. In the case of small samples, the statistical critical coefficient of the Pauta criterion is significantly larger than other criteria, and it is difficult to eliminate abnormal data using the Pauta criterion. The k value of the Grubbs criterion (α = 0.01) is larger than that of the Grubbs criterion (α = 0.05), indicating that the removal range is larger and the effect is better when α = 0.01. The Dixon criterion judges the accuracy of the data by the range ratio method, which can eliminate multiple outliers at one time and omit the process of calculating the standard deviation. Therefore, the Grubbs criterion (α = 0.01) and the Dixon criterion are more reasonable in this case.
(2) When 25 ≤ n < 56, the Grubbs curve is between the critical coefficient three of the Chauvenet curve and the Pauta criterion. At this time, the Grubbs curve with α = 0.01 is greater than three, and the Dixon criterion also exceeds the scope of application; so, the Grubbs criterion (α = 0.05) is more reasonable.
(3) When 56 ≤ n < 185, the applicability of the Chauvenet criterion is stronger, and the statistical critical coefficient of the Chauvenet criterion is smaller than that of the Pauta criterion, which can avoid missing abnormal data.
(4) When n ≥ 185, the reliability of the Pauta criterion is the strongest. At this time, the statistical critical coefficients of the other three criteria are very large. Only the test criteria of the Pauta criterion remain unchanged at three. Therefore, when the monitoring data samples are large, it is suitable to apply the Pauta criterion to eliminate gross errors [13].
The monitoring data of the tunnel is generally a small sample array. According to the previous conclusions, when the data sample n is 3 ≤ n < 25, the detection of the Dixon criterion and Grubbs criterion is more accurate. Therefore, this paper mainly uses the Dixon criterion and Grubbs criterion to calculate the monitoring data.
Early warning is required when the monitoring value reaches 60% (1.8 mm) of the maximum change rate (3 mm/d). This threshold setting is a practical choice for anomaly detection in monitoring systems. Although there is a lack of empirical or structural evidence, this threshold serves as an initial benchmark, ensuring the timely identification of potential issues. It allows for a balance between sensitivity in monitoring and practicality.
The change value of 1.8 mm at this time is used as the coarse difference to replace the monitoring data of the fourteenth period, and the detection effects of the two criteria are tested. And 1.8 mm and 2.0 mm were used as gross errors to replace the fifteenth monitoring data to test the determination of multiple outliers. The test results are shown in Table 2, where ‘zero′ represents no gross error detected, ‘one′ represents one gross error detected, and ‘two′ represents two gross errors detected.
It can be seen from Table 2 that when the abnormal value is close to and exceeds the warning value, both criteria can detect anomalies. When there are two of the same outliers, the Dixon criterion can detect the two outliers at the confidence level of α = 0.01 and α = 0.05, and the Grubbs criterion does not detect outliers. When there were two different outliers, the Dixon criterion (α = 0.01 and α = 0.05) and the Grubbs criterion (α = 0.05) detected a large outlier of 2.0 mm, but did not detect 1.8 mm, and the Grubbs criterion (α = 0.01) did not detect outliers.
The data of the fourteenth period were replaced by the arithmetic progression with 0.04 mm as the equal step size, and the same criteria were used for testing. Table 3 shows the results when the replacement data were 1.08 mm, 1.16 mm, 1.44 mm, and 1.56 mm, where ‘zero′ represented no gross error and ‘one′ represented one gross error.
It can be seen from Table 3 that with the increase in the replacement gross difference, among the four methods, the Grubbs criterion (α = 0.05) detects the anomaly first, followed by the Dixon criterion (α = 0.05), then the Grubbs criterion (α = 0.01), and finally the Dixon criterion (α = 0.01). According to Table 2 and Table 3, in the case of a small sample of data, the Grubbs criterion (α = 0.05) is the most sensitive and the Dixon criterion (α = 0.01) is the worst. The detection effect of the four methods was ranked as follows: Grubbs criterion (α = 0.05) > Dixon criterion (α = 0.05) > Grubbs criterion (α = 0.01) > Dixon criterion (α = 0.01). The preference for Grubbs criterion over the Dixon criterion is due to the small sample size in this study. Although the Dixon criterion can detect multiple outliers, the Grubbs criterion (α = 0.05) identifies the larger one (2.0 mm) when dealing with two distinct outliers (1.8 mm and 2.0 mm), which is vital for a risk assessment. Given the importance of the timely detection of significant anomalies in underground passage monitoring, the Grubbs criterion (α = 0.05) is more suitable for detecting larger anomalies in small samples.

2.2. Interpolation Processing

The interpolation methods mainly include linear interpolation, nearest neighbor interpolation, Lagrange interpolation, and Newton interpolation. The data of the monitoring points selected in this paper are complete data, and there is no problem of missing monitoring data. In order to facilitate the interpolation processing, the rand random function is used to randomly eliminate one data from the monitoring data of K0 + 625 in periods 1–8, 9–16, and 17–24, respectively, construct three missing value sequences, and carry out three random elimination tests. Four interpolation methods are used to interpolate the missing value sequences. The calculation results retain the last five decimal places, and the processing results are shown in Table 4, Table 5 and Table 6.
Based on the analysis of Table 4, Table 5 and Table 6, it can be seen that the nearest neighbor interpolation method has the largest error when dealing with a single missing value. The errors of the Lagrange method, Newton method, and linear interpolation method are high or low in different intervals. In general, the linear interpolation method is more suitable for the linear distribution of monitoring data. However, tunnel deformation is often nonlinear, such as in logarithmic creep scenarios. The suitability of linear interpolation depends on the specific deformation characteristics observed. When deformation is predominantly linear, it offers a simple and computationally efficient solution. For nonlinear cases, more complex methods like Newton interpolation are recommended. The choice of linear interpolation is based on its efficiency and accuracy in specific contexts, but other methods are needed for nonlinear trends to ensure consistency with actual deformation data. The Lagrange interpolation method and Newton interpolation method have little difference. However, the Lagrange interpolation method has shortcomings. This method has no inheritance. The whole calculation work must start again when the nodes increase, and the calculation accuracy will decrease when there are too many missing points. The Newton interpolation method avoids the above problems. Therefore, when the construction function is relatively complex, the Newton interpolation method is more applicable.
The tunnel monitoring data in this paper are all collected from the sensor of Kaiyuan Road–Jianyuan Road Tunnel Project, which belong to a small sample of data, and there is no interruption of monitoring data during the monitoring period of the project. Based on the analysis of the previous example, the gross error elimination processing of all monitoring data is carried out using the Grubbs criterion (α = 0.05). The monitoring data after gross error processing will be used as the data basis for the subsequent visual early warning of the tunnel IFC model.

3. IFC-Based Tunnel Monitoring Information Integration Model

3.1. IFC Infrastructure

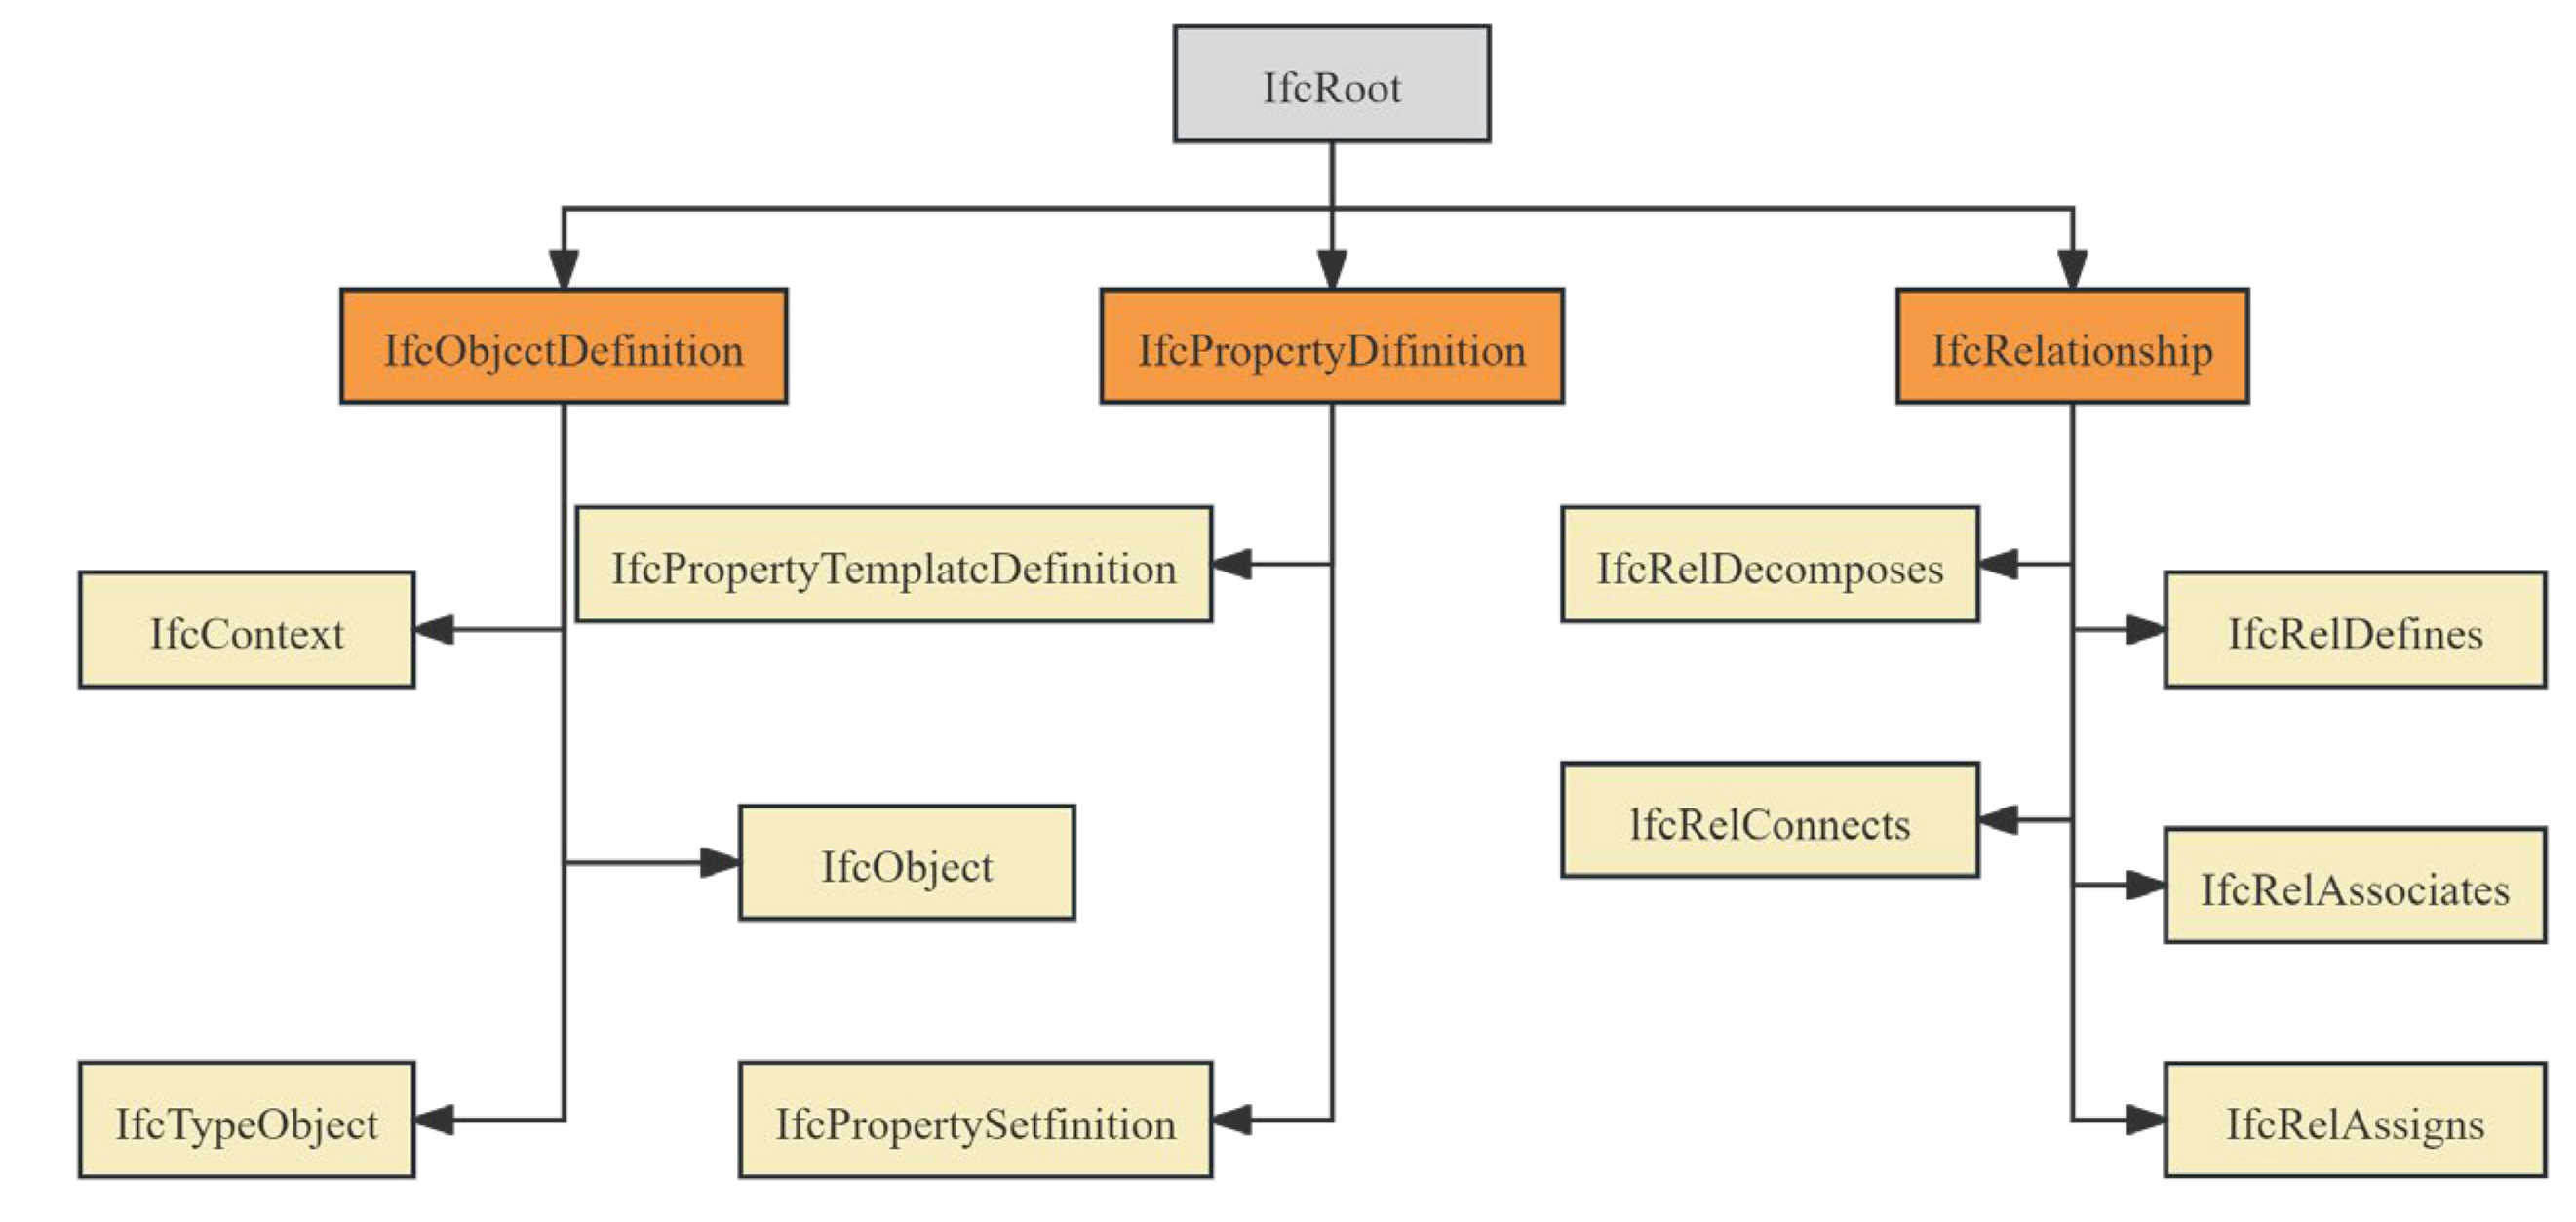
3.1.1. IFC Standard Data Framework

IFCs (Industry Foundation Classes) are defined as ‘industry-based standards‘ and have developed into an industry-recognized information exchange standard format. IFCs represent a common standard for BIM information interaction using different software by the designers of various specialties throughout the life cycle of the building. They provide a data structure that expresses BIM model information and unifies the file format for data interaction [14]. The IFC standard defines the description rules of entities and their attributes. It integrates the rule relationships between entities and entities and between entities and attributes. The IFC model is a data model generated based on the IFC standard [15].
The IFC4 standard divides the IFC information architecture into four levels: a resource layer, core layer, sharing layer, and domain layer. Each level is subdivided into multiple modules. According to the IFC standard, the resources at all levels cannot refer to each other, and the target object can only refer to resources in the same layer or a lower layer, and cannot refer to resources in the upper layer. Therefore, after the resource attributes of the upper level change, they will not affect the lower level [16].

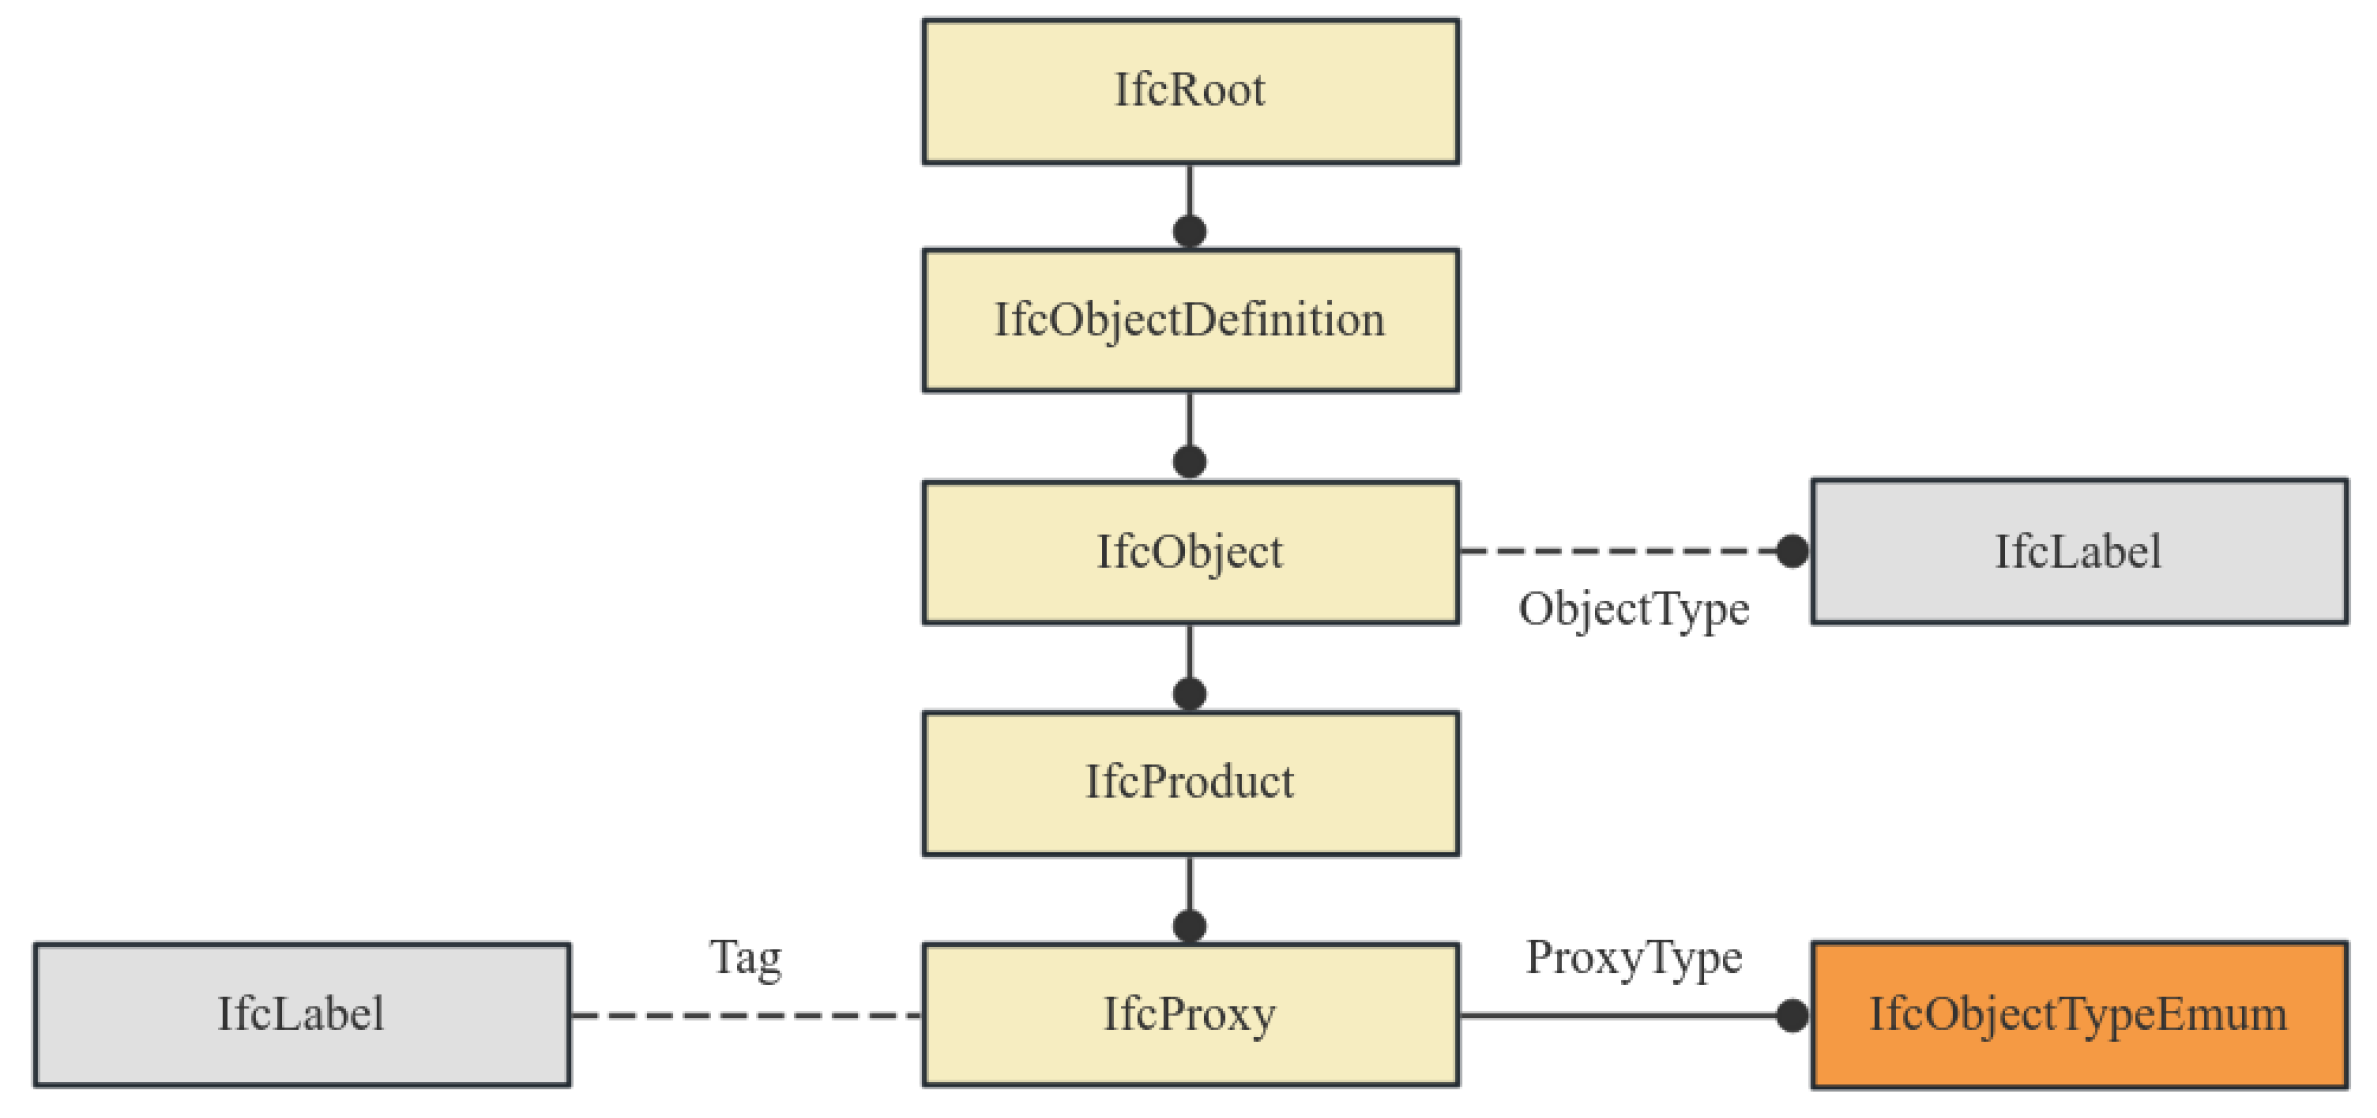
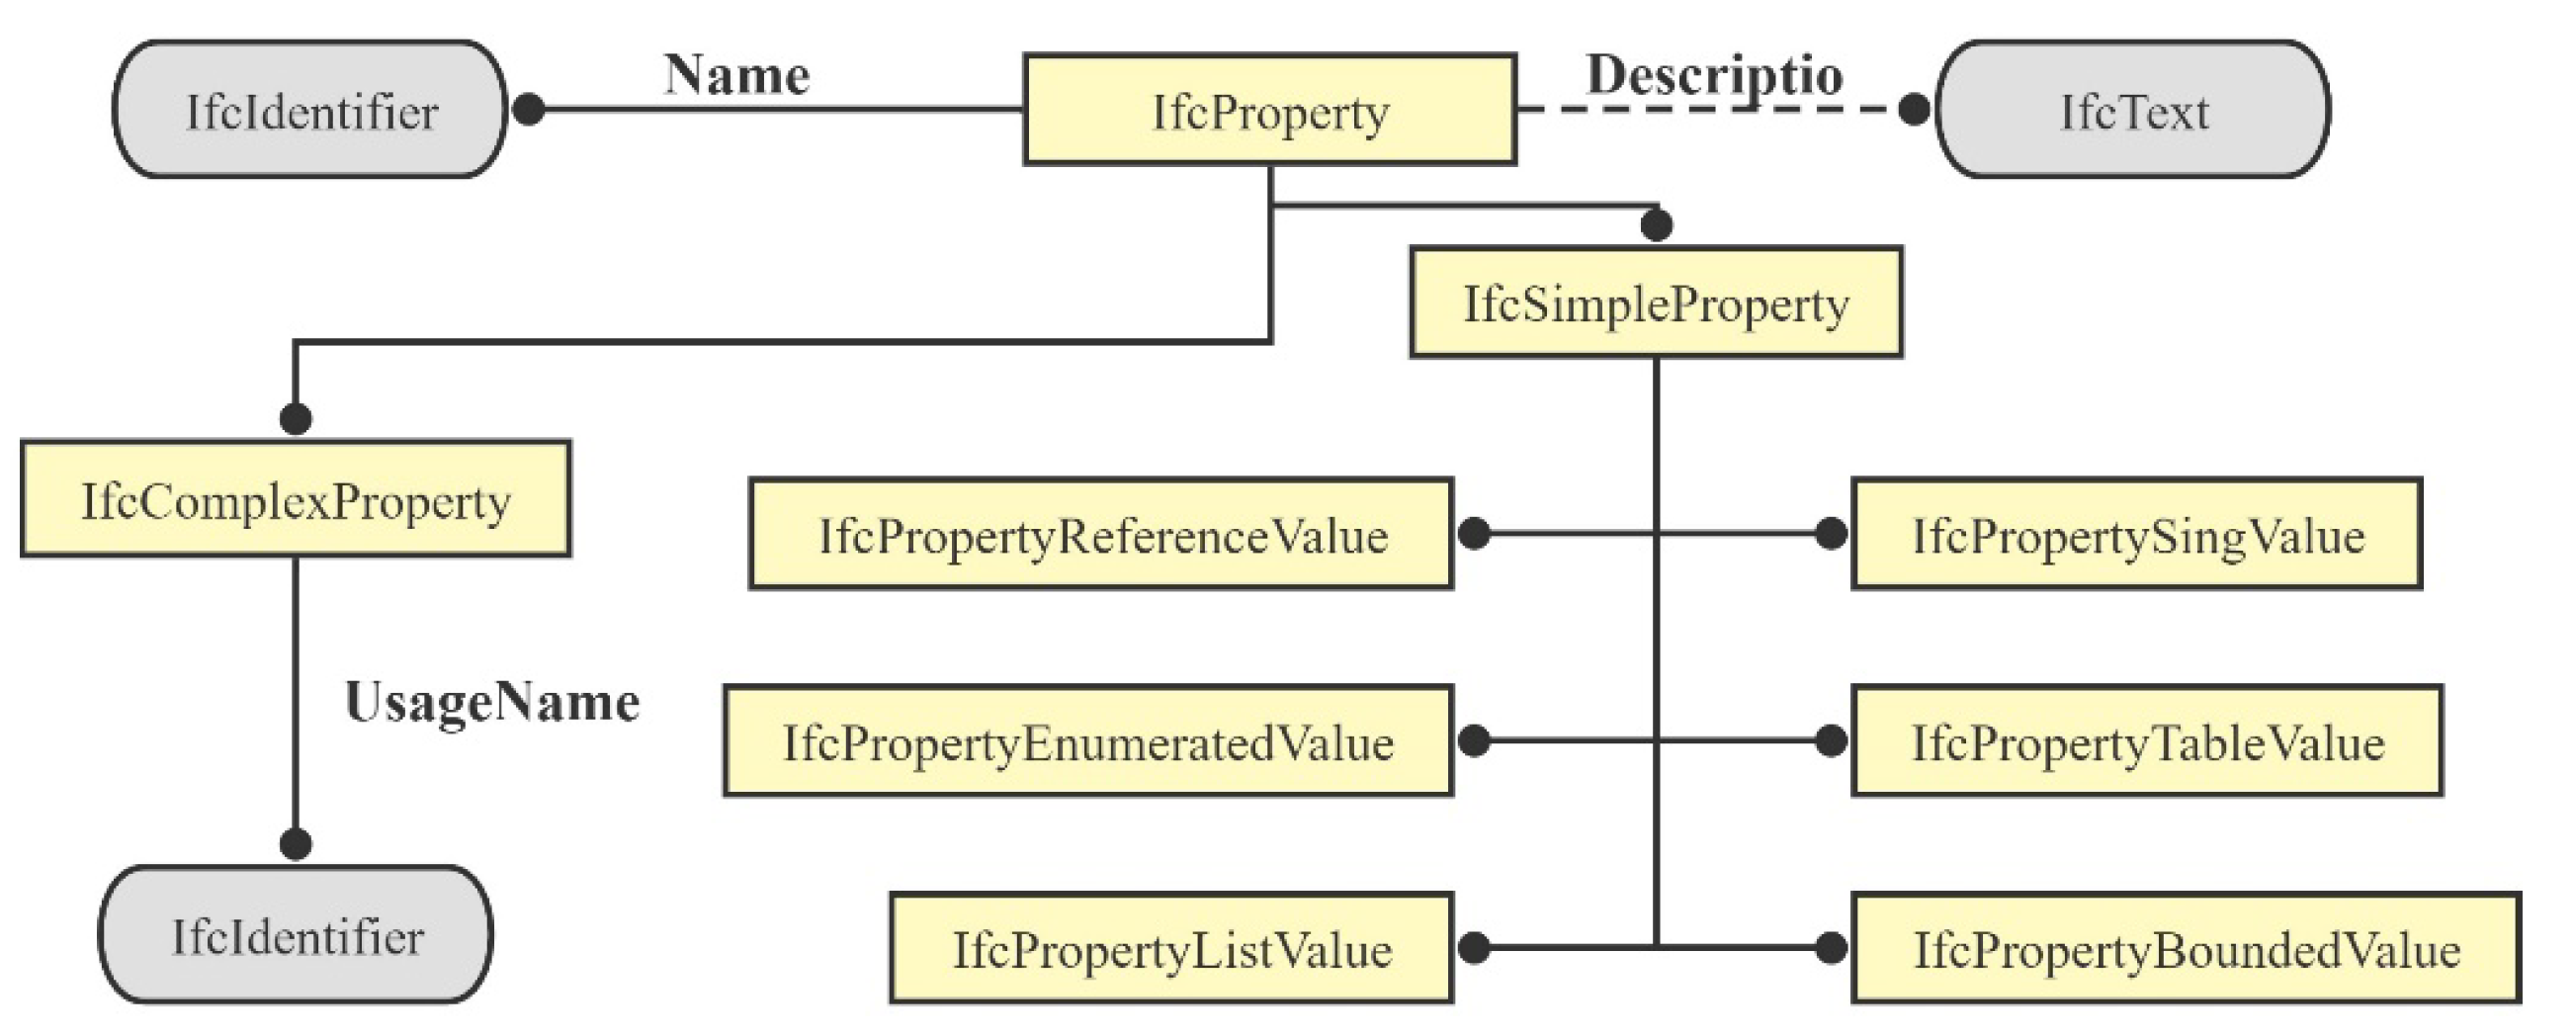
3.1.2. IFC Definition of Entity

The complete IFC file of the project contains the basic building information provided by IfcProject, the spatial location provided by IfcBuilding, and the geometry provided by IfcBuildingElement [17]. Entity is an important part of building the IFC framework, which contains the parameter information of the BIM model. Entities integrate various attributes or attribute sets, and can be defined and extended by users [18]. The entities that can be extended in the IFC standard are differentiated from IfcRoot. IfcRoot has three sub-class entities, IfcRelationship, IfcObjectDefinition, and IfcPropertyDefinition, as shown in Figure 2.

3.1.3. IFC Standard Extension Method

(1) Extension based on the IfcProxy entity
IfcProxy is equivalent to a container that can wrap objects with attribute definitions. These objects have different geometric representations and spatial locations in space because of different attribute definitions. IfcProxy is located in the core layer of IFCs, which is a subclass of IfcProduct. It can define an entity that is not defined in the IFC version and extend the entity by instantiating the defined entity and describing the entity to add attributes and information, as shown in Figure 3. The extension method based on IfcProxy entity is clear and easy to operate. The disadvantage is that the extension operation efficiency is low and it is not suitable for information extension containing a large number of models.
(2) Extension based on the entity definition
Entity-based definition extension is an entity definition added to the existing IFC standard definition architecture system. It is generally a supplement to specific professional fields that are not within the IFC architecture. It is equivalent to the update and improvement of the IFC architecture. The IFC version update is based on the entity definition extension. The efficiency of the extension method is very high, but the actual implementation is very difficult, and the extended entity model information cannot be identified by the software. Before the entity expansion, we must first retrieve the IFC overall framework, determine that there is no conflict between the new entity definition and the existing entity definition, and ensure that the architecture of the new entity strictly implements the definition and reference rules of the IFC annotation architecture.
(3) Extension based on the attribute set
The extension based on the attribute set is to define a new attribute to express entity information on the basis of the existing attribute set, and the new attribute belongs to the same attribute set. In the IFC standard, attribute types include enumerated values, list values, reference values, single values, table values, bounded values, etc. These single attribute values are collectively referred to as simple attributes; complex attributes can be combined by multiple single attribute values or nested in another complex attribute [19], as shown in Figure 4. The extension based on the attribute set must meet the standard requirements of the current IFC version and ensure that the extension of the attribute is within the IFC architecture. The type of the attribute must be correctly selected in order to make the extended attribute set correctly expressed and meet the actual needs of the project.

3.2. Tunnel Structure Expression Based on IFCs

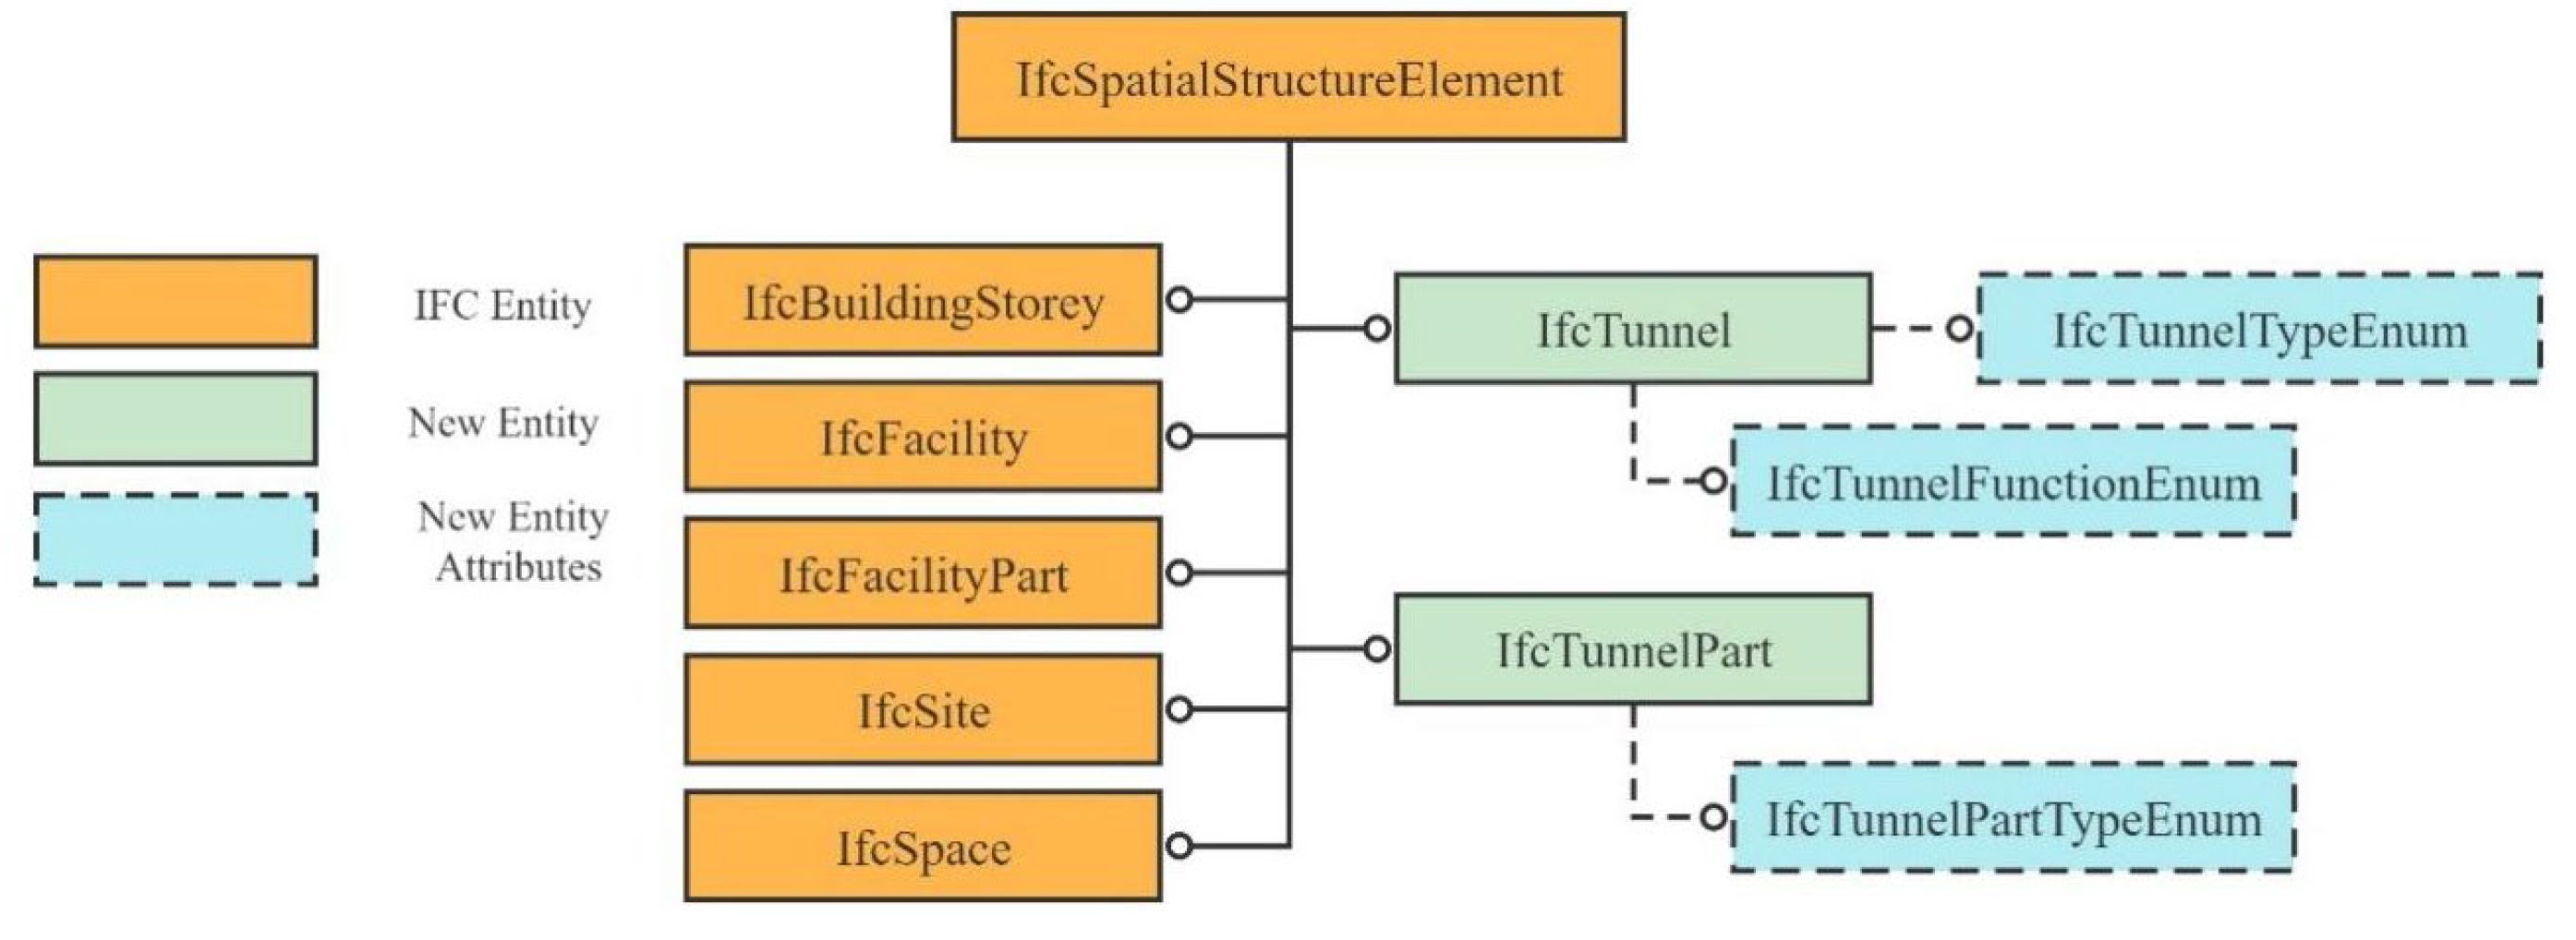
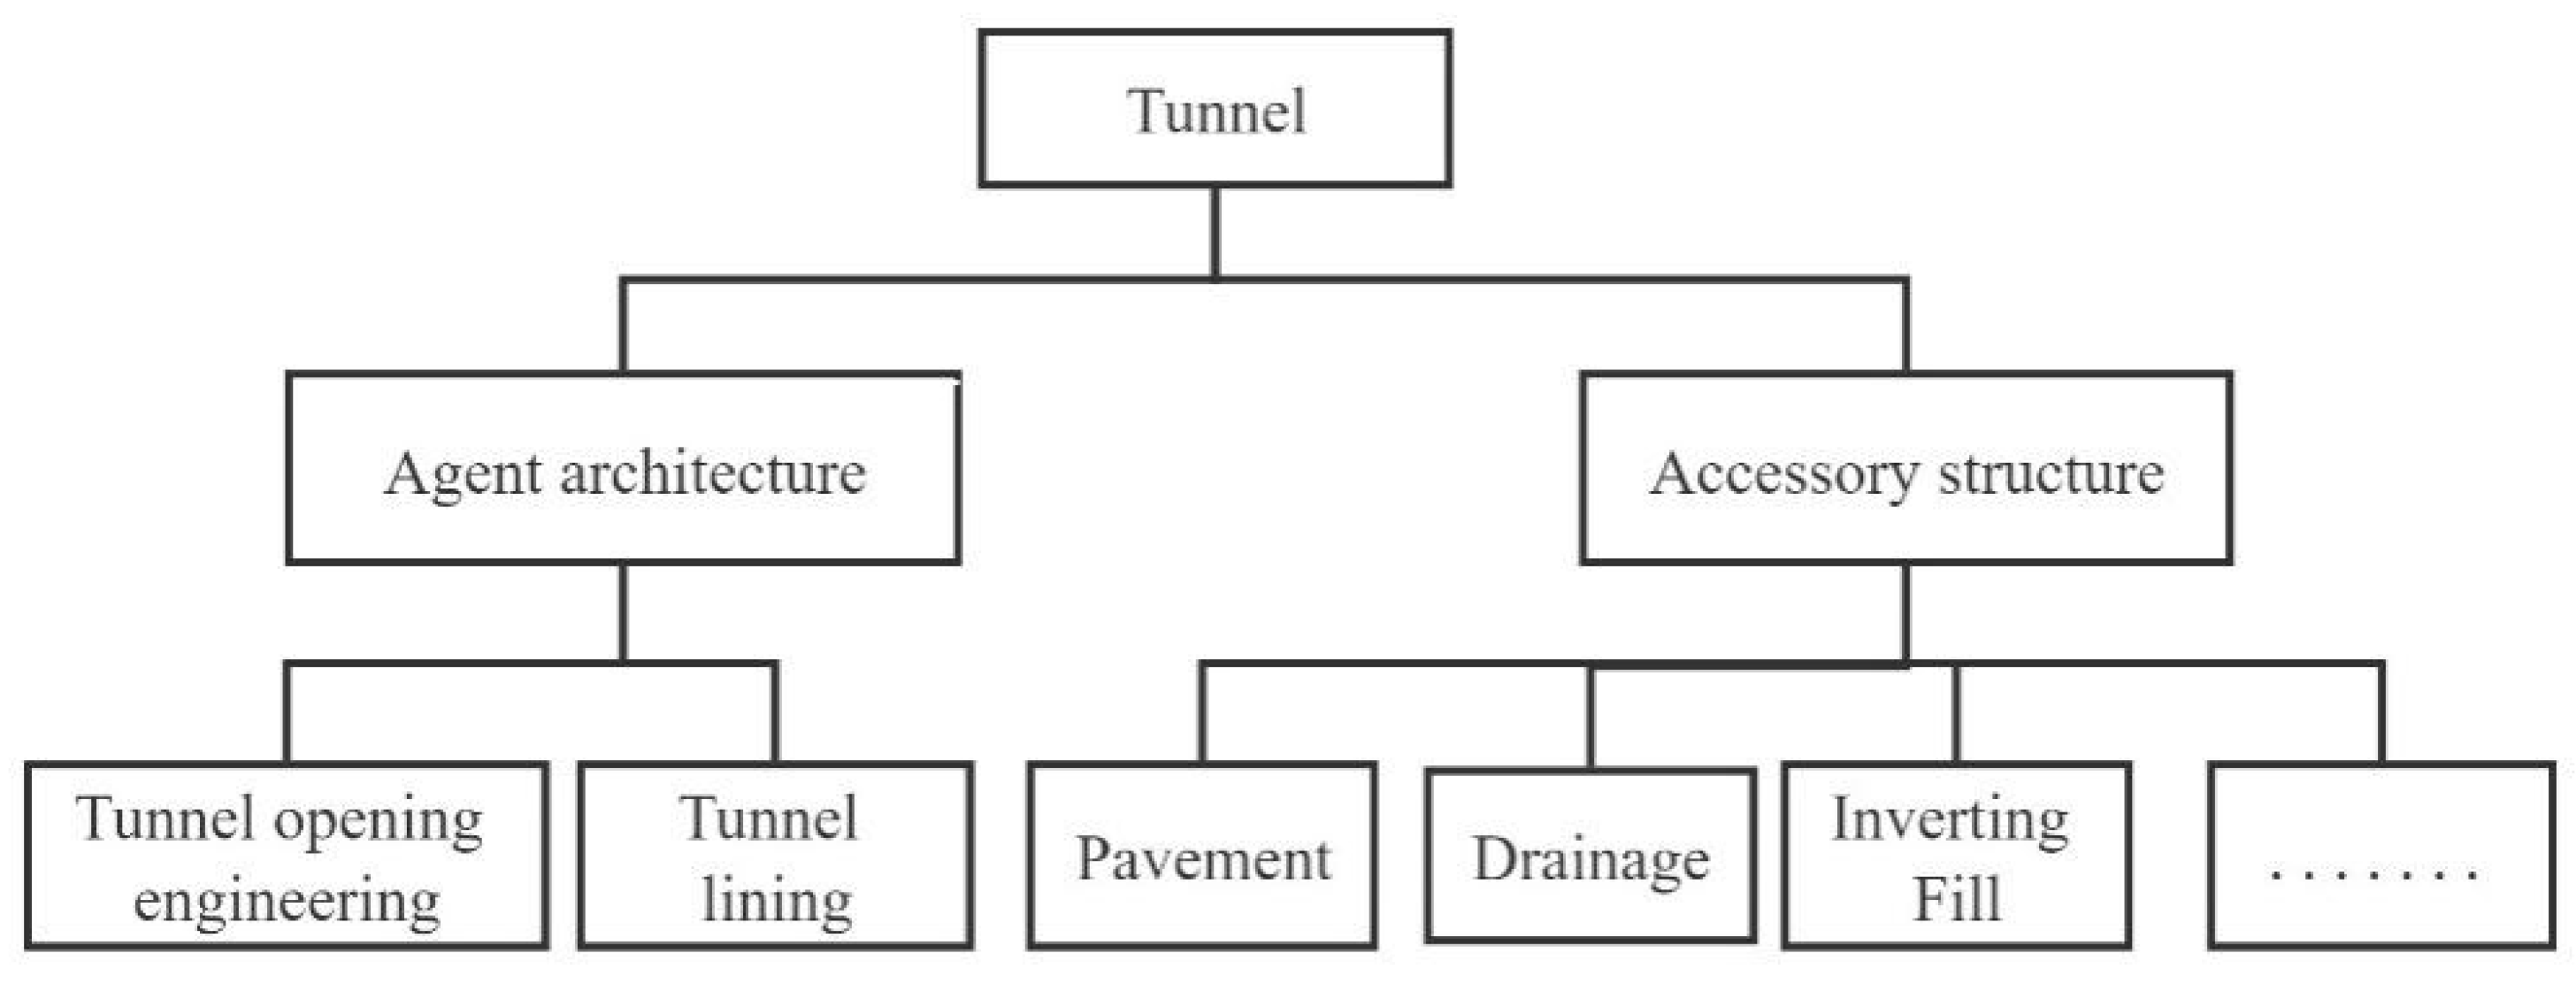
3.2.1. Definition of the Tunnel Spatial Structure

In the IFC standard, in order to facilitate project management, the project is divided into subsets in the IFC file, and the set of these subsets is the spatial structure of the project; the tunnel IFC spatial structure decomposes the tunnel into various tunnel structures, and each structure can be decomposed into more detailed components. The IFC standard does not describe the relevant definitions of highway tunnels, and so this paper adds the entity definition of tunnel spatial structure to the existing IFC framework system. At present, the architectural domain classes in the IFC standard are inherited from the subclasses derived from the IfcSpatialStructureElement, such as facility, site, and space. On this basis, this paper adds IfcTunnel (tunnel) and IfcTunnelPart (tunnel structure) to realize the definition of the tunnel spatial structure, as shown in Figure 5.

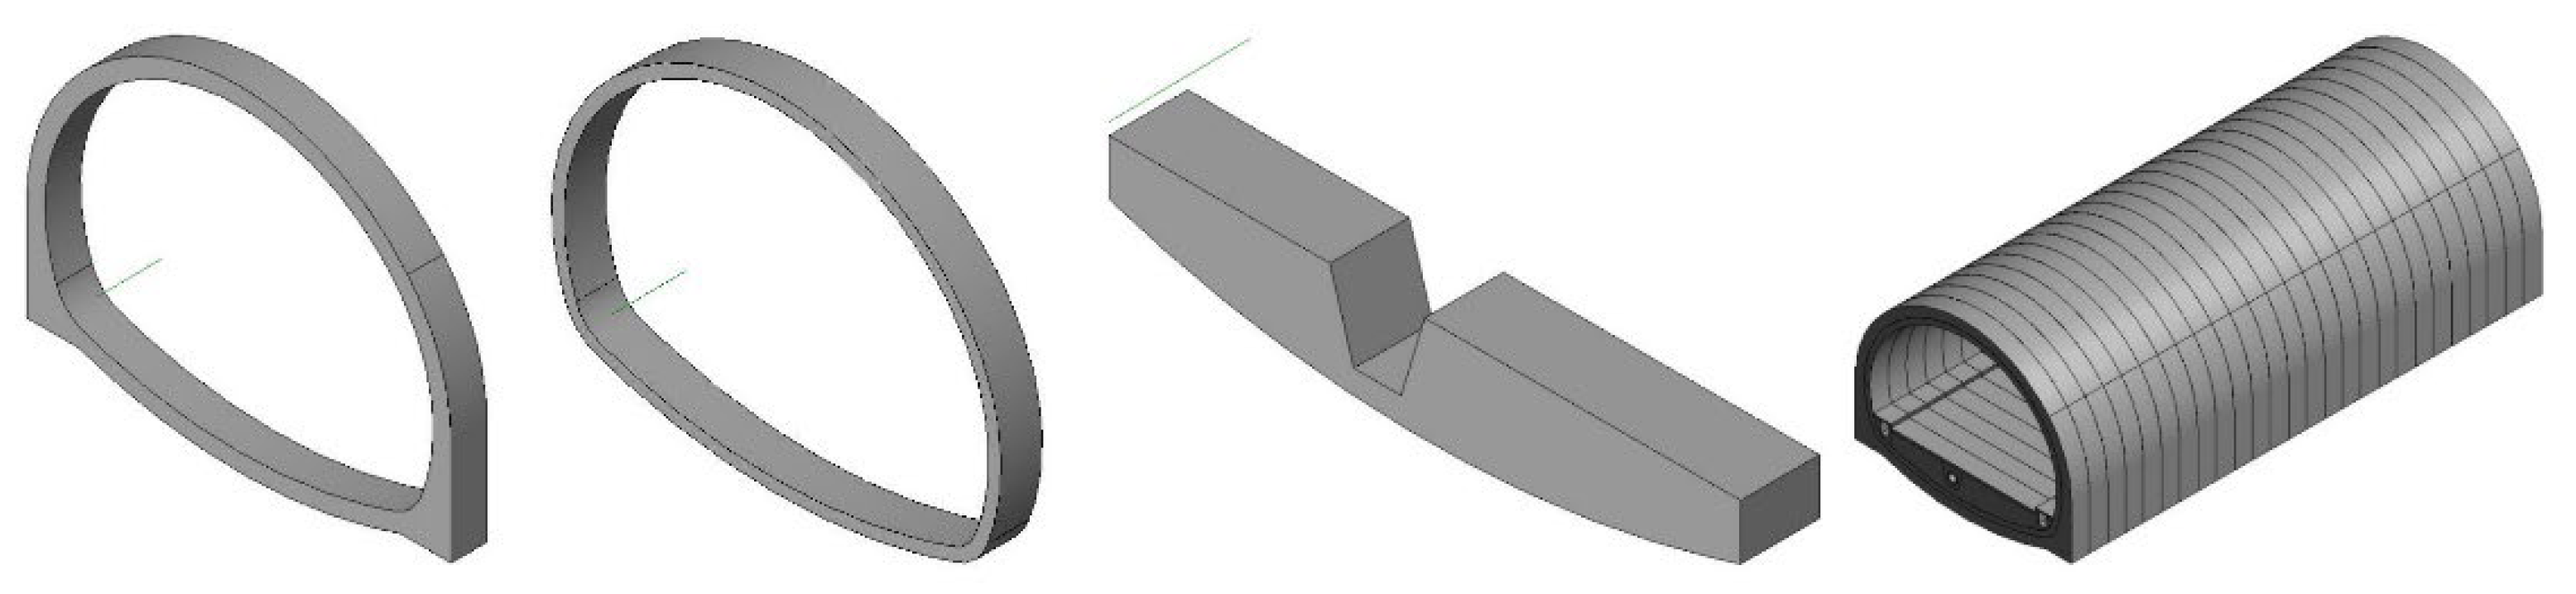
3.2.2. Definition of the Tunnel Geometry

From the perspective of the geometric structure, the tunnel is composed of a lining profile, inverted arch filling, and steel frame. These structures also lack of definitions in the IFC standard, and so defining their corresponding entities in IFCs is necessary. Firstly, IfcTunnelElement is added under the subclass IfcCivilElement of IfcElement. Then, under the IfcTunnelElement, entities such as IfcInitialSupport, IfcSecondaryLining, IfcForepoling, IfcSurroundingRock, IfcSteelStructure, IfcAnchorRod, and IfcInvertedArchFilling are added. The specific structure is shown in Figure 6.

3.3. IFC Extension of the Tunnel Structure

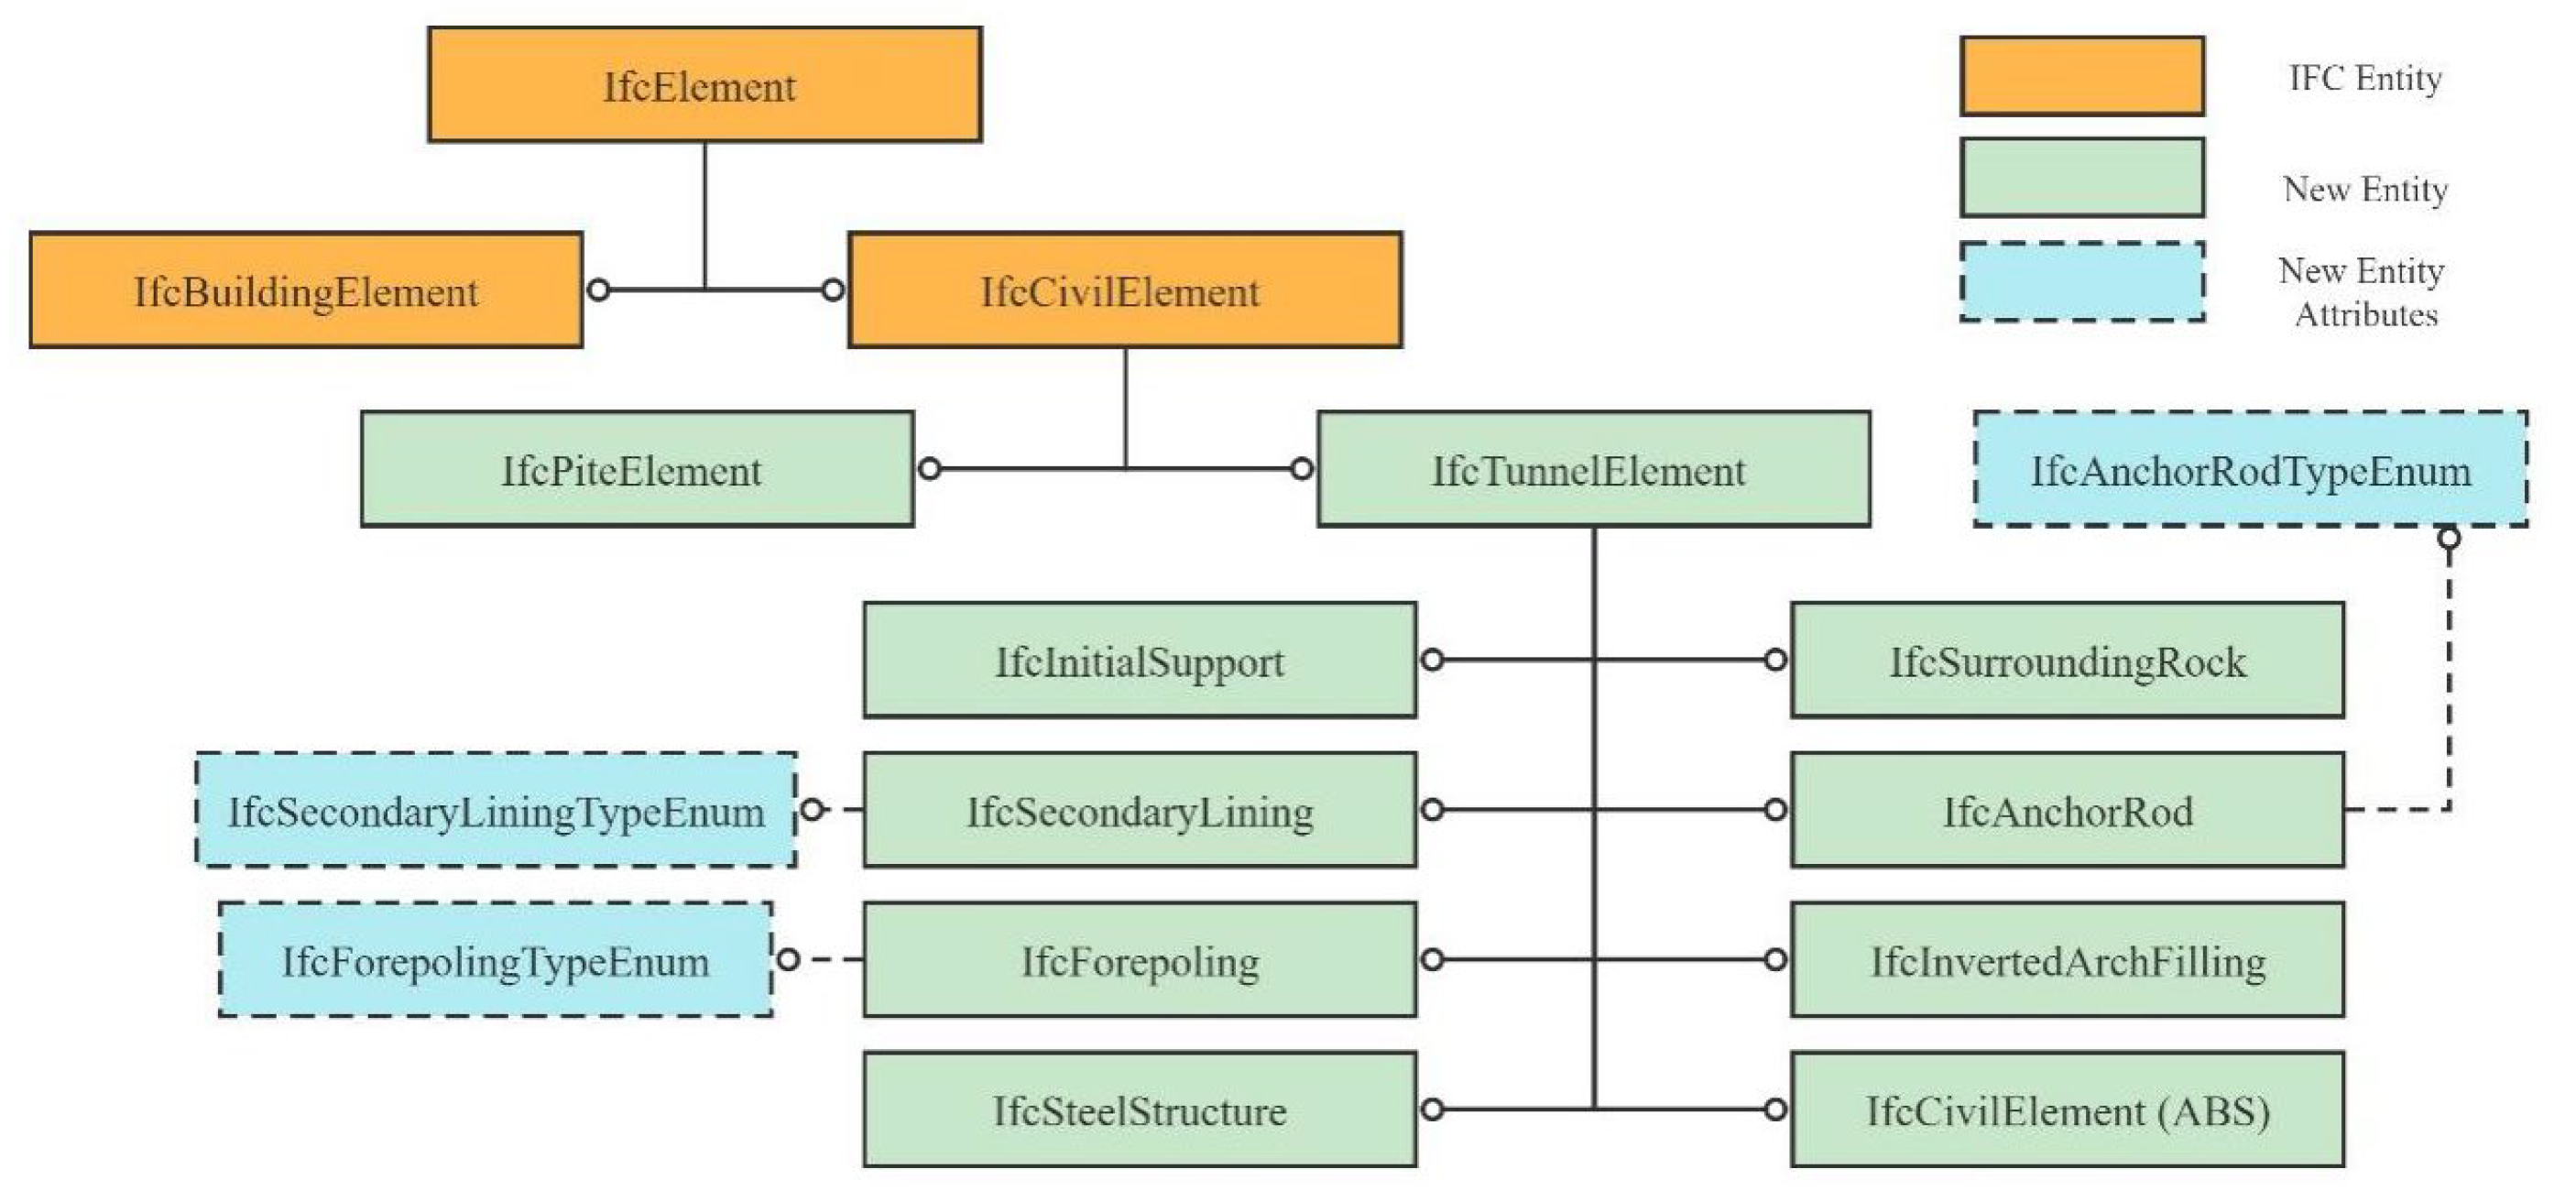
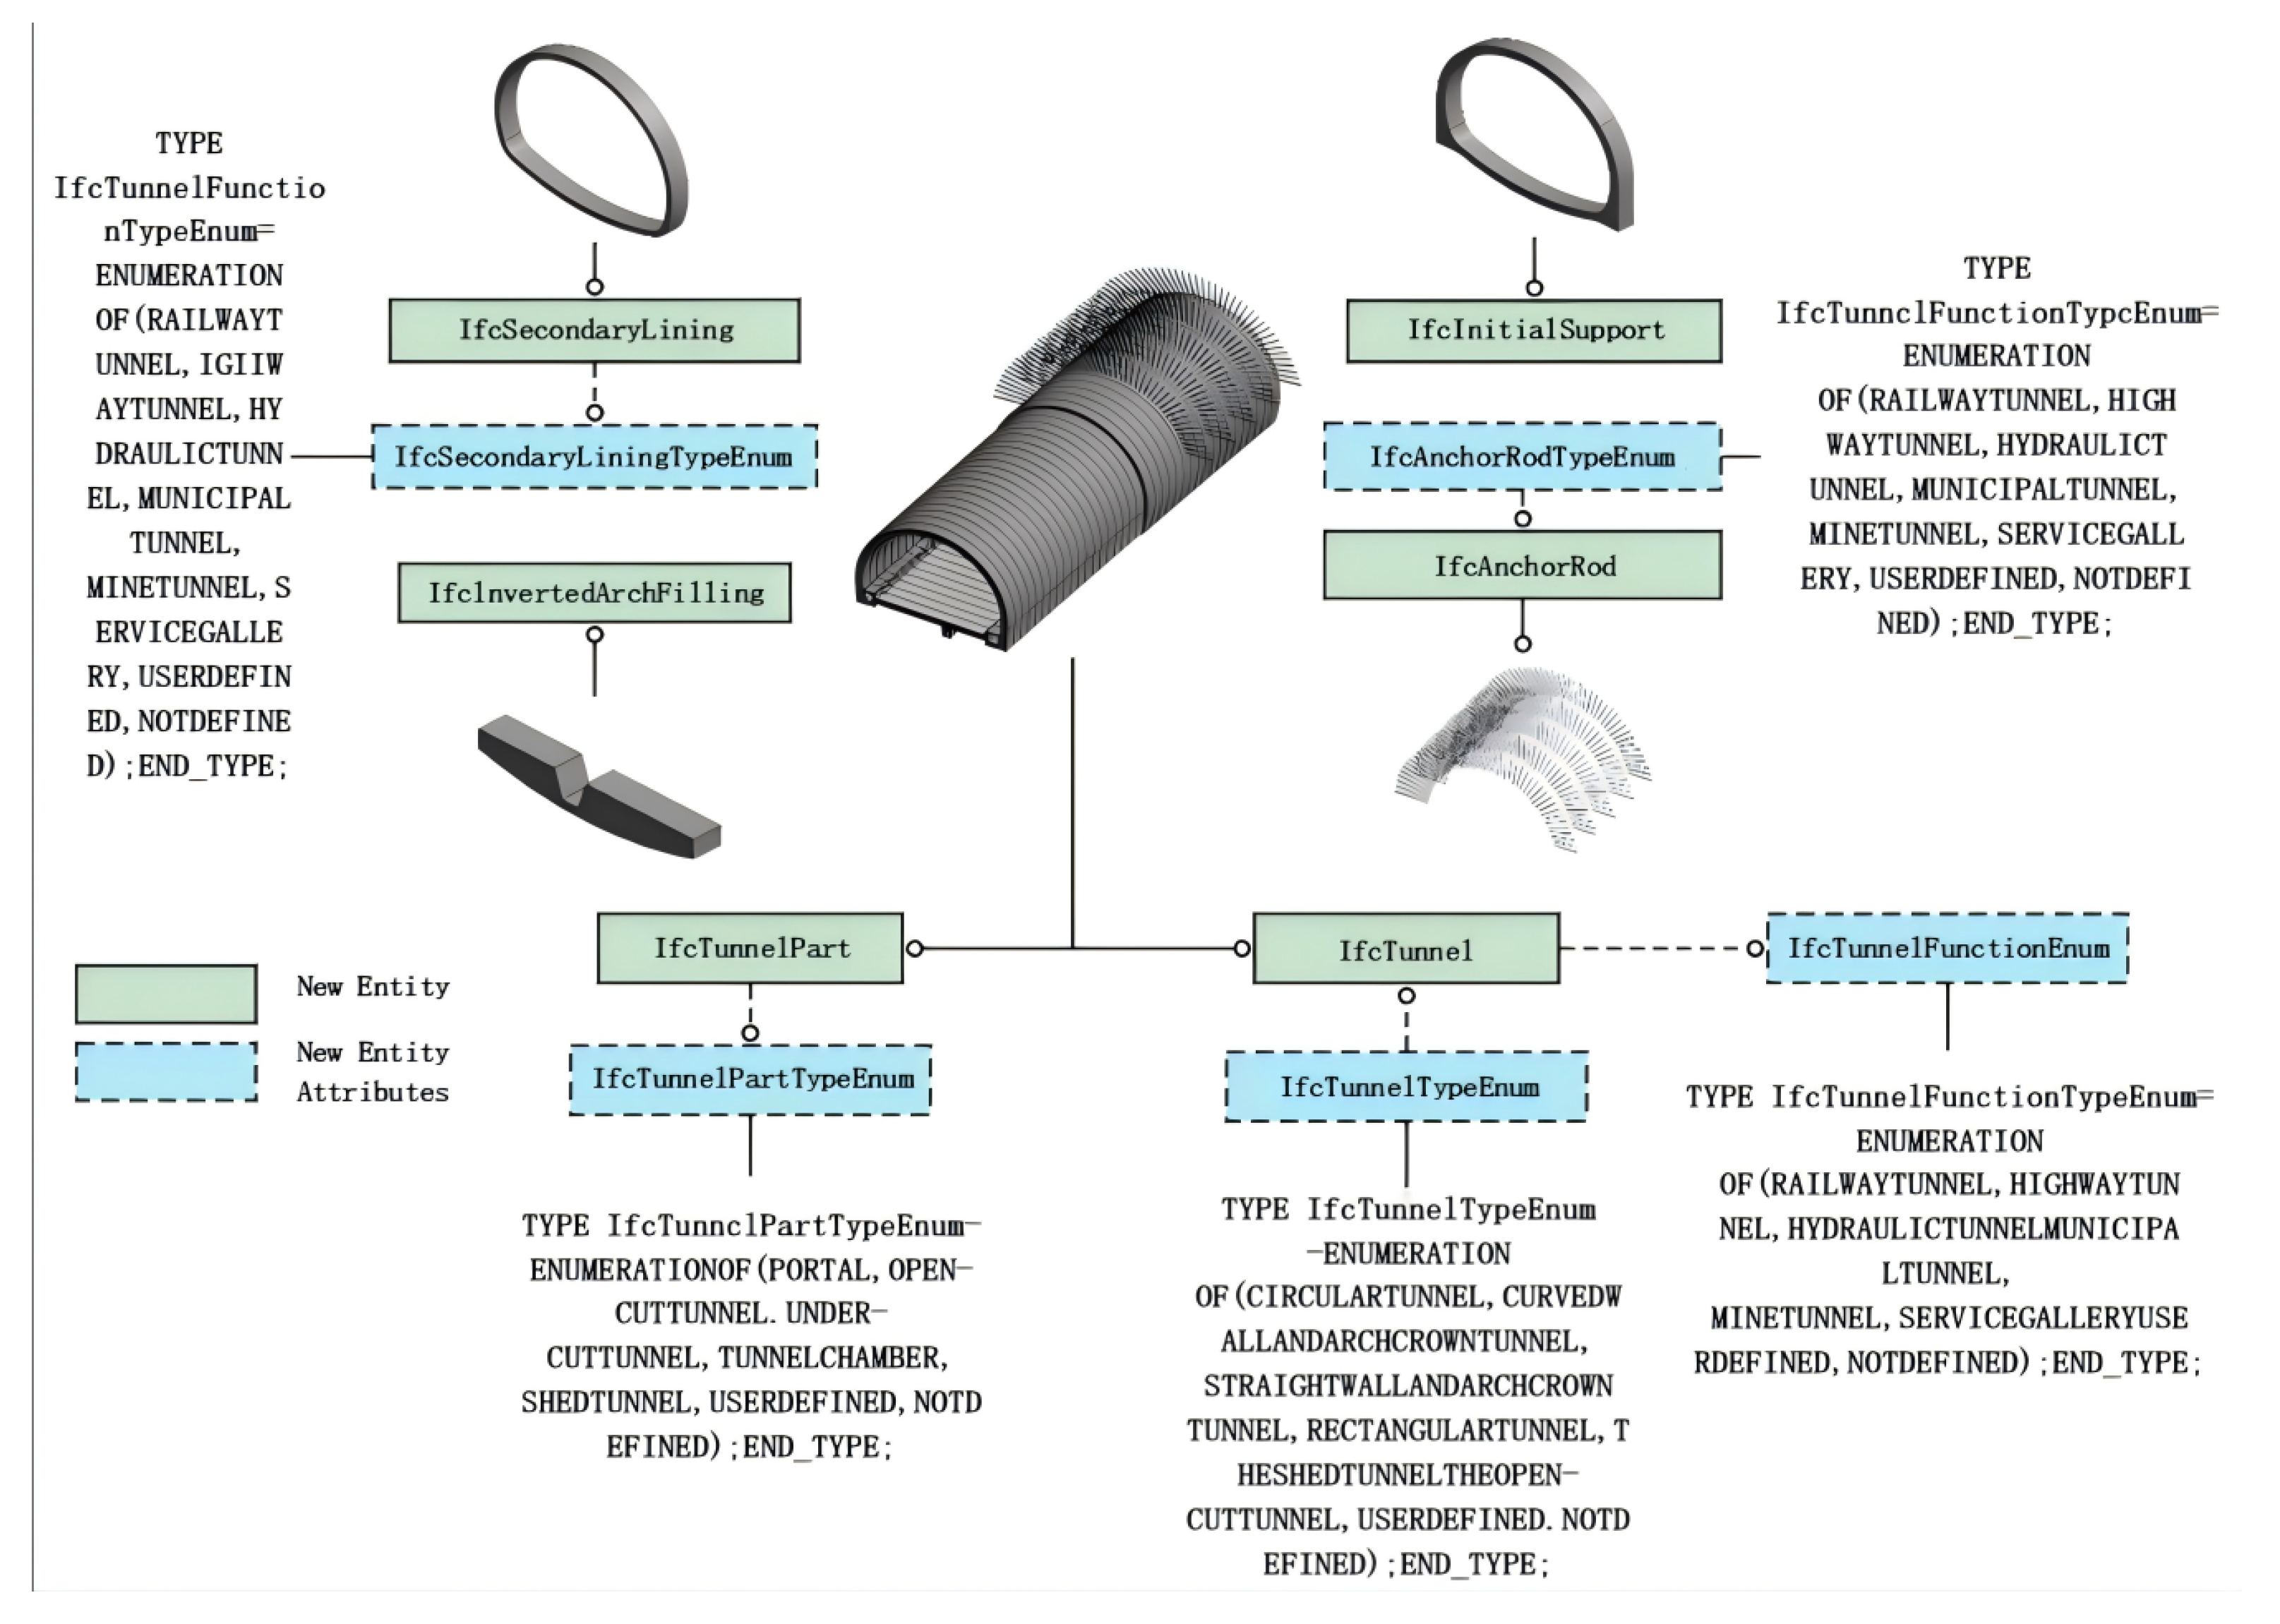
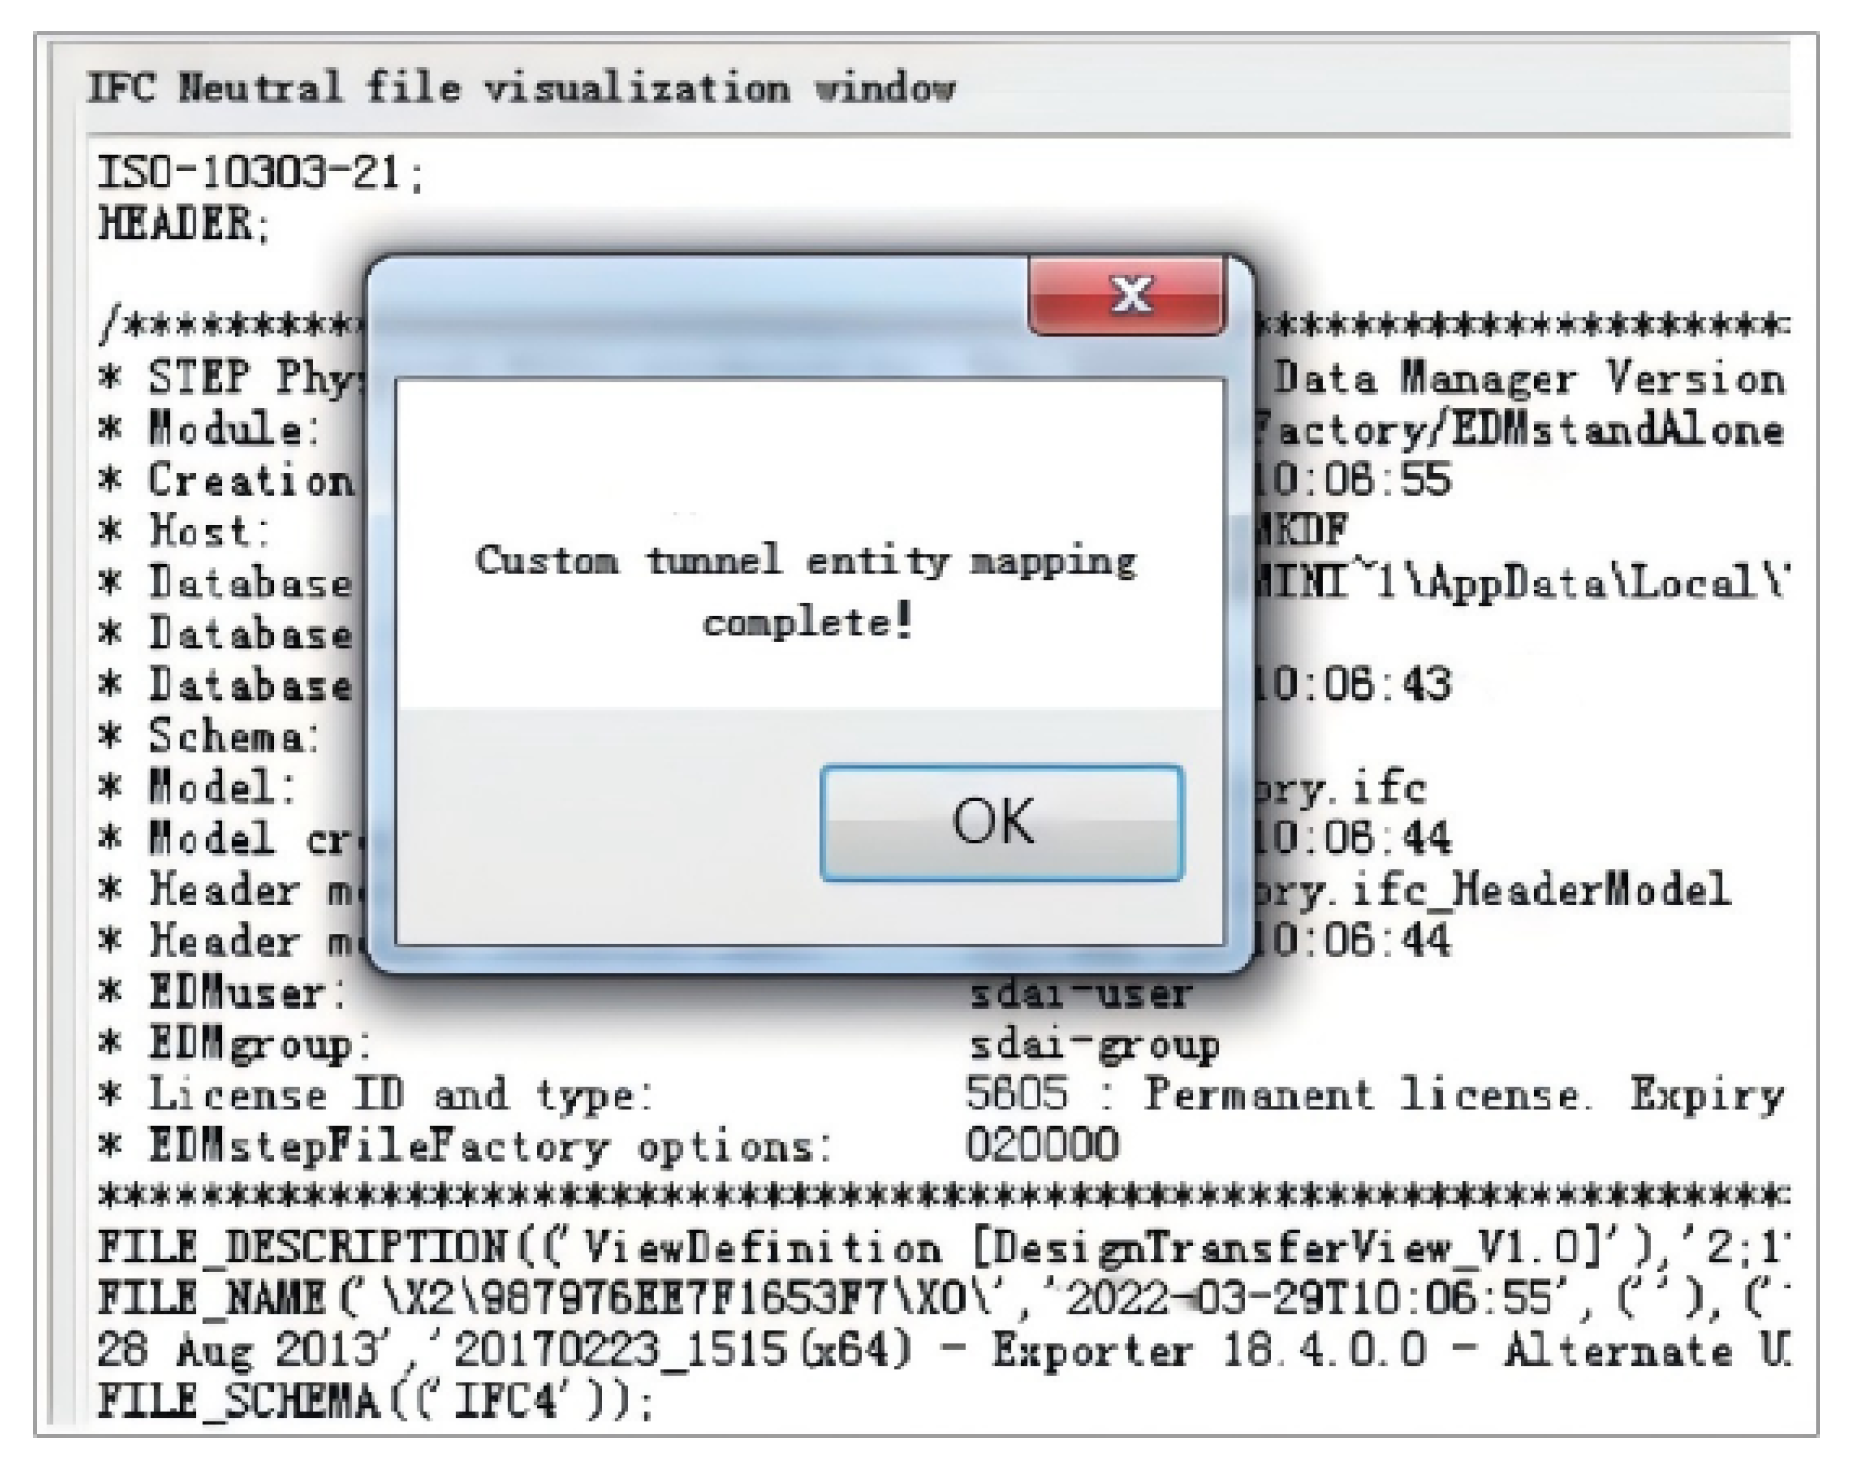
3.3.1. Definition of the Tunnel Entity Based on IFCs

Based on the description and inheritance relationship of the spatial structure and geometric structure of the tunnel mentioned above in the IFC standard, the entity and type of the tunnel structure are described by the Express language, and then the tunnel entity and tunnel type are added based on the Express standard file. And attributes such as TypeEnum and Where are added. The IFC4× version adds a predefined type attribute to some entities. By defining this attribute, the tunnel spatial structure and geometric structure and their types can be predefined in the IFC architecture to ensure that the tunnel structure is described using the same entity. Based on the entity definition of the building field in the existing IFC standard, this paper adds IfcTunnel and TypeEnum, IfcAnchorRod, and IfcSecondaryLining to the IFC standard file. The definition of the tunnel IFC structure is shown in Figure 7. The expanded IFC standard can be used for BIM applications in tunnel construction design.

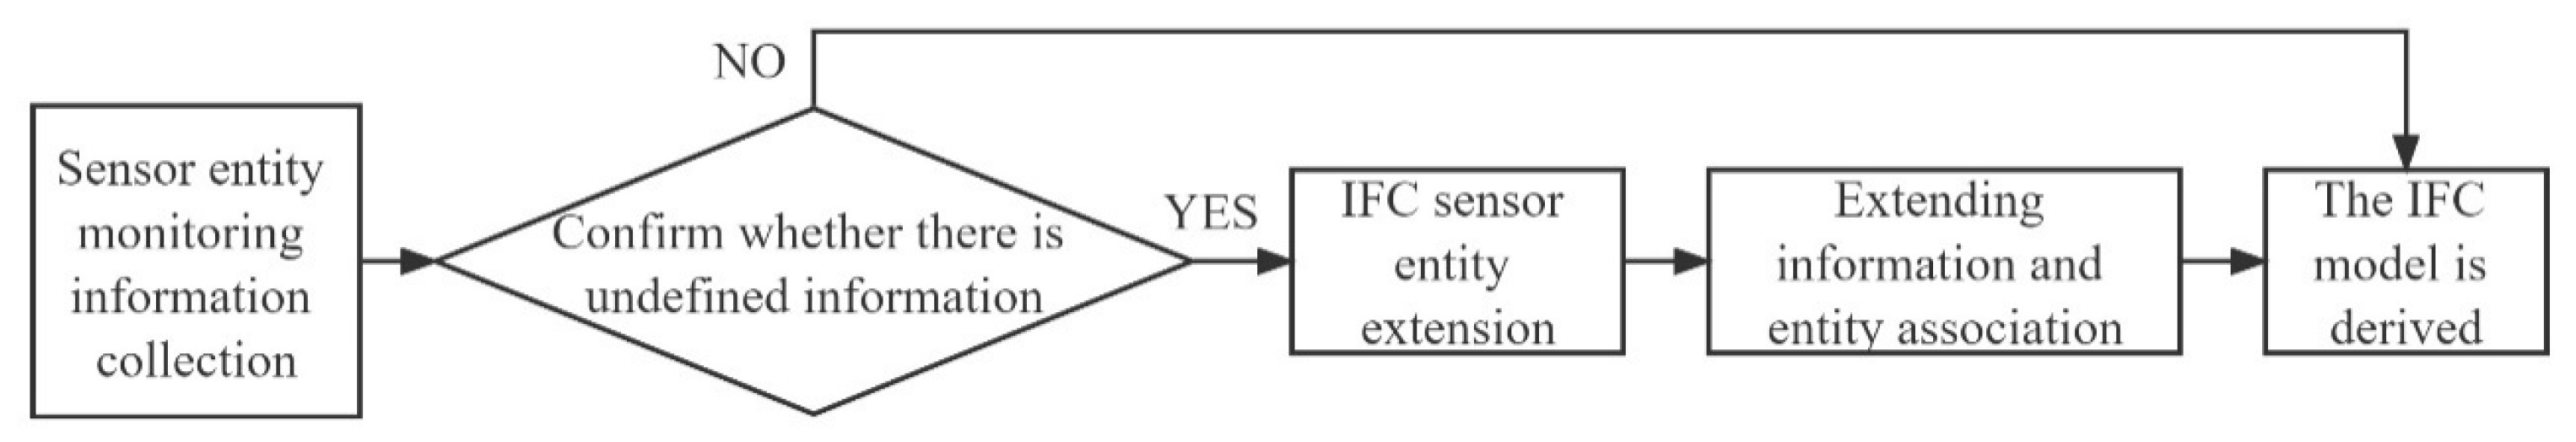
3.3.2. The Definition of Sensor Attributes Based on IFCs

In order to make the sensor model fully express the monitoring information and realize the visual information monitoring of the tunnel, expanding the sensor entity based on IFCs is also necessary. Since IFC4 has defined IfcSensor entities for sensors in the infrastructure, only the attribute set of sensor entities needs to be supplemented and improved within the existing architecture. Therefore, this paper chooses the extension method based on the attribute set to extend the sensor entity. This method only changes the attributes of the attribute layer in the architecture, and the compatibility is very high. The specific process is shown in Figure 8.
The attribute information of the sensor includes sensor characteristics (sensor type, measurement accuracy, early warning value, etc.), measuring point information, the sensor type, and monitoring data. For different attribute information, describing and expressing the attribute set of the corresponding sensor entity in IFCs are necessary. The sensor attribute set can be divided into general attribute set and type attribute set [20]. The common attribute set contains the same attributes of different types of sensors, such as the sensor type, measuring point information, etc. Type attributes represent the unique functions of sensors, such as displacement sensors, stress sensors, pressure sensors, etc., which are unique attributes of sensors and cannot be shared. Before extending the sensor, traversing the existing IFC framework is necessary to determine whether the attribute set of the corresponding entity has a missing definition. For undefined data, selecting the correct attribute type for expansion is necessary. Considering the demand of tunnel construction for monitoring information, the general attribute set of the sensor is extended so that it can fully express the data information needed for model monitoring [21]. To extend the general attribute set of the sensor, we first need to redefine the attribute set and sub-attribute set, such as the name, applicable carrier, applicable type, attribute definition, etc. In addition to modifying the definition of the common attribute set, defining the type of sensor is necessary, as shown in Table 7 and Table 8.

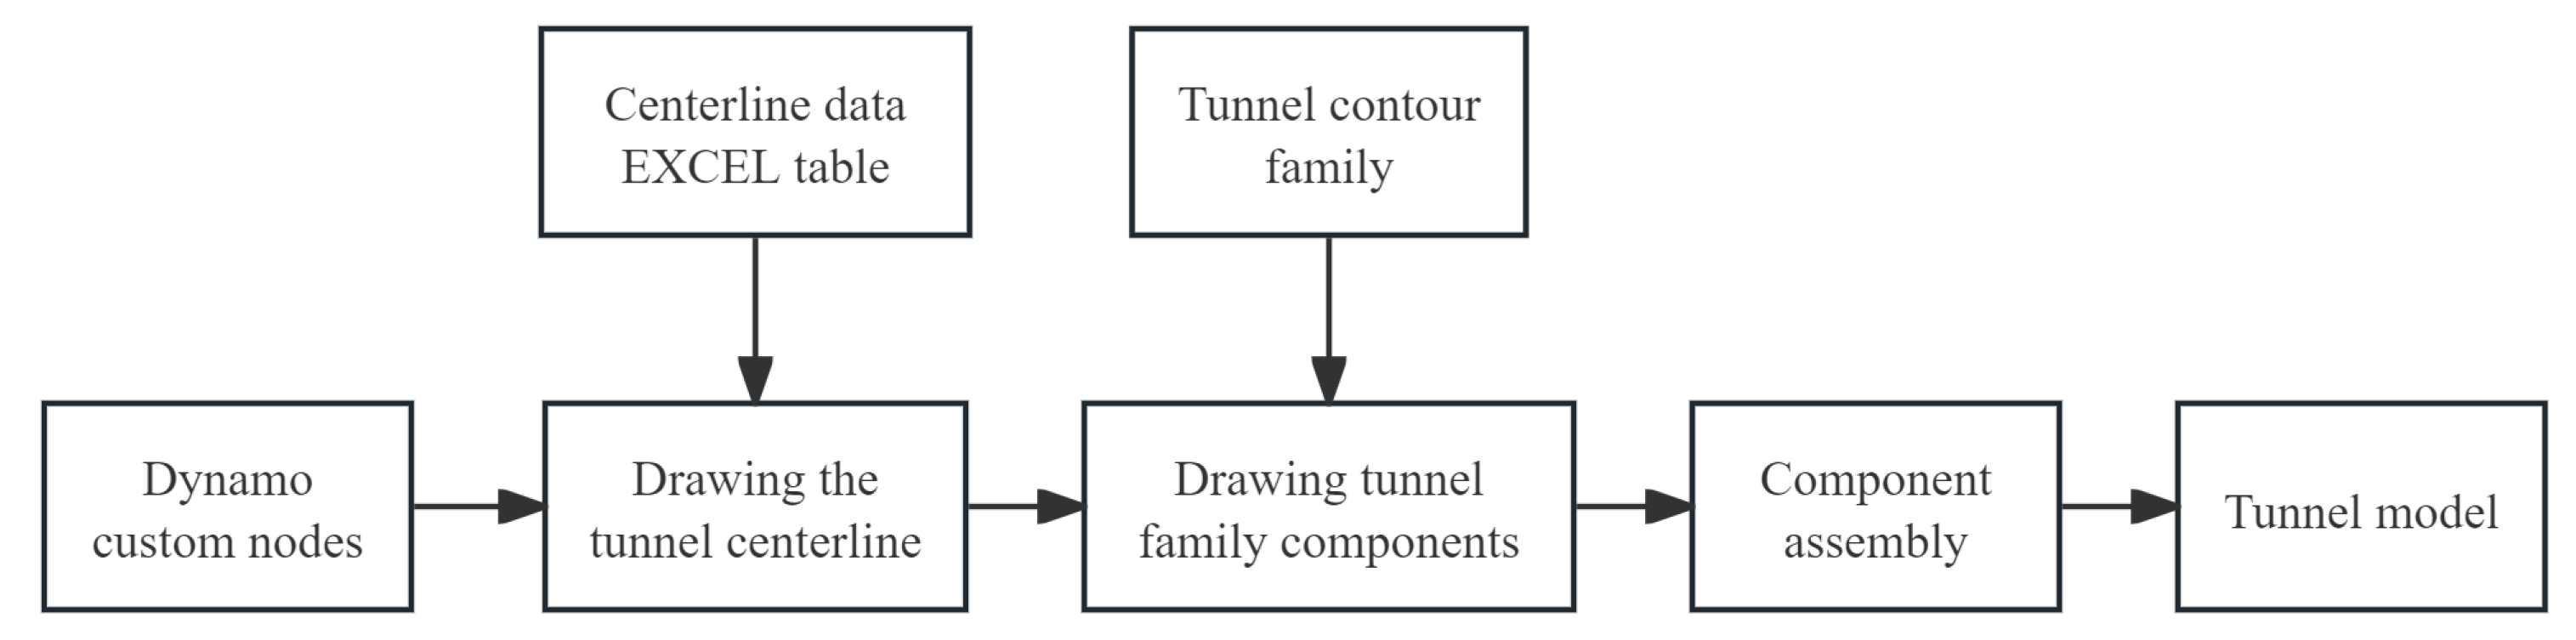
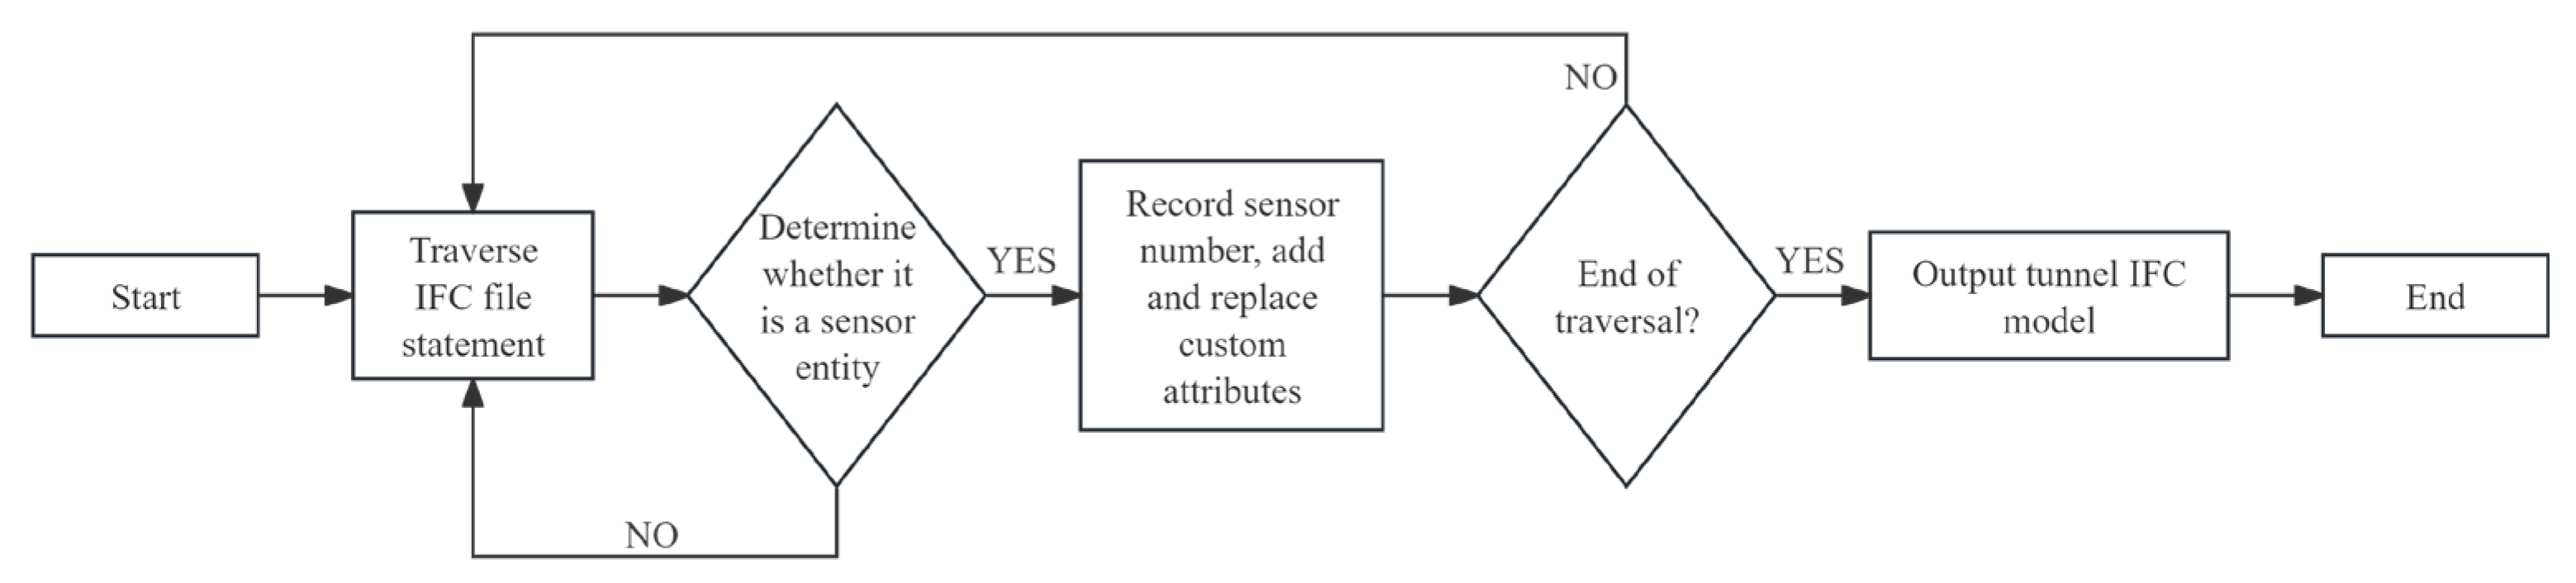
3.4. Tunnel IFC Model Creation

BIM technology was originally mainly used in the construction field, and in recent years, it has been widely used in the field of transportation infrastructure. Parametric modeling is the core design idea of BIM technology. The component family idea of Revit 2018 software is of great significance to improve the efficiency of tunnel modeling. Designers can establish a tunnel engineering component family library in advance according to the needs of the project, and can reuse the component family based on the project’s needs. Therefore, decomposing the tunnel into various detailed components is helpful to establish a family library of tunnel components, which is of great significance for realizing the BIM parametric modeling of tunnels, as shown in Figure 9.
The tunnel engineering family library is not set or established in Revit, and so building the component family library according to the tunnel structure frame is necessary. The tunnel components are classified according to their functions and structural locations, and a family template is created for each component. The model is drawn to generate a component family and uploaded to the family library, as shown in Figure 10.
The three-dimensional spatial alignment makes each section form of the tunnel have certain differences, and the tunnel structure is complex. It is not feasible to establish the tunnel engineering model only by manually assembling the component family. Dynamo is a parametric design plug-in, which is directly installed in the menu bar as a built-in plug-in in Revit 2018 and above. Dynamo itself can also exist independently as a software. In Dynamo, each node can perform the corresponding task. The output of one window node is input to another window node through a line connection. A series of windows pass through the line, from one node to another node, and finally form a network to realize the parametric design and automatic modeling functions of Revit. With its high openness and plasticity, Dynamo allows users to customize logical algorithms to meet the needs of different users. Tunnel modeling can be realized based on Revit family and Dynamo node editing, and the specific process is shown in Figure 11.
The tunnel structure is divided into various detailed structures, and the contour family template is established. The contour family template is loaded into the metric conventional model template to establish the tunnel component family model. The model is modeled in sections, and the left and right tunnels are modeled separately to establish a lightweight tunnel model to improve the efficiency of computer operation and monitoring.
The traditional IFC information integration method is designed to manually add project information and monitoring information to the model space in the form of parameters after establishing the sensor model, and then output the BIM file as an IFC file for storage. However, a large amount of construction information and monitoring data will be generated in the process of tunnel construction monitoring. By manually adding information, not only the working time will be increased but also data input errors will occur, which will reduce the working efficiency and impose adverse effects on the long-term storage of monitoring information. In view of the above problems, this paper establishes a more efficient monitoring information integration method. The tunnel model is established on the BIM platform, and the parameters such as measuring point information and monitoring value are added to the sensor attributes. The file is output in IFC format, and the monitoring data are read and written into the IFC file through a batch operation to complete the integration of monitoring information. Revit is used to define the sensor family and create the sensor model entity. Two extended parameters, IFCExportAs and IFCExportType, are added to the sensor model entity, and IfcSensor and IfcSensorType parameter values are defined for it. Finally, the IFC entity corresponding to the sensor object is defined as IfcSensor so that the mapping between IFC and sensor model can be realized. Finally, the model file is in IFC format, and the sensor attribute set extension is realized through the developed IFC standard extension auxiliary program, as shown in Figure 12; the specific workflow is shown in Figure 13.

4. System Development and Application

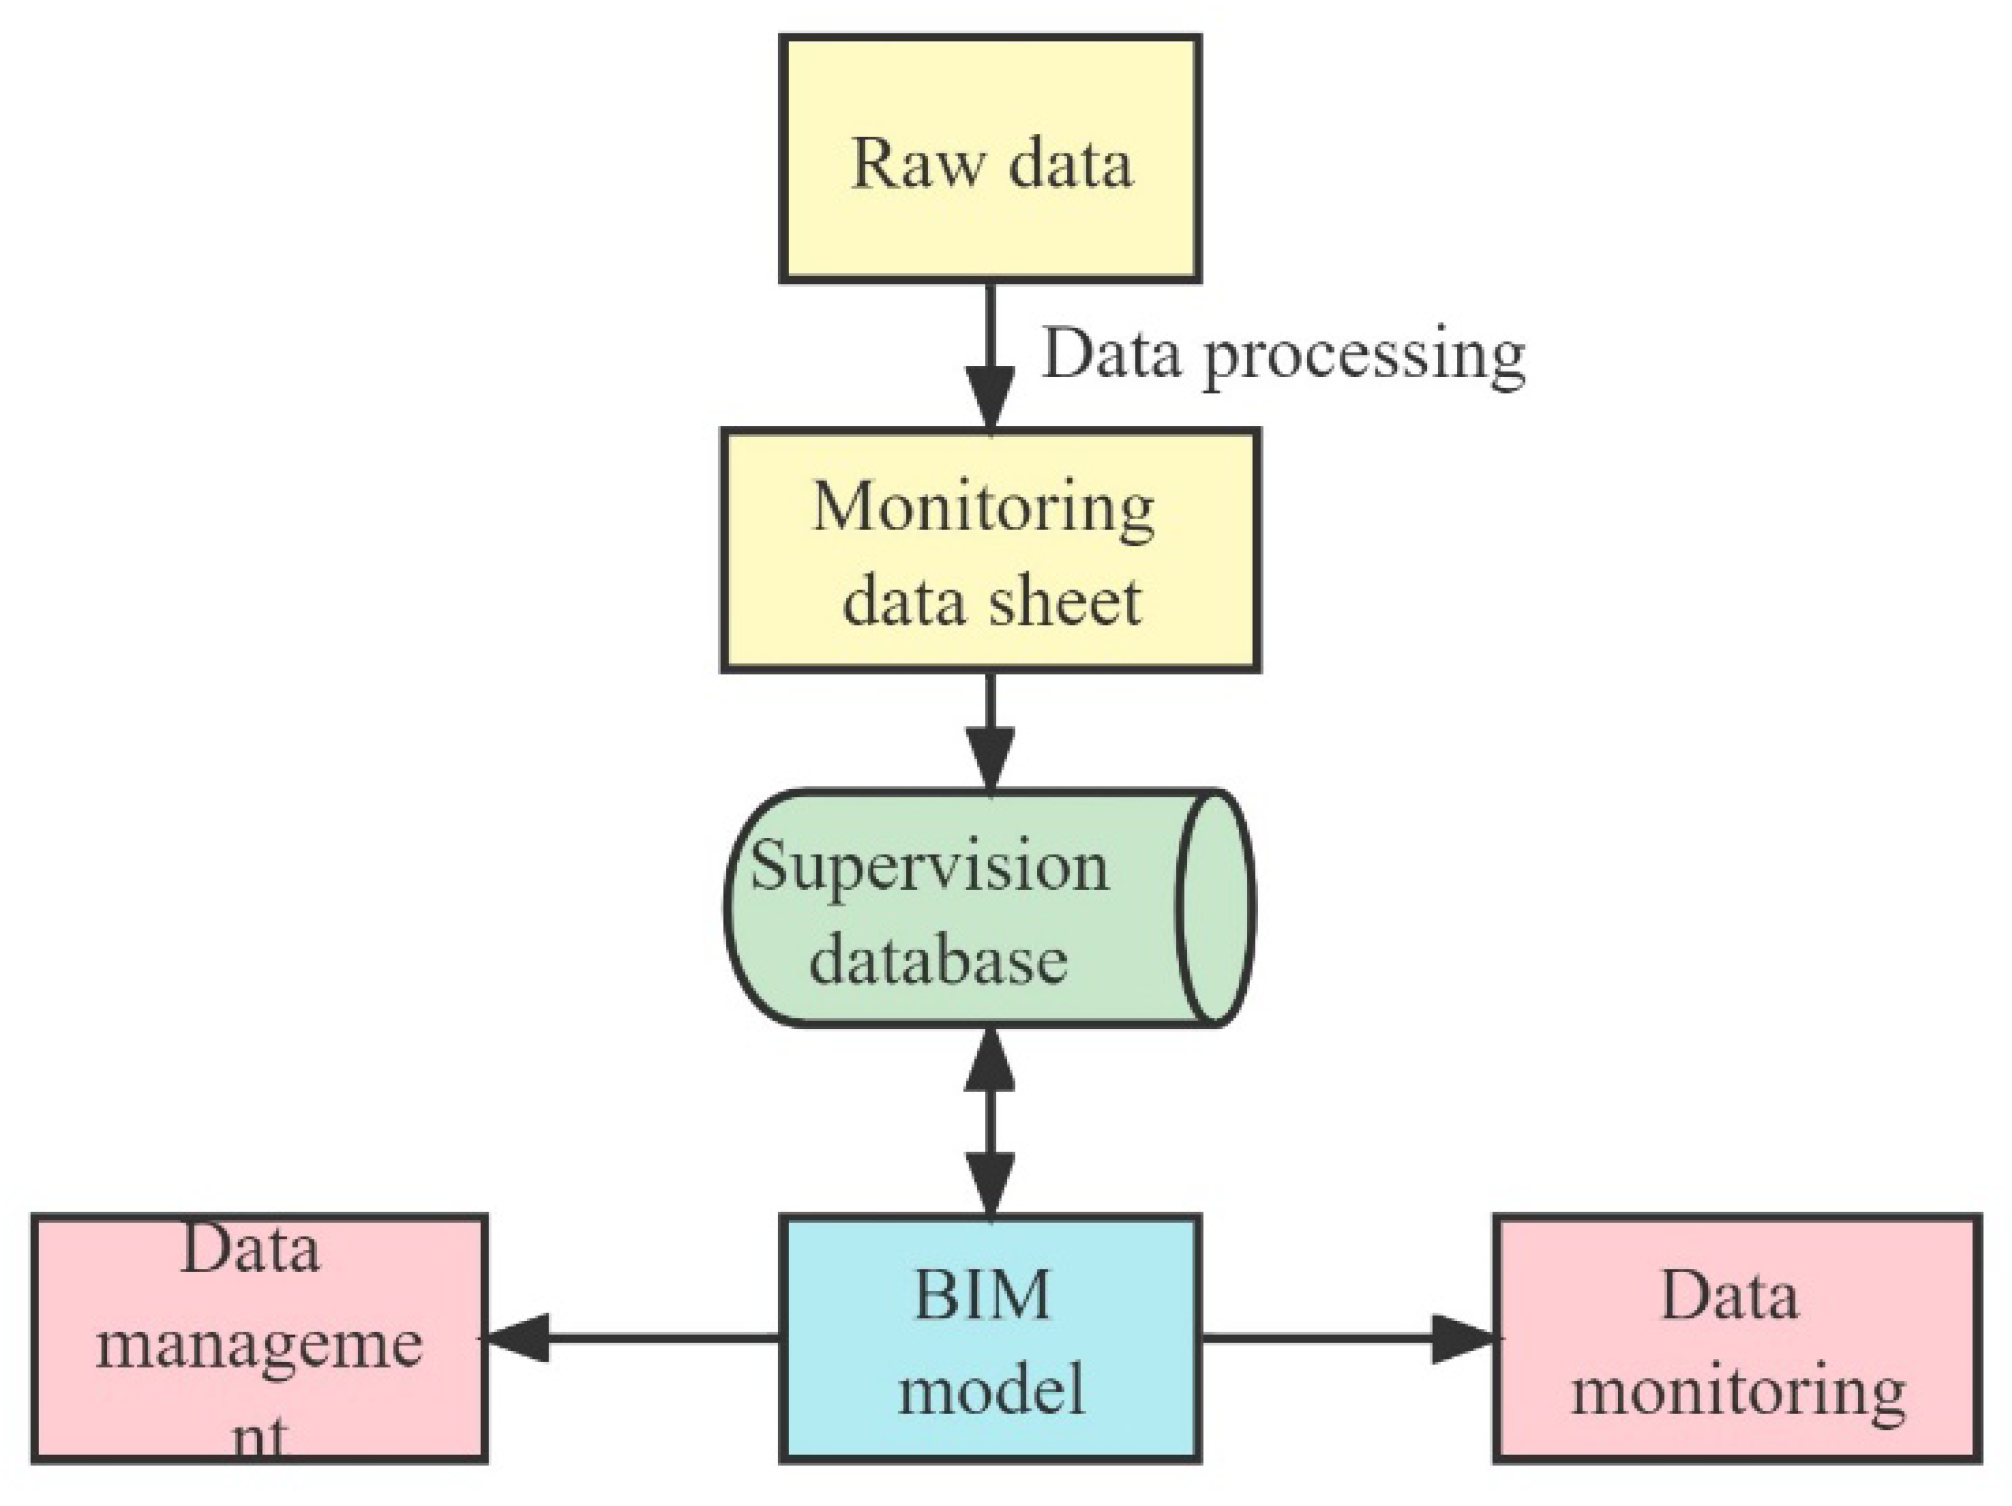
4.1. Monitoring Information Integration System Based on the Database

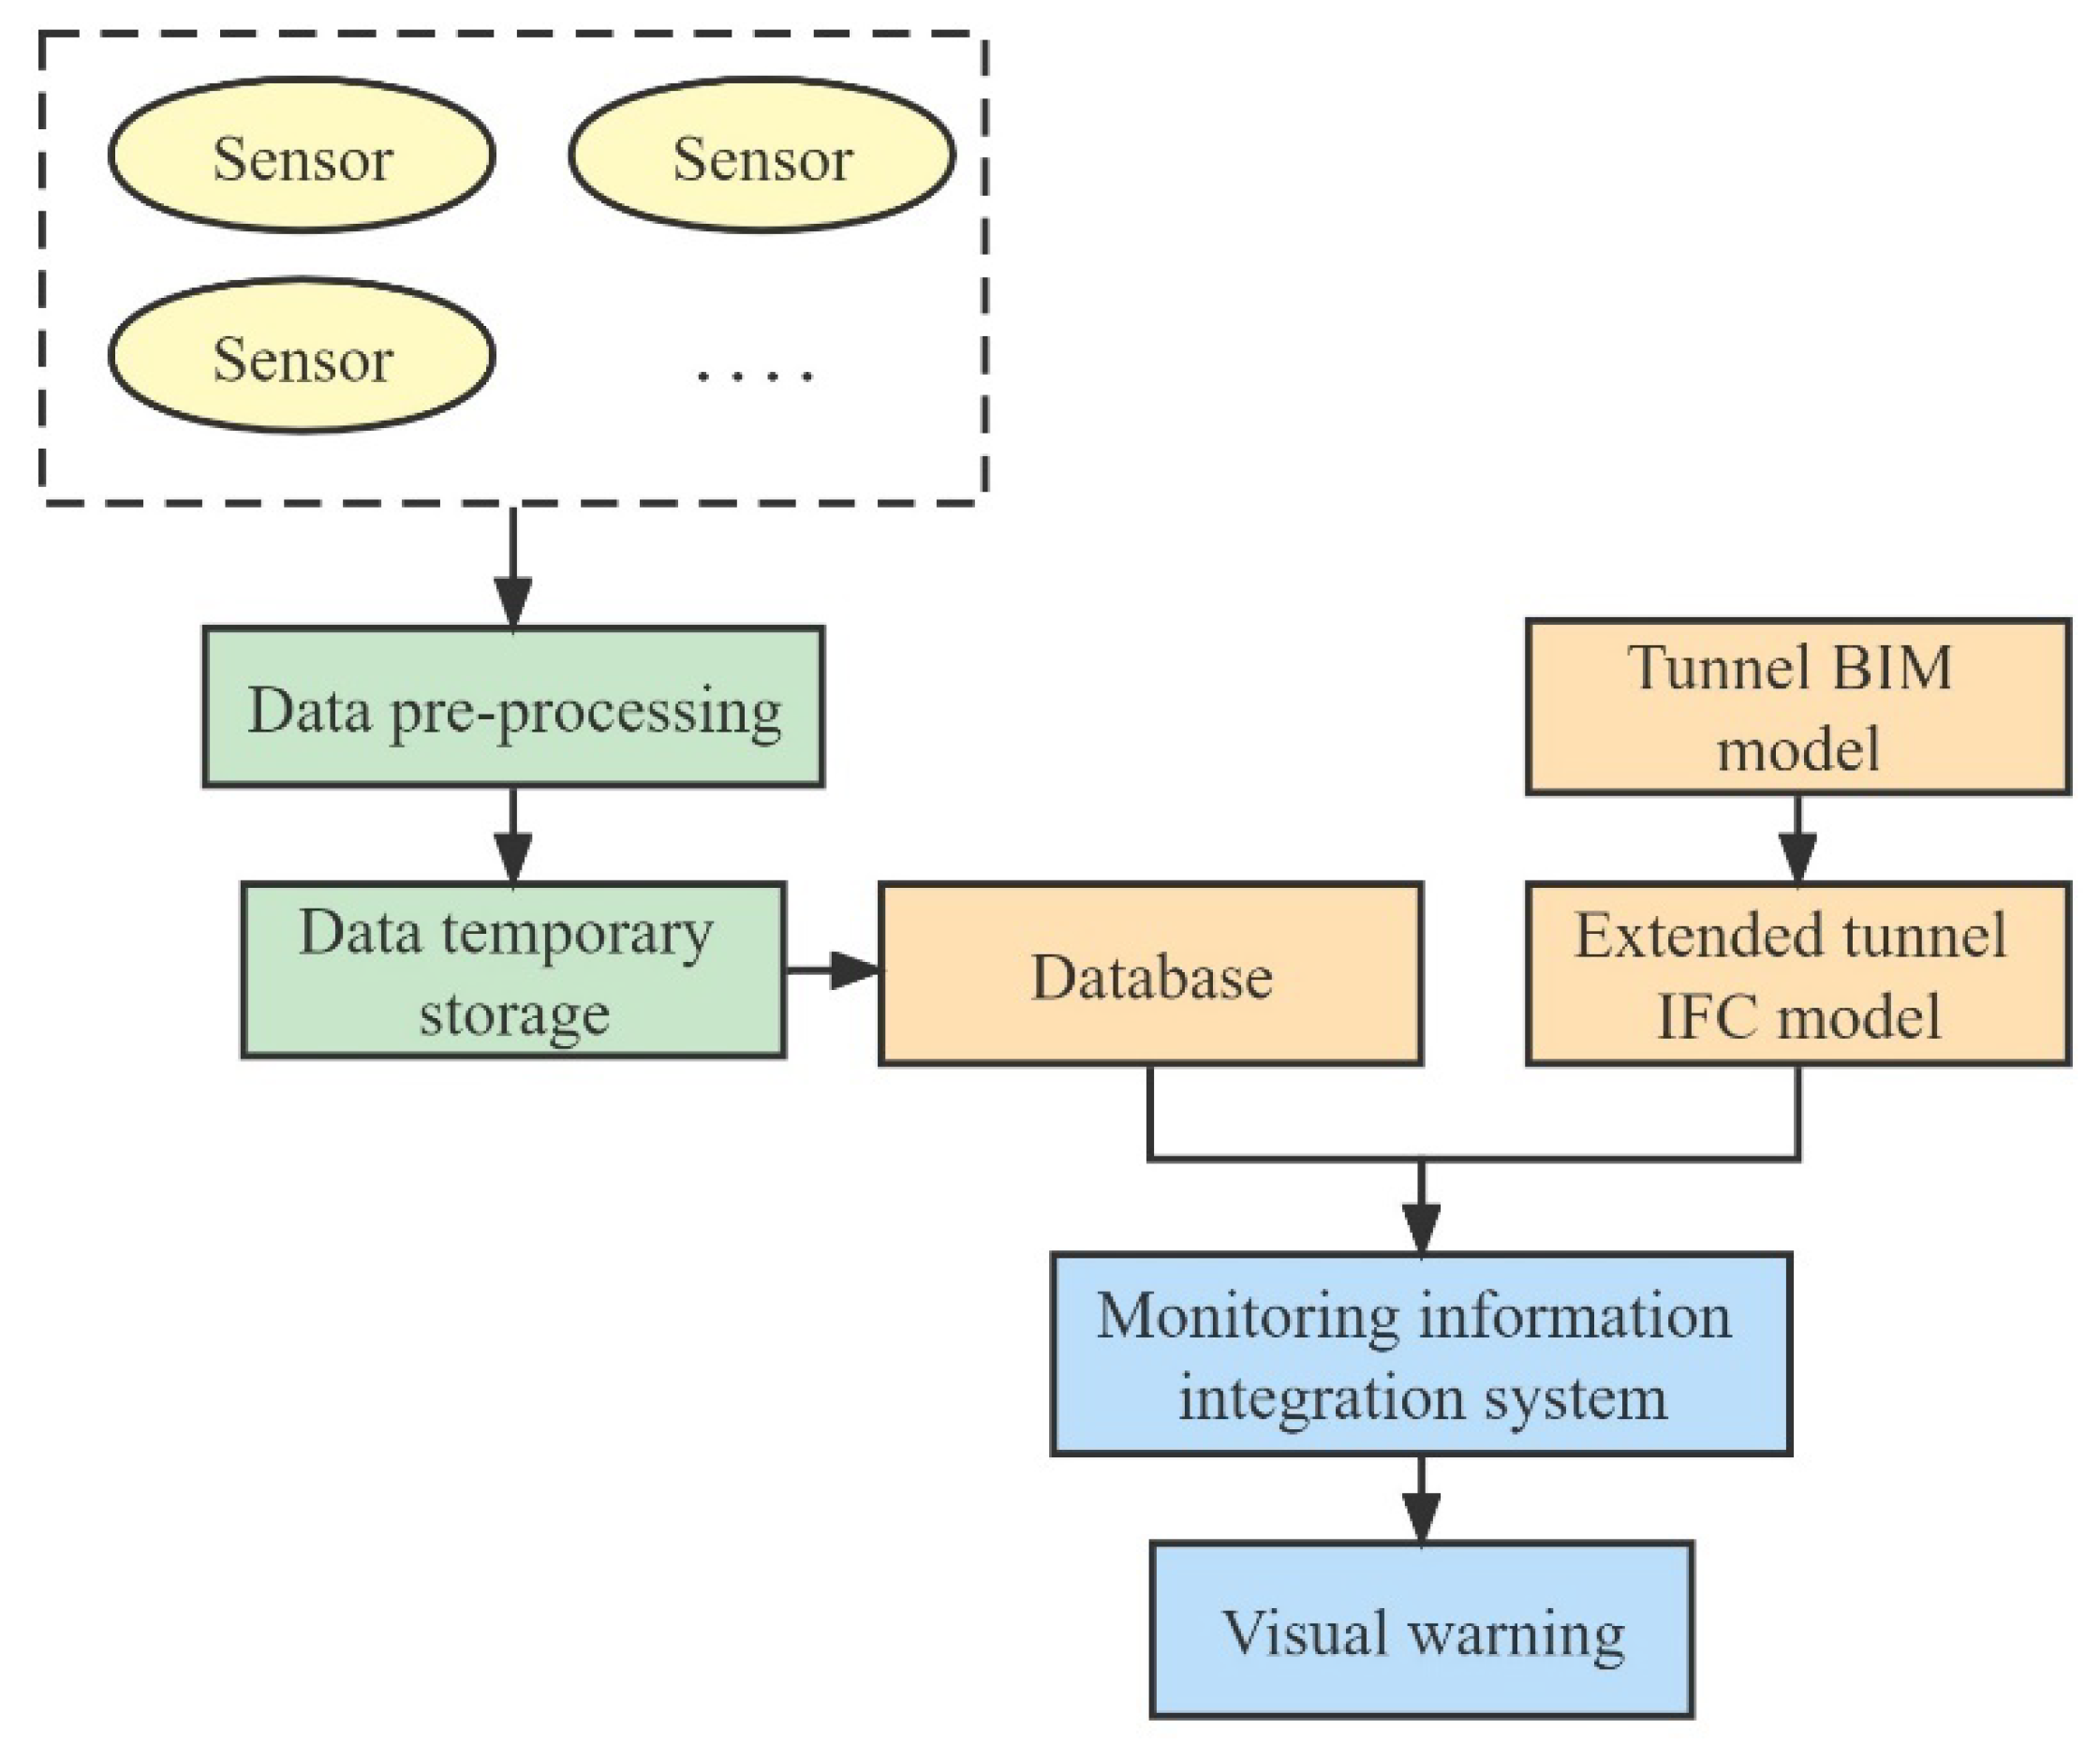
4.1.1. System Framework

In this paper, a sensor monitoring information integration system is developed based on the BIM platform. Combined with the characteristics of BIM technology and a traditional data management system, a data management system framework based on BIM technology is designed to associate the BIM model with monitoring data, realize model data fusion, and carry out the early warning application for the data fusion model.
The visual data fusion process of the system is as follows:
(1) Tunnel BIM model
According to the tunnel construction project, the engineering BIM model is established. The sensor model is established and set on the engineering model according to the monitoring requirements. The BIM model is exported as an IFC file, and the sensor monitoring information is extended based on the IFC format to ensure that the monitoring information can be fully expressed in the BIM model. Export the extended BIM model and wait for monitoring data transmission.
(2) Data preprocessing
The original monitoring data collected by the sensor are imported and stored in the data management system after preprocessing. The monitoring data are imported into the database and associated with the sensor model through the integrated import function of the monitoring system.
(3) Visual early warning application
The BIM model that transmits the monitoring data is imported into the Revit project, and the plug-in is run to analyze and query the monitoring data of the model. The visualization system can identify the monitoring point information and the sensor model. When the monitoring point information exceeds the early warning value, the early warning prompt will be carried out in the early warning bar. The system positioning function can quickly locate and display the early warning sensors, and realize the visual early warning application based on the data fusion model. The specific logical structure of the monitoring system is shown in Figure 14.

4.1.2. Database Requirement Analysis

This paper uses the SQL Server 2019 relational database management system, based on the Visual Studio 2019 platform for development. At present, SQL Server is widely used. Compared with other databases, it has better read and write performance and data storage capacity, and has a natural connection advantage with the .NET Framework. The idea of database management based on BIM is shown in Figure 15. The details are as follows:
(1) Reading and writing functions
Based on the relational database, large numbers of monitoring data collected by sensors are stored and managed. Based on SQL script and Revit, the functions of reading and importing monitoring data are realized.
(2) Information interaction
The management of sensor model information and monitoring data is centralized. The monitoring information table is established based on the database, and the information of each measuring point and the corresponding sensor model is stored in the table. The monitoring data are associated with the monitoring information table through a unique measuring point number. Through the sensor model, the monitoring data collected by the corresponding measuring points can be queried, and the corresponding sensor model information can also be found through the monitoring data.
(3) Visualization
Based on the Revit platform, monitoring information integration is realized. Based on the expression of sensor monitoring information, the sensor model is connected with the monitoring information to realize the visual management of monitoring information.
(4) Integrated management
Management and maintenance of the monitoring information database are performed. The database is used to manage and maintain the monitoring data, and the data of a single measuring point or a single data table are managed and maintained.

4.1.3. Database Structure Design

(1) Conceptual structural design
Conceptual structural design is the process of establishing a conceptual model according to design requirements. A conceptual model can truly reflect the relationship between entities. An E-R diagram (entity–relationship diagram) model is the basis of the monitoring database conceptual model. In this paper, the conceptual structural design adopts the bottom-up design method, defines the local conceptual model, then integrates it into the global conceptual model, and continuously optimizes it [22].
The local conceptual model consists of three modules: a data module, file information, and measuring point information. The data module contains monitoring values and monitoring information; file information includes the file name, file type, and storage path. The measuring point information includes the type of measuring point, monitoring point number, and monitoring time. The E-R structure of the monitoring database is shown in Figure 16.
(2) Logical structure design
The logical structure design of the database is the process of transforming the conceptual structural model into a relational model. The logical structure design mainly designs the structural relationship between the attributes, and then optimizes the relational model according to the design requirements.
① Measuring point information
The measuring point information table contains the information of the monitoring point and its corresponding sensor, as shown in Table 9.
② Sensor information
The sensor information table is used to store the information of all sensors in the monitoring project, including the sensor number, measuring point type, monitoring value, and sensor model identifier, as shown in Table 10.
③ Monitoring data
The monitoring data table stores monitoring information collected by sensors, including the monitoring time, measuring point number, monitoring value, and sensor number, as shown in Table 11.
④ File information
The file information structure is shown in Table 12, including the file name, type, and file path.
(3) Physical structure design
The physical structure of the database provides the working environment for the logical structure model to run. The physical structure design mainly includes the following four aspects: ① determine the storage structure of the data; ② design the data storage path; ③ determine the location of data storage; and ④ determine the system configuration.

4.2. Engineering Application

4.2.1. Project Overview

Jianyuan Road and Kaiyuan Road are located in the northwest and southeast corners of the Lvxiaozhai Interchange of the Xi’an City Ring Expressway. Due to the division of the Xi’an City Ring Expressway, Xitong Expressway, and Xi’an North Third Ring Road, the traffic from Xi’an North Railway Station to the southeast of Xitong Expressway is poor and the traffic pressure is large. Opening the Jianyuan Road and Kaiyuan Road channel is conducive to alleviating the traffic pressure in the region. The construction of the project has improved the road network planning in the region to a certain extent and will play an important role in improving the image of the city. The Kaiyuan Road–Jianyuan Road Tunnel starts from the Kaiyuan Road–Fengcheng No. 12 intersection in the south, and passes through several ramps and main lines of the Lvxiaozhai Interchange of the circum-city expressway in a tunnel way to the northwest to then connect the existing Jianyuan Road; the project adopts the urban secondary trunk road, and the standard is two-way with four lanes, with a total length of 1483 m.

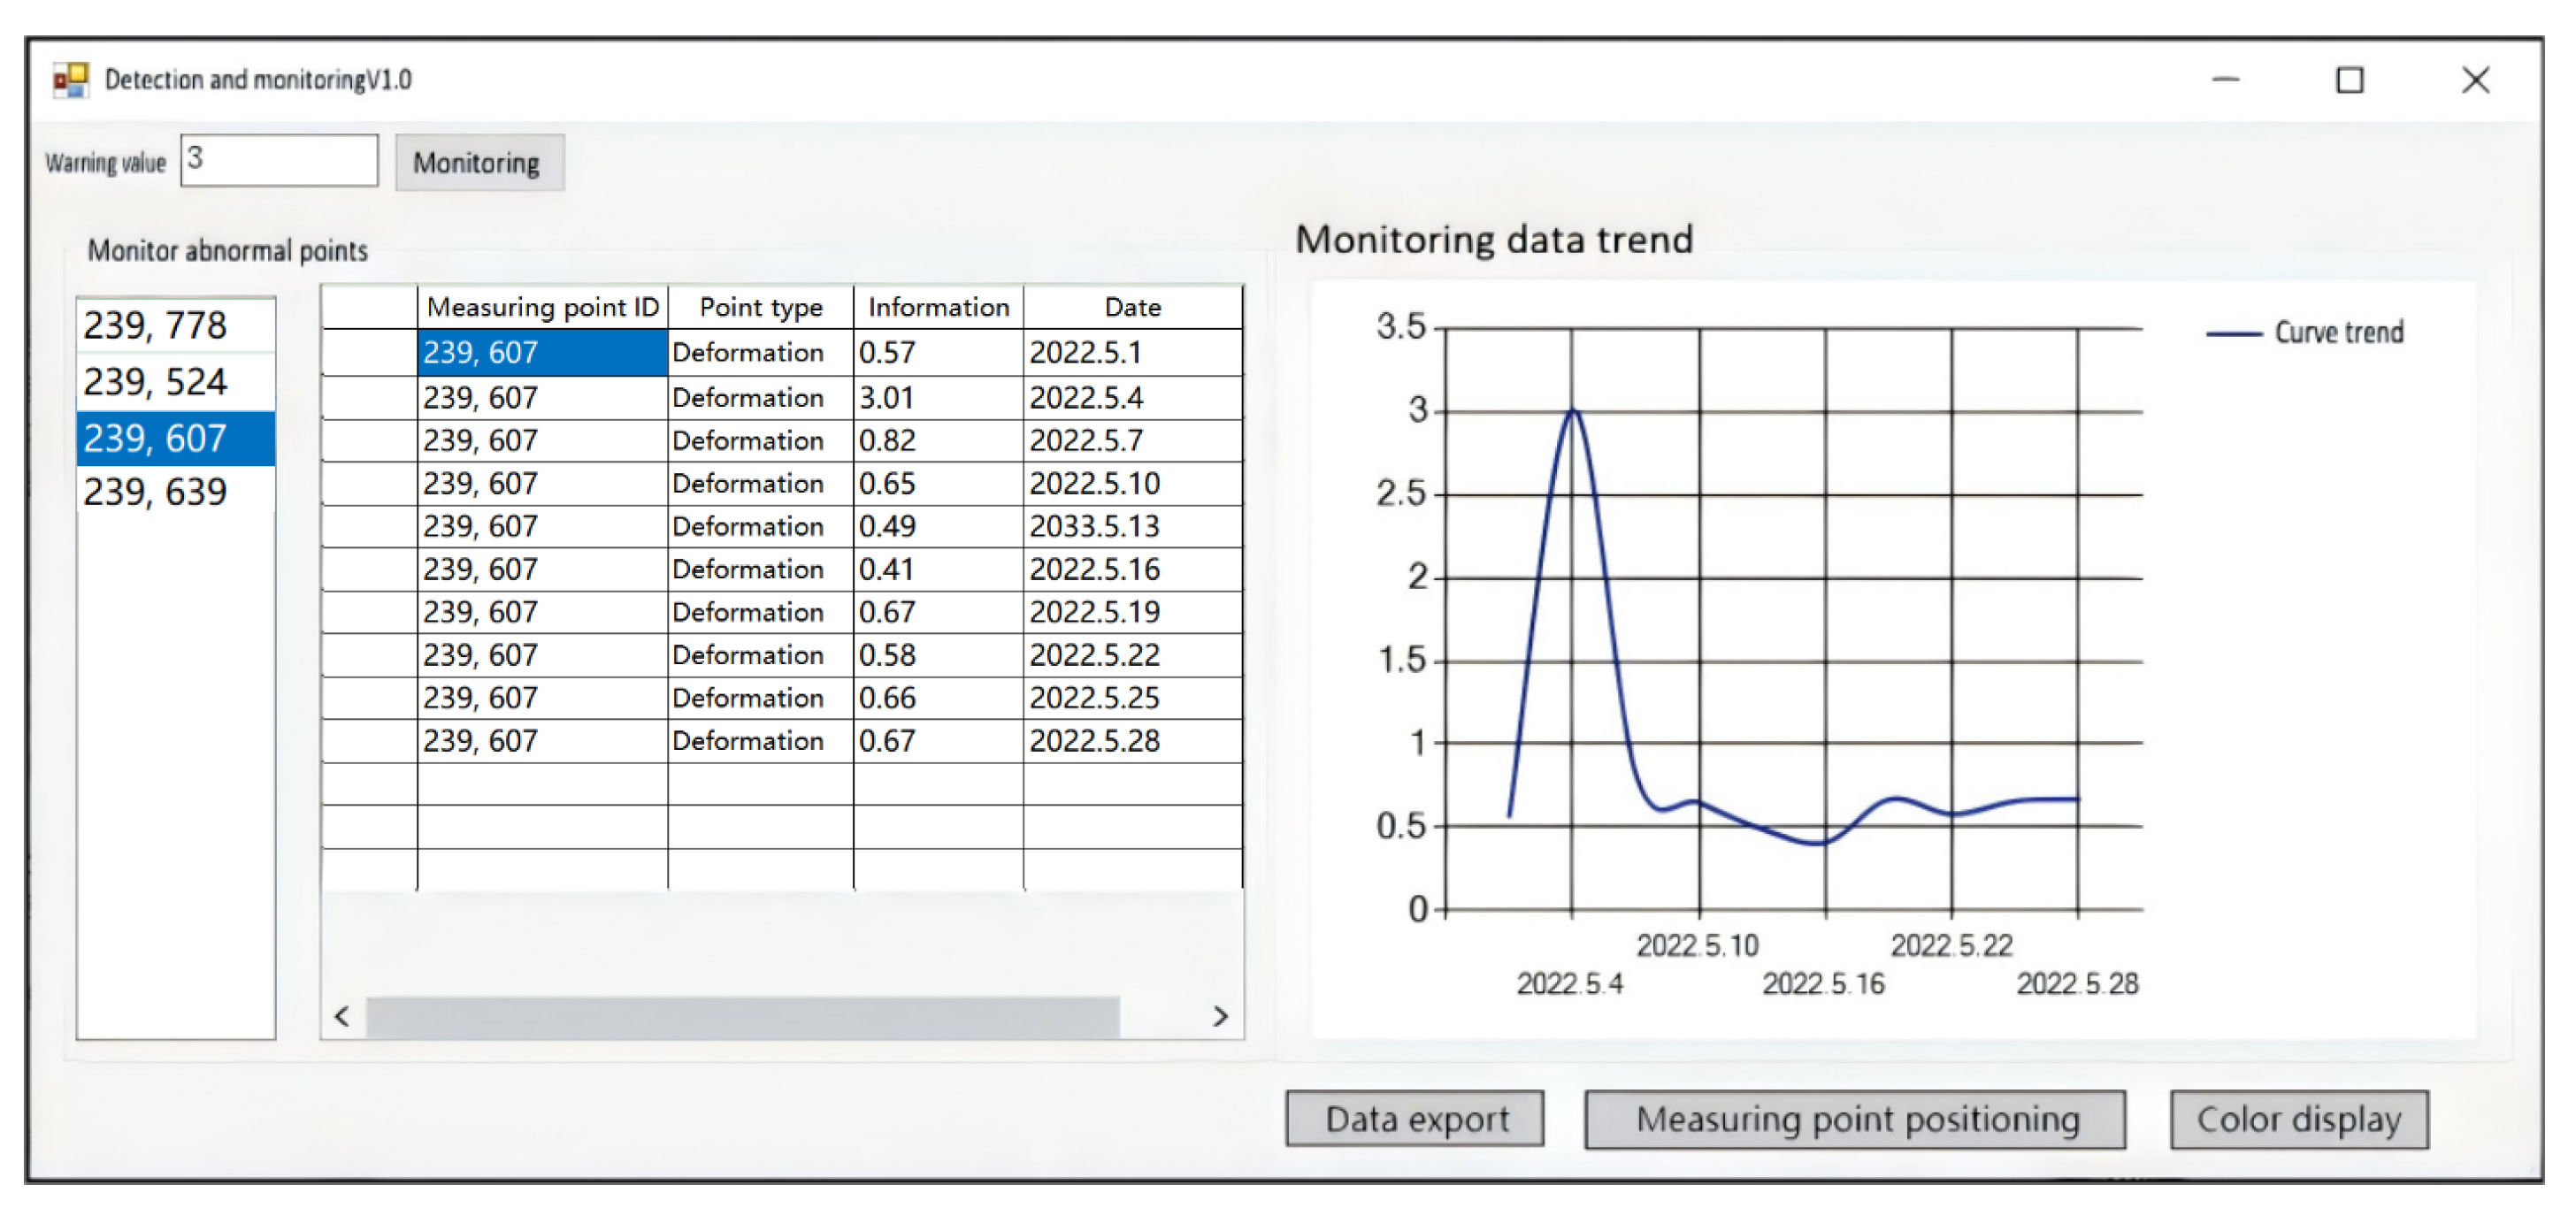
4.2.2. Visual Warning Application

The monitoring data are imported into the information management system to interact with the extended sensor model, then the tunnel IFC model containing the monitoring information is imported into the Revit project, and the monitoring and monitoring plug-in are run to monitor and warn the model. The right side of the monitoring system is the monitoring information curve, which reflects the fluctuation trends of the monitoring data. After the input warning value is clicked on for monitoring, once the monitoring data of the monitoring point exceeds the warning value, it will be displayed in the left warning bar, as shown in Figure 17. By clicking on the ‘measuring point positioning‘, you can quickly locate the abnormal measuring point and mark the section where the measuring point is located as red, as shown in Figure 18.
This monitoring and information integration system, though centering on post-processing, incorporates real-time monitoring. Its data update frequency depends on the monitoring project requirements and sensor performance. The system can handle real-time sensor data streams, supporting immediate data processing and analysis for dynamic decision-making.

5. Conclusions

This study explored the IFC-based integration and visual warning scheme for tunnel monitoring information. The following conclusions were obtained:
(1) By addressing IFC standard limitations in tunnel engineering entity descriptions and sensor definitions, we expanded IFCs via new entities, attribute sets, and definitions in the IFC architecture. We added tunnel-specific entities and types to the IFC standard file, defined sensor model attributes with IfcSensor, and enhanced monitoring information attributes, establishing an IFC-based tunnel monitoring information model.
(2) A BIM-based monitoring information integration system was developed using a relational database and tested on Xi’an’s Kaiyuan Road–Jianyuan Road Tunnel. The information management system enables visual early warning monitoring, quickly locates abnormal monitoring points, and supports digital construction and safety management.
(3) The system has limitations as a local Revit-based visualization solution with high hardware demands. Future work will connect it to a cloud server for online monitoring and email early warning functions.
(4) While resolving data storage issues, the system lacks the management of other dynamic construction information like the surrounding rock, support, and construction methods. Future work will develop an integrated tunnel dynamic construction information system to maximize the advantages of the IFC-based model.

Author Contributions

Conceptualization, J.L.; Methodology, J.L.; Software, Z.L.; Validation, Z.L.; Formal analysis, H.Y.; Investigation, Q.W.; Resources, Q.W.; Data curation, Q.W. and H.Y.; Writing—original draft, Z.L.; Writing—review & editing, J.L.; Supervision, X.J.; Project administration, H.Y.; Funding acquisition, X.J. All authors have read and agreed to the published version of the manuscript.

Funding

This research was funded by following projects: Shaanxi Transportation Research Project (24-65K); Research and Development Project of Beijing Municipal Engineering Design & Research Institute Co., LTD. (2024-KYDL-010); Major Research and Development Project of China Harbour Engineering Company Limited (2024-ZGKJ-ZDYF-05).

Data Availability Statement

Data is contained within the main text.

Conflicts of Interest

The authors declare no conflict of interest.

References

  1. Ismail, A.; Strug, B.; Ślusarczyk, G. Building Knowledge Extraction from BIM/IFC Data for Analysis in Graph Databases. In Artificial Intelligence and Soft Computing; Springer International Publishing AG: Cham, Switzerland, 2018; pp. 652–664. [Google Scholar]
  2. Marmo, R.; Polverino, F.; Nicolella, M.; Tibaut, A. Building performance and maintenance information model based on IFC schema. Autom. Constr. 2020, 118, 103275. [Google Scholar] [CrossRef]
  3. Lai, H.H.; Deng, X.Y. Interoperability analysis of IFC-based data exchange between heterogeneous BIM software. J. Civ. Eng. Manag. 2018, 24, 537–555. [Google Scholar] [CrossRef]
  4. Zeng, Q.; Zhang, Q.L.; Zhang, J.H. Research on IFC Data Storage Based on Object-oriented Hierarchical Database. J. Inf. Technol. Civ. Eng. Archit. 2021, 13, 17–23. [Google Scholar]
  5. Zhang, Z.B.; Meng, X.M. IFC-based Information Exchange Framework Research and Implementation Between Architectural Design and Structural Design. Build. Struct. 2024, 54, 149–154. [Google Scholar]
  6. Söbke, H.; Peralta, P.; Smarsly, K.; Armbruster, M. An IFC schema extension for BIM-based description of wastewater treatment plants. Autom. Constr. 2021, 129, 103777. [Google Scholar] [CrossRef]
  7. Guan, L.; Hu, J.H.; Li, J.Q.; Wang, H.; Dong, J.Z.; Zhang, J.M. Research on Substation Gantry Modeling Based on IFC Standard. In Proceedings of the 2019 3rd International Conference on Electronic Information Technology and Computer Engineering (EITCE), Xiamen, China, 18–20 October 2019; pp. 759–762. [Google Scholar]
  8. Zhu, H.X.; Xu, Z. Research on information collaboration and model construction for top-down design of prefabricated buildings. J. Graph. 2021, 42, 289–298. [Google Scholar]
  9. Bao, L.S.; An, P.L.; Wang, P.; Liang, W.; Yu, L. Research on Visualization of Bridge Safety Information Based on IFC. J. Shenyang Archit. Univ. (Nat. Sci.) 2022, 38, 682–689. [Google Scholar]
  10. Zhao, L.G.; Jiang, A.N.; Wu, H.T.; Duan, L.M.; Zhang, G.T.; Shen, F.Y. Information integration model of tunnel dynamic design based on IFC standard. J. Dalian Marit. Univ. 2019, 45, 66–74. [Google Scholar]
  11. Mobaraki, B.; Vaghefi, M. The Effect of Protective Barriers on the Dynamic Response of Underground Structures. Buildings 2024, 14, 3764. [Google Scholar] [CrossRef]
  12. Mobaraki, B.; Ma, H.; Lozano Galant, J.A.; Turmo, J. Structural Health Monitoring of 2D Plane Structures. Appl. Sci. 2021, 11, 2000. [Google Scholar] [CrossRef]
  13. Xiong, Y.Y.; Wu, X.Q. The Generalizing Application of Four Judging Criterions for Gross Errors. Phys. Exp. Coll. 2010, 23, 66–68. [Google Scholar]
  14. Li, W.H. Intelligent Information Agent with Ontology on Semantic Web. Comput. Eng. Appl. 2002, 38, 136–138. [Google Scholar]
  15. Chen, G.L.; Wu, J.M.; Zhong, Y.; Chen, J.; Chen, B.; Wang, Y.D. Research on IFC-based standard extension for 3D geological model. Rock Soil Mech. 2020, 41, 2821–2828. [Google Scholar]
  16. Xu, K.; Huo, L.; Shen, T.; Fu, J.Y. Research on Construction Method of Special Knowledge Model of Water Conservancy Safety Monitoring Based on Semantic Web and BIM. Geomat. Spat. Inf. Technol. 2022, 45, 25–28. [Google Scholar]
  17. Zhou, H.B.; Shi, W.P.; Deng, X.Y. Research on BIM Component Library Based on IFC Standard. J. Graph. 2017, 38, 589–595. [Google Scholar]
  18. Dai, S.H. Research on BIM Model Extension Technology of Bridge Structure Based on Semantic Ontology. Master’s Thesis, Chongqing Jiaotong University, Chongqing, China, 2019. [Google Scholar]
  19. Cao, G.; Gao, G.L.; Qiu, Y.H.; Cao, J. Extended Application of Reinforcement Properties Based on IFC Standard. J. Inf. Technol. Civ. Eng. Archit. 2013, 5, 24–28. [Google Scholar]
  20. Lai, H.H.; Hou, T.; Zhong, Z.L.; Zhao, Y.F. Analysis on Development of BIM Data Standard IFC. J. Civ. Eng. Manag. 2020, 37, 126–133. [Google Scholar]
  21. Gao, J.X.; Jiang, A.N.; Zhang, Y.; Shen, F.Y.; Wu, H.T.; Duan, L.M. Research on Tunnel Monitoring Information Model Based on IFC Standard and Parameterization. J. Inf. Technol. Civ. Eng. Archit. 2019, 11, 1–6. [Google Scholar]
  22. Zhang, N.; Bi, Y.Q.; Li, W. Research and Design of City Subway Construction Monitoring Information Management System. Geomat. Spat. Inf. Technol. 2019, 42, 119–120. [Google Scholar]
Figure 1. Comparison of statistical critical coefficients of three criteria.
Buildings 15 02221 g001
Figure 2. IfcRoot classification.
Buildings 15 02221 g002
Figure 3. Extensions based on IfcProxy entities.
Buildings 15 02221 g003
Figure 4. IFC attribute classification.
Buildings 15 02221 g004
Figure 5. IFC definition of the tunnel spatial structure.
Buildings 15 02221 g005
Figure 6. IFC definition of the tunnel geometric structure.
Buildings 15 02221 g006
Figure 7. Definition of the tunnel IFC structure.
Buildings 15 02221 g007
Figure 8. Sensor monitoring information expansion process.
Buildings 15 02221 g008
Figure 9. Tunnel structure classification.
Buildings 15 02221 g009
Figure 10. Tunnel Component Family Library.
Buildings 15 02221 g010
Figure 11. Tunnel modeling process.
Buildings 15 02221 g011
Figure 12. IFC extension interface.
Buildings 15 02221 g012
Figure 13. IFC extension process.
Buildings 15 02221 g013
Figure 14. Logical structure of the monitoring system.
Buildings 15 02221 g014
Figure 15. Monitoring data integration management ideas.
Buildings 15 02221 g015
Figure 16. Database E-R diagram.
Buildings 15 02221 g016
Figure 17. Outlier screening.
Buildings 15 02221 g017
Figure 18. Outlier section positioning.
Buildings 15 02221 g018
Table 1. K0 + 625 monitoring data for the Kaiyuan Road–Jianyuan Road tunnel project.
Number of
Periods/d
Variable Quantity
(mm/d)
Cumulant
/mm
Number of
Periods/d
Variable Quantity
(mm/d)
Cumulant
/mm
100130.425.33
20.180.18140.415.74
30.240.42150.336.07
40.280.70160.376.44
50.461.16170.246.68
60.511.67180.196.87
70.442.11190.126.99
80.672.78200.237.22
90.483.26210.177.39
100.573.83220.157.54
110.664.49230.117.65
120.424.91240.087.73
Table 2. Gross error test results.
Criterion1 Outlier
(1.8 mm)
2 Outliers
(1.8 mm, 1.8 mm)
2 Outliers
(1.8 mm, 2.0 mm)
Grubbs criterion (α = 0.01)100
Grubbs criterion (α = 0.05)101
Dixon criteria (α = 0.01)121
Dixon criteria (α = 0.05)121
Table 3. Equal step size replacement gross error test results.
Criterion1.08 mm1.24 mm1.44 mm1.56 mm
Grubbs criterion (α = 0.01)0011
Grubbs criterion (α = 0.05)1111
Dixon criteria (α = 0.01)0001
Dixon criteria (α = 0.05)0111
Table 4. K0 + 625 randomly eliminated data test results 1.
IntervalMonitoring Data
/mm
Linear
Interpolation
/mm
Nearest Neighbor Interpolation
/mm
Lagrange’s
Interpolation
/mm
Newton
Interpolation
/mm
Stage 1–82.112.2252.782.172452.18541
Stage 9–165.745.76.075.712515.72214
Stage 17–247.397.387.547.356757.37441
Table 5. K0 + 625 randomly eliminated data test results 2.
IntervalMonitoring Data
/mm
Linear
Interpolation
/mm
Nearest Neighbor Interpolation
/mm
Lagrange’s
Interpolation
/mm
Newton
Interpolation
/mm
Stage 1–81.161.1851.671.189641.17992
Stage 9–164.494.374.914.414574.43214
Stage 17–246.686.6556.876.645146.63992
Table 6. K0 + 625 randomly eliminated data test results 3.
IntervalMonitoring Data
/mm
Linear
Interpolation
/mm
Nearest Neighbor Interpolation
/mm
Lagrange’s
Interpolation
/mm
Newton
Interpolation
/mm
Stage 1–80.420.440.700.433640.42192
Stage 9–165.745.706.075.724465.73578
Stage 17–247.227.197.397.186927.19247
Table 7. Sensor type definitions.
Name of the Attribute SetEntityType Value
Displacement sensorIfcSensorDisplacementSensor
Strain sensor IfcSensorStrainSensor
Acceleration sensor IfcSensorAccelerationSensor
Table 8. Definitions of sensor attributes.
Name of the Attribute SetAttribute TypeType Value
Sensor categoryIfcPropertySingleValueIfcLabel
Sensor rangeIfcPropertySingleValueIfcLabel
Measurement accuracyIfcPropertySingleValueIfcLabel
Measuring pointIfcPropertySingleValueIfcText
Measuring point mileageIfcPropertySingleValueIfcText
Service lifeIfcPropertySingleValueIfcTimeMeasure
Monitoring timeIfcPropertySingleValueIfcDatetime
Table 9. Measuring point information table.
Attribute NameCharacter NameData Type
Measuring point numberMonitoringPointIDvarchar (30)
Sensor numberSensorNumbervarchar (30)
Type of measuring pointPointTypenchar (10)
Monitoring valueValuevarchar (30)
Table 10. Sensor information table.
Attribute NameCharacter NameData Type
Sensor numberSensorNumbervarchar (30)
Type of measuring pointPointTypenchar (10)
Monitoring valueValuevarchar (30)
Sensor Model IdentifierElementGUIDvarchar (50)
Table 11. Monitoring data table.
Attribute NameCharacter NameData Type
Monitoring time Timedatetime
Measuring point number MonitoringPointIDvarchar (30)
Monitoring value Valuevarchar (30)
Sensor numberSensorNumbervarchar (30)
Table 12. File information table.
Attribute NameCharacter NameData Type
File nameNamenvarchar (50)
TypeTypenchar (10)
Creation timeTimedatetime
File pathPathchar (100)
Disclaimer/Publisher’s Note: The statements, opinions and data contained in all publications are solely those of the individual author(s) and contributor(s) and not of MDPI and/or the editor(s). MDPI and/or the editor(s) disclaim responsibility for any injury to people or property resulting from any ideas, methods, instructions or products referred to in the content.

