Article

Structural Damage Identification Using PID-Based Search Algorithm: A Control-Theory Inspired Application

1
Scientific Research Institute, Hefei University of Technology, No. 193 Tunxi Road, Baohe District, Hefei 230009, China
2
School of Road Bridge & Harbor Engineering, Nanjing Vocational Institute of Transport Technology, No. 629 Longmian Avenue, Jiangning District, Nanjing 211188, China
*
Author to whom correspondence should be addressed.
Buildings 2025, 15(13), 2216; https://doi.org/10.3390/buildings15132216
Submission received: 27 May 2025 / Revised: 21 June 2025 / Accepted: 23 June 2025 / Published: 24 June 2025
(This article belongs to the Section Building Structures)

Abstract

This study employs a PID (Proportion, Integral, Differential)-based search algorithm (PSA) to achieve structural damage identification (SDI), localization, and quantification. We developed finite element programs for a 10-element simply supported beam, a 21-element truss, and a 7-story steel frame, assigning damage factors to each element as design variables. The Relative Frequency Change Rate (RFCR) and Modal Assurance Criterion (MAC) were calculated as objective functions for PSA iteration; comparative studies were then conducted against Particle Swarm Optimization (PSO), Genetic Algorithm (GA), and Simulated Annealing (SA) in terms of damage identification accuracy, computational efficiency, and noise robustness. Results demonstrate that PSA achieves exceptional damage localization accuracy within 1% error in severity under noise-free conditions. With 1–3% noise, PSA maintains precise damage localization despite minor severity estimation errors, while other algorithms exhibit false positives in intact elements. Within the fixed number of iterations, PSA outperforms GA and PSO in computational efficiency. Although SA shows faster computation, it significantly compromises identification accuracy and fails in damage detection. The regularization term enables PSA to maintain noise-resistant damage identification even in a 70-element frame structure, demonstrating its potential for robust damage assessment across diverse structural types, scales, and noisy environments.

1. Introduction

Structural Damage Identification (SDI) is a technique for assessing the health status of a structure, detecting damage, and predicting the remaining life by collecting and analyzing structural data in real time or periodically. Although traditional manual inspection and local nondestructive testing techniques can capture damage at a specific location, their limitations of low efficiency, high cost, and difficulty in realizing global continuous monitoring have prompted academics and engineers to turn to automated and intelligent damage identification methods.
Intelligent damage identification primarily focuses on two research approaches—data-driven methods [1,2,3,4] and vibration characterization-based methods [5,6,7,8]. Data-driven methods rely mainly on machine learning and deep learning techniques. These methods circumvent physical models by uncovering hidden patterns within sensor data to directly establish mappings between input signals and damage states. For instance, Convolutional Neural Networks can automatically extract damage-sensitive features from time-frequency maps of vibration signals [9,10,11], while Long Short-Term Memory Networks are capable of predicting damage progression trends based on temporal response data [12,13,14]. Such methods exhibit strong nonlinear fitting capabilities and efficient high-dimensional data processing, making them particularly suitable for early detection of minor damage in complex structures. However, data-driven approaches heavily depend on extensive labeled datasets. In practical engineering applications, the scarcity of damage samples and the high cost associated with data labeling often lead to limited model generalizability. Moreover, the “black-box” decision-making mechanism results in damage identification outcomes that lack physical interpretability. This makes it challenging for engineers to fully trust data-driven methods in damage localization and severity assessment, potentially hindering technology implementation—especially in safety-critical domains.
In contrast, vibration characterization-based methods rely on structural dynamics theory. These methods identify changes in structural stiffness or mass distribution by analyzing damage-induced variations in dynamic parameters such as natural frequency [15], modal shapes [16], and damping ratios [17], thereby achieving damage localization and quantification. For instance, the Frequency Change Rate (FCR) [18] compares structural natural frequencies before and after damage occurs, Modal Assurance Criterion (MAC) [19] detects local stiffness degradation by examining correlations between pre- and post-damage vibration shapes, and the flexibility matrix difference method locates damaged regions using stiffness matrix sensitivity. These approaches offer clear physical interpretations, with damage indicators like stiffness reduction factors directly corresponding to engineering experience. They also eliminate the need for labeled data, requiring only a baseline model and measured healthy-state dynamic responses for damage assessment. Nevertheless, significant limitations exist. Finite element (FE) modeling errors, including simplified boundary conditions and material parameter uncertainties, can propagate through the model and affect damage identification results, potentially causing false damage detection. Additionally, vibration characteristics exhibit low sensitivity to localized minor damages. When damage is subtle, modal parameter changes may become indistinguishable from environmental noise such as temperature fluctuations or traffic vibrations, making accurate identification challenging.
To address the limitations of vibration characteristic-based methods, FE model updating and the selection of appropriate optimization algorithms have become crucial for accurate damage localization and quantification. Lee et al. [20] applied model updating techniques to enhance the accuracy of simulation data, which was subsequently utilized for training neural networks to detect structural damage. Huang et al. [21] proposed a hybrid optimization approach integrating Simulated Annealing and Particle Swarm Optimization to fine-tune the hyperparameters of a convolutional neural network, thereby improving its performance in damage identification. Ding et al. [22] introduced three modifications to the JAYA algorithm and incorporated L0.5 regularization into the optimization function to enhance the robustness of damage detection. Ghannadi et al. [23] established an objective function derived from natural vibration frequencies and implemented the Salp Swarm Algorithm for damage assessment in multi-story shear frame structures. Firouzi et al. [24] investigated the effects of hybridizing four optimization algorithms in pairs, evaluating their performance in improving crack detection accuracy in cantilever beams. Ereiz et al. [25] conducted a comprehensive review of finite element model updating methodologies, encompassing sensitivity-based techniques, nature-inspired optimization algorithms, surrogate modeling approaches, and Bayesian inference methods. Alkayem et al. [26] formulated an objective function based on modal strain energy and developed an enhanced Particle Swarm Optimization algorithm, validating its efficacy through damage detection in a benchmark frame structure. Tiachacht et al. [27] employed the slime mold algorithm to assess its noise robustness in structural health monitoring applications. Gara [28] leveraged a Particle Swarm Optimization-based model updating strategy to refine the finite element model of a historical building with complex structural characteristics. Wang et al. [29] optimized sensor placement strategies to accurately extract structural natural frequencies, mode shapes, and damping ratios, facilitating precise model updating. The parametric updating process entails identifying sensitive structural parameters such as elastic modulus and connection stiffness for calibration. This process involves formulating objective functions derived from measured modal data and iteratively adjusting structural parameters to reduce deviations between numerical simulations and experimental measurements. Upon completing model updating, the damage identification problem is framed as a high-dimensional nonlinear optimization task through methodical stiffness reduction across various structural elements. The choice of optimization algorithm significantly influences three crucial performance aspects including identification accuracy, computational efficiency, and noise resistance. However, existing methods present inherent trade-offs: certain algorithms achieve high precision but require extensive computation time, others demonstrate rapid processing but tend to converge to local optima, while some exhibit both efficiency and accuracy but show significant sensitivity to measurement noise.
To overcome these challenges, this study develops a novel damage indicator that integrates Relative Frequency Change Rate (RFCR) and Modal Assurance Criterion (MAC). The SDI process is further enhanced by employing an optimization algorithm based on PID control theory. The effectiveness of the proposed method is systematically validated through numerical simulations of simply supported beams and truss structures, demonstrating superior performance in identification accuracy, computational efficiency, and noise immunity. Additionally, practical applicability is confirmed through experimental validation on a seven-story frame structure, where the proposed method is implemented in conjunction with finite element model updating techniques.

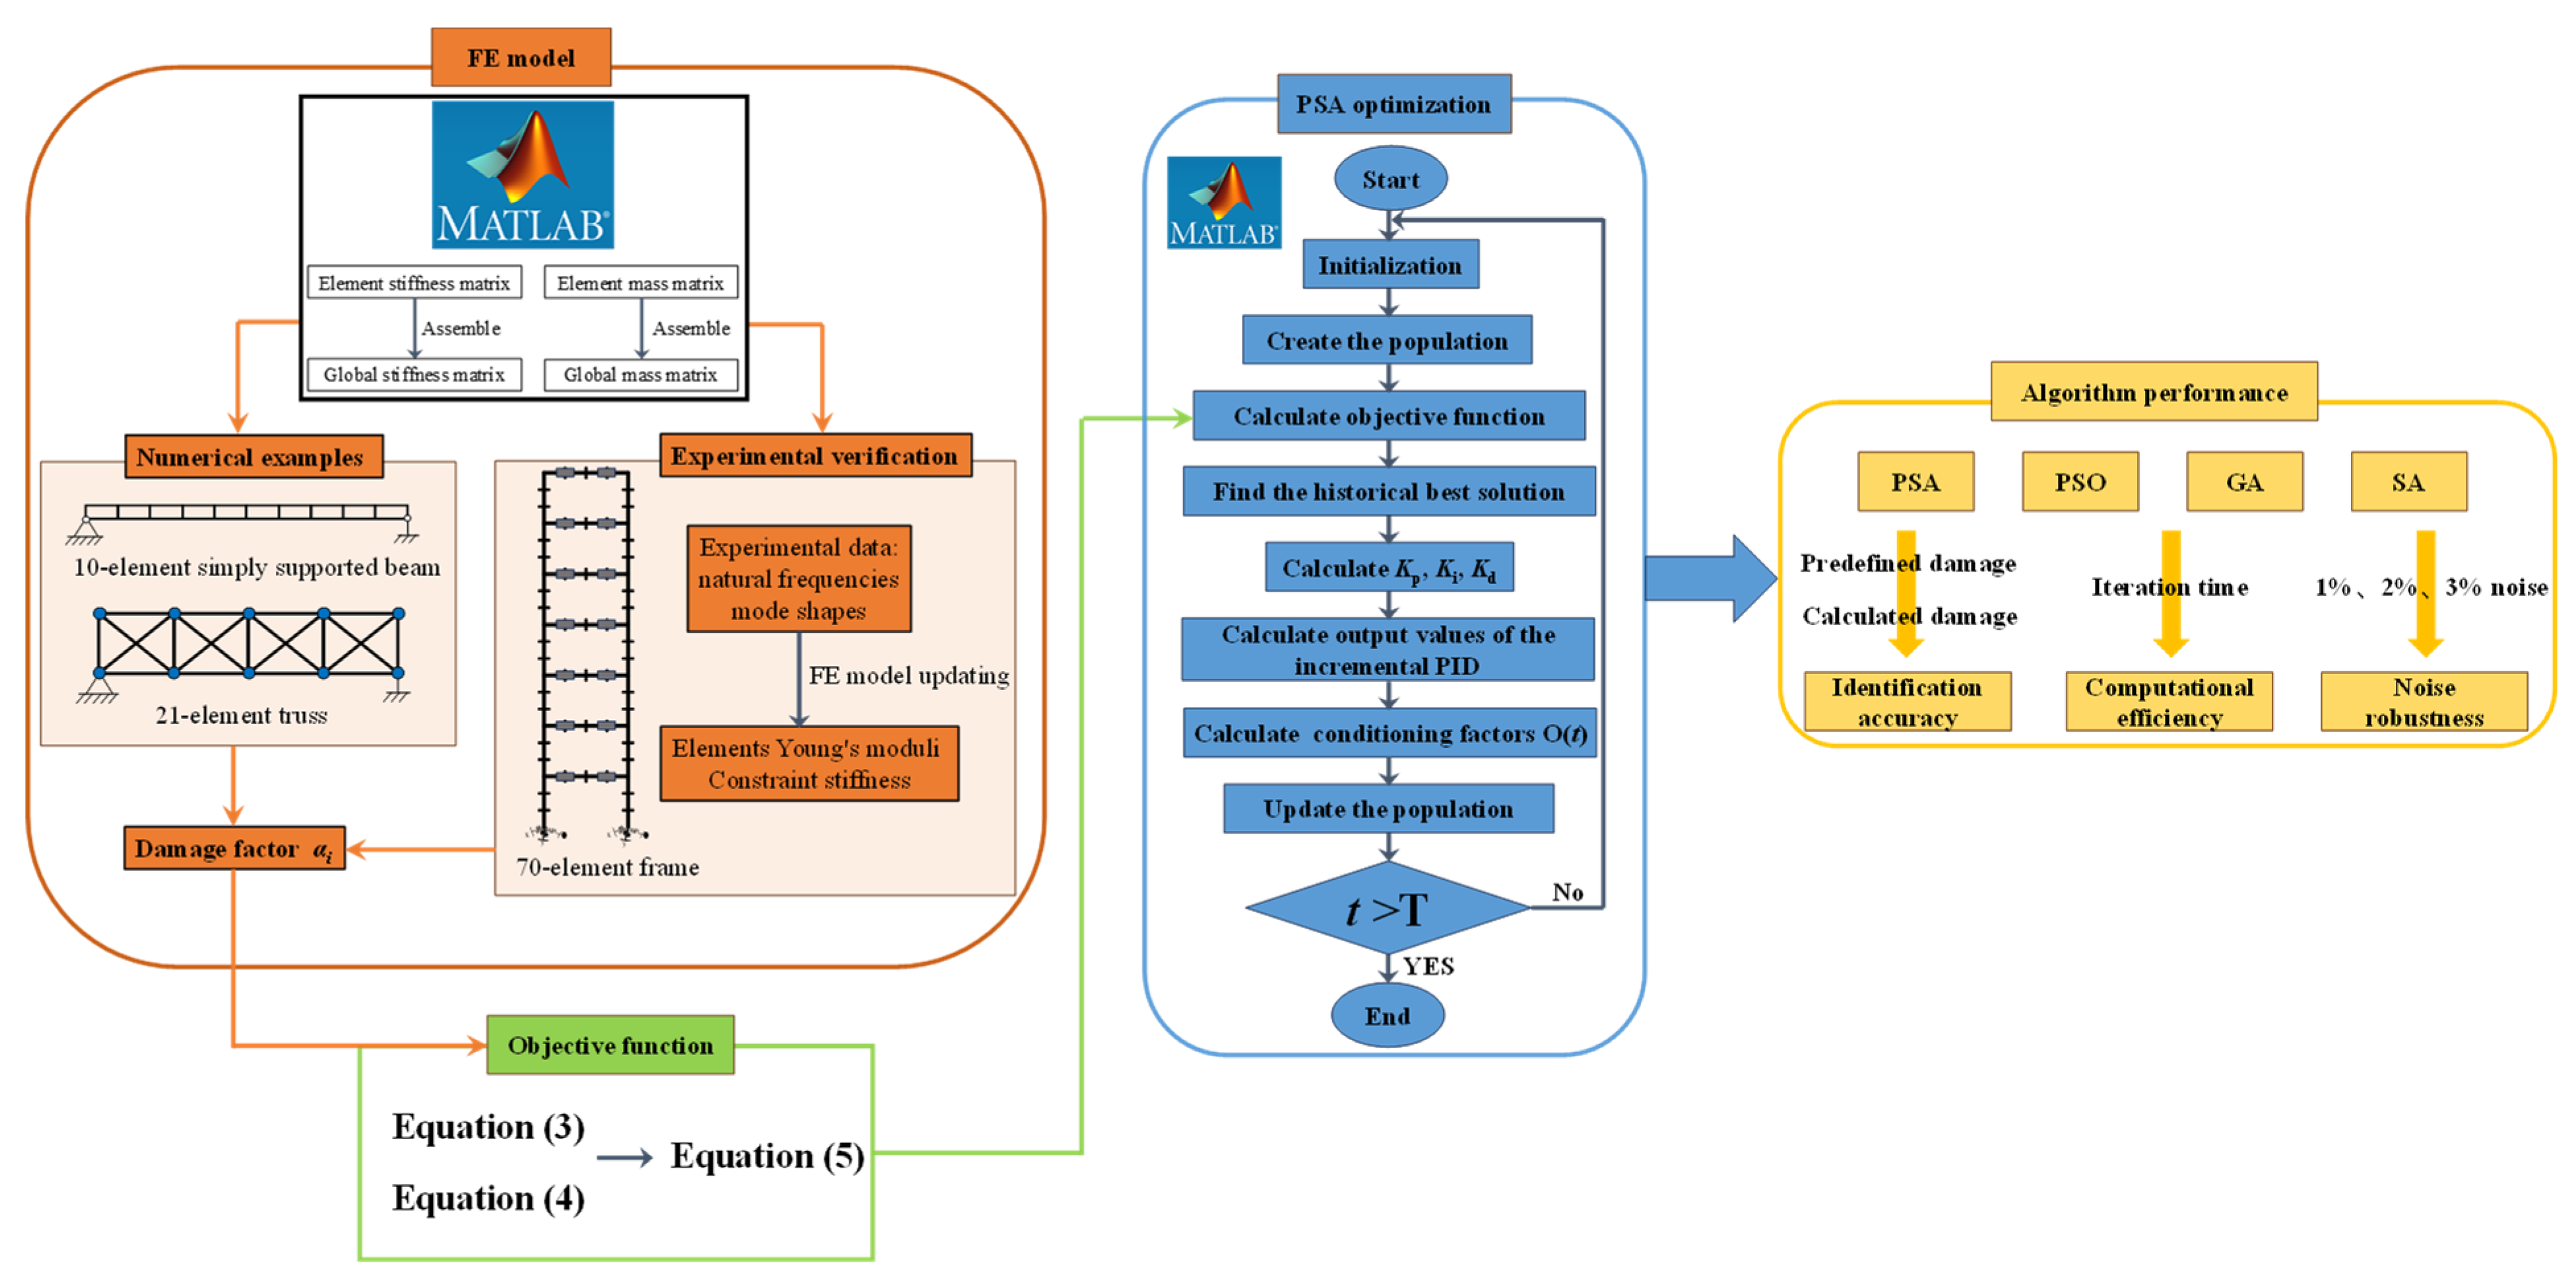
2. Theoretical Background

2.1. Damage Indentification Problem

The SDI problem can be formulated as the following optimization problem:
a opt = arg min α   J ( α )
where J(α) denotes the objective function that quantifies the deviation between numerical model predictions and experimental observations. αopt represents the optimal damage factor vector that characterizes the severity of damage across structural elements. The damage factors vector α are derived from a stiffness reduction model, formulated as follows:
K d = i = 1 N e   1 α i K u , i
where Kd represents the global stiffness matrix of the structural system. Ku,i represents the undamaged stiffness matrix of the i-th element. αi represents the damage factor of the i-th element, within the interval αi ∈ [0, 1] (0 indicate no damage, 1 indicate complete failure). Ne represents the total number of finite elements in the discrete structure. This stiffness reduction model establishes a quantitative relationship between structural damage and stiffness degradation through the damage factor αi, thereby formulating the SDI problem as a parameter optimization framework.
The objective function J(α) is conventionally formulated using static displacement discrepancies, modal frequency discrepancies, or mode shape correlations, and is subsequently solved through numerical optimization algorithms to obtain the optimal damage factor vector αopt. This study proposes an objective function by integrating RFCR and MAC:
R F C R i ( a ) = f i m   f i ( a ) f i m   + f i ( a )
M A C i α = φ i m T φ i ( α ) 2 φ i m T φ i m φ i T ( α ) φ i ( α )
J ( a ) = ω 1 i = 1 N R F C R i α + ω 2 i = 1 N 1 M A C i α + λ α 1
where fim and fi(α) represent the experimentally measured and numerically computed natural frequencies corresponding to the i-th mode, respectively. φim and φi(α) denote experimentally measured and numerically computed modal shape for the i-th mode. The RFCR metric demonstrates particular sensitivity to global structural stiffness variations, making it effective for identifying overall structural damage. However, its diagnostic capability may be compromised when distinct damage scenarios produce comparable natural frequency. Conversely, the MAC metric exhibits superior sensitivity to localized damage and proves particularly effective for detecting frequency-independent damage patterns, including symmetric damage configurations, though its performance may degrade under significant measurement noise conditions. To achieve optimal balance between global and local damage detection capabilities, weighting coefficient ω1 and ω2 are introduced, with values of 0.9 and 0.1 adopted in this study. The term ||α||1 represents the Manhattan norm, where λ functions as the regularization parameter. This regularization component improves the objective function’s noise immunity by controlling model complexity and mitigating spurious correlations induced by measurement noise.

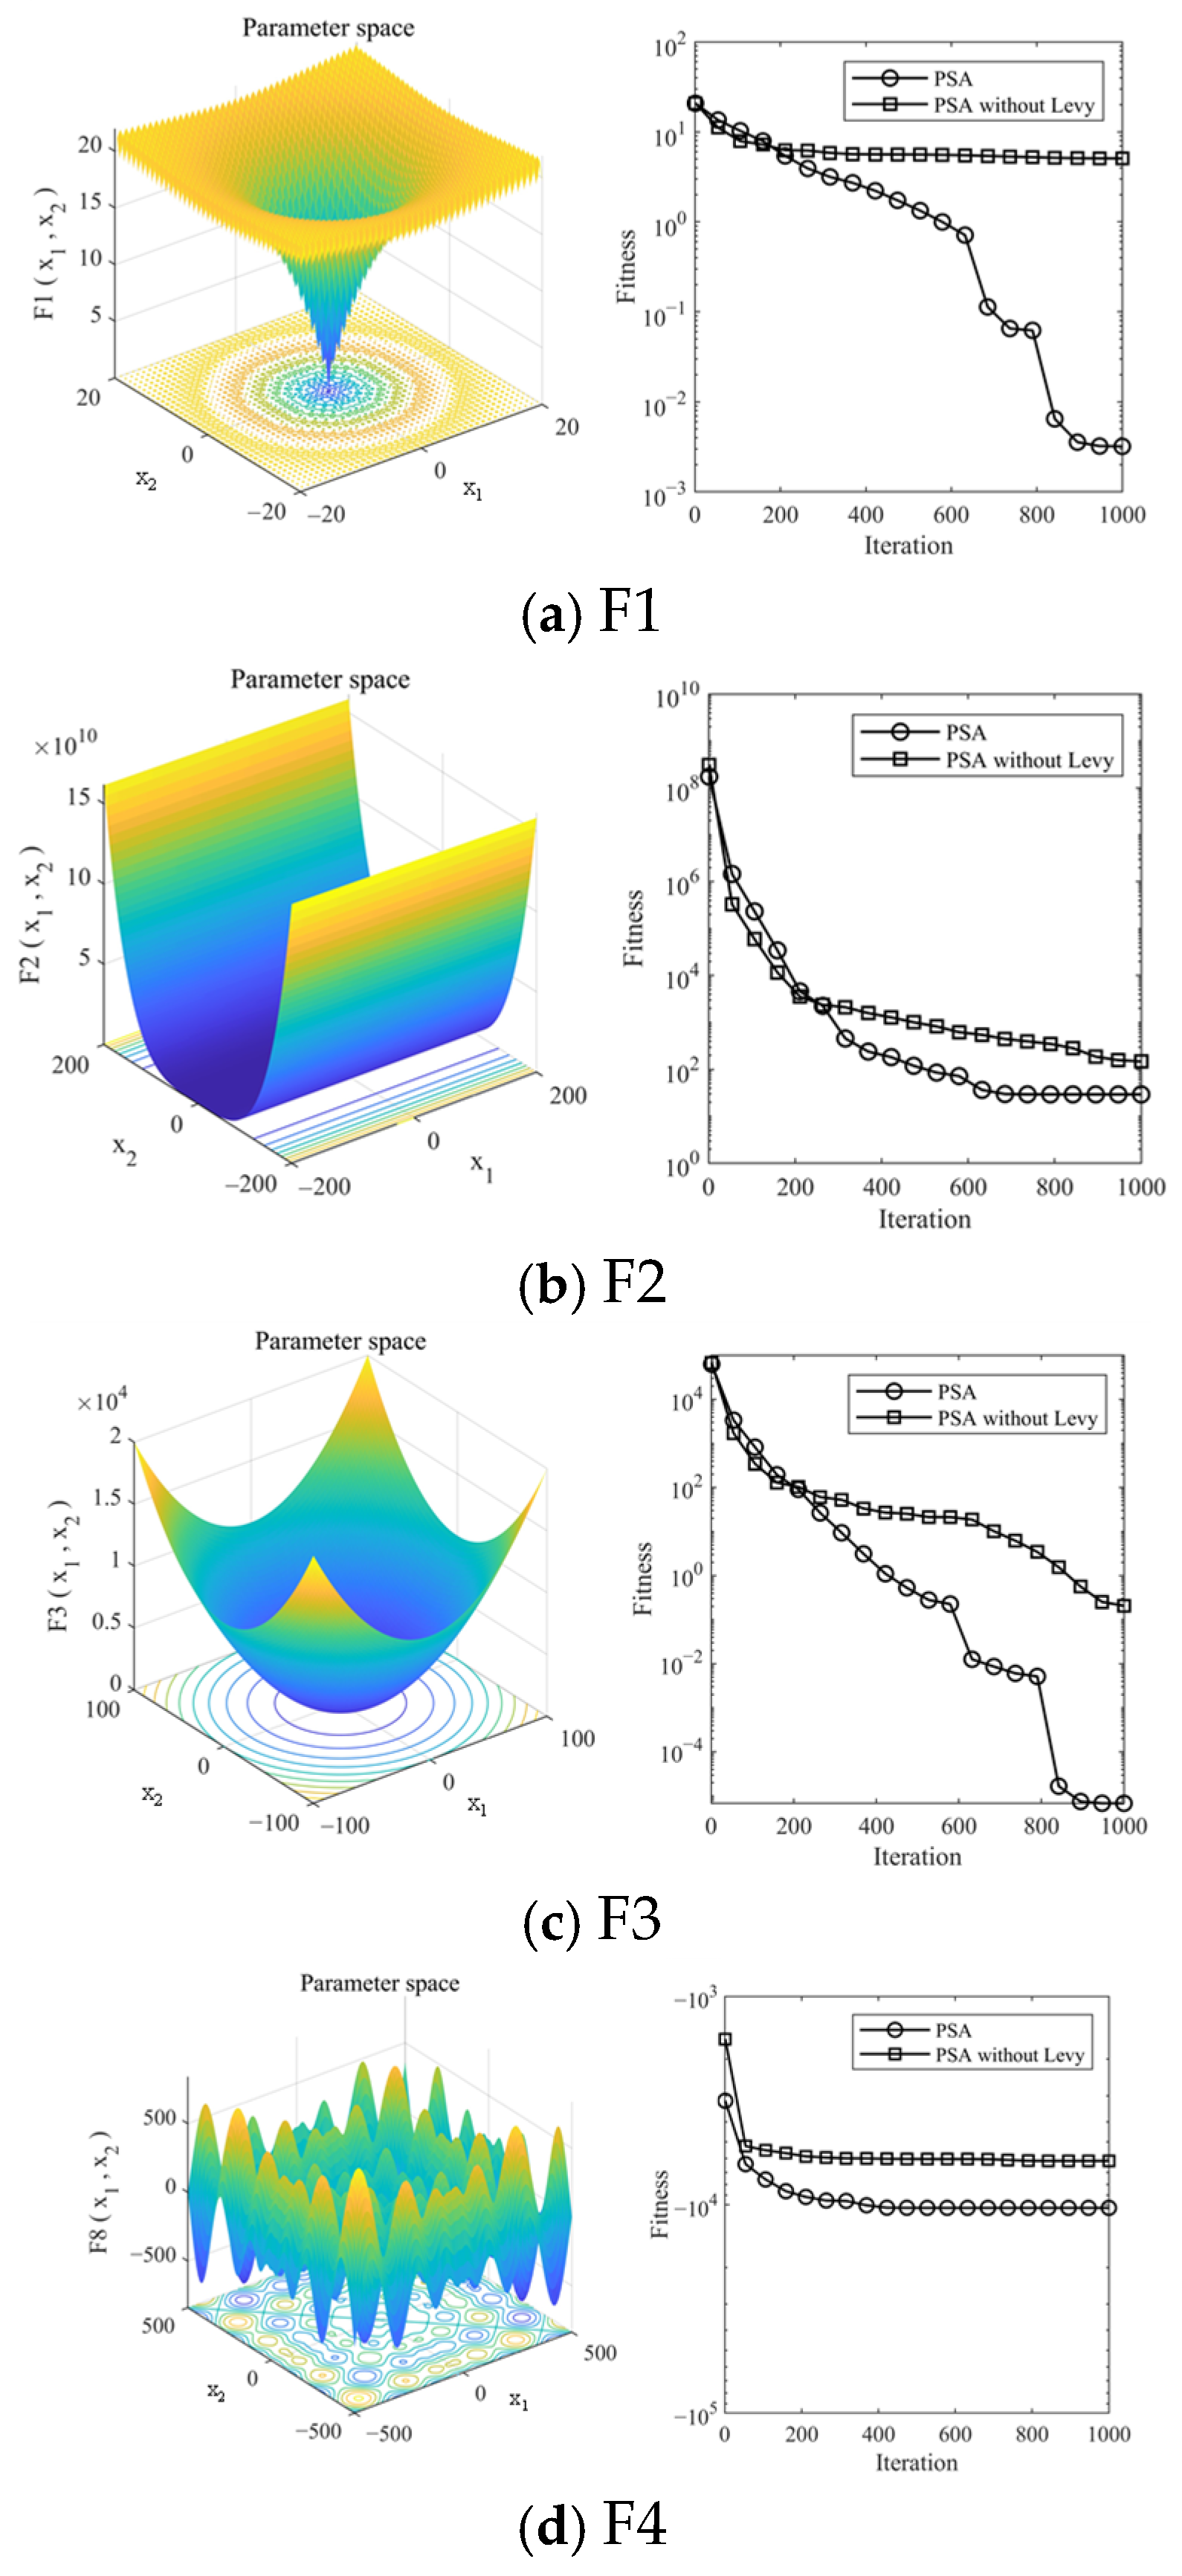
2.2. PID-Based Search Algorithm

Contemporary optimization methodologies can be systematically categorized into four principal groups: evolutionary algorithms, swarm intelligence algorithms, physics-inspired optimization algorithms, and mathematically based optimization algorithms. Evolutionary algorithms like GA (Genetic Algorithm) [30] and DE (Differential Evolution) [31] mimic biological evolution through selection, crossover, and mutation operations, and these methods can effectively explore complex solution spaces. Swarm intelligence algorithms such as PSO (Particle Swarm Optimization) [32] and ACO (Ant Colony Optimization) [33] simulate collective biological behaviors. They solve optimization problems through decentralized information sharing among agents. Physics-inspired methods including SA (Simulated Annealing) [34] and GSA (Gravitational Search Algorithm) [35] are derived from physical phenomena. Mathematically based optimization algorithms are rigorously derived from formal mathematical formulations, featuring provable convergence properties that guarantee asymptotic approximation to optimal solutions within finite iterations.
PID (Proportion, Integral, Differential) control algorithm is a classical feedback control strategy [36,37,38,39]. As a typical mathematically based optimization algorithm, its core framework is illustrated in Figure 1. This algorithm achieves dynamic error correction through continuous adjustment of control outputs derived from a linear combination of error terms. The incremental PID variant implements control quantity computation based on differential equations, replacing conventional absolute output schemes. This approach enhances computational efficiency while simultaneously improving system stability through inherent noise suppression capabilities of differential operations.
Yuansheng Gao [40] proposed a novel search algorithm called incremental PID-based search algorithm (PSA) to address optimization problems. First, random populations are generated based on the upper and lower bounds of the design variables:
x = u l r 1 + l
where u represents the upper bound of the design variable, l represents the lower bound, with r1 denoting a uniformly distributed random variable within the interval [0, 1]. An initial population matrix x is generated with dimensions determined by both the population size and the design variable dimensionality. For minimization optimization problems, the error ek(t) of the PID control algorithm at the iteration t is defined as the difference between the optimal individual from iteration t − 1 and each candidate solution in the population of iteration t − 1:
e k ( t ) = x * ( t 1 ) x ( t 1 )
where x*(t − 1) represents the matrix composed of the optimal individual from the iteration t−1, while x(t − 1) represents the population matrix at the iteration t − 1. The symbol k represents the current iteration, with k − 1 and k − 2 referring to the immediately preceding iteration and the second preceding iteration, respectively. When t = 1, ek(t) = ek−1(t) = ek−2(t), when t > 1, ek−2(t)= ek−1(t − 1), and ek−1(t) should be equal to ek(t − 1), in order to reduce the space complexity of the algorithm, ek−1(t) is denoted as
e k 1 ( t ) = e k ( t 1 ) + x * ( t ) x * ( t 1 )
where x*(t) represents the optimal individual from the iteration t. Based on the principle of the incremental PID algorithm, the control quantity increment Δ u ( t ) at the iteration t can be expressed as
Δ u ( t ) = K p r 2 e k ( t ) e k 1 ( t ) + K i r 3 e k ( t ) + K d r 4 e k ( t ) 2 e k 1 ( t )   + e k 2 ( t )
where r2, r3, r4 represent uniformly distributed random vectors with elements ranging from 0 to 1. Kp, Ki, Kd correspond to the proportional, differential, and integral terms of the incremental PID, respectively. To prevent premature convergence to local optima, a regulation factor is incorporated into the following algorithm:
o ( t ) = cos ( 1 t / T ) + λ r 5 L e k ( t )
where r5 represents uniformly distributed random vectors with elements ranging from 0 to 1. T represents the maximum iteration count. λ serves as the adjustment factor, L represents the Levy flight function. The mathematical formulations for λ and L are given by
λ = [ ln ( T t + 2 ) / ln ( T ) ] 2
L = u σ | v | 1 / β ; σ = Γ ( 1 + β ) × sin ( π β / 2 ) Γ ( ( 1 + β ) / 2 ) × β × 2 ( β 1 ) / 2 1 / β
where u and v represent the random matrices with dimensions determined by the population size and design variable dimensionality. β is a constant and set to 1.5 in this study. The position update for all candidate solutions in the population depends on both Δ u ( t ) and o ( t ) , as mathematically expressed by the following:
x ( t + 1 ) = x ( t ) + η Δ u ( t ) + ( 1 η ) o ( t )
where ƞ represents a column vector with dimensions corresponding to the population size, which is calculated as follows:
η = r 6 cos ( t / T )
where r6 represents uniformly distributed random vectors with elements ranging from 0 to 1.
To investigate the impact of the Levy flight mechanism on the PSA, the following four test functions are selected:
F 1 = 20 exp 0.2 i = 1 n x i 2 n exp i = 1 n cos 2 π x i n + 20 + exp ( 1 ) n = 30 ;   20 x i 20
F 2 = i = 1 n 1 100 x i + 1 x i 2 2 + x i 1 2 n = 30 ;   200 x i 200
F 3 = i = 1 n x i 2 n = 30 ;   100 x i 100
F 4 = i = 1 n x i sin x i   n = 30 ;   500 x i 500
The optimization results of PSA and PSA without Levy are shown in Figure 2, where the left side displays the 3D surface plot of the function and the right side presents the iteration curves, with fitness expressed on a logarithmic. From Figure 2a–d, PSA consistently achieves superior performance over PSA without Levy by obtaining smaller fitness values, demonstrating that the Levy flight mechanism significantly enhances the algorithm’s global exploration capability and effectively prevents premature convergence to local optima.

2.3. Workflow

This study selects three representative optimization algorithms for comparative analysis with PSA: GA representing evolutionary algorithms, PSO as a swarm optimization algorithm, and SA representing physics-inspired optimization algorithms. The specific parameter settings for each algorithm are provided in Table 1. In the GA implementation, the crossover rate governs the production of new candidate solutions, while the mutation rate collectively introduces stochastic elements into the evolutionary process, and tournament size is used to select superior individuals from the current population to participate in crossover and mutation operations. The PSO algorithm employs an inertia weight w to modulate the influence of a particle’s current velocity on its subsequent movement, while c1 and c2 directly influence the algorithm’s convergence behavior and search capability by balancing the trade-off between individual experience and swarm cooperation. For the SA, the initial temperature parameter regulates the probability of accepting suboptimal solutions during the exploration phase, whereas the cooling rate parameter governs the convergence characteristics throughout the iterative process. Within the PSA framework, the control parameters Kp, Ki, and Kd respectively determine the adjustment rates for the proportional, integral, and derivative components of the control strategy.
The workflow of this study is illustrated in Figure 3. The programming and numerical computations are performed in MATLAB R2023b [41,42]. In the FE analysis phase, the element stiffness matrices and element mass matrices are systematically assembled into global matrices, after which eigenvalue analysis is conducted to characterize the structural dynamic properties. Following the introduction of damage factors, the objective function defined in Equation (5) is computed from the resultant data and employed as the fitness for the PSA. The PSA iterative solution process is then executed in accordance with the computational framework established by Equations (6)–(14). The SDI performance of PSA is subsequently evaluated through comparative analysis with PSO, GA, and SA algorithms. To ensure a fair comparison, the population size of all algorithms was uniformly set to 30.

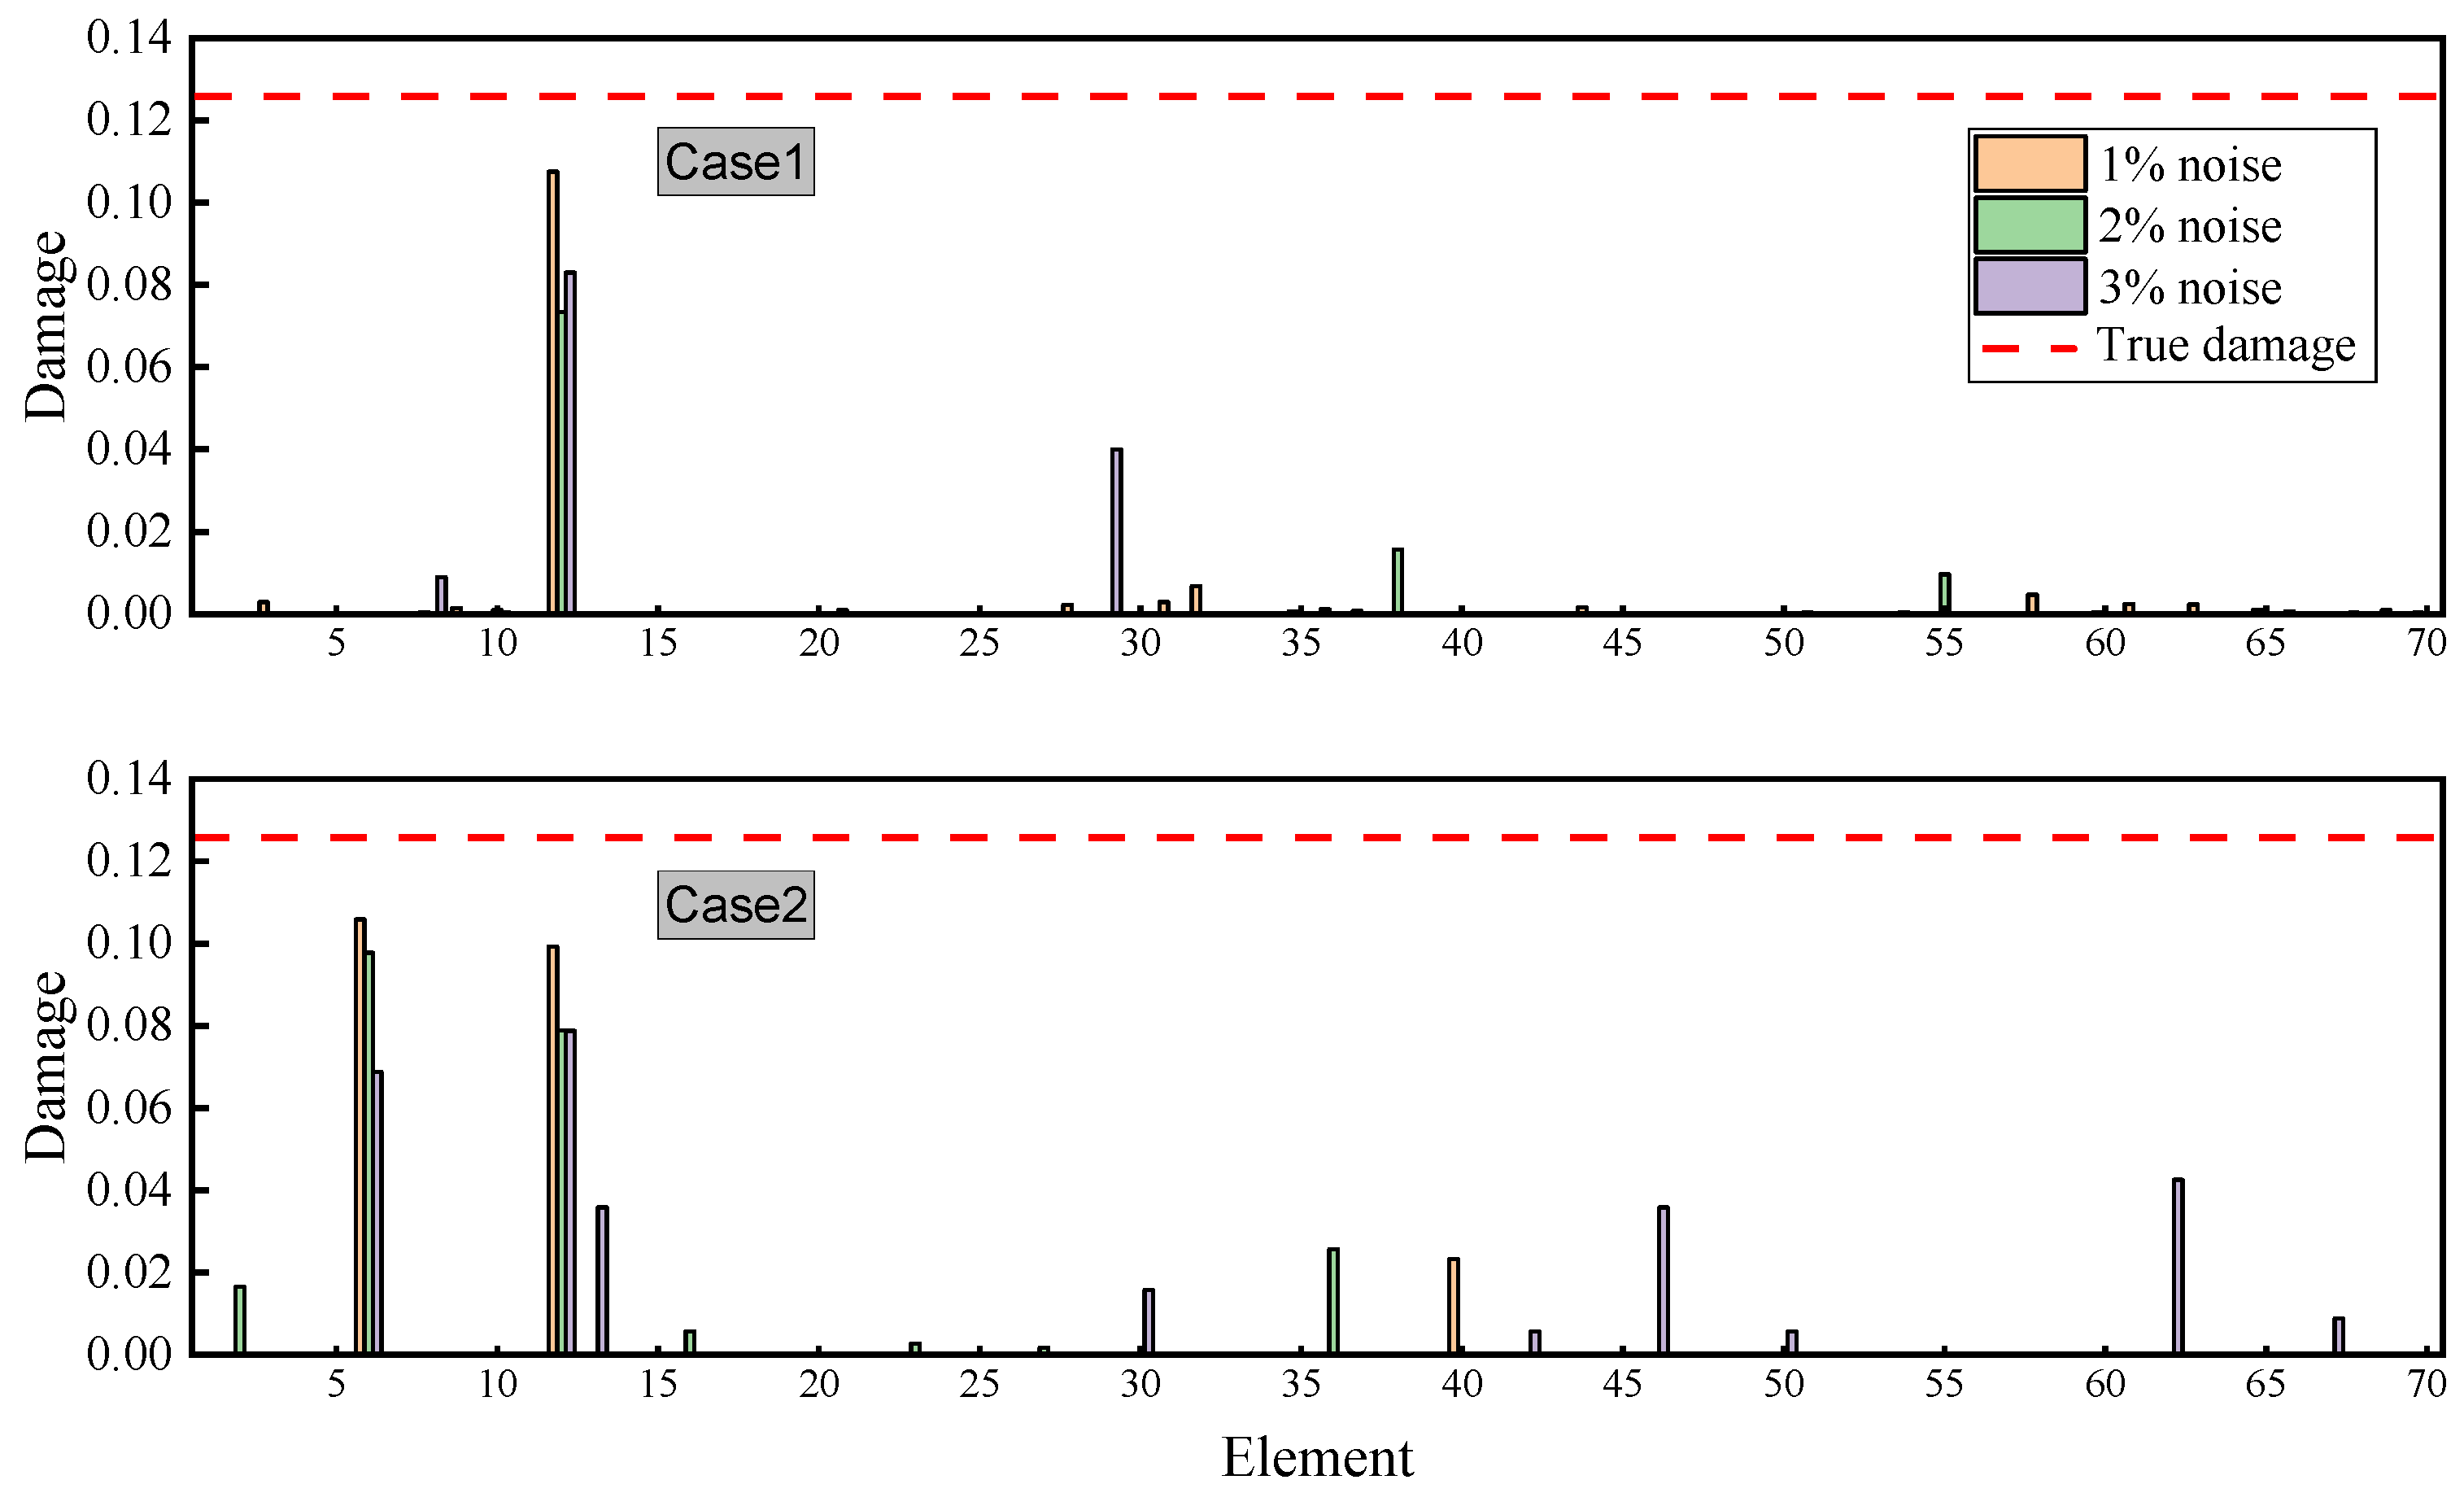
3. Simulation Examples

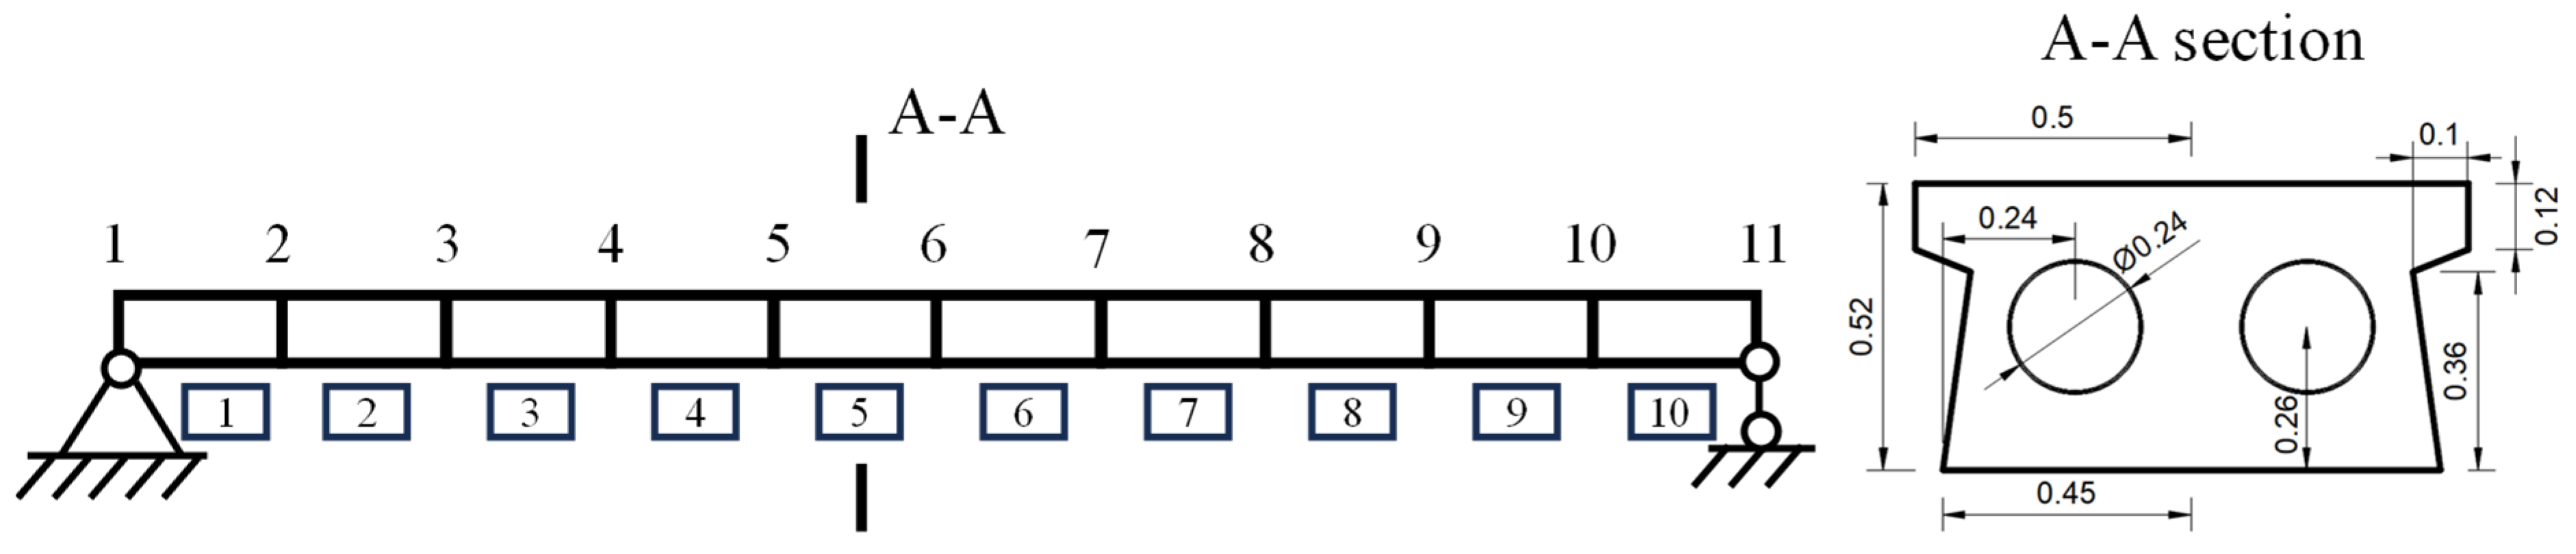
3.1. Simply Supported Beam
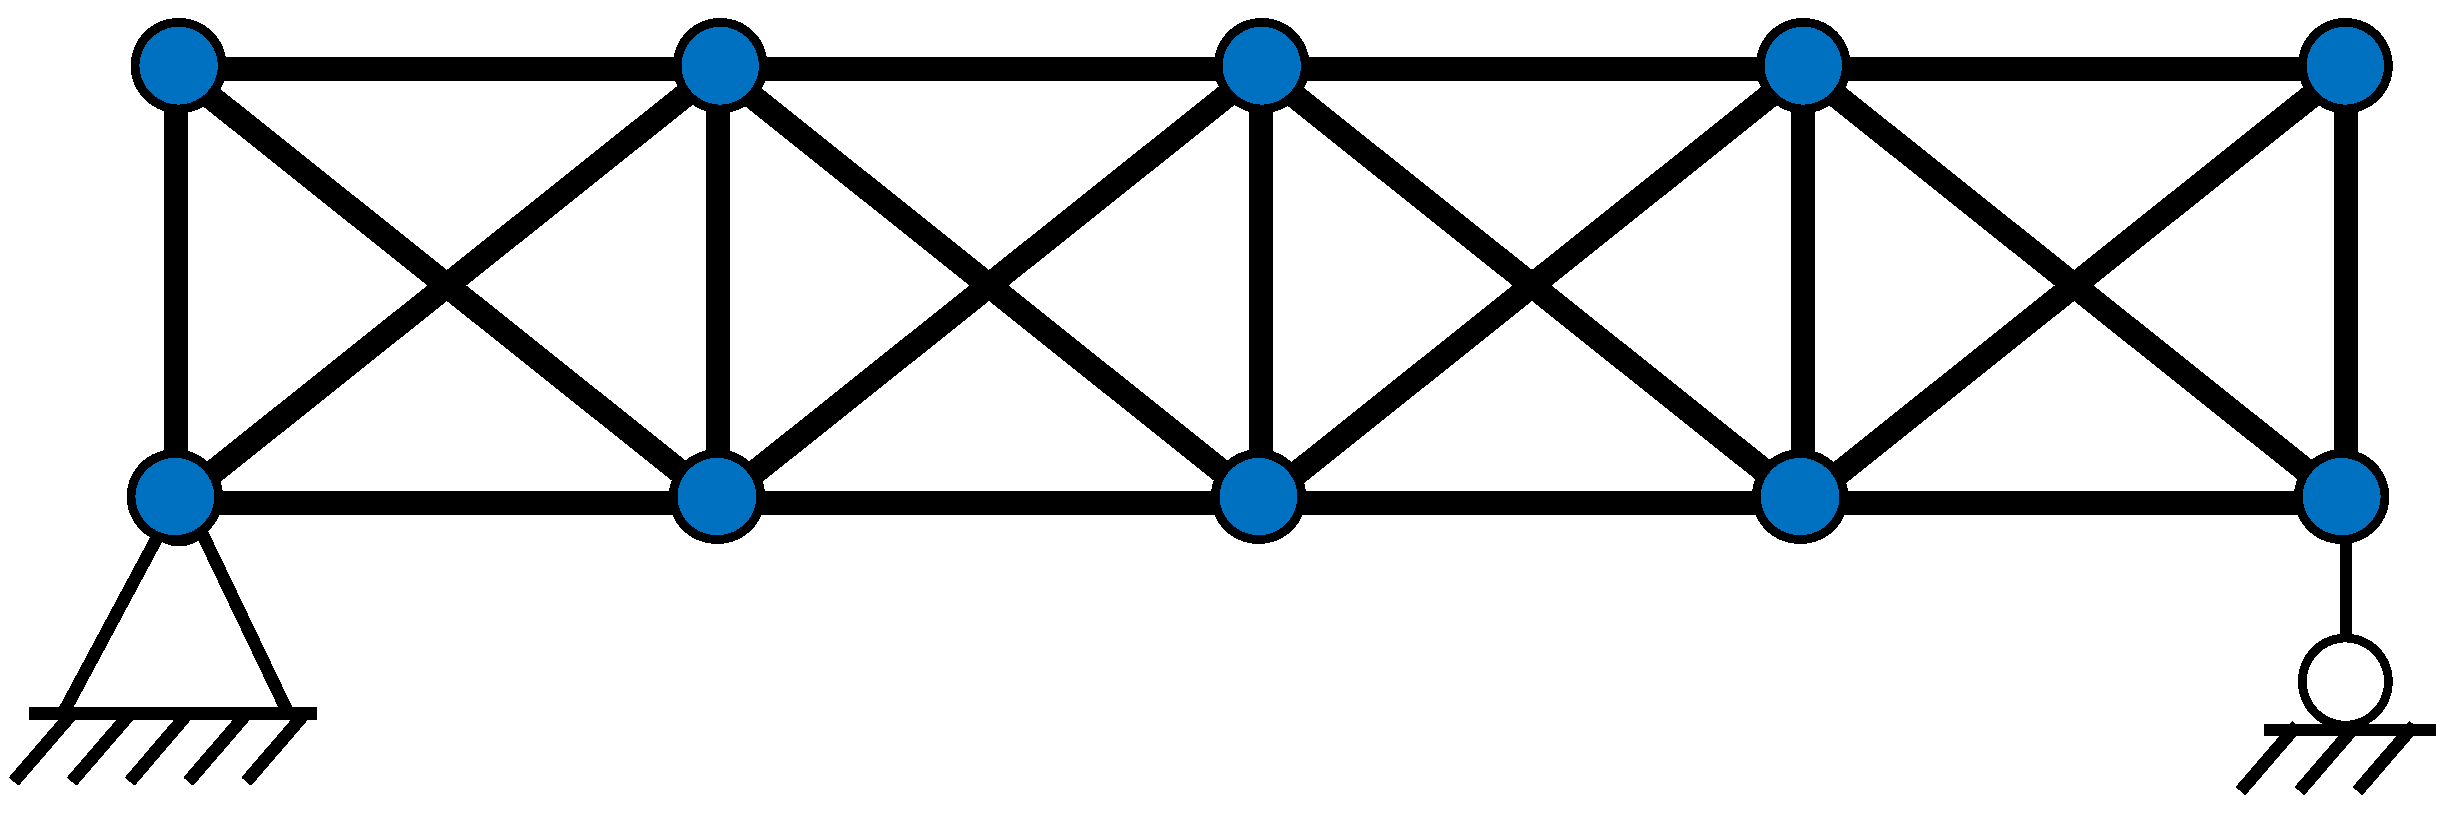
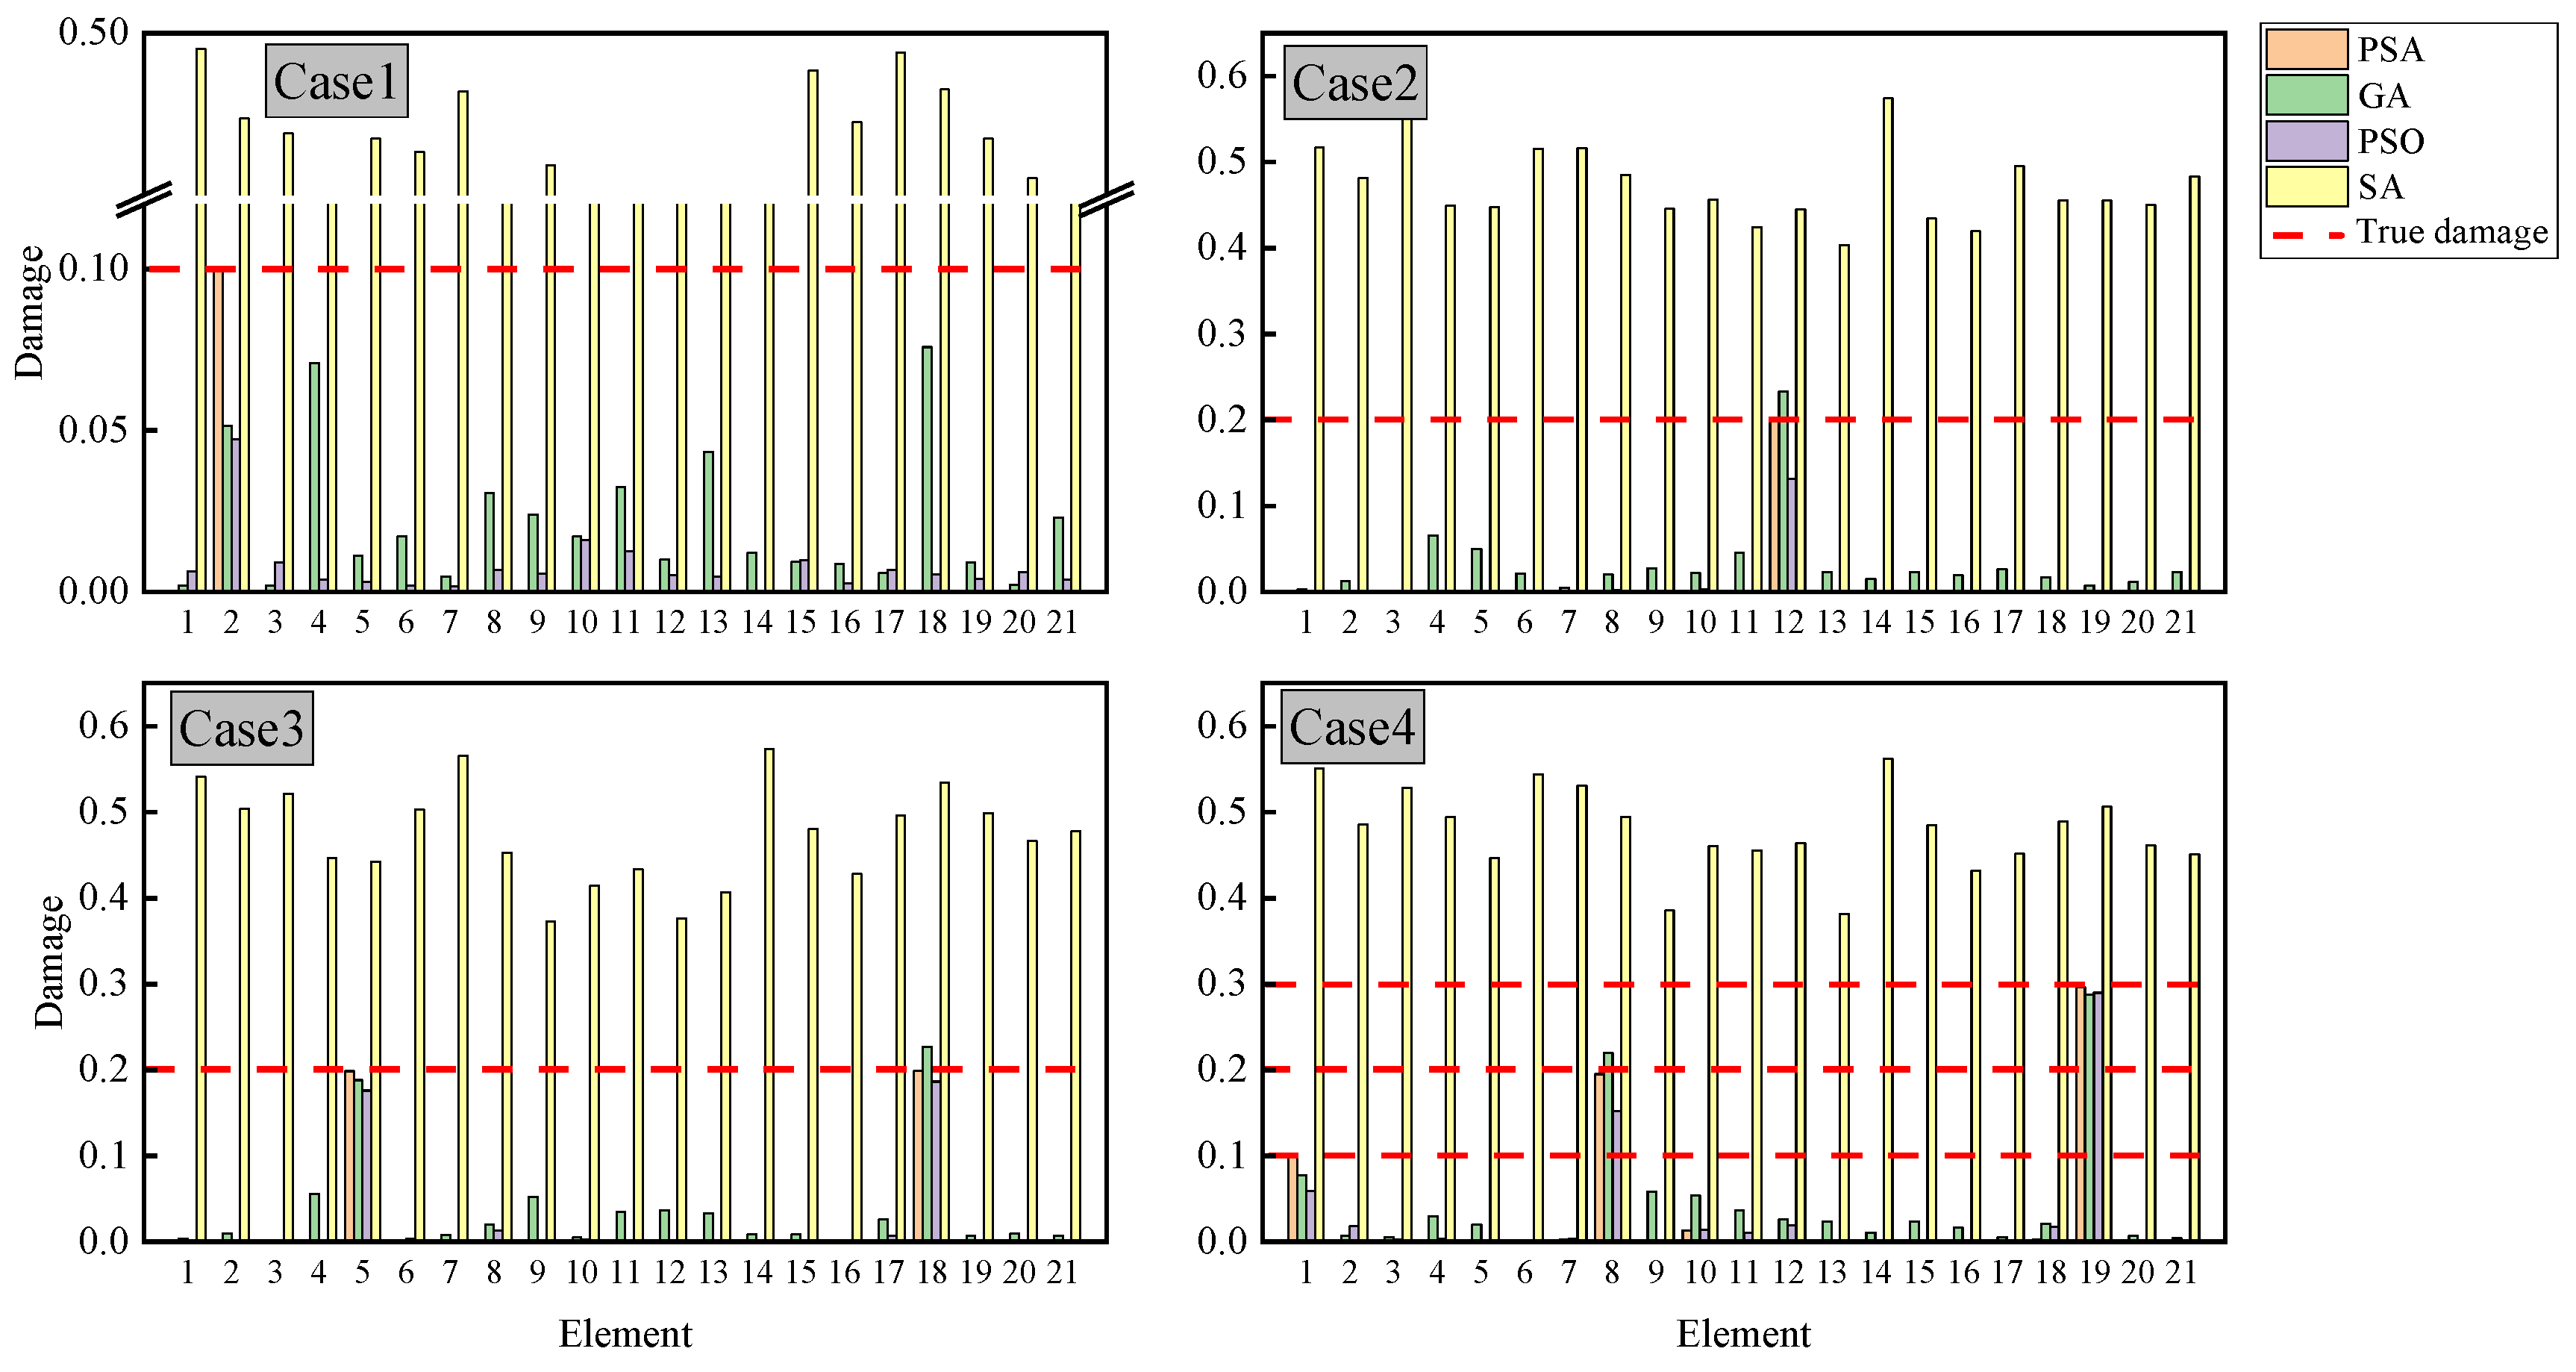
A finite element model of a simply supported beam is established, with its nodal and element configuration illustrated in Figure 4. The structure is a 20 m-long concrete beam featuring a double-hole box and short-slab cross-section. The model comprises 10 elements, each possessing 4 degrees of freedom. The material properties of the beam include an elastic modulus of 3.1 × 10¹⁰ Pa, a density of 2500 kg/m3, and cross-sectional area of 0.3715 m2, and a moment of inertia of 0.01056 m4.
Six damage cases are defined in Table 2 to evaluate the performance of the algorithms, including three single-damage cases, one symmetrical double-damage case, one asymmetrical double-damage case, and one triple-damage case. Due to the inherent stochasticity of intelligent algorithms, each case is simulated 100 times, the maximum iteration for each algorithm is set to 200, and the results are averaged to ensure statistical reliability. Figure 5 presents Case 1 as a representative example, and the PSO algorithm achieves the fastest convergence and stabilization. PSA and GA exhibit comparable convergence speeds, while SA demonstrates significantly slower convergence. Notably, PSA achieves the smallest fitness value closest to 0, demonstrating exceptional precision in aligning measured and calculated frequencies and mode shapes.
The SDI results are presented in Figure 6. While GA, PSO, and PSA successfully localized damage across all cases, significant discrepancies emerged in their ability to quantify damage severity. PSA achieves near-complete identification of damage severity, exhibiting substantially superior performance compared to both GA and PSO. For instance, in Case 3, PSA estimated a 29.9% stiffness reduction in element 9 with error < 1%, whereas GA and PSO yielded 0.274 (8.7% error) and 0.282 (6% error), respectively. Case 6 further highlighted PSA’s superiority in multi-location damage scenarios; although GA, PSO, and PSA accurately quantified damage in element 5 with 0.198–0.199 reduction, PSA uniquely maintained precision for elements 1 and 7, while GA and PSO exhibited deviations exceeding 10%. In contrast, SA failed to achieve reliable identification in all six test cases. Its limitations became pronounced in high-dimensional search spaces, particularly when optimizing multi-peak objective functions characteristic of complex damage patterns. This manifested as slow convergence rates and susceptibility to local minima.
The computational time of the four algorithms is compared in Table 3. PSA demonstrates superior time performance, requiring approximately one-third of GA’s computation time across six test cases, while also being marginally faster than PSO. Although PSA only achieves modest time savings in the simply supported beam case, it shows significant potential for more complex finite element analyses. This efficiency advantage makes PSA particularly suitable for real-time structural health monitoring systems that demand rapid response capabilities. It should be noted that SA completes identification within 0.018–0.019 s, but at the cost of substantially compromised accuracy.

3.2. 21-Bar Truss

This section examines the effect of measurement noise on SDI performance. The analysis employs a 21-member truss structure, with its configuration graphically presented in Figure 7. All structural elements possess two degrees of freedom. The upper and lower chord members have a uniform length of 2.5 m, while the web members measure 2 m in length. The structural components utilize circular steel cross-sections characterized by an elastic modulus of 210 GPa, a material density of 7800 kg/m3, and a cross-sectional area of 5 × 10⁻³ m3.
Table 4 outlines four distinct damage scenarios comprising two cases of single-element damage, one case of dual-element damage, and one case of triple-element damage. Due to the increase in elements, the number of iterations is set to 1000 to ensure convergence to the optimal solution. Figure 8 illustrates the damage identification performance across different algorithms. The PSA maintains consistent accuracy in locating damaged elements and quantifying damage severity within the truss structure, aligning with its previously demonstrated performance in simply supported beam applications and confirming its effectiveness for diverse structural configurations. Across all test cases, GA consistently generated erroneous damage predictions affecting multiple structural members. PSO exhibited comparable limitations, particularly in Case 1, where it misidentified several undamaged elements as compromised. While PSO achieved correct damage localization in Cases 2 to 4, its severity assessments displayed considerable variance from the true damage values. Most significantly, SA proved entirely ineffective for damage detection throughout all experimental scenarios.
Table 5 presents the computation time for each algorithm. As the number of elements increases, the computational efficiency advantage of PSA becomes more pronounced. Compared to GA, PSA achieves an average time savings of approximately 3 s per case, while it outperforms PSO by around 1 s. Although SA computes extremely fast due to its lack of a population mechanism, it may occasionally accept inferior solutions, leading to inaccuracies in SDI.
To investigate the influence of measurement noise, Gaussian-distributed random noise with intensity levels ranging from 1% to 3% is introduced to both frequency and modal data, formulated as follows:
y = y ( 1 + r ρ )
where y* and y represent the noise-contaminated and original data, respectively, r represents a Gaussian random variable with zero mean and unit variance, and ρ represents the prescribed noise level ranging from 1% to 3%.
Figure 9 presents the damage identification results of PSA under noisy conditions. The analysis reveals that PSA exhibits certain misjudgments across all four cases when subjected to noise interference, with particularly notable errors observed in Case 2 where false damage identifications occurred in multiple structural elements under 1–3% noise levels. However, the performance demonstrates significant improvement in Cases 1, 3, and 4. Under 1% and 2% noise conditions, PSA maintains accurate damage localization with minimal false identifications, though some interference emerges in damage severity quantification. For instance, in Case 1 with 1% and 2% noise levels, the identified damage severities of 8.6% and 12.1% correspond to relative errors of 14% and 21%, respectively, compared to true values. Overall, PSA demonstrates robust noise resistance, maintaining satisfactory identification accuracy under low noise conditions (1–2%). However, the performance shows noticeable degradation when noise intensity increases to 3%, particularly with some intact elements being misjudged as damaged.

4. Experimental Verification

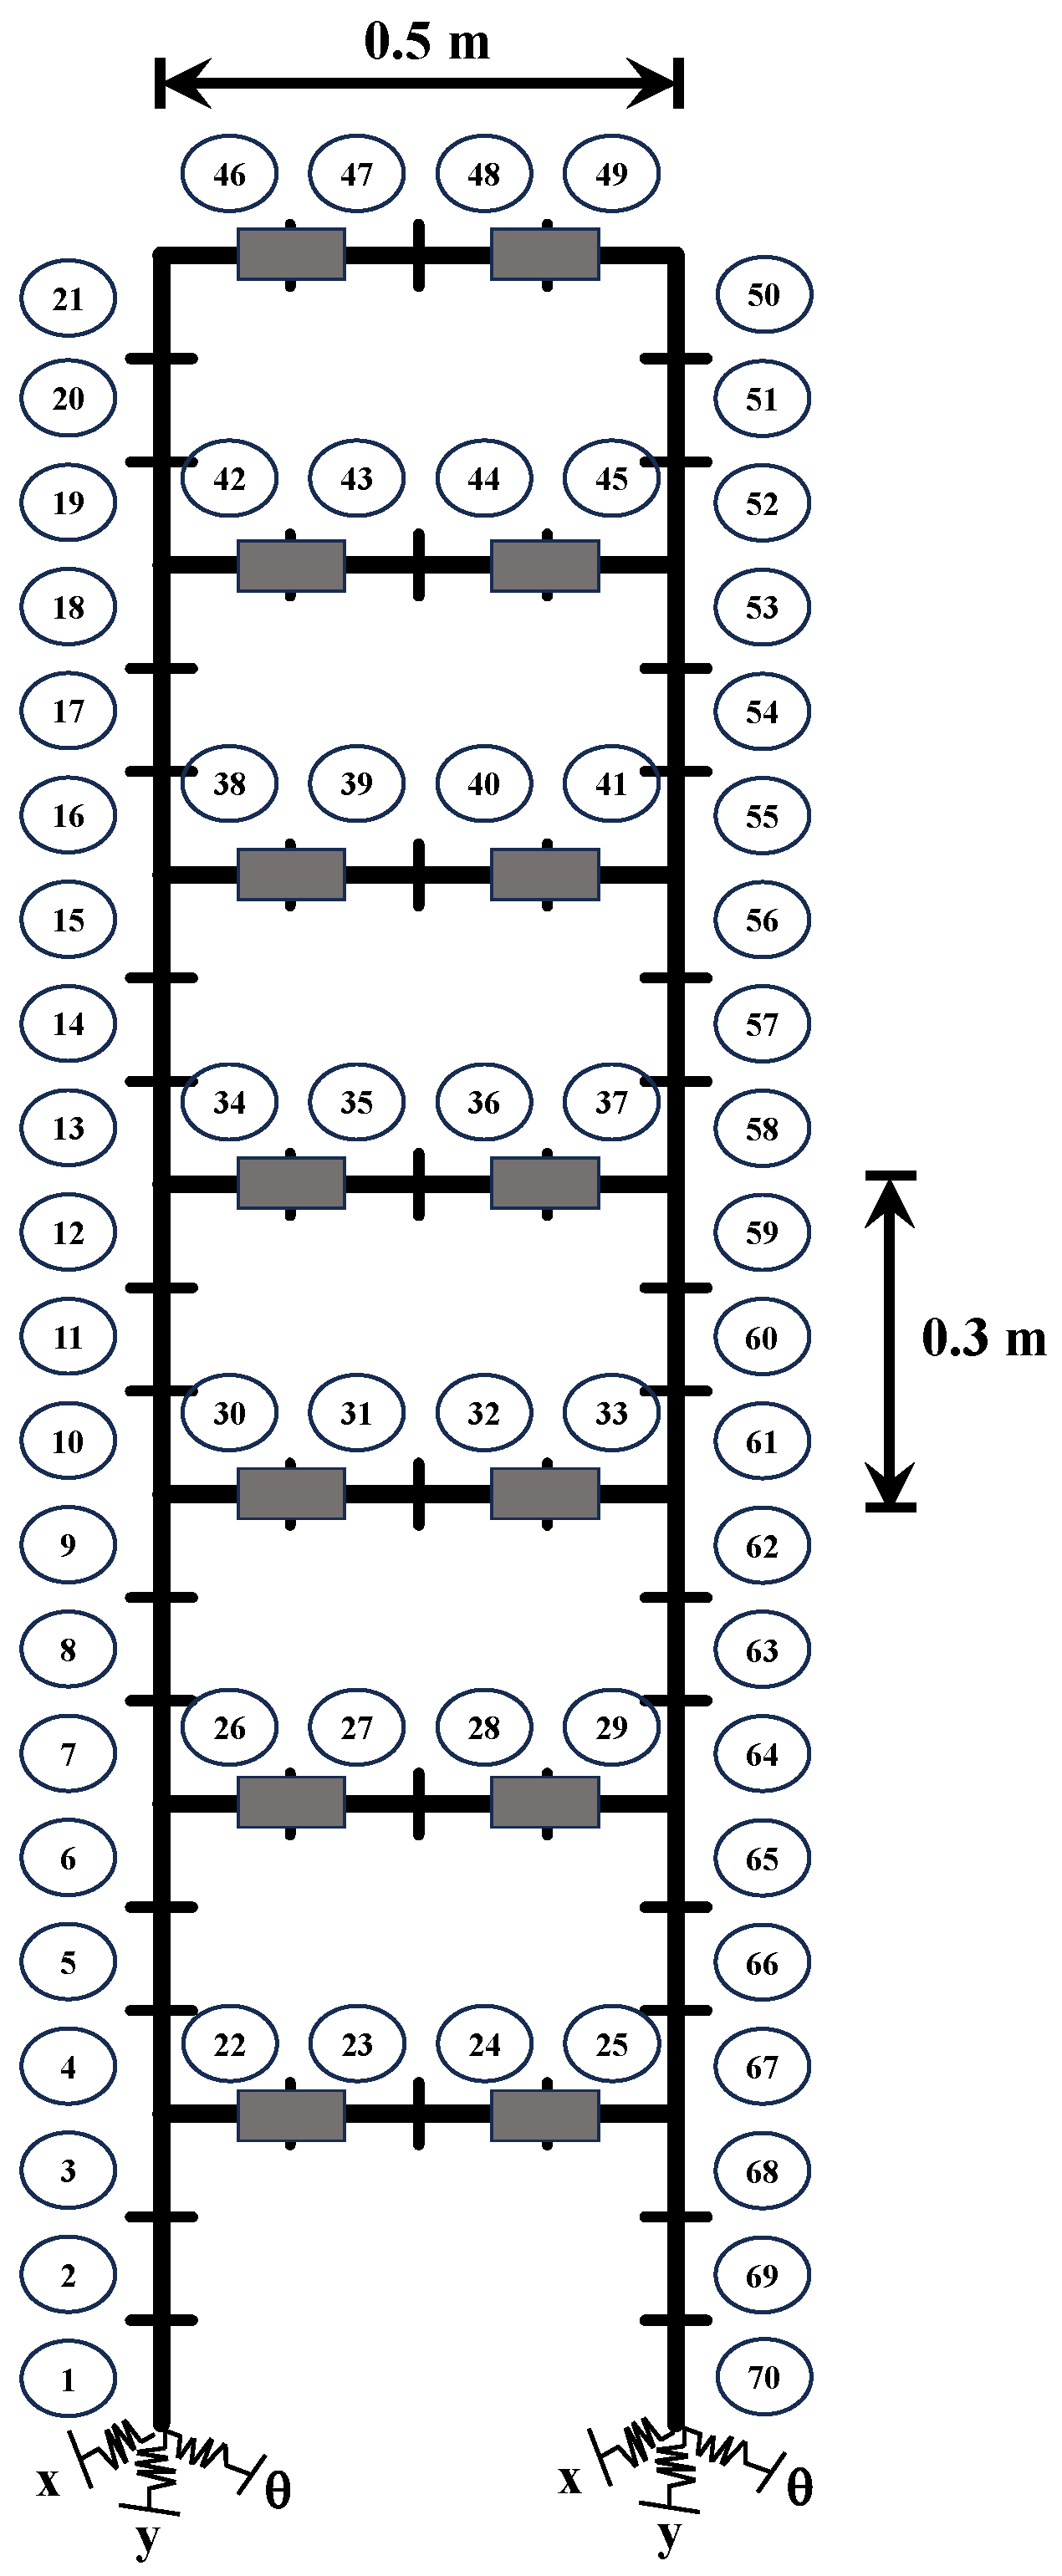
4.1. Experimental Setup

The proposed method is validated using the seven-story steel frame test conducted by Li et al. [43]. The experimental setup is shown in Figure 10. The frame has a width of 0.5 m, with each story height of 0.3 m. Lumped masses were placed at the 1/4 and 3/4 positions of each floor to simulate the floor weight, with each mass block weighing approximately 8 kg. An FE model is established for simulation, where beam elements are used to model the frame structure. Each column is divided into three elements with a density of 7850 kg/m3, while each floor slab is divided into four elements with a density of 7734.2 kg/m3. The entire structure consists of 70 elements in total. The column cross-section measured 49.98 mm in length and 4.85 mm in width, whereas the floor slab cross-section measured 49.98 mm in length and 8.92 mm in width. The base support of the frame structure is modeled with spring restraints in three degrees of freedom: lateral translation (x), vertical translation (y), and rotation about the z-axis (θ). The initial Young’s modulus for all elements is set to 210 GPa.

4.2. FE Model Updating
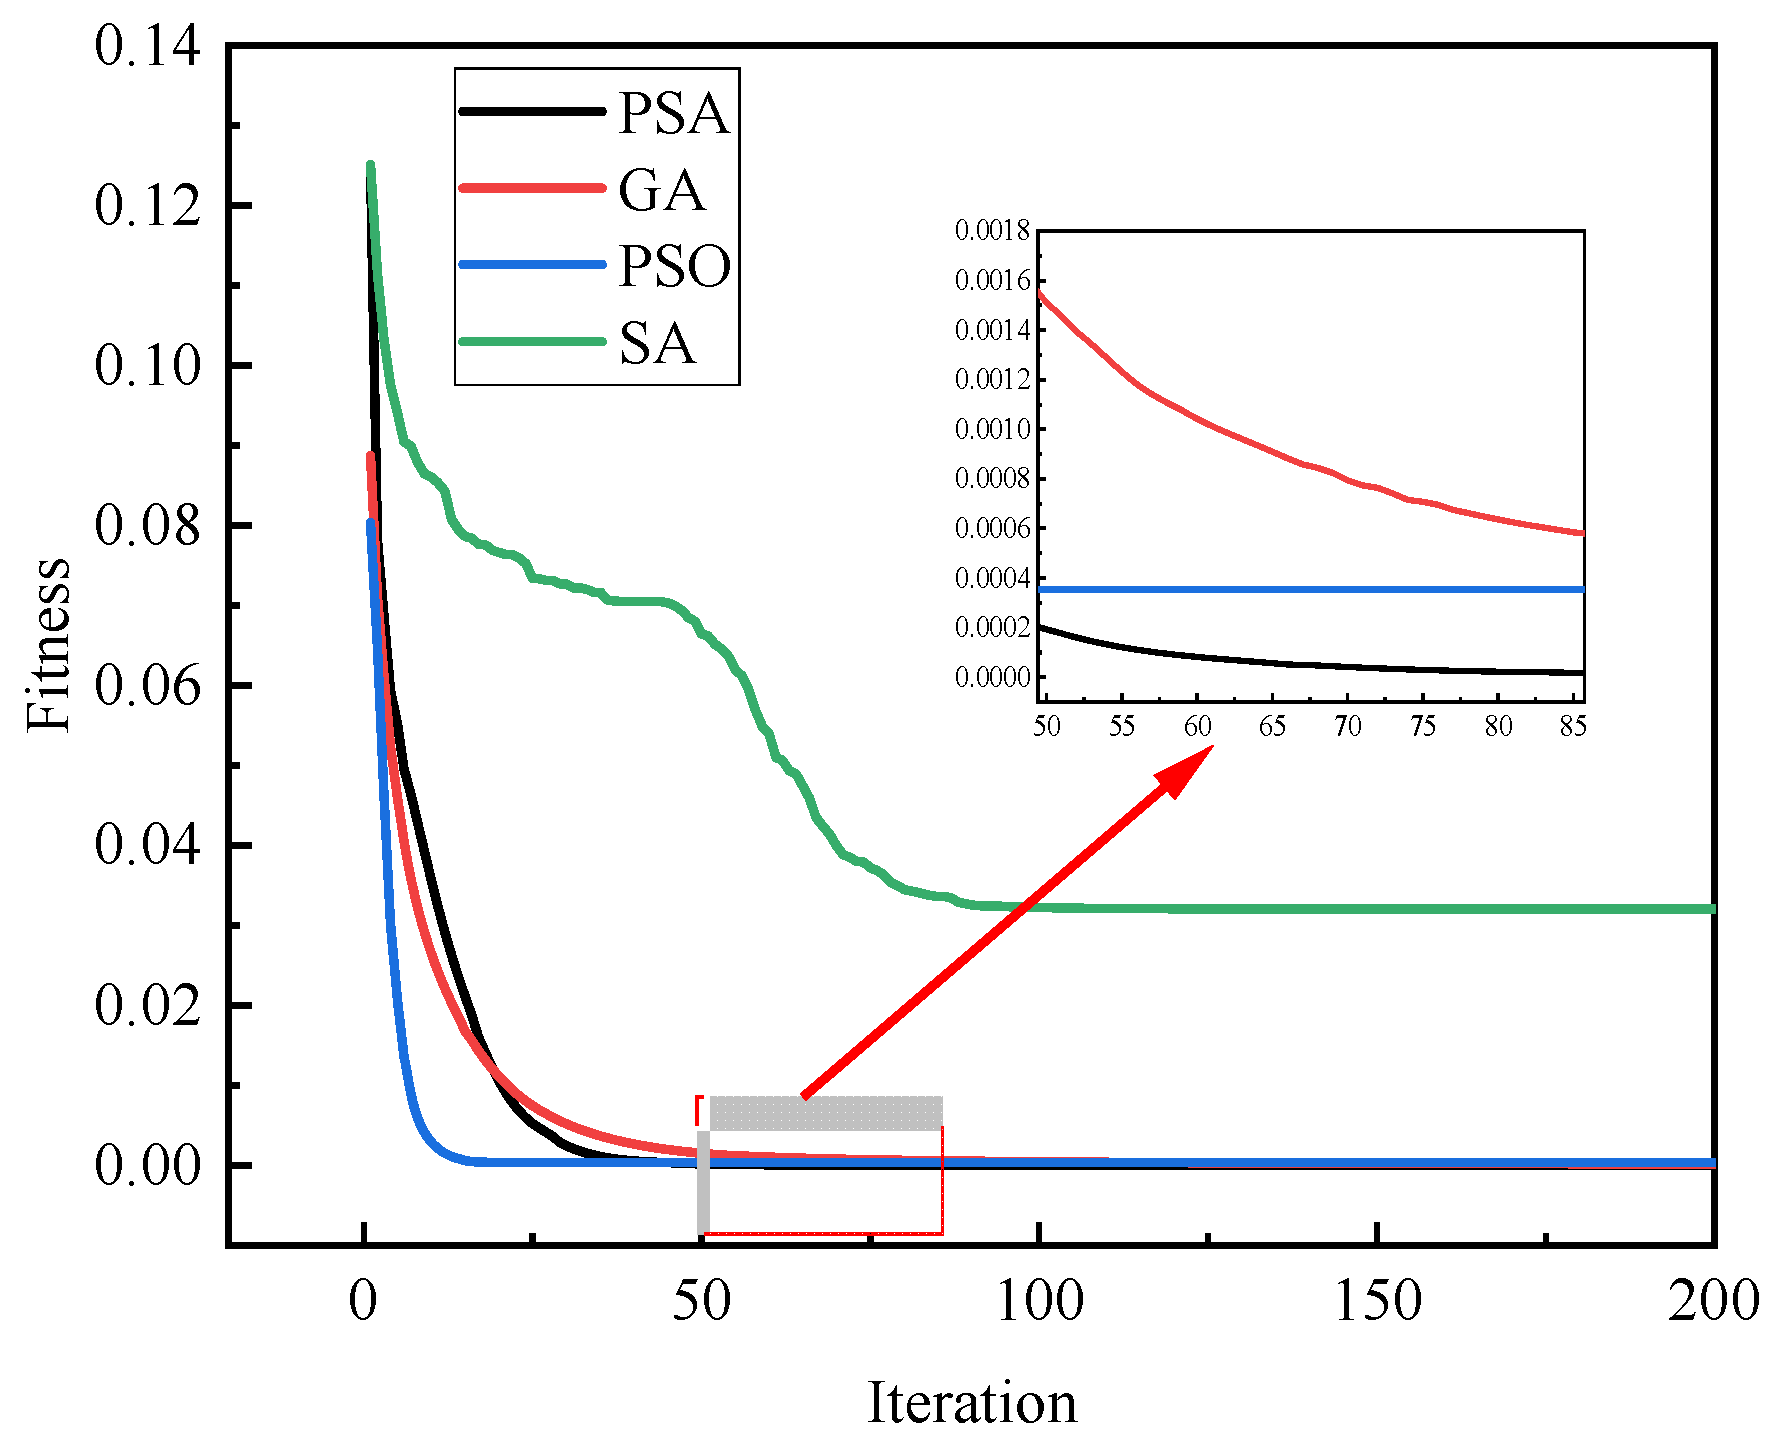
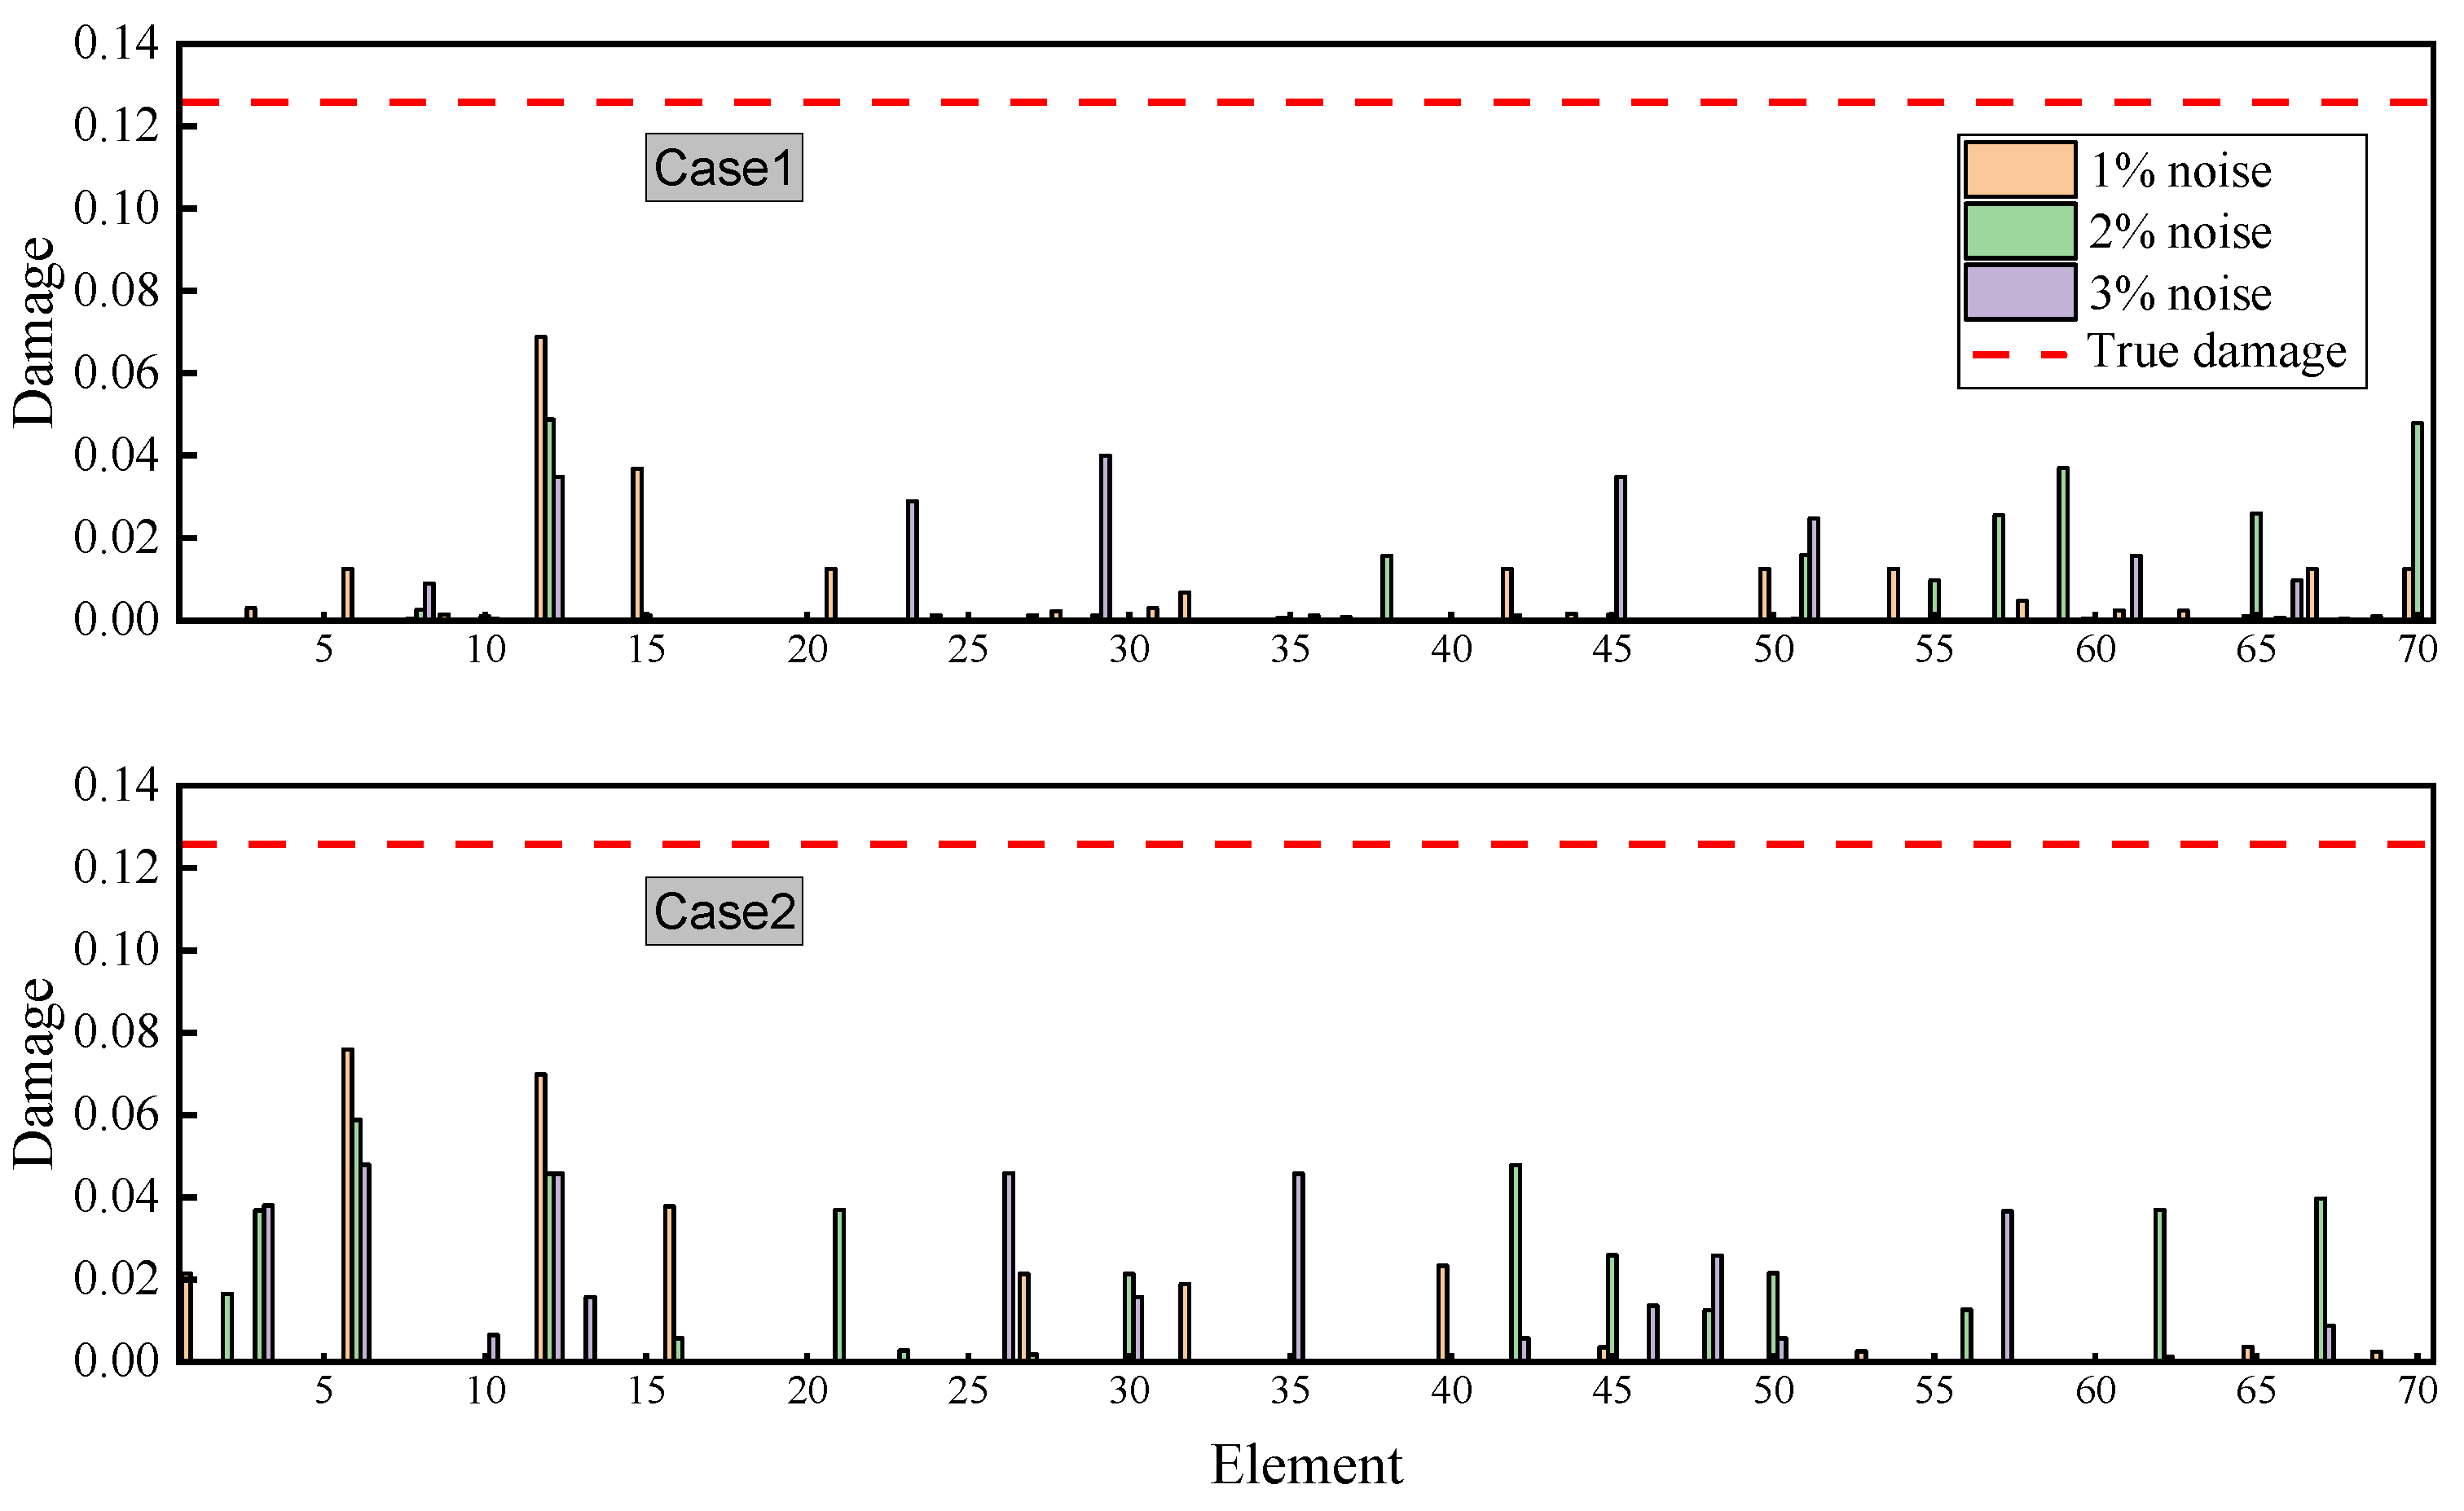
SDI requires prior FE model updating to address discrepancies between the idealized FE model and the actual structure. These discrepancies primarily derive from material property variations and boundary condition uncertainties. For the FE model updating procedure, the Young’s moduli of all 70 structural elements and six constraint stiffness parameters serve as design variables. The optimization objective focuses on matching the first seven computed natural frequencies and corresponding mode shapes with experimental data, as defined in Equation (5). The PSA is consistently employed as the optimization method throughout this process.
Table 6 presents the updated natural frequencies showing significantly better agreement with experimental results. The frequency errors decrease from an initial range of 1–4% to below 1% after model updating. This improved FE model provides a dependable baseline for subsequent SDI studies, thereby supporting the validation of the PSA-based methodology.

4.3. SDI Results

Two damage scenarios were predefined: Case 1 with 12.5% damage in Element 12, and Case 2 with 12.5% damage in both Elements 6 and 12. In practical SDI, measured dynamic parameters are inevitably affected by noise. Based on the updated model, three noise levels are applied, where the regularization coefficient λ in Equation (5) is set to 0 and 0.005, respectively, to examine the effect of the regularization term on identification accuracy, and the SDI results are shown in Figure 11 and Figure 12.
In Figure 11, when the λ is set to zero, the analysis reveals that noise-contaminated conditions lead to widespread false damage identifications across multiple structural elements in both test cases. These erroneous identification outcomes fail to meet acceptable engineering accuracy standards. In Figure 12, when the λ = 0.005, for Case 1, under 1% noise level, almost no false detection occurs, with the damage correctly identified at Element 12 and quantified as 10.75%. Under 2% and 3% noise levels, some false detections appear in other elements, while the identified damage extents in Element 12 are 7.34% and 8.3%, respectively. Case 2 demonstrates similar trends under increasing noise conditions. With 1% noise, only Element 40 shows negligible false detection, while the algorithm correctly identifies damage in Elements 6 (10.59%) and 12 (9.93%). At noise levels of 2% and 3%, additional false detections appear, but the actual damaged elements remain detectable with reduced accuracy: Elements 6 and 12 show 9.78% and 7.9% (2% noise), and 6.88% and 7.88% (3% noise) damage identification, respectively. The λ||α||1 regularization term in Equation (5) proves particularly effective in maintaining damage identification robustness. While higher noise levels tend to increase false identification occurrences in undamaged elements, the algorithm consistently identifies the true damaged Elements 6 and 12. This performance stems from the term’s ability to leverage the inherent sparsity of structural damage patterns, effectively suppressing noise-induced misjudgment while preserving true damage signatures.
This section involves a complex 70-element frame structure, representing a significant computational challenge compared to simpler structures like 10-element beams or 21-element trusses. The 70-dimensional parameter space creates significant computational challenges due to its exponentially expanding search domain, while simultaneously magnifying the effects of measurement noise. Despite these challenges, the PSA demonstrates reliable SDI performance, suggesting strong potential for real-world structural health monitoring applications.

5. Conclusions

An innovative optimization algorithm called PSA, grounded in PID control theory, was developed for structural damage identification. Additionally, an objective function was defined based on RFCR, MAC, and a regularization term. Validation was performed using three distinct structures: (i) a numerical 10-element simply supported beam, (ii) a numerical 21-element truss, and (iii) an experimental seven-story steel frame, to comprehensively assess the algorithm’s accuracy, computational efficiency, and noise robustness. For benchmark comparison, representative algorithms from different categories, GA, PSO, SA were implemented under identical conditions. The core results obtained from this study are summarized as follows:
(1) In noise-free cases for both the simply supported beam and truss structures, PSA successfully identified single and multiple damage locations with severity estimation errors below 1%, outperforming GA, PSO, and SA in detection accuracy. In terms of computational efficiency, PSA requires less time than both GA and PSO, with the time-saving advantage becoming more pronounced as the number of elements increases. Although SA executes extremely fast due to its absence of population-based operations, it completely fails in damage identification.
(2) The noise resistance performance of PSA was tested on a truss bridge case study. The PSA method demonstrates precise damage localization capability under both 1% and 2% noise levels in single-damage, double-damage, and triple-damage scenarios. In all these cases, the absolute discrepancy between predicted and actual damage values in the affected elements remains within 5%. When the noise level increased to 3%, false damage identifications appeared in several undamaged elements.
(3) When applied to FE model updating of the seven-story frame with 70 updating parameters, PSA achieved natural frequency errors below 1%. When λ = 0, false positives were detected in multiple undamaged structural elements. When λ = 0.005, across various noise conditions (1–3%), the algorithm consistently located true damage positions, with severity estimates ranging from 10.59% to 6.88% compared to the actual 12.5% damage. The regularization term proves particularly effective in enhancing low-noise identification performance.
Stiffness reduction combined with optimization algorithms offers advantages for SDI but faces challenges including computational inefficiency, noise sensitivity, and local optima convergence. While the proposed PSA performs well on structures comprising up to 70 elements, its scalability to larger structures needs verification. Future work should explore the following: hybrid algorithms for efficiency-accuracy balance, Bayesian methods for noise robustness, machine learning for feature extraction and surrogate model construction, and reducing reliance on preset parameters to enhance computational speed.

Author Contributions

Conceptualization, K.S. and T.S.; methodology, K.S. and T.S.; investigation, K.S. and T.S.; writing—original draft preparation, K.S.; funding acquisition, T.S. All authors have read and agreed to the published version of the manuscript.

Funding

This study was supported by Jiangsu Province Industry University Research Cooperation Project (BY20230330, BY20230087), Jiangsu Provincial Qinglan Project for Young and Middle-aged Academic Leaders, Major Project of the Research Fund of Nanjing Vocational Institute of Transport Technology (JZ2301), Research Startup Project for High-Level Talents at Nanjing Vocational Institute of Transport Technology (JG2505).

Data Availability Statement

The raw data supporting the conclusions of this article will be made available by the authors on request.

Conflicts of Interest

The authors declare no conflicts of interest.

References

  1. Cantero, D.; Sarwar, Z.; Malekjafarian, A.; Corbally, R.; Alamdari, M.M.; Cheema, P.; Aggarwal, J.; Noh, H.Y.; Liu, J.X. Numerical benchmark for road bridge damage detection from passing vehicles responses applied to four data-driven methods. Arch. Civ. Mech. Eng. 2024, 24, 190. [Google Scholar] [CrossRef]
  2. Wang, Q.A.; Dai, Y.; Ma, Z.G.; Ni, Y.Q.; Tang, J.Q.; Xu, X.Q.; Wu, Z.Y. Towards probabilistic data-driven damage detection in SHM using sparse Bayesian learning scheme. Struct. Control. Health Monit. 2022, 29, e3070. [Google Scholar] [CrossRef]
  3. Tavares, A.; Di Lorenzo, E.; Cornelis, B.; Peeters, B.; Desmet, W.; Gryllias, K. Machine Learning approaches to damage detection in composite structures combining experimental and simulation domains. Mech. Syst. Signal Process. 2024, 215, 111412. [Google Scholar] [CrossRef]
  4. Lazaridis, P.C.; Kavvadias, I.E.; Demertzis, K.; Iliadis, L.; Vasiliadis, L.K. Structural damage prediction of a reinforced concrete frame under single and multiple seismic events using machine learning algorithms. Appl. Sci. 2022, 12, 3845. [Google Scholar] [CrossRef]
  5. Chen, Z.P.; Di, Z.; Zhou, C.; Wenxue, W.X. Structural damage detection based on modal feature extraction and multi-objective optimization method for steel structures. Front. Mater. 2022, 9, 1015322. [Google Scholar] [CrossRef]
  6. Chen, Z.P.; Liu, Q.T.; Pan, C.D. Structural damage detection based on modal strain energy assurance criterion using adaptive region shrinkage assisted IGOA. Structures 2023, 58, 105458. [Google Scholar] [CrossRef]
  7. Corbally, R.; Malekjafarian, A. Bridge damage detection using operating deflection shape ratios obtained from a passing vehicle. J. Sound Vib. 2022, 537, 117225. [Google Scholar] [CrossRef]
  8. Mostafaei, H. Modal Identification Techniques for Concrete Dams: A Comprehensive Review and Application. Science 2024, 6, 40. [Google Scholar] [CrossRef]
  9. Gulgec, N.S.; Takáč, M.; Pakzad, S.N. Convolutional neural network approach for robust structural damage detection and localization. J. Comput. Civ. Eng. 2019, 33, 04019005. [Google Scholar] [CrossRef]
  10. Lee, K.; Chung, M.; Kim, S.; Shin, D.H. Damage detection of catenary mooring line based on recurrent neural networks. Ocean. Eng. 2021, 227, 108898. [Google Scholar] [CrossRef]
  11. Nguyen, D.H.; Wahab, M.A. Damage detection in slab structures based on two-dimensional curvature mode shape method and Faster R-CNN. Adv. Eng. Softw. 2023, 176, 103371. [Google Scholar] [CrossRef]
  12. Choe, D.E.; Kim, H.C.; Kim, M.H. Sequence-based modeling of deep learning with LSTM and GRU networks for structural damage detection of floating offshore wind turbine blades. Renew. Energy 2021, 174, 218–235. [Google Scholar] [CrossRef]
  13. Huang, L.W.; Hong, X.B.; Yang, Z.J.; Liu, Y.; Zhang, B. CNN-LSTM network-based damage detection approach for copper pipeline using laser ultrasonic scanning. Ultrasonics 2022, 121, 106685. [Google Scholar] [CrossRef]
  14. Ge, Q.Y.; Li, C.M.; Yang, F.L. Research on the Application of Deep Learning Algorithm in the Damage Detection of Steel Structures. IEEE Access 2025, 13, 76732–76746. [Google Scholar] [CrossRef]
  15. Hassani, S.; Shadan, F. Using incomplete FRF measurements for damage detection of structures with closely-spaced eigenvalues. Measurement 2022, 188, 110388. [Google Scholar] [CrossRef]
  16. Yang, Y.; Lu, H.C.; Tan, X.K.; Wang, R.Q.; Zhang, Y. Mode shape identification and damage detection of bridge by movable sensory system. IEEE Trans. Intell. Transp. Syst. 2022, 24, 1299–1313. [Google Scholar] [CrossRef]
  17. Zhang, F.L.; Kim, C.W.; Goi, Y. Efficient Bayesian FFT method for damage detection using ambient vibration data with consideration of uncertainty. Struct. Control. Health Monit. 2021, 28, e2659. [Google Scholar] [CrossRef]
  18. Duarte, H.V.; Donadon, L.V. Frequency-based damage detection method for excitation signals above work frequencies: Theoretical aspects and experimental results. J. Braz. Soc. Mech. Sci. Eng. 2021, 43, 1–11. [Google Scholar] [CrossRef]
  19. Xu, Y.F.; Huang, G.L. Modal sensitivity analysis of acoustic metamaterials for structural damage detection. Int. J. Mech. Sci. 2023, 259, 108571. [Google Scholar] [CrossRef]
  20. Lee, Y.; Kim, H.; Min, S.; Yoon, H. Structural damage detection using deep learning and FE model updating techniques. Sci. Rep. 2023, 13, 18694. [Google Scholar] [CrossRef]
  21. Huang, M.S.; Zhang, J.W.; Li, J.; Deng, Z.H.; Luo, J. Damage identification of steel bridge based on data augmentation and adaptive optimization neural network. Struct. Health Monit. 2025, 24, 1674–1699. [Google Scholar] [CrossRef]
  22. Ding, Z.H.; Hou, R.R.; Xia, Y. Structural damage identification considering uncertainties based on a Jaya algorithm with a local pattern search strategy and L0. 5 sparse regularization. Eng. Struct. 2022, 261, 114312. [Google Scholar] [CrossRef]
  23. Ghannadi, P.; Kourehli, S.S. Model updating and damage detection in multi-story shear frames using Salp Swarm Algorithm. Earthq. Struct. 2019, 17, 63–73. [Google Scholar] [CrossRef]
  24. Firouzi, B.; Abbasi, A.; Sendur, P. Improvement of the computational efficiency of metaheuristic algorithms for the crack detection of cantilever beams using hybrid methods. Eng. Optim. 2022, 54, 1236–1257. [Google Scholar] [CrossRef]
  25. Ereiz, S.; Duvnjak, I.; Jiménez-Alonso, J.F. Review of finite element model updating methods for structural applications. Structures 2022, 41, 684–723. [Google Scholar] [CrossRef]
  26. Alkayem, N.F.; Shen, L.; Al-hababi, T.; Qian, X.D.; Cao, M.S. Inverse analysis of structural damage based on the modal kinetic and strain energies with the novel oppositional unified particle swarm gradient-based optimizer. Appl. Sci. 2022, 12, 11689. [Google Scholar] [CrossRef]
  27. Tiachacht, S.; Khatir, S.; Thanh, C.L.; Rao, R.V.; Mirjalili, S.; Wahab, M.A. Inverse problem for dynamic structural health monitoring based on slime mould algorithm. Eng. Comput. 2022, 38, 2205–2228. [Google Scholar] [CrossRef]
  28. Gara, F.; Nicoletti, V.; Arezzo, D.; Cipriani, L.; Leoni, G. Model updating of cultural heritage buildings through swarm intelligence algorithms. Int. J. Archit. Herit. 2025, 19, 259–275. [Google Scholar] [CrossRef]
  29. Wang, X.G.; Liang, P.; Ma, M.; Zhou, Z.W.; Wu, G.; Song, S. Finite element model updating and response prediction of a frame structure based on optimal sensor placement. Adv. Struct. Eng. 2025, 28, 55–67. [Google Scholar] [CrossRef]
  30. Ramezani, M.; Bahar, O. Structural damage identification for elements and connections using an improved genetic algorithm. Smart Struct. Syst. 2021, 28, 643–660. [Google Scholar] [CrossRef]
  31. Wang, N.G.; Jiang, Y.Y.; Zhong, Y.T.; Shao, L. An adaptive damage detection method based on differential evolutionary algorithm for beam structures. Measurement 2021, 178, 109227. [Google Scholar] [CrossRef]
  32. Chen, Z.; Yu, L. A new structural damage detection strategy of hybrid PSO with Monte Carlo simulations and experimental verifications. Measurement 2018, 122, 658–669. [Google Scholar] [CrossRef]
  33. Majumdar, A.; Nanda, B. A comparative study on inverse vibration based damage assessment techniques in beam structure using ant colony optimization and particle swarm optimization. Adv. Sci. Eng. Med. 2020, 12, 918–923. [Google Scholar] [CrossRef]
  34. Chen, Z.; Wang, Y.; Zhang, K.; Chan, T.H.; Wang, Z.Z. Damage detection and location using a simulated annealing-artificial hummingbird algorithm with an improved objective function. Struct. Health Monit. 2025, 24, 129–147. [Google Scholar] [CrossRef]
  35. Fallahian, S.; Seyedpoor, S.M.; Norouzi, E.; Ghasemi, S. Structural Damage Identification Using a Multi-stage Gravitational Search Algorithm. J. Civ. Eng. Res. 2024, 6, 33–48. [Google Scholar] [CrossRef]
  36. Borase, R.P.; Maghade, D.K.; Sondkar, S.Y.; Pawar, S.N. A review of PID control, tuning methods and applications. Int. J. Dyn. Control. 2021, 9, 818–827. [Google Scholar] [CrossRef]
  37. Feng, H.; Ma, W.; Yin, C.B.; Cao, D.H. Trajectory control of electro-hydraulic position servo system using improved PSO-PID controller. Autom. Constr. 2021, 127, 103722. [Google Scholar] [CrossRef]
  38. Jian, M.L.; Zhu, S.; Du, W.Y.; Yang, L.Q.; Zhang, J.H. Design of a temperature control system for transient thermal measurement utilizing the backpropagation PID algorithm. Int. J. Therm. Sci. 2025, 210, 109654. [Google Scholar] [CrossRef]
  39. Zhang, J.Q.; Yang, X.; Wang, W.; Brilakis, I.; Davletshina, D.; Wang, H.N. Robust ELM-PID tracing control on autonomous mobile robot via transformer-based pavement crack segmentation. Measurement 2025, 242, 116045. [Google Scholar] [CrossRef]
  40. Gao, Y.S. PID-based search algorithm: A novel metaheuristic algorithm based on PID algorithm. Expert Syst. Appl. 2023, 232, 120886. [Google Scholar] [CrossRef]
  41. Wang, X.; Palka, R.; Wardach, M. Nonlinear digital simulation models of switched reluctance motor drive. Energies 2020, 13, 6715. [Google Scholar] [CrossRef]
  42. Nguyen, H.D.; Huang, S.C. Using the extended finite element method to integrate the level-set method to simulate the stress con-centration factor at the circular holes near the material boundary of a functionally-graded material plate. J. Mater. Res. Technol. 2022, 21, 4658–4673. [Google Scholar] [CrossRef]
  43. Li, J.; Law, S.S.; Ding, Y. Substructure damage identification based on response reconstruction in frequency domain and model updating. Eng. Struct. 2012, 41, 270–284. [Google Scholar] [CrossRef]
Figure 1. Regulation process of PID control.
Buildings 15 02216 g001
Figure 2. The performance of PSA and PSA without Levy on test functions.
Buildings 15 02216 g002
Figure 3. SDI workflow.
Buildings 15 02216 g003
Figure 4. Simply supported beam FE model.
Buildings 15 02216 g004
Figure 5. Iteration curves of different algorithms for Case 1.
Buildings 15 02216 g005
Figure 6. SDI results of simply supported beam.
Buildings 15 02216 g006
Figure 7. 21-member truss FE mode.
Buildings 15 02216 g007
Figure 8. Damage identification results of 21-member truss.
Buildings 15 02216 g008
Figure 9. Damage identification results of PSA for the 21-member truss bridge under varying noise levels.
Buildings 15 02216 g009
Figure 10. Seven-story steel frame FE model.
Buildings 15 02216 g010
Figure 11. SDI results of seven-story steel frame with 1%, 2% and 3% noise (λ = 0).
Buildings 15 02216 g011
Figure 12. SDI results of 7-story steel frame with 1%, 2%, and 3% noise (λ = 0.005).
Buildings 15 02216 g012
Table 1. Parameter settings for GA, PSO, SA, and PSA.
AlgorithmParameters
GAcrossover_rate = 0.8, mutation_rate = 0.1, tournament_size = 5, Pop = 30
PSOw = 0.729, c1 = 1.5, c2 = 1.5, Pop = 30
SAinitial_temp = 200, cooling_rate = 0.95
PSAKp = 1, Ki = 0.5, Kd = 1.2, Pop = 30
Table 2. Damage scenarios for simply supported beam.
Damage ScenariosDamage Location and Severity
Case 1Element 5, 10%
Case 2Element 3, 20%
Case 3Element 9, 30%
Case 4Element 4, 15%&Element 7 15%
Case 5Element 2, 10%&Element 6, 30%
Case 6Element 1, 10%&Element 5, 20%&Element 7, 30%
Table 3. Running time of the four algorithms for simply supported beam.
CaseTime/s
PSAGAPSOSA
Case 10.4941.8430.5340.018
Case 20.5001.8370.5270.019
Case 30.5091.8750.5680.019
Case 40.5291.9160.5450.018
Case 50.5291.8250.5320.019
Case 60.5261.8280.5330.019
Table 4. Damage scenarios for 21-bar truss.
Damage ScenariosDamage Location and Severity
Case 1Element 2, 10%
Case 2Element 12, 20%
Case 3Element 5, 20%&Element 18 20%
Case 4Element 1, 10% &Element 8, 20% &Element 19, 30%
Table 5. Running time of the four algorithms for 21-member truss.
CaseTime/s
PSAGAPSOSA
Case12.3285.8133.5330.063
Case22.1325.6433.4990.062
Case32.5475.6353.8730.065
Case42.9106.4183.9330.062
Table 6. Natural frequencies and errors before and after updating.
ModeMeasuredInitial FE ModelUpdated FE Model
CaculatedError
(%)
CaculatedError
(%)
12.542.491.972.540.00
27.667.521.837.630.39
312.8612.512.7212.850.08
418.0317.642.1617.990.22
522.9622.372.5722.910.22
626.9925.923.9626.940.19
729.9128.823.6429.870.13
Disclaimer/Publisher’s Note: The statements, opinions and data contained in all publications are solely those of the individual author(s) and contributor(s) and not of MDPI and/or the editor(s). MDPI and/or the editor(s) disclaim responsibility for any injury to people or property resulting from any ideas, methods, instructions or products referred to in the content.

