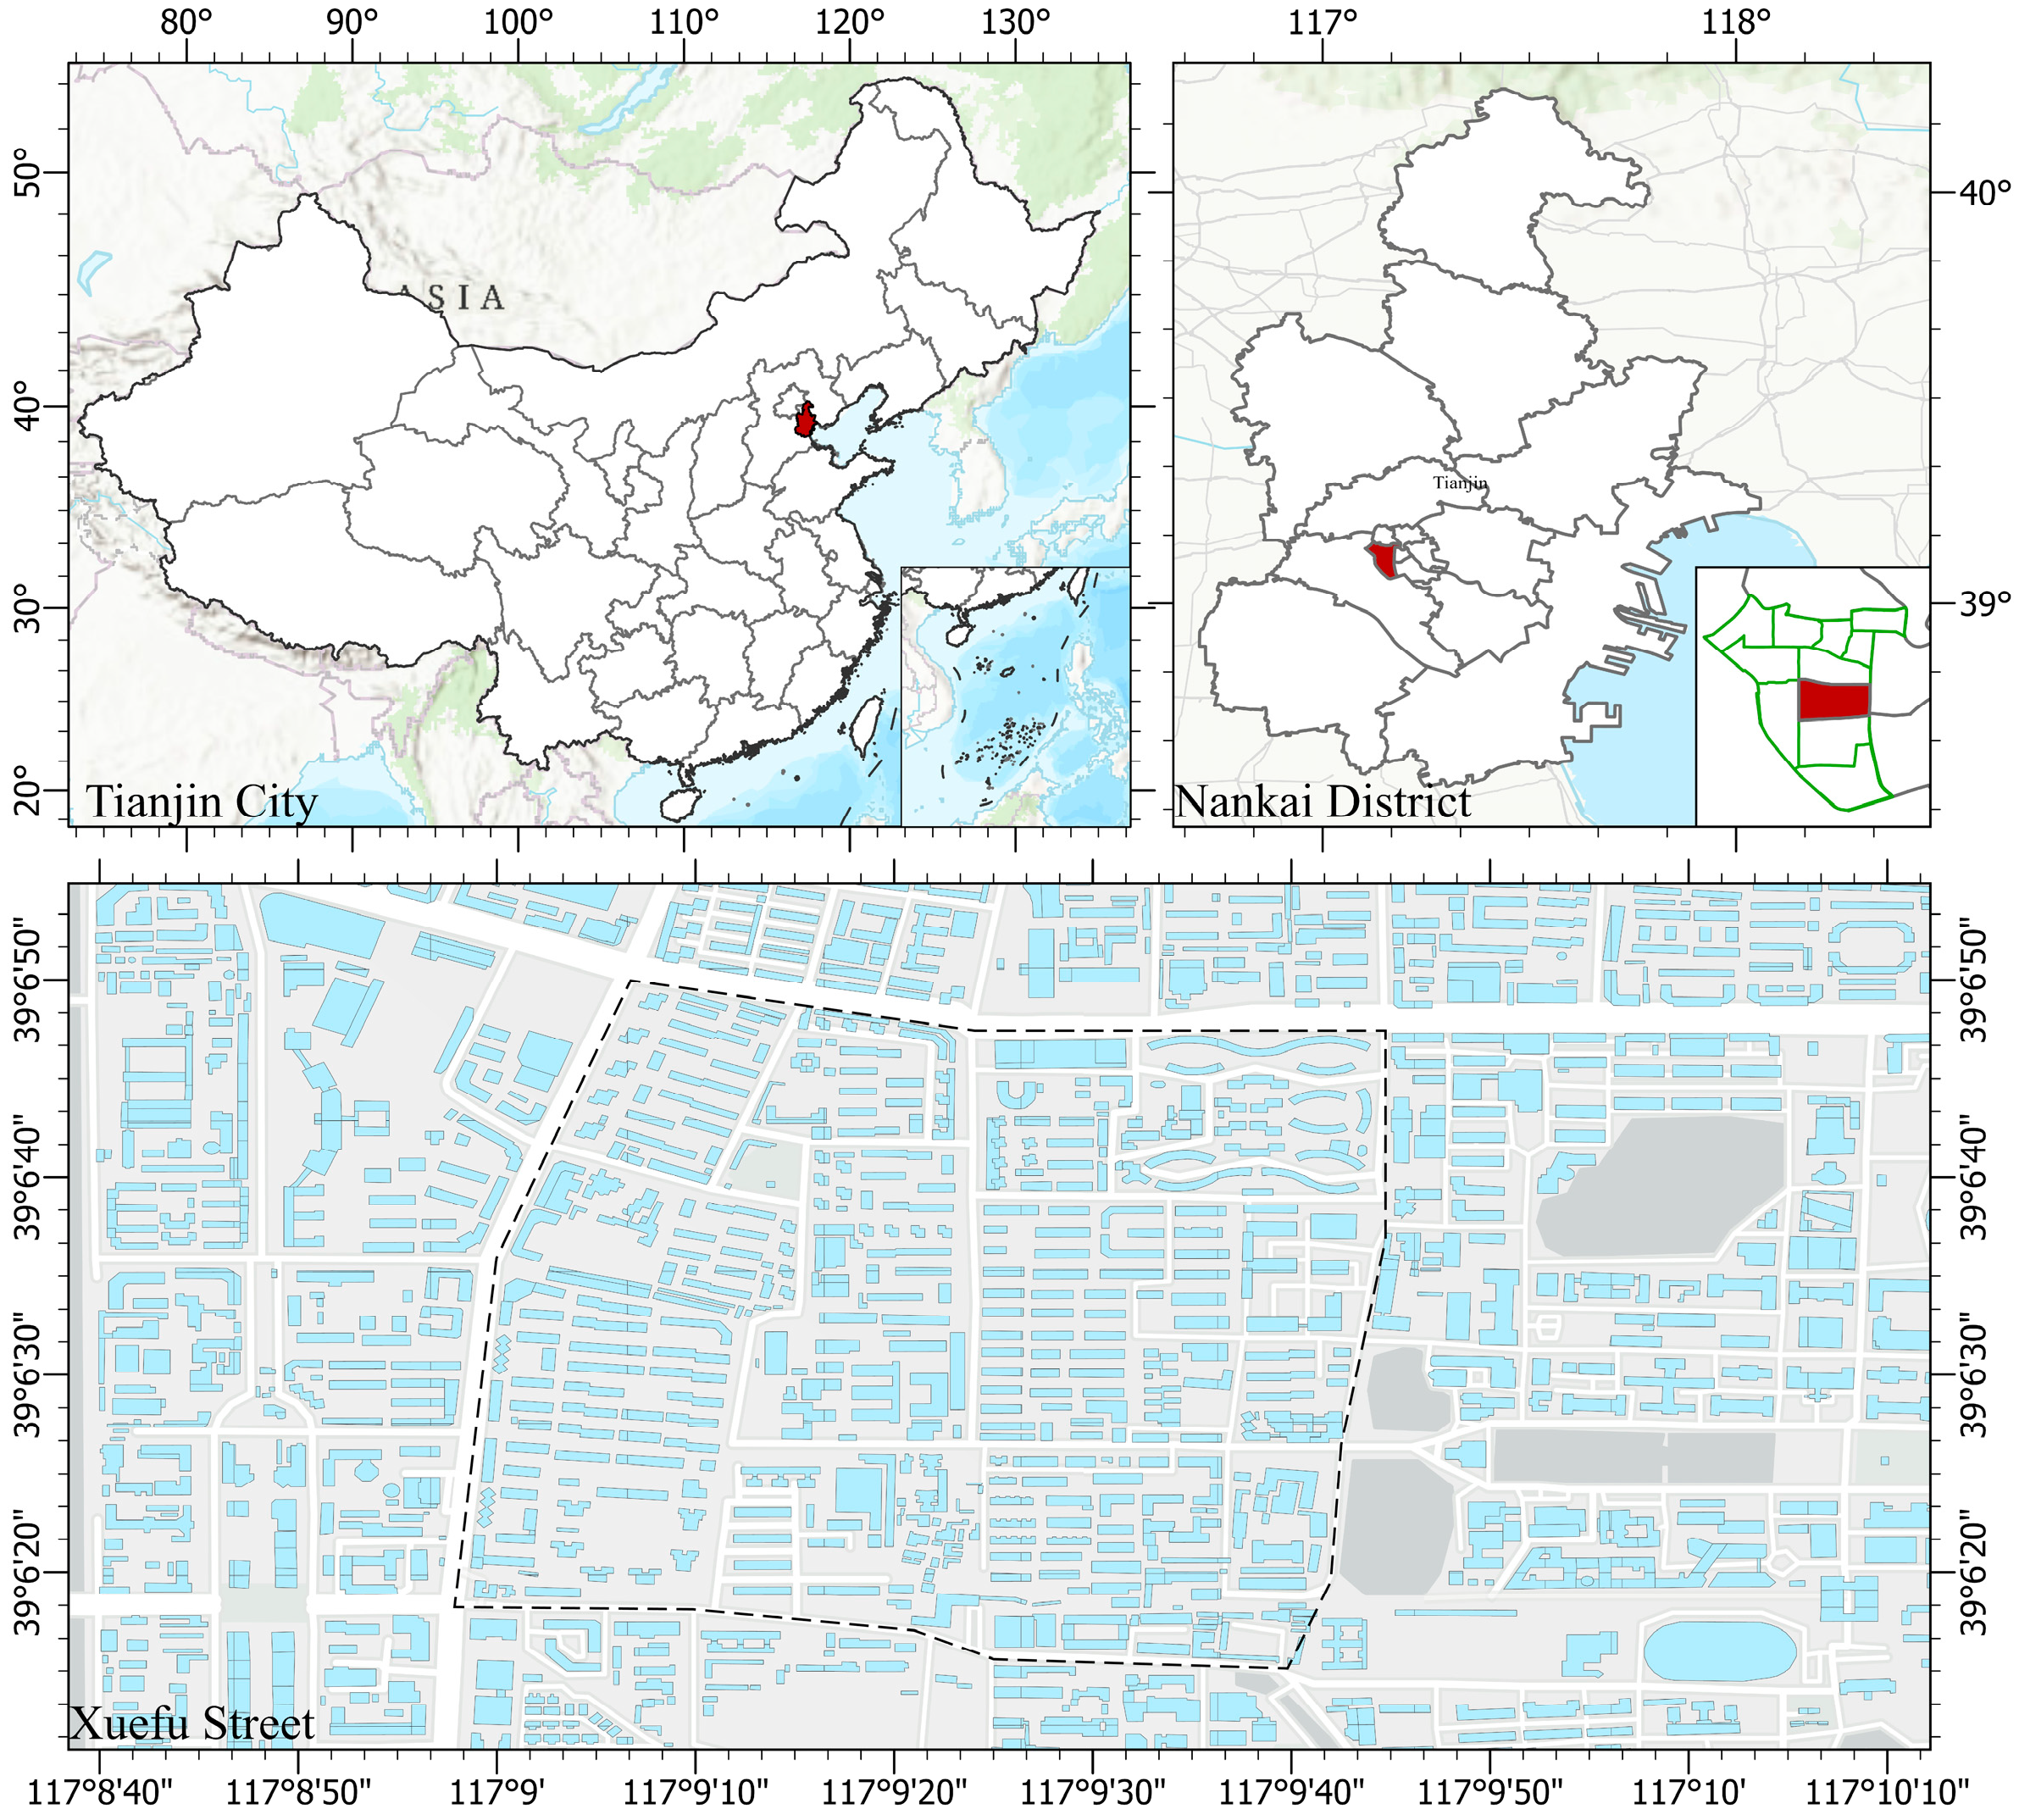
3.3. Assessment Model for Resource Production Potential
This study developed mathematical models to assess the resource potential of the food, energy, and water subsystems, with the land area allocated to each type of resource production serving as the independent variable.
The energy subsystem incorporates two widely adopted and mature technologies: PV power generation and biogas-based electricity generation. To ensure computational feasibility, the model calculates annual energy output as the total of each technology’s unit-area energy yield multiplied by its corresponding allocated area:
In this equation, E represents the total annual energy output (kWh/year). yᵢ denotes the area or volume allocated to the ith type of energy production, such as flat roof PV area (y1), greenhouse surface area (y2), and sloped roof PV area (y3). The energy yield parameters (bi) were carefully selected to represent realistic performance under Tianjin’s specific conditions: 178.39 kWh/m2 for PV systems and 5.8 kWh/m3 for biogas systems.
The PV energy yield was determined through PVSyst 7.4 software simulation using monocrystalline silicon panels—currently the predominant commercial technology—with Tianjin’s solar radiation data from the China Meteorological Administration. This approach provides more realistic estimates than laboratory efficiency ratings or theoretical calculations and ensures the validity of the data. Biogas yields were estimated based on calorific value and power station conversion efficiency, referencing the Comprehensive Methods for Biogas Production Calculation and Calorific Value Conversion [
23] and the Renewable Energy Statistical Yearbook [
24]. According to the calorific value of biogas, 1 m
3 of biogas is equivalent to 0.714 kg of standard coal and 5.8 kWh of electricity production.
The annual vegetable production potential was calculated as the sum of the products of unit-area yields and the corresponding areas for each food production type:
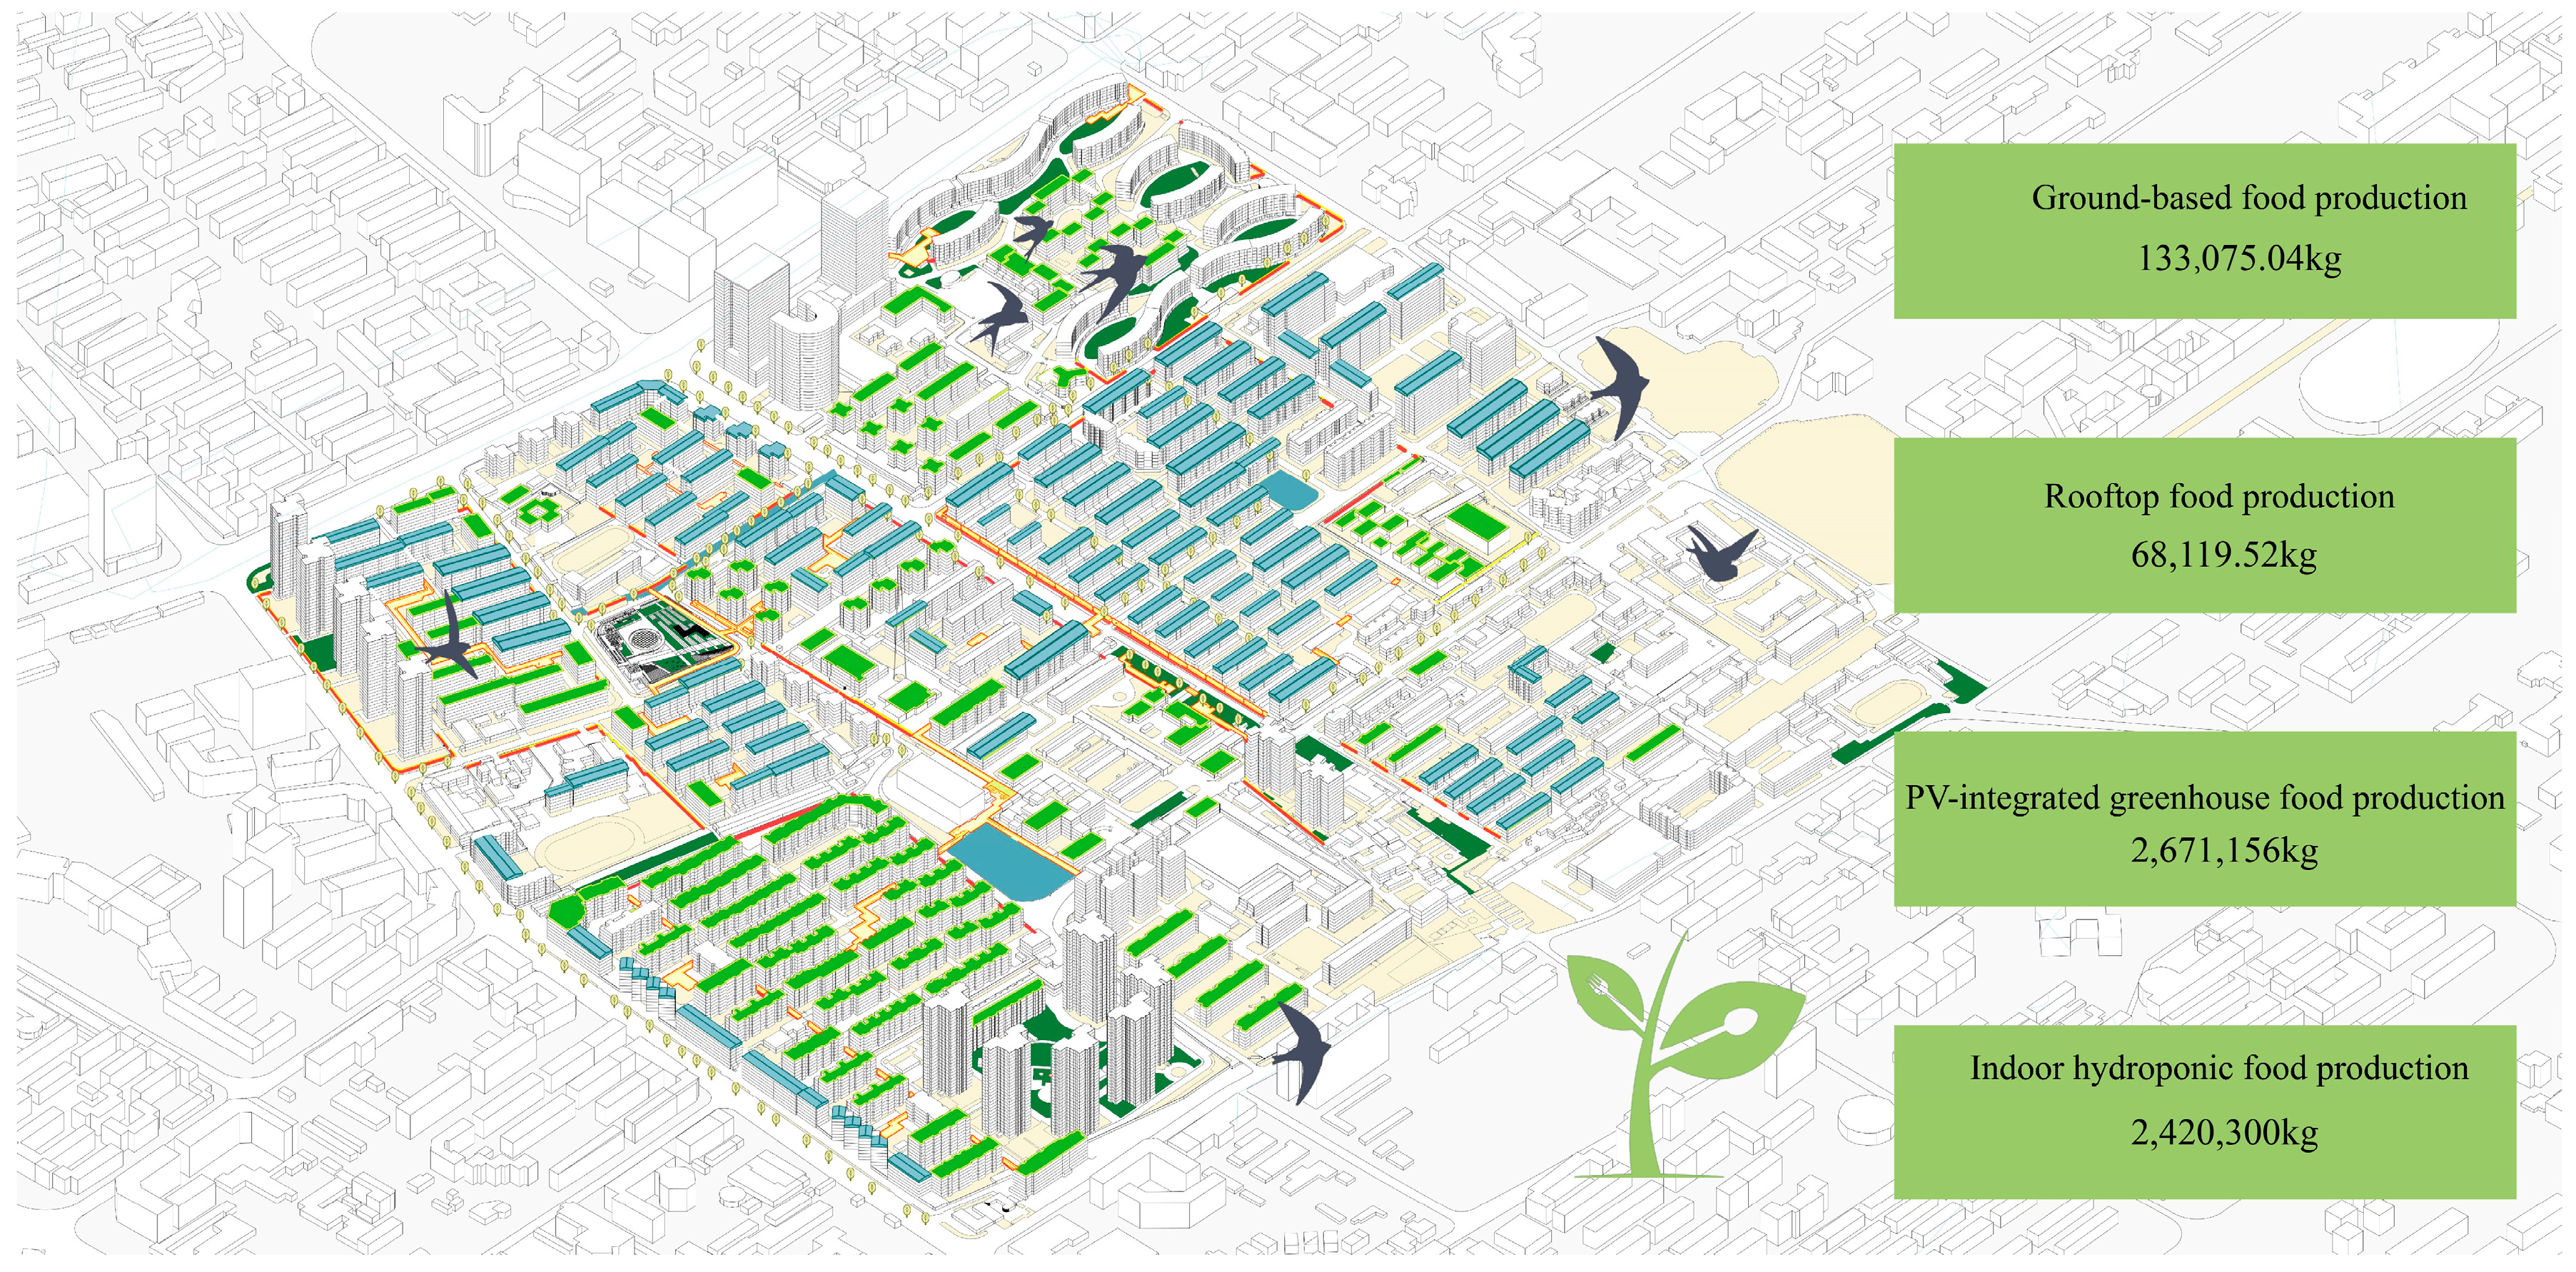
In this equation, F denotes the total annual food output (kg/year). aⱼ represents the average annual yield per unit area (kg/m2) of the jth food production type. xⱼ refers to the cultivable area (m2) available for the jth method, which includes ground cultivation (x1), rooftop cultivation (x2), PV greenhouse cultivation (x3), and indoor hydroponic systems (x4).
The food yield parameters (a
j) were established based on experimental data from the Facility Agriculture Experimental [
25] Base of Beijing Academy of Agriculture and Forestry Sciences, rather than idealized agricultural models. The yield of lettuce grown on land is approximately 14 plants per square meter, with two harvests per year, resulting in an annual yield of about 28 plants per square meter. Taking hydroponic cultivation in three layers as an example, the annual yield is approximately 480 plants per square meter. For large plants, the weight per plant ranges from 200 to 300 g, while for small plants, it ranges from 100 to 200 g. Therefore, unit yields were set at 5.6 kg/m
2 for ground and rooftop cultivation and 40 kg/m
2 for controlled-environment agriculture, such as PV greenhouses and hydroponics.
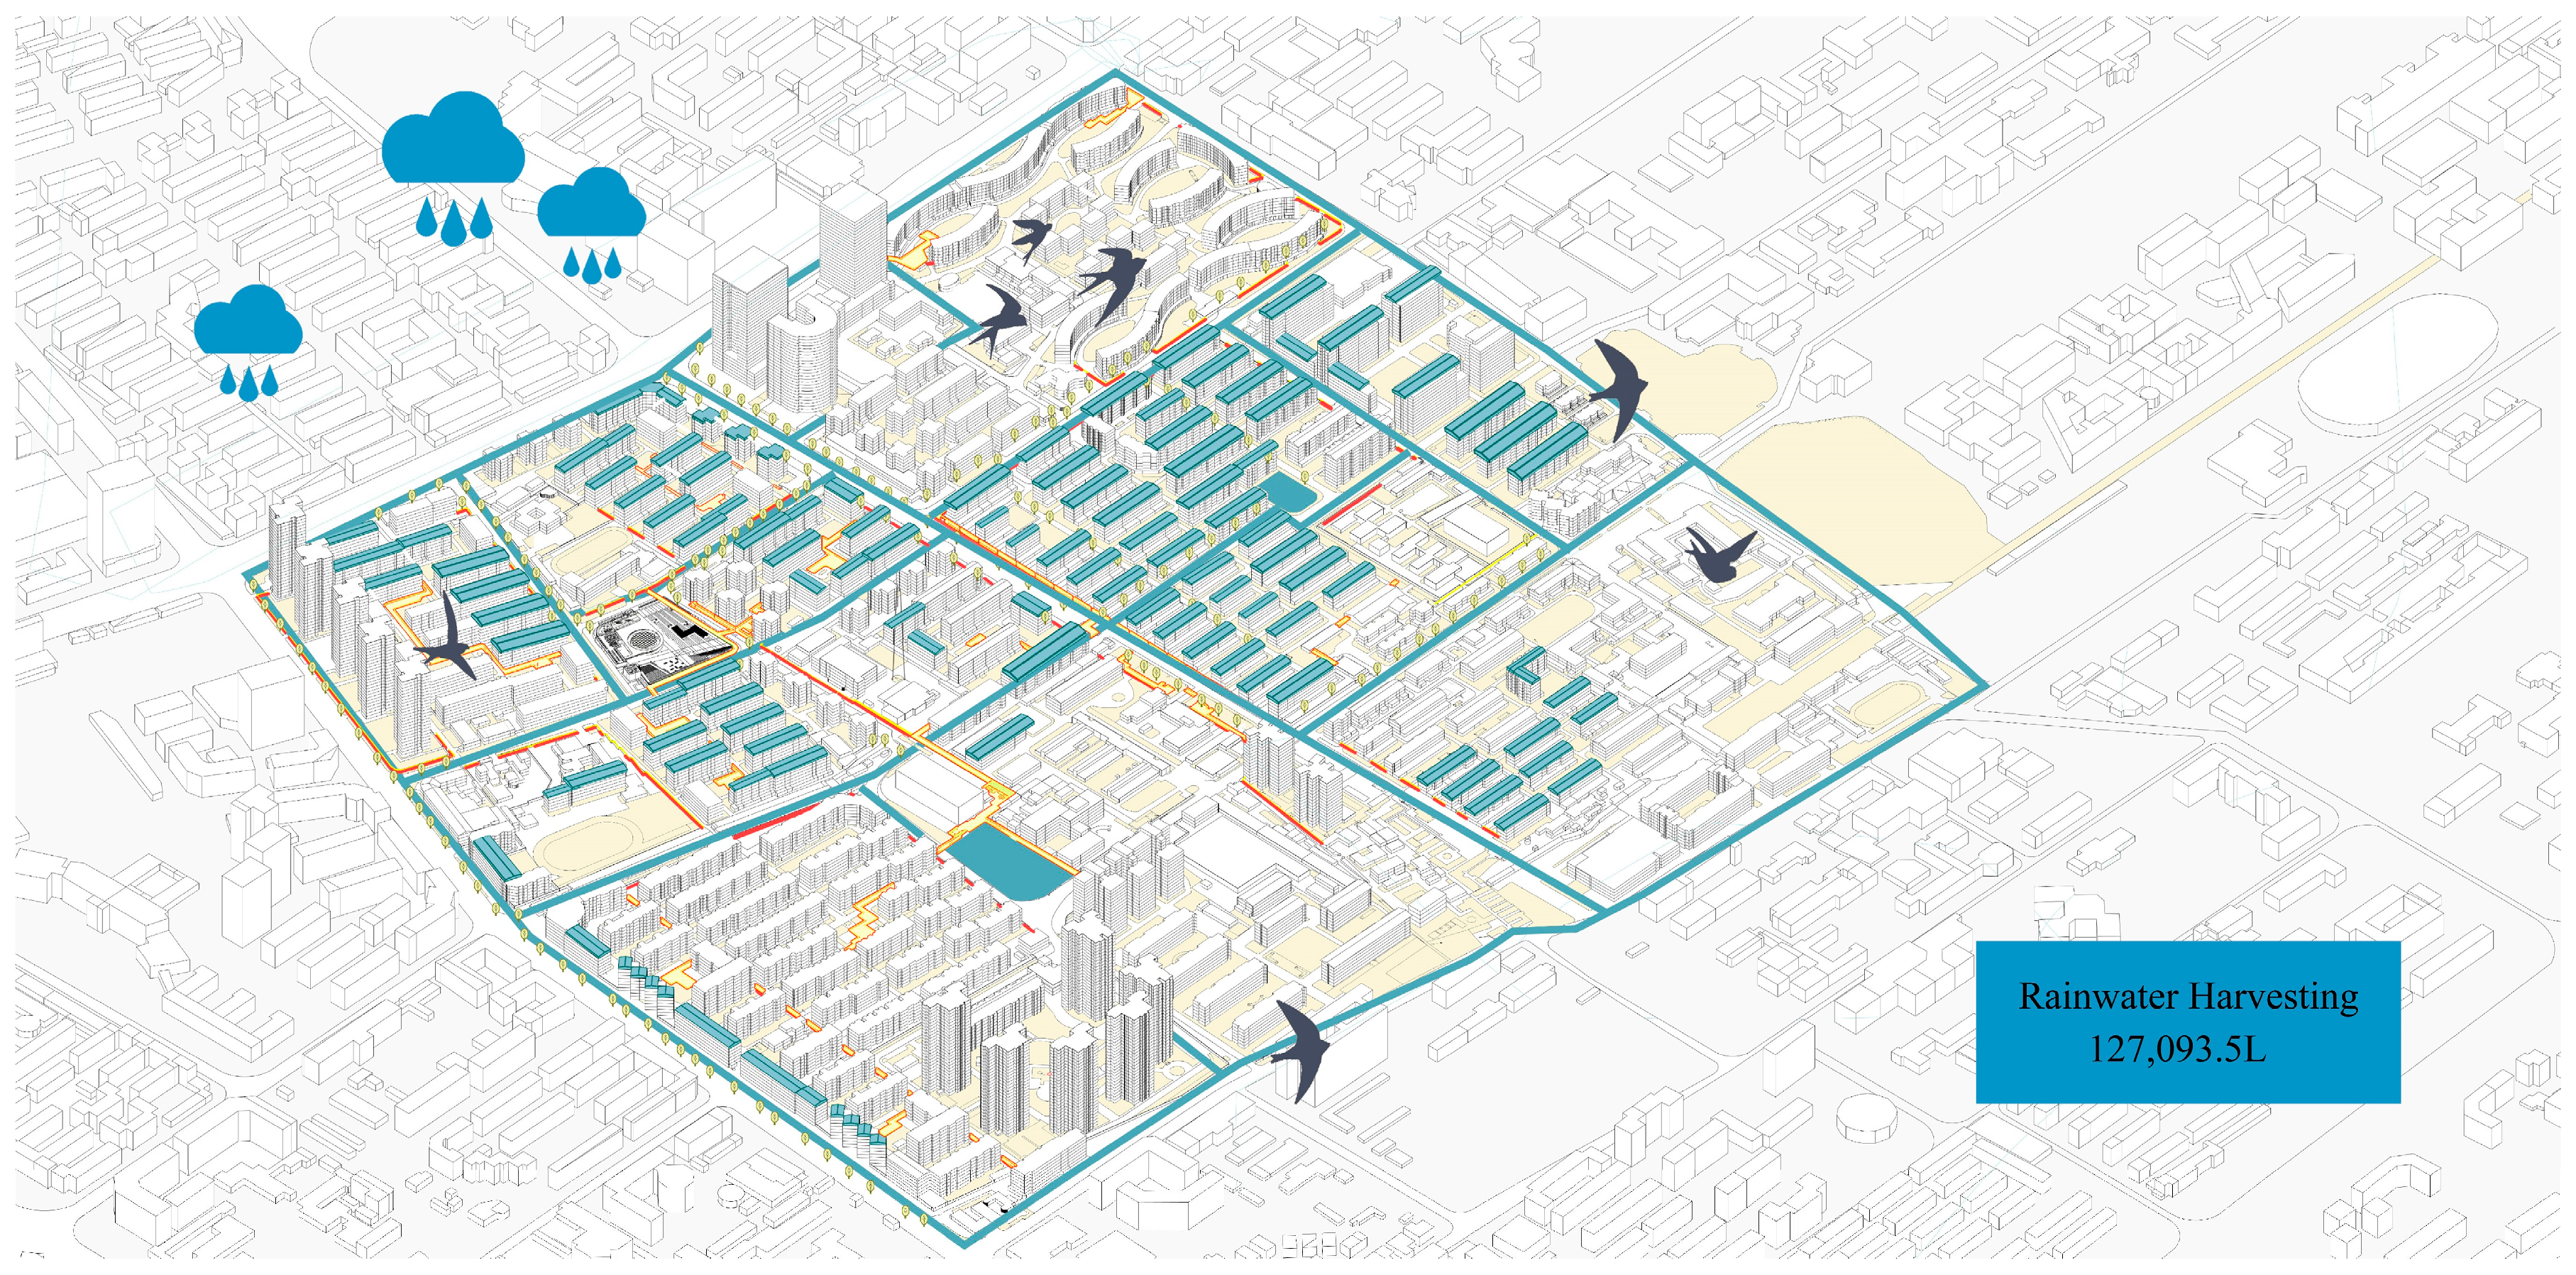
For the water subsystem, this analysis focused on the collection and utilization of rainwater:
In this equation, W represents the total annual volume of rainwater collected (m
3). zₖ is the area (m
2) of the
kth rainwater-harvestable surface type, such as flat roof collection areas (z
1) and newly added hardscape surfaces (
z2). cₖ represents the surface runoff coefficient, set at 0.9 for flat roofs and 0.6 for hardscapes, based on the Tianjin local standard DB/T 29-236-2016: Technical Specifications for Urban Rainwater Utilization [
26]. R is the annual precipitation (m), with a long-term average of 0.6186 m (618.6 mm) for Tianjin’s central urban area, as reported in the Tianjin Statistical Yearbook 2023 [
27]. All outputs were standardized to cubic meters.
A critical interaction within the FEW-Nexus lies in the water demand associated with food production. For newly developed cultivation spaces, the total irrigation demand was calculated as follows:
In this equation, G represents the total annual irrigation water demand for the food subsystem (L/year). sₚ is the irrigated area (m
2) for the
pth cultivation type, including open-field cultivation (s
1), greenhouse drip irrigation (s
2), and hydroponic drip irrigation (s
3). dₚ denotes the unit irrigation demand, set at 142.5 L/m
2 for open-field cultivation and 180.0 L/m
2 for both greenhouse and hydroponic systems. These values are based on the standard DB11/T 1764.2-2021: Water Use Quotas for Irrigating Leafy Vegetables [
28] in both open-field and protected environments and are adjusted according to practical water allocation strategies in the Tianjin Plain region. The water parameters were selected from local established engineering standards, ensuring the model reflects realistic efficiency factors rather than ideal-case scenarios.
3.4. Cost Assessment Method
The total economic cost was calculated as the combined expenditure of four subsystems (
Table 2): PV power generation, open-field cultivation, greenhouse and hydroponic cultivation, and rainwater harvesting, as shown in Equation (5). Each subsystem’s cost includes its respective capital investment, O&M expenses, production input costs, and resource consumption, with deductions made for revenue generated, such as income from electricity production.
Since the biogas yield is treated as a fixed parameter, independent of spatial configuration, its associated cost does not vary with decision variables and is, therefore, excluded from the cost component of the objective function. However, it is included in the total energy output calculation.
The cost evaluation of PV systems includes module installation costs and annual O&M expenses, net of revenue generated from electricity production. Key parameters were sourced from the China Photovoltaic Industry Development Roadmap (2022–2023), market quotations, and O&M standards issued by the China Photovoltaic Industry Association. These parameters were further calibrated using 2024 mainstream PV module specifications and local commercial electricity prices to ensure an accurate, contemporary, and context-specific economic evaluation. We computed the comprehensive expenditure for solar power production as the sum of the PV module installation cost (A) and system O&M cost (B), minus the electricity revenue (C):
The cost assessment of open-field cultivation was based on the Compilation of Costs and Returns of Agricultural Products in China 2024, which disaggregates cost components for vegetable production in urban settings, including land preparation, fertilizers, pesticides, labor, and irrigation. To ensure conservative and operationally feasible evaluations, the lowest estimated values were adopted. The total cost of open-field cultivation consists of land preparation and tillage cost (D), fertilizer cost (E), pesticide cost (F), labor cost (G), and irrigation cost (H):
The construction, operation, and resource input costs of greenhouse and indoor hydroponic systems were derived from the empirical study by Zhen et al. (2020) on lifecycle costs of community-supported agriculture (CSA) in peri-urban Beijing [
29]. These values were further adjusted based on current greenhouse configurations and management practices to ensure data representativeness and practical applicability. The total cost of greenhouse cultivation and indoor hydroponics includes construction cost (I), production input cost (J), O&M cost (K), fertilizer cost (L), pesticide cost (M), waste management cost (N), and irrigation cost (O):
For the rainwater harvesting system, the cost was assessed in terms of construction expenses, O&M costs, and water quality treatment fees. These estimates were based on market surveys of leading commercial suppliers and calibrated against municipal water pricing systems in representative Chinese cities. This provides a robust framework for evaluating the cost–benefit potential of rainwater harvesting. The total cost of rainwater utilization comprises construction cost (P), O&M cost (Q), and water treatment cost (R), offset by the economic benefit of conserved water resources (S). The rainwater catchment area was optimized to precisely match the irrigation demand:
3.6. Decision Variables and Constraint Settings
To ensure that optimization results were both practically feasible and implementable, this study established two primary types of constraints: resource system constraints and spatial area constraints. The resource system constraints focus on achieving internal resource circularity and self-sufficiency, while the spatial constraints define realistic bounds based on the physical availability and accessibility of space.
At the resource system level, two key constraints were applied. First, the annual rainwater harvesting volume (W) must meet or exceed the total annual irrigation water demand (G) required for controlled-environment agriculture, i.e., W ≥ G, thereby supporting water recycling and ensuring irrigation stability (
Table 3). Second, the cost objective function is minimized, and the objective functions of food production and energy production are maximized while satisfying the above physical constraints, ensuring sustainable resource system operations alongside economic feasibility and practical applicability.
In terms of spatial constraints, this study defined clear upper limits for the developable areas of various productive facilities based on field investigations and remote sensing classification results, combined with the actual conditions of building layouts, green space types, road systems, and rooftop structures within the study area. The upper limit of the ground-level agricultural area was estimated based on the internal green space resources of the residential district. Excluding buildings, roads, and courtyards unsuitable for productive development, this study identified relatively open and contiguous public green spaces and landscaped areas as potential locations for ground-based agriculture. These include residential parks and squares, public green spaces, and inter-building landscaped green spaces, totaling a developable green area of 85,125 m2, which is taken as the upper limit for the ground-level agricultural system. Although private courtyards have some greening potential, they are generally enclosed and reserved for private use by residents and are, therefore, excluded from the calculation of developable areas.
To account for practical factors such as building structural load capacity, shading from facilities, and access requirements for equipment maintenance, feasible utilization rates were further defined (
Table 3). Based on the three-dimensional model, field surveys of 30 buildings of varying ages within the study area, and references to global and domestic urban agriculture and green roof retrofit practices [
30,
31], the upper limit of the utilization area for flat roof photovoltaic (PV) installation was set at 40%, corresponding to a developable area of 78,726 m
2. Further, the upper limit of rooftop cultivation utilization area was set at 50%, corresponding to a developable area of 59,044.5 m
2. For sloped rooftops, factors such as orientation, slope angle, drainage system interference, and the load-bearing capacity of older buildings result in a utilization rate of 20%, corresponding to a developable area of 5307 m
2. Studies indicate that actual rooftop utilization rates in high-density cities typically range between 30% and 50%, with an upper limit of rooftop utilization around 75%, making these estimates conservative yet realistic.
In configuring the energy system, additional parameters were established for rooftop areas available for PV installations. For PV greenhouse roofs (y
2), considering the impact of panel shading on plant growth and the requirements for light and thermal regulation in facility agriculture, this study references modern PV greenhouse practices [
32] and set the usable area as 70% of the total greenhouse roof area (y
2 = 0.7X
3). For sloped rooftop PV (y
3), the usable area was defined as 20% of the developable sloped rooftop area (y
3 = 0.2S_slope), prioritizing deployment on unobstructed south-facing roofs while accounting for slope, drainage, and structural stability. To simplify the model structure and reduce variable dimensions, certain variables with minimal impact on the objective function were assigned their maximum feasible values.
In the production scenario comparisons, although PV greenhouses are advantageous for enhancing residential self-sufficiency, their high construction and operational costs, coupled with their impact on rainwater harvesting, make them unsuitable for immediate large-scale deployment. Therefore, to ensure the practical feasibility and data consistency of the energy system configuration, annual biogas production (primarily derived from residential sewage and organic household waste, approximately 845,822 m
3) is treated as a fixed constraint in the optimization model (
Table 4 and
Table 5).
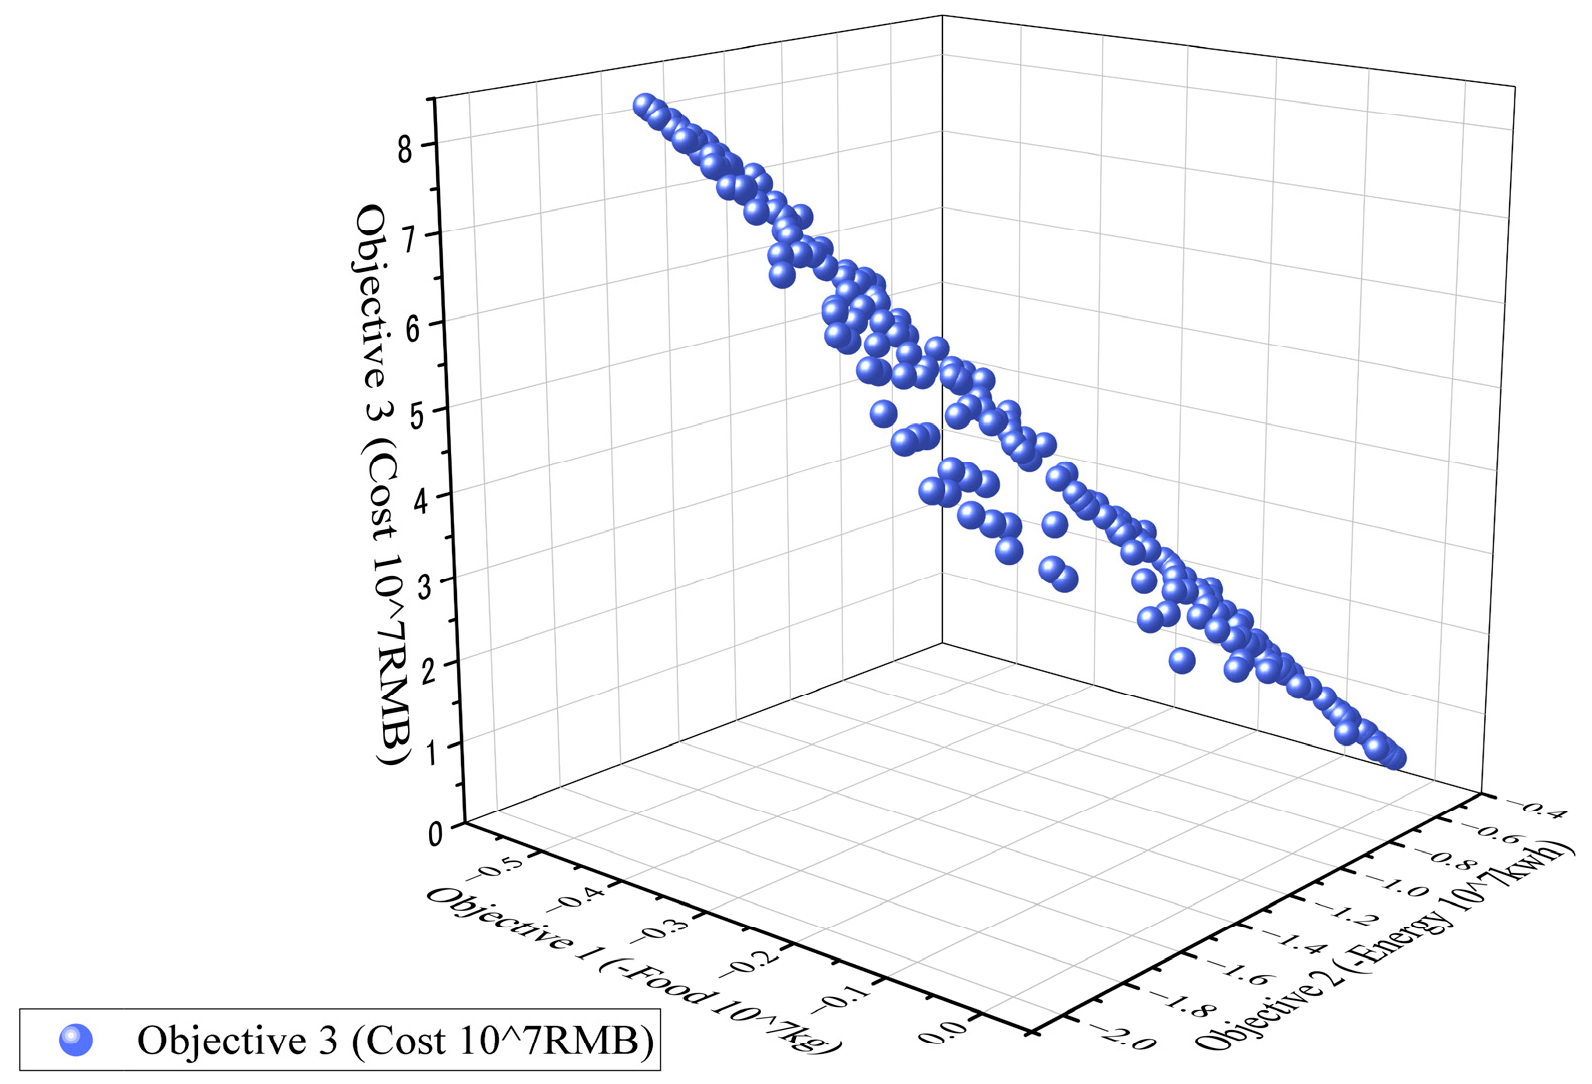
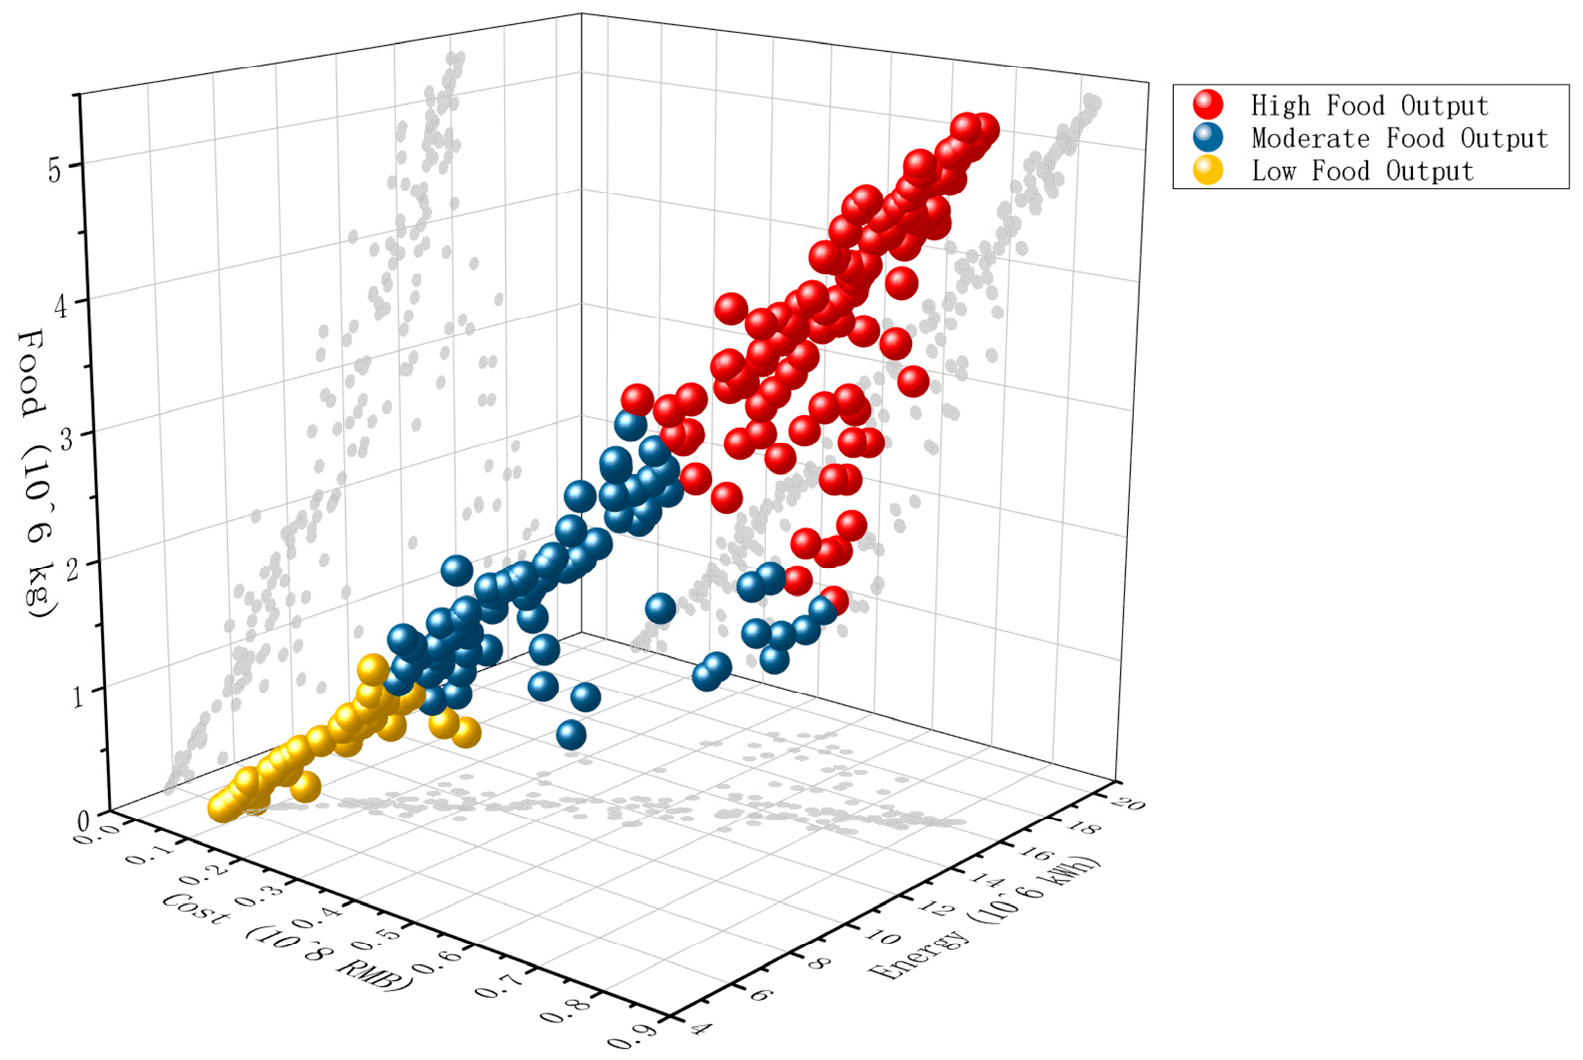
Following the generation of a Pareto-optimal solution set through the multi-objective optimization model, this study employed a standardized scoring method with equal weighting to comprehensively evaluate all candidate solutions. The solution achieving the highest composite score was identified as the compromise optimal solution for subsequent spatial configuration analysis. By normalizing the three objective functions—maximizing food production, maximizing energy output, and minimizing total system cost—and assigning equal importance to each, this approach ensures a balanced optimization outcome. It enables effective cost control without significantly compromising resource productivity, thus enhancing both the feasibility and contextual adaptability of the solution.
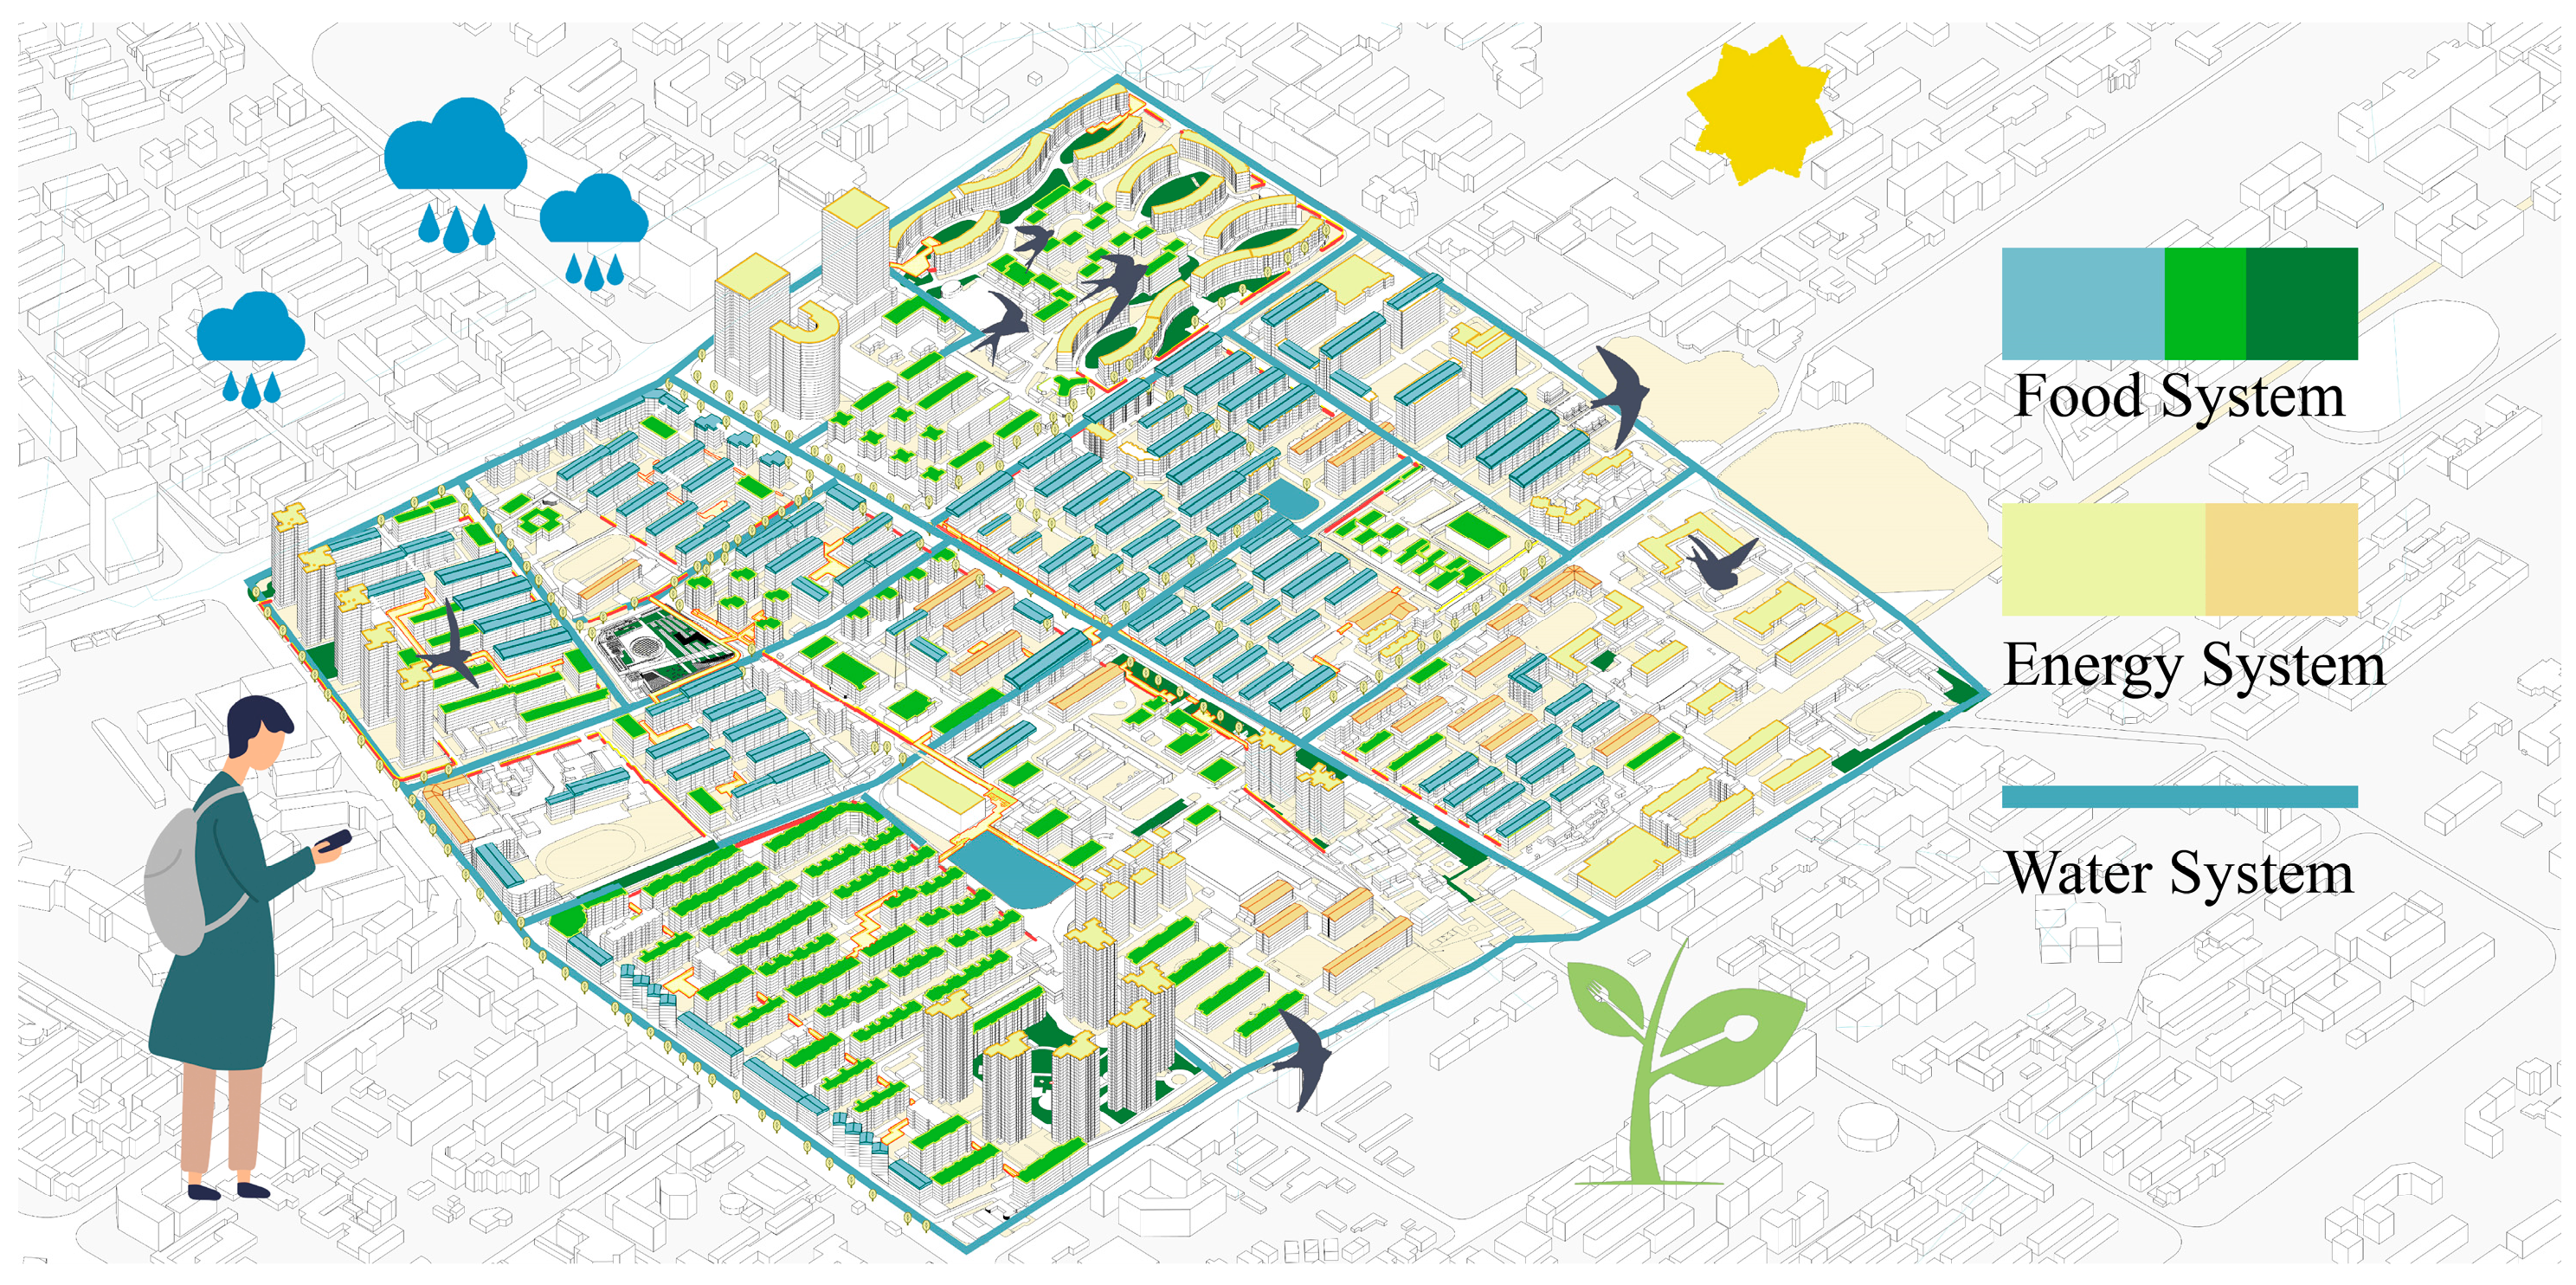
However, while the optimization model provides the area allocation among food, energy, and water systems, it does not specify methods for their spatial integration within the built environment. To address this, we summarized a series of practical typologies for integrating these systems within high-density urban residential areas, providing actionable implementation pathways. These typologies include ground-level elements (e.g., rain gardens, community gardens), roof-level elements (e.g., photovoltaic panels, photovoltaic greenhouses), and building-integrated components (e.g., photovoltaic, photovoltaic curtain walls, canopies), etc. Each typology supports multi-functional land use and resource efficiency.
Building on these typologies, master planning strategies must account for the broader spatial structure and systemic interactions within the study area. At the master planning level, functional zones should be delineated based on the site’s existing spatial structure. and tailored retrofitting strategies should be developed for each subsystem according to spatial suitability. For example, flat rooftops are optimal for agricultural production, whereas the rooftops of high-rise buildings—due to heightened wind loads and thermal variation—are better suited for photovoltaic (PV) installations. Roofs of industrial buildings or those with pollution risks should prioritize PV deployment, whereas public buildings offer opportunities for multifunctional use, integrating agriculture with recreation and commercial services. Sloped rooftops are best suited for PV panel installation. For idle or underutilized land parcels, lightweight and mobile planting systems are recommended to minimize initial capital investment and facilitate site restoration after use.
In this case study, specific typologies were applied to various spatial contexts: roof-tops were utilized for photovoltaic panels, photovoltaic greenhouses, and open-air planting. All ground-level green spaces were designated for open-air planting, while rainwater collection and utilization systems were integrated across both ground and roof areas. Implementation required context-specific decisions based on building types, roof forms, spatial accessibility, and infrastructure compatibility. This demonstrates how abstract optimization results can be translated into concrete spatial arrangements tailored to specific environmental conditions.


