Article

Sustainable Reinforcement Methods for Brick Masonry Walls: An Experimental and Finite Element Analysis Approach

1
Civil and Architecture Engineering Department, Sultan Qaboos University, Muscat 123, Oman
2
Civil Engineering Department, Wah Campus, COMSATS University Islamabad (CUI), Islamabad 45550, Pakistan
3
Department of Civil Engineering, Faculty of Engineering, Rangsit Campus, Thammasat University, Pathum Thani 12121, Thailand
4
Department of Civil Engineering, Faculty of Engineering, Rajamangala University of Technology Phra Nakhon, Bangkok 10800, Thailand
5
Department of Civil Engineering, School of Engineering, King Mongkut’s Institute of Technology Ladkrabang, Bangkok 10520, Thailand
6
National Institute of Transportation, National University of Sciences and Technology (NUST), Islamabad 44000, Pakistan
7
Civil Engineering Department, Kasem Bunding University, Bangkok 10510, Thailand
8
Department of Civil and Environmental Engineering, Srinakharinwirot University, Nakhonnayok 26120, Thailand
*
Author to whom correspondence should be addressed.
Buildings 2025, 15(13), 2180; https://doi.org/10.3390/buildings15132180
Submission received: 6 May 2025 / Revised: 12 June 2025 / Accepted: 16 June 2025 / Published: 22 June 2025
(This article belongs to the Special Issue Modeling and Testing the Performance of Masonry Structures)

Abstract

:
This study investigates the enhancement of axial and shear strength in brick masonry walls reinforced with steel and fiberglass meshes. The novelty of this study lies in its thorough evaluation of various reinforcement types and their influence on both axial and shear strength, offering valuable insights to enhance the performance of brick masonry structures. By using steel and fiberglass meshes for reinforcement, the study promotes the use of durable materials that can extend the lifespan of brick masonry structures, reducing the need for frequent repairs and replacements. The findings reveal that double-layer steel mesh delivers the highest strength, effectively reducing brittleness and improving deformation capacity in both single- and double-brick walls. Specifically, single-brick walls exhibited increases in compressive strength of 38.8% with single-layer steel mesh, 31.2% with fiberglass mesh, and 19.7% with plaster. In contrast, double-brick walls showed enhancements of 73.6% with double-layer steel mesh and 43.5% with fiberglass mesh. For shear strength, single-brick walls improved by 115.1% with single-layer steel mesh, 91.3% with fiberglass mesh, and 42.1% with plaster, while double-brick walls experienced increases of 162.7% with double-layer steel mesh and 132.5% with fiberglass mesh. Additionally, Abaqus modeling under axial and diagonal compression closely matched experimental results, revealing less than a 10% discrepancy across all reinforcement types.

1. Introduction

Housing is a fundamental necessity for human life, and masonry plays a crucial role in building homes. Masonry has been a key construction material for over 6000 years [1]. It is commonly used in low-rise and medium-rise building structures due to its affordability and ability to withstand mainly vertical loads. Among the various types of masonry, brick masonry is the most prevalent because of its material availability, ease of construction, strength, and minimal need for supervision. Brick masonry is not only the oldest but also the most widely used form of construction [2,3]. Its popularity stems from its low cost, high compressive strength, thermal mass, and availability. Despite being an ancient construction method, the anisotropic and heterogeneous behavior of masonry still requires further understanding. Additionally, compared with other materials like concrete and steel, masonry is more intriguing for analyzing and designing. The characteristics of masonry rely on the manufacturing procedure and variations in the constituent minerals. Earthquakes are natural disasters that pose significant dangers to human life and source extensive damage to structures and infrastructure [4,5]. Many constructions, including houses, bridge abutments, and water tanks, are commonly built with brick masonry around the world. However, brick masonry structures are vulnerable to earthquake loads, particularly when they are not braced for seismic activity [6]. Numerous studies have reported the out-of-plane weakness of unreinforced masonry walls [7,8]. In addition, the in-plane shear failure has also been reported [9]. Even under moderately intense seismic events, unreinforced masonry structures can suffer severe damage.
Unreinforced brick masonry (URM) is mainly supposed to bear vertical loads, using its axial capacity [10]. URM is considered to have low tensile strength due to its inability to resist tensile forces [11]. Upon compressive loading, the mortar in masonry tends to dilate, ascribed to its Poisson’s ratio. The bonding between the mortar and bricks restricts this expansion, creating lateral tensile stresses in the bricks and triaxial compressive stresses in the mortar. When the mortar crushes under compression, it forms weak regions, and the lateral tension among the brick elements starts cracks that spread from micro to macro levels [11]. Although reinforced concrete and steel structures can withstand high seismic loads and stresses, unreinforced masonry (URM) remains widely used in developing countries like Pakistan due to its local availability, low cost, and the abundance of skilled labor. Most of Pakistan’s ancient residential houses and architectural heritage are constructed from brick masonry [12]. Additionally, many active faults exist in the junction regions of the country [13]. The weal tensile capacity and brittle response of URM endanger both property and human lives. Ascribed to their low tensile capacity, heavy mass, and brittle nature, brick masonry constructions are greatly susceptible to earthquakes, leading to numerous catastrophic failures [14]. A significant amount of damage was reported during the Kashmir 2005 Earthquake where conventional brick masonry buildings were commonly used [15]. Similar damage was also reported in Nepal [16,17]. Similar construction routines are prevalent across the country, underscoring the urgent need for reinforcement. As a result, the demand for reinforcing these hazardous structures continues to grow [15]. During an earthquake, URM structures are subjected to flexural loads, causing the URM walls to experience out-of-plane bending and in-plane shear stresses, particularly diagonal tension [18]. Extreme stresses are typically found at the bottom, the wall center, the heel, and near the loading point. The non-homogeneous and anisotropic response of masonry makes predicting the behavior of brick masonry under these loading environments extremely challenging [19]. Consequently, the design of such structures requires the utmost care and must be reinforced to ensure safety.
In recent decades, various reinforcement approaches have been progressed to address the vulnerability of brick masonry constructions. Numerous researchers have conducted experimental studies to propose strategies for enhancing the strength of brick masonry and concrete structures. These practices include the use of fiber-reinforced polymer (FRP) mixtures with steel rods for reinforcement, as well as the incorporation of flax fibers and carbon FRPs [20,21]. Although these FRP combinations have demonstrated an increased load-bearing capacity in brick masonry and concrete structures [22], their high cost often outweighs the benefits, especially when compared to the relatively inexpensive construction technique of brick masonry. Mercedes et al. [23] experimented with strengthening masonry using hemp, vegetal meshes, and glass fiber, all of which were covered with plaster. The use of vegetal mesh notably enhanced shear strength, though bond failure was observed. Recently, Angiolilli and Gregori [24] have undertaken retrofitting of ancient masonry structures using similar approaches. Triwiyono et al. [25] explored the flexural capacity and ductility of concrete brick masonry walls strengthened with steel. The study found that the ductility and flexural strength of the walls enhanced significantly, up to five to six times their original values. It was reported that the flexural capacity of the walls could be increased to nearly theoretical values with the utilization of steel reinforcement. In the construction industry, numerous researchers have explored various modifications and innovations to improve the properties of brick masonry [26]. Meli [27] examined the response of URM walls under lateral loads, conducting tests such as axial compression, diagonal compression, and shear. For axial compression, the height-to-width ratio of the piers was 4. Diagonal compression tests were conducted on small panels of different shapes, revealing that hollow bricks exhibited higher compressive strength compared to other common bricks. In square panels, failure typically occurs along the joints.
Naseer et al. [28] studied the behavior of brick masonry under diagonal compression. The wall specimen measured 730 mm by 730 mm by 229 mm. This study compares two simplified micro-modeling approaches for unconfined masonry walls under in-plane static and reverse cyclic loading using ANSYS: the spring modeling (SM) approach and the expanded units modeling (EUM) approach. The SM approach, using nonlinear springs for mortar, offers high accuracy and computational efficiency for static loading, while the EUM approach, which expands brick dimensions to include mortar, is more versatile for cyclic loading. Results highlight both methods as accurate, efficient alternatives to existing techniques, with improved versatility and reduced computational cost. Nguyen and Meftah [29] developed a computational model to study the behavior of fired-clay URM walls exposed to fire. A three-dimensional numerical modeling was performed, focusing particularly on the spalling of hollow bricks. Haach et al. [30] also performed flexural testing on masonry walls in accordance with EN 1052-2. Various types of walls were created, each consisting of two units in length and seven courses in height, with 8 mm joints. In-plane displacements were measured using three LVDTs, and the curvature was calculated from LVDT data at the base of the specimen. Experimental data of Haach et al. [31] were also used to establish the mechanical behavior of the homogenized material for numerical modeling, specifically Young’s modulus, Poisson’s ratio, and tensile and compressive capacity. To enhance the ductility of masonry structures, glass-fiber-reinforced polymer (GFRP) was used for strengthening [32]. Further in the past, many studies conducted seismic analysis [33,34,35,36,37,38], risk perception [39], gender-based studies, and analysis of the mechanical properties of concrete [40,41,42].
This study investigates the feasibility of traditional strengthening techniques utilizing locally available low-cost materials such as cement-sand mortar and different types of wire mesh, including steel and fiberglass mesh. These materials are more accessible and cost-effective compared to FRP composites. Masonry brick walls from the Taxila region were tested under axial and diagonal compression to evaluate their mechanical properties and the effects of reinforcement using single and double layers of steel and fiberglass mesh. The work addresses a gap in the existing literature by examining the structural behavior of unreinforced masonry (URM) walls strengthened with mortar and various configurations of wire mesh—specifically, single-layer and double-layer steel mesh, as well as single-layer and double-layer fiberglass mesh. This study involves both experimental and numerical analysis to evaluate the performance of URM walls under axial and diagonal loading, assess the influence of steel and fiberglass mesh reinforcement, and simulate the response of the strengthened walls using ABAQUS. Initially, 3D models of wall specimens were created, with dimensions of 700 mm × 700 mm and thicknesses of 114.3 mm and 228.6 mm for the control sample and 714 mm × 714 mm with thicknesses of 128 mm and 240 mm for plastered and mesh-reinforced walls. As Abaqus is unitless, the system of units used in this study was millimeters. In the next step, different approaches to model masonry in finite element analysis (FEA) were considered, ranging from detailed micro-level to more simplified macro-level models, as discussed by Noort [43]. A macro-scale model was selected, where all masonry components (interface, unit, mesh, and mortar) were homogenized as either anisotropic or isotropic continua. This approach is favored due to its practical application and lower computational requirements. Mac-roscopic models are used for efficient overall behavior analysis, while microscopic models provide insights into complex interactions at the material level. Therefore, in this study, macroscopic models were used.

2. Materials and Experimental Framework

This research involved both experimental and numerical assessments of clay brick masonry walls reinforced with steel and fiberglass mesh, comparing them with single-brick walls, double-brick walls, and unreinforced walls. The mechanical characteristics of fired clay brick, involving compressive strength, splitting tensile strength, and water absorption were determined. Additionally, the compressive strength of prisms, the axial compressive strength of walls, and the shear strength of walls were evaluated.

2.1. Material Characteristics

In this work, locally available clay bricks, steel mesh, and fiberglass mesh were used in both single and double layers. The dimensions of the bricks are 114.3 × 76 × 228.2 mm. For single-brick testing, compressive strength, modulus of rupture, and splitting tensile tests were conducted. The average compressive strength of the bricks was 9.65 MPa, as determined by ASTM C1314-23a [44] (Figure 1a). The average modulus of rupture and splitting tensile strength were 2.75 MPa and 0.65 MPa, respectively, computed as shown in Figure 1b,c, tested under ASTM C1314-23a. Additionally, 50 mm mortar cubes were examined for compressive strength under ASTM C109 [45] (Figure 1c). The average compressive capacity of the N-type mortar cubes (1:4 cement to sand ratio) after 28 days of curing was 18.509 MPa. According to EC 8 [46], the minimum required compressive strength of mortar should be no less than 5.0 MPa. The steel wire mesh diameter was 0.119 mm. The ultimate strength of steel wire mesh was 0.06 MPa. The opening size in steel wire mesh was 20 × 15 mm (width × depth). The ultimate strength of fiberglass mesh was 0.039 MPa. The opening size in steel wire mesh was 5 × 5 mm (width × depth).

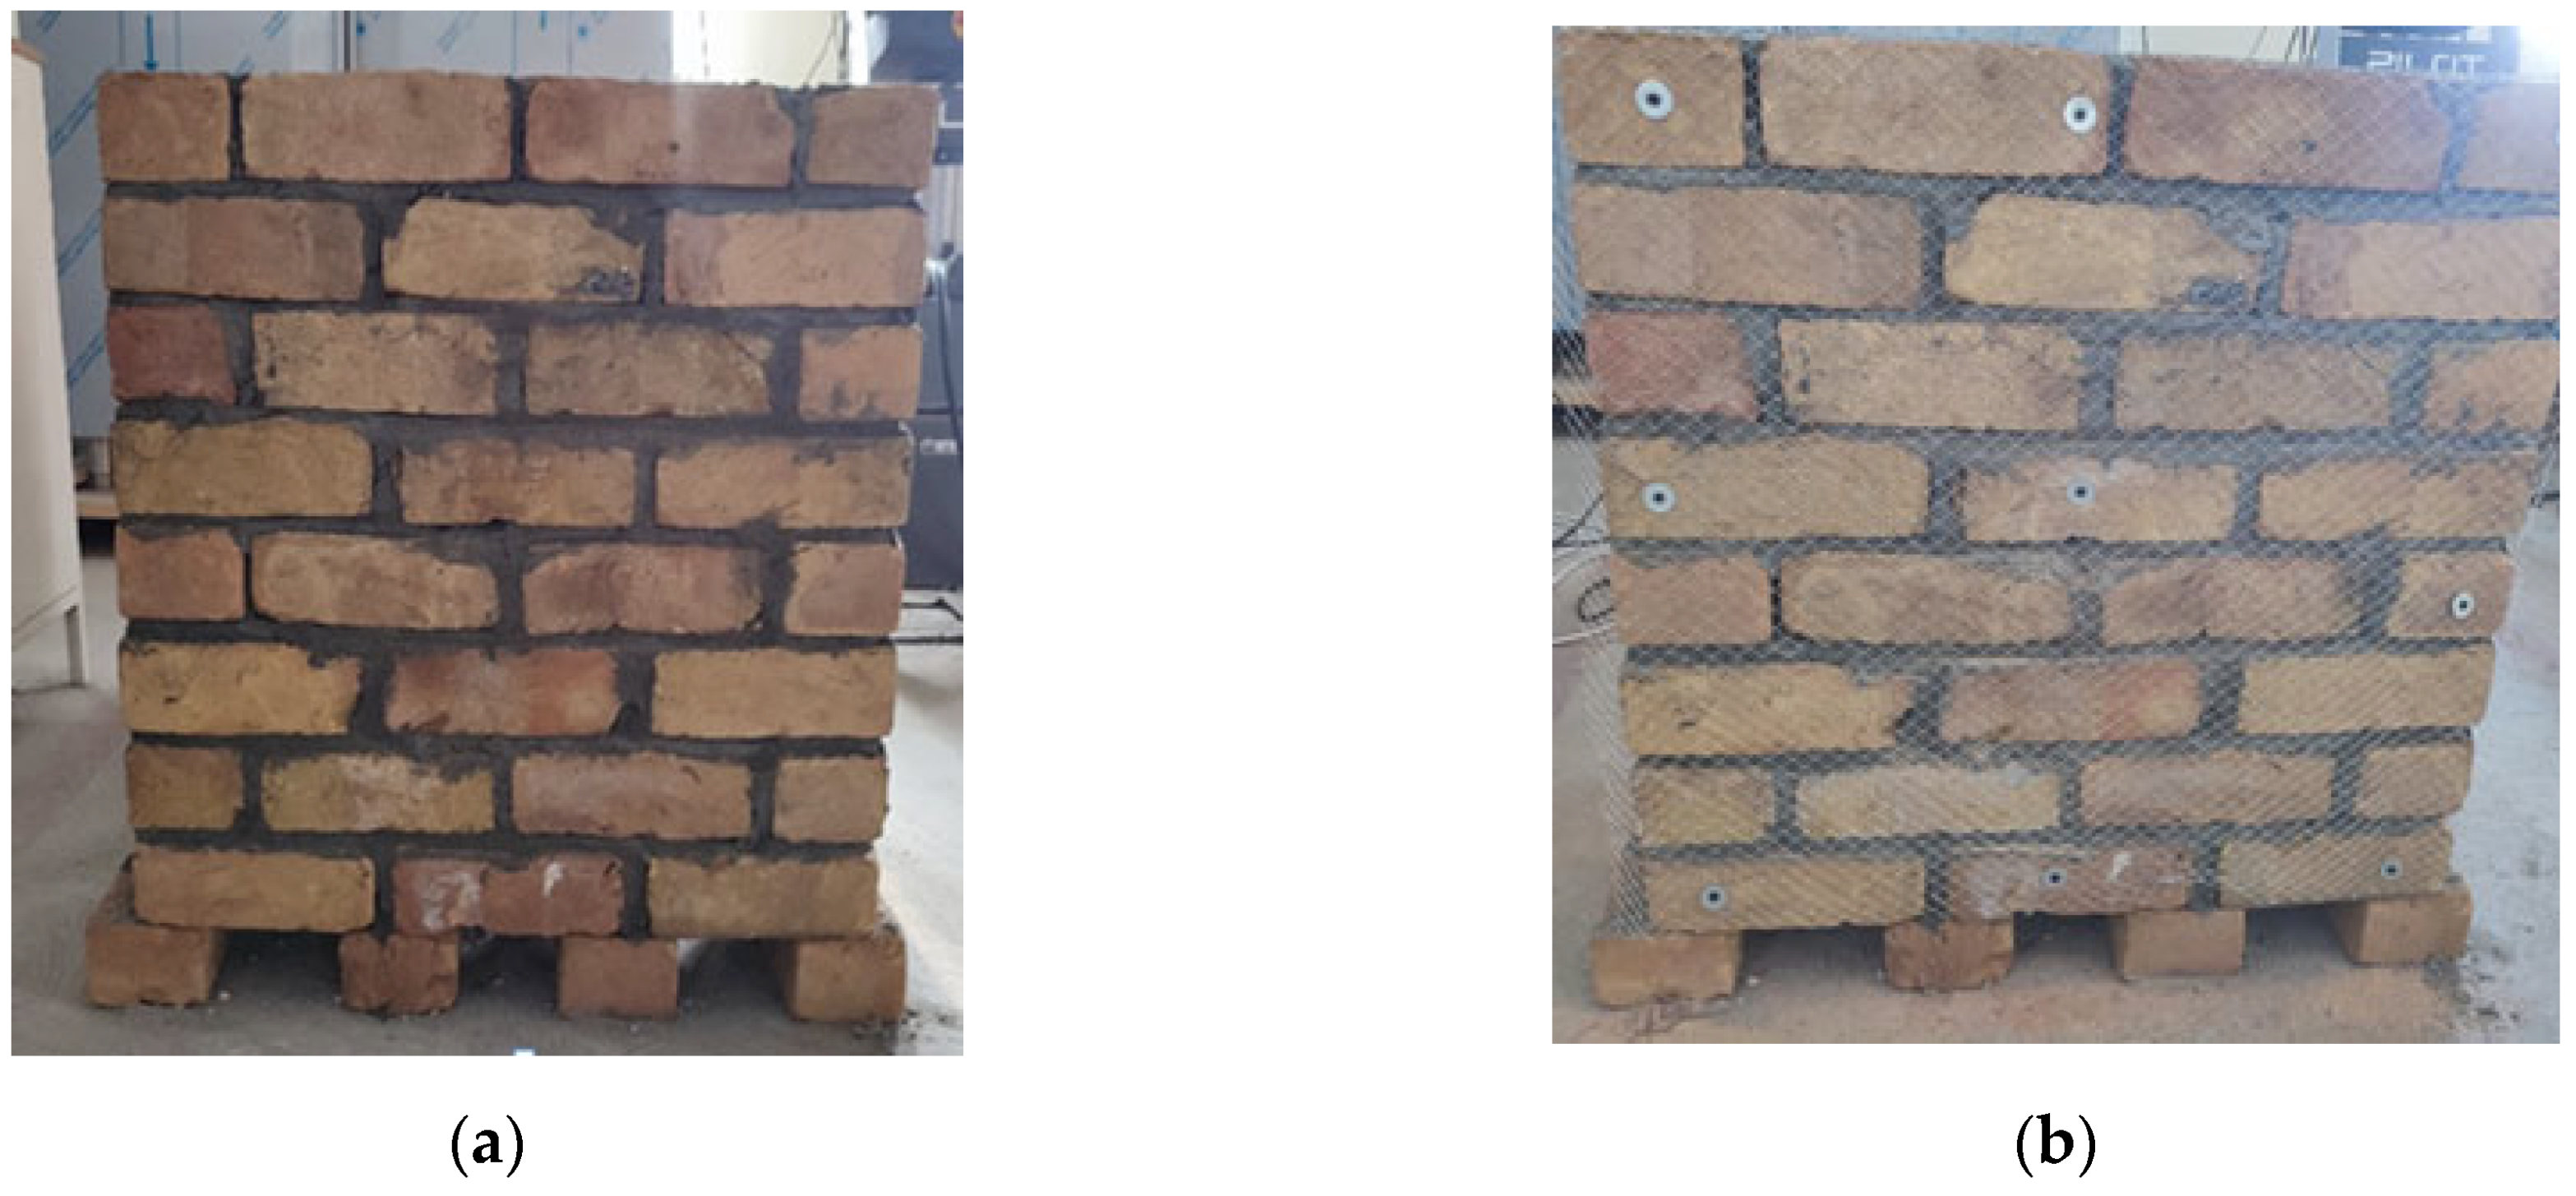
2.2. Wall Preparation

The fundamental objective of this work was to evaluate the performance of strengthened single-brick and double-brick masonry walls using single and double layers of steel mesh and fiberglass mesh. To achieve this, twenty-four brick masonry walls of the same size (700 × 700 mm) were constructed in the laboratory for both single- and double-brick walls, following ASTM C1717-19 [47] for axial loading and ASTM E519/E519M-22 [48] for diagonal loading, as illustrated in Figure 2a. The walls were cured for a minimum of 28 days. Locally accessible materials, including cement, sand, and solid clay bricks, were used, and construction was carried out by a skilled artisan. Double- and single-brick walls of 228.6 mm and 114.3 mm thickness were constructed. Four walls were kept as controls for comparison, while twenty were strengthened using N-type mortar (1:4 cement-to-sand ratio) with steel mesh and fiberglass mesh in both single and double layers. Table 1 presents the terminology of the strengthening schemes used in this work. Cement and sand in a 1:4 ratio were utilized for all mortars, and their thickness was kept at 13 mm.
As illustrated in Figure 3, the steel mesh specimens were strengthened with steel mesh, while the fiberglass mesh specimens were reinforced with fiberglass. All specimens were strengthened symmetrically, both horizontally and vertically, on both the front and back surfaces. The walls were then plastered with N-type mortar and subsequently cured.

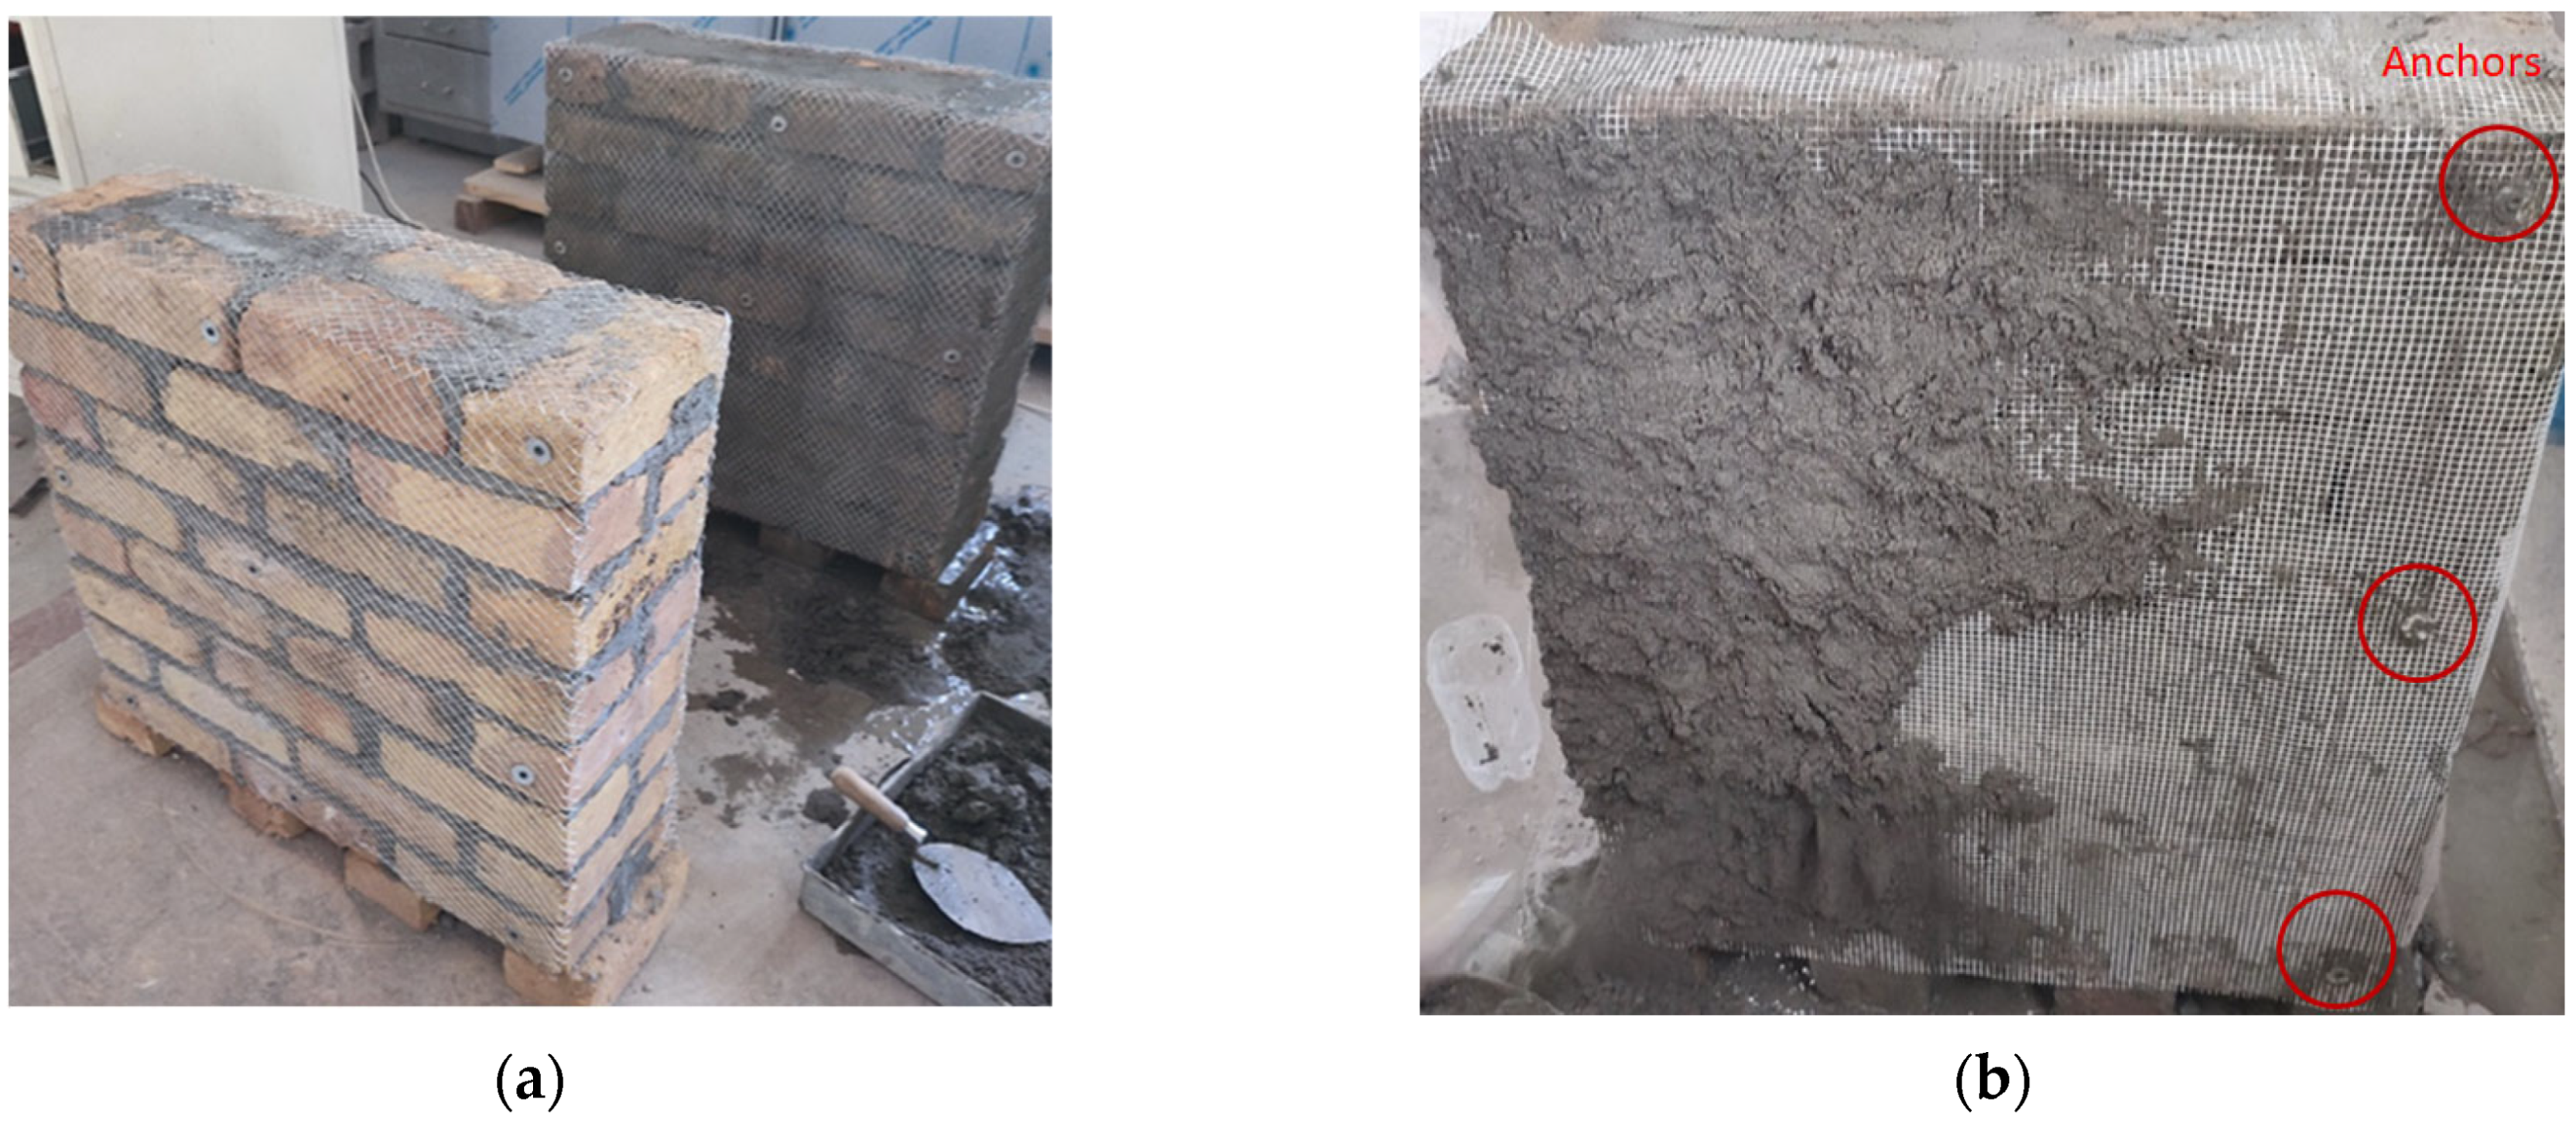
2.3. Fiberglass/Steel Strengthening

Fiberglass mesh and steel mesh were utilized to strengthen the URM walls, with material characteristics and geometrical details given in Section 2.1. Both single and double layers of steel and fiberglass mesh were applied. The installation procedure was straightforward and simple. Firstly, a mesh grid was utilized to mark the points. The walls were then drilled at specific locations, as illustrated in Figure 2. The mesh was anchored to the masonry walls using pan Philip screws and washers, with a thickness of 1.2 mm, and internal and external diameters of 5.5 mm and 40.6 mm, respectively. At each face, a total of 9 anchors were used. The spacing between each anchor was approximately 345 mm in both directions. The fiberglass meshes were significantly lighter than steel, making it easier to handle and install. However, generally it provides less enhancement in compressive and shear strength compared to steel mesh. The steel mesh was positioned diagonally, with the specimen tested in a diagonal orientation, aligning the mesh wires parallel to the stress direction.

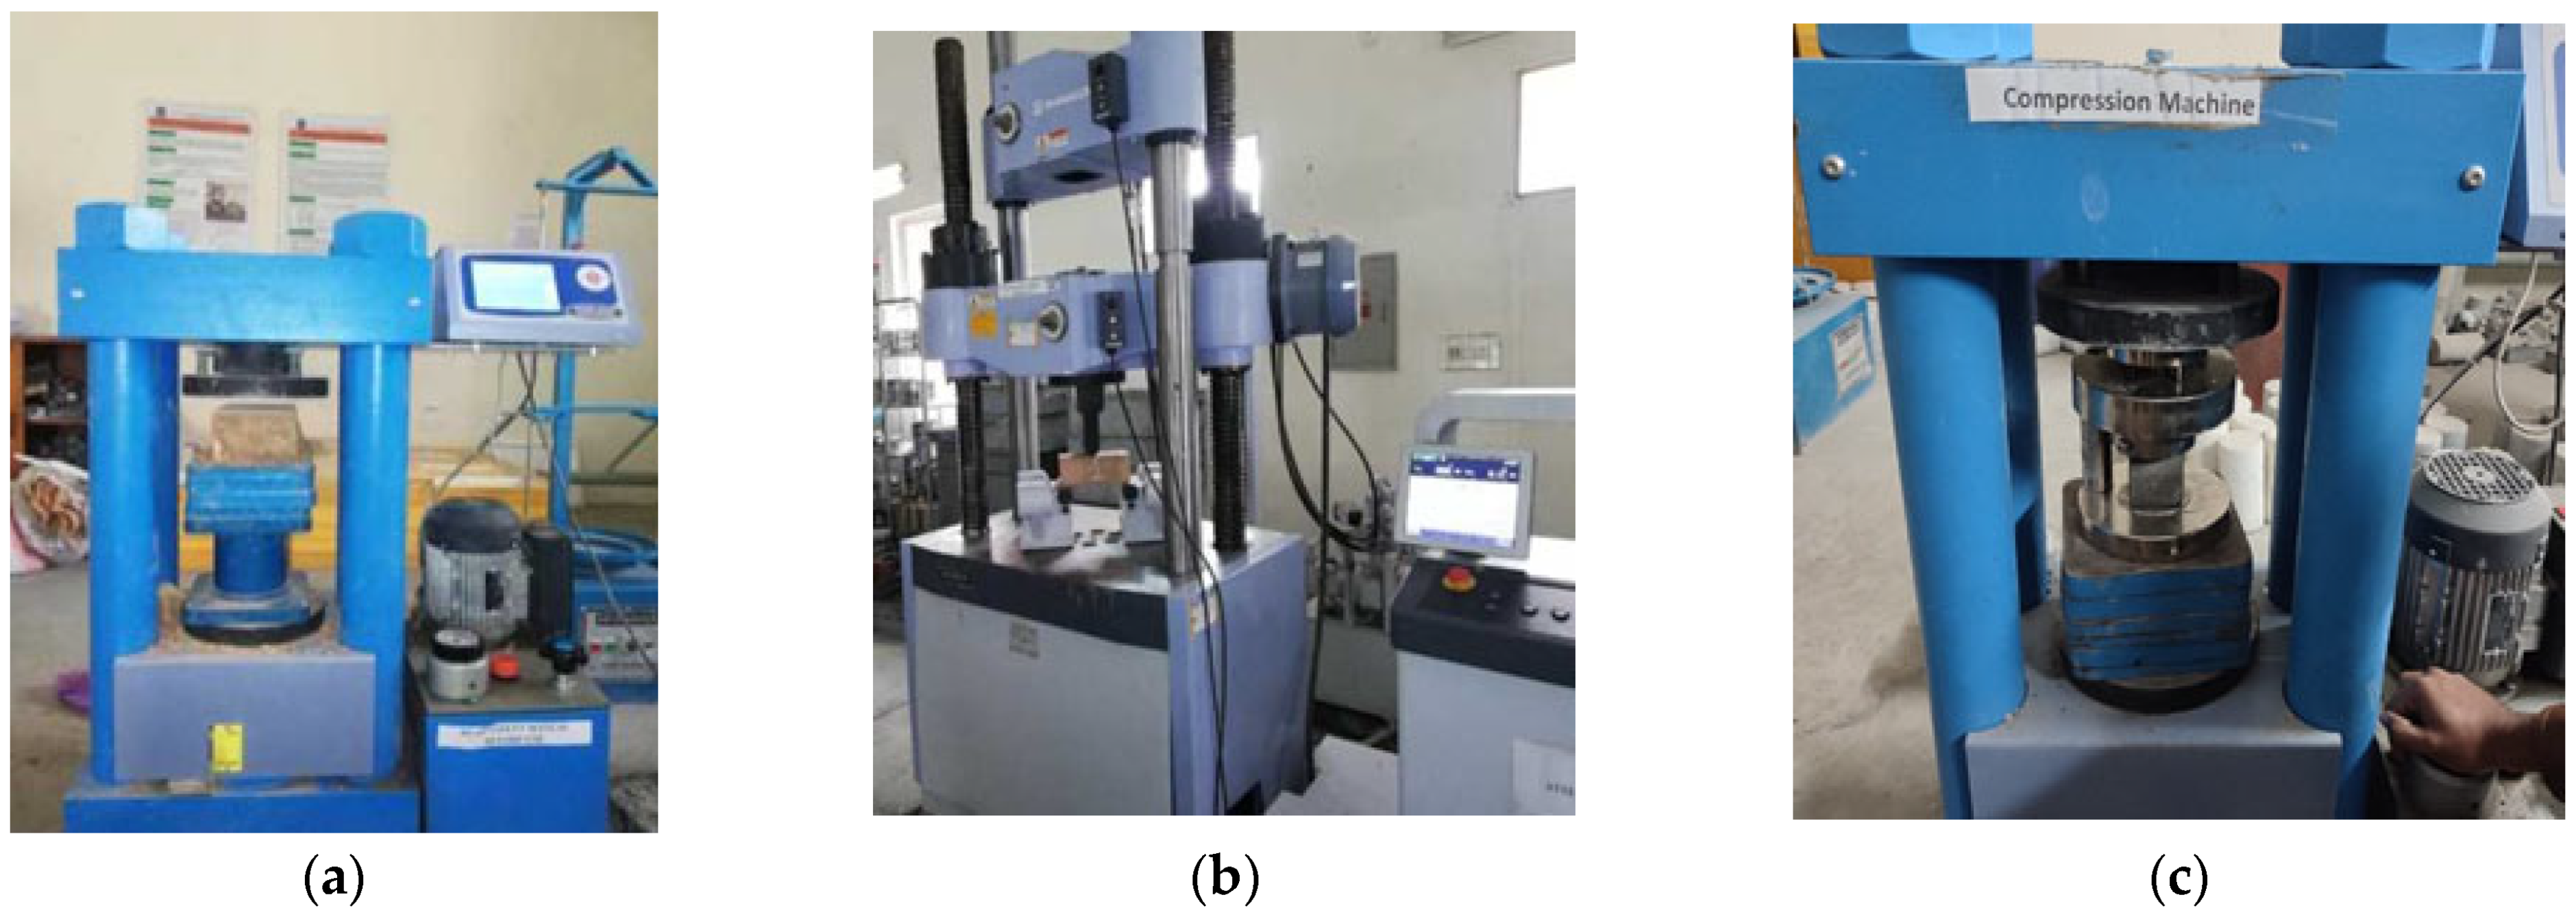
2.4. Test Setup and Instrumentation

The wall specimens were placed in a reaction frame, and a 12 mm thick I-shaped steel beam was positioned on top to ensure uniform load distribution. The load was applied at a rate of 500 N/sec and continued uniformly until the specimens collapsed. Cracks were marked using a marker, and the ultimate load sustained by each specimen was recorded.

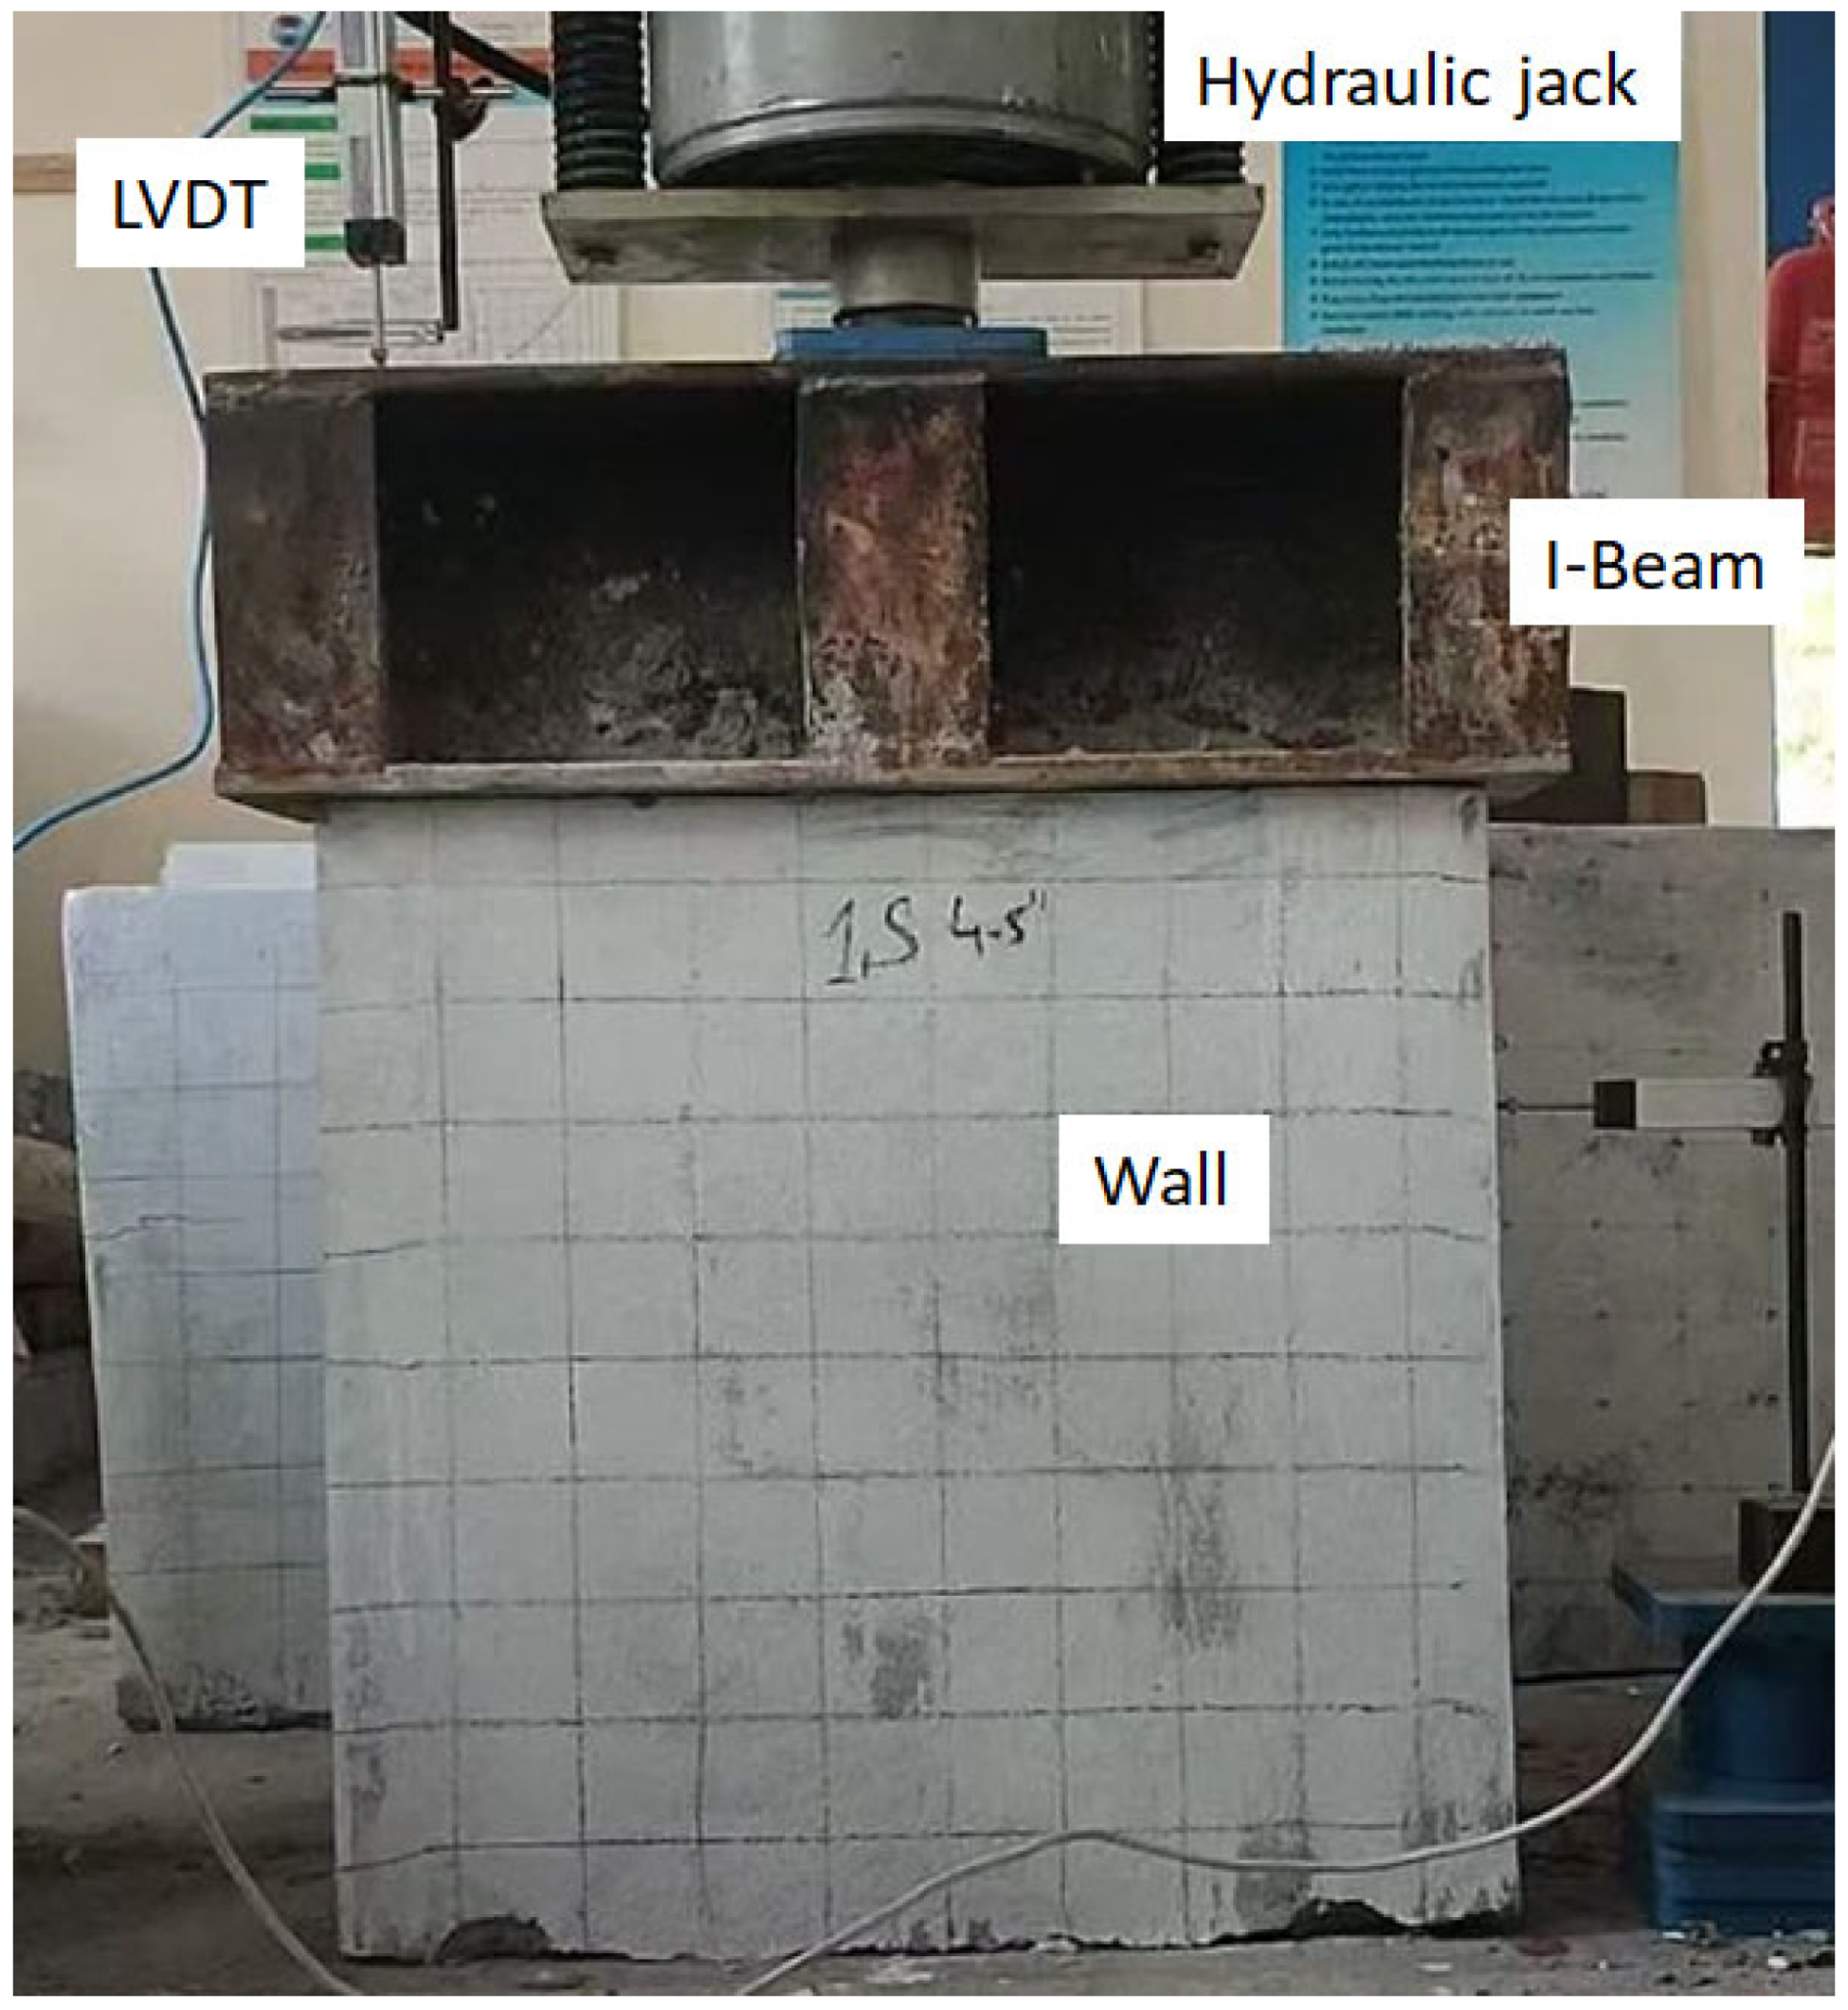
2.4.1. Axial Compression

The instrumentation plan for axial compression of the wall specimens is illustrated in Figure 4. Wall specimens were placed in a reaction frame, with 12 mm thick special plates on the top and bottom, to ensure uniform load distribution. The load was applied at the rate of 500 N/s until the specimens collapsed, and the maximum load was recorded. The test setup for the axial involved a 125-ton capacity hydraulic jack and two LVDTs to monitor deflections, as illustrated in Figure 4. This experimental campaign examined the behavior of masonry structural members under gravitational loads.

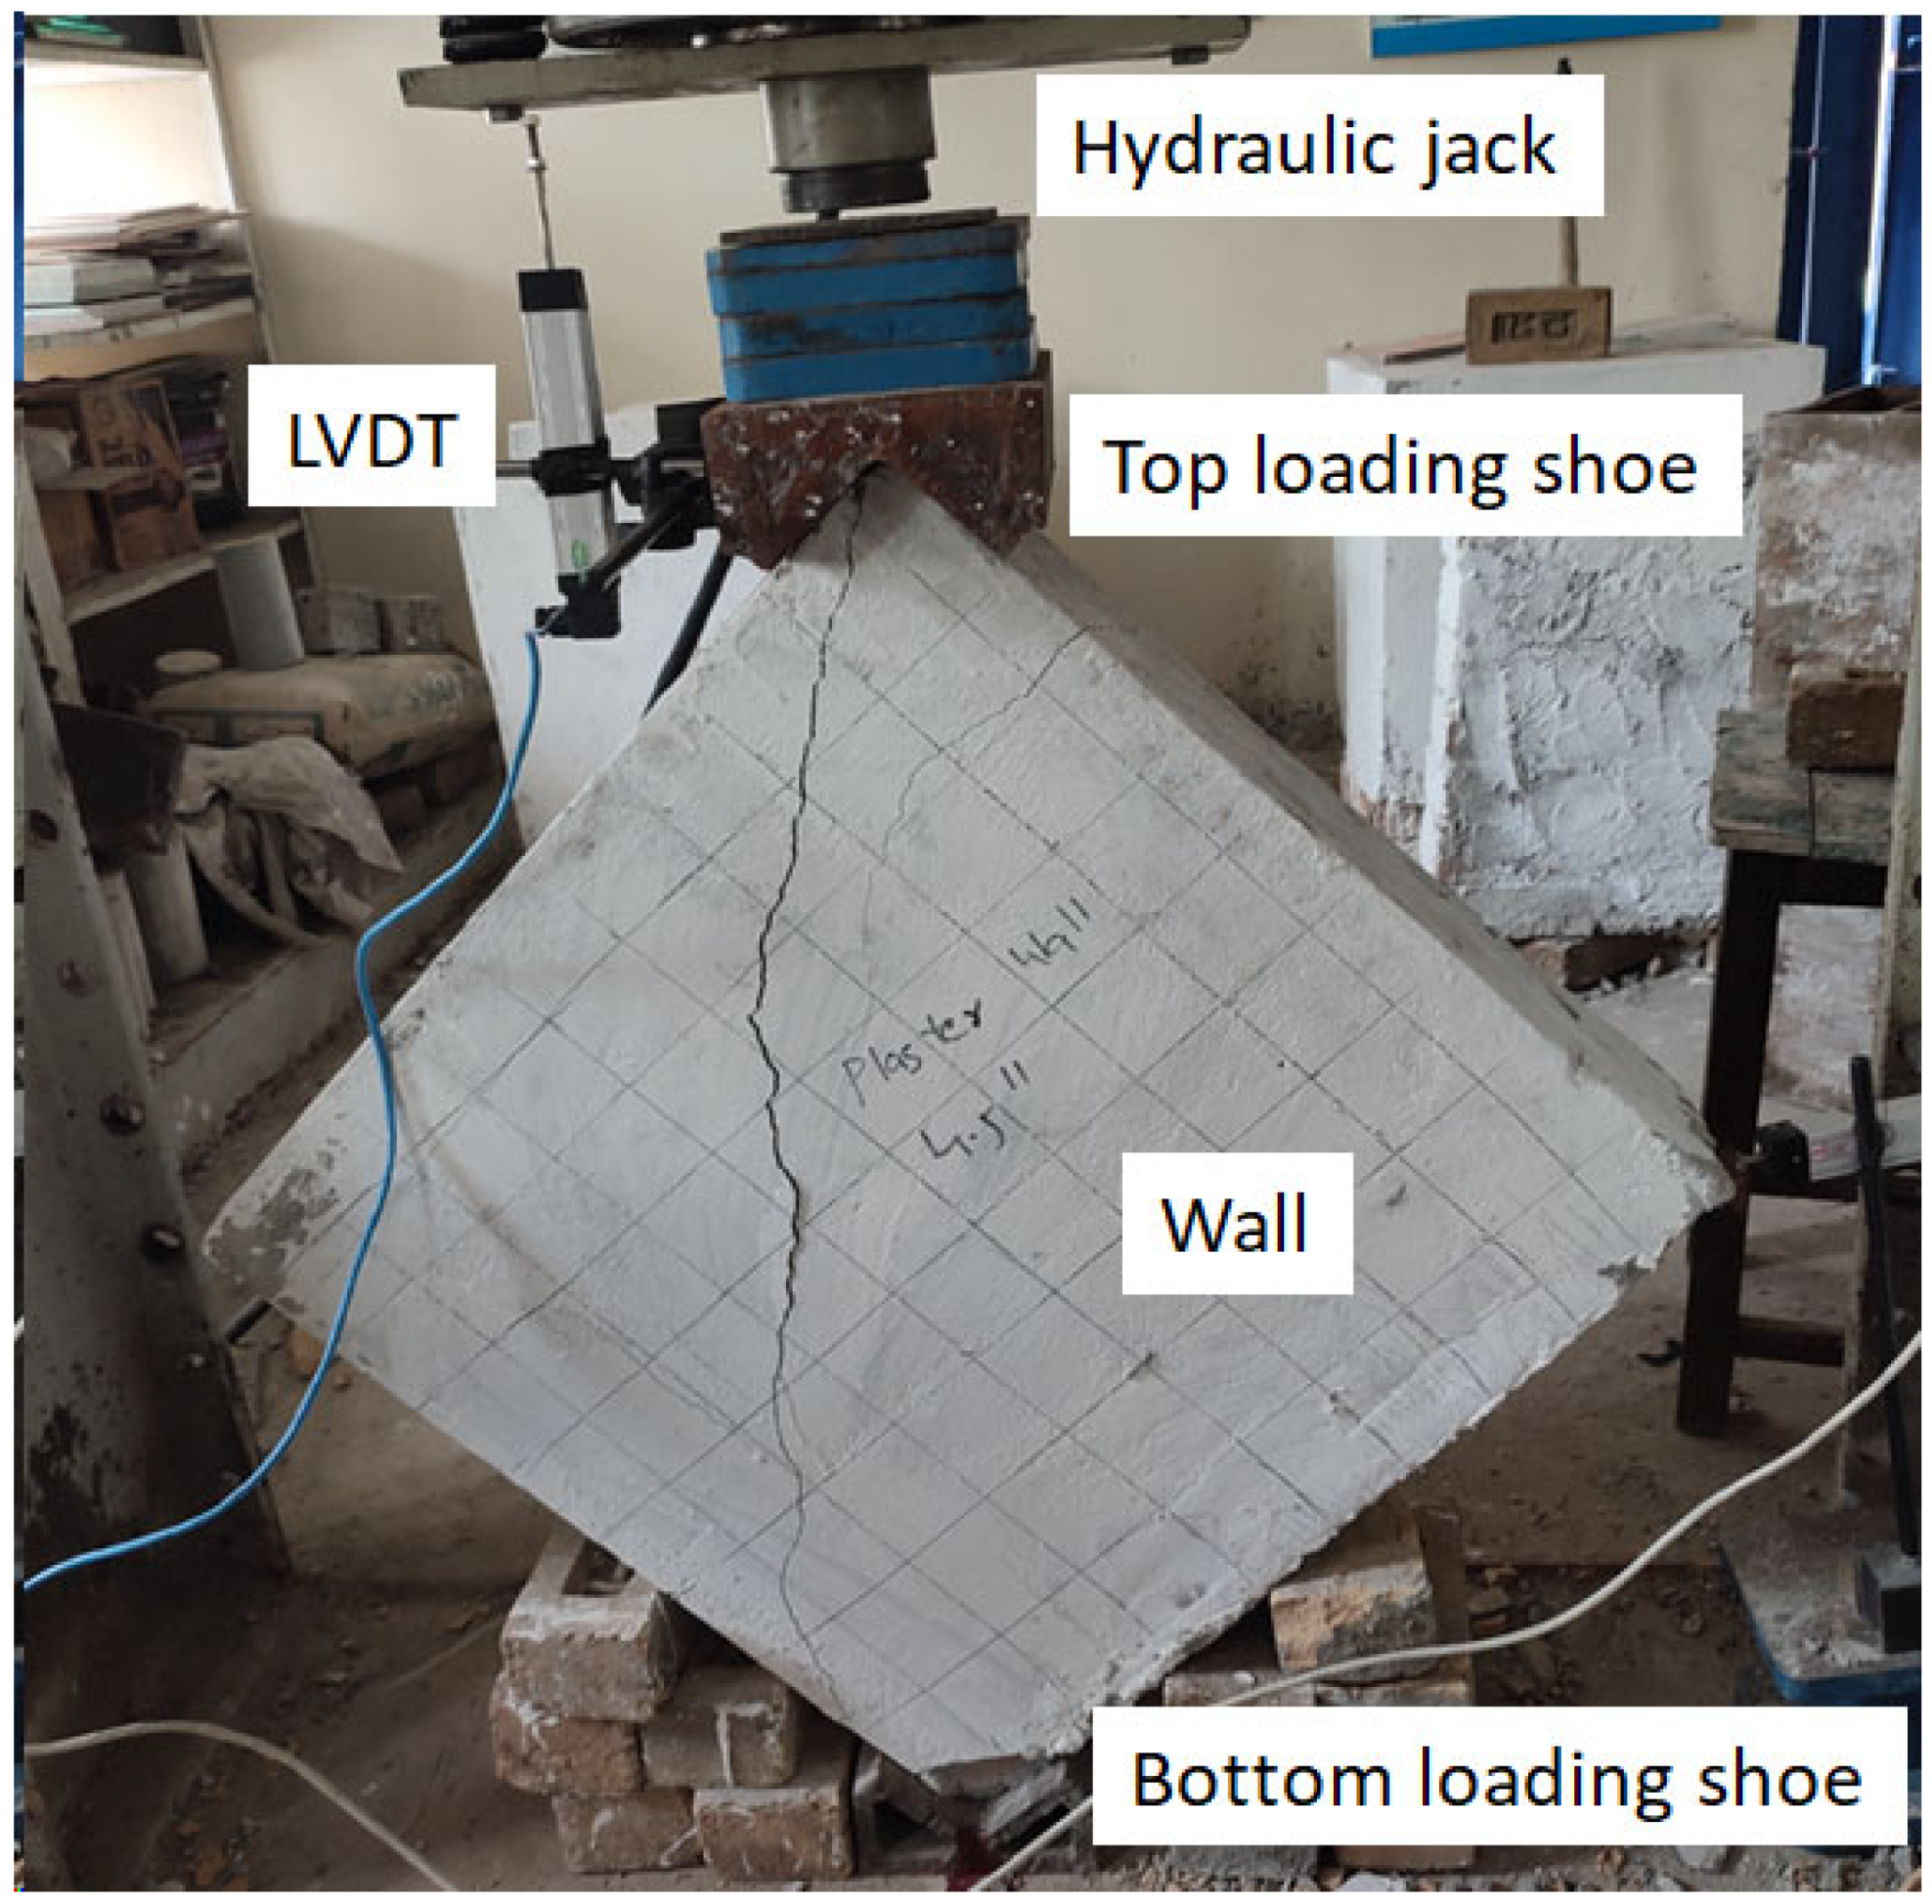
2.4.2. Diagonal Compression

The diagonal compression test was performed following ASTM E519-22 [48]. The test setup for diagonal loading also involved a 125-ton capacity hydraulic jack and two LVDTs to monitor deflections, as illustrated in Figure 5. A Micro Measurement data logger was utilized to capture the deformations. Safety supports were provided for the diagonal walls to hold the wallets and protect the instruments. No overturning occurred during the testing procedure. The load was applied at the same rate of 500 N/sec until the specimens collapsed, and the maximum load was recorded. This setup examined the behavior under seismic-type loads.

3. Experimental Results

This section provides the behavior of walls during the application of loads, including their crack patterns and development and ultimate capacities demonstrated. This study involved the assessment of the contribution of different mesh types and their magnitude. Consequently, the effect of mesh strengthening is discussed on the failure modes, peak capacity, and failure modes of walls.

3.1. Failure Modes and Peak Capacity of Walls

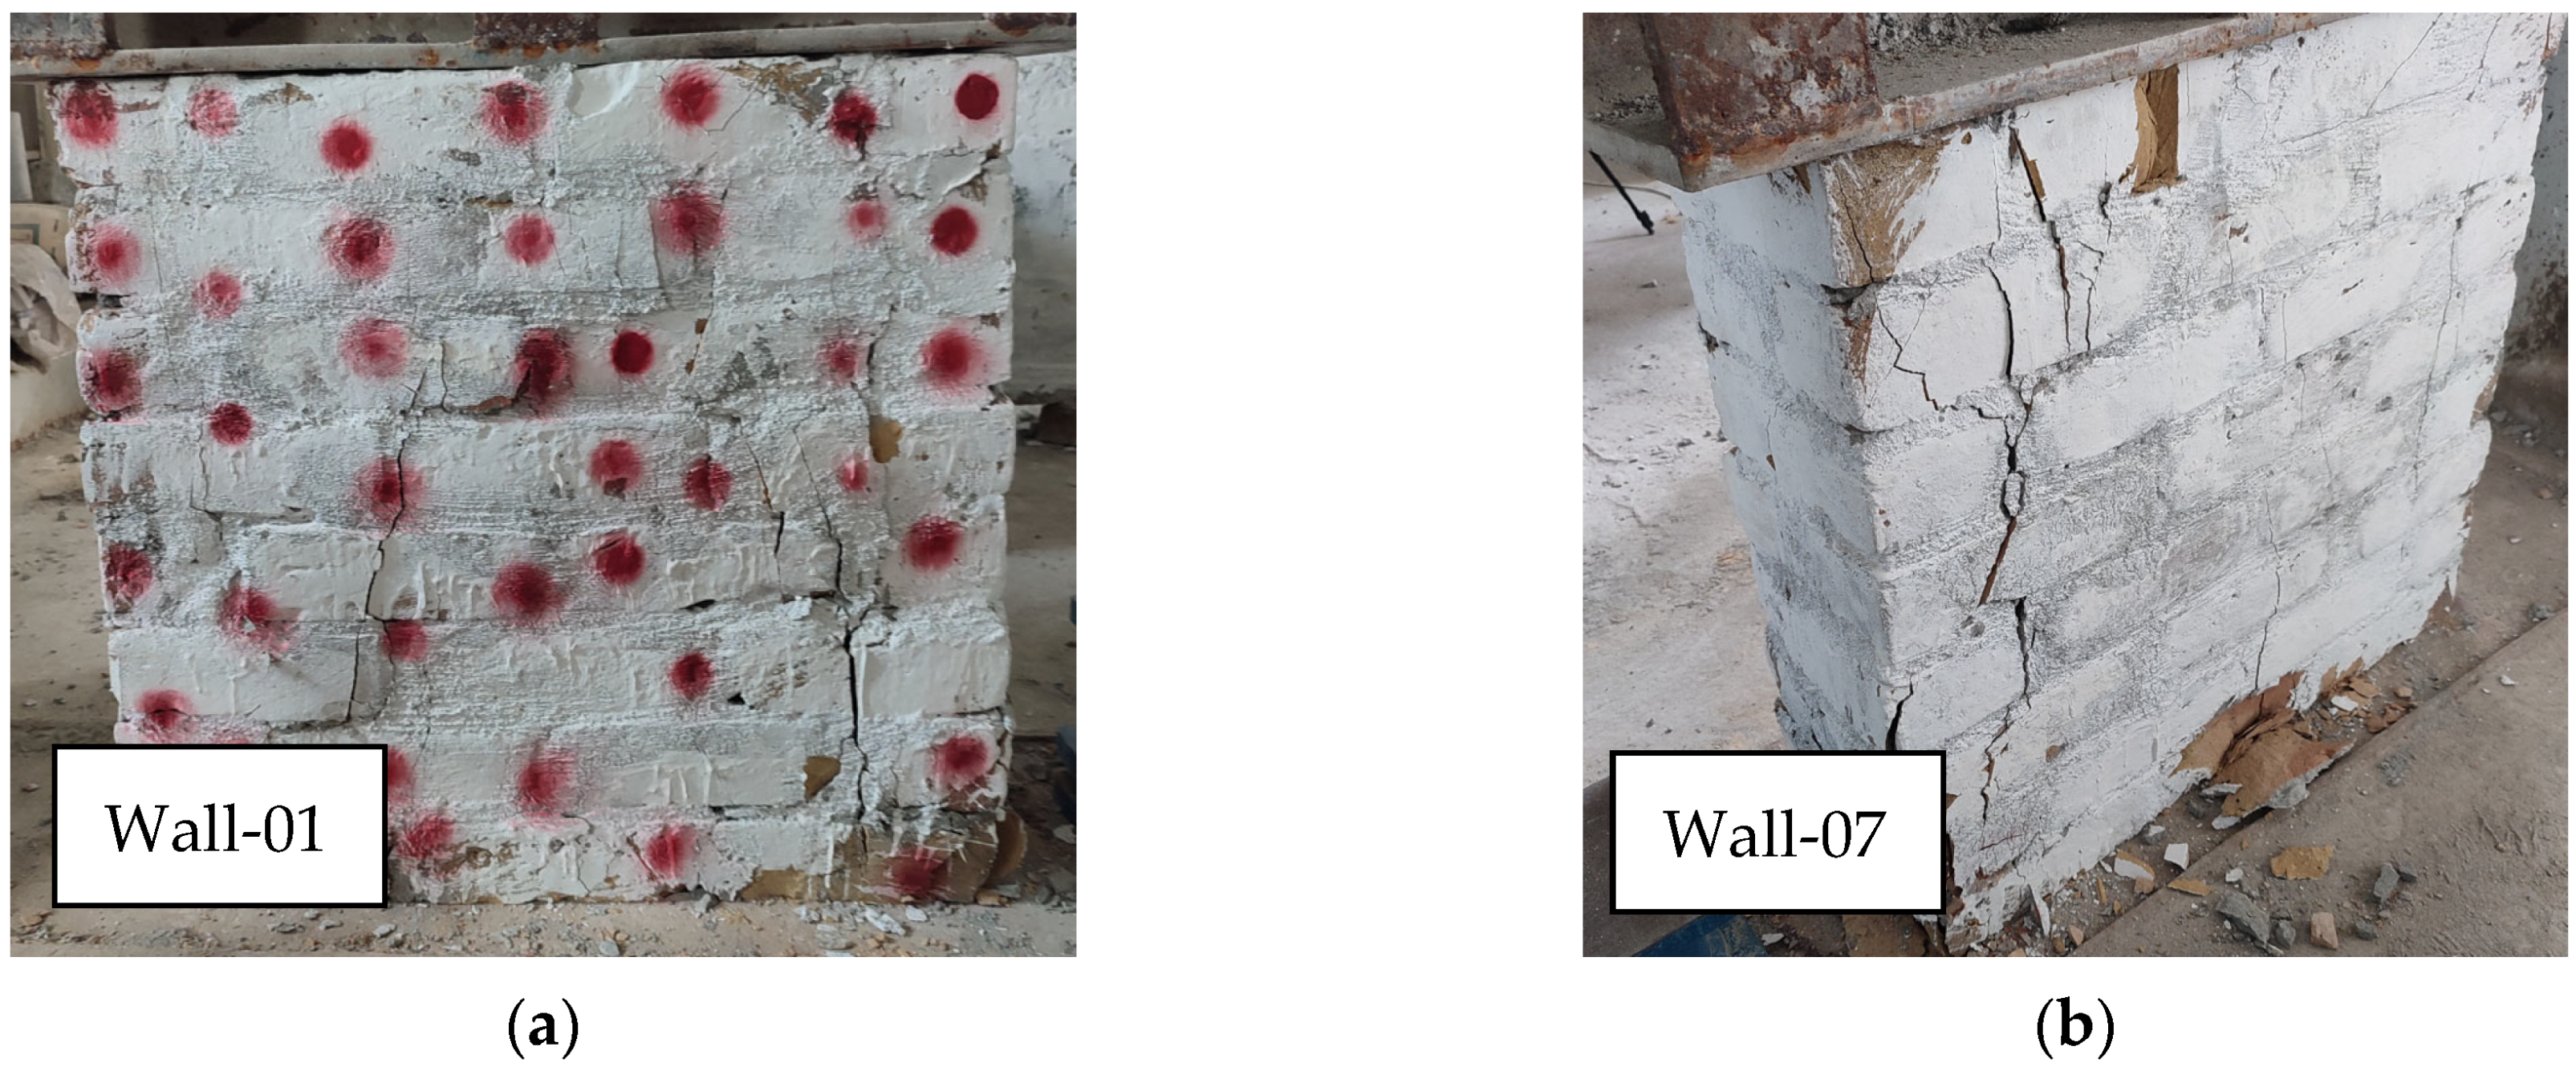
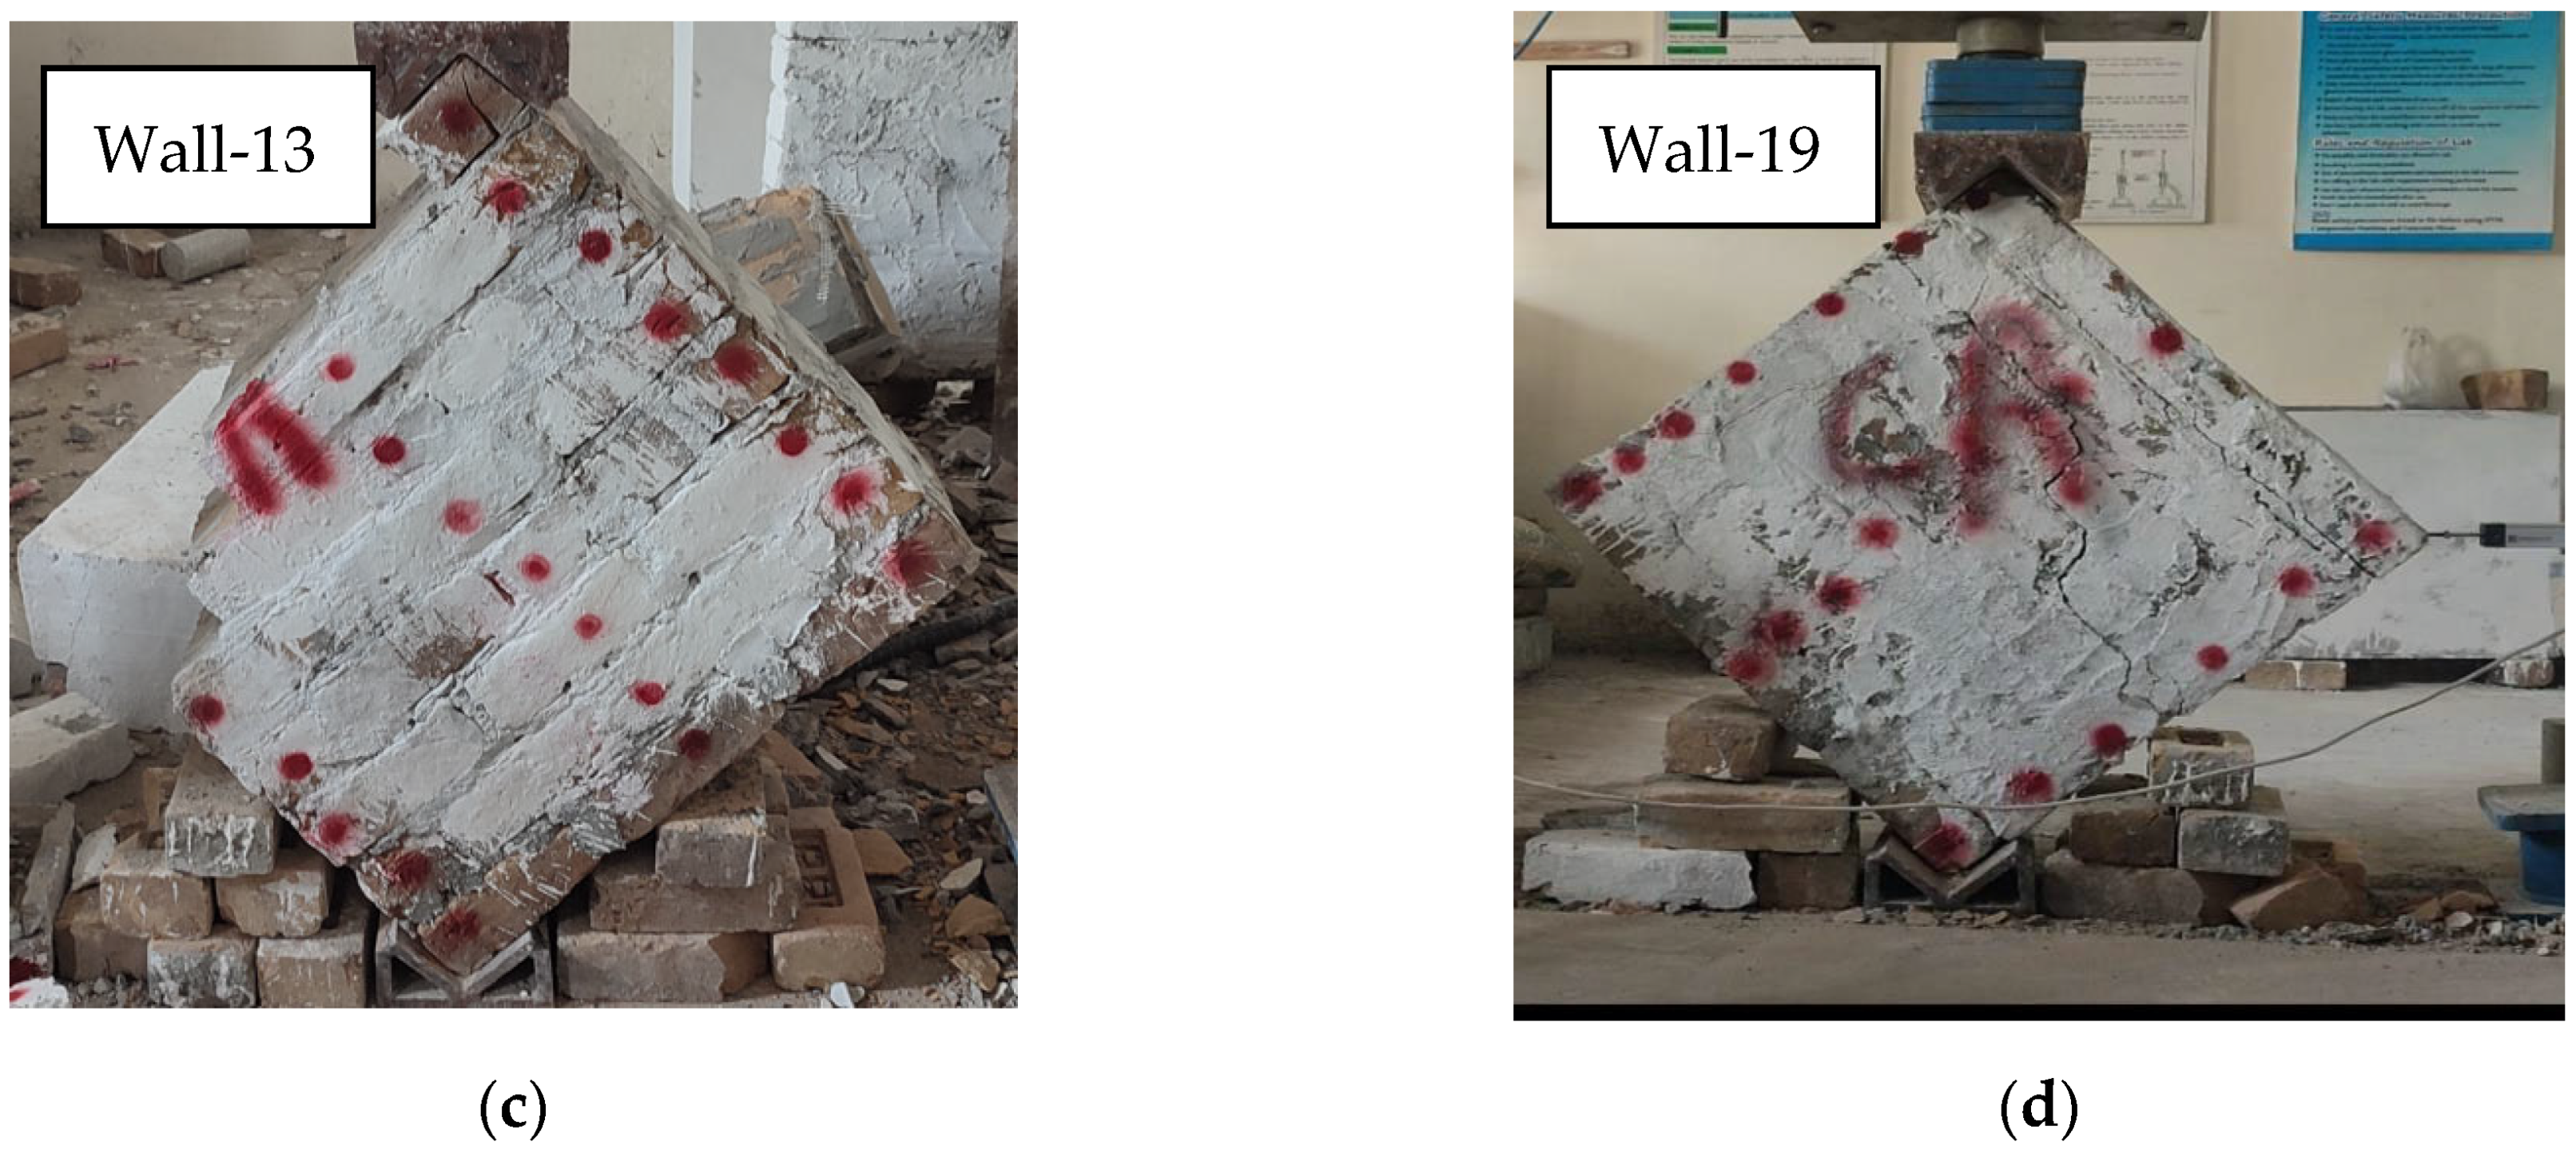
3.1.1. Reference Specimens Without Plaster

The reference specimens W01, W07, W13, and W19 did not incorporate mortar on its sides. However, the walls were painted to ease the marking of cracks. All such walls exhibited brittle failure, both under axial and diagonal loads. Walls W01 (single layer) and W07 (double layer) were subjected to axial loads, demonstrating peak capacities of 151 kN and 356 kN, respectively. In axial loading, the crack occurred parallel to the direction of the applied load, as shown in the failure pattern. Walls W13 and W19 were subjected to diagonal failure loads. These walls also showed a sudden drop in capacity, and the failure was brittle, ascribed to the sudden loss in the bond between the brick courses, as shown in Figure 6c,d.

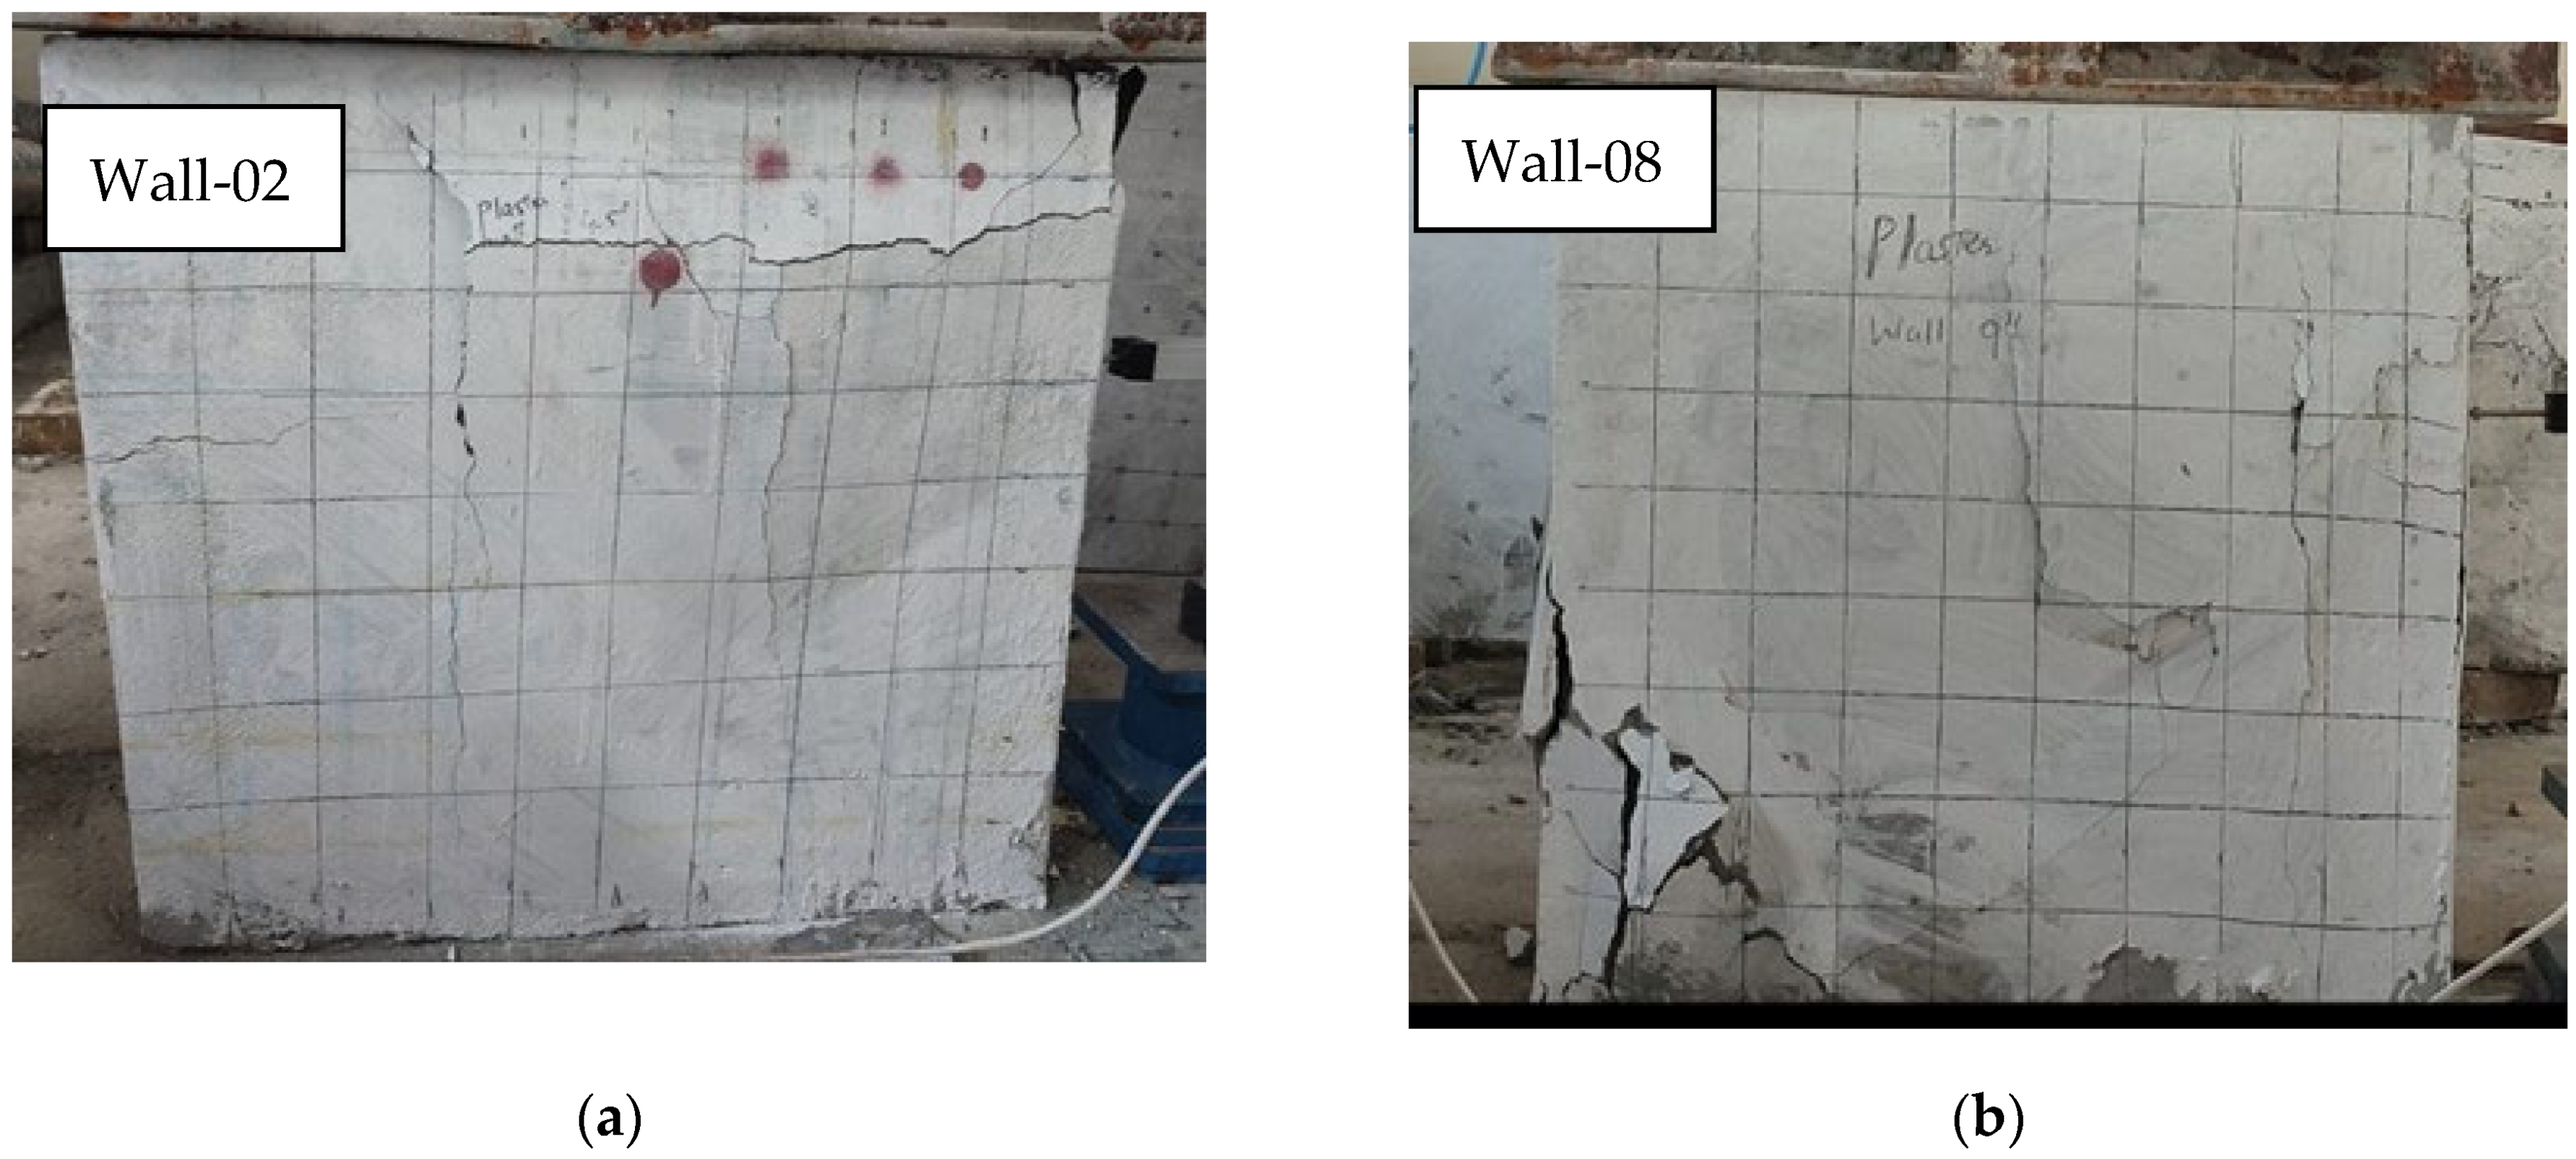
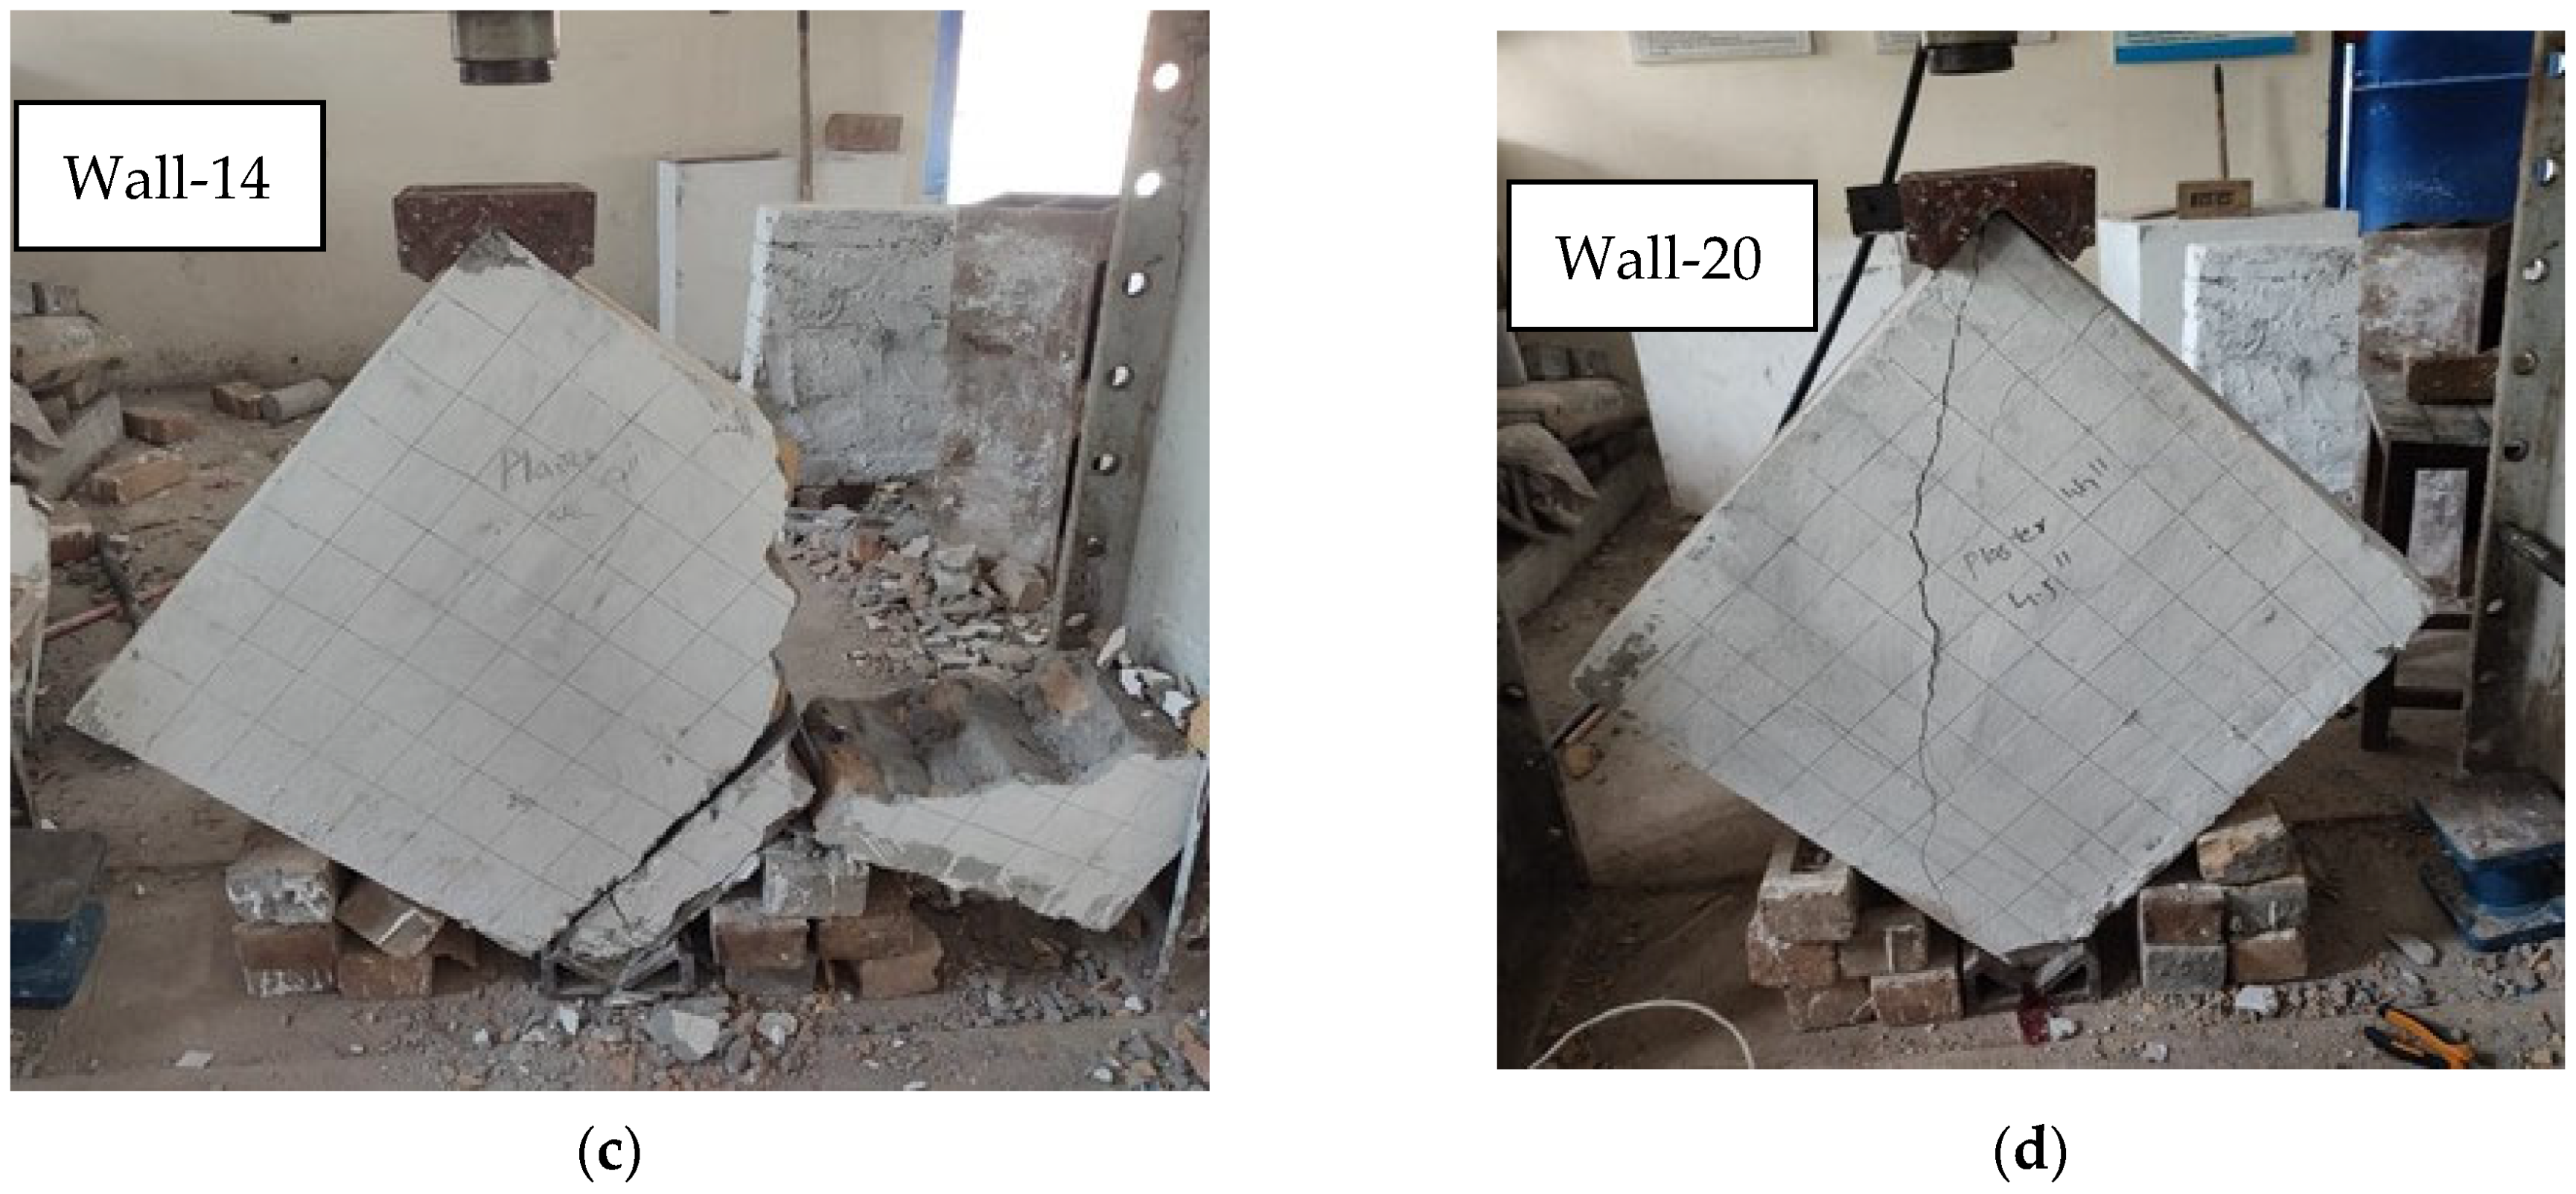
3.1.2. Plastered Specimens

Four walls, W02, W08, W14, and W20, were tested after plastering their sides with cement-sand mortar. Walls W02 (single layer) and W08 (double layer) were tested in compression, whereas diagonal configuration was adopted for walls W14 (single layer) and W20 (double layer), as shown in Figure 7. Under axial load, the cracks appeared parallel to the applied load, as illustrated in the failure pattern (Figure 7a,b). The double-brick wall and single-brick wall withstood total loads of 426 kN and 190 kN, respectively, with corresponding axial deformations of 0.80 mm and 0.52 mm. Under diagonal loading, both single- and double-brick wall configurations developed cracks along a non-diagonal direction due to the load exceeding the tensile strength of the mortar used in the joints, as depicted in Figure 7c,d. The double-brick wall sustained a total load of 178 kN, and the single-brick wall 91 kN, with shear stresses of 1.11 MPa and 1.13 MPa and diagonal deformations of 0.67 mm and 0.47 mm, respectively. Garcia-Ramonda et al. [49] observed similar crack patterns in their study, where they conducted diagonal compressive strength tests on brick wall specimens to determine their shear strength and noted cracks developing both in the diagonal loading direction and along a non-diagonal direction. In wall W08, there was some compression failure at the bottom (left), which could have been due to the uneven surface and or uneven loading plate (Figure 7b). Further, in wall W14, there was failure at the right edge, which mainly occurred due to splitting cracks near the bottom shoe plate. This could be associated with un-even loading setup as well.

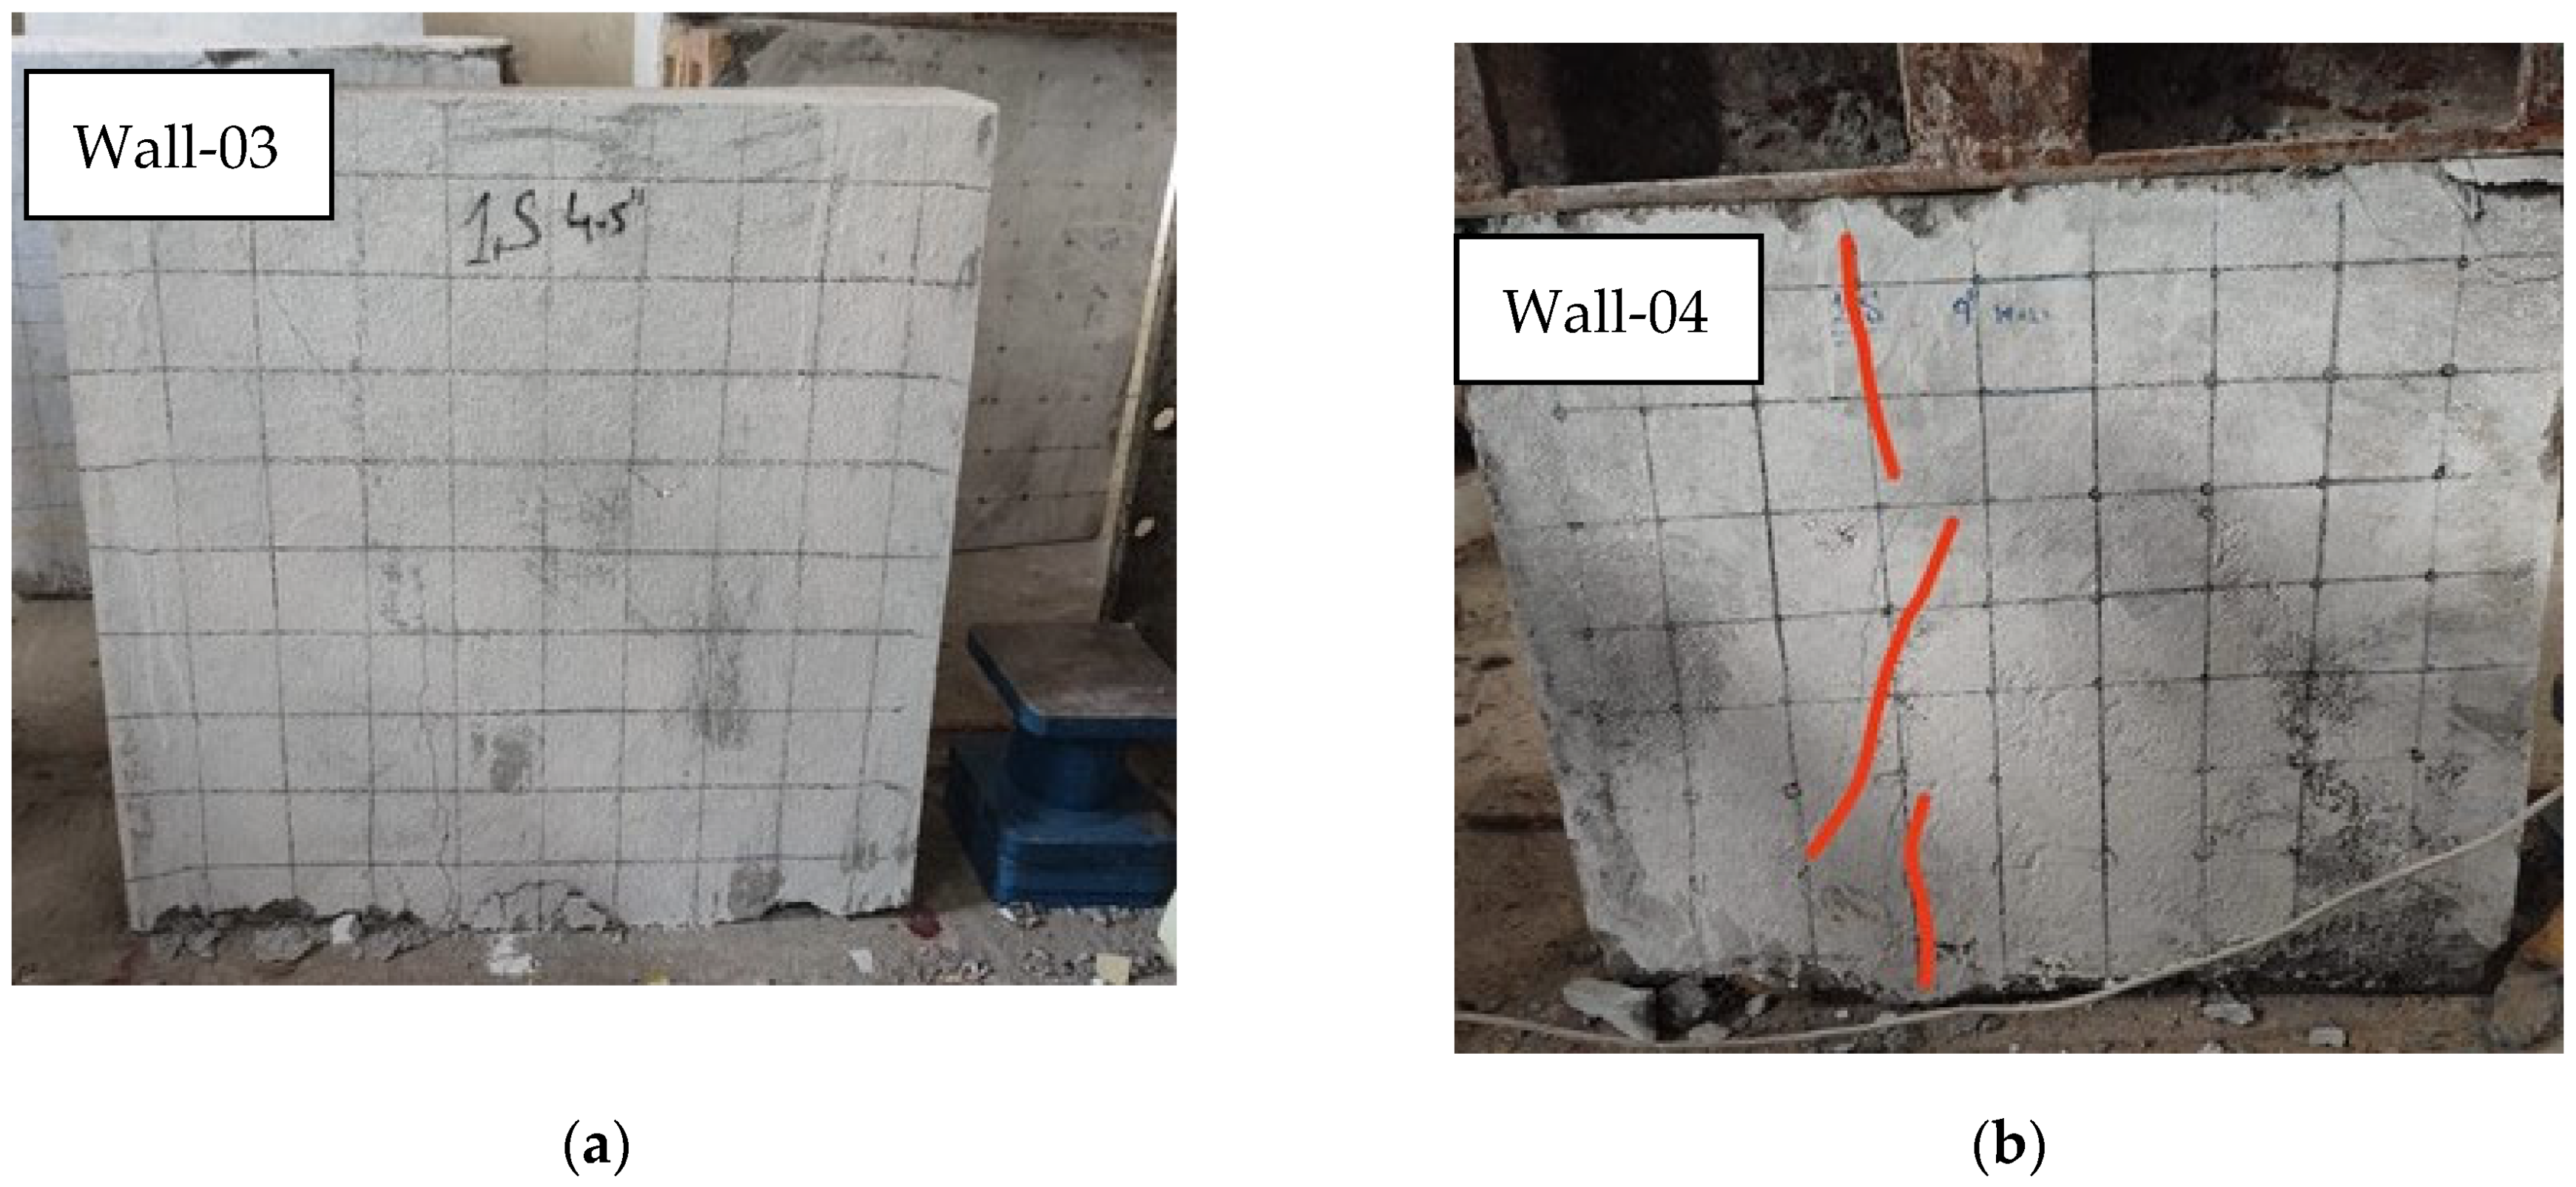
3.1.3. Walls Strengthened with Steel Mesh Under Axial Load

In the axial load test, double-brick and single-brick walls were reinforced with double-layer steel mesh (2S) or single-layer steel mesh (1S). Walls W03 and W04 comprised single bricks, whereas walls W09 and W10 comprised double-brick layers. Walls W03 and W09 were strengthened with single steel mesh (1S), whereas a double steel mesh (2S) was adopted for walls W04 and W10. The wall specimens developed vertical cracks parallel to the applied load. The primary failure mode was aligned with the direction of the applied load and shear, with further failures resulting from the splitting and crushing of the bricks in the loading region. Vertical splitting failure, due to the different strain characteristics of mortar joints and bricks, was observed, as illustrated in Figure 8. The total loads carried by the double-brick walls with 2S (W10) and 1S (W09) reinforcement were 618 kN and 494 kN, corresponding to compressive strengths of 3.84 MPa and 3.07 MPa, with axial deformations of 2.17 mm and 1.18 mm, respectively. Similarly, the single-brick walls with 2S (W04) and 1S (W03) reinforcement carried loads of 321 kN and 256 kN, with compressive strengths of 3.99 MPa and 3.18 MPa and axial deformations of 2.1 mm and 1.75 mm, respectively.

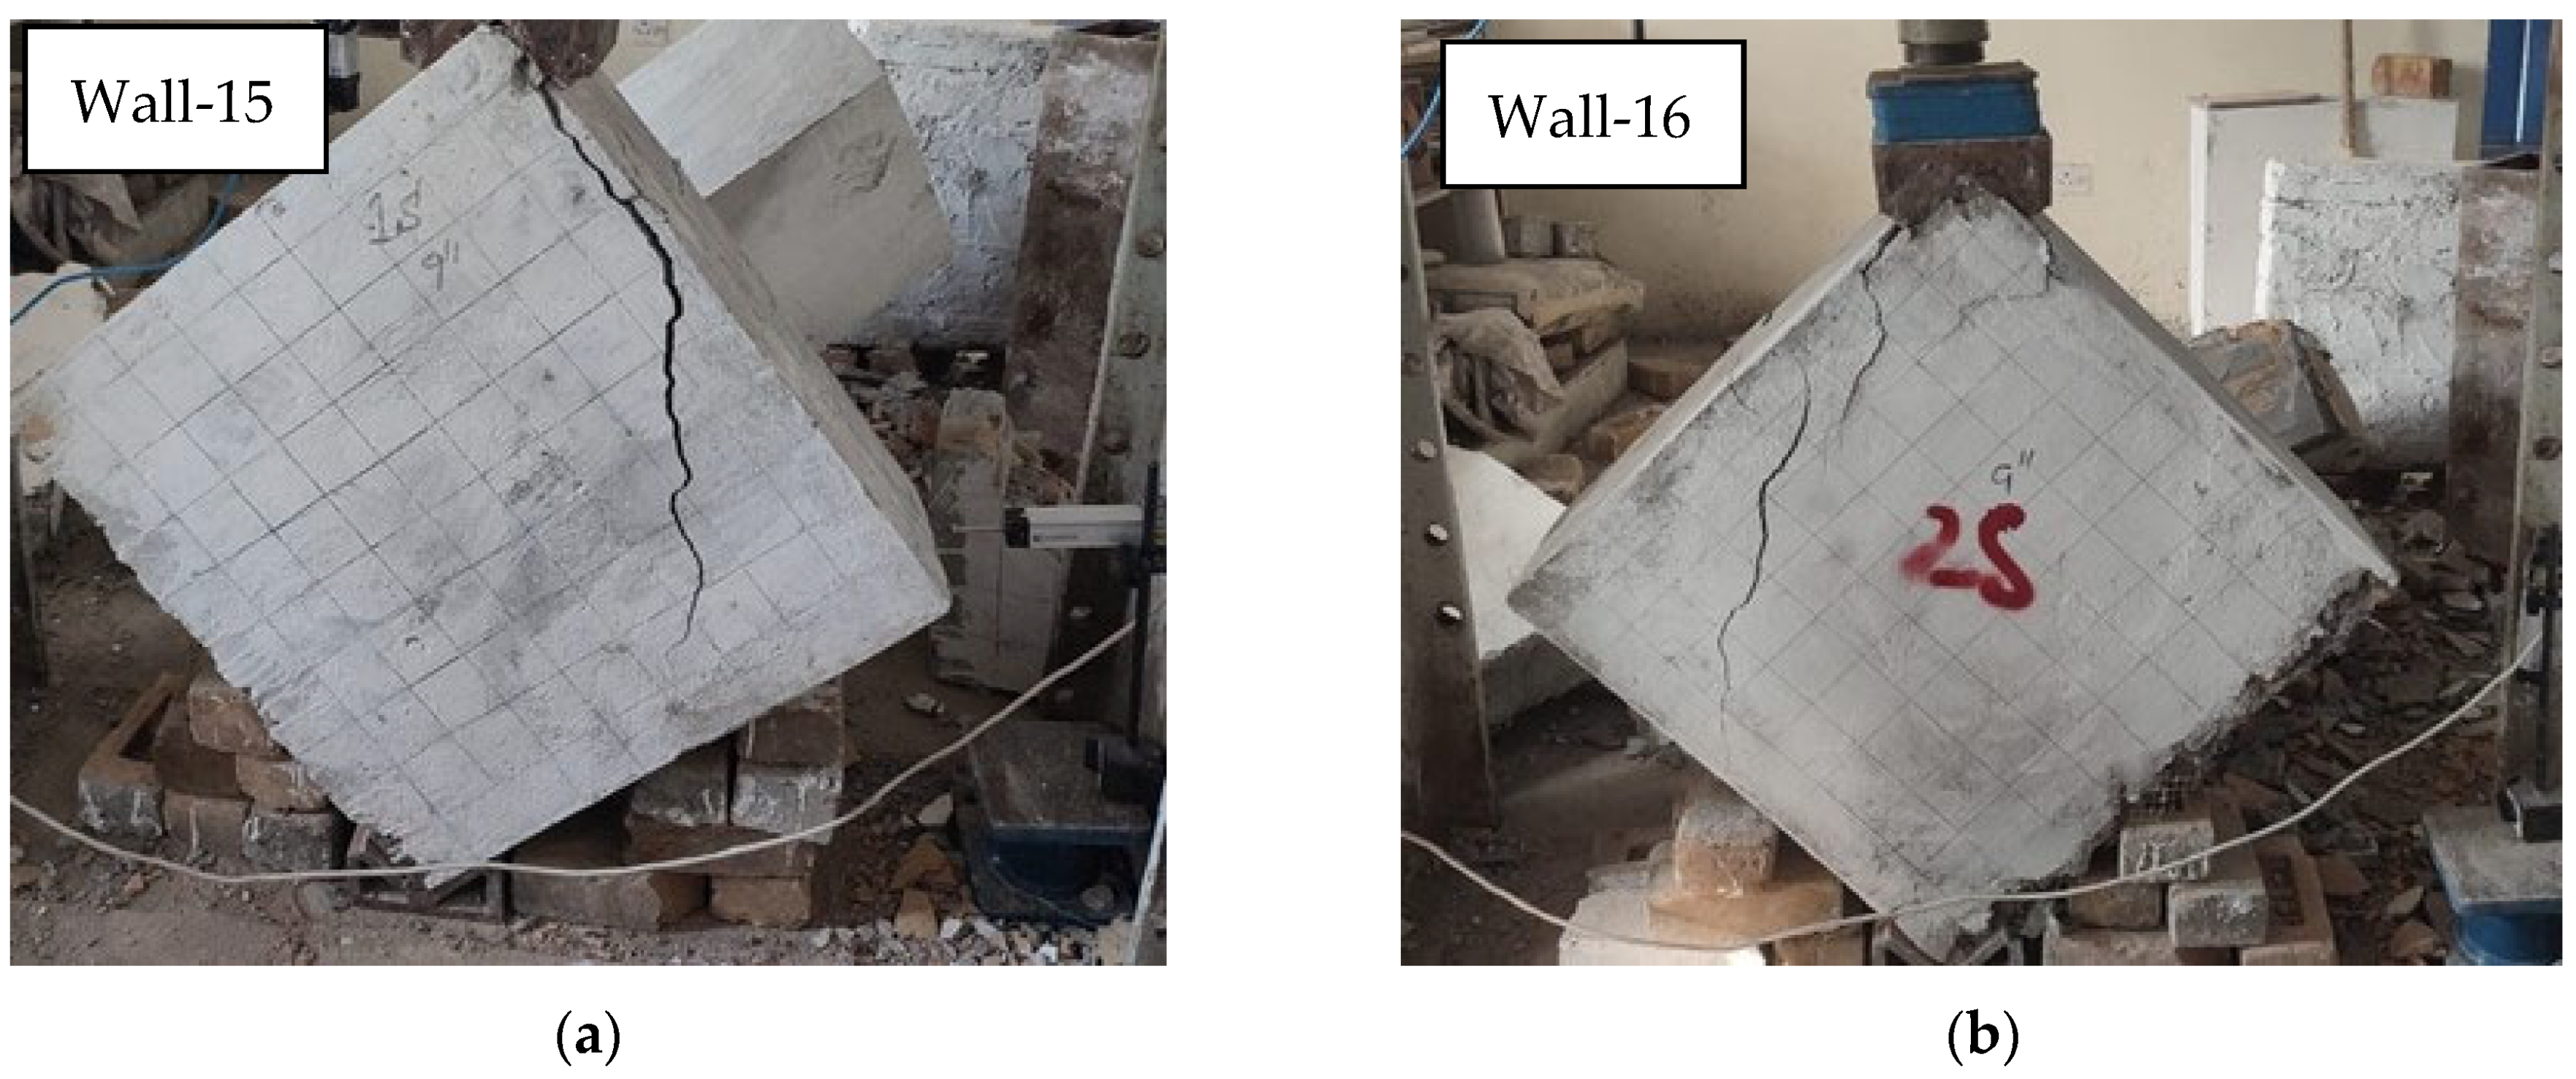
3.1.4. Walls Strengthened with Steel Mesh Under Diagonal Load

Walls W15 and W16 comprised single bricks, whereas walls W21 and W22 comprised double bricks. Walls W15 and W21 were strengthened with single steel mesh (1S), whereas a double steel mesh (2S) was adopted for walls W16 and W22. All these walls exhibited minor visible cracks before failure. The steel mesh reinforcement demonstrated ductile behavior, with cracks forming along the loading direction, as expected in diagonal compression testing, as shown in Figure 9. When the applied load exceeded the mesh’s capacity, the anchor nodes transmitted the stresses to the mesh, leading to the wires beginning to break. The double-brick walls reinforced with 2S (W22) and 1S (W21) mesh carried total loads of 330 kN and 270 kN, corresponding to shear strengths of 2.05 MPa and 1.68 MPa, with axial deformations of 2.11 mm and 1.17 mm, respectively. Similarly, the single-brick walls with 2S (W16) and 1S (W15) mesh carried loads of 182 kN and 135 kN, with shear strengths of 2.26 MPa and 1.68 MPa and axial deformations of 1.49 mm and 1.03 mm, respectively.

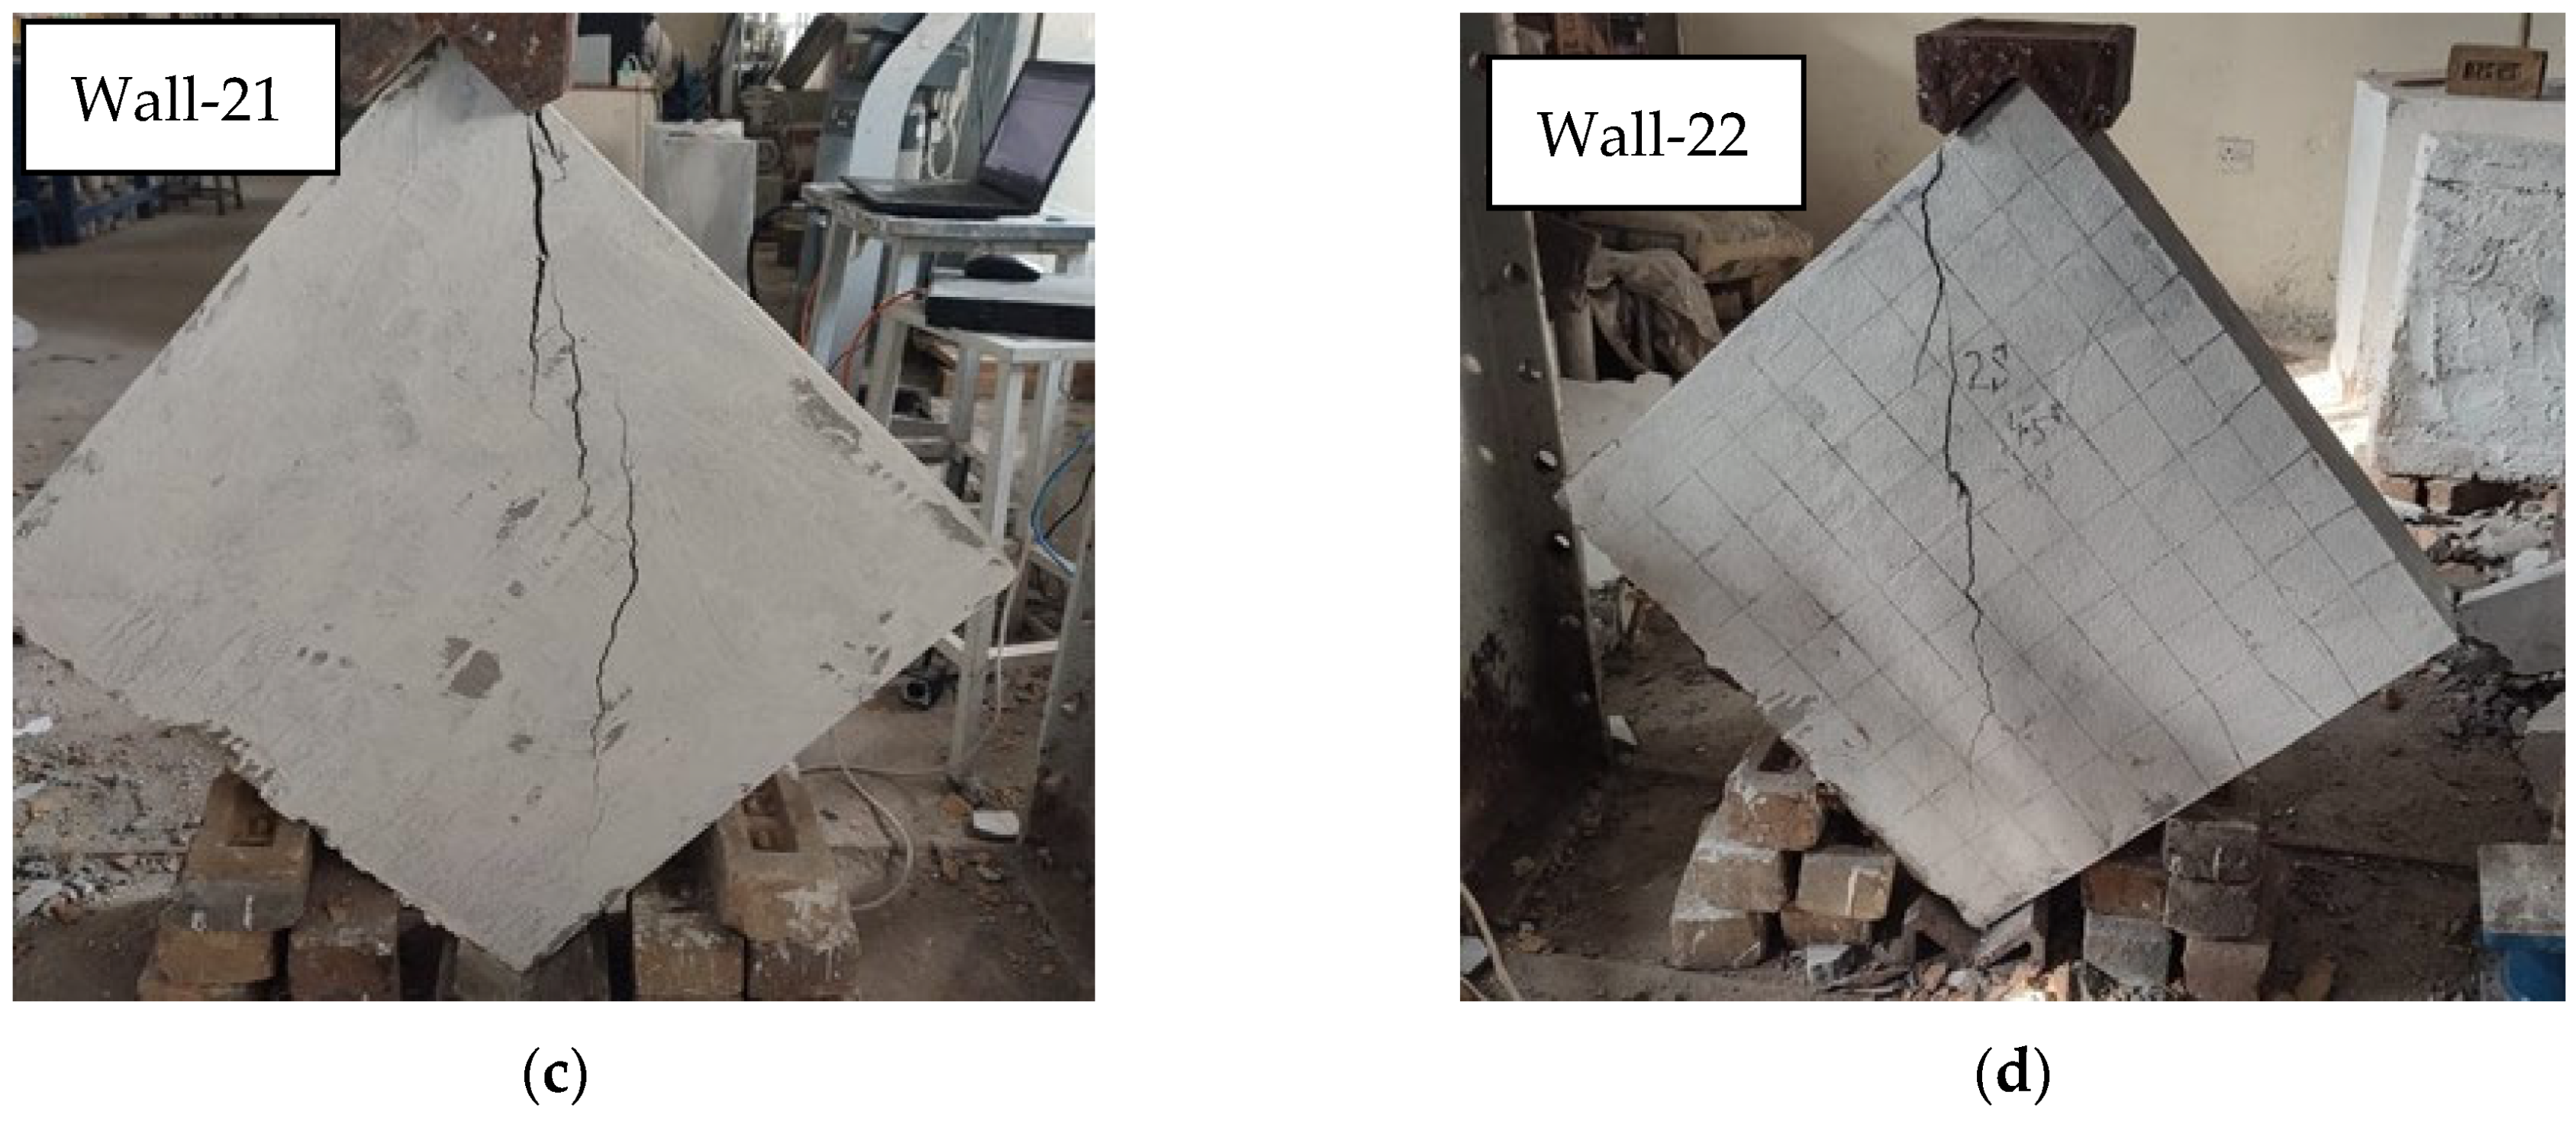
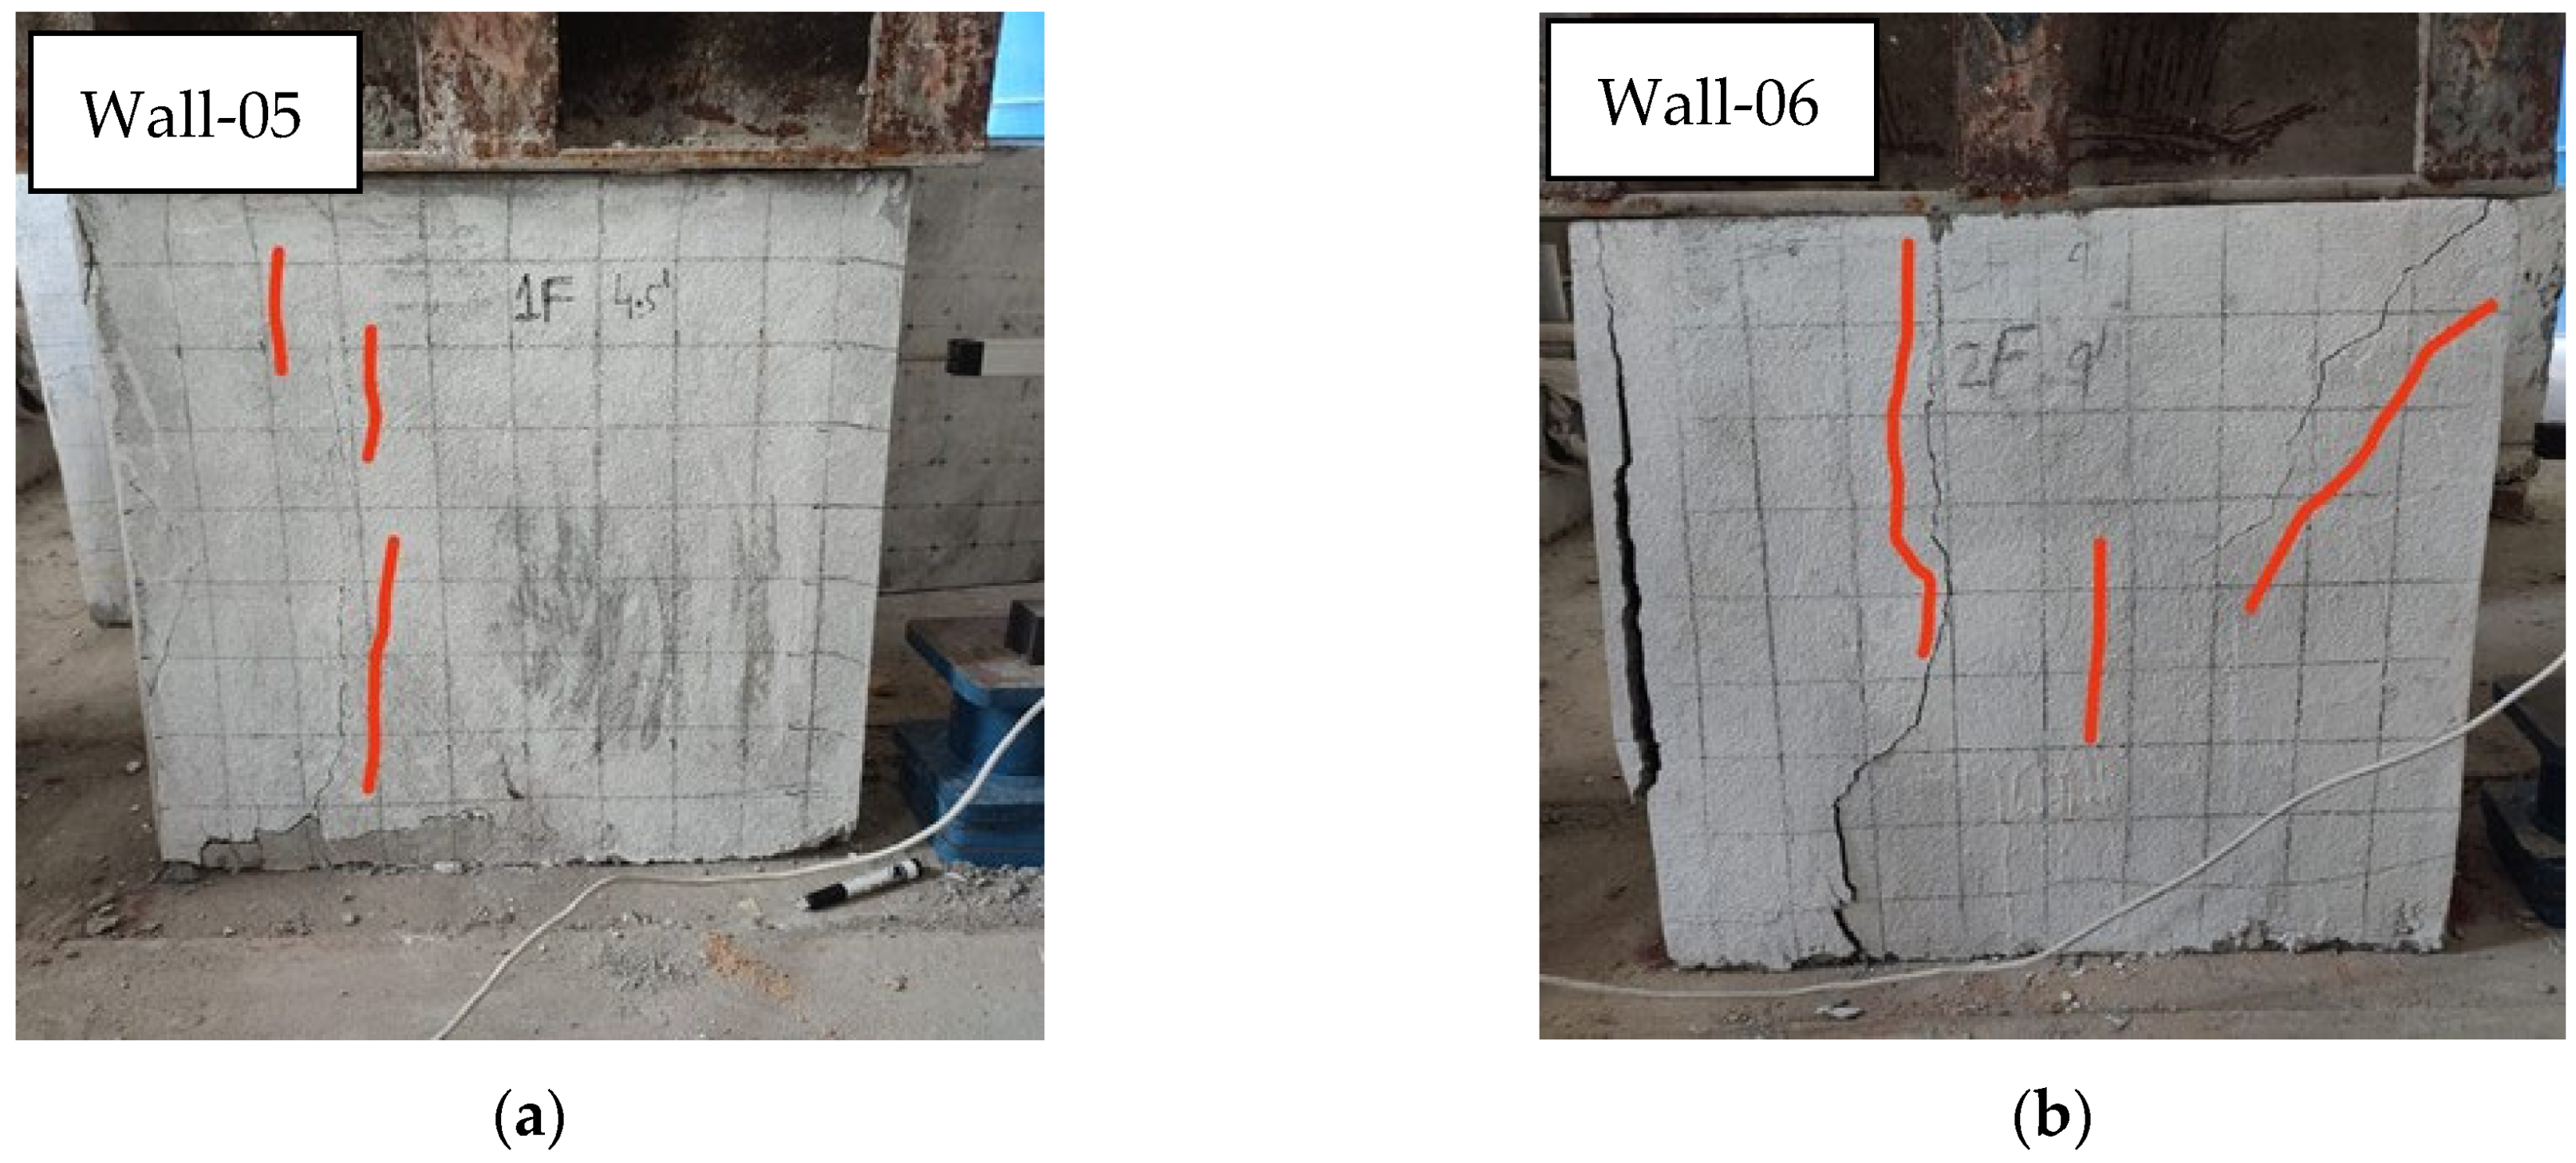
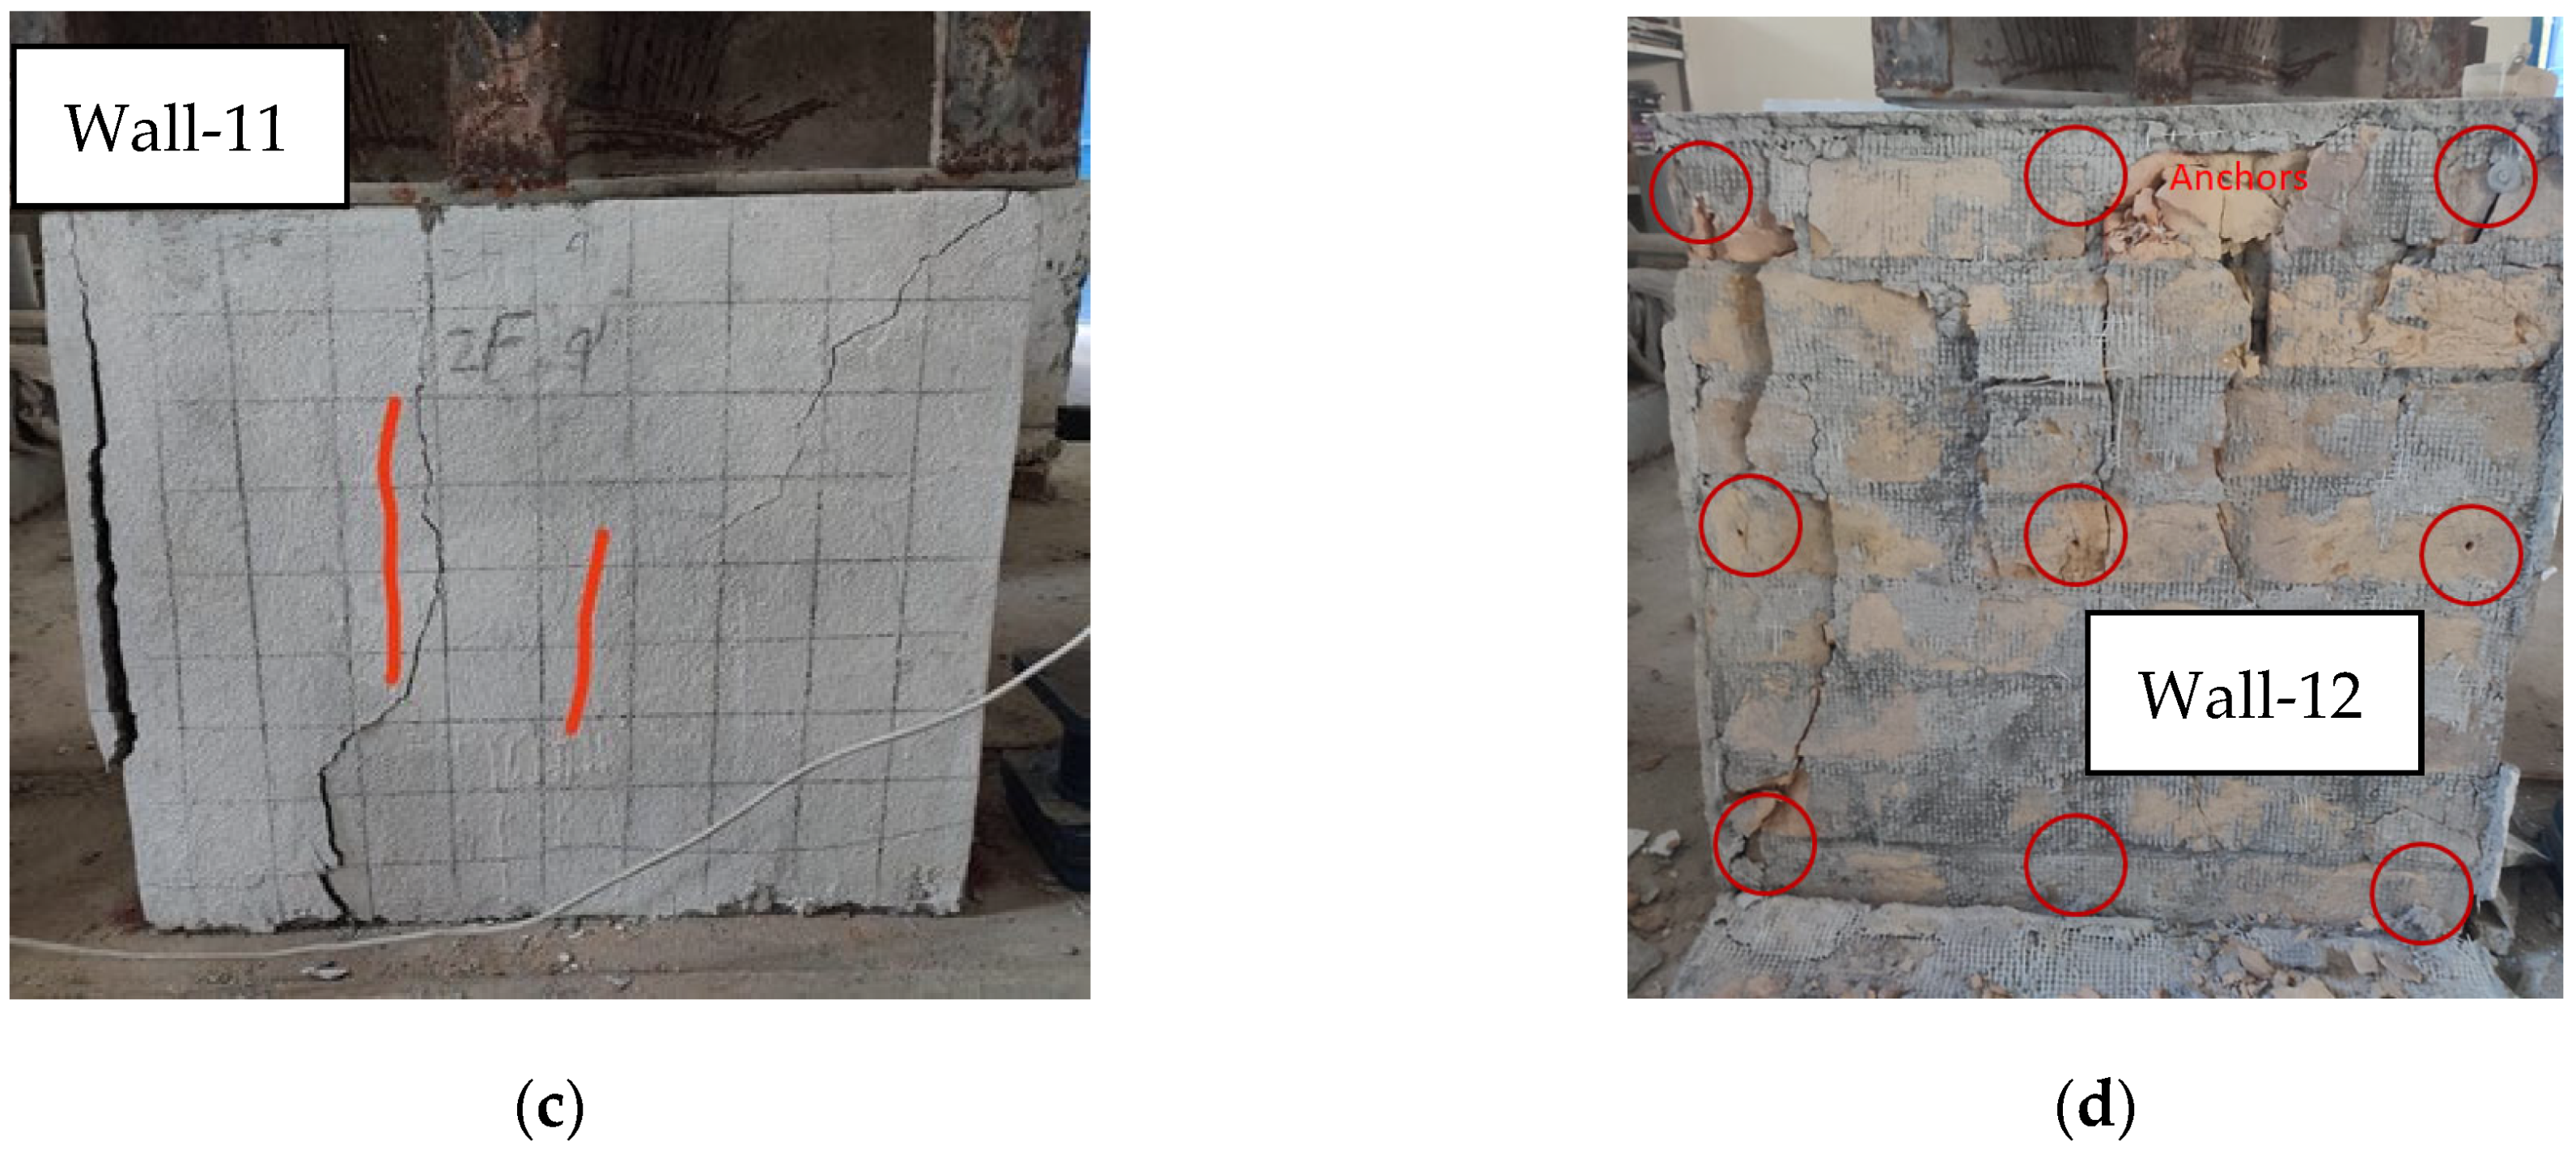
3.1.5. Walls Strengthened with Fiberglass Mesh Under Axial Load

Walls W05 and W06 comprised single bricks, whereas walls W11 and W12 comprised double bricks. Walls W05 and W11 were strengthened with single fiberglass mesh (1F), whereas a double fiberglass mesh (2F) was adopted for walls W06 and W12. The wall specimens exhibited vertical cracks parallel to the applied load under axial compression. The primary failure mode involved bond failure and brick crushing in the direction of the applied load, as shown in Figure 10. The double-brick walls reinforced with 2F (W12) and 1F (W11) mesh carried total loads of 511 kN and 467 kN, corresponding to compressive strengths of 3.17 MPa and 2.90 MPa, with axial deformations of 1.60 mm and 0.92 mm, respectively. Similarly, the single-brick walls with 2F (W06) and 1F (W05) mesh carried loads of 272 kN and 239 kN, with compressive strengths of 3.38 MPa and 2.97 MPa and axial deformations of 1.81 mm and 0.96 mm, respectively. Double-layer steel mesh significantly increased the compressive strength of both single- and double-brick walls. This was due to the increased load distribution and resistance provided by the additional mesh layer. In wall W12, slight crushing was observed at the top (right), which could be due to the uneven loading plate. Further, the pull-out failure of anchors was observed at different locations due to splitting cracks in the bricks.

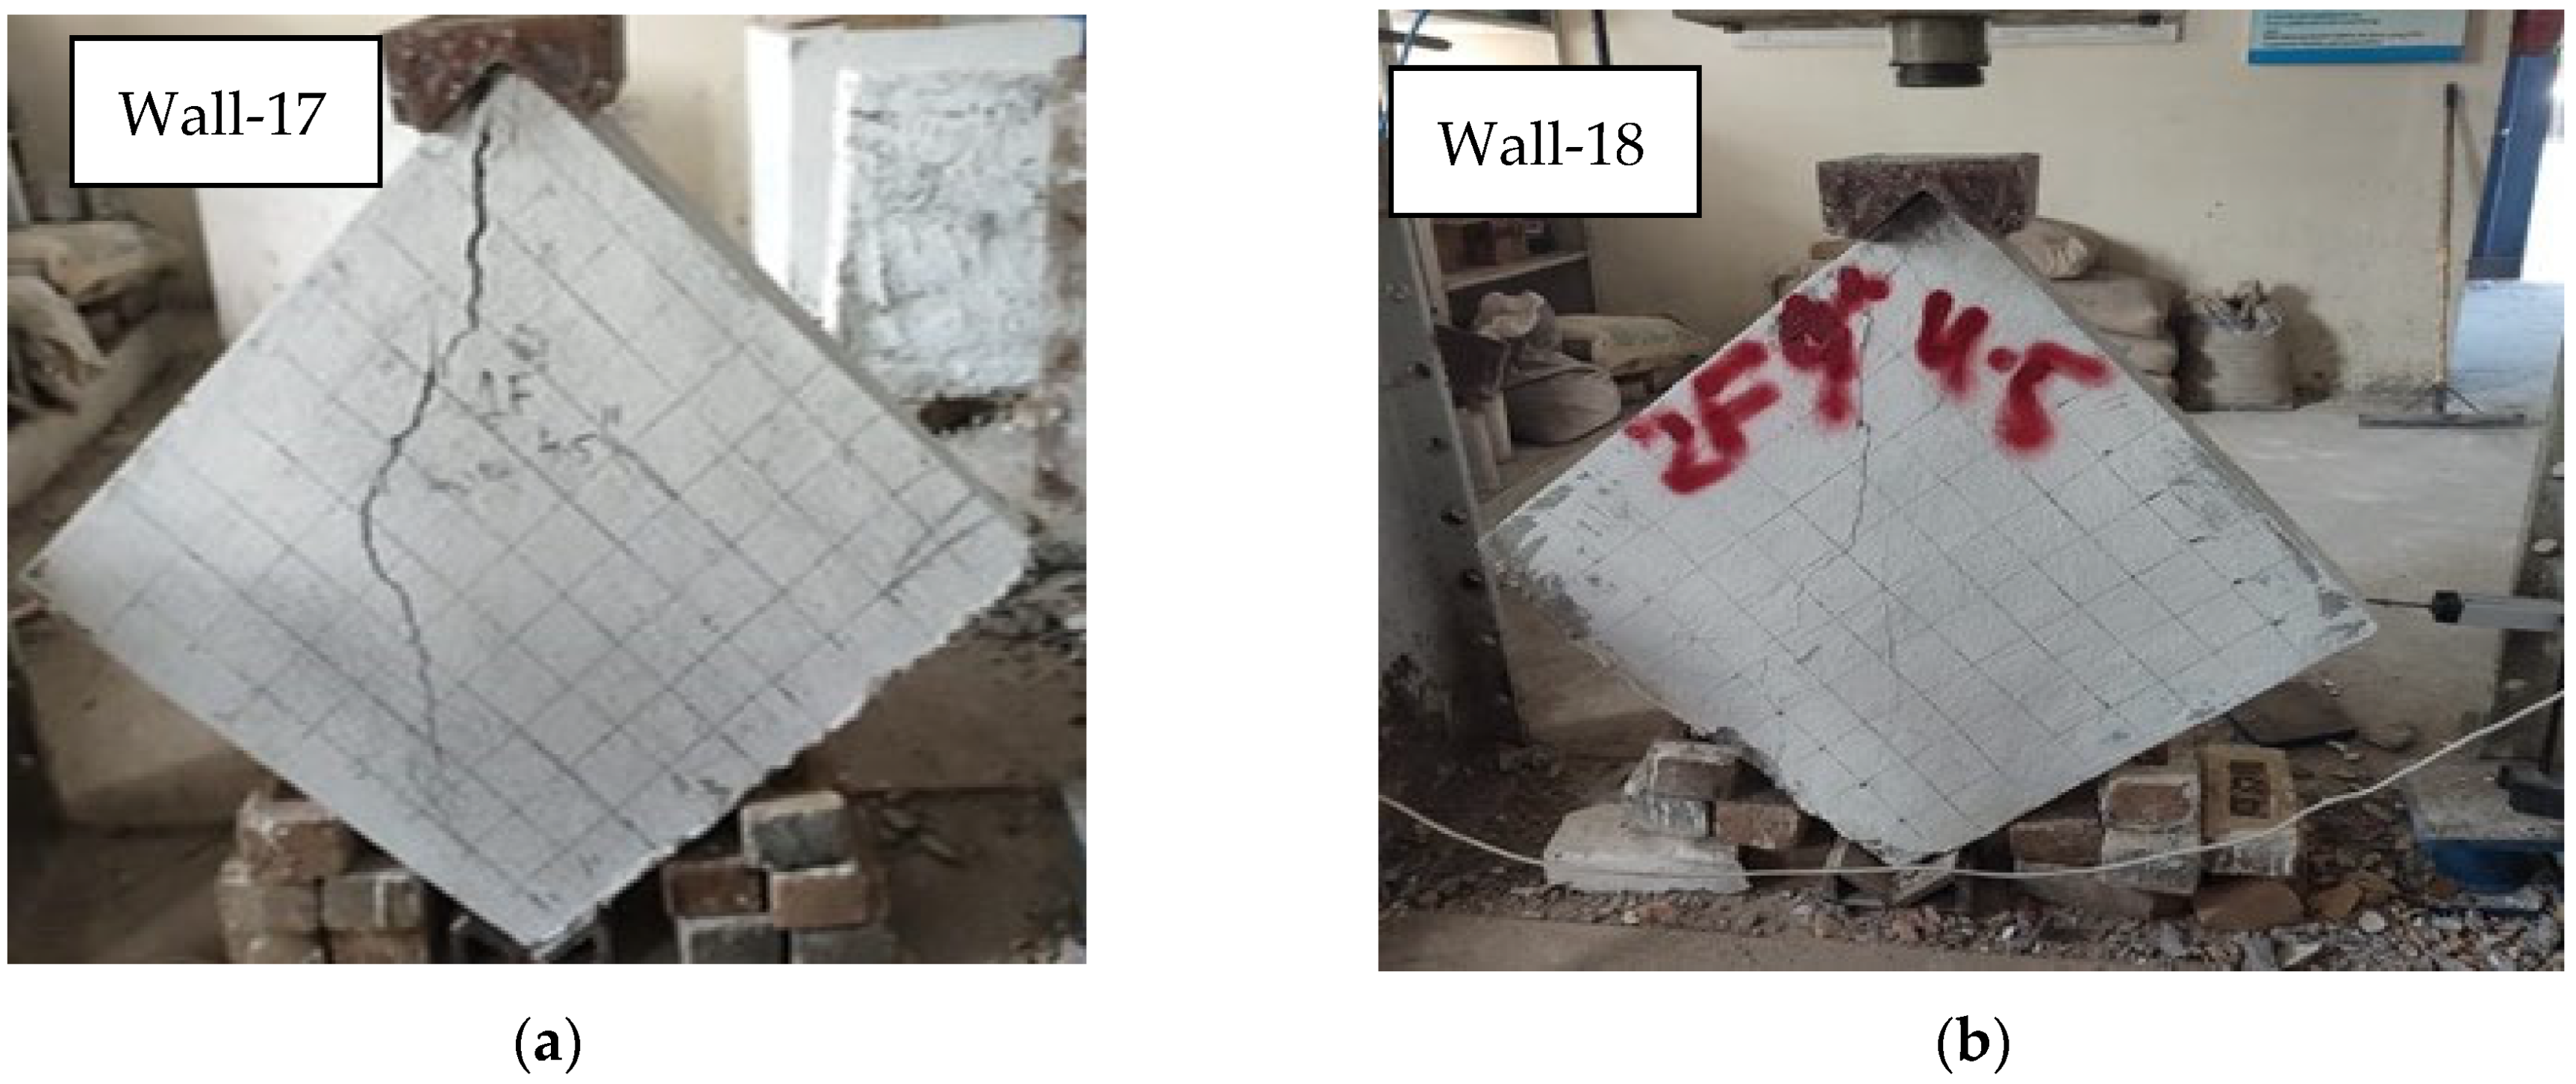
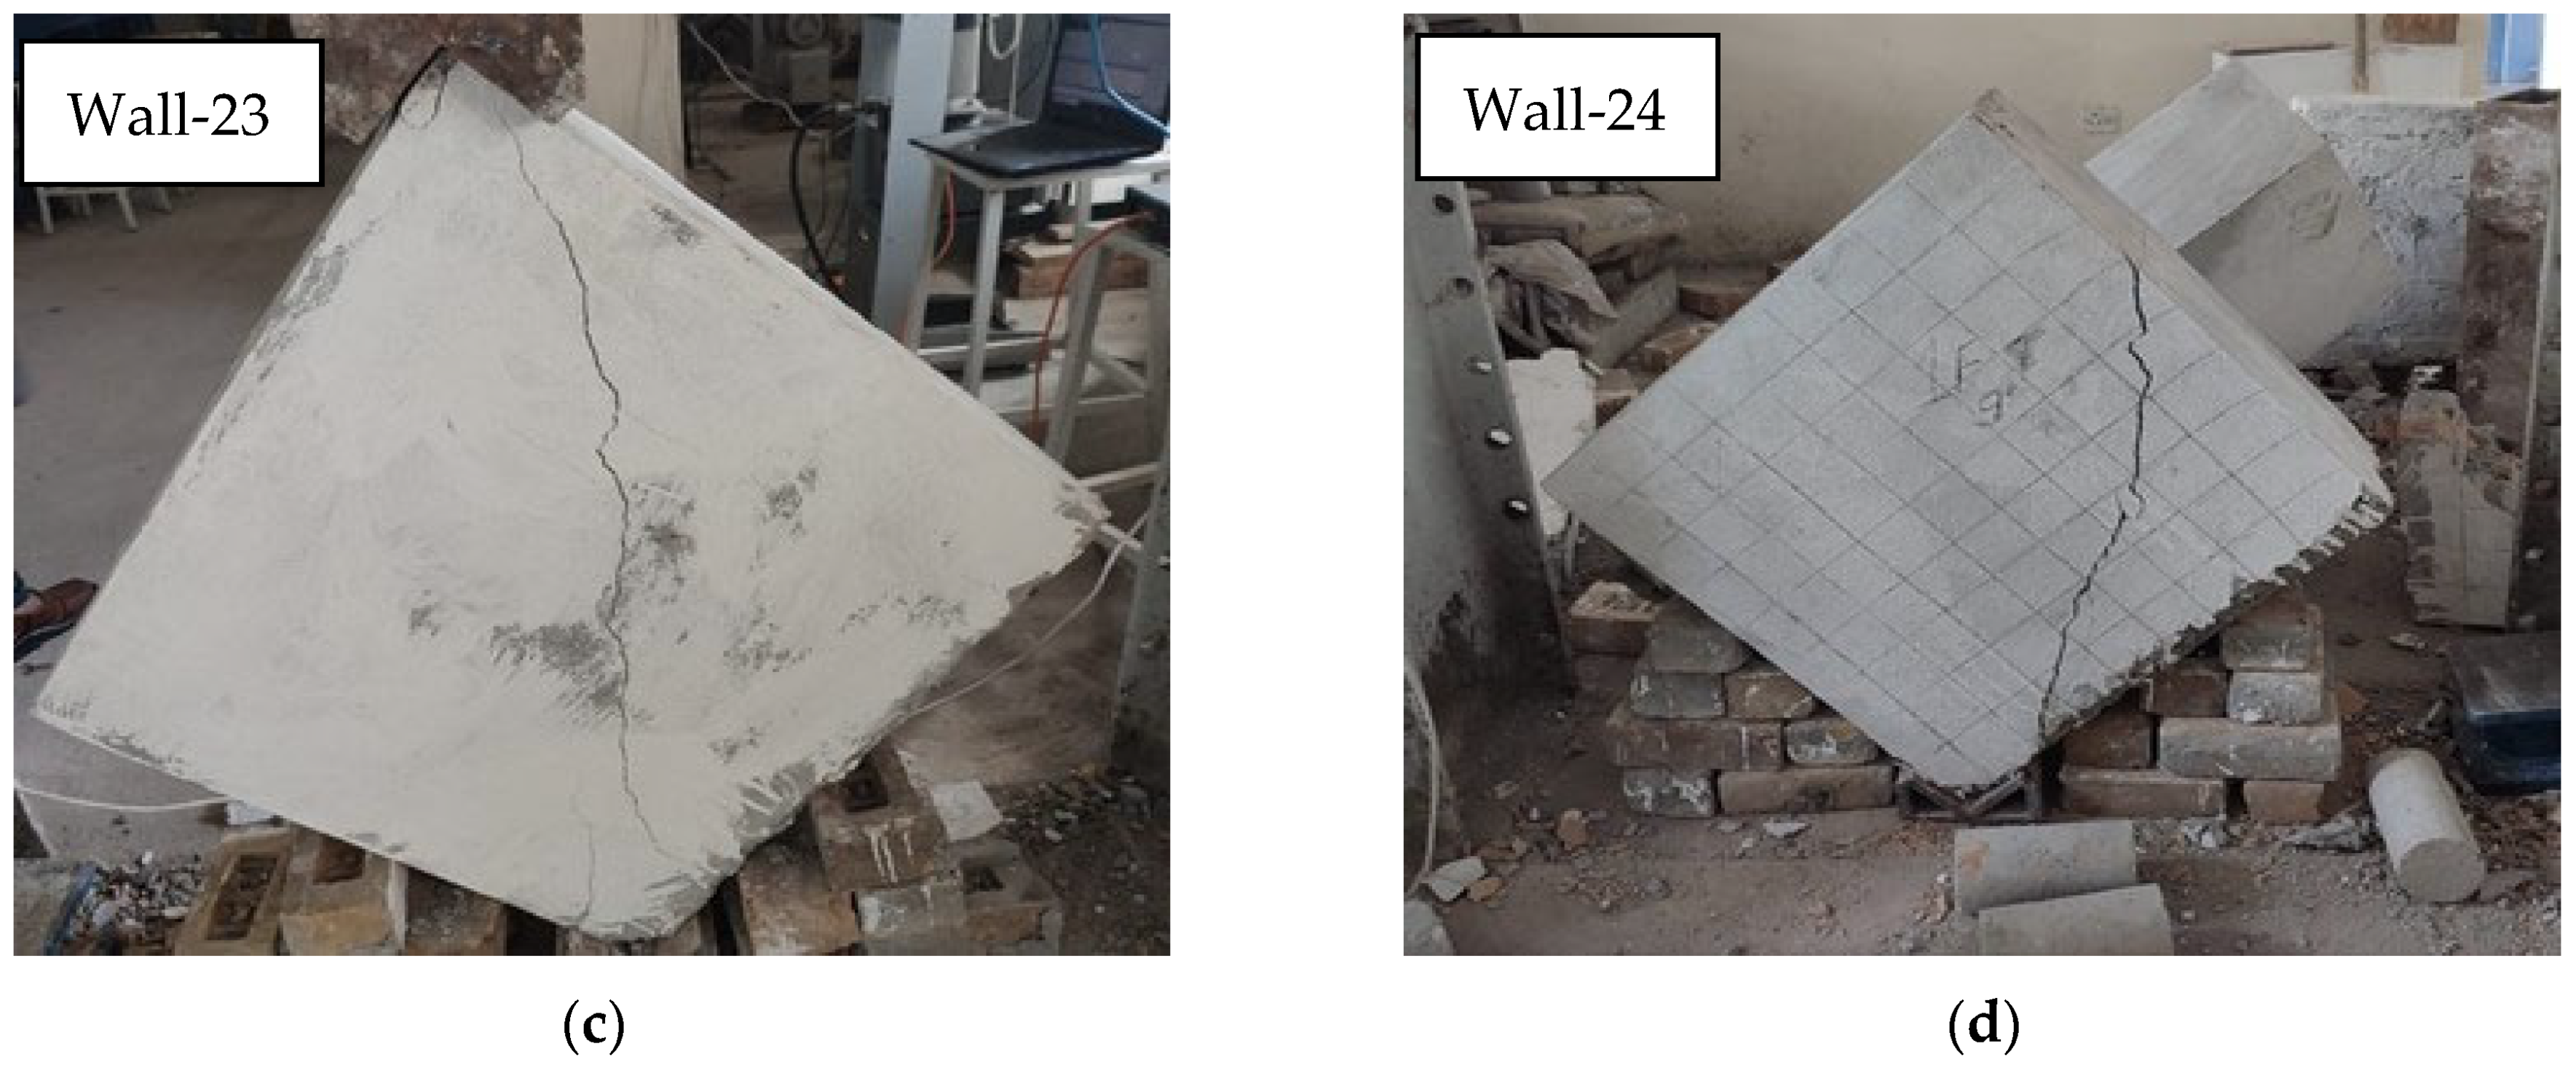
3.1.6. Walls Strengthened with Fiberglass Mesh Under Diagonal Load

Walls W17 and W18 comprised single bricks, whereas walls W23 and W24 comprised double bricks. Walls W17 and W23 were strengthened with single fiberglass mesh (1F), whereas a double fiberglass mesh (2F) was adopted for walls W18 and W24. The fiberglass mesh demonstrated less ductility compared to the steel mesh. All the fiberglass-reinforced specimens experienced similar shear failures, as shown in Figure 11. The fiberglass mesh yielded and was severed after excessive deformation at the crack locations by the end of the test. The double-brick walls reinforced with 2F (W24) and 1F (W23) mesh carried total loads of 292 kN and 240 kN, corresponding to shear strengths of 1.81 MPa and 1.49 MPa, with deformations of 1.49 mm and 0.87 mm, respectively. Similarly, the single-brick walls with 2F (W18) and 1F (W17) mesh carried loads of 157 kN and 122 kN, with shear strengths of 1.95 MPa and 1.52 MPa and deformations of 1.1 mm and 0.94 mm, respectively. The 1F-reinforced double-brick wall failed against a non-diagonal load, likely due to improper centering, as shown in Figure 11c,d.

3.2. Peak Capacity and Load vs. Deflection Curves

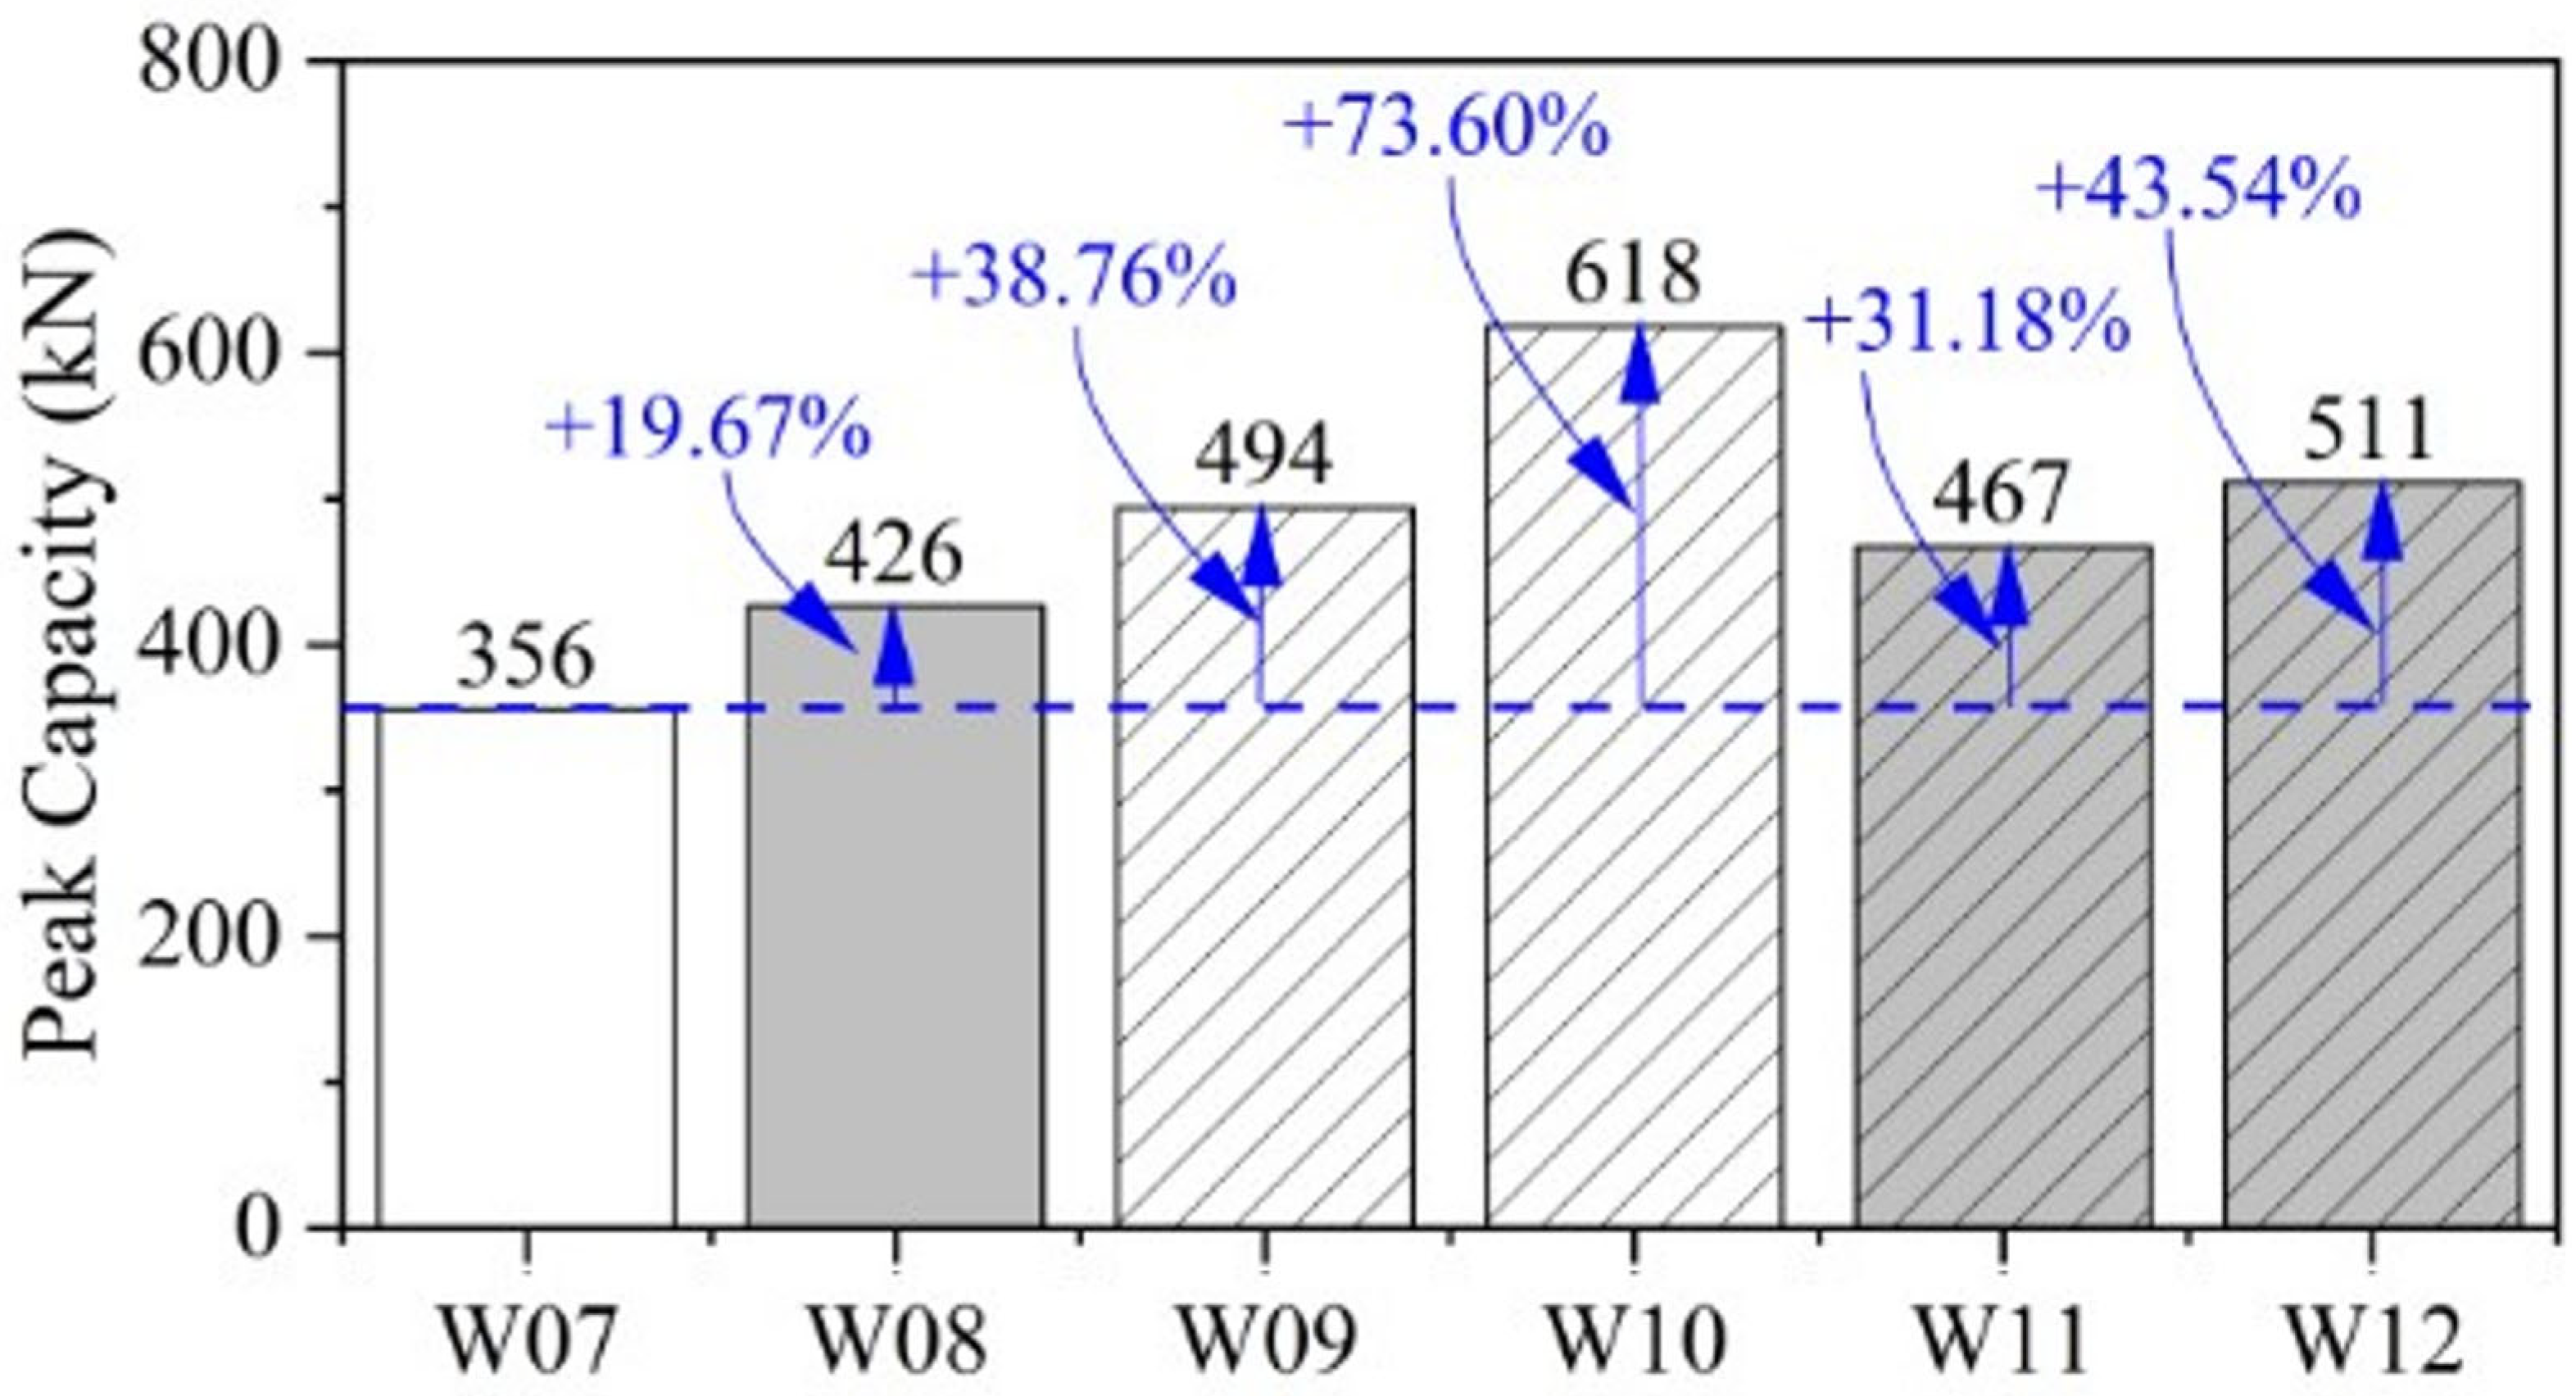
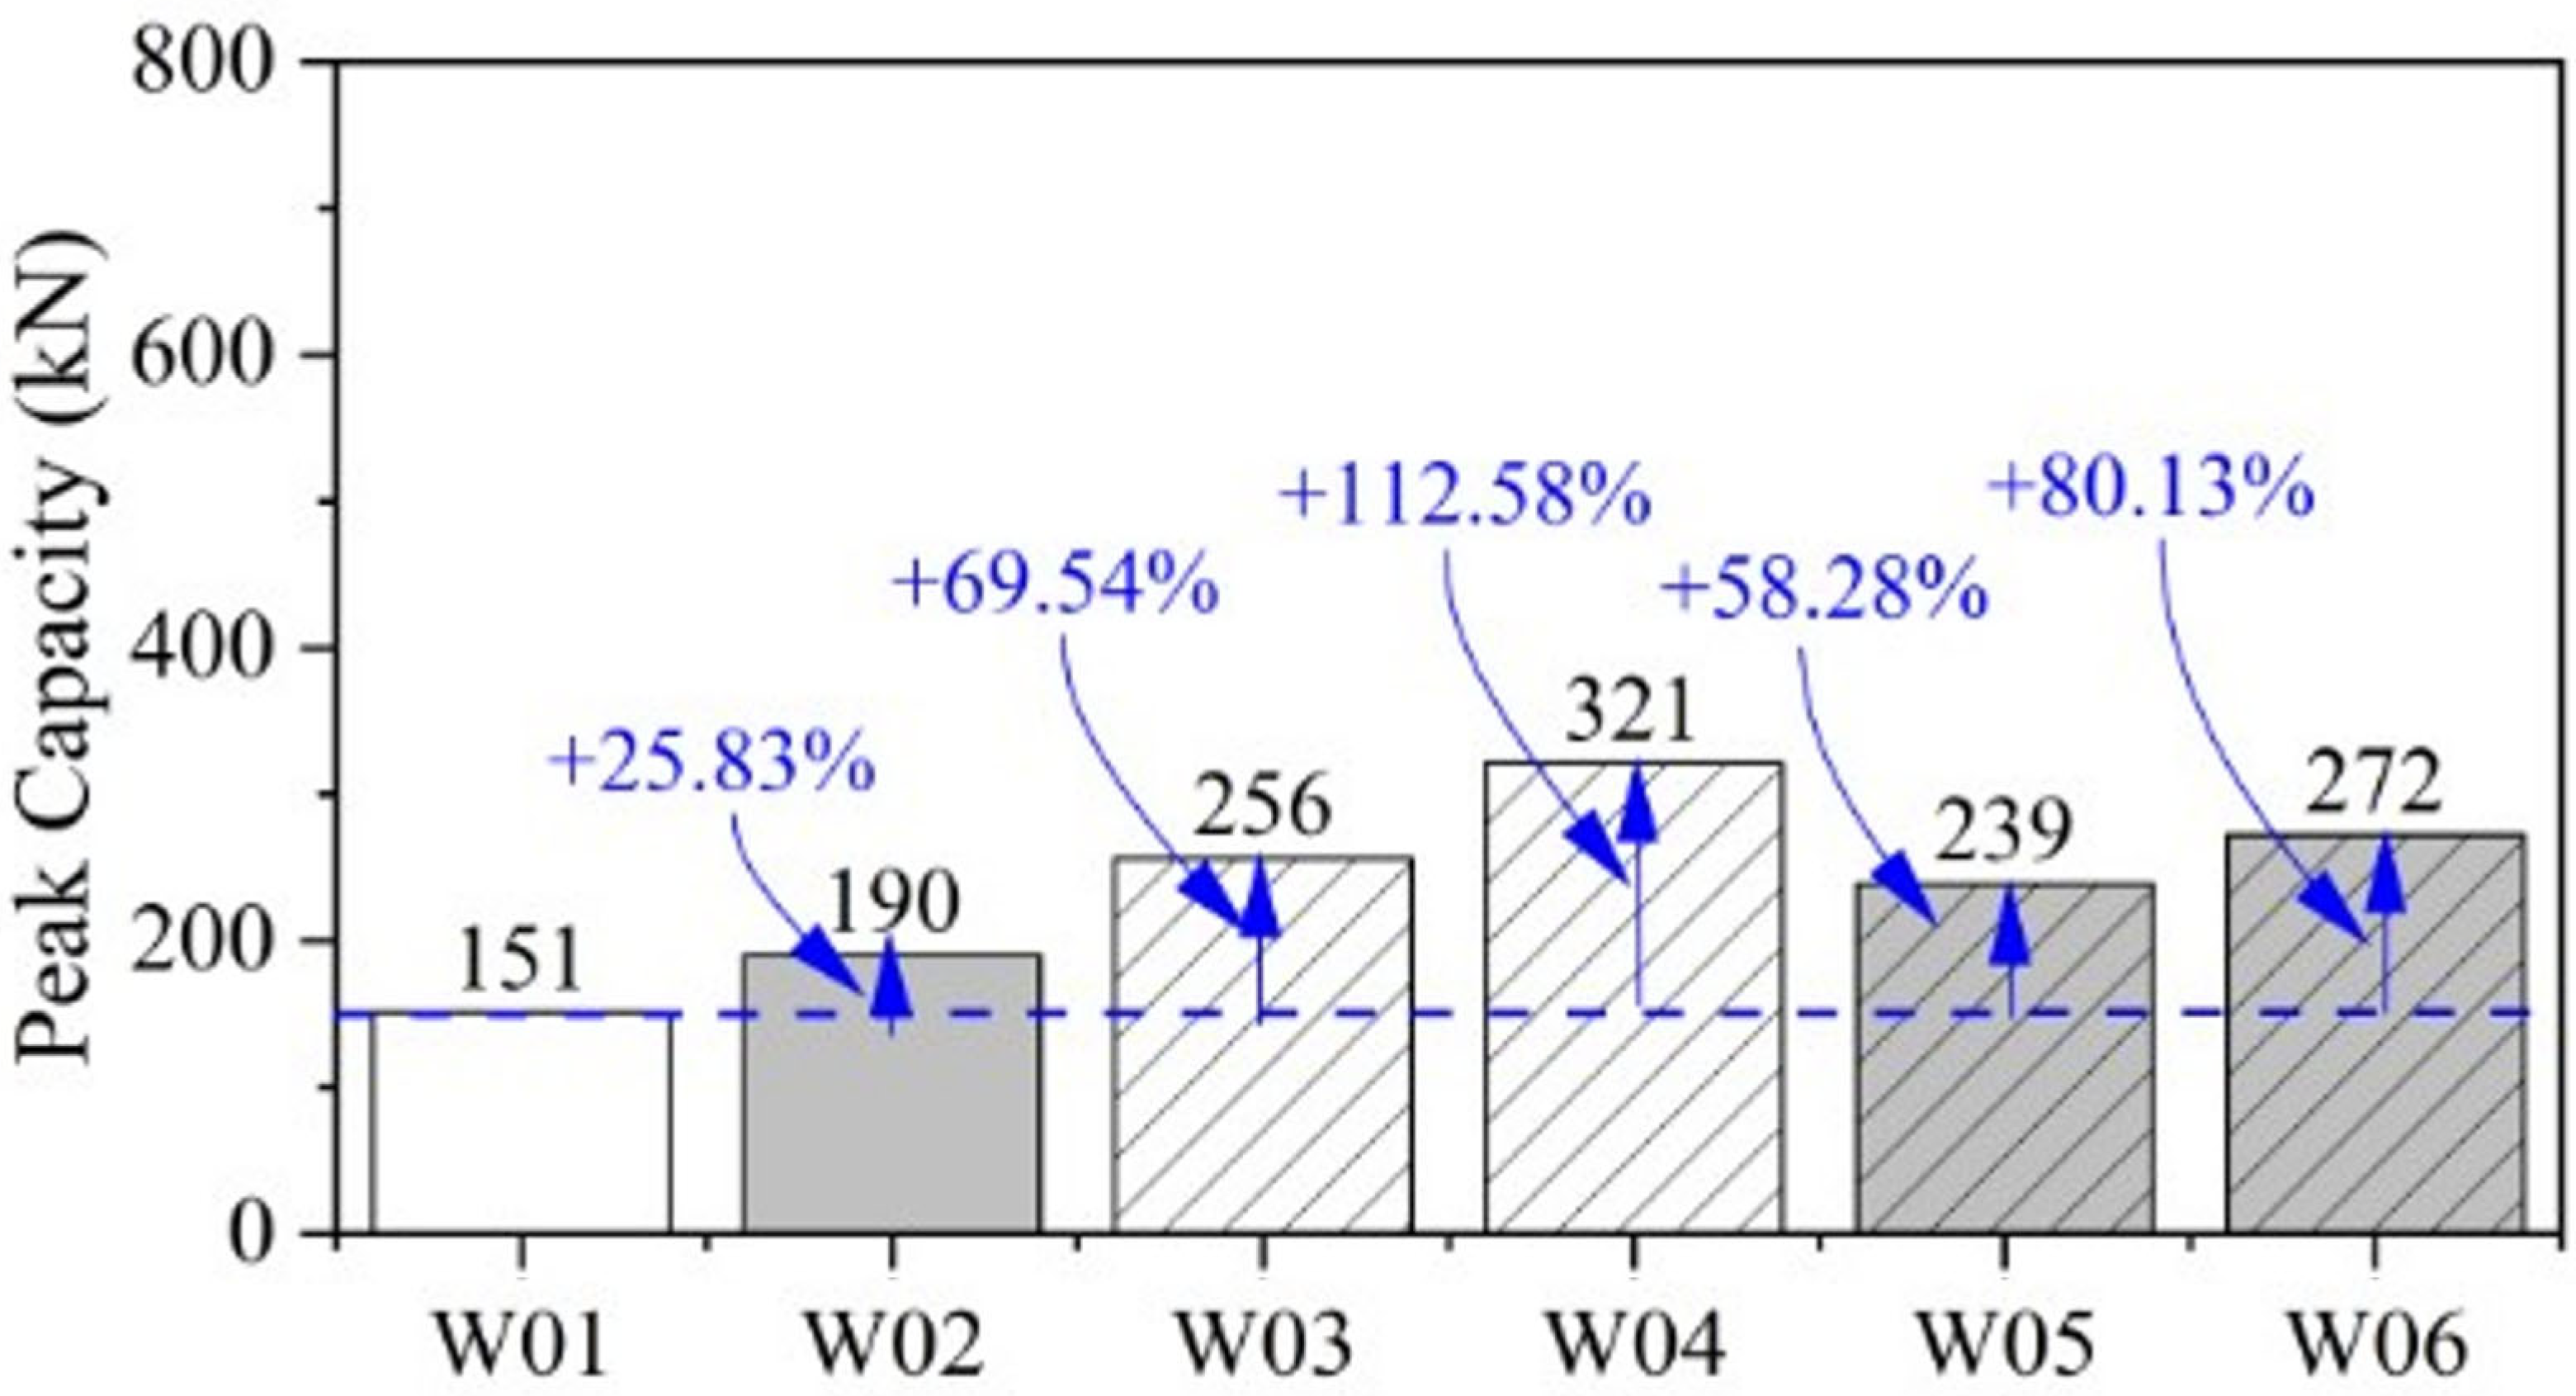
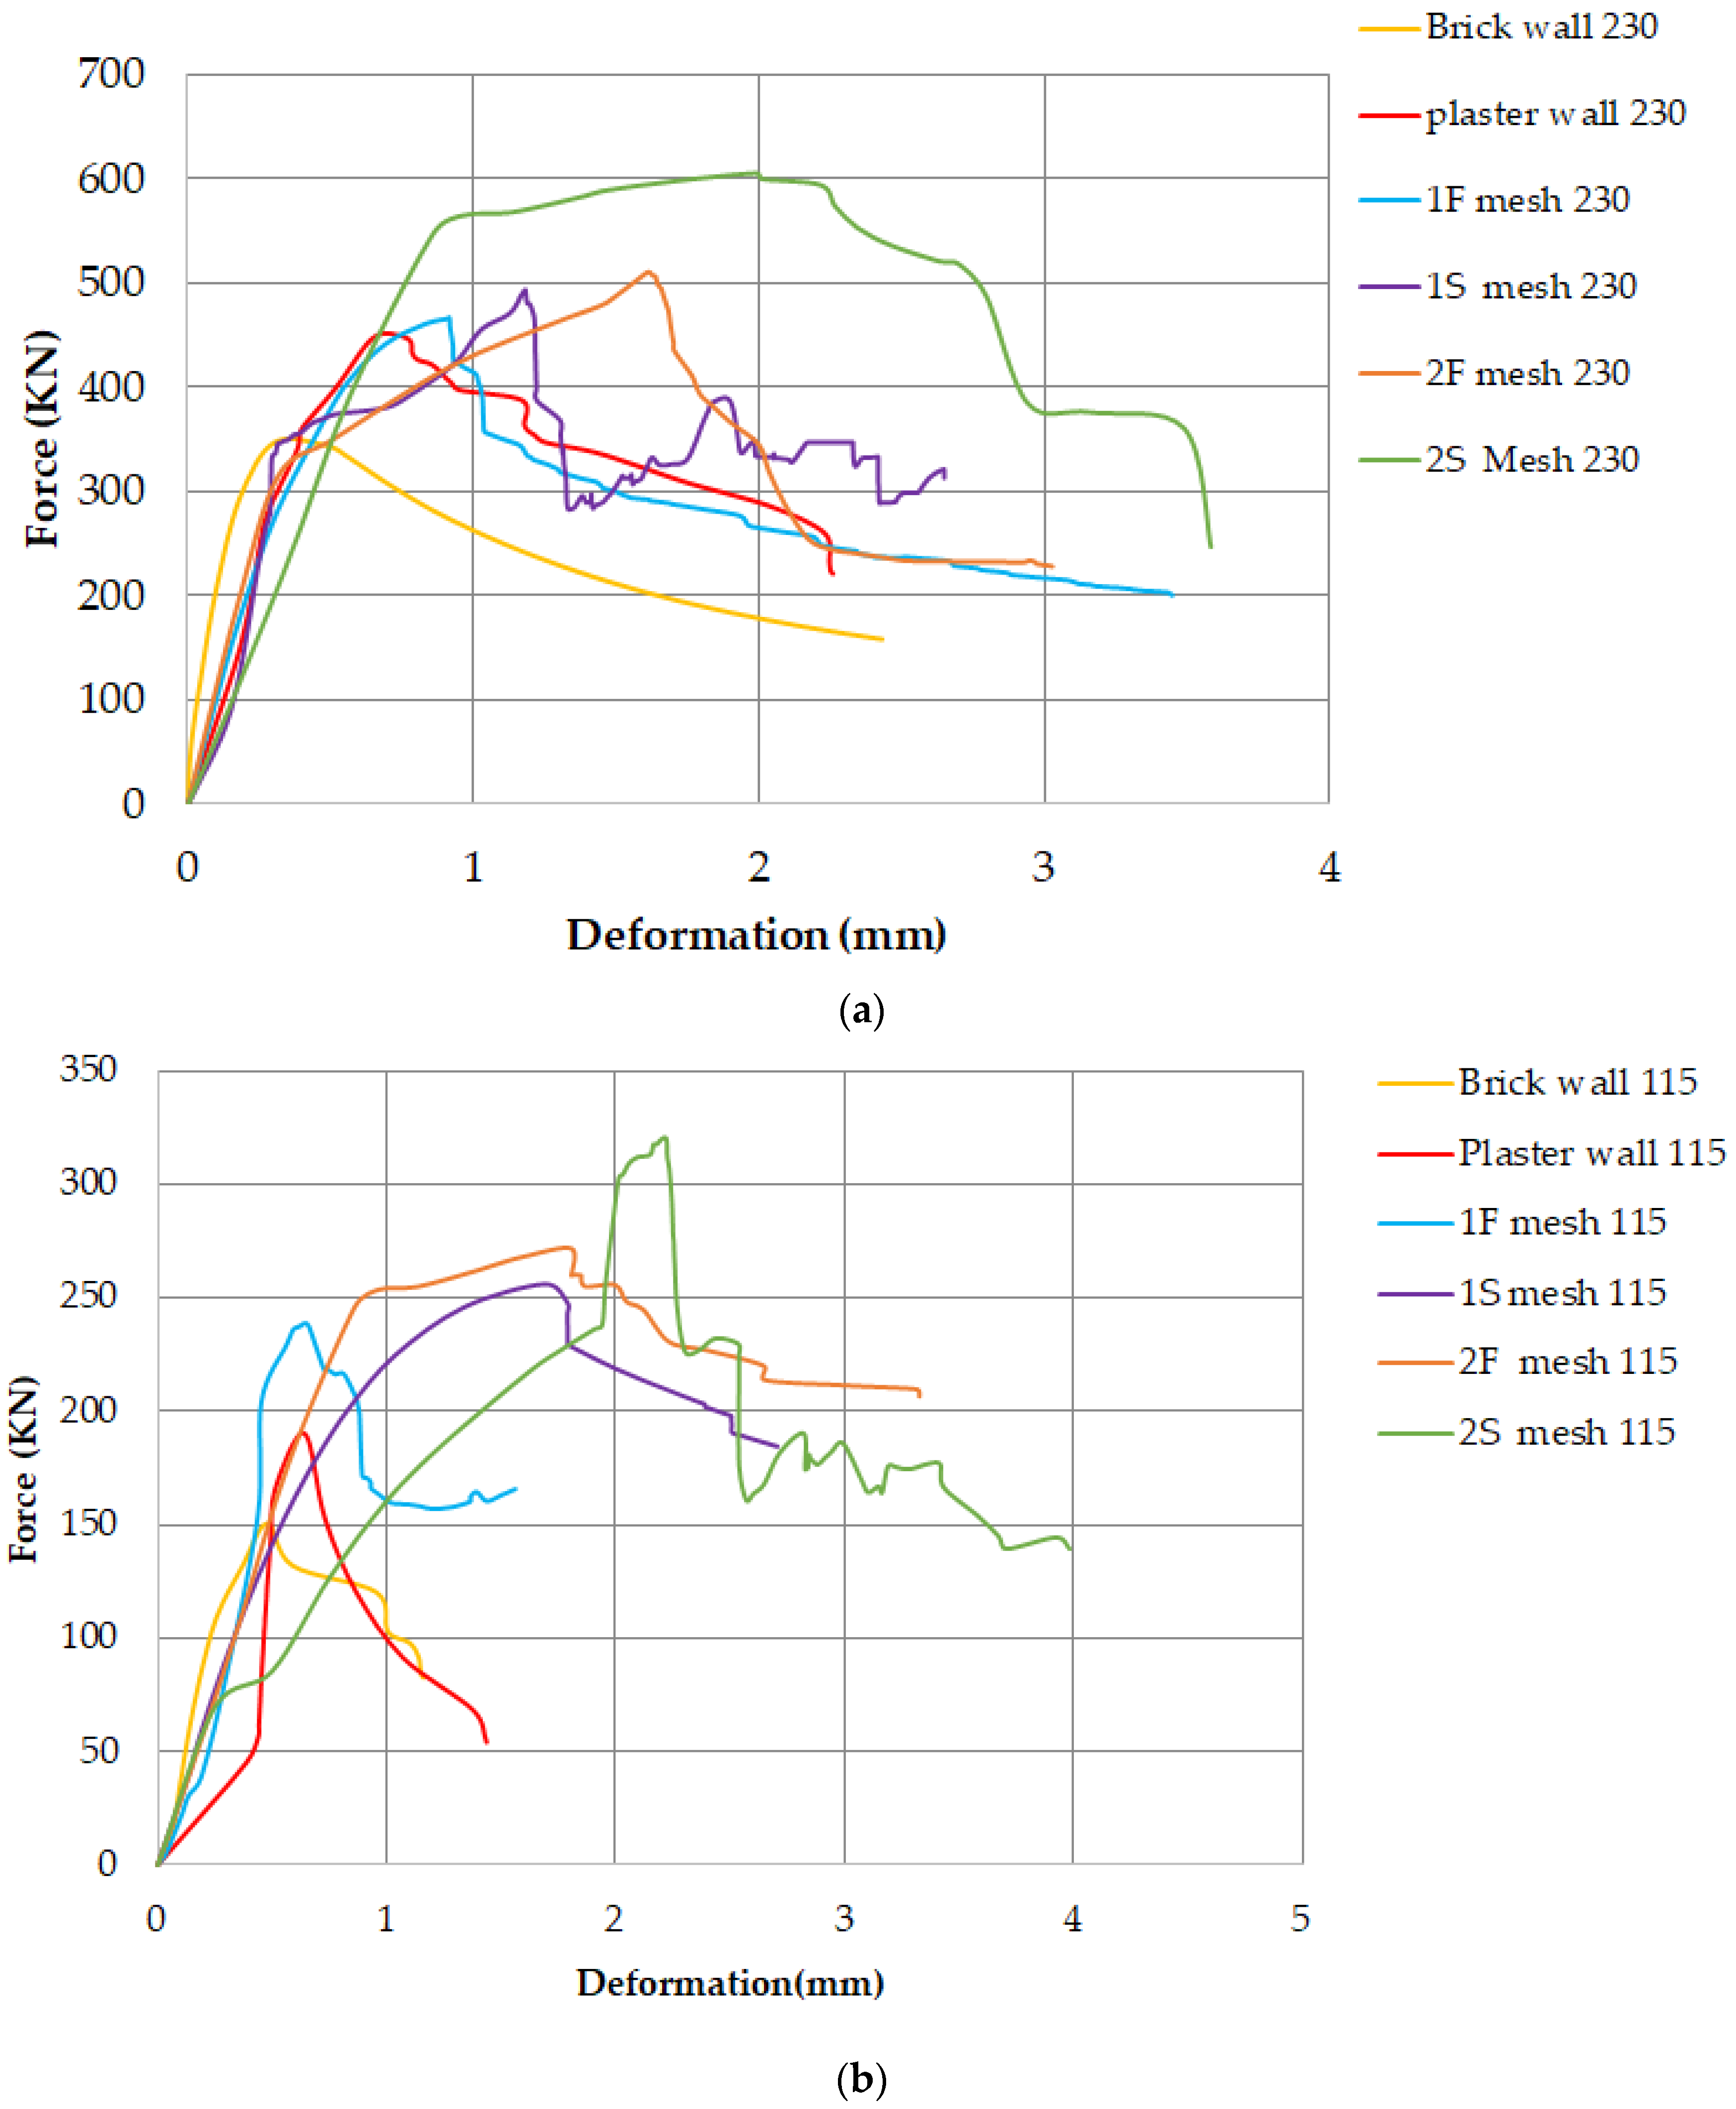
3.2.1. Walls Under Axial Compression

Table 2 provides a summary of results for walls under axial compression. All strengthened walls demonstrated greater peak capacities than their corresponding control walls. Walls W07 and W01 had peak capacities of 356 kN and 151 kN, respectively. All single- and double-brick-strengthened walls demonstrated greater capacities than walls W01 and W07, respectively. Besides the peak capacity, the deflection at the peak capacity was also enhanced in all strengthened walls. The compressive capacity of walls was estimated by dividing the peak capacity by the bearing area of the walls. Figure 12 shows the comparison of the peak capacity of double-brick walls under axial compression. It is noted that the peak capacity was improved by up to 73.60% when strengthened with a two-layer steel mesh. The two-layer fiberglass mesh resulted in a peak capacity improvement of 43.54%. For one-layer strengthening, the steel and fiberglass resulted in peak capacity improvements of up to 38.76% and 31.18%, respectively. It is critical to observe that steel mesh demonstrated greater strengthening potential than fiberglass mesh. This may be attributed to the greater tensile capacity of steel mesh than fiberglass mesh. The substantial strength enhancements (e.g., a 73.6% increase in compressive strength with double-layer steel mesh) provide greater safety margins. This allows structures to better withstand seismic forces, reducing the risk of catastrophic failure during earthquakes. Enhanced ductility and reduced brittleness from reinforcement contribute to the overall resilience of masonry structures. This means that buildings can absorb and dissipate energy more effectively during seismic events, leading to less damage and a higher likelihood of retaining structural integrity. The thickness of the wall specimens significantly influenced their load-carrying capacity, with double-brick walls exhibiting a higher load-carrying capacity compared to single-brick walls. The presence of double-layer steel mesh mitigates the brittleness commonly associated with brick masonry. This allows for greater deformation capacity before failure, leading to safer performance under loads.
Figure 13 shows the comparison of the peak capacity of single-brick walls under axial compression. Compared to the 151 kN capacity of Wall W01, all walls demonstrated increased peak capacity, i.e., in excess of 25%. The plastering alone enhanced the capacity by 25.83%. The trend of enhancement imparted by steel and fiberglass mesh is reported to be analogous to that in single-brick walls. Steel mesh showed better strengthening potential than fiberglass potential in terms of peak capacity.
It is further noted that the effectiveness of mesh was reduced more in double-brick walls than in single-brick walls, as shown in Figure 14. The difference in improvement in peak capacity of single- and double-brick walls for 1S, 2S, 1F, and 2F is noted at 30.7%, 39.0%, 27.1%, and 36.6%, respectively. Thus, on average, the strengthening by either steel or fiberglass mesh resulted in 33% greater improvement in the case of single-brick walls.

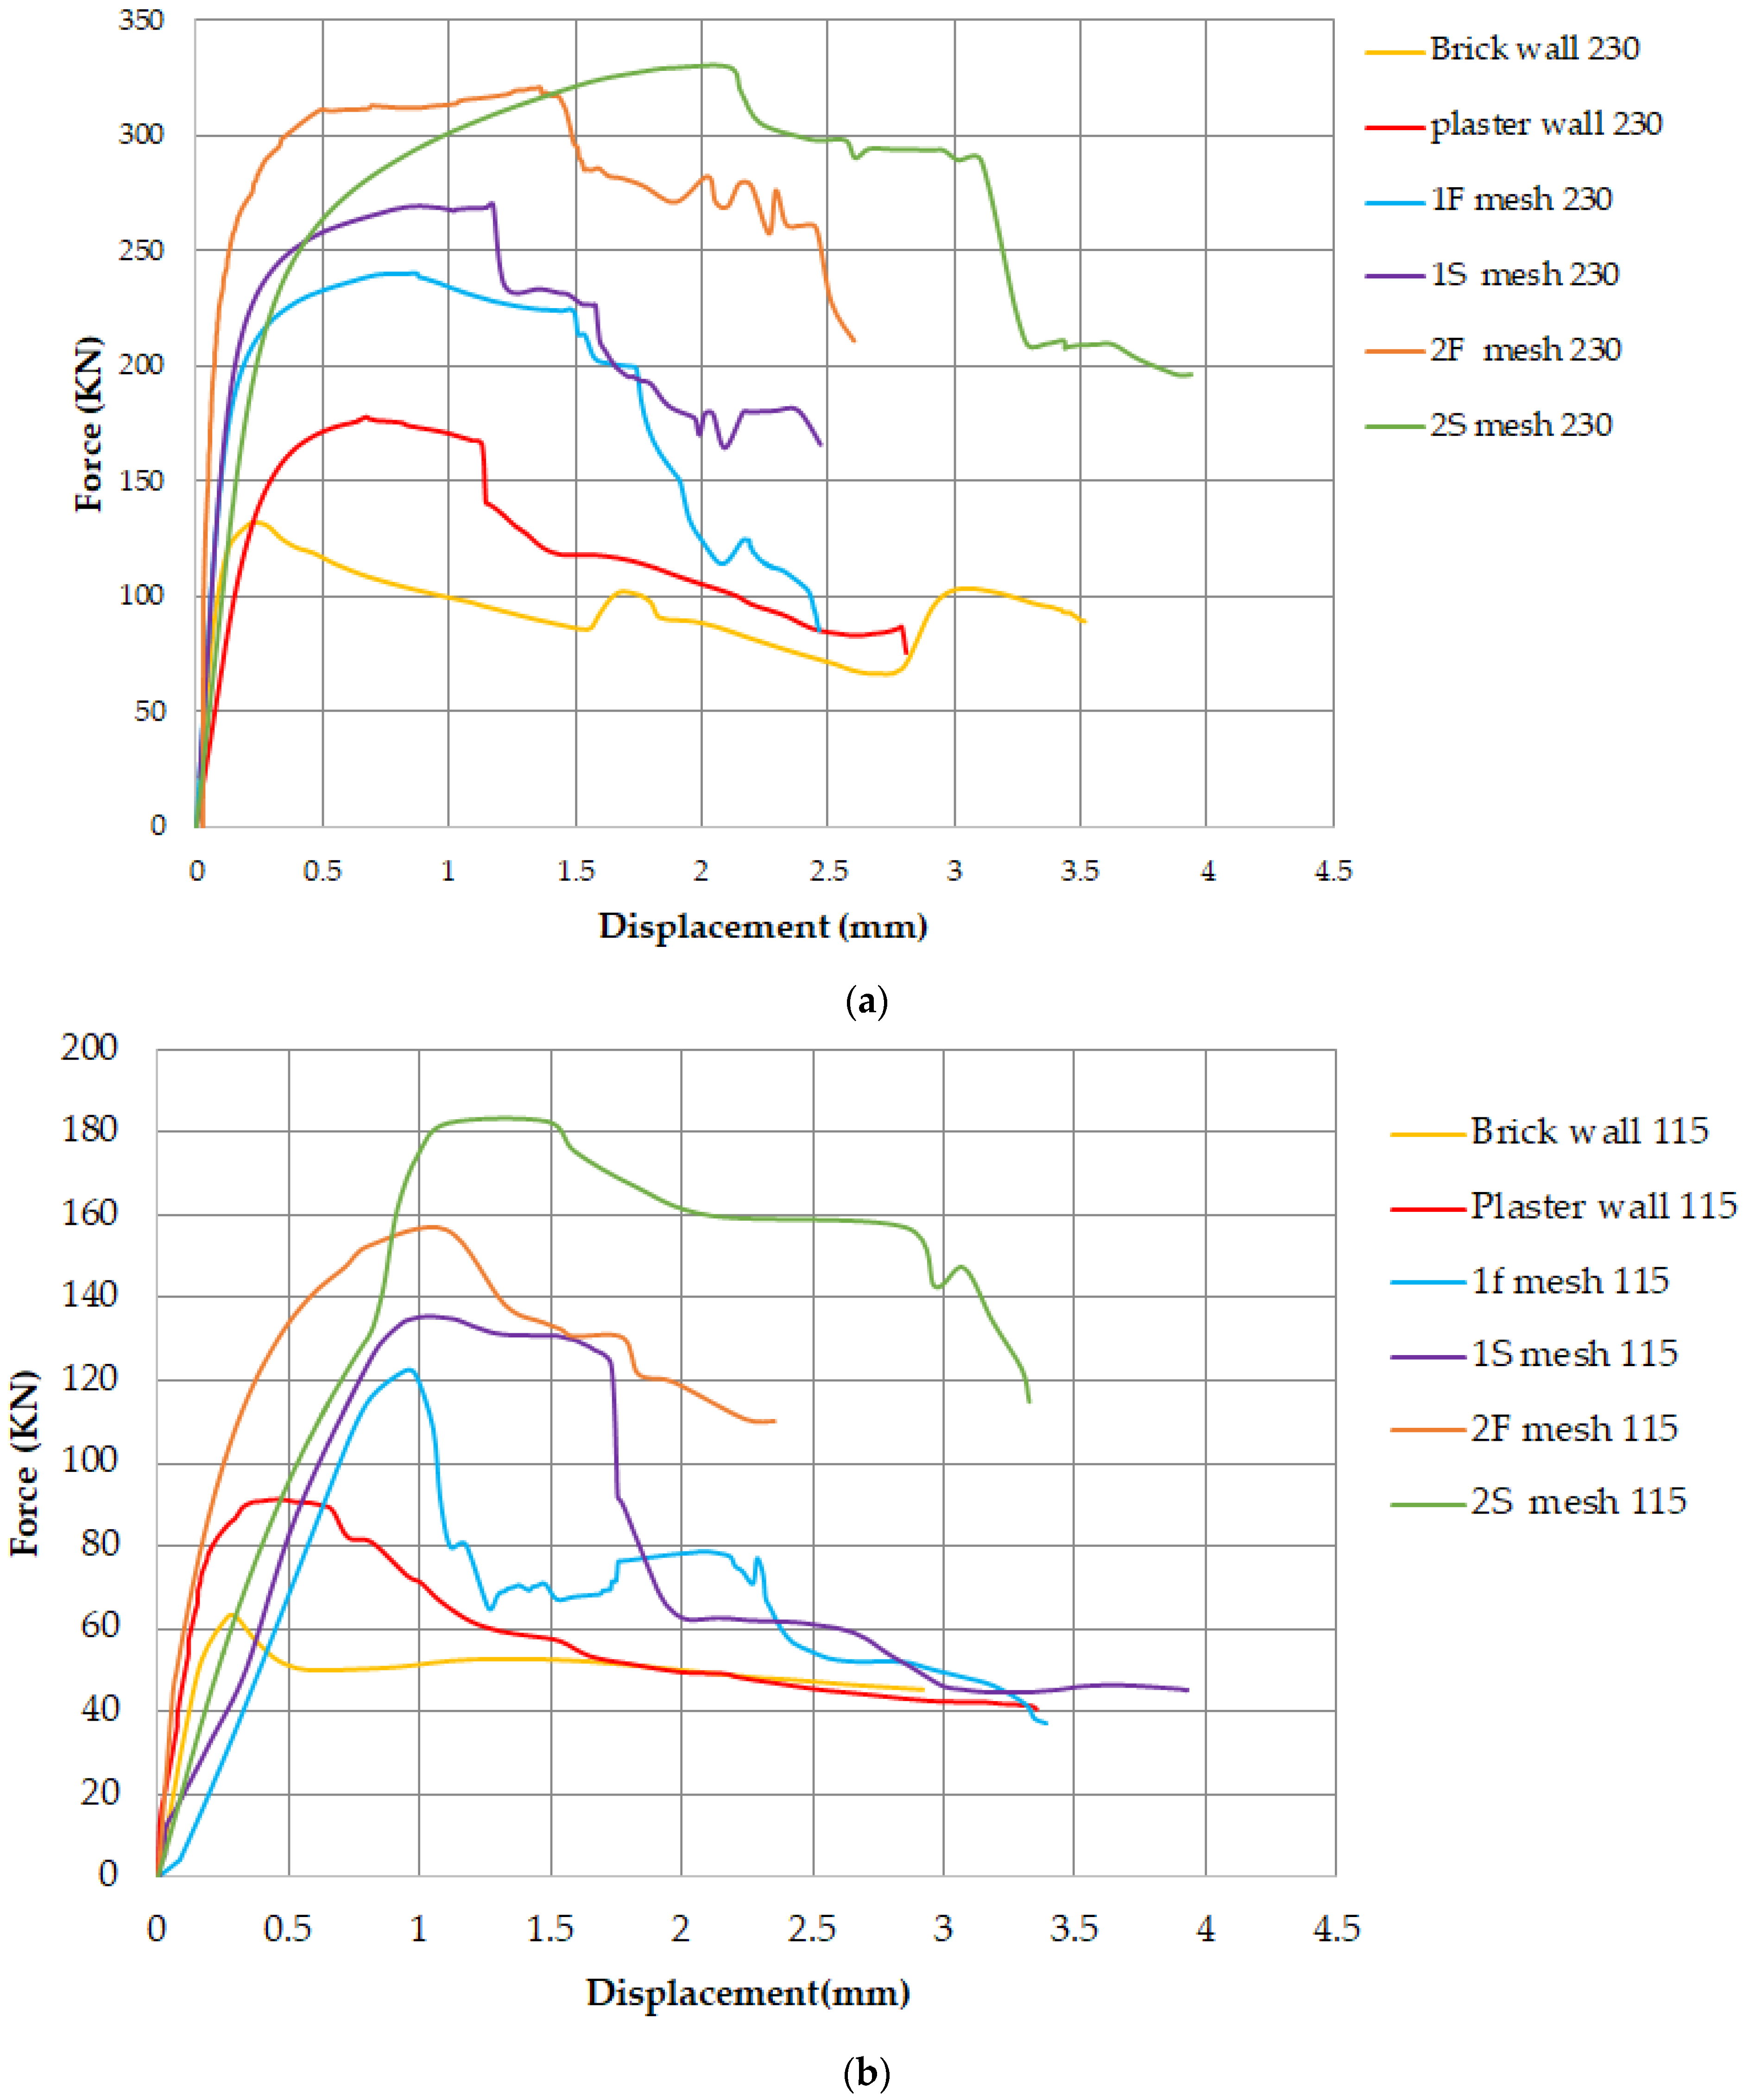
3.2.2. Walls Under Diagonal Compression

Table 2 provides the summary of results for walls under diagonal compression. The shear stress was calculated using the formula provided in Equation (1).
v = P cos θ 0.50 t H + L
where P is the peak capacity, t is the wall thickness, L is the wall length, H is the wall height, and θ is the angle between the wall diagonal and the horizontal axis. This equation is based on the linearly elastic isotropic models. The calculated shear strength is presented in Table 3. All single- and double-brick strengthened walls exhibited higher capacities compared to walls W13 and W19, respectively. In addition to the increased peak capacity, the deflection at peak capacity also improved in all strengthened walls. Figure 15 illustrates the comparison of peak capacities of the single-brick walls under diagonal compression. Notably, the peak capacity was enhanced by up to 193.55% with the use of a two-layer steel mesh, while the two-layer fiberglass mesh led to a peak capacity improvement of 153.23%. For one-layer strengthening, the steel and fiberglass mesh resulted in peak capacity improvements of up to 117.74% and 96.77%, respectively. These results clearly indicate that steel mesh provided greater strengthening potential than fiberglass mesh.
Figure 16 presents a comparison of the peak capacities of double-brick walls under diagonal compression. Compared to the 126 kN capacity of Wall W19, all reinforced walls exhibited a peak capacity increase of over 42%. Plastering alone enhanced the capacity by 42.06%. The trend of capacity enhancement provided by steel was greater than that provided by fiberglass mesh in double-brick walls. Notably, the steel mesh demonstrated superior strengthening potential compared to fiberglass mesh in terms of peak capacity. It is also observed that the effectiveness of the mesh reinforcement was greater in single-brick walls compared to double-brick walls, as shown in Figure 17. This finding aligns well with the results of the axial compression tests.

3.3. Load vs. Deflection Curves

The load vs. deflection curves of all walls under axial compression are shown in Figure 18. It was noted that strengthened or plastered walls demonstrated enhanced capacity, as depicted in Figure 18. The post-peak strength degradation rate of plastered-only walls was found to be similar to that of the control walls. The initial stiffness of walls was not significantly influenced by the presence of steel or fiberglass mesh. Importantly, the load vs. deflection response of walls with double steel mesh was most ductile, followed by the response of walls strengthened with double fiberglass mesh. Similar observations were noted in the case of diagonal walls, as shown in Figure 19. It is noted from Figure 18 and Figure 19 that the largest area under the load vs. deflection curve belonged to the walls strengthened with double steel mesh, followed by double fiberglass mesh. Hence, the energy dissipation capacity of walls strengthened with double steel mesh was the greatest among all. In the case of one layer steel mesh and fiberglass mess, there were sudden drops in the load-carrying capacity, which could be associated with the rupture of meshes.

4. Numerical Modeling

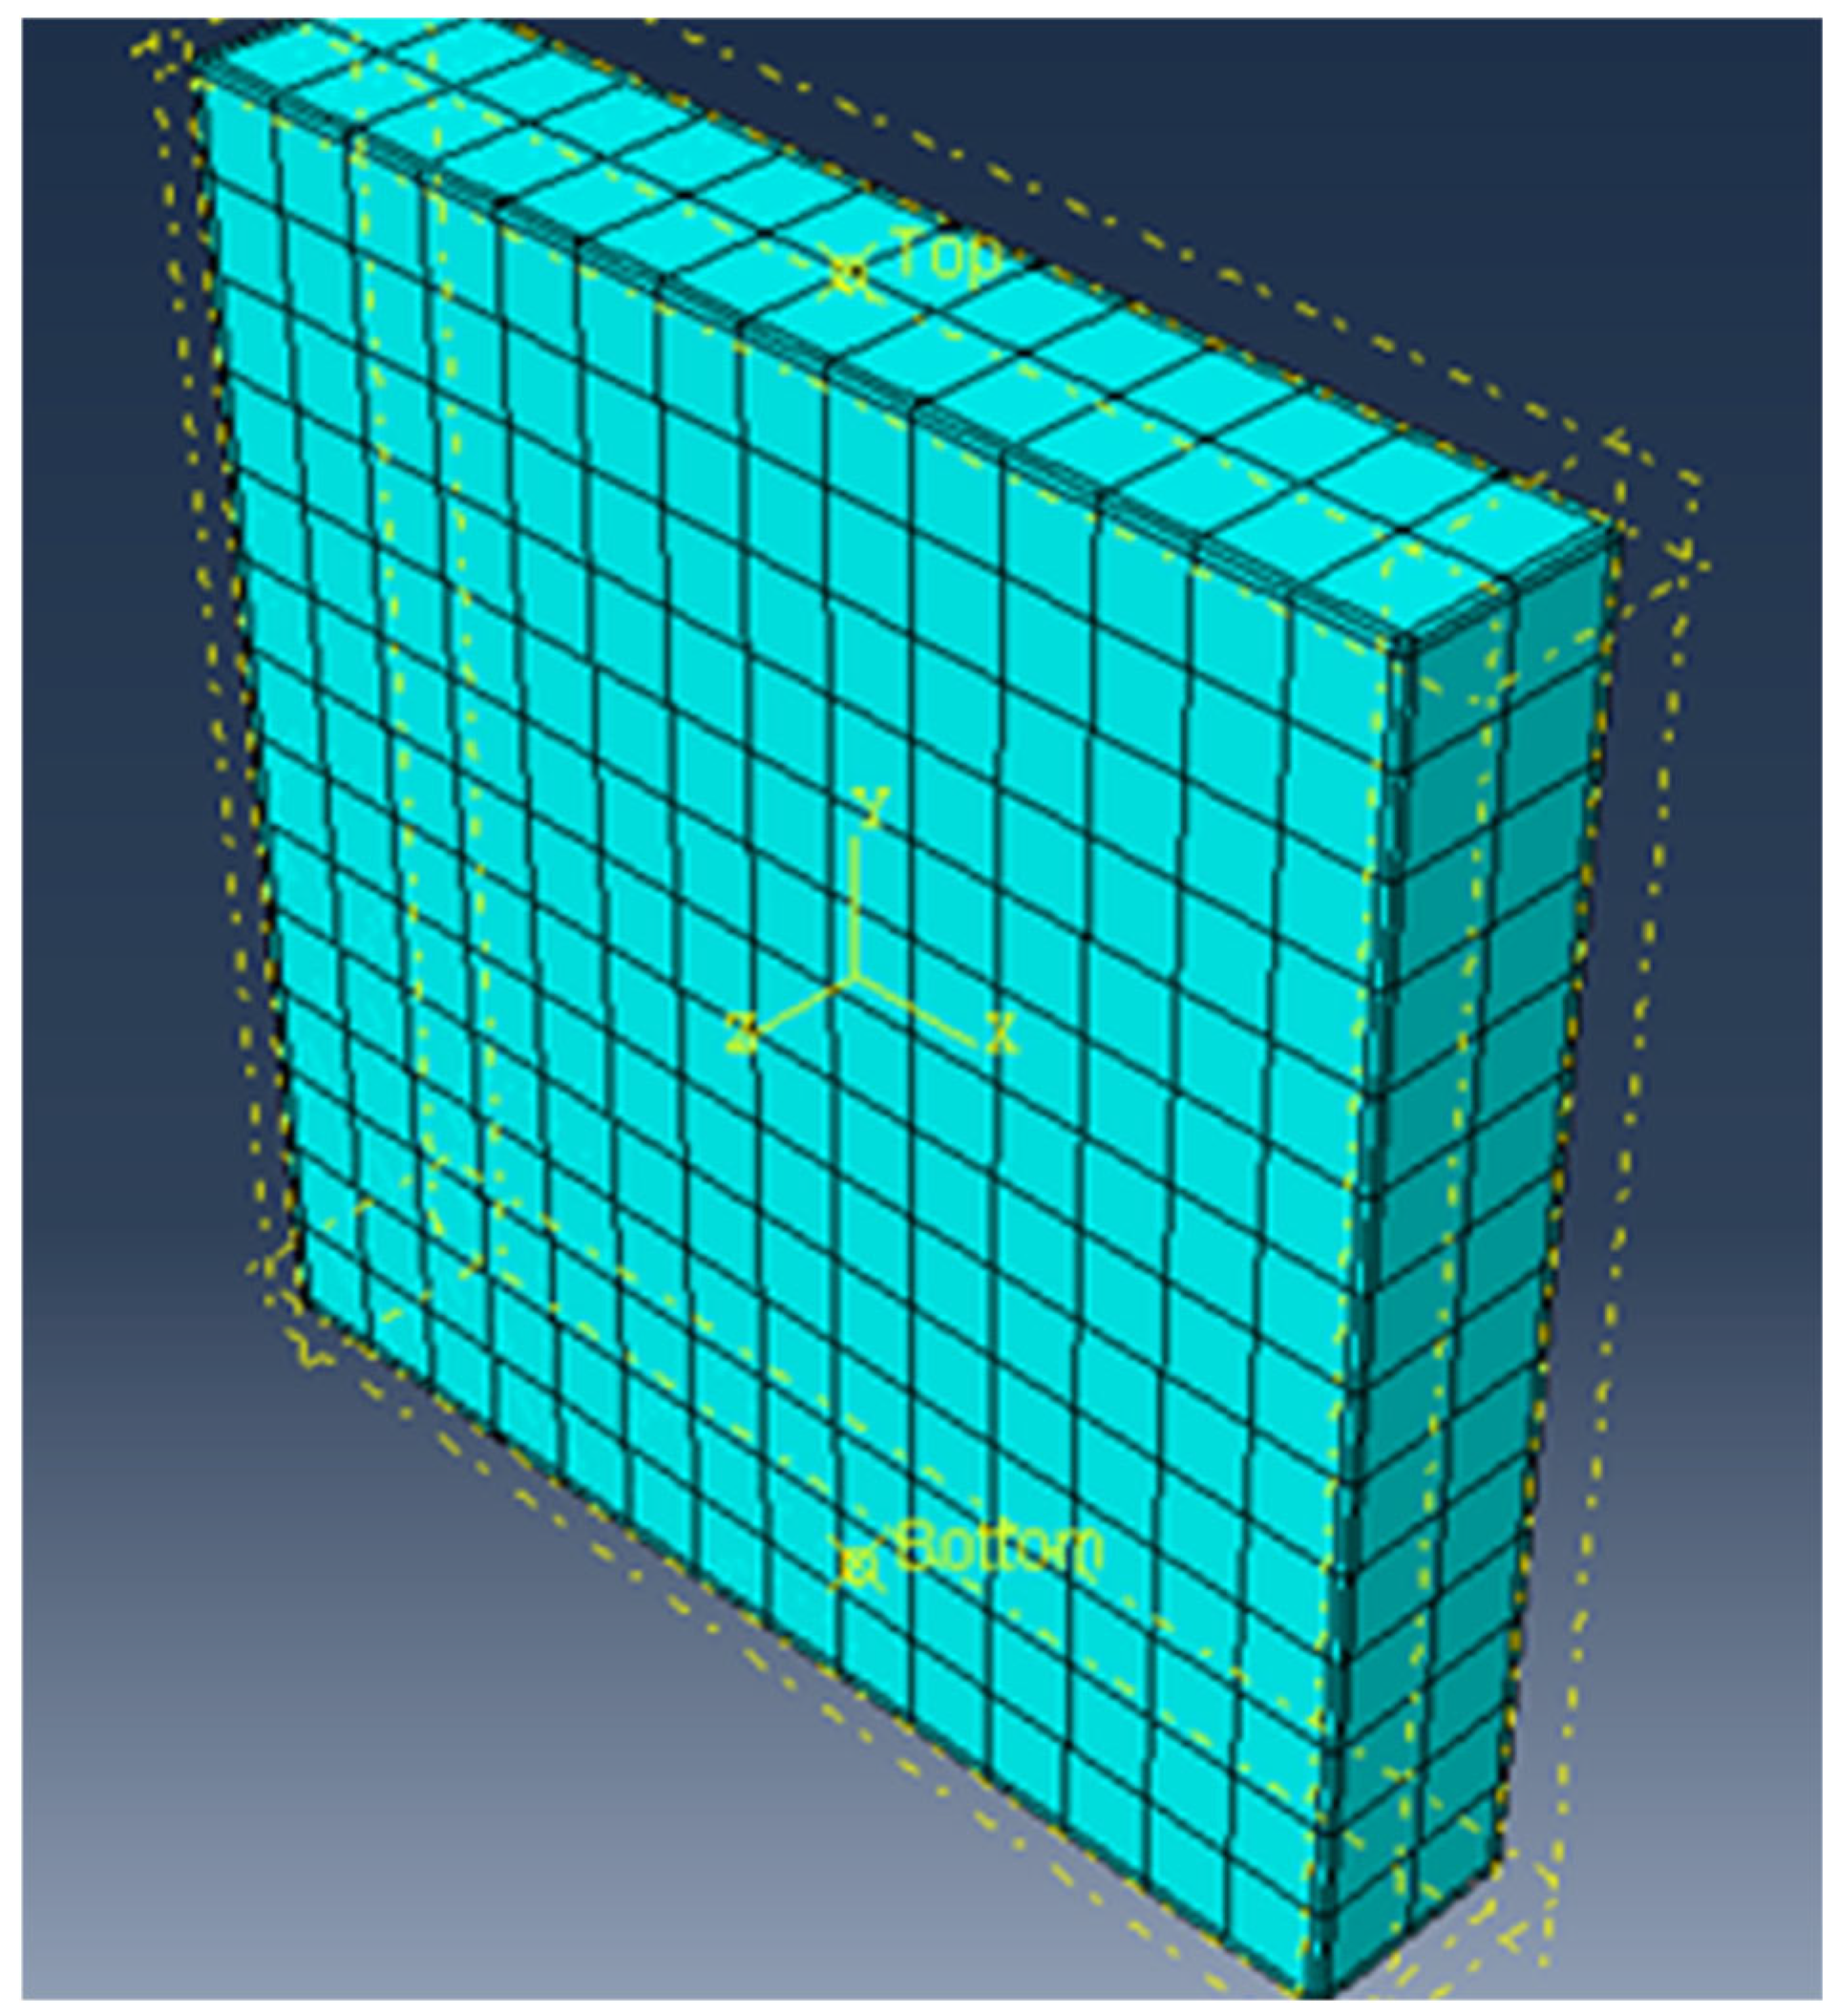
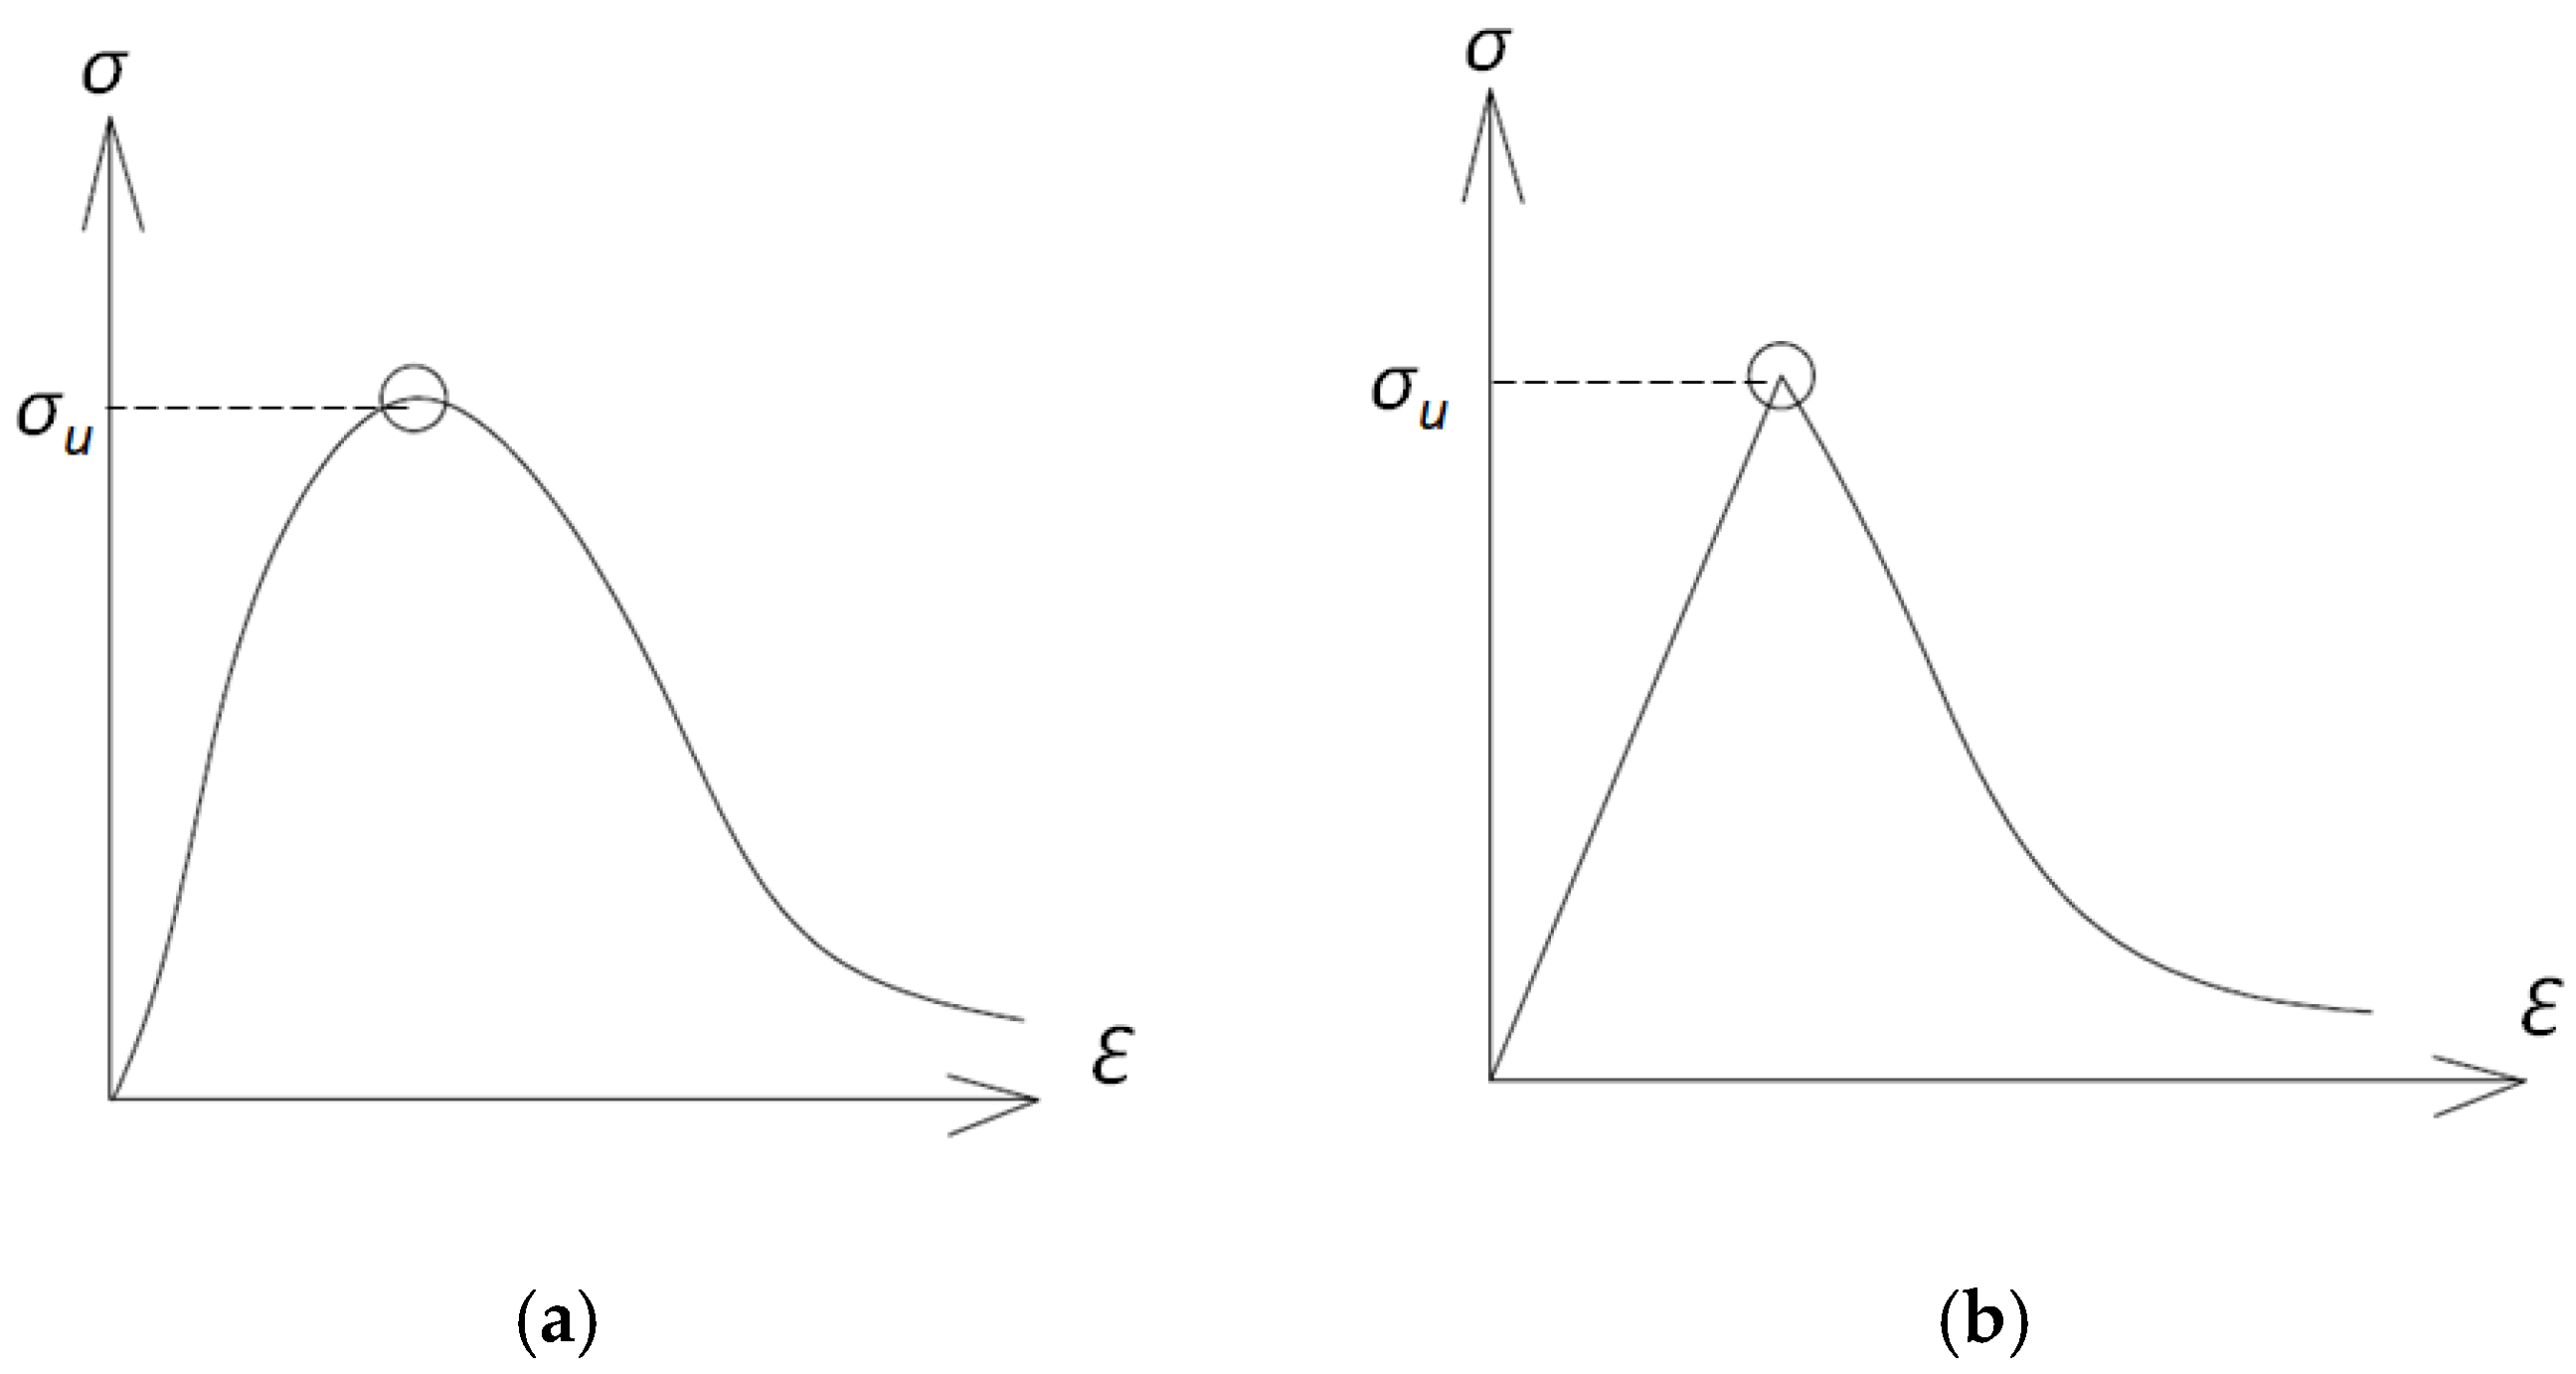
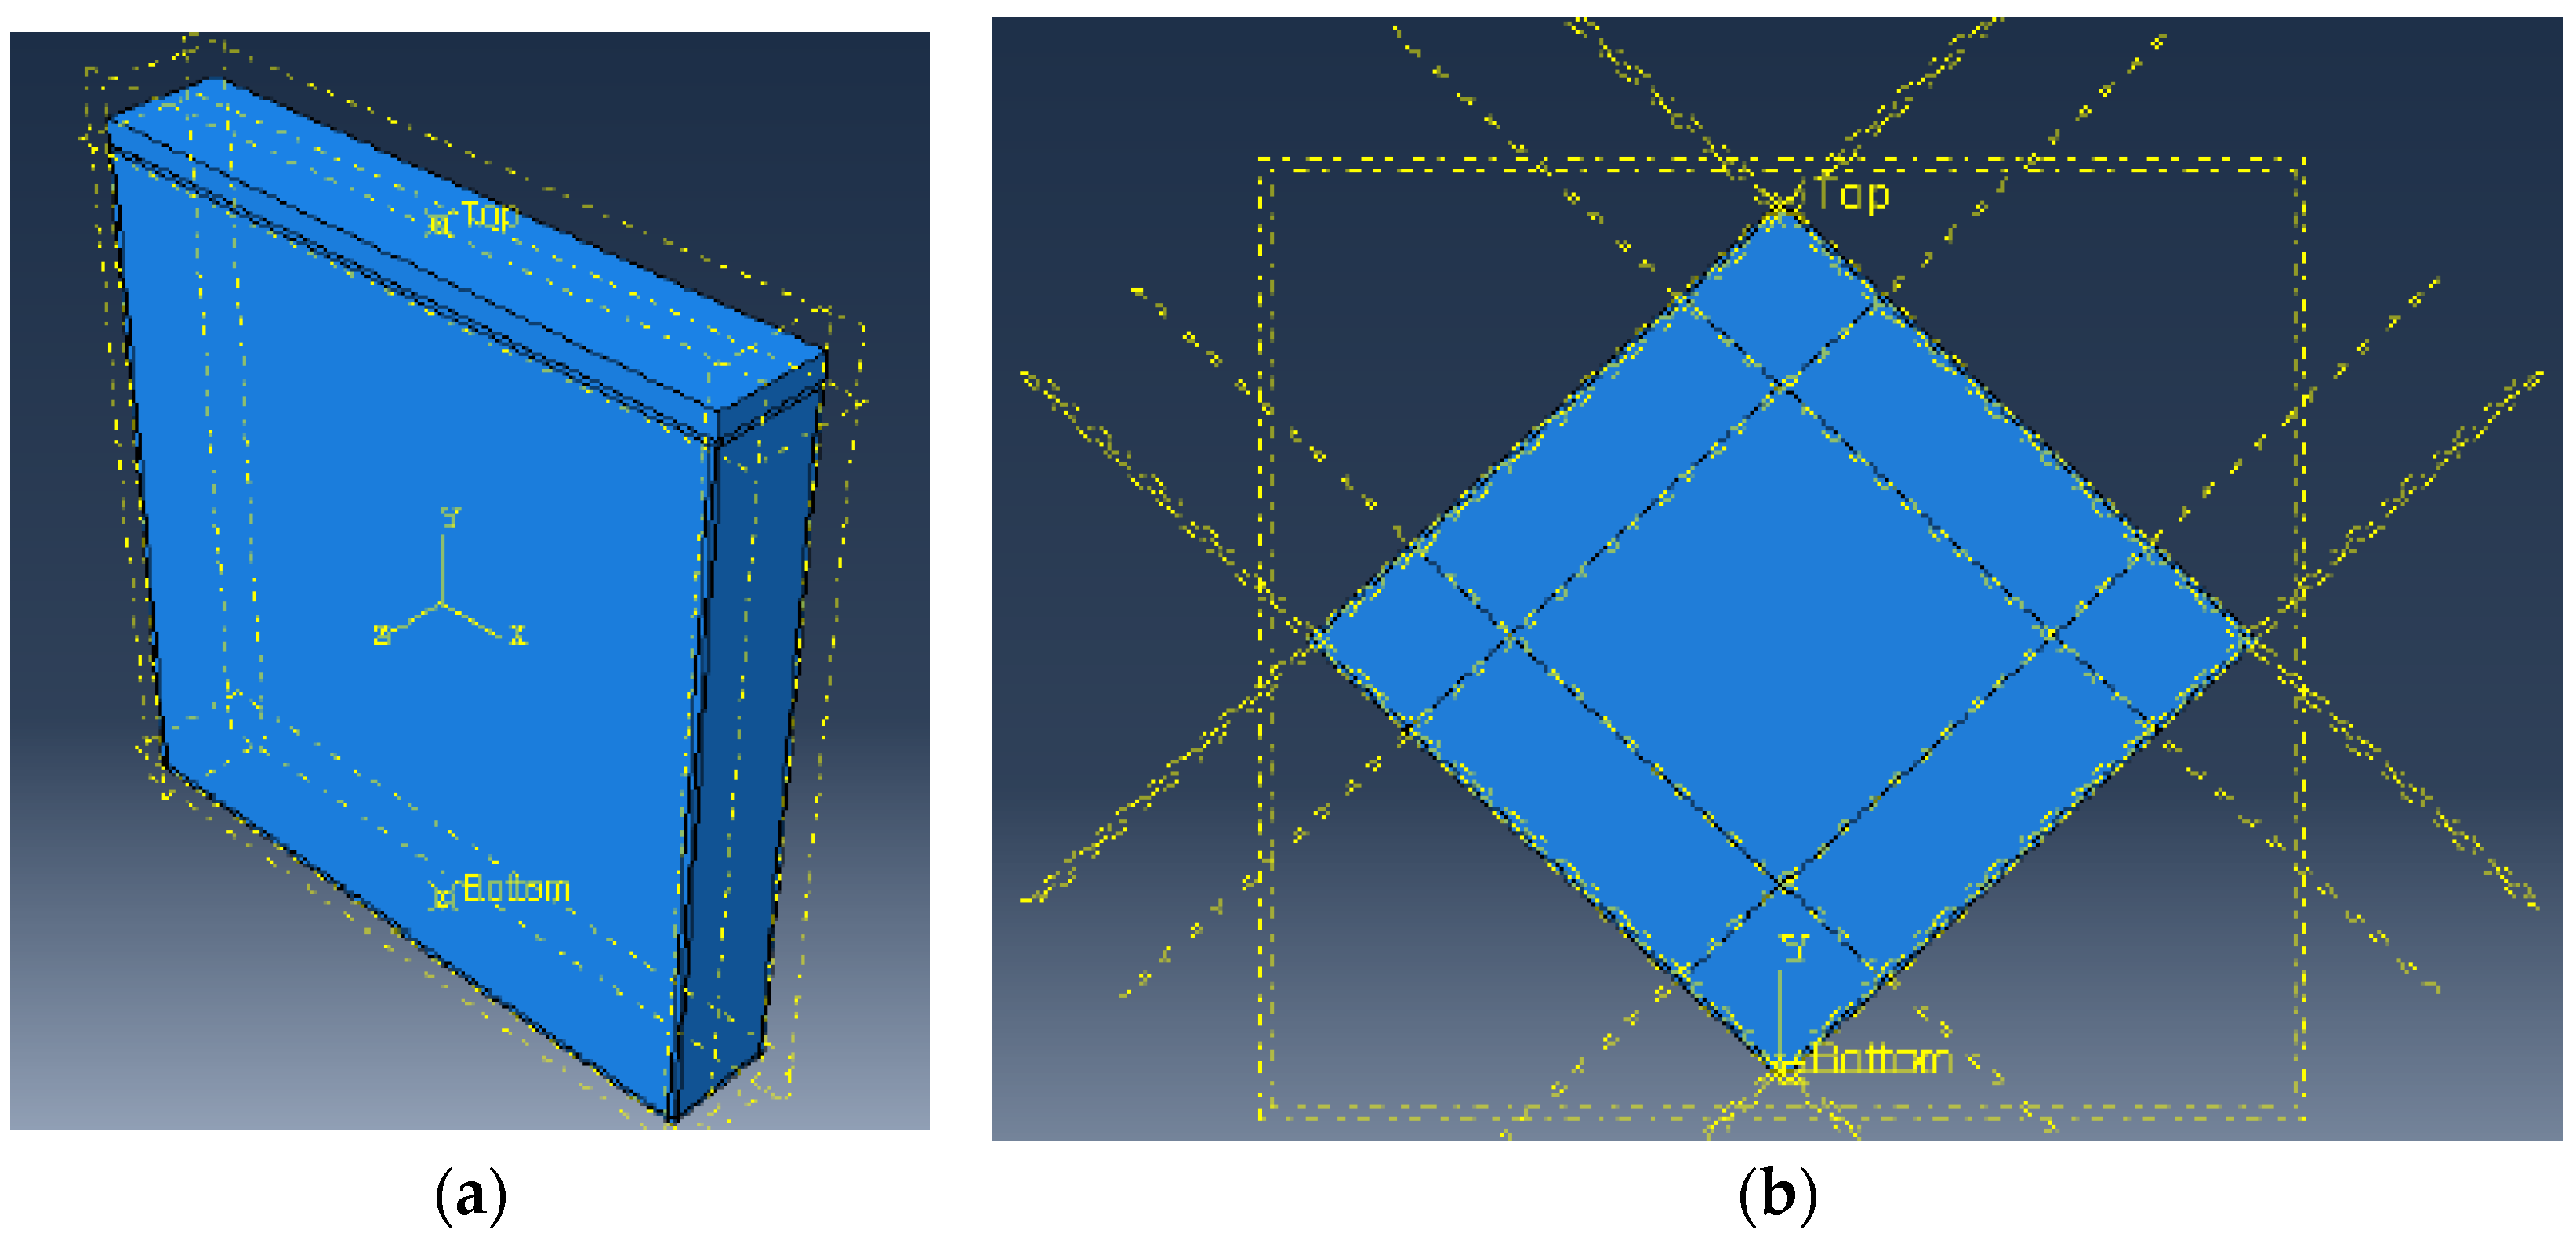
4.1. Modeling Strategy

The Abaqus software 2022 was employed for the numerical modeling of brick masonry walls under axial and diagonal compressive loads. A comparative analysis was conducted between the experimental and analytical results. Initially, 3D models of wall specimens were created, with dimensions of 700 mm × 700 mm and thicknesses of 114.3 mm and 228.6 mm for the control sample and 714 mm × 714 mm with thicknesses of 128 mm and 240 mm for plastered and mesh-reinforced walls. As Abaqus is unitless, the system of units used in this study was millimeters. In the next step, different approaches to model masonry in finite element analysis (FEA) were considered, ranging from detailed micro-level to more simplified macro-level models, as discussed by Noort [43]. A macro-scale model was selected, where all masonry components (interface, unit, mesh, and mortar) were homogenized as either anisotropic or isotropic continua. This approach is favored due to its practical application and lower computational requirements. Macroscopic models are used for efficient overall behavior analysis, while microscopic models provide insights into complex interactions at the material level. Therefore, in this study macroscopic models were used. Figure 20 illustrates the masonry wall after applying the mesh. The mesh size was 50 mm and total number of elements for control wall was 392. An eight-node linear brick element was used for brick walls. Finally, the Concrete Damaged Plasticity (CDP) model was implemented, which provides general capabilities for analyzing concrete and is also suitable for masonry. The Concrete Damaged Plasticity (CDP) model in Abaqus requires several key parameters to accurately define the material behavior such as elastic, plastic, and strength [50,51,52,53]. All parameters were defined following material properties, as mentioned in Section 2.1. The non-linear behavior of reinforcement meshes were also defined through the macro-scale model, defining the appropriate material model (e.g., plasticity, hyperelasticity) and input relevant parameters. In the Abaqus property module, material properties were defined, requiring input parameters such as elasticity, concrete damage plasticity, and the yield strength of fiberglass and steel meshes. The CDP model assumes a non-associated potential plastic flow, employing the Drucker–Prager hyperbolic function for flow potential. The CDP model identifies failure modes such as crushing in compression or cracking in tension. Figure 21 presents the concrete damage response.
In the fourth step, for axial compression, the masonry wall was connected to the beam by establishing a surface-to-surface contact in the Create Interaction module. A reference point was created at the top of the girder to connect it to the wall, and the load was applied, as illustrated in Figure 22a. For diagonal compression, the masonry wall was connected to the upper and lower plates, which were fixed by forming surface-to-surface contacts in the Create Interaction module. A reference point was made at the top plate to connect it to the wall, and the load was applied, as shown in Figure 22b. In the fifth step, within the Load Module, the model was rigidly fixed at both the bottom and top. The boundary condition used at the wall’s base was ENCASTRE, and a displacement-type boundary condition was applied at the top, following guidelines from previous research [54]. Figure 22 depicts the typical modelling process.

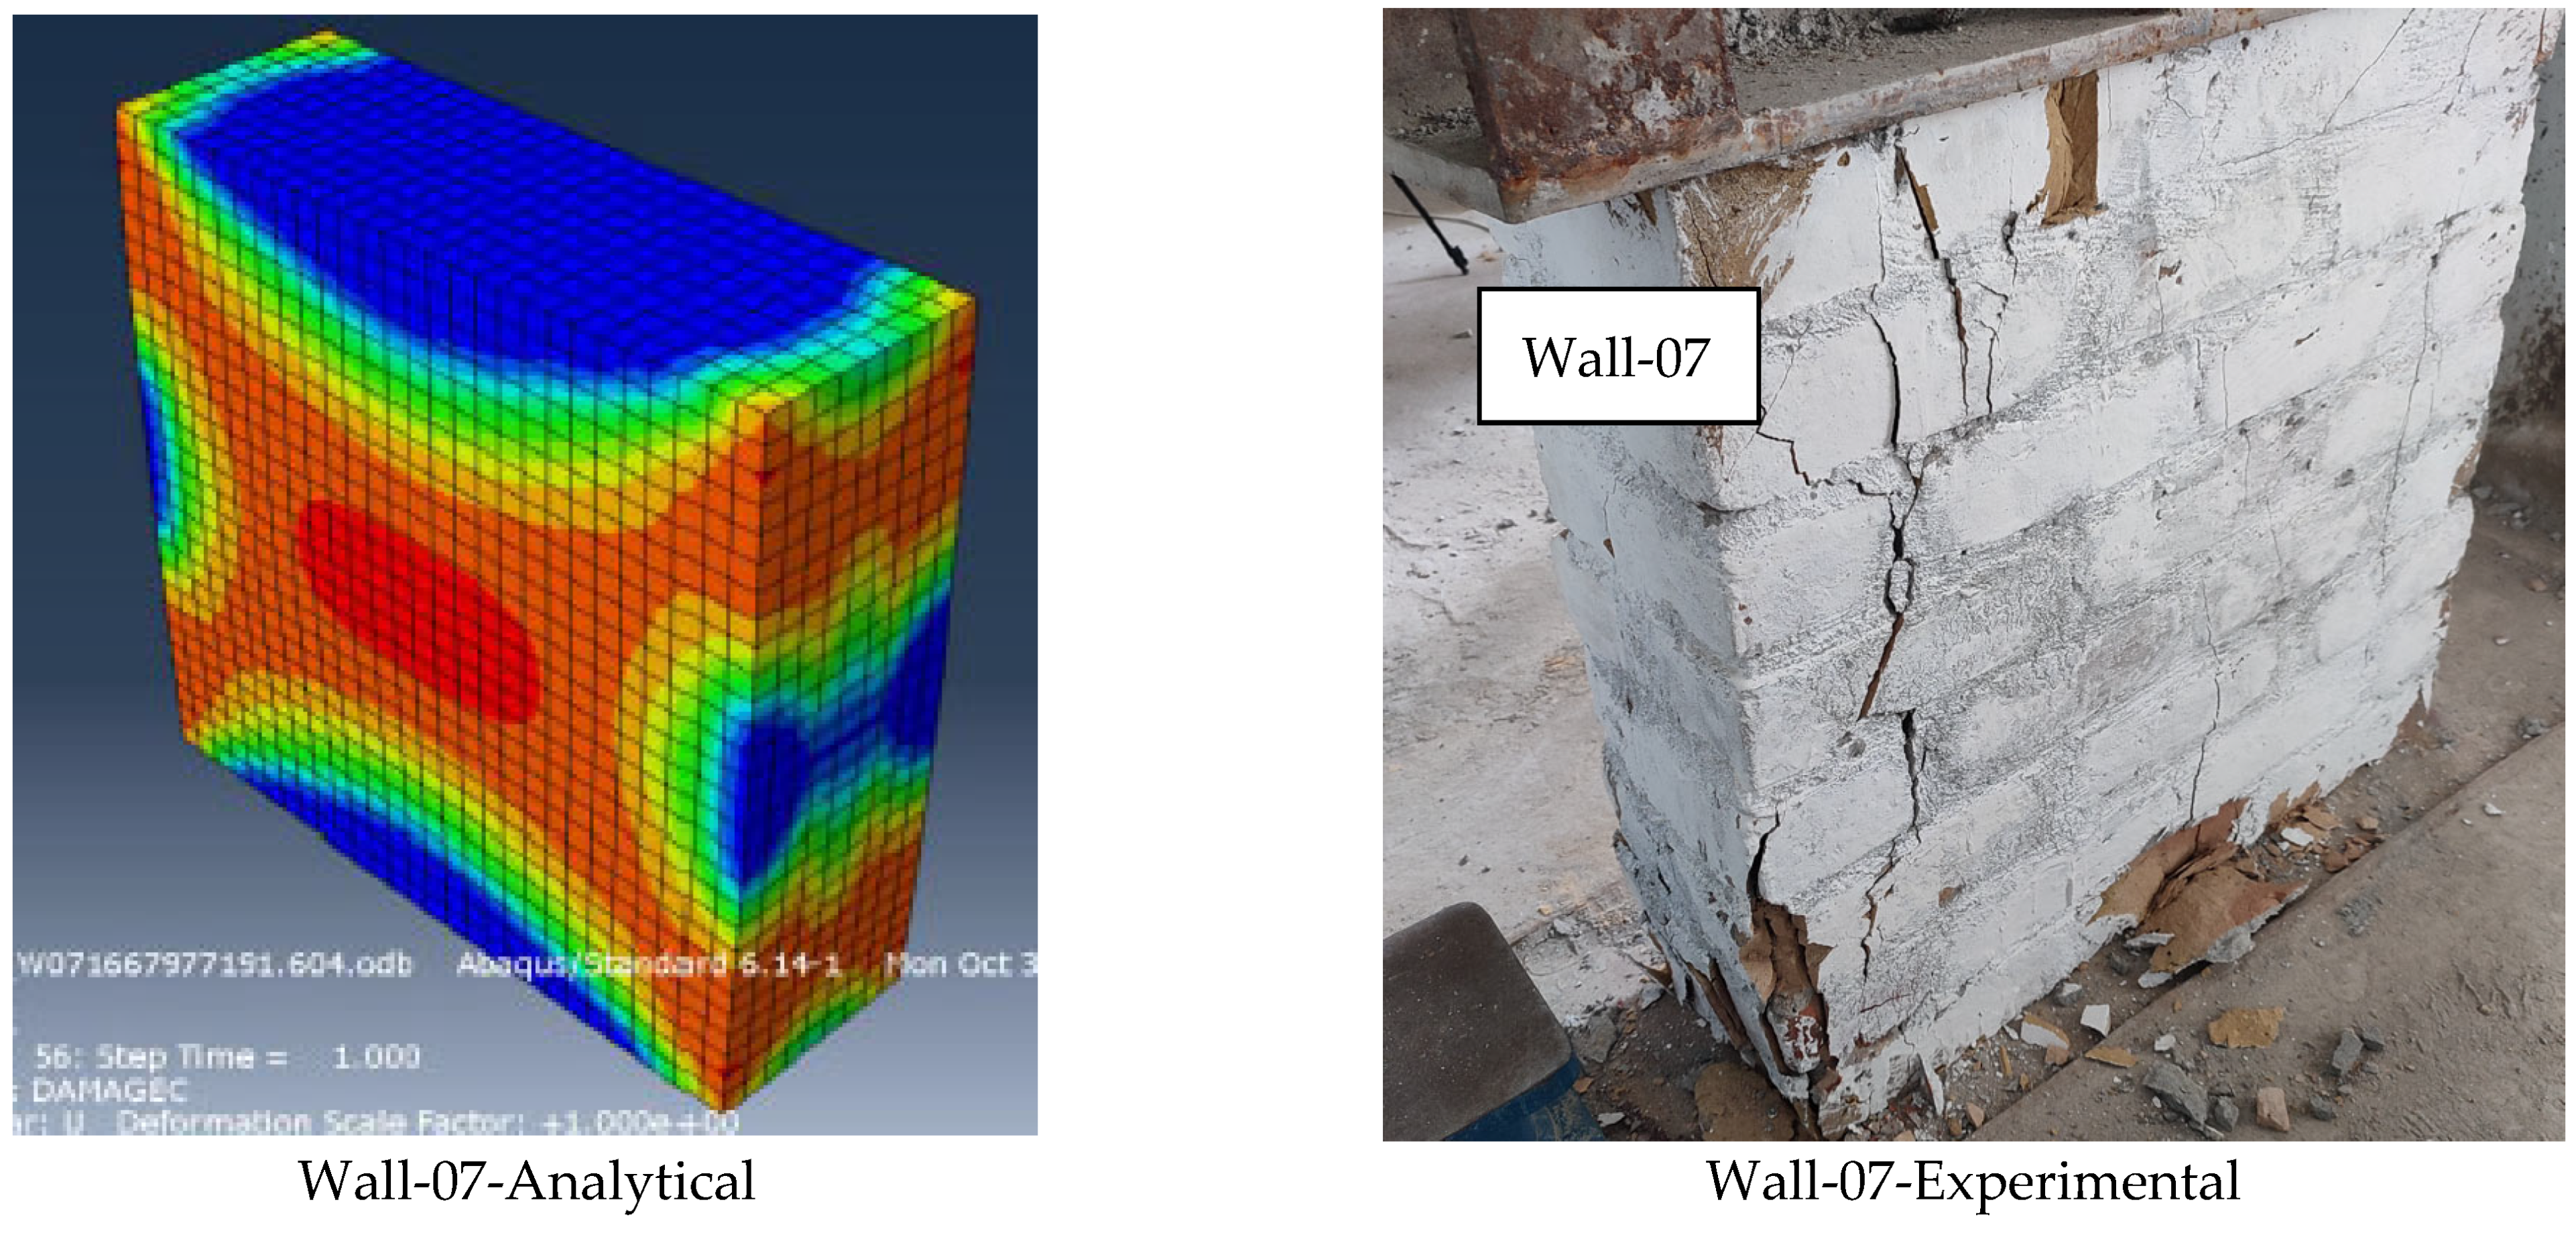
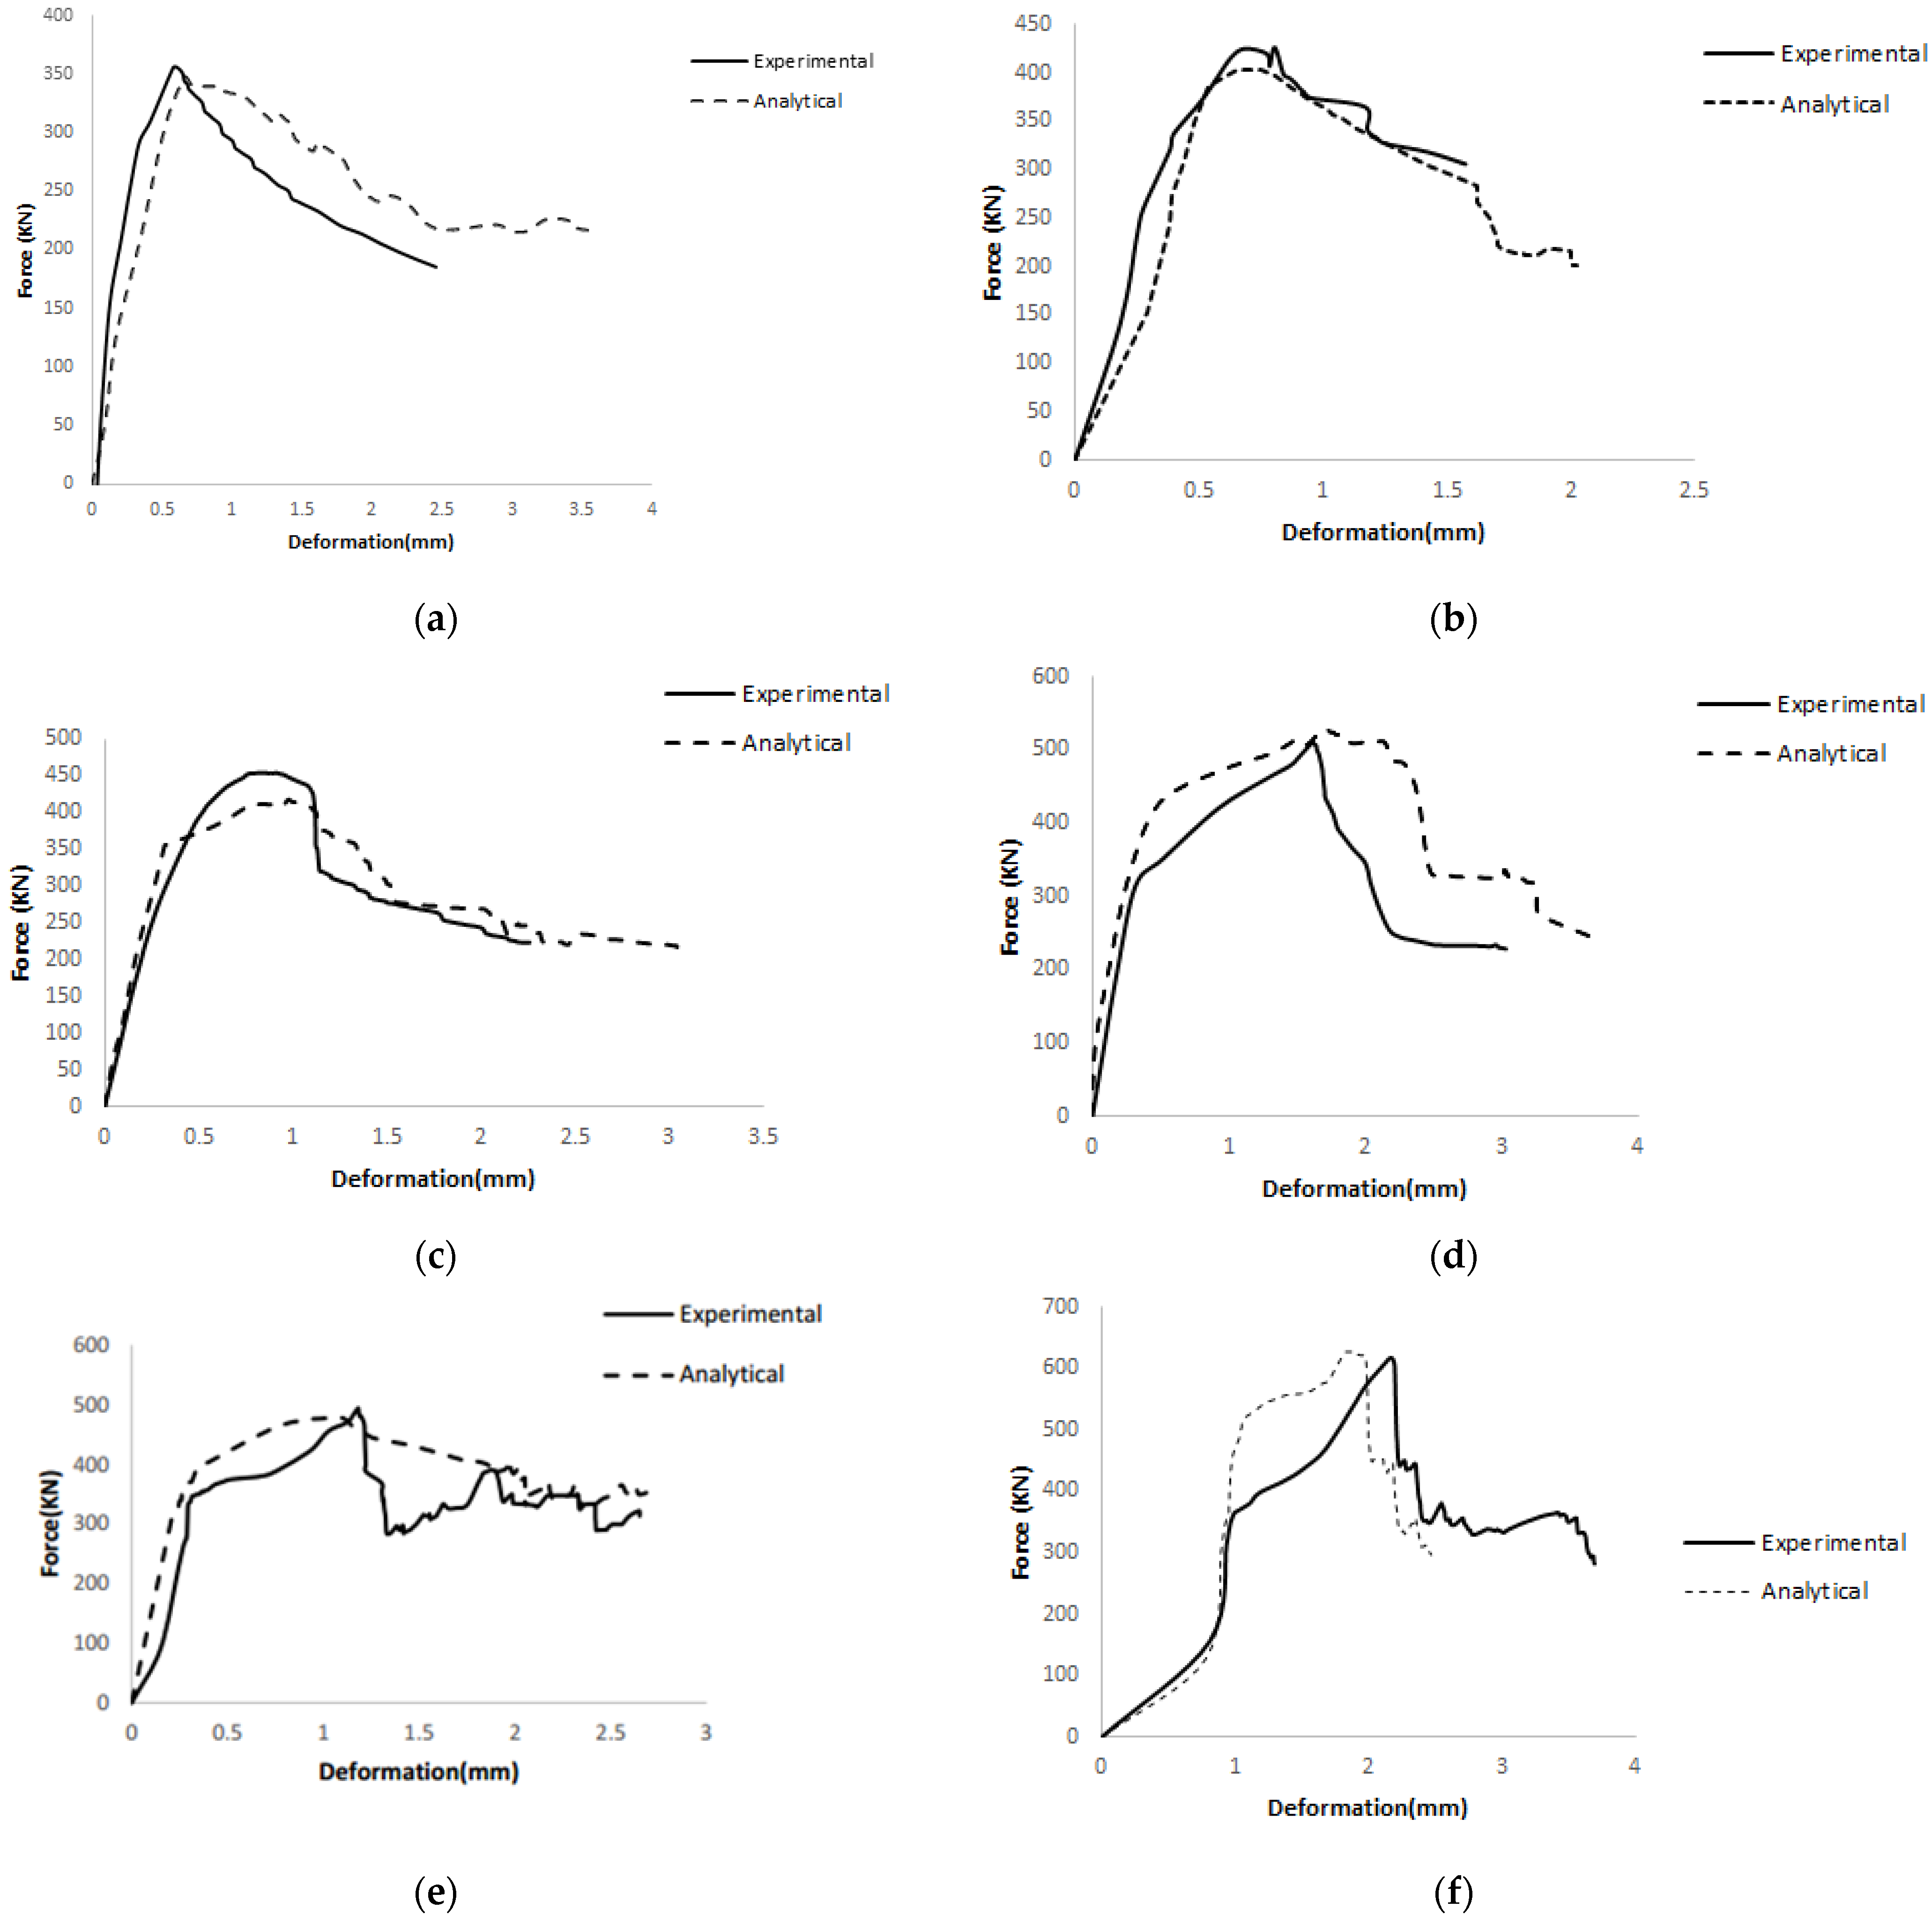
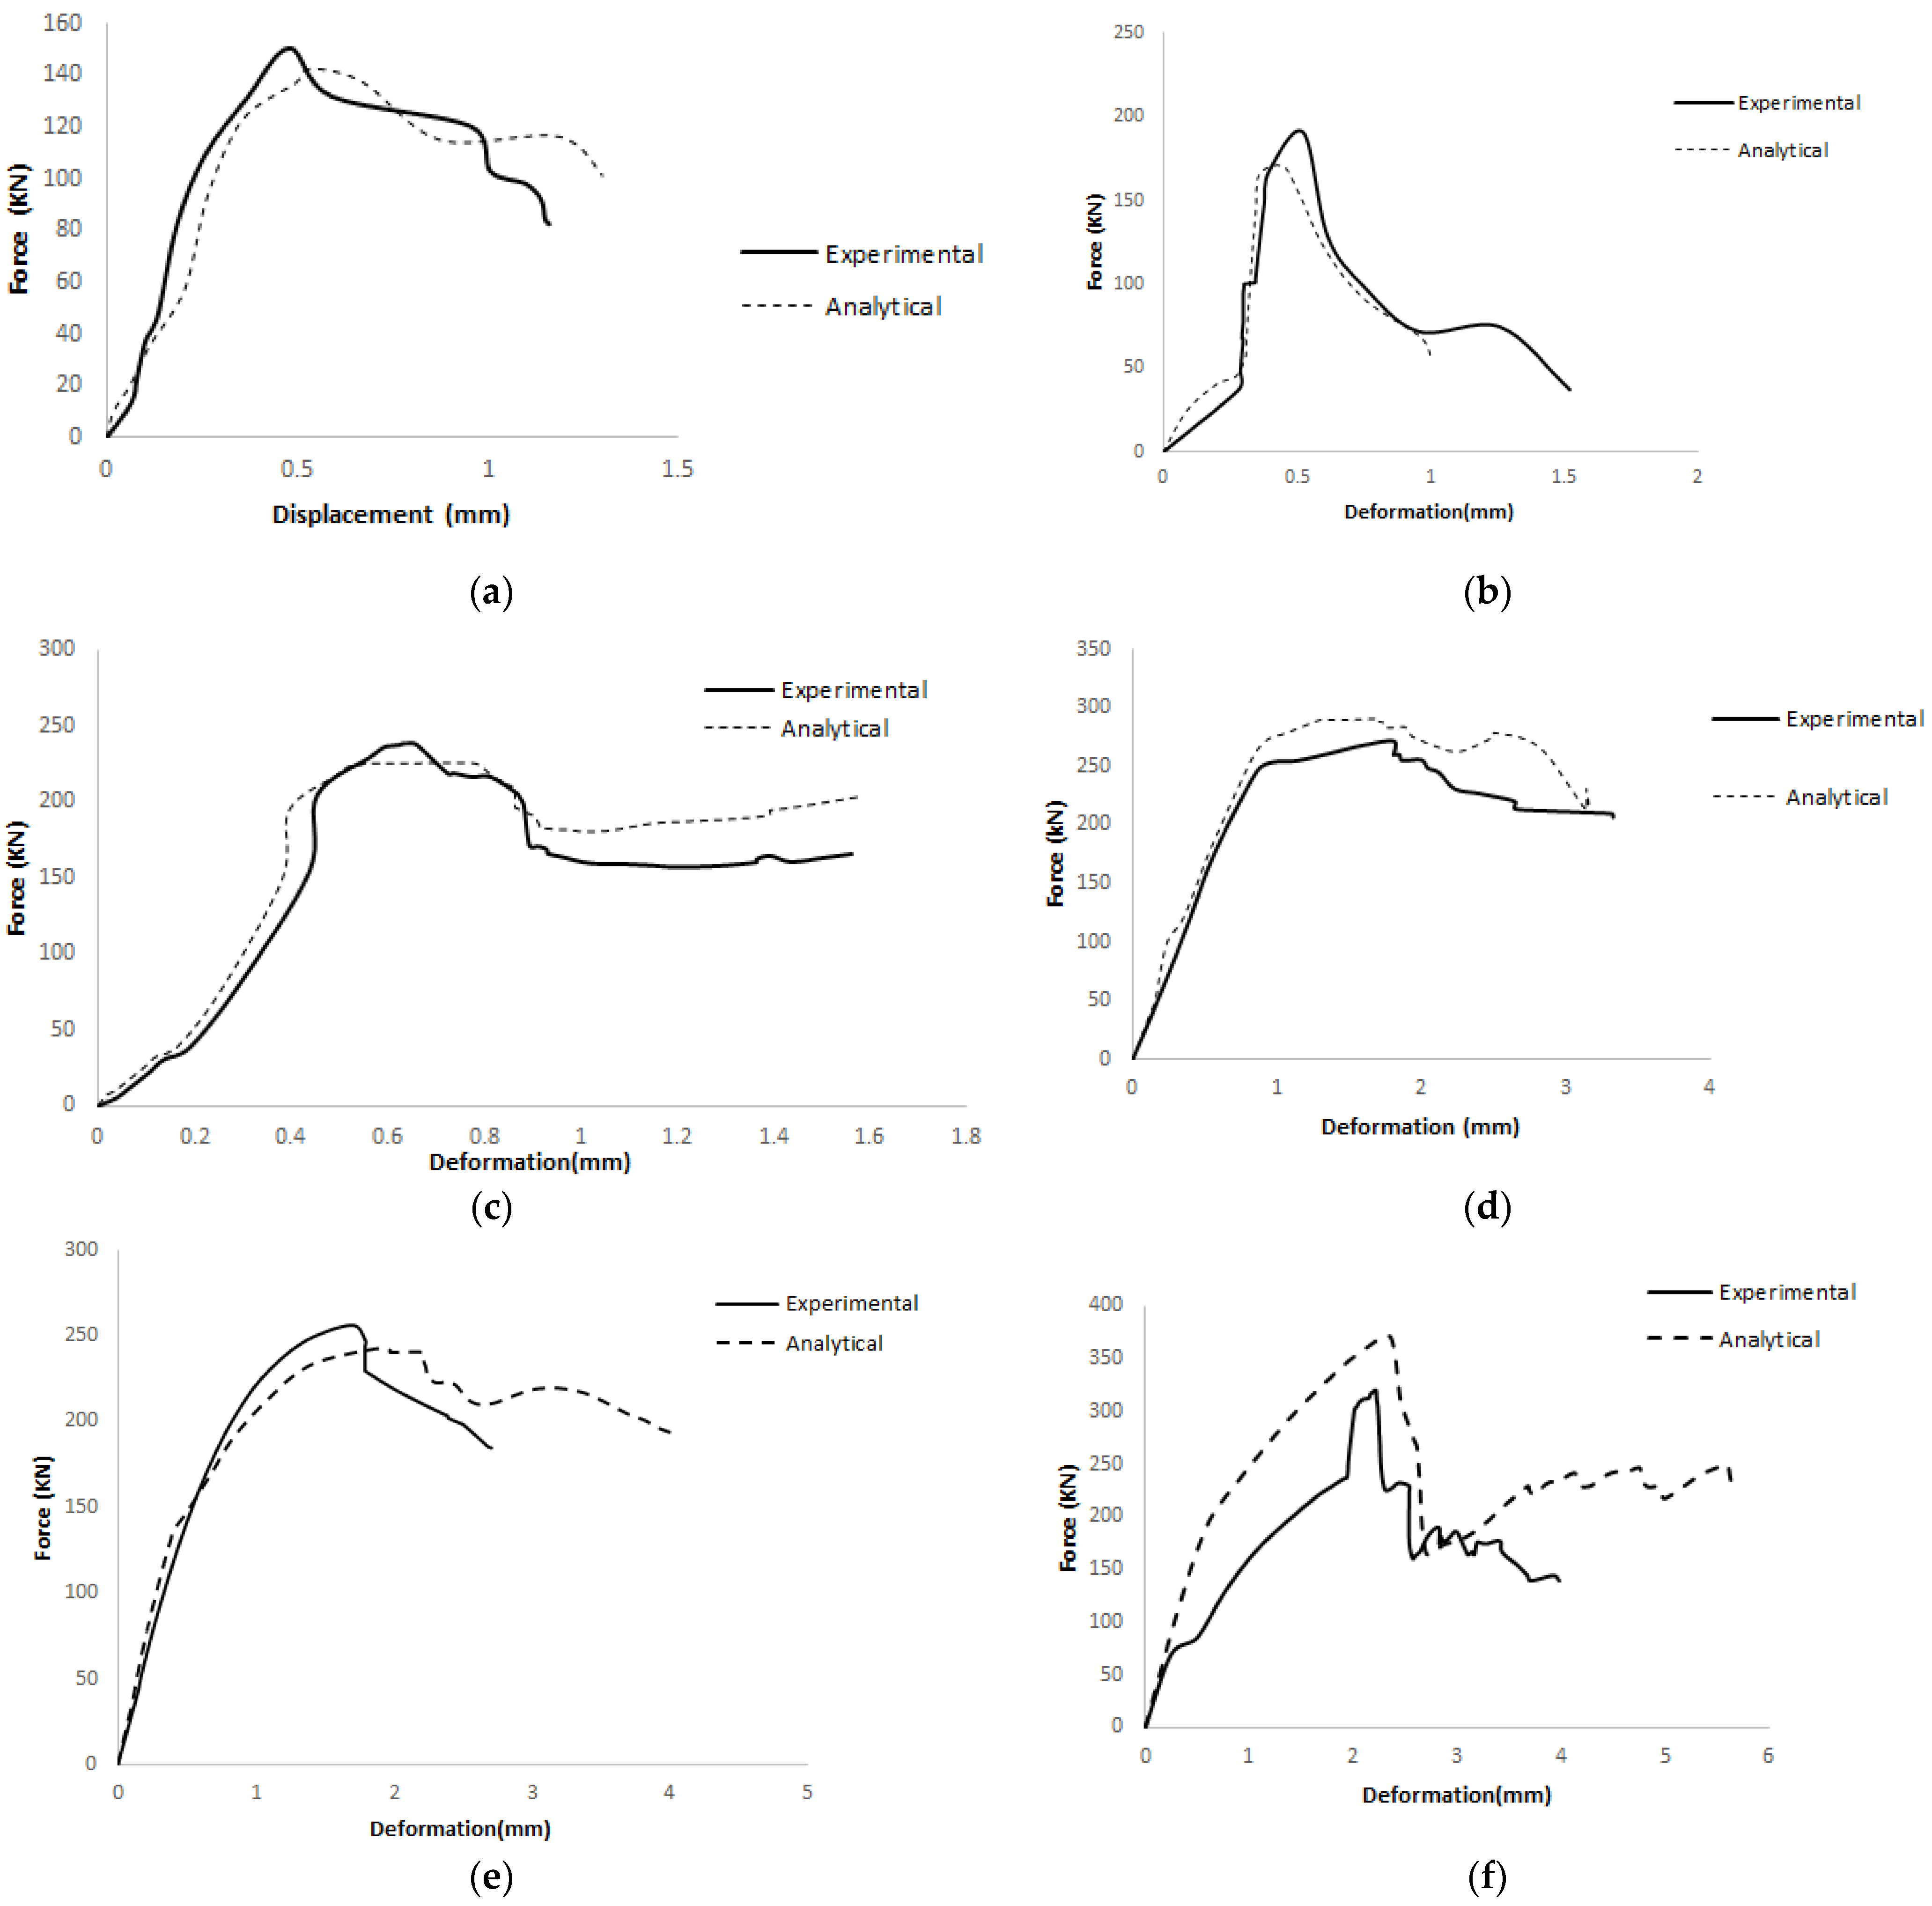
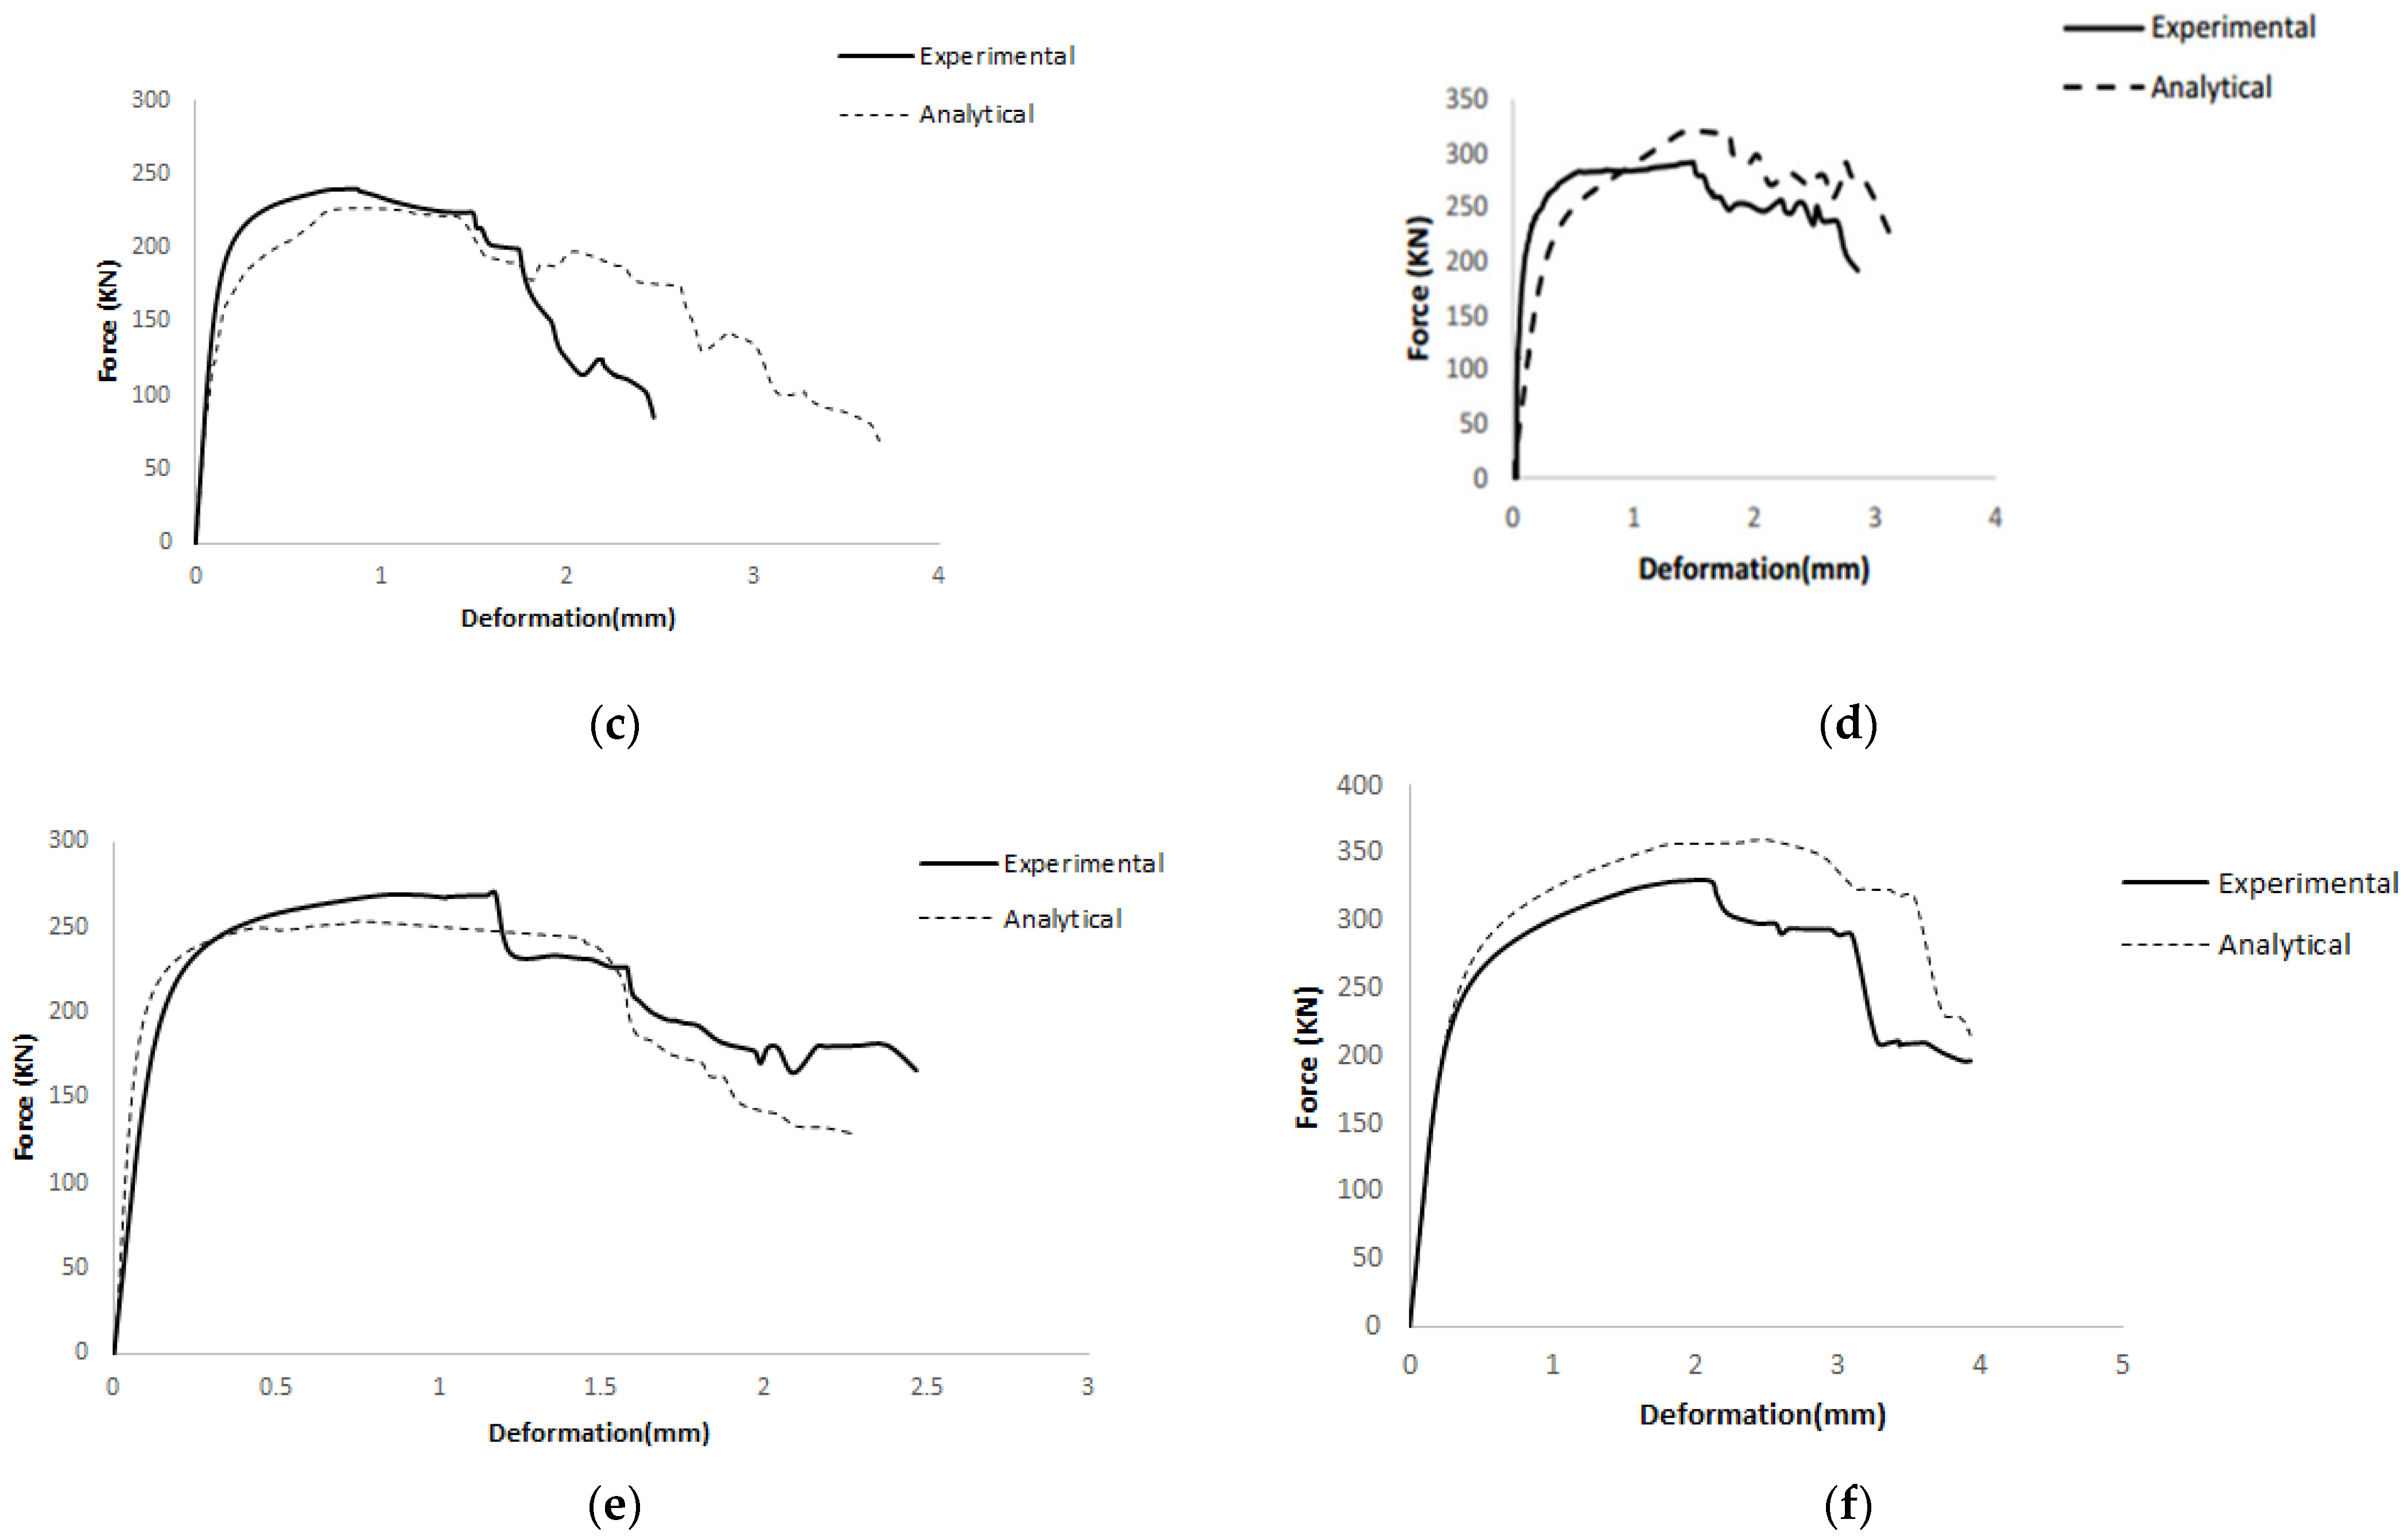
4.2. Axial Compression Behavior of Brick Walls with Abaqus

Load–deformation curves for the double brick wall specimens are presented in Figure 23. The comparison between the experimental results and the Abaqus simulations shows a reasonably good agreement (Table 4). The percentage differences between the experimental and analytical maximum load values for the W07, W08, W09, W10, W11, and W12 were 3.19%, 5.19%, 4%, −1.9%, 4.94%, and 6.46%. Similarly, the percentage differences in maximum deformation for these walls were −7.69%, −7.14%, −5.41%, −8.70%, 2.13%, and 3.43%, respectively. For the single-brick wall specimens, the load–deformation curves are shown in Figure 24. The agreement between the experimental and Abaqus results was also found to be reasonably good. The percentage differences in maximum deformation between the experimental and analytical results for the W01, W02, W03, W04, W05, and W06 were −10.77%, 6.67%, −1.67%, 7.96%, −12.38%, and 5.96%. The percentage differences in maximum load for these walls were 7.86%, 8.57%, 4.49%, −2.73%, 6.22%, and −5.88%, respectively.

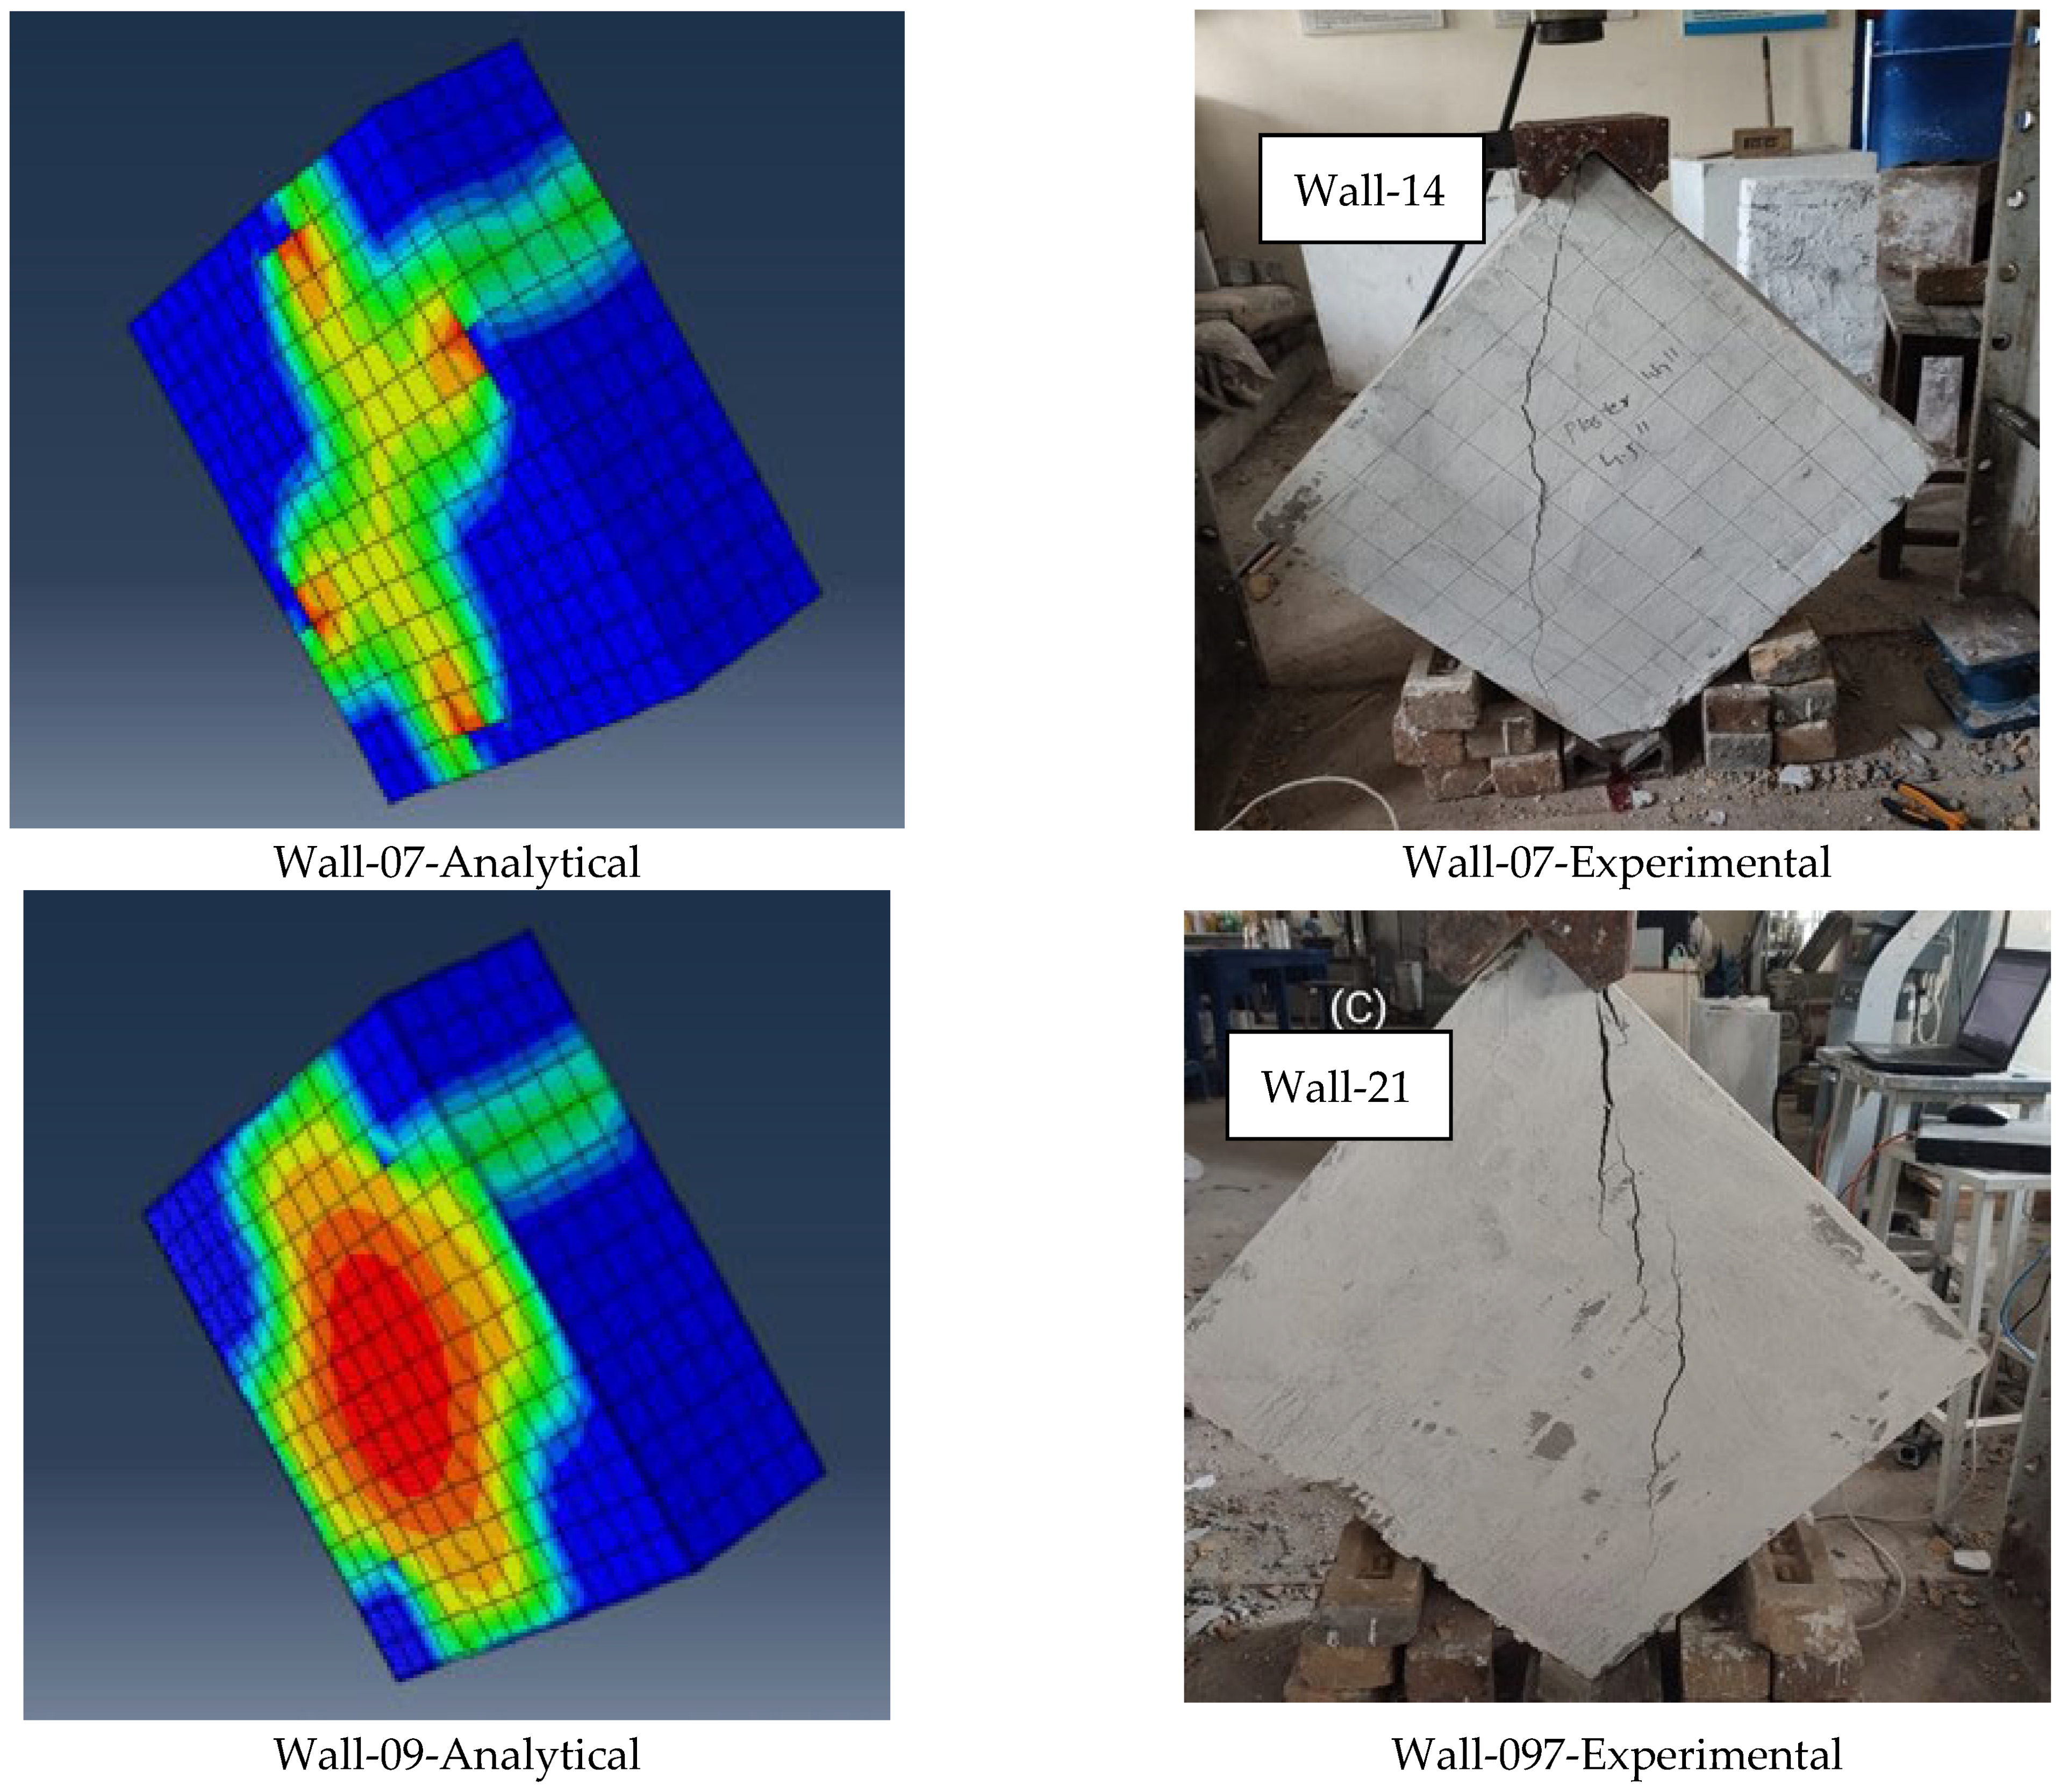
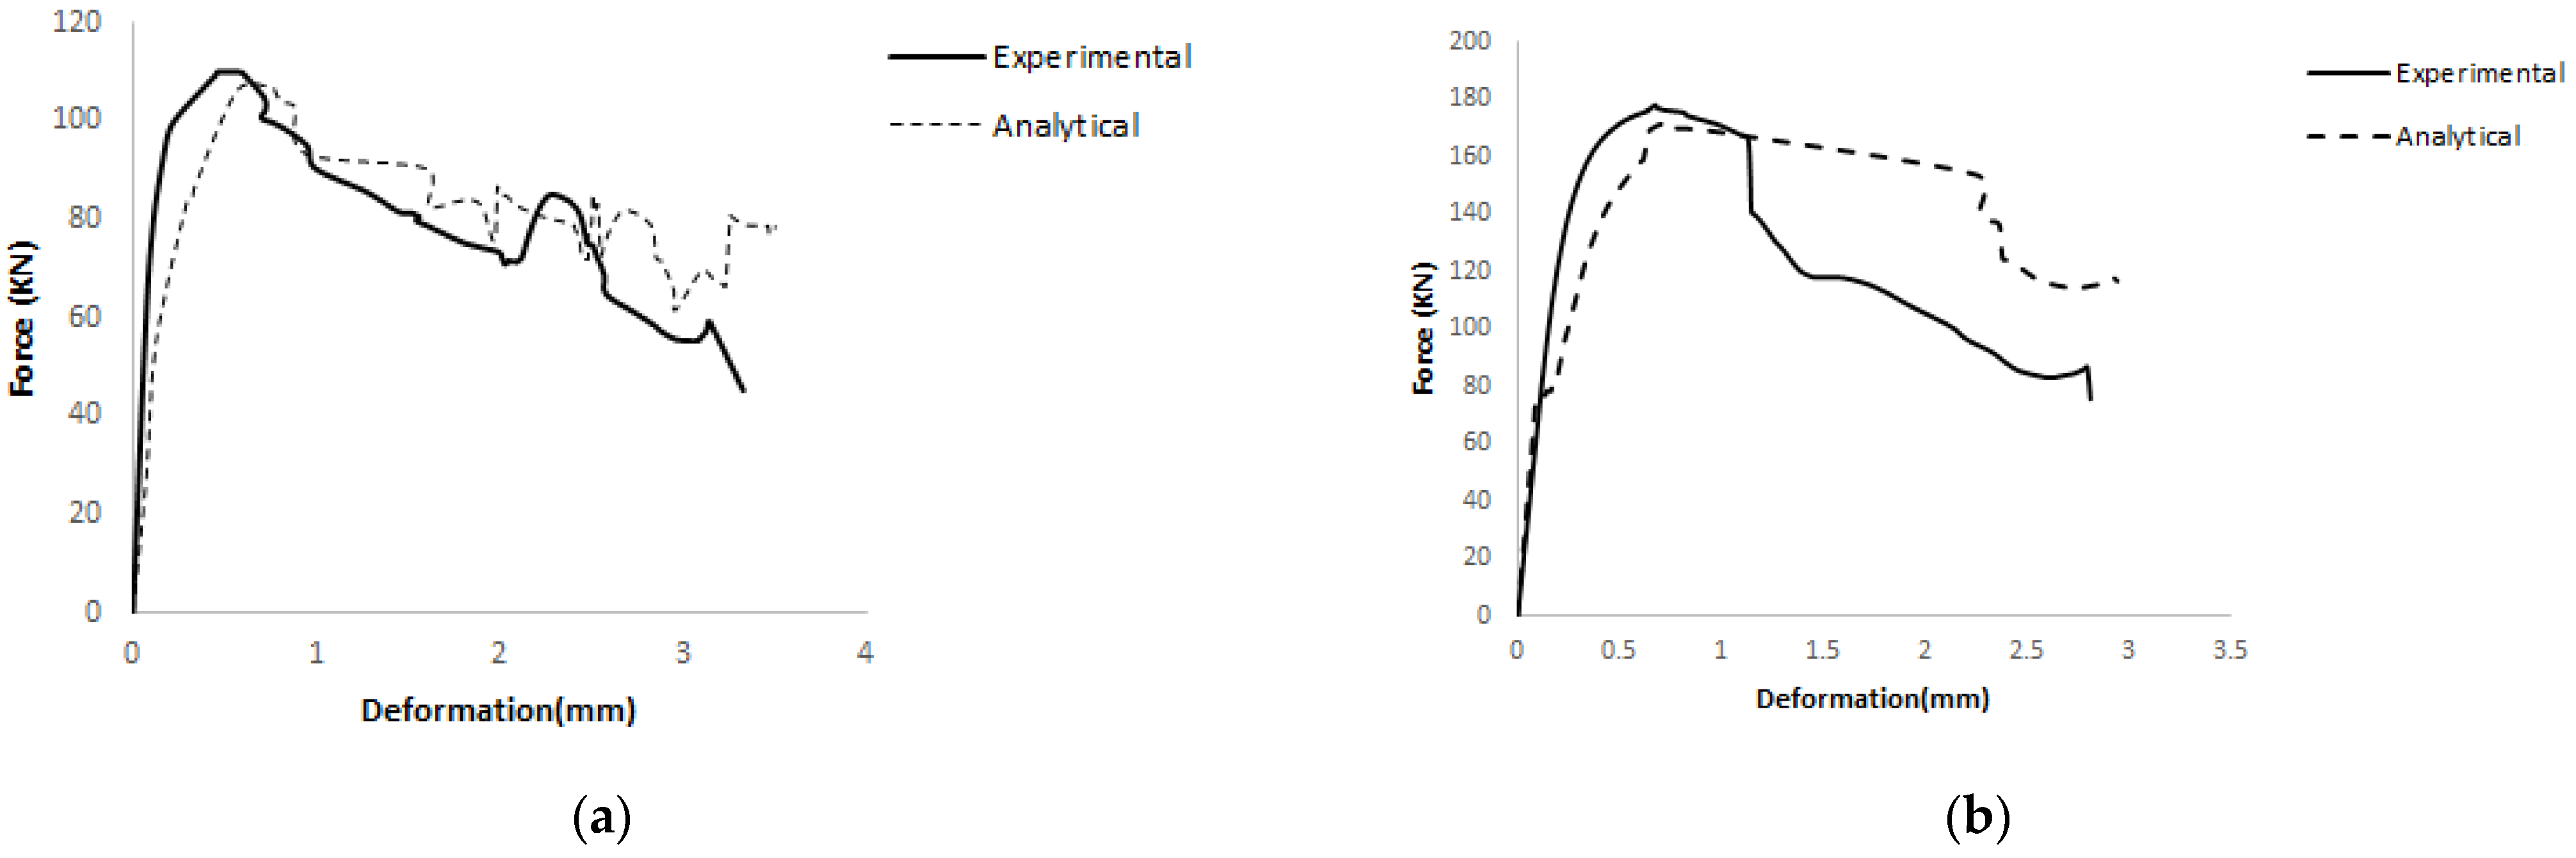
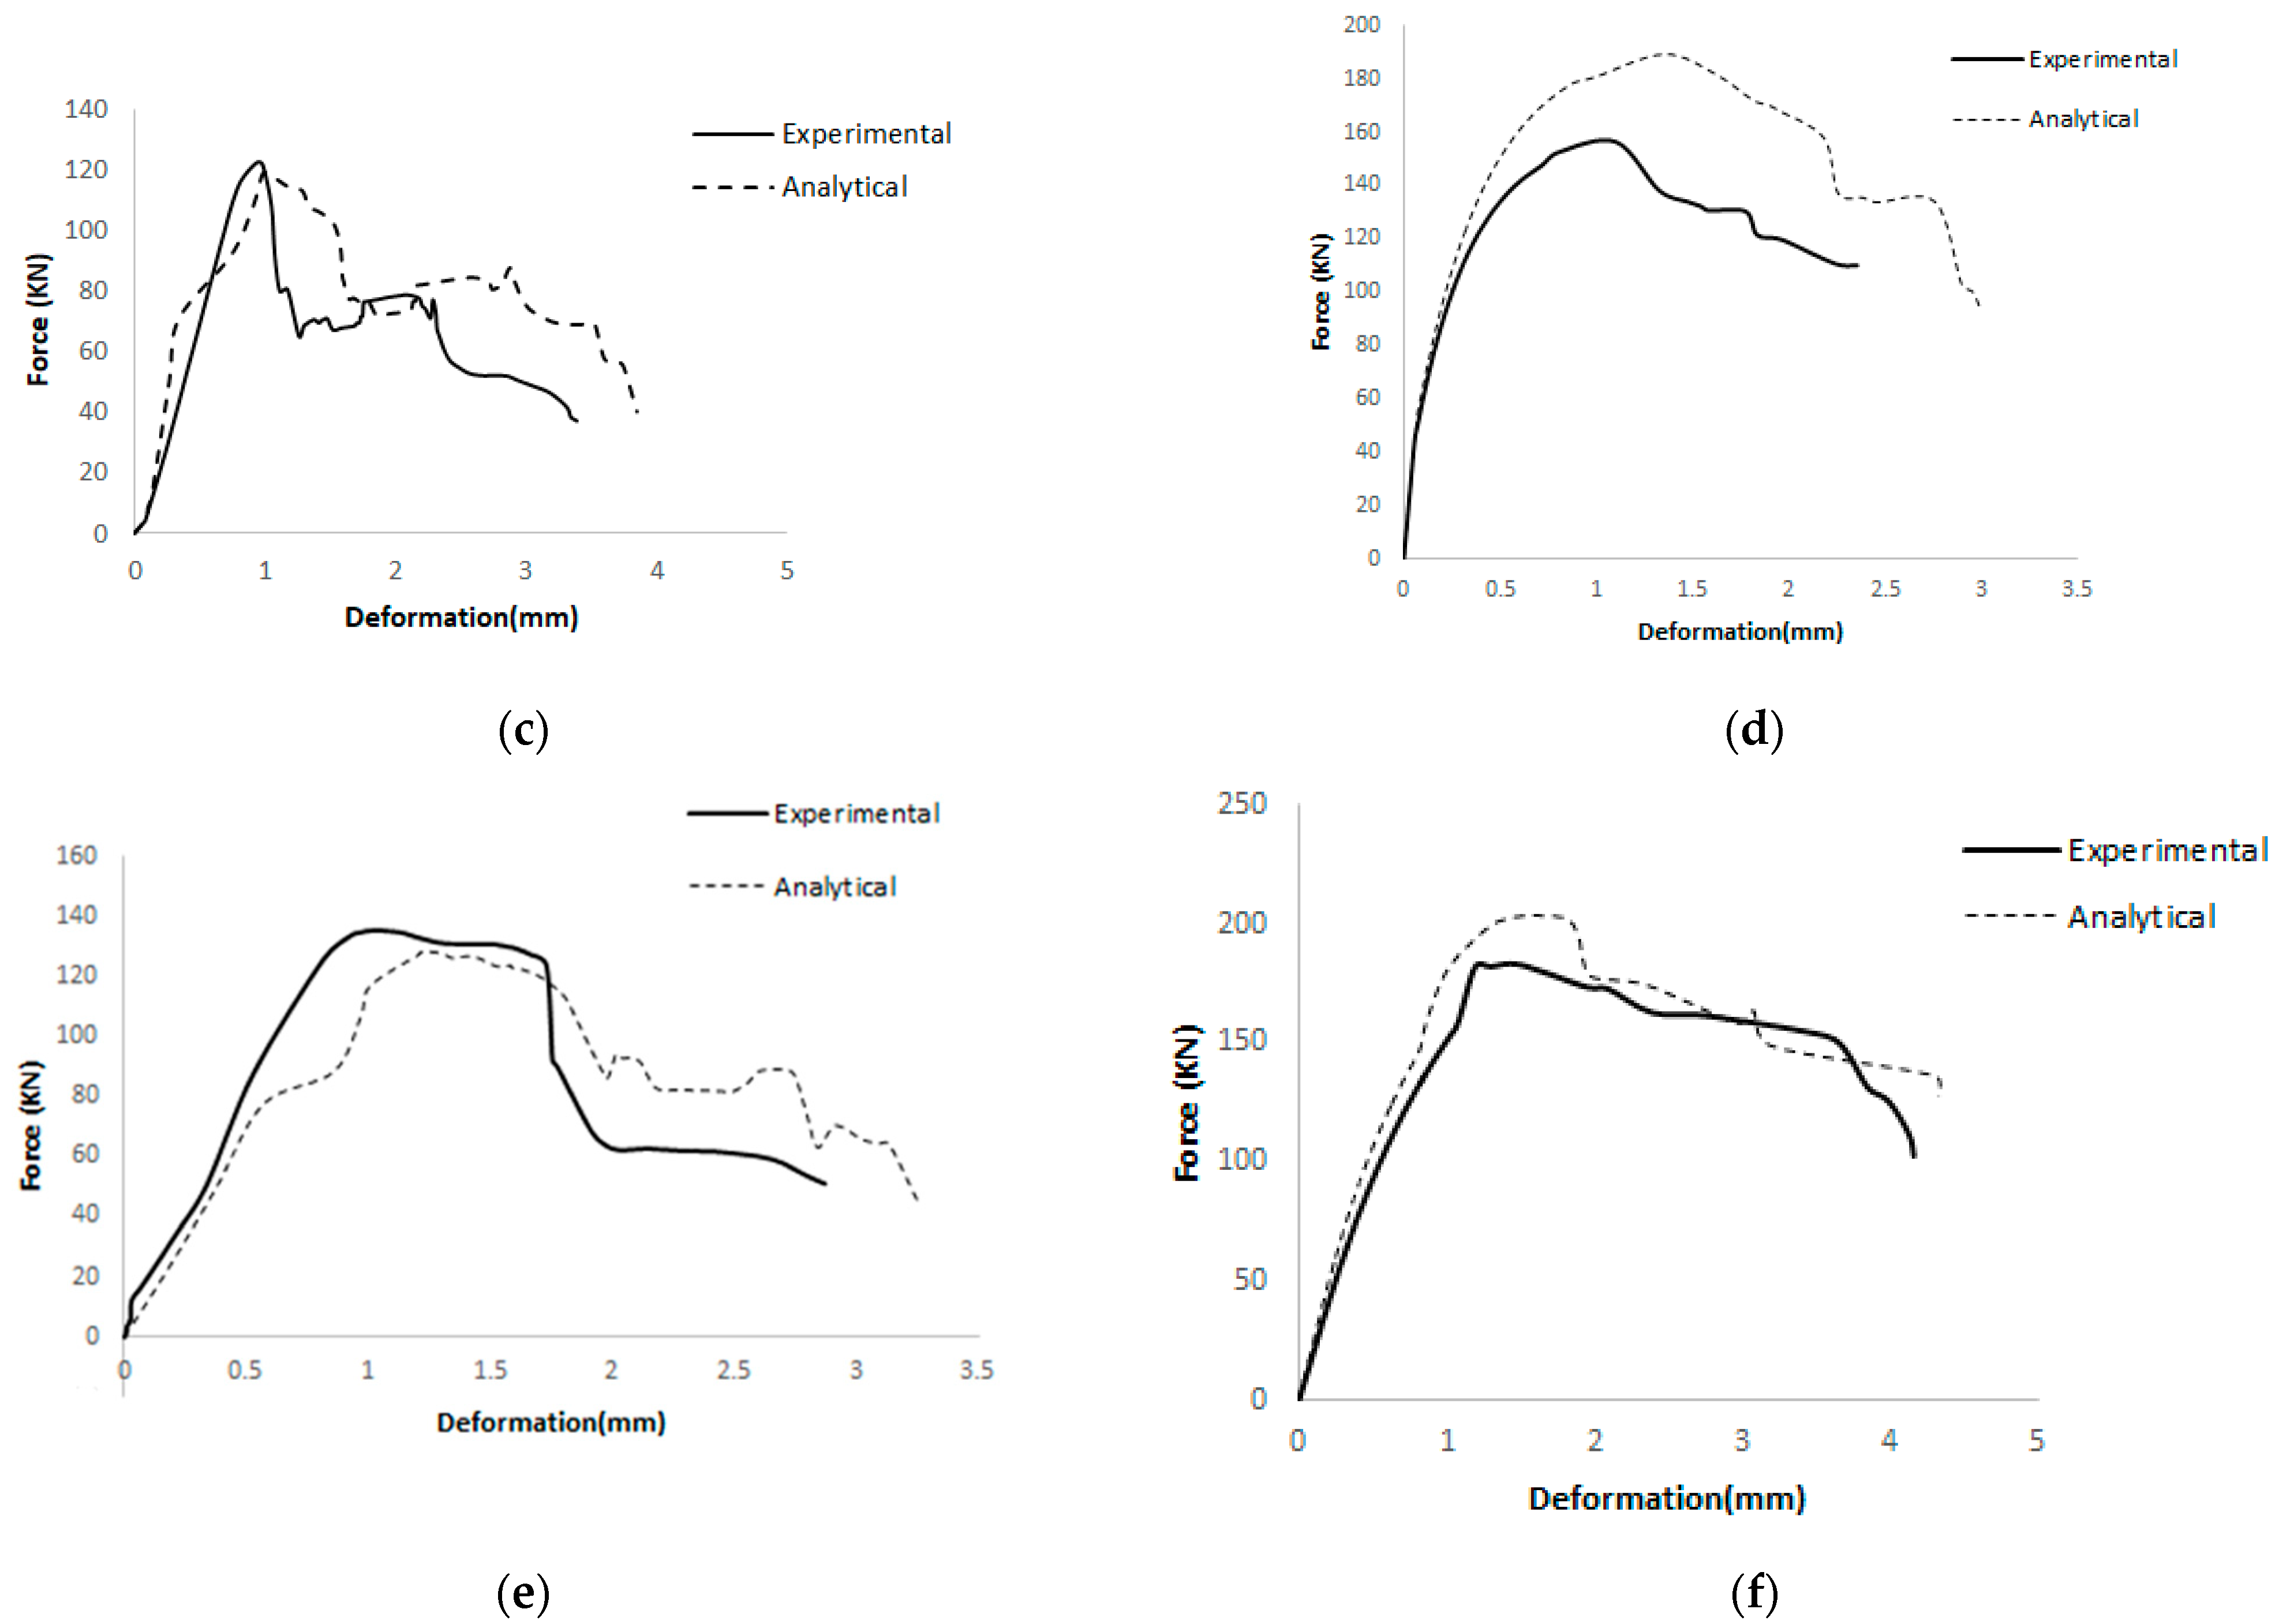
4.3. Diagonal Compression Behavior of Brick Walls with Abaqus

The load–deformation curves for the double-brick wall specimens are shown in Figure 25. The comparison between the experimental and Abaqus results indicated a reasonably good agreement. The percentage differences between the experimental and analytical maximum load values for the W19, W20, W21, W22, W23, and W24 were 6.78%, 4.71%, 3.85%, −4.35%, 4.35%, and −4.26%. Similarly, the percentage differences in maximum deformation for these walls were −12.50%, −7.84%, −10.43%, −6.88%, −6.93%, and −7.56%, respectively. For the single-brick wall specimens, the load–deformation curves are presented in Figure 26. The agreement between the experimental and Abaqus results was generally good, except for the double-layer steel mesh and double-layer fiberglass mesh, where the differences in maximum load values were significantly higher. This discrepancy is attributed to the non-uniform application of the mesh on the wall specimens. The percentage differences in maximum deformation between the experimental and analytical results for the W13, W14, W15, W16, W17, and W18 were −13.16%, −10.67%, −7.14%, −4.09%, −12.12%, and −6.29%. The percentage differences in maximum load for these walls were 14.81%, 9.64%, 8.0%, −5.21%, 6.09%, and −4.85%, respectively. Although Abaqus model results were quite close to the experimental results in terms of ultimate load and deflections, the issues related to the sudden collapse and delamination’s were not accurately captured by the Abaqus models. Further studies are required regarding these issues. Further, the initial stiffness of the Abaqus models was different than the experimental results, which could be due to the errors in loading setup and uneven surfaces of wall specimens. It is important to note that the damage visualization of typical specimens is shown in Appendix A.

5. Conclusions

Masonry brick walls from the Taxila region were tested under axial and diagonal compression to evaluate their mechanical properties and the effects of reinforcement using single and double layers of steel and fiberglass mesh. Abaqus software was employed to compare the experimental results with analytical simulations. Based on the findings, the following conclusions can be drawn:
  • Double-layer steel mesh exhibited the highest axial and shear strength among all reinforcement types, outperforming double-layer fiberglass mesh, single-layer steel mesh, single-layer fiberglass mesh, plaster walls, and unreinforced brick walls in both single and double brick masonry walls. The brittleness of brick masonry walls was reduced with the application of steel and fiberglass mesh, which, in turn, enhanced the deformation capacity of the walls. The increased strength and enhanced deformation capacity observed in walls reinforced with steel and fiberglass meshes can be attributed to the reduced ductility of the members.
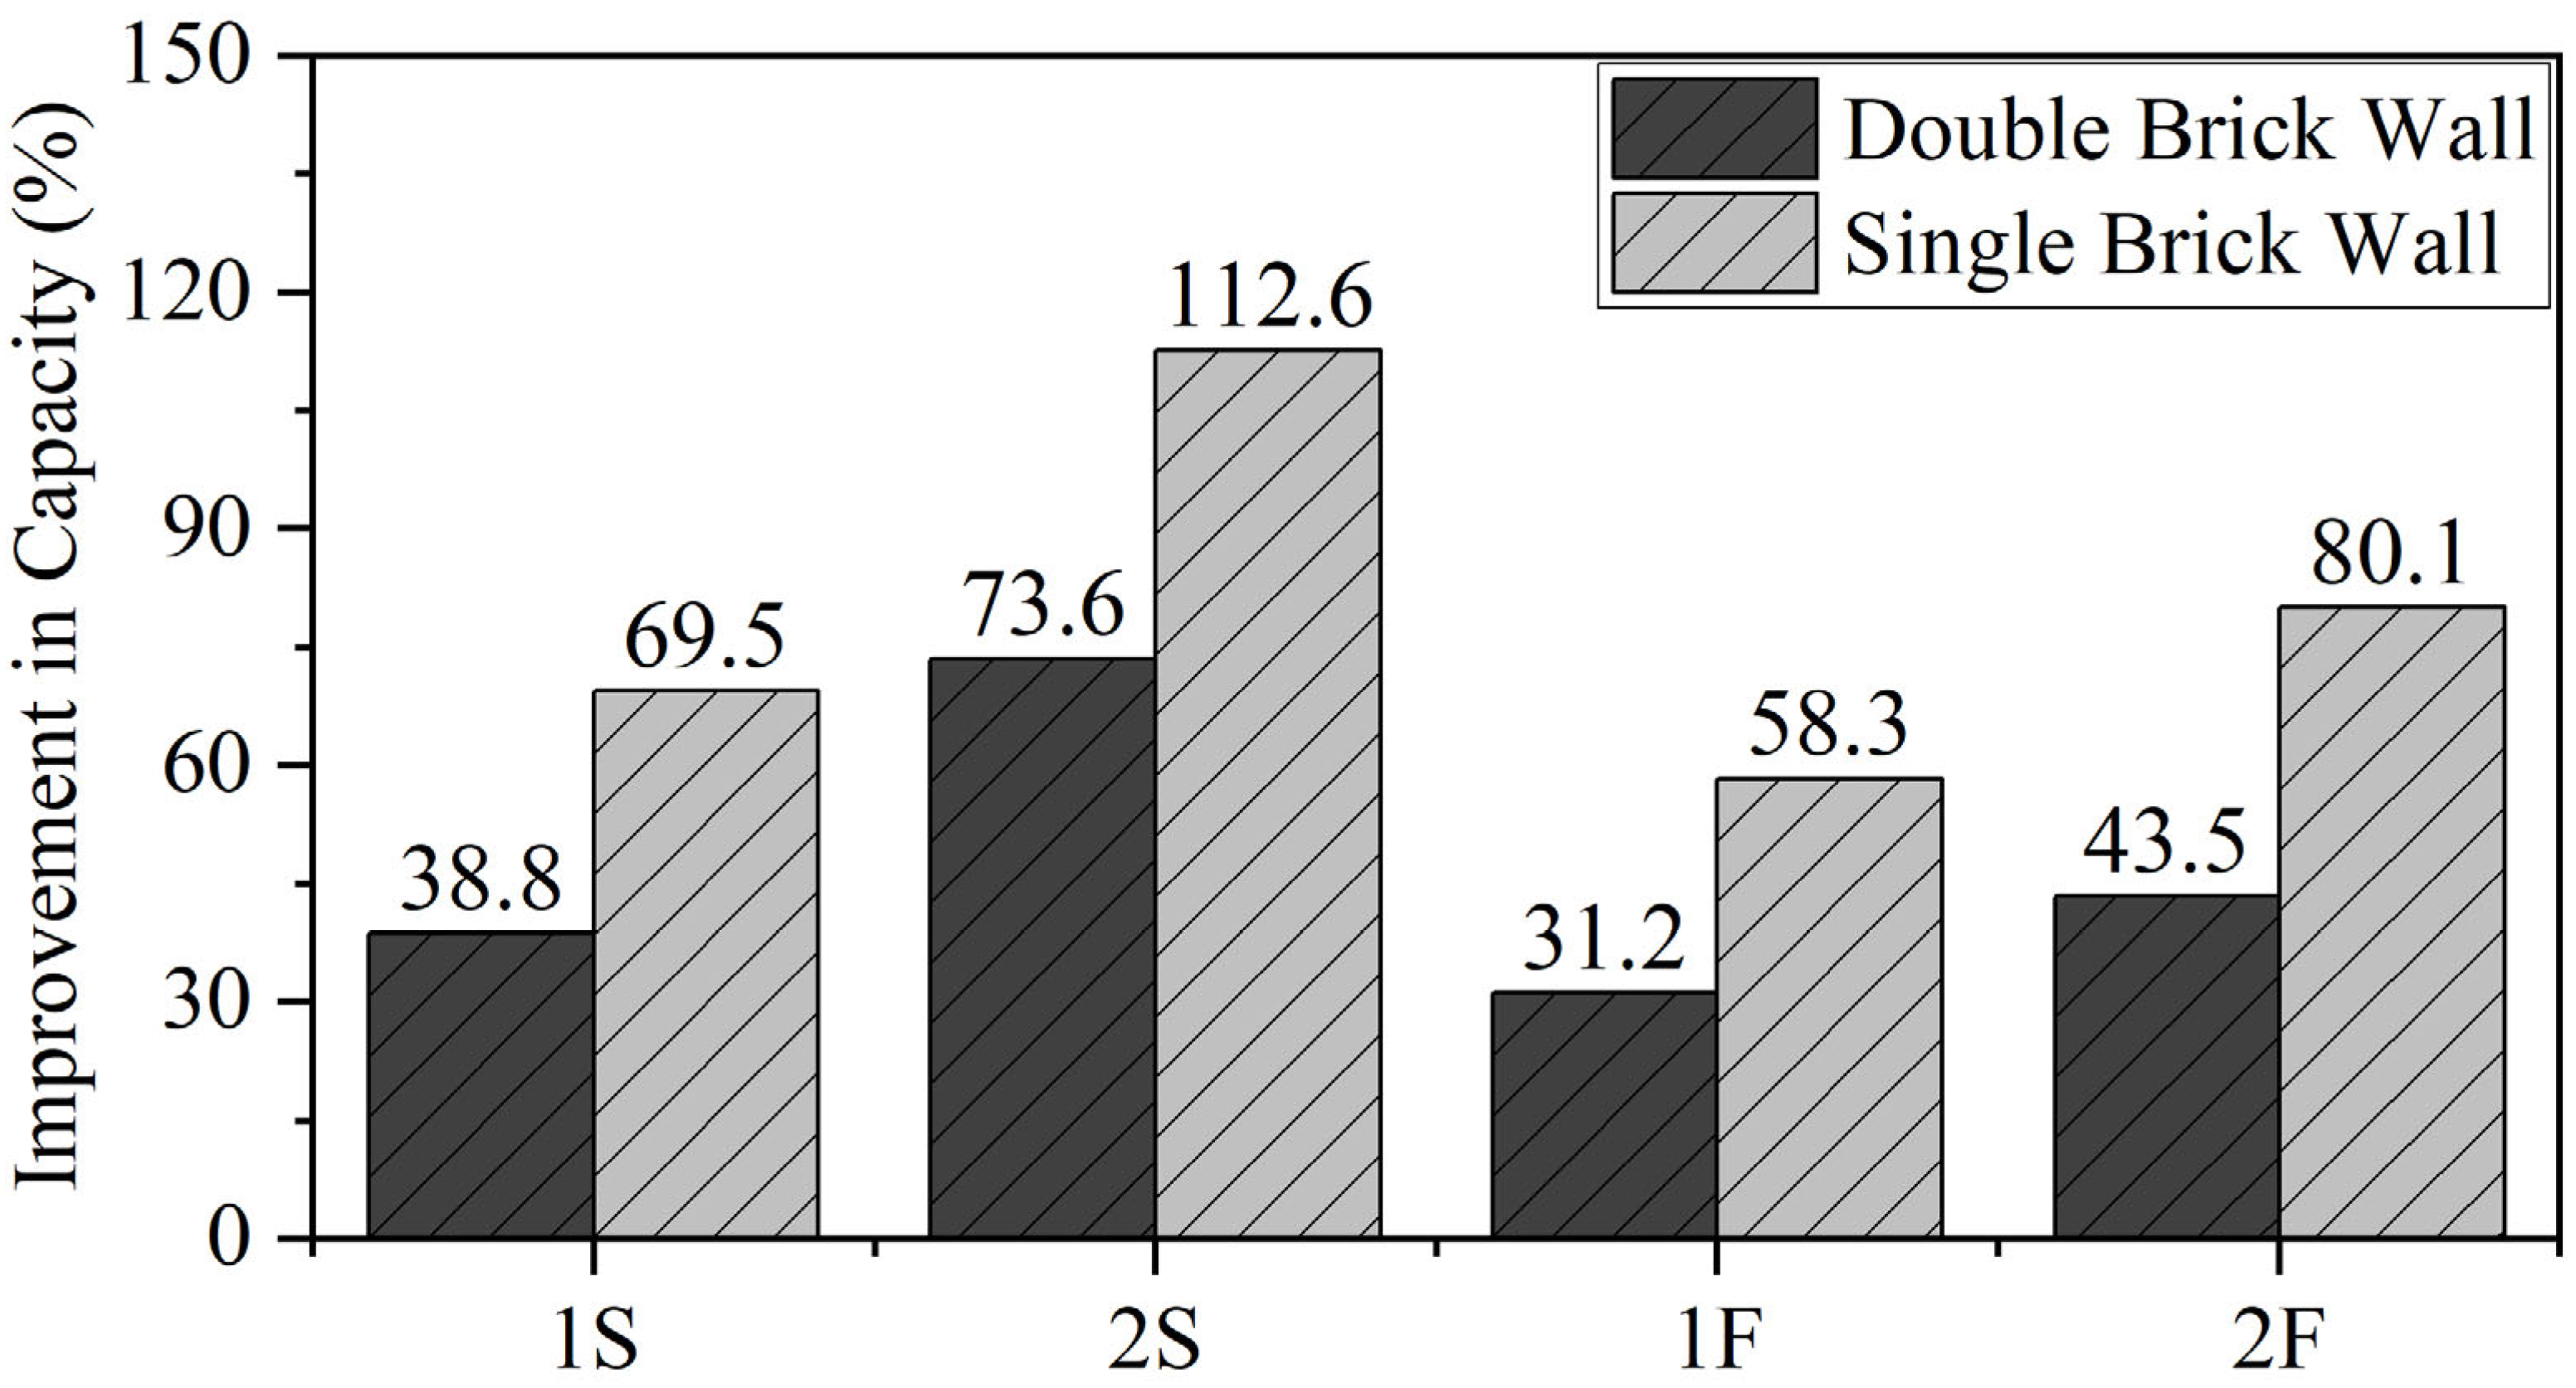
  • The use of single-layer steel mesh, fiberglass mesh, and plaster improved the compressive strength of unreinforced masonry walls by 69.54%, 58.28%, and 25.83%, respectively. Additionally, the application of double-layer steel and fiberglass mesh increased the compressive strength by 112.58% and 80.13%, respectively, in single-brick walls. For double-brick walls, the compressive strength was enhanced by 38.76%, 31.18%, and 19.67% with single-layer steel mesh, fiberglass mesh, and plaster, respectively, compared to the control samples. Furthermore, the use of double-layer steel and fiberglass meshes increased the compressive strength of double-brick walls by 73.60% and 43.54%, respectively, compared to unreinforced counterparts. The greater percentage increase in compressive strength in single-brick walls is attributed to the fact that load transfer from the brick to the steel mesh occurs at lower loads compared to the load transfer mechanism in double brick walls.
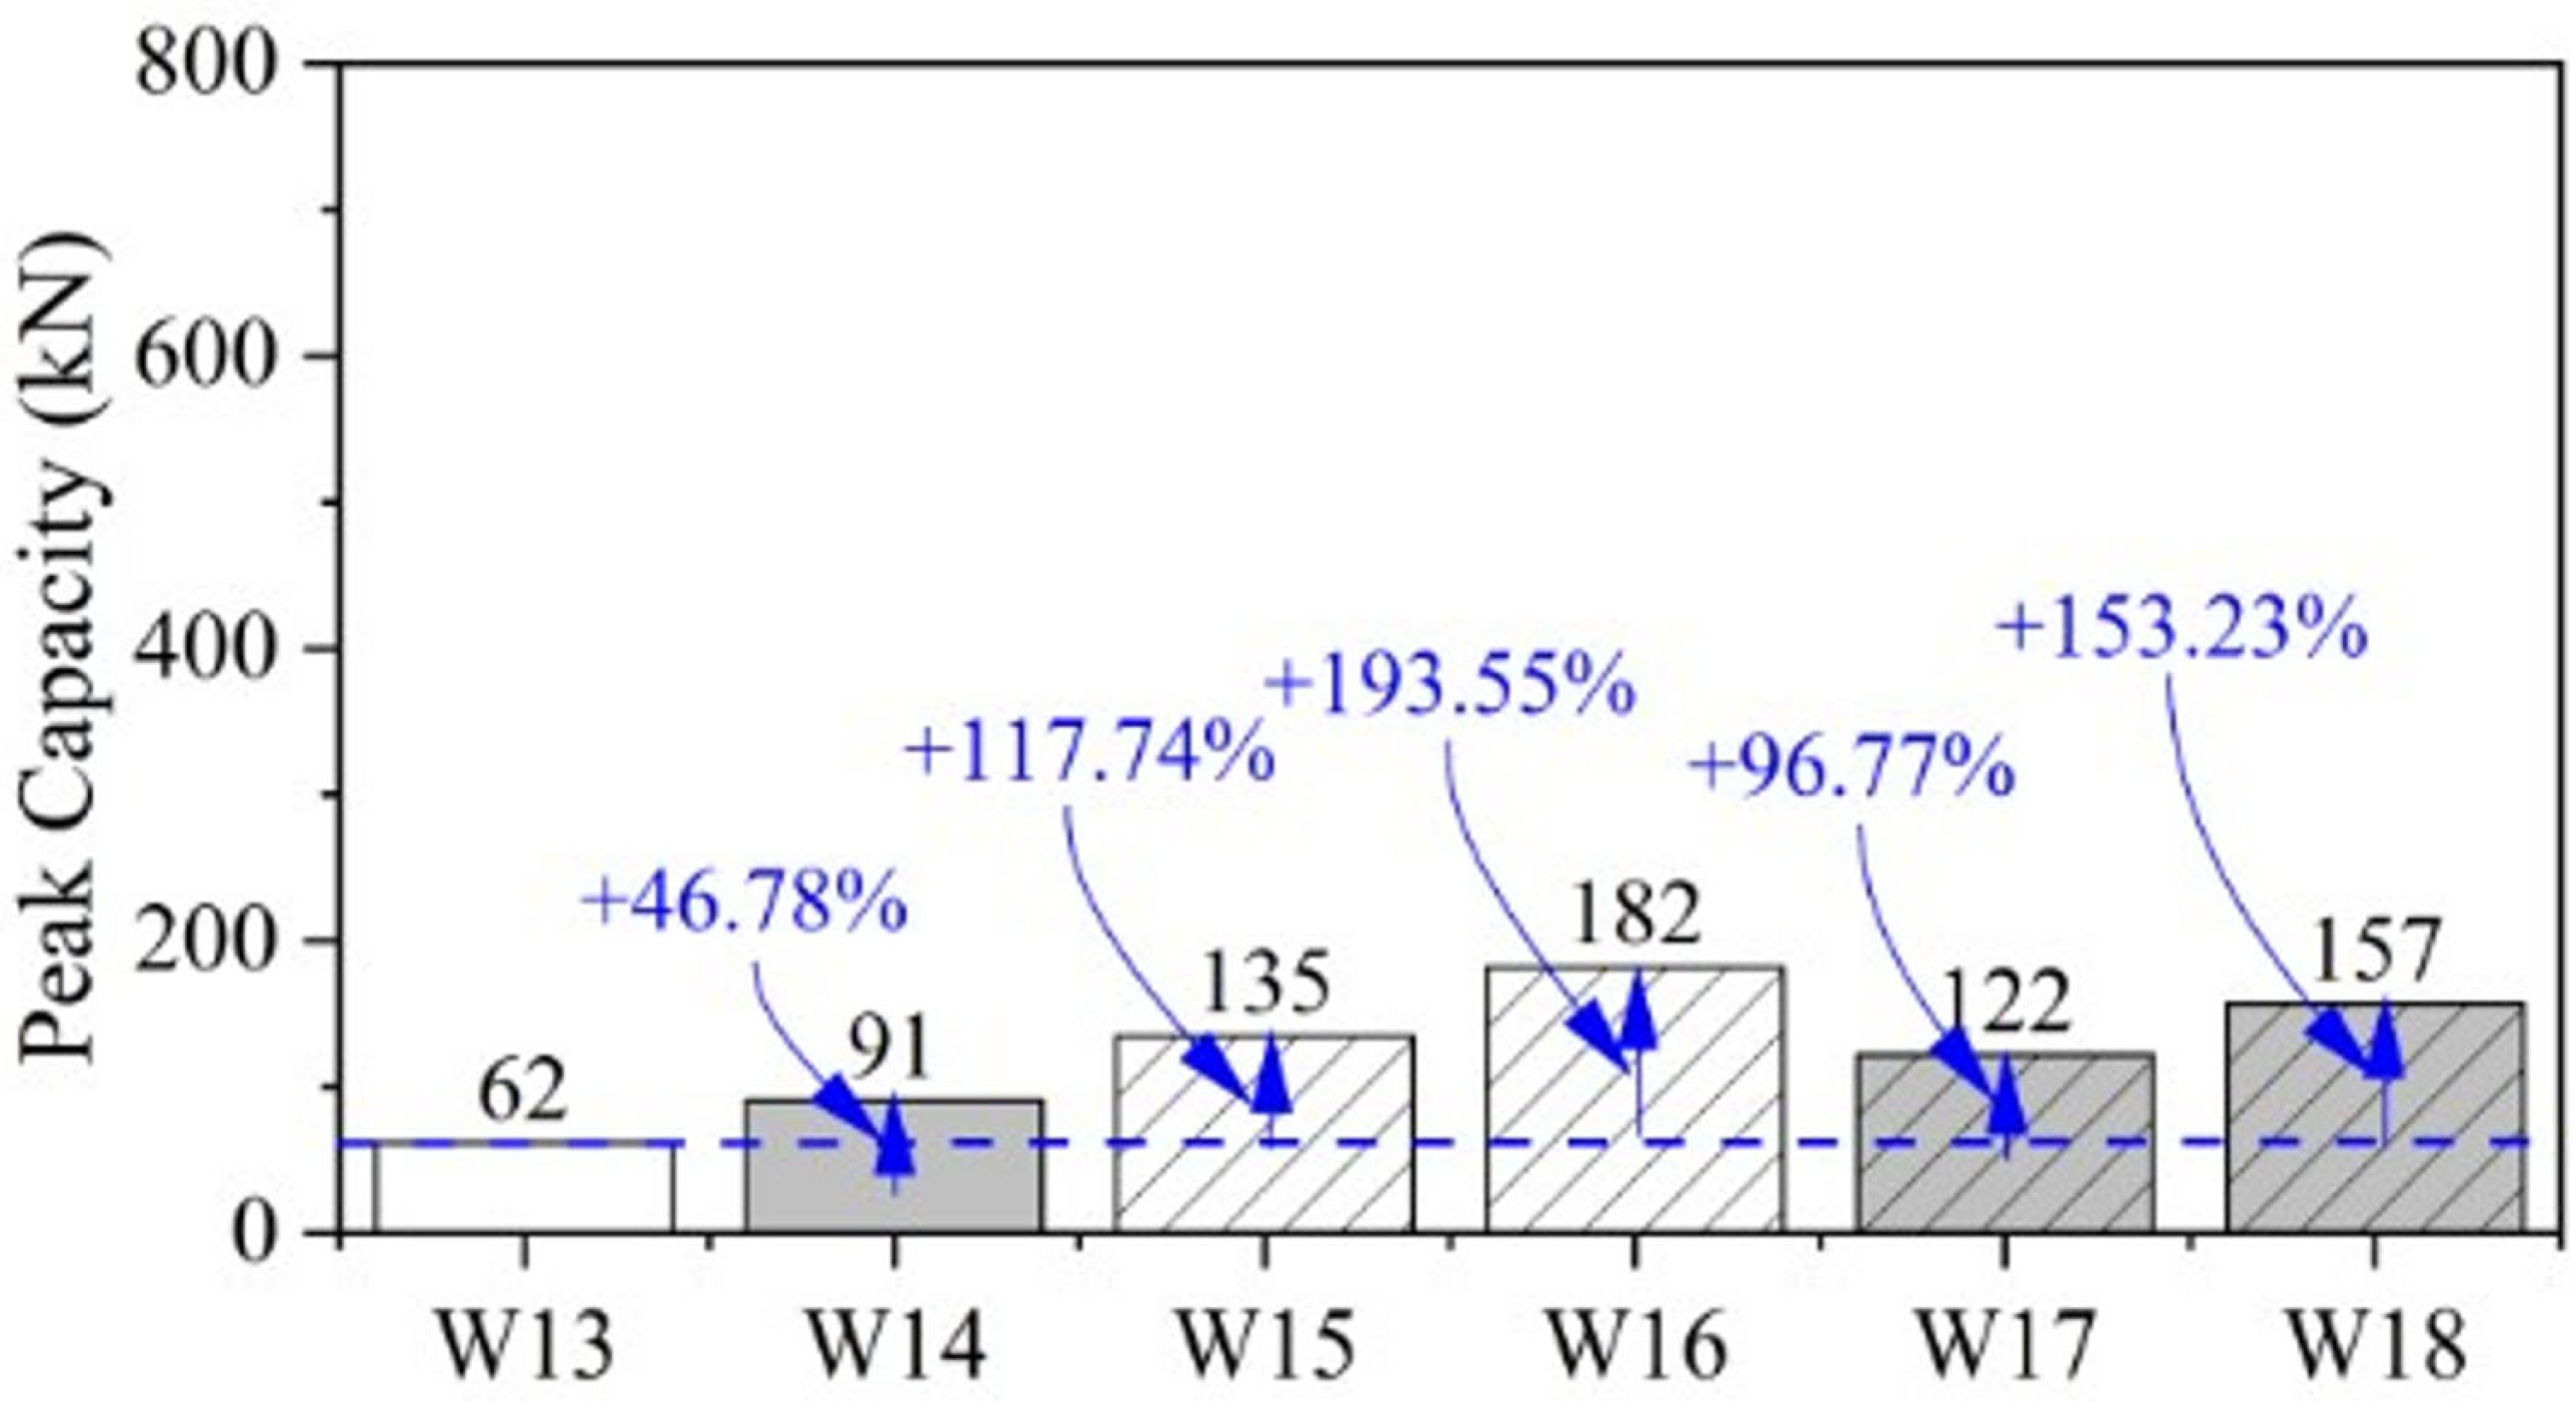
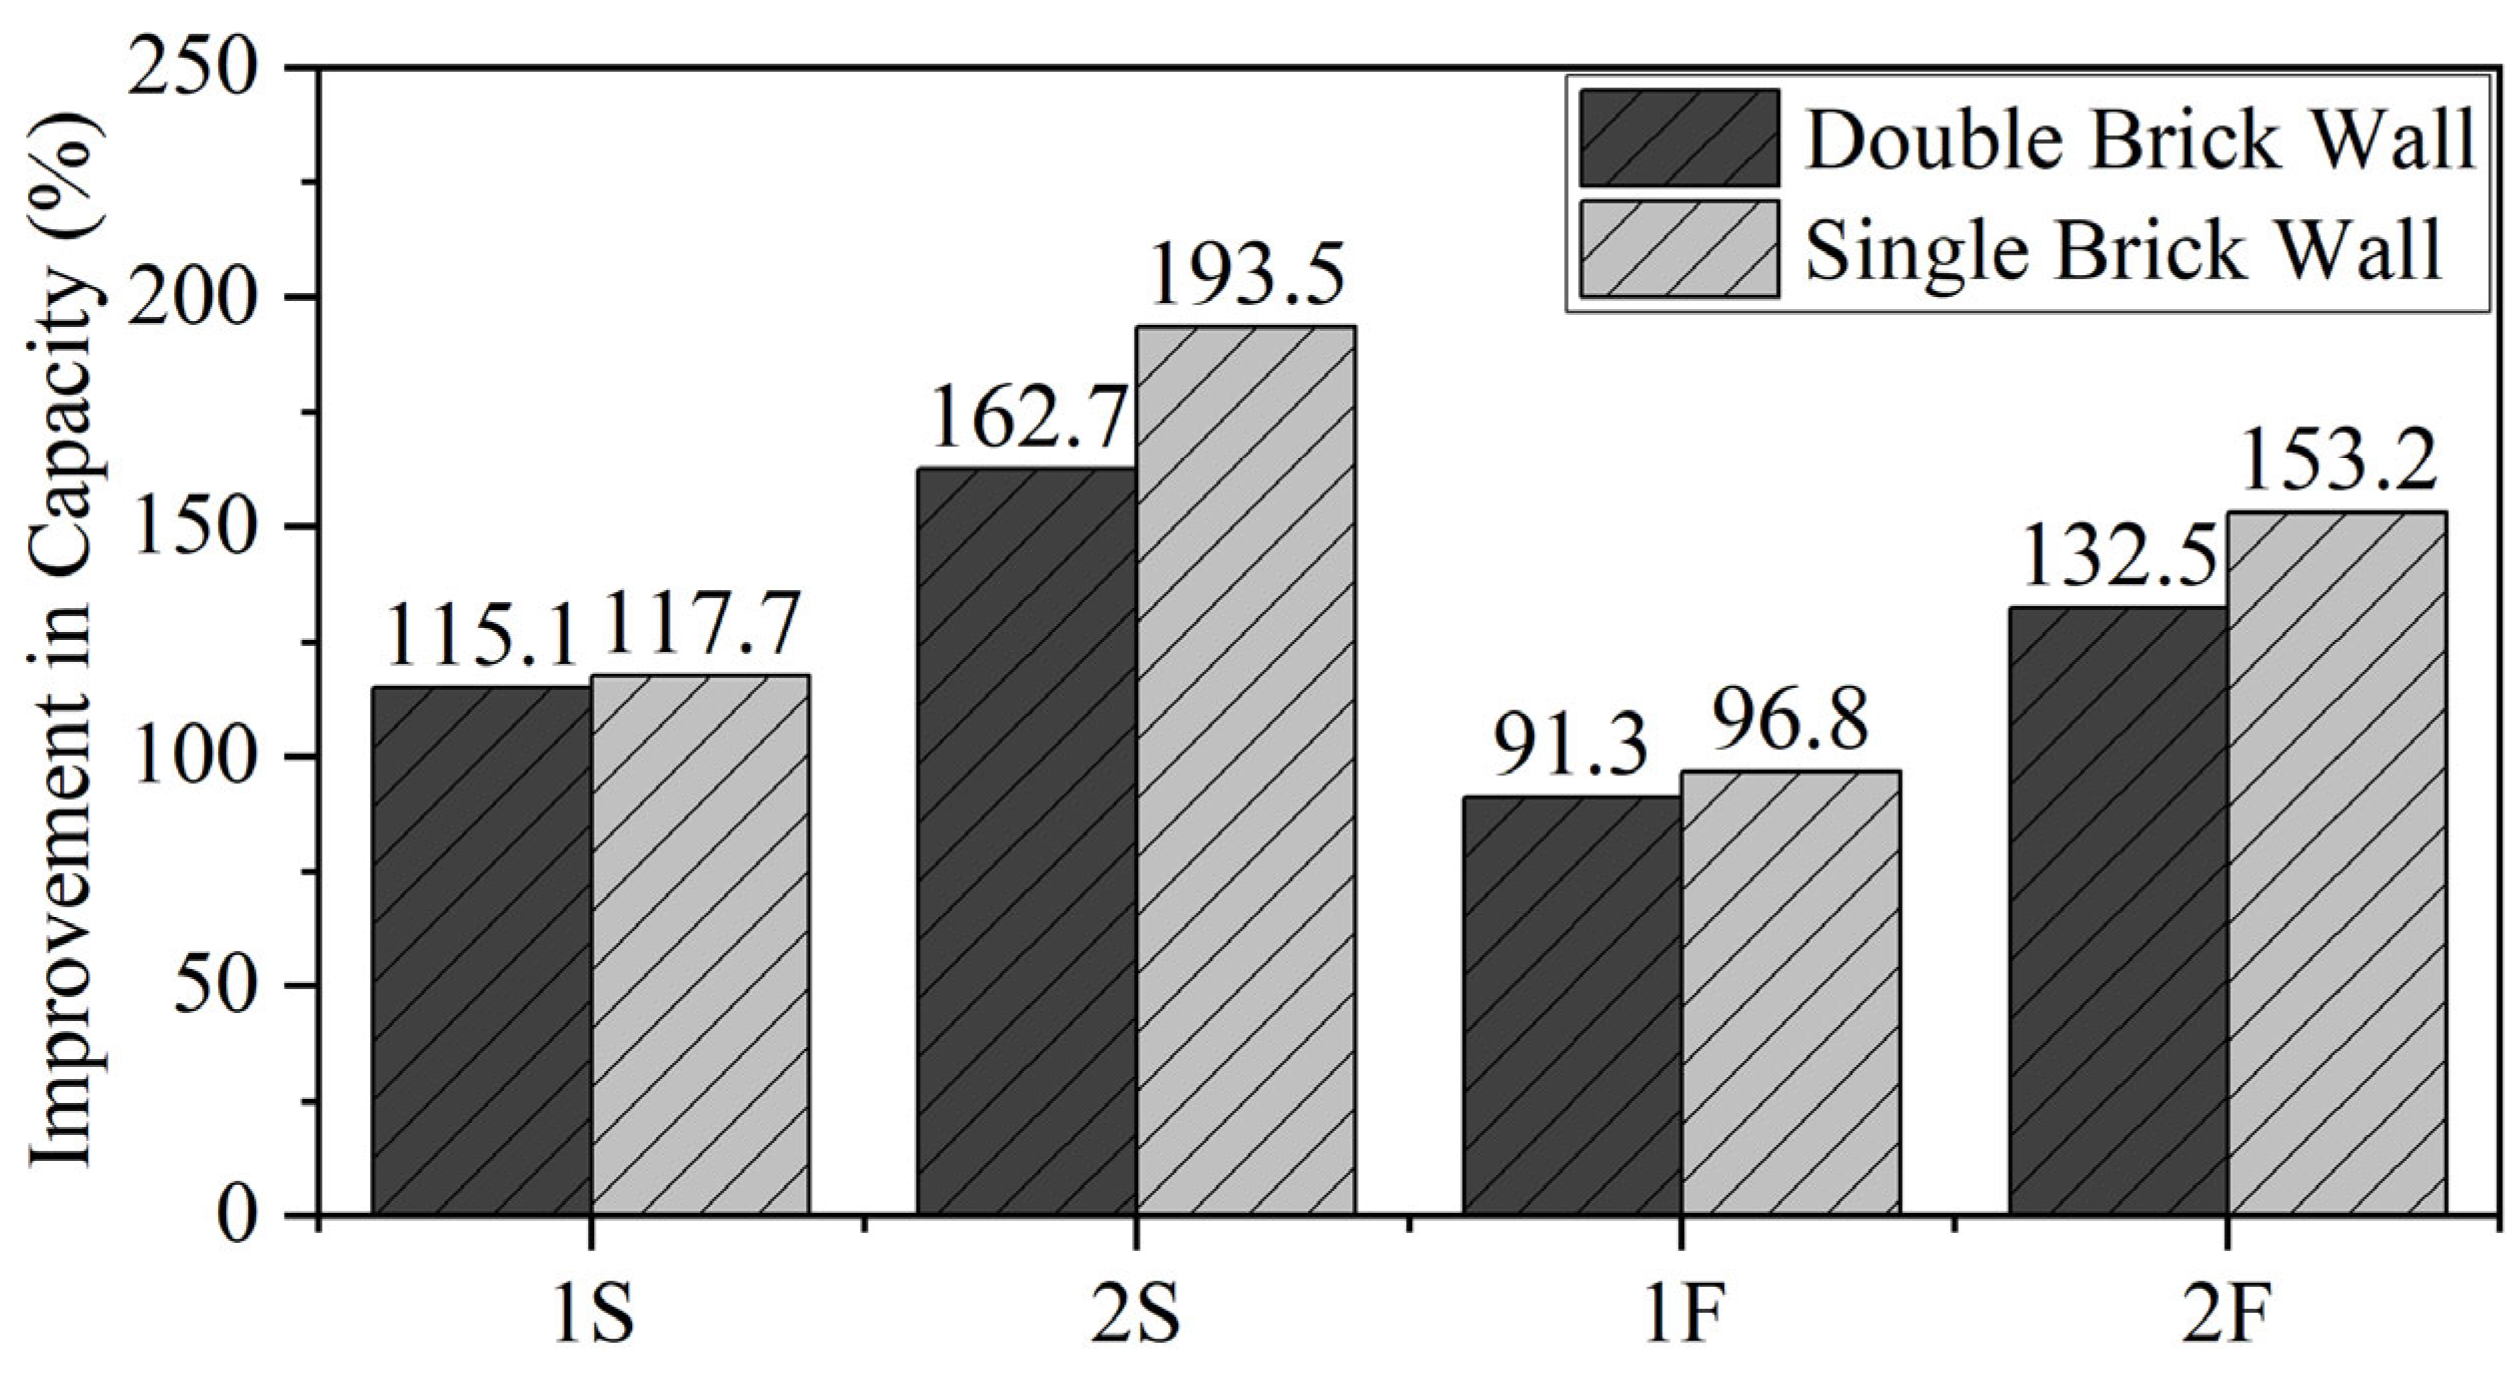
  • The use of single-layer steel mesh, fiberglass mesh, and plaster enhanced the shear strength of double-brick walls by 117.74%, 96.77%, and 46.78%, respectively, compared to the control samples. Additionally, double-layer steel mesh and double-layer fiberglass mesh increased the shear strength by 193.55% and 153.23%, respectively, due to the mesh wires being oriented parallel to the direction of stresses, allowing them to behave in tension.
  • The results obtained from Abaqus software showed good agreement with the experimental findings. The experimental results for double-layer steel mesh, double-layer fiberglass mesh, single-layer steel mesh, and single-layer fiberglass mesh were compared and validated using commercial software. The overall percentage difference between the experimental and analytical results was less than 10%.

Author Contributions

Conceptualization, T.M., M.A.A., B.C., G.S.-I., P.S., A.E., Q.H., P.J., and S.S.; methodology, S.S.; writing—original draft, T.M., M.A.A., B.C., G.S.-I., P.S., A.E., Q.H., P.J., and S.S.; writing—review and editing, T.M., M.A.A., B.C., G.S.-I., P.S., A.E., Q.H., P.J., and S.S. All authors have read and agreed to the published version of the manuscript.

Funding

Research Funding Received from the Science, Research and Innovation Promotion Fund for Fiscal Year 2025 (Contract Number 063/2568).

Data Availability Statement

The original contributions presented in this study are included in the article. Further inquiries can be directed to the corresponding author.

Acknowledgments

Research Funding Received from the Science, Research and Innovation Promotion Fund for Fiscal Year 2025 (Contract Number 063/2568). Thanks, are also extended to the Civil Engineering Department, COMSATS University Islamabad (CUI), Wah campus, for supporting test facilities.

Conflicts of Interest

The authors declare no conflict of interest.

Appendix A

Figure A1. Typical comparison of failure modes (axial).
Buildings 15 02180 g0a1aBuildings 15 02180 g0a1b
Figure A2. Typical comparison of failure modes (diagonal).
Buildings 15 02180 g0a2

References

  1. Almssad, A.; Almusaed, A.; Homod, R.Z. Masonry in the Context of Sustainable Buildings: A Review of the Brick Role in Architecture. Sustainability 2022, 14, 14734. [Google Scholar] [CrossRef]
  2. Maione, A.; Casapulla, C.; Di Ludovico, M.; Prota, A.; Ceroni, F. Efficiency of injected anchors in connecting T–shaped masonry walls: A modelling approach. Constr. Build. Mater. 2021, 301, 124051. [Google Scholar] [CrossRef]
  3. Papanicolaou, C.G.; Triantafillou, T.; Papathanasiou, M.; Karlos, K. Textile reinforced mortar (TRM) versus FRP as strengthening material of URM walls: Out-of-plane cyclic loading. Mater. Struct. 2007, 41, 143–157. [Google Scholar] [CrossRef]
  4. D’aLtri, A.M.; Sarhosis, V.; Milani, G.; Rots, J.; Cattari, S.; Lagomarsino, S.; Sacco, E.; Tralli, A.; Castellazzi, G.; de Miranda, S. Modeling Strategies for the Computational Analysis of Unreinforced Masonry Structures: Review and Classification. Arch. Comput. Methods Eng. 2019, 27, 1153–1185. [Google Scholar] [CrossRef]
  5. Deng, M.; Dong, Z.; Dai, J.; Zhao, X. Out-of-plane strengthening of URM walls using different fiber-reinforced materials. Constr. Build. Mater. 2022, 362, 129597. [Google Scholar] [CrossRef]
  6. Mughal, U.A.; Qazi, A.U.; Ahmed, A.; Abbass, W.; Abbas, S.; Salmi, A.; Sayed, M.M. Impact of openings on the in-plane strength of confined and unconfined masonry walls: A sustainable numerical study. Sustainability 2022, 14, 7467. [Google Scholar] [CrossRef]
  7. Asteris, P.; Chronopoulos, M.; Chrysostomou, C.; Varum, H.; Plevris, V.; Kyriakides, N.; Silva, V. Seismic vulnerability assessment of historical masonry structural systems. Eng. Struct. 2014, 62–63, 118–134. [Google Scholar] [CrossRef]
  8. Joyklad, P.; Ali, N.; Yooprasertchai, E.; Jaffar, S.T.A.; Magbool, H.M.; Hussain, Q.; Chaiyasarn, K. An investigative study for the prediction of compressive strength of cement-clay interlocking (CCI) hollow brick masonry walls. Case Stud. Constr. Mater. 2022, 16, e01001. [Google Scholar] [CrossRef]
  9. Gul, A.; Alam, B.; Shahzada, K. Seismic performance evaluation of unconfined dry stacked block masonry structure. Eng. Struct. 2022, 265, 114529. [Google Scholar] [CrossRef]
  10. Ullah, S.; Farooq, S.H.; Usman, M.; Ullah, B.; Hussain, M.; Hanif, A. In-Plane Seismic Strengthening of Brick Masonry Using Steel and Plastic Meshes. Materials 2022, 15, 4013. [Google Scholar] [CrossRef]
  11. Waseem, M.; Khan, M.A.; Khan, S. Seismic sources for southern Pakistan and seismic hazard assessment of Karachi. Nat. Hazards 2019, 99, 511–536. [Google Scholar] [CrossRef]
  12. Pararas-carayannis, G. pakistan’s earthquake and tsunami hazards potential impact on infrastructure. J. Infect. Dis. 2011, 2, 19–29. [Google Scholar]
  13. Andrabi, T.; Das, J. In Aid We Trust: Hearts and Minds and the Pakistan Earthquake of 2005. Rev. Econ. Stat. 2017, 99, 371–386. [Google Scholar] [CrossRef]
  14. Rossetto, T.; Peiris, N. Observations of damage due to the Kashmir earthquake of October 8, 2005 and study of current seismic provisions for buildings in Pakistan. Bull. Earthq. Eng. 2009, 7, 681–699. [Google Scholar] [CrossRef]
  15. Godio, M.; Portal, N.W.; Flansbjer, M.; Magnusson, J.; Byggnevi, M. Experimental and numerical approaches to investigate the out-of-plane response of unreinforced masonry walls subjected to free far-field blasts. Eng. Struct. 2021, 239, 112328. [Google Scholar] [CrossRef]
  16. Garofano, A.; Ceroni, F.; Pecce, M. Modelling of the in-plane behaviour of masonry walls strengthened with polymeric grids embedded in cementitious mortar layers. Compos. Part B Eng. 2016, 85, 243–258. [Google Scholar] [CrossRef]
  17. Zhou, Y.; Sui, L.; Huang, X.; Guo, M.; Luo, M.; Hu, B.; Chen, C. Enhancing the EB-FRP strengthening effectiveness by incorporating a cracking-control layer of ECC with different thicknesses. Constr. Build. Mater. 2021, 286, 122975. [Google Scholar] [CrossRef]
  18. Haldar, P.; Singh, Y.; Paul, D. Identification of seismic failure modes of URM infilled RC frame buildings. Eng. Fail. Anal. 2013, 33, 97–118. [Google Scholar] [CrossRef]
  19. Di Nino, S.; Luongo, A. A simple homogenized orthotropic model for in-plane analysis of regular masonry walls. Int. J. Solids Struct. 2019, 167, 156–169. [Google Scholar] [CrossRef]
  20. Joyklad, P.; Ali, N.; Verre, S.; Magbool, H.M.; Elnemr, A.; Qureshi, M.I.; Hussain, Q.; Chaiyasarn, K. Experimental study on the out-of-plane behavior of brick masonry walls strengthened with mortar and wire mesh: A pioneer study. Infrastructures 2021, 6, 165. [Google Scholar] [CrossRef]
  21. Joyklad, P.; Hussain, Q. Development of strength models for brick walls: Experimental and theoretical study. Results Eng. 2023, 18, 101103. [Google Scholar] [CrossRef]
  22. Hussain, Q.; Ruangrassamee, A.; Joyklad, P.; Wijeyewickrema, A.C. Shear enhancement of RC beams using low-cost natural fiber rope reinforced polymer composites. Buildings 2022, 12, 602. [Google Scholar] [CrossRef]
  23. Mercedes, L.; Bernat-Maso, E.; Gil, L. In-plane cyclic loading of masonry walls strengthened by vegetal-fabric-reinforced cementitious matrix (FRCM) composites. Eng. Struct. 2020, 221, 111097. [Google Scholar] [CrossRef]
  24. Angiolilli, M.; Gregori, A. Assessment of the FRCM in-plane behavior in masonry retrofit applications. Procedia Struct. Integr. 2023, 44, 2174–2181. [Google Scholar] [CrossRef]
  25. Triwiyono, A.; Eratodi, I.G.L.B.; Wibowo, D.E.; Siswosukarto, S. Investigation of Confined Masonry Using Non-standard Quality of Concrete and Reinforcement. Lect. Notes Civ. Eng. 2022, 215, 187–199. [Google Scholar] [CrossRef]
  26. Zhang, L. Production of bricks from waste materials—A review. Constr. Build. Mater. 2013, 47, 643–655. [Google Scholar] [CrossRef]
  27. Meli, R. Behavior of masonry walls under lateral loads. In Proceedings of the Fifth World Conference on Earthquake Engineering, Rome, Italy, 25–29 June 1973; pp. 853–862. [Google Scholar]
  28. Naseer, M.A.; Qazi, A.U.; Mughal, U.A.; Ajmal, M.M.; Ahmed, A. Characteristics of unconfined masonry walls under in-plane static and reverse-cyclic loading: A comparative numerical study. Eur. J. Environ. Civ. Eng. 2023, 28, 150–175. [Google Scholar] [CrossRef]
  29. Nguyen, T.-D.; Meftah, F.; Chammas, R.; Mebarki, A. The behaviour of masonry walls subjected to fire: Modelling and parametrical studies in the case of hollow burnt-clay bricks. Fire Saf. J. 2009, 44, 629–641. [Google Scholar] [CrossRef]
  30. Haach, V.G.; Vasconcelos, G.; Lourenço, P.B. Parametrical study of masonry walls subjected to in-plane loading through numerical modeling. Eng. Struct. 2011, 33, 1377–1389. [Google Scholar] [CrossRef]
  31. Haach, V.G.; Vasconcelos, G.; Lourenço, P.B. Experimental Analysis of Reinforced Concrete Block Masonry Walls Subjected to In-Plane Cyclic Loading. J. Struct. Eng. 2010, 136, 452–462. [Google Scholar] [CrossRef]
  32. Kalali, A.; Kabir, M.Z. Experimental response of double-wythe masonry panels strengthened with glass fiber reinforced polymers subjected to diagonal compression tests. Eng. Struct. 2012, 39, 24–37. [Google Scholar] [CrossRef]
  33. Asgari, A.; Bagheri, M.; Hadizadeh, M. Advanced seismic analysis of soil-foundation-structure interaction for shallow and pile foundations in saturated and dry deposits: Insights from 3D parallel finite element modeling. Structures 2024, 69, 107503. [Google Scholar] [CrossRef]
  34. Bagheri, M.; Jamkhaneh, M.E.; Samali, B. Effect of seismic soil–pile–structure interaction on mid- and high-rise steel buildings resting on a group of pile foundations. Int. J. Géoméch. 2018, 18. [Google Scholar] [CrossRef]
  35. Najam, F.A.; Qureshi, M.I.; Warnitchai, P.; Mehmood, T. Prediction of nonlinear seismic demands of high-rise rocking wall structures using a simplified modal pushover analysis procedure. Struct. Des. Tall Spéc. Build. 2018, 27, e1506. [Google Scholar] [CrossRef]
  36. Khalil, U.; Aslam, B.; Kazmi, Z.A.; Maqsoom, A.; Qureshi, M.I.; Azam, S.; Nawaz, A. Integrated support vector regressor and hybrid neural network techniques for earthquake prediction along Chaman fault, Baluchistan. Arab. J. Geosci. 2021, 14, 2192. [Google Scholar] [CrossRef]
  37. Khan, S.U.; Qureshi, M.I.; Rana, I.A.; Maqsoom, A. Seismic vulnerability assessment of building stock of Malakand (Pakistan) using FEMA P-154 method. SN Appl. Sci. 2019, 1, 1625. [Google Scholar] [CrossRef]
  38. Qureshi, M.I.; Warnitchai, P. Reduction of inelastic seismic demands in a mid-rise rocking wall structure designed using the displacement-based design procedure. Struct. Des. Tall Spéc. Build. 2016, 26, e1307. [Google Scholar] [CrossRef]
  39. Qureshi, M.I.; Khan, S.U.; Rana, I.A.; Ali, B.; Rahman, A.U. Determinants of people’s seismic risk perception: A case study of Malakand, Pakistan. Int. J. Disaster Risk Reduct. 2021, 55, 102078. [Google Scholar] [CrossRef]
  40. Abbas, S.N.; Qureshi, M.I.; Alkharisi, M.K.; Alturki, M.; Ahmad, Z. Combined effect of silica fume and various fibers on fresh and hardened properties of concrete incorporating HDPE aggregates. Constr. Build. Mater. 2024, 445, 137940. [Google Scholar] [CrossRef]
  41. Ali, K.; Saingam, P.; Qureshi, M.I.; Saleem, S.; Nawaz, A.; Mehmood, T.; Maqsoom, A.; Malik, M.W.; Suparp, S. Influence of recycled plastic incorporation as coarse aggregates on concrete properties. Sustainability 2023, 15, 5937. [Google Scholar] [CrossRef]
  42. Khan, A.A.; Rana, I.A.; Nawaz, A.; Waheed, A. Gender-based emergency preparedness and awareness: Empirical evidences from high-school students of Gilgit, Pakistan. Environ. Hazards 2020, 20, 416–431. [Google Scholar] [CrossRef]
  43. Van Noort, J.R. Computational Modelling of Masonry Structures. Master’s Thesis, Delft University of Technology, Delft, The Netherlands, 2012. [Google Scholar]
  44. ASTM International. ASTM C1314-23a Standard Test Method for Compressive Strength of Masonry Prisms. 2023. Available online: https://www.astm.org/DATABASE.CART/HISTORICAL/C1314-16.htm (accessed on 28 September 2021).
  45. ASTM. ASTM C109/C109M-21–Standard Test Method for Compressive Strength of Hydraulic Cement Mortars. 2021. Available online: https://store.astm.org/c0109_c0109m-21.html (accessed on 4 January 2022).
  46. EN 1998-1; Eurocode 8, Design of Structures for Earthquake Resistance. British Standard: London, UK, 2005.
  47. ASTM C1717-19; Standard Test Methods for Conducting Strength Tests of Masonry Wall Panels. American Society for Testing Materials: West Conshohocken, PA, USA, 2019.
  48. ASTM E519/E519M-22; Standard Test Method for Diagonal Tension (Shear) in Ma-Sonry Assemblages. American Society for Testing Materials: West Conshohocken, PA, USA, 2022.
  49. Garcia-Ramonda, L.; Pelá, L.; Roca, P.; Camata, G. In-plane shear behaviour by diagonal compression testing of brick masonry walls strengthened with basalt and steel textile reinforced mortars. Constr. Build. Mater. 2020, 240, 117905. [Google Scholar] [CrossRef]
  50. George, J.; Rama, J.K.; Kumar, M.S.; Vasan, A. Behavior of plain concrete beam subjected to three point bending using concrete damaged plasticity (CDP) model. Mater. Today Proc. 2017, 4, 9742–9746. [Google Scholar] [CrossRef]
  51. Le Thanh, C.; Minh, H.-L.; Sang-To, T. A nonlinear concrete damaged plasticity model for simulation reinforced concrete structures using ABAQUS. Frat. Ed Integrita Strutt. Struct. Integr. 2021, 16, 232–242. [Google Scholar] [CrossRef]
  52. Fakeh, M.; Jawdhari, A.; Fam, A. Calibration of ABAQUS Concrete Damage Plasticity (CDP) Model for UHPC Material. In Proceedings of the Third International Interactive Symposium on Ultra-High Performance Concrete, Wilmington, DE, USA, 4–7 June 2023. [Google Scholar]
  53. Işık, E.; Avcil, F.; Harirchian, E.; Arkan, E.; Bilgin, H.; Özmen, H.B. Architectural characteristics and seismic vulnerability assessment of a historical masonry minaret under different seismic risks and probabilities of exceedance. Buildings 2022, 12, 1200. [Google Scholar] [CrossRef]
  54. Systèmes, D. Abaqus USER Subroutines Reference Guide; Version 6.14; Dassault Systemes Simulia Corporation: Providence, RI, USA, 2014. [Google Scholar]
Figure 1. Mechanical testing: (a) brick compressive strength, (b) modulus of rupture of brick, and (c) mortar cube compression.
Buildings 15 02180 g001
Figure 2. Prepared sample: (a) unstrengthened and (b) strengthened.
Buildings 15 02180 g002
Figure 3. Pictorial views of different meshing schemes: (a) steel mesh specimen and (b) fiberglass mesh specimens.
Buildings 15 02180 g003
Figure 4. Axial testing instrumentation: (J) top vertical LVDT, (K) I shape beam plate for uniformly distributed load, and (L) axil masonry wall.
Buildings 15 02180 g004
Figure 5. Diagonal shear testing instrumentation.
Buildings 15 02180 g005
Figure 6. Failure of reference walls: (a) W01, (b) W07, (c) W13, and (d) W19.
Buildings 15 02180 g006aBuildings 15 02180 g006b
Figure 7. Failure of plastered-only walls: (a) W02, (b) W08, (c) W14, and (d) W20.
Buildings 15 02180 g007aBuildings 15 02180 g007b
Figure 8. Failure of steel-mesh strengthened walls under axial compression: (a) W03, (b) W04, (c) W09, and (d) W10.
Buildings 15 02180 g008aBuildings 15 02180 g008b
Figure 9. Failure of steel-mesh strengthened walls under diagonal compression: (a) W15, (b) W16, (c) W21, and (d) W22.
Buildings 15 02180 g009aBuildings 15 02180 g009b
Figure 10. Failure of fiberglass-mesh-strengthened walls under axial compression: (a) W05, (b) W06, (c) W11, and (d) W12.
Buildings 15 02180 g010aBuildings 15 02180 g010b
Figure 11. Failure of fiberglass-mesh-strengthened walls under diagonal compression: (a) W17, (b) W18, (c) W23, and (d) W24.
Buildings 15 02180 g011aBuildings 15 02180 g011b
Figure 12. Comparison of peak capacity of double-layer brick walls under axial compression.
Buildings 15 02180 g012
Figure 13. Comparison of peak capacity of single-brick walls under axial compression.
Buildings 15 02180 g013
Figure 14. Comparison of peak capacity of single- and double-brick walls under axial compression.
Buildings 15 02180 g014
Figure 15. Comparison of peak capacity of single-brick walls under diagonal compression.
Buildings 15 02180 g015
Figure 16. Comparison of peak capacity of double-brick walls under diagonal compression.
Buildings 15 02180 g016
Figure 17. Comparison of peak capacity of single- and double-brick walls under diagonal compression.
Buildings 15 02180 g017
Figure 18. Comparison of load vs. deflection curves of walls under axial compression: (a) double- and (b) single-brick walls.
Buildings 15 02180 g018
Figure 19. Comparison of load vs. deflection curves of walls under diagonal compression: (a) double- and (b) single-brick walls.
Buildings 15 02180 g019
Figure 20. Meshed model in Abaqus.
Buildings 15 02180 g020
Figure 21. Uniaxial concrete model in (a) compression and (b) tension.
Buildings 15 02180 g021
Figure 22. Typical modelling process (a) axial walls and (b) diagonal walls.
Buildings 15 02180 g022
Figure 23. Comparison of the experimental and analytical deformation values of a double-brick wall subjected to axial compression.
Buildings 15 02180 g023
Figure 24. Comparison of the experimental and analytical deformation values of a single-brick wall subjected to axial compression.
Buildings 15 02180 g024
Figure 25. Comparison of the experimental and analytical deformation values of a double-brick wall subjected to diagonal compression.
Buildings 15 02180 g025aBuildings 15 02180 g025b
Figure 26. Comparison of the experimental and analytical deformation values of a single-brick wall subjected to diagonal compression.
Buildings 15 02180 g026aBuildings 15 02180 g026b
Table 1. Details of the test matrix.
IDThickness (mm)Mortar RatioWire Mesh
CementSand
Walls for Axial Compressive Behavior
W0111514N/A
W0211514N/A
W0311514Single steel layer (1S)
W0411514Double steel layer (2S)
W0511514Single fiberglass layer (1F)
W0611514Double fiberglass layer (2F)
W0723014N/A
W0823014N/A
W0923014Single steel layer (1S)
W1023014Double steel layer (2S)
W1123014Single fiberglass layer (1F)
W1223014Double fiberglass layer (2F)
Walls for Diagonal Compressive Behavior
W1311514N/A
W1411514N/A
W1511514Single steel layer (1S)
W1611514Double steel layer (2S)
W1711514Single fiberglass layer (1F)
W1811514Double fiberglass layer (2F)
W1923014N/A
W2023014N/A
W2123014Single steel layer (1S)
W2223014Double steel layer (2S)
W2323014Single fiberglass layer (1F)
W2423014Double fiberglass layer (2F)
Table 2. Summary of results for walls under axial compression.
IDTypePeak Load
(kN)
Compressive Strength
(MPa)
Axial Deformation at Peak (mm)
Thickness (mm)Strengthening
W01115Control1511.880.58
W02115Plaster Only1902.360.80
W031151 Layer Steel2563.181.18
W041152 Layer Steel3213.992.17
W051151 Layer Fiberglass2392.970.92
W061152 Layer Fiberglass2723.381.60
W07230Control3562.210.48
W08230Plaster Only4262.650.52
W092301 Layer Steel4943.071.75
W102302 Layer Steel6183.842.10
W112301 Layer Fiberglass4672.900.96
W122302 Layer Fiberglass5113.171.81
Table 3. Summary of results for walls under diagonal compression.
IDTypePeak Load
(kN)
Shear Strength
(MPa)
Axial Deformation at Peak (mm)
Thickness (mm)Strengthening
W13115Control620.770.33
W14115Plaster Only911.130.67
W151151 Layer Steel1351.681.17
W161152 Layer Steel1822.262.11
W171151 Layer Fiberglass1221.520.87
W181152 Layer Fiberglass1571.951.49
W19230Control1260.780.28
W20230Plaster Only1781.110.47
W212301 Layer Steel2701.681.03
W222302 Layer Steel3302.051.49
W232301 Layer Fiberglass2401.490.94
W242302 Layer Fiberglass2921.811.10
Table 4. Comparison of experimental and analytical results.
IDPeak Load—EXP
(kN)
Peak Load—Analytical
(kN)
Difference (%)Axial Deformation at Peak—EXP
(mm)
Axial Deformation at Peak—
Analytical (mm)
Difference (%)
W011511407.860.580.65−10.77
W021901758.570.80.756.67
W032562454.491.181.2−1.67
W04321330−2.732.172.017.96
W052392256.220.921.05−12.38
W06272289−5.881.61.515.96
W073563453.190.480.52−7.69
W084264055.190.520.56−7.14
W094944754.001.751.85−5.41
W10618630−1.902.12.3−8.70
W114674454.940.960.942.13
W125114806.461.811.753.43
W13625414.810.330.38−13.16
W1491839.640.670.75−10.67
W151351258.001.171.26−7.14
W16182192−5.212.112.2−4.09
W171221156.090.870.99−12.12
W18157165−4.851.491.59−6.29
W191261186.780.280.32−12.50
W201781704.710.470.51−7.84
W212702603.851.031.15−10.43
W22330345−4.351.491.6−6.88
W232402304.350.941.01−6.93
W24292305−4.261.11.19−7.56
Disclaimer/Publisher’s Note: The statements, opinions and data contained in all publications are solely those of the individual author(s) and contributor(s) and not of MDPI and/or the editor(s). MDPI and/or the editor(s) disclaim responsibility for any injury to people or property resulting from any ideas, methods, instructions or products referred to in the content.

