
Multisensory Digital Heritage Spaces as Smart Environments in Sustainable Architectural Design


Abstract
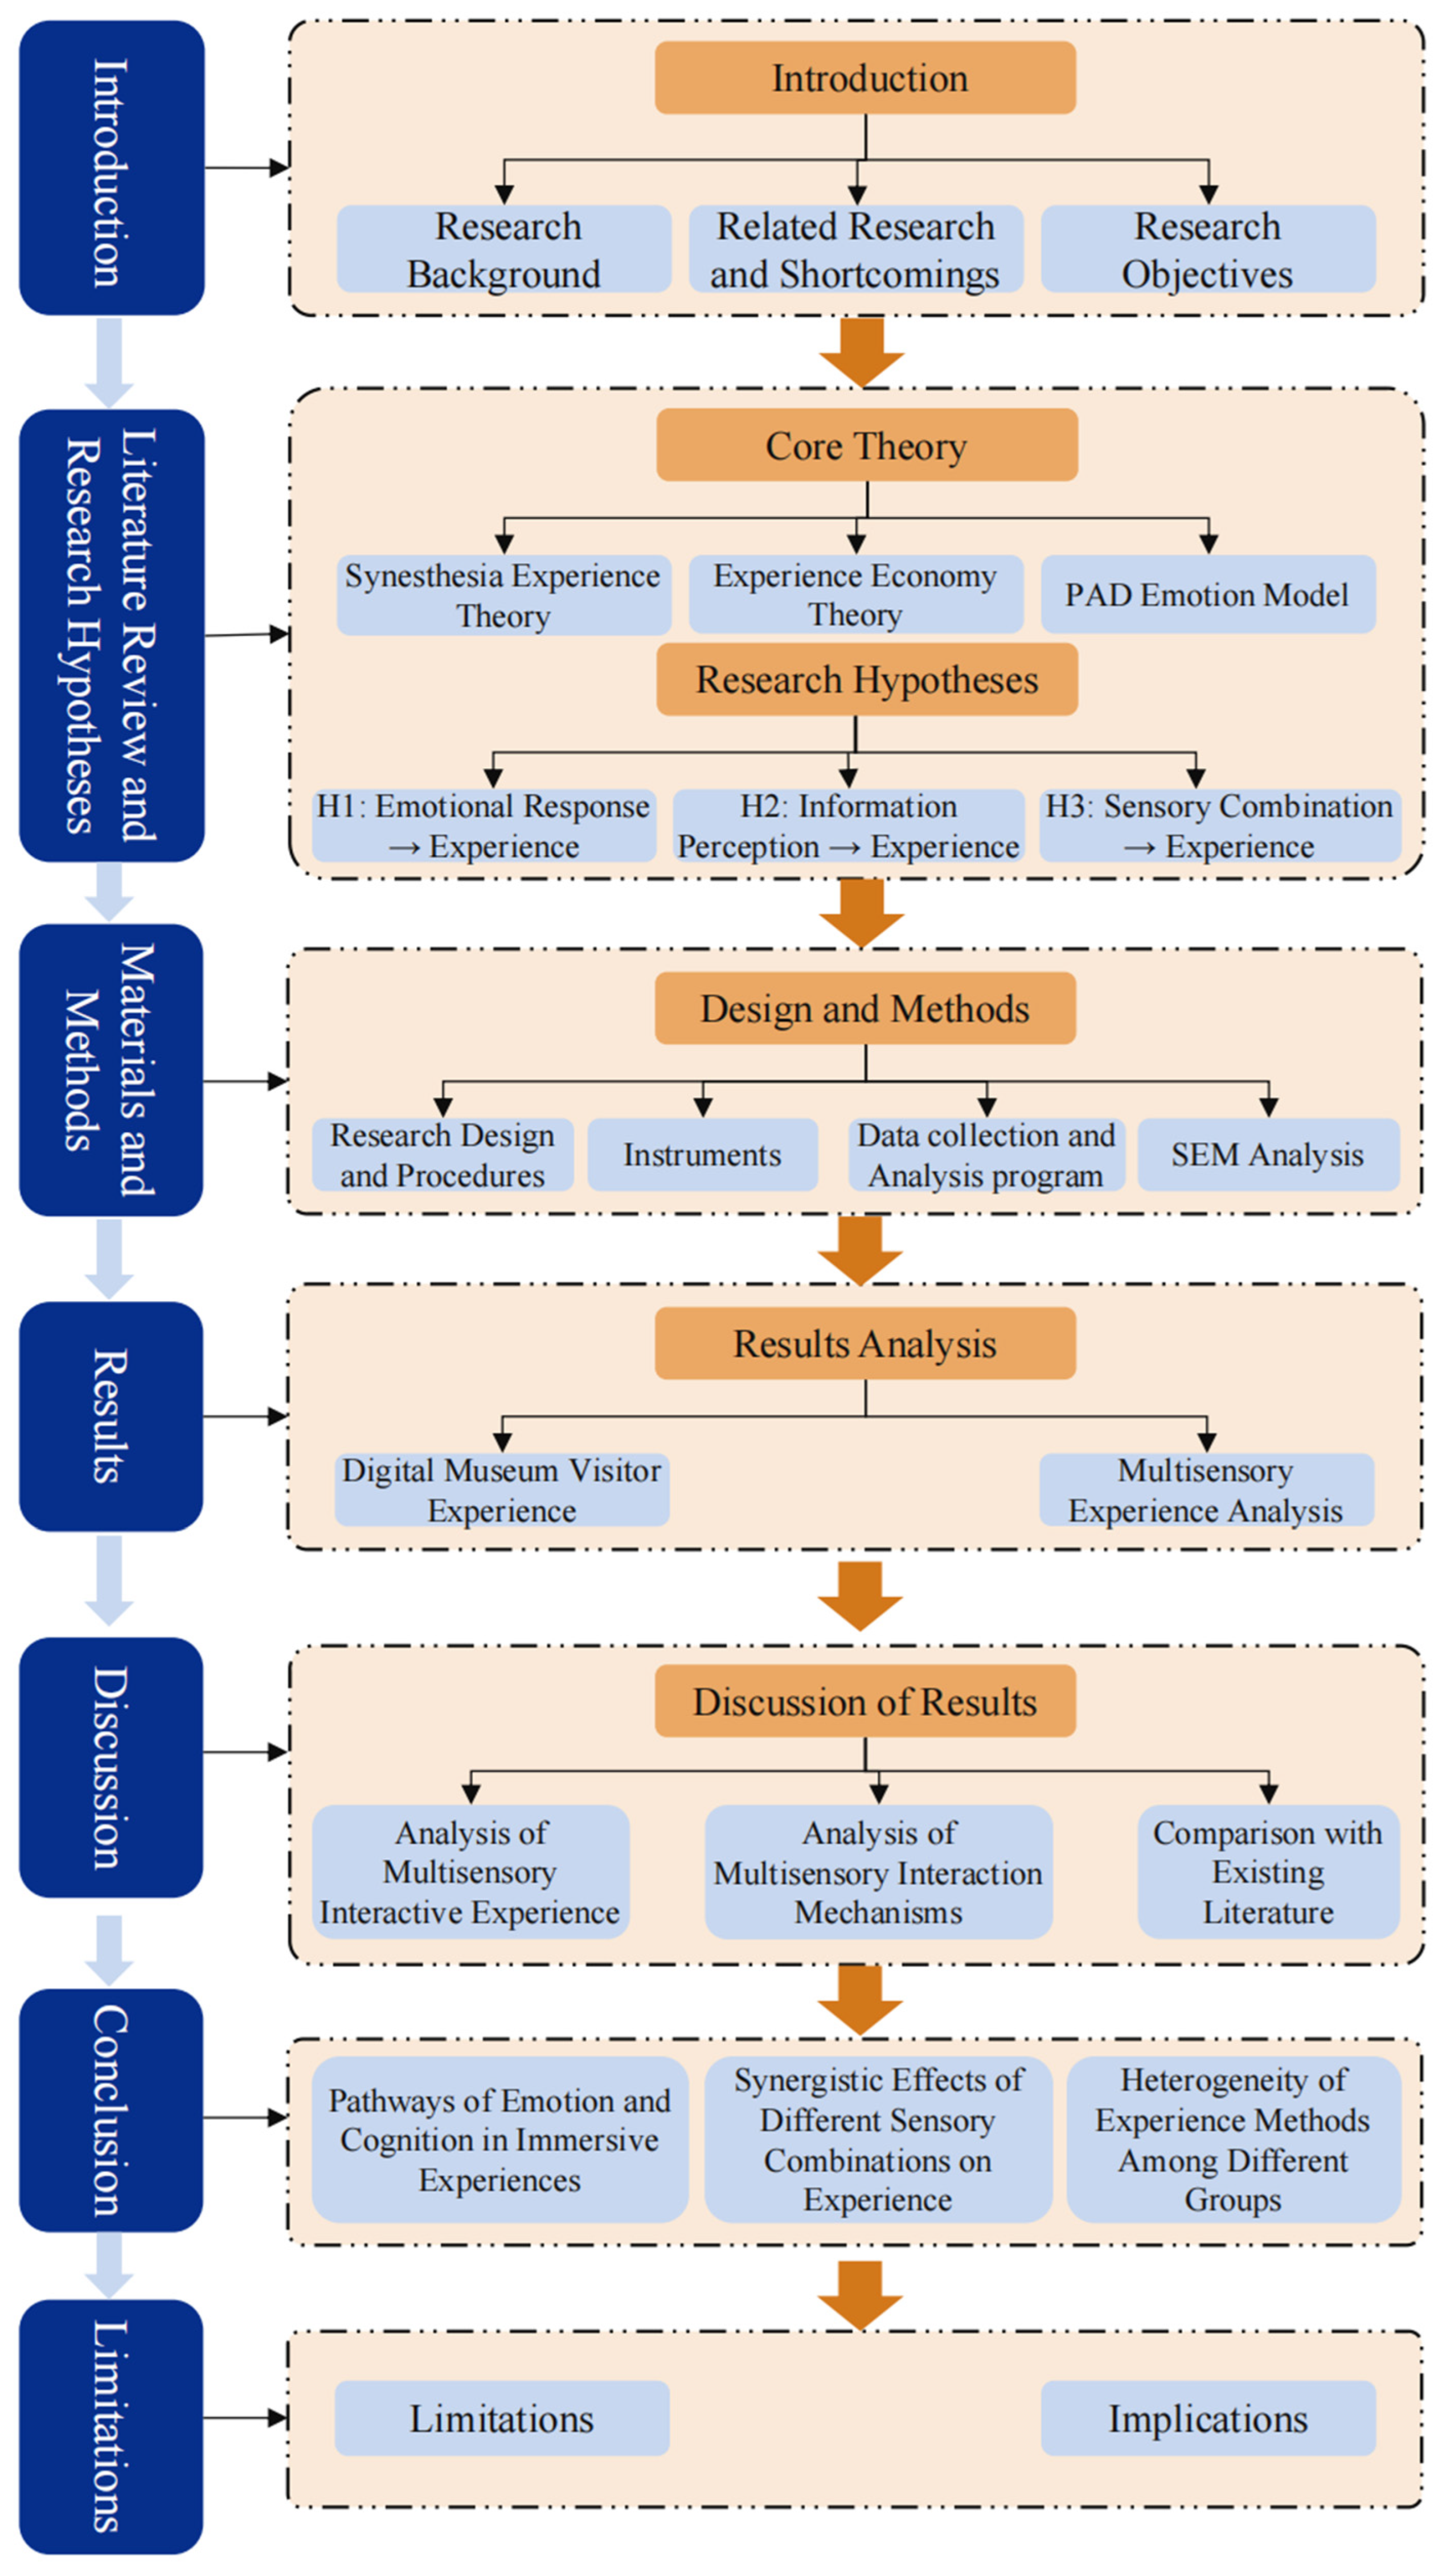
1. Introduction
- (1)
- There is a lack of quantitative analysis of the specific ways in which different sensory components contribute to the formation of experiences.
- (2)
- There is a lack of an overall evaluation system applicable to ecological responsibility goals. Existing measurement methods rely primarily on subjective scales and interviews and are unable to scientifically measure the effects of multisensory experiences on immersion, emotions, and cognition.
- (3)
- There is a lack of design recommendations applicable to practice. Exploratory practices have not provided design pathways suitable for different exhibition conditions or addressed how to leverage sensory elements for experience innovation and ecological communication.
- Describe the overall experience of visitors in digital museums and construct a multidimensional evaluation index system.
- Use structural equation modeling (SEM) to verify the impact of multisensory interaction on visitor experience and understand the role of emotional responses and information perception of visitors in digital museums.
- Propose design strategy recommendations based on multi-sensory experience optimization to promote the sustainable development of digital museums.
2. Literature Review and Research Hypotheses
2.1. Technology Innovations in Digital Museums and Tourism Experiences
2.2. Immersive Travel Experiences and Multisensory Interactions
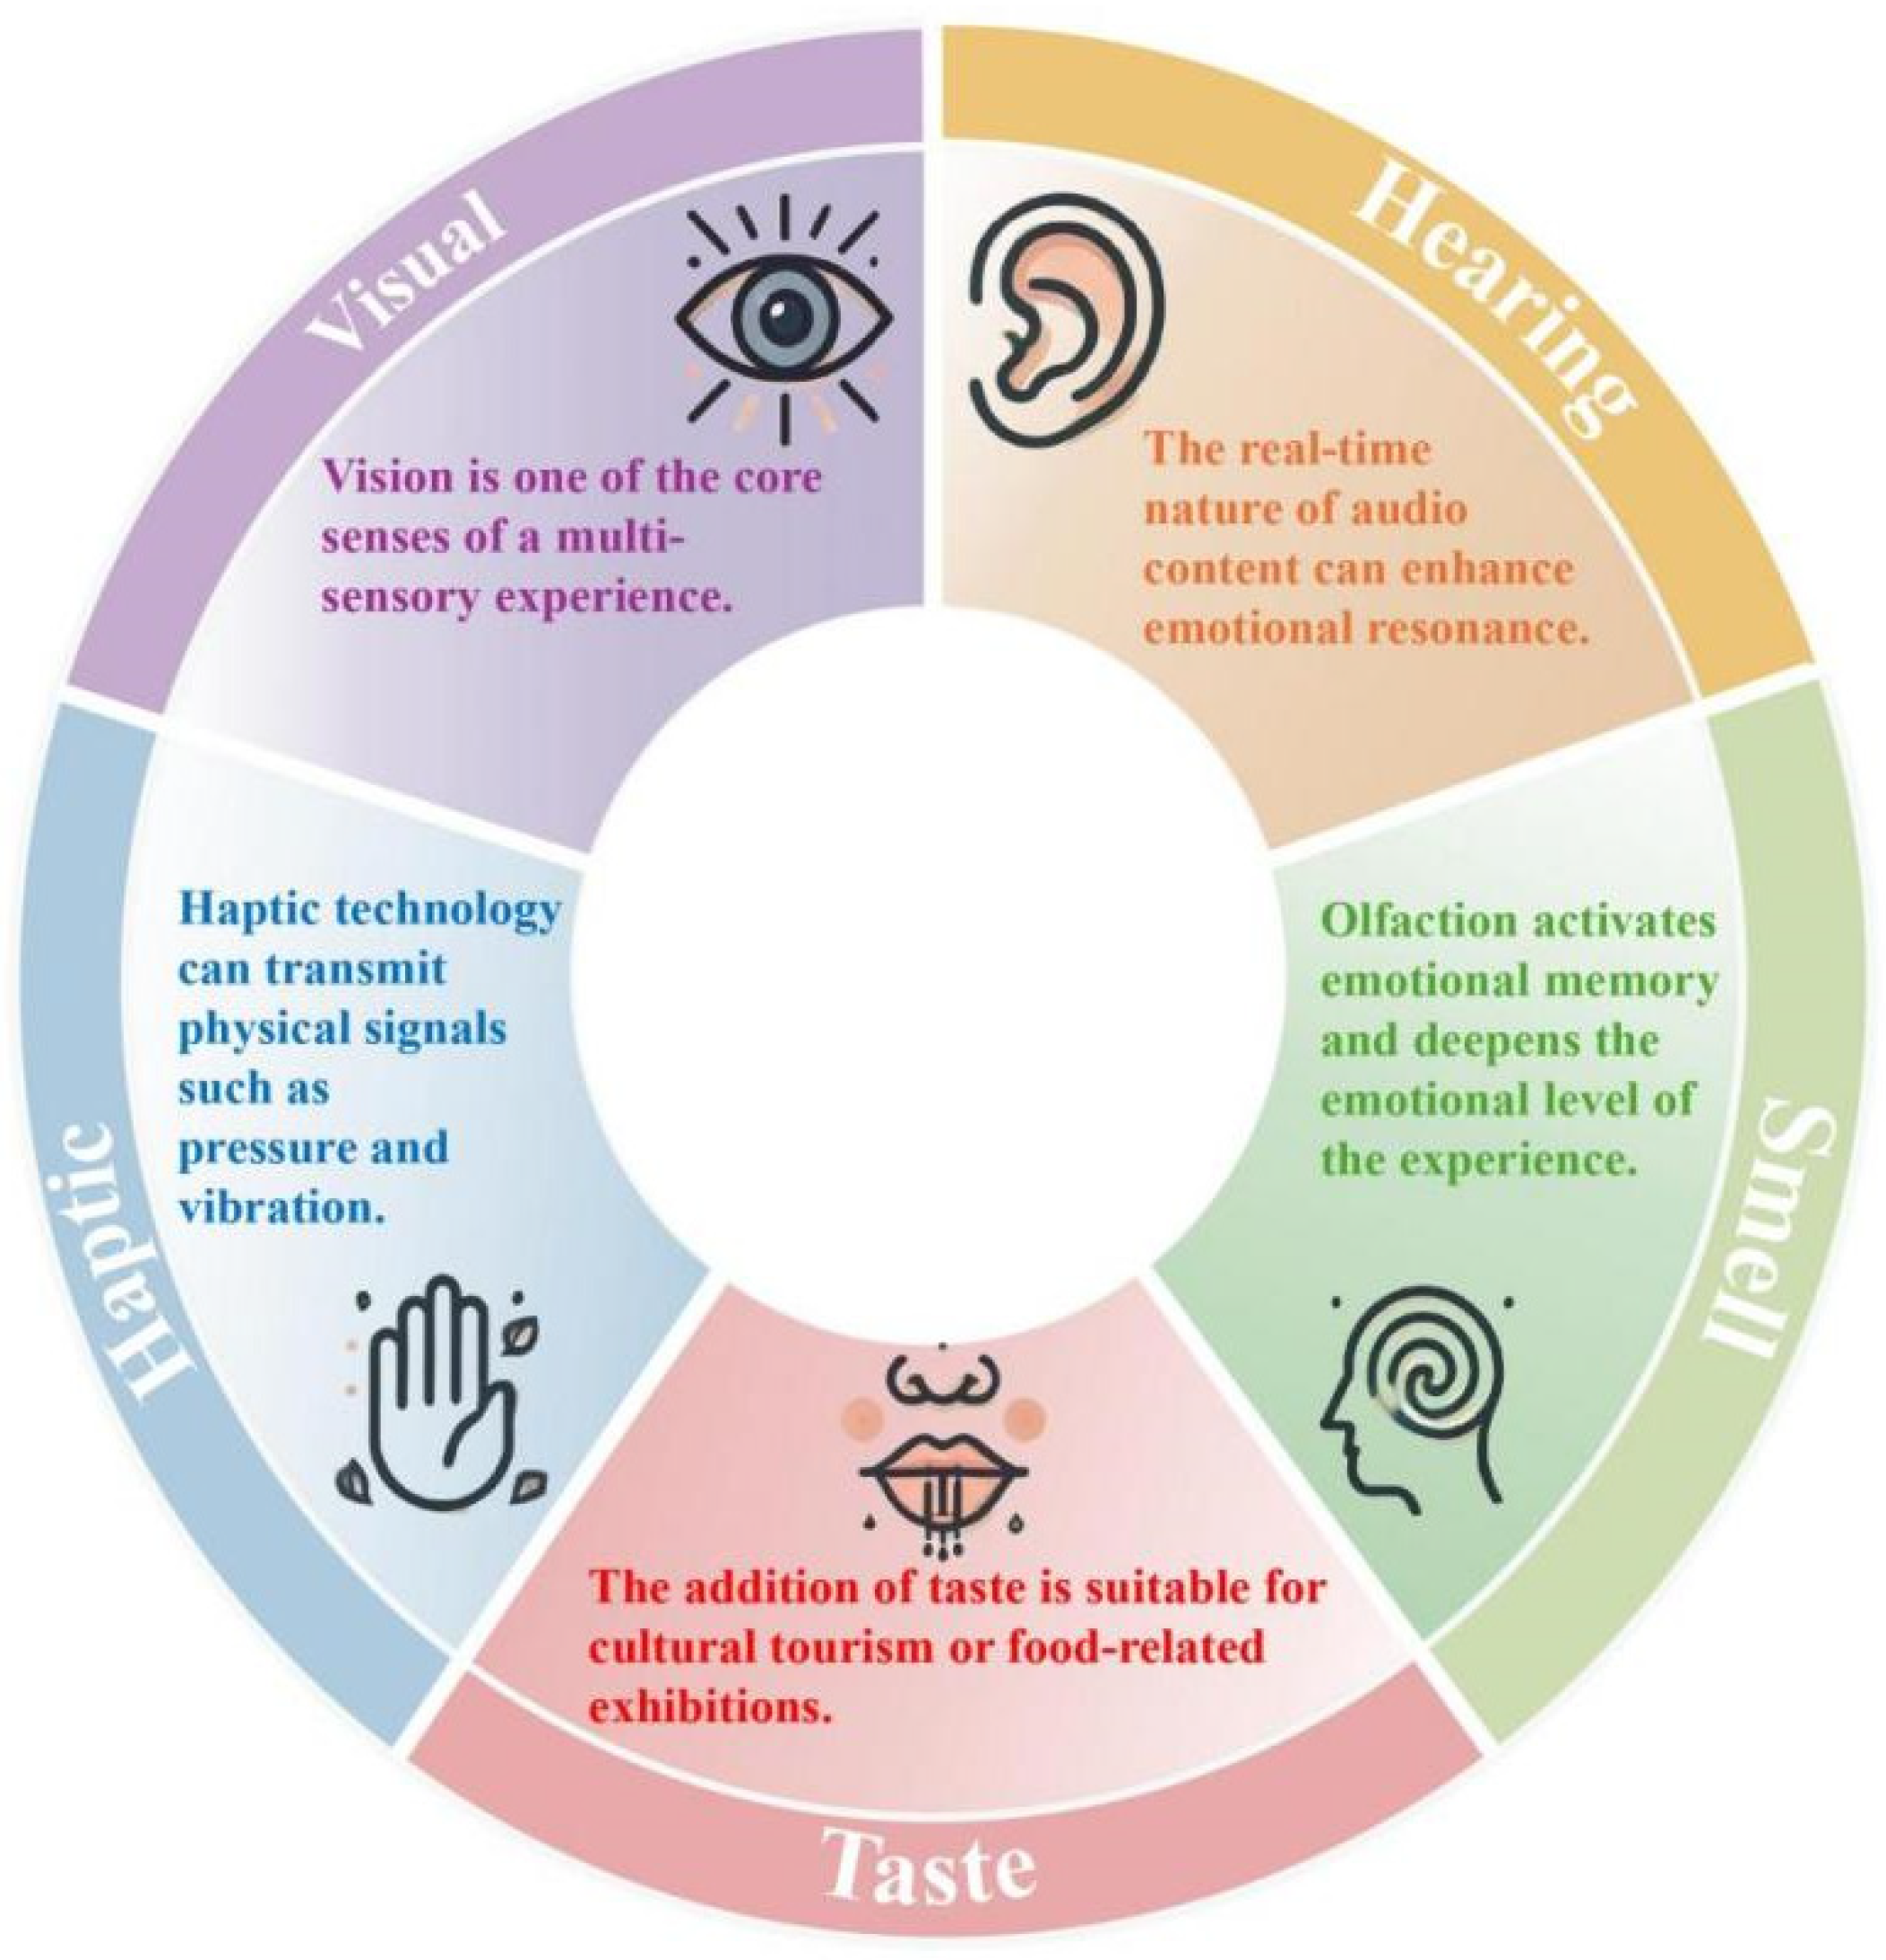
2.3. Multisensory Design Principle
2.4. Concepts Related to Museum Experience, Emotional Response, Information Perception, and Multisensory Cues
2.4.1. Eight-Dimensional Experience of Museums
- -
- Entertainment experience enhances the fun and duration of participation through interactive exhibits such as AR games [13].
- -
- Educational experience promotes the internalization of knowledge through VR scene reconstruction and multisensory interpretation [21].
- -
- Esthetic experience relies on high-precision 3D modeling and light and shadow sound effects to enhance visual art perception [8].
- -
- Serendipity experience triggers emotional resonance through associative design [41].
- -
- Communities experience an enhanced sense of collective participation through multiplayer collaborative tasks and virtual community platforms [17].
- -
- Escapism experience relies on VR/AR to break the boundary between the real and the virtual to enhance cultural communication [16].
- -
- Localness experience deepens the recognition of heritage values through localized narratives [22].
- -
- The personalized experience dynamically recommends content based on user data to enhance engagement.
2.4.2. Measurement of Emotional Responses
2.4.3. Dimensions of Information Cognition
2.4.4. Multisensory Types and Experiences Multisensory Interaction Design
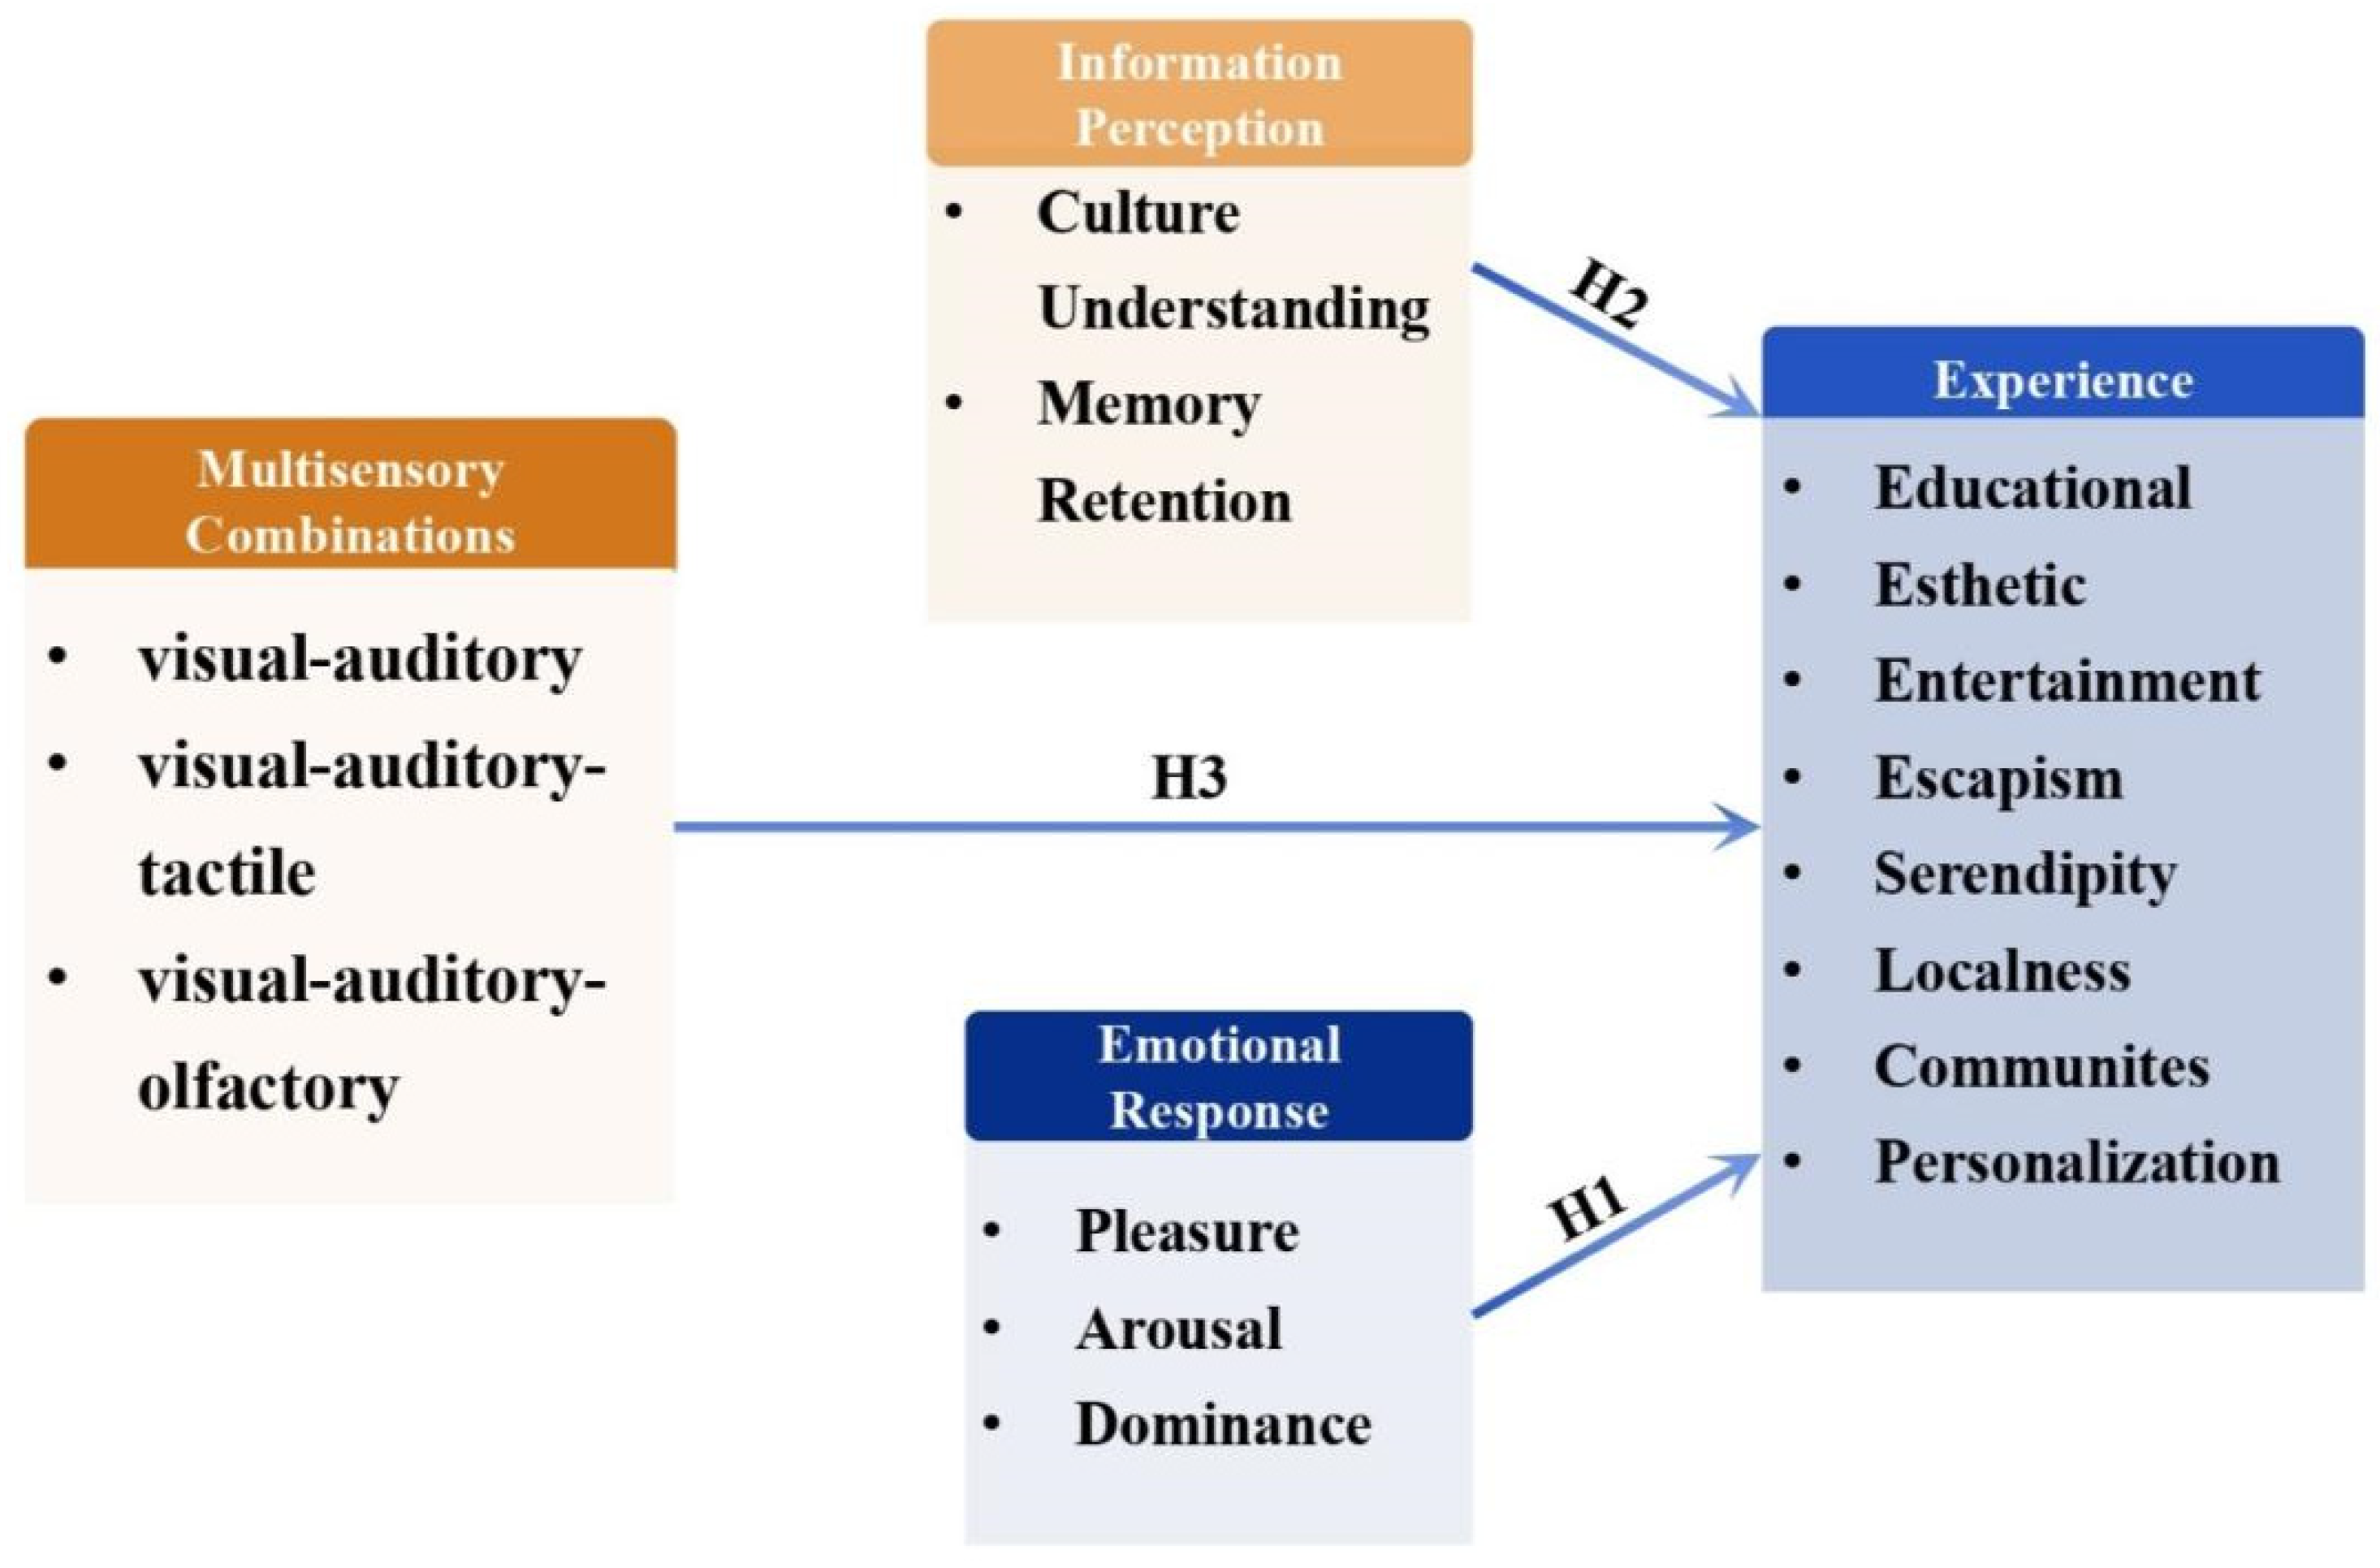
2.5. The Assumption of Multisensory Design for Immersive Cultural Experiences
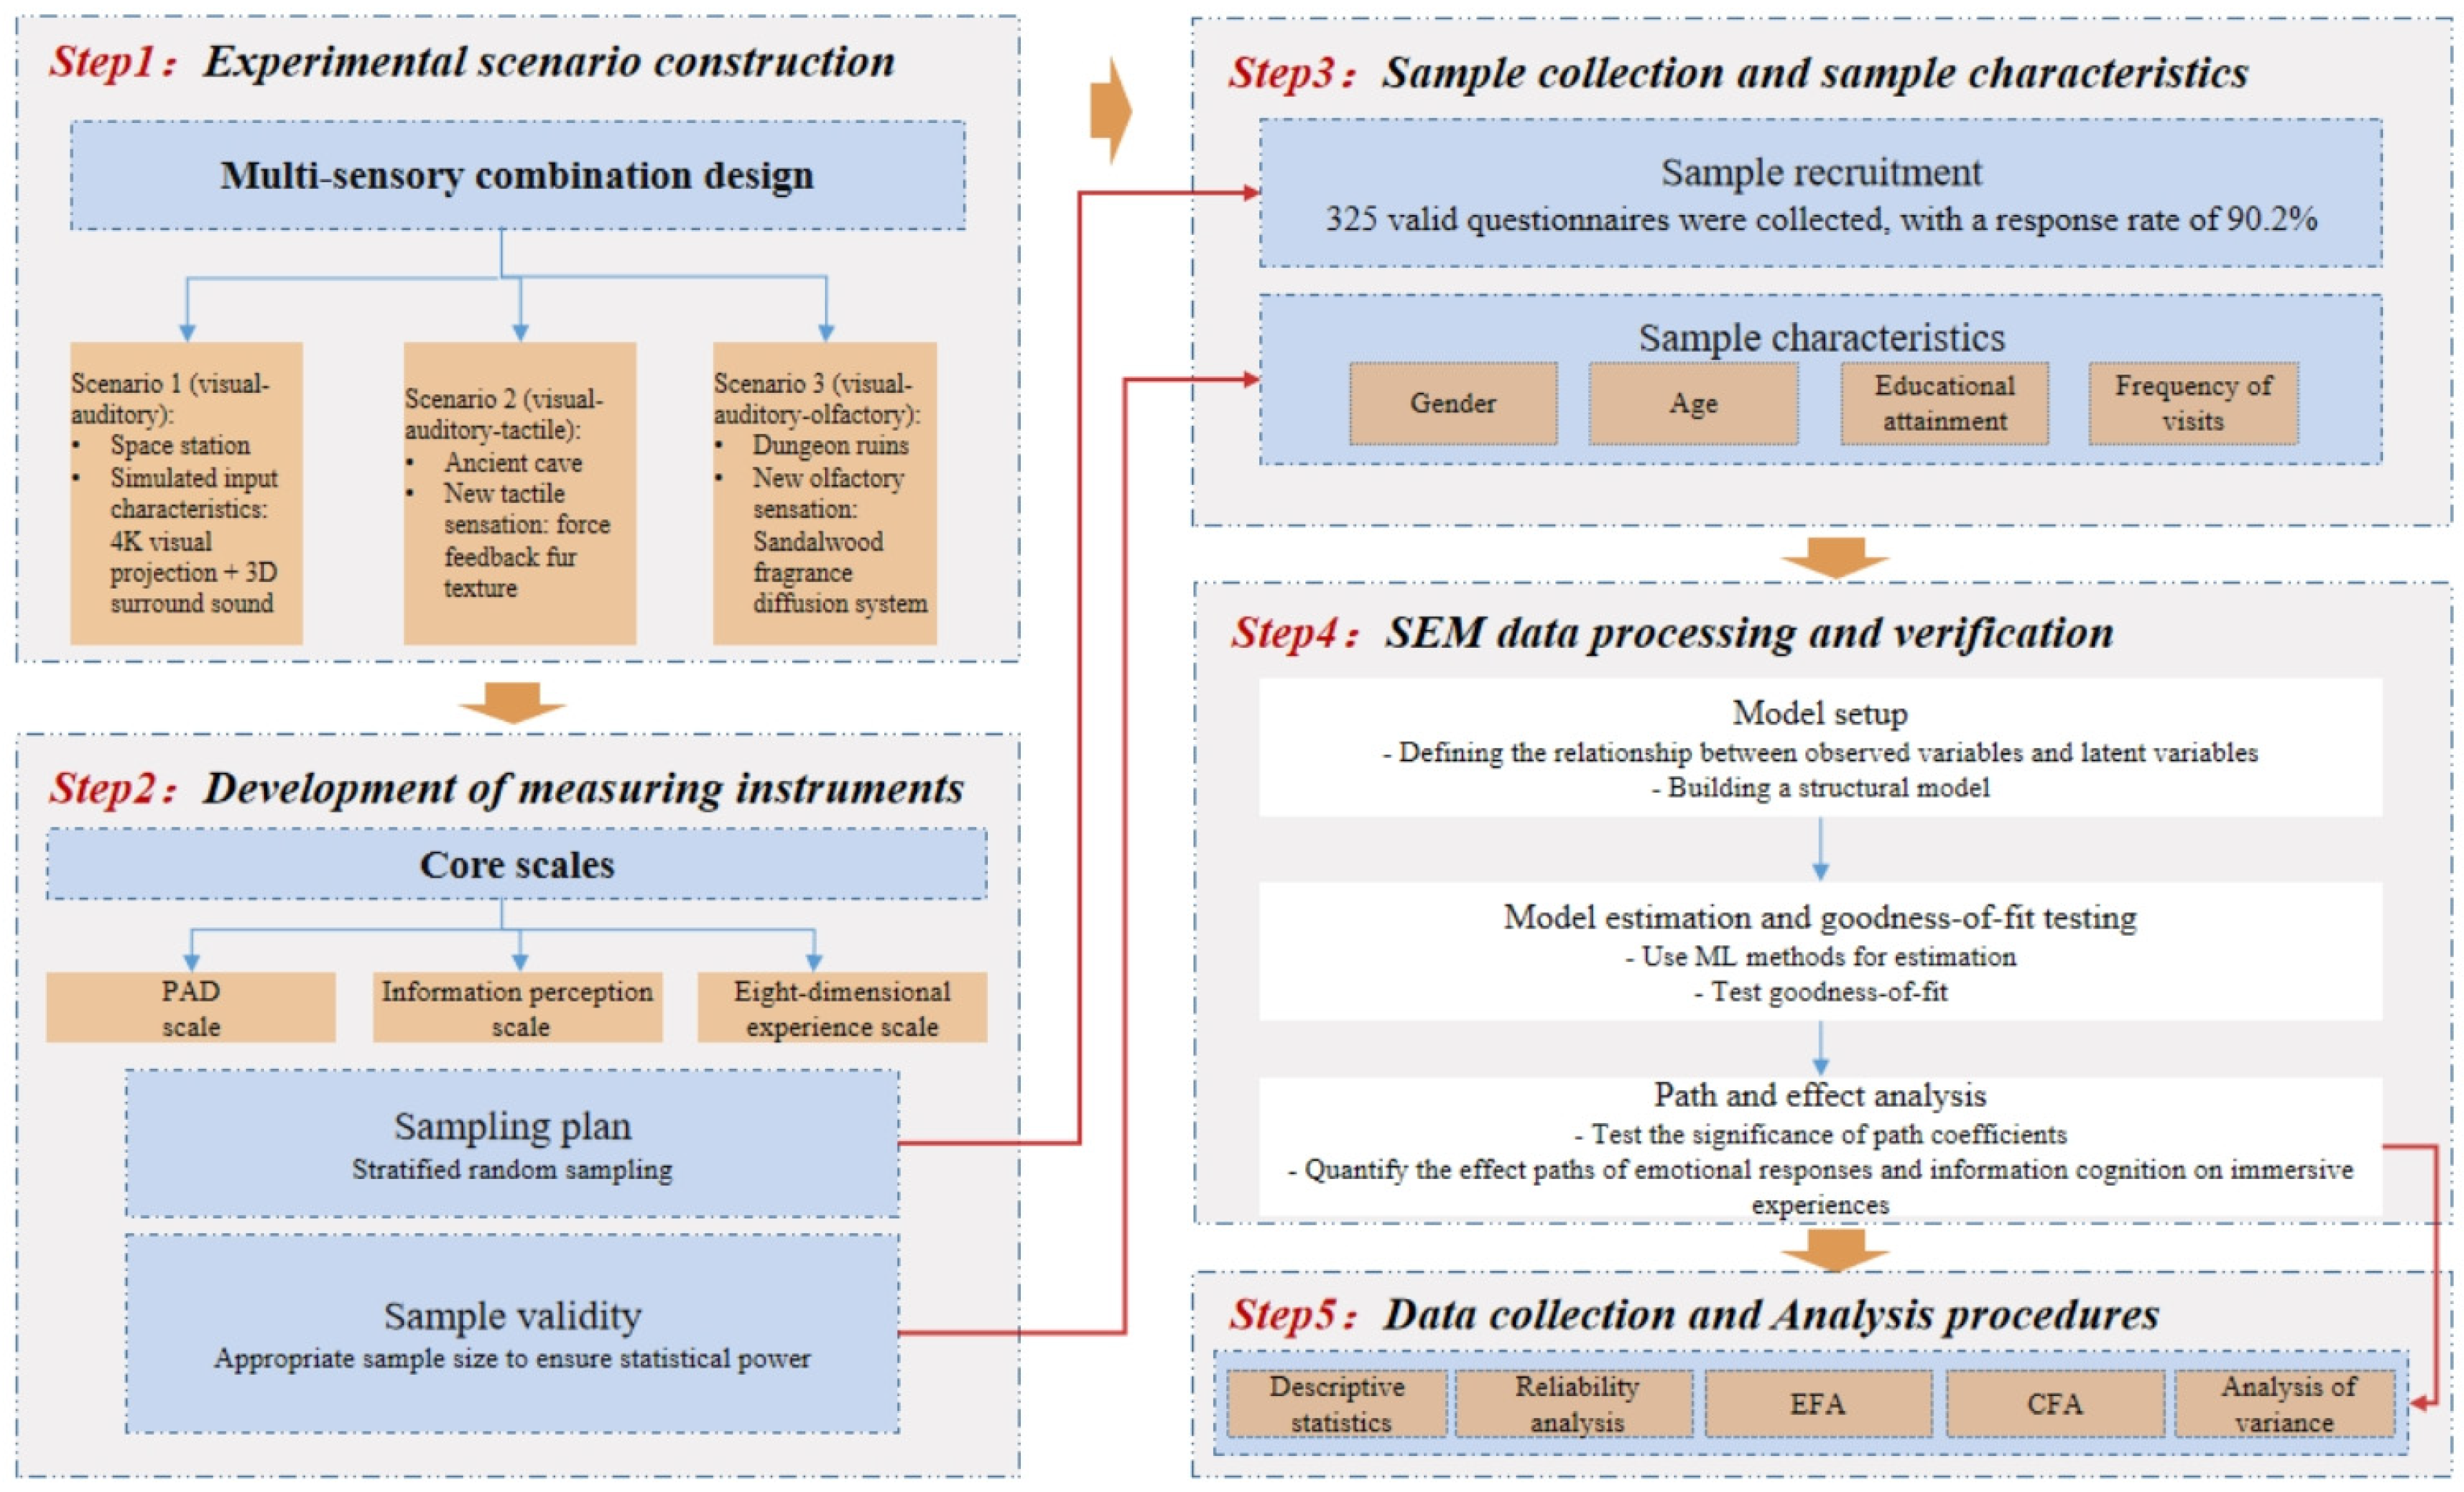
3. Materials and Methods
3.1. Research Design and Procedures
3.2. Instruments
- (1)
- Sampling Strategy and Rationale: A stratified random sampling method was used to recruit participants, ensuring demographic diversity in terms of age, gender, and visit time. The sample included visitors on weekdays and weekends to reduce time bias. The inclusion criteria ensured that participants had no sensory impairments and had not previously visited the same exhibition. Each participant was randomly assigned to one of three sensory scenarios to ensure internal validity.
- (2)
- Sample Validity Considerations: This sampling method was chosen to enhance the representativeness of the museum-visiting public and reduce self-selection bias. The sample size exceeded the minimum recommended for SEM analysis, ensuring sufficient statistical power for factor structure validation and path modeling.
3.3. Participant Basic Information
3.4. Structural Equation Modeling (SEM) Analysis
3.4.1. Principles and Applicability Analysis of SEM Methods
3.4.2. Structural Model Construction and Validation
3.5. Data Collection and Analysis Procedure
3.5.1. Descriptive Statistics Methods
3.5.2. Reliability Analysis Methods
3.5.3. Exploratory Factor Analysis (EFA)
- First perform varimax orthogonal rotation to get the initial load matrix.
- Generate the diagonal target matrix by power transformation (usually to the power).
- Calculate the diagonal load matrix.
3.5.4. Confirmatory Factor Analysis (CFA)
3.5.5. Analysis of Variance
4. Results
4.1. Digital Museum Visitor Experience
4.1.1. Reliability Analysis
4.1.2. Validity Analysis
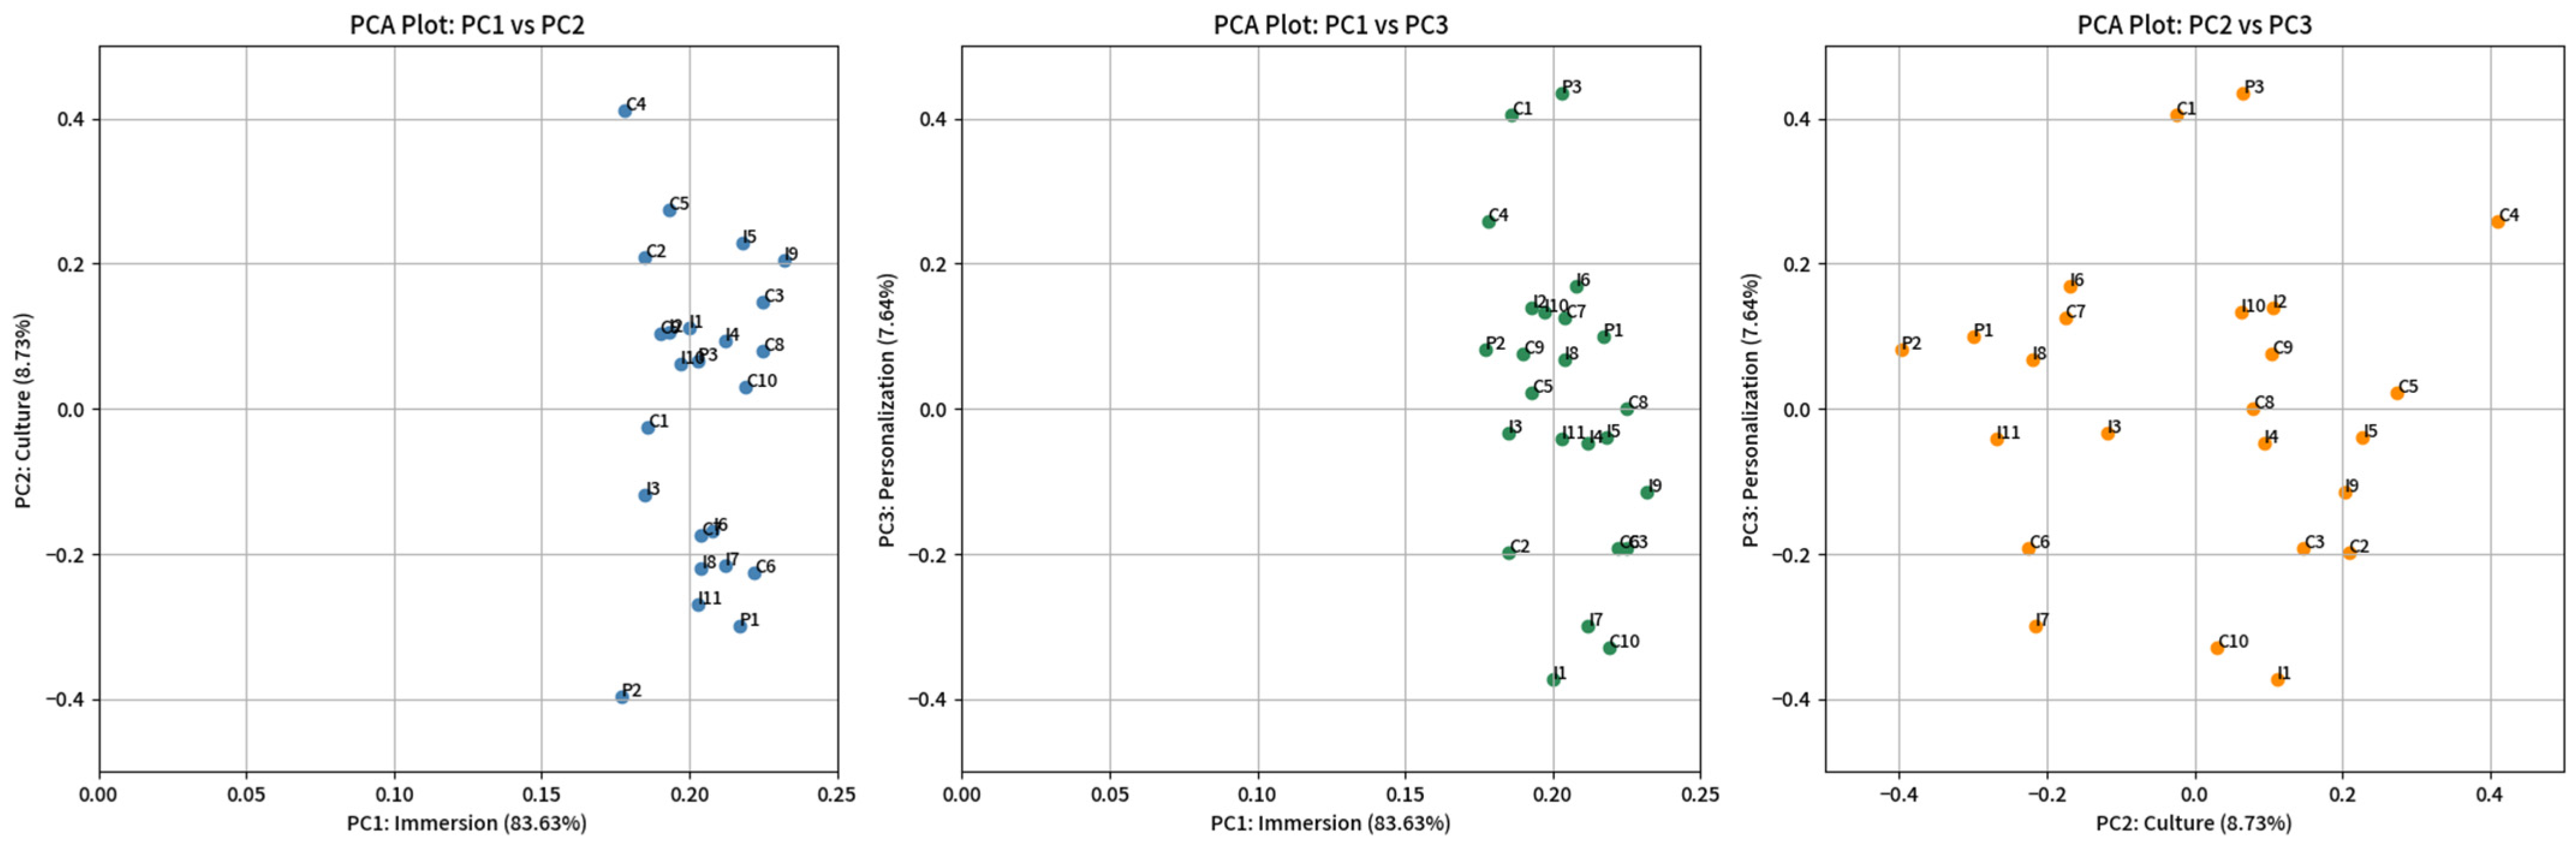
4.1.3. Principal Component Analysis Results
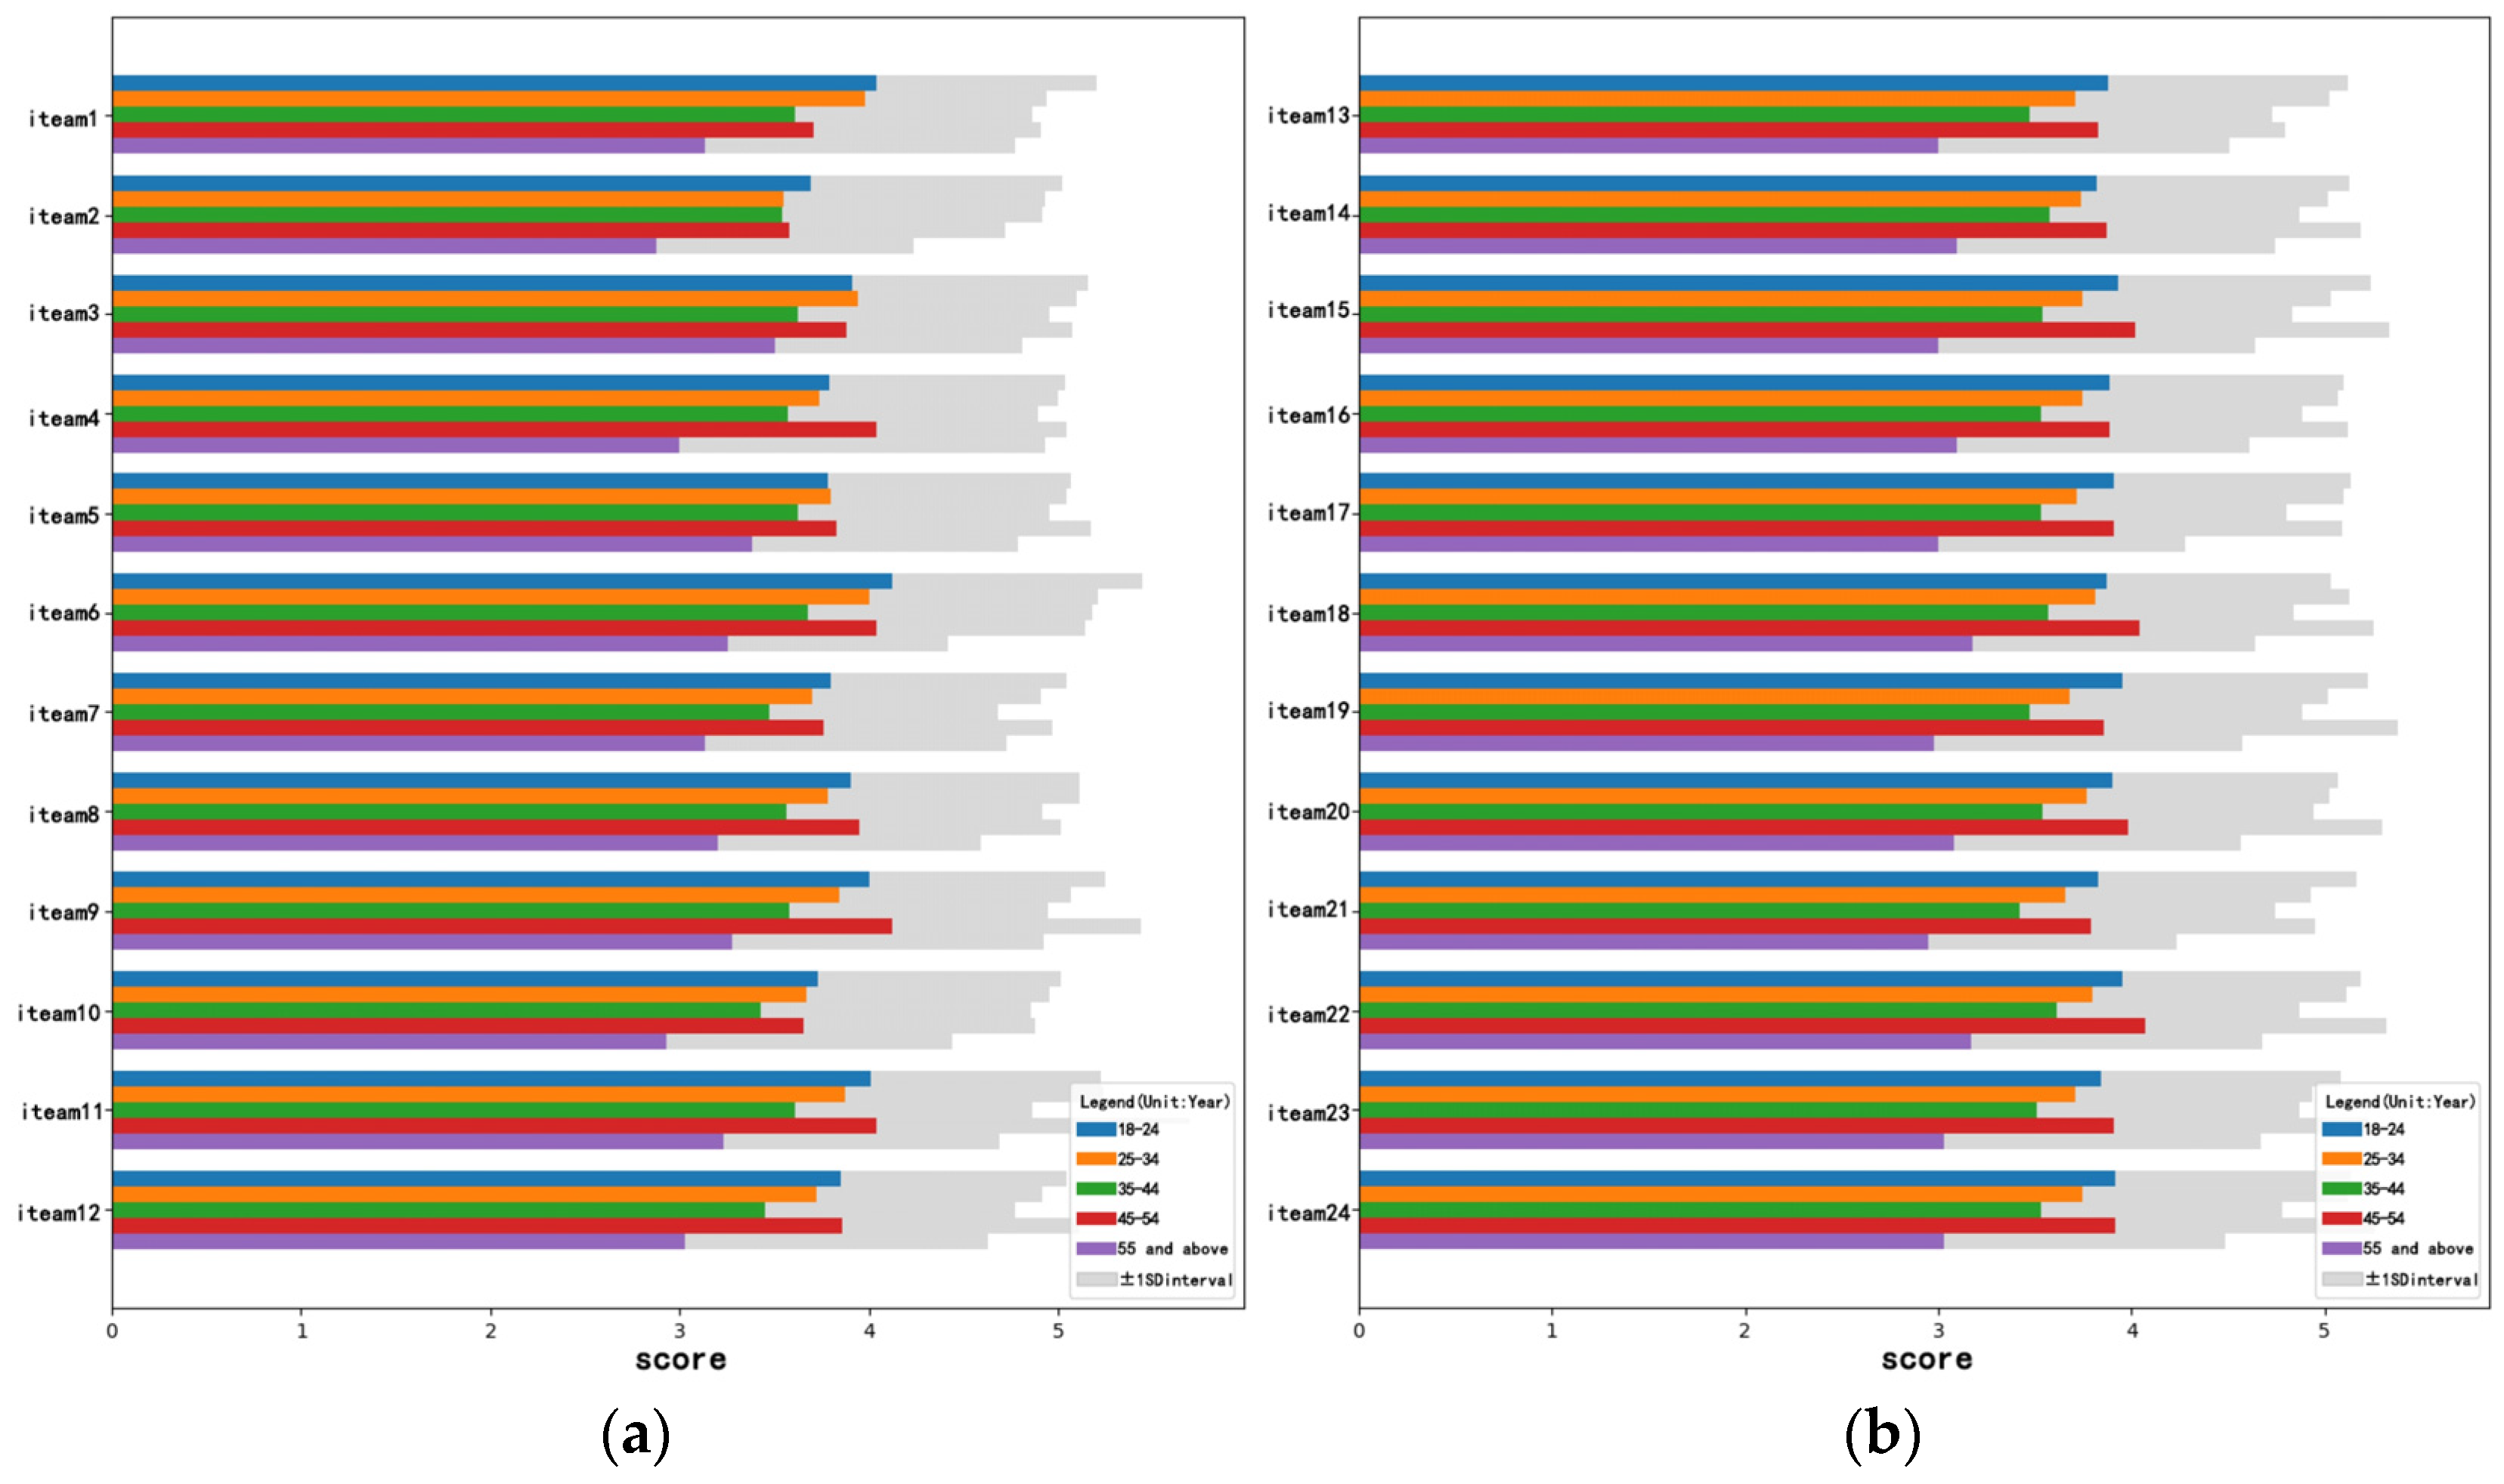
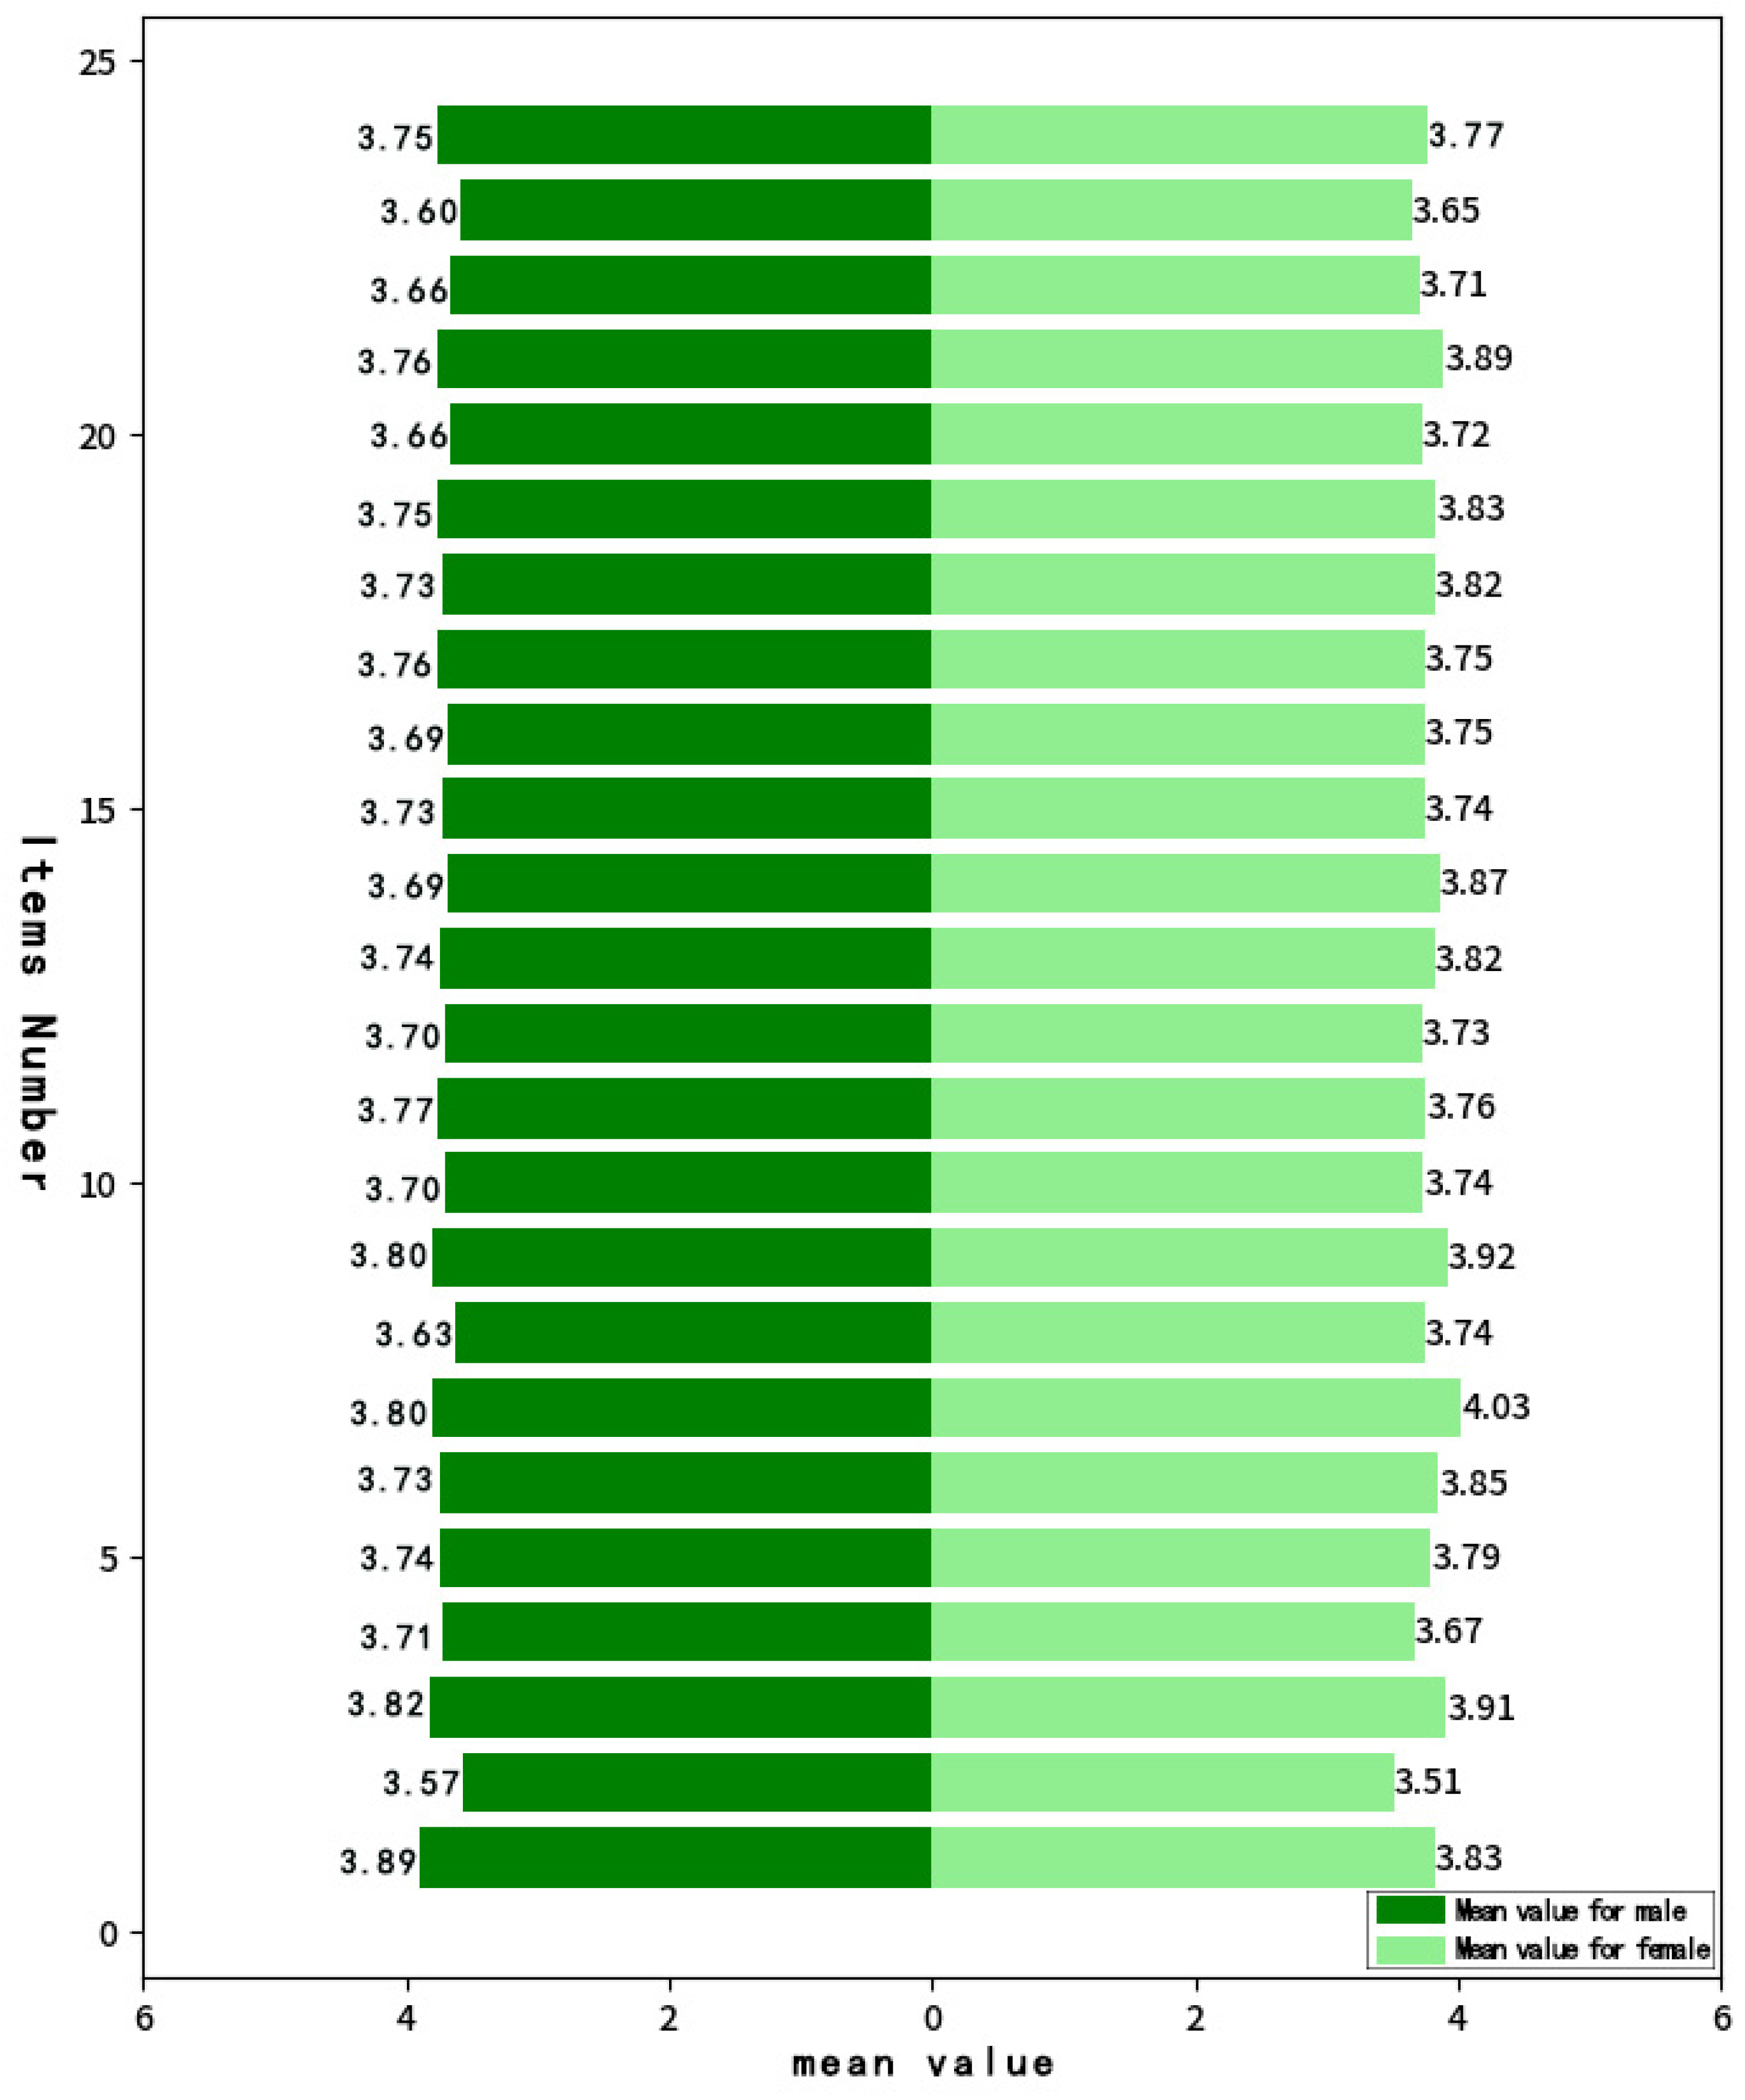
4.1.4. Age and Gender Effects on Experience Scores
4.1.5. Confirmatory Factor Analysis Results
4.2. Multisensory Experience Analysis of Digital Museums Based on SEM
4.2.1. Descriptive Statistics
4.2.2. Reliability Analysis for Information Perception and Emotional Response
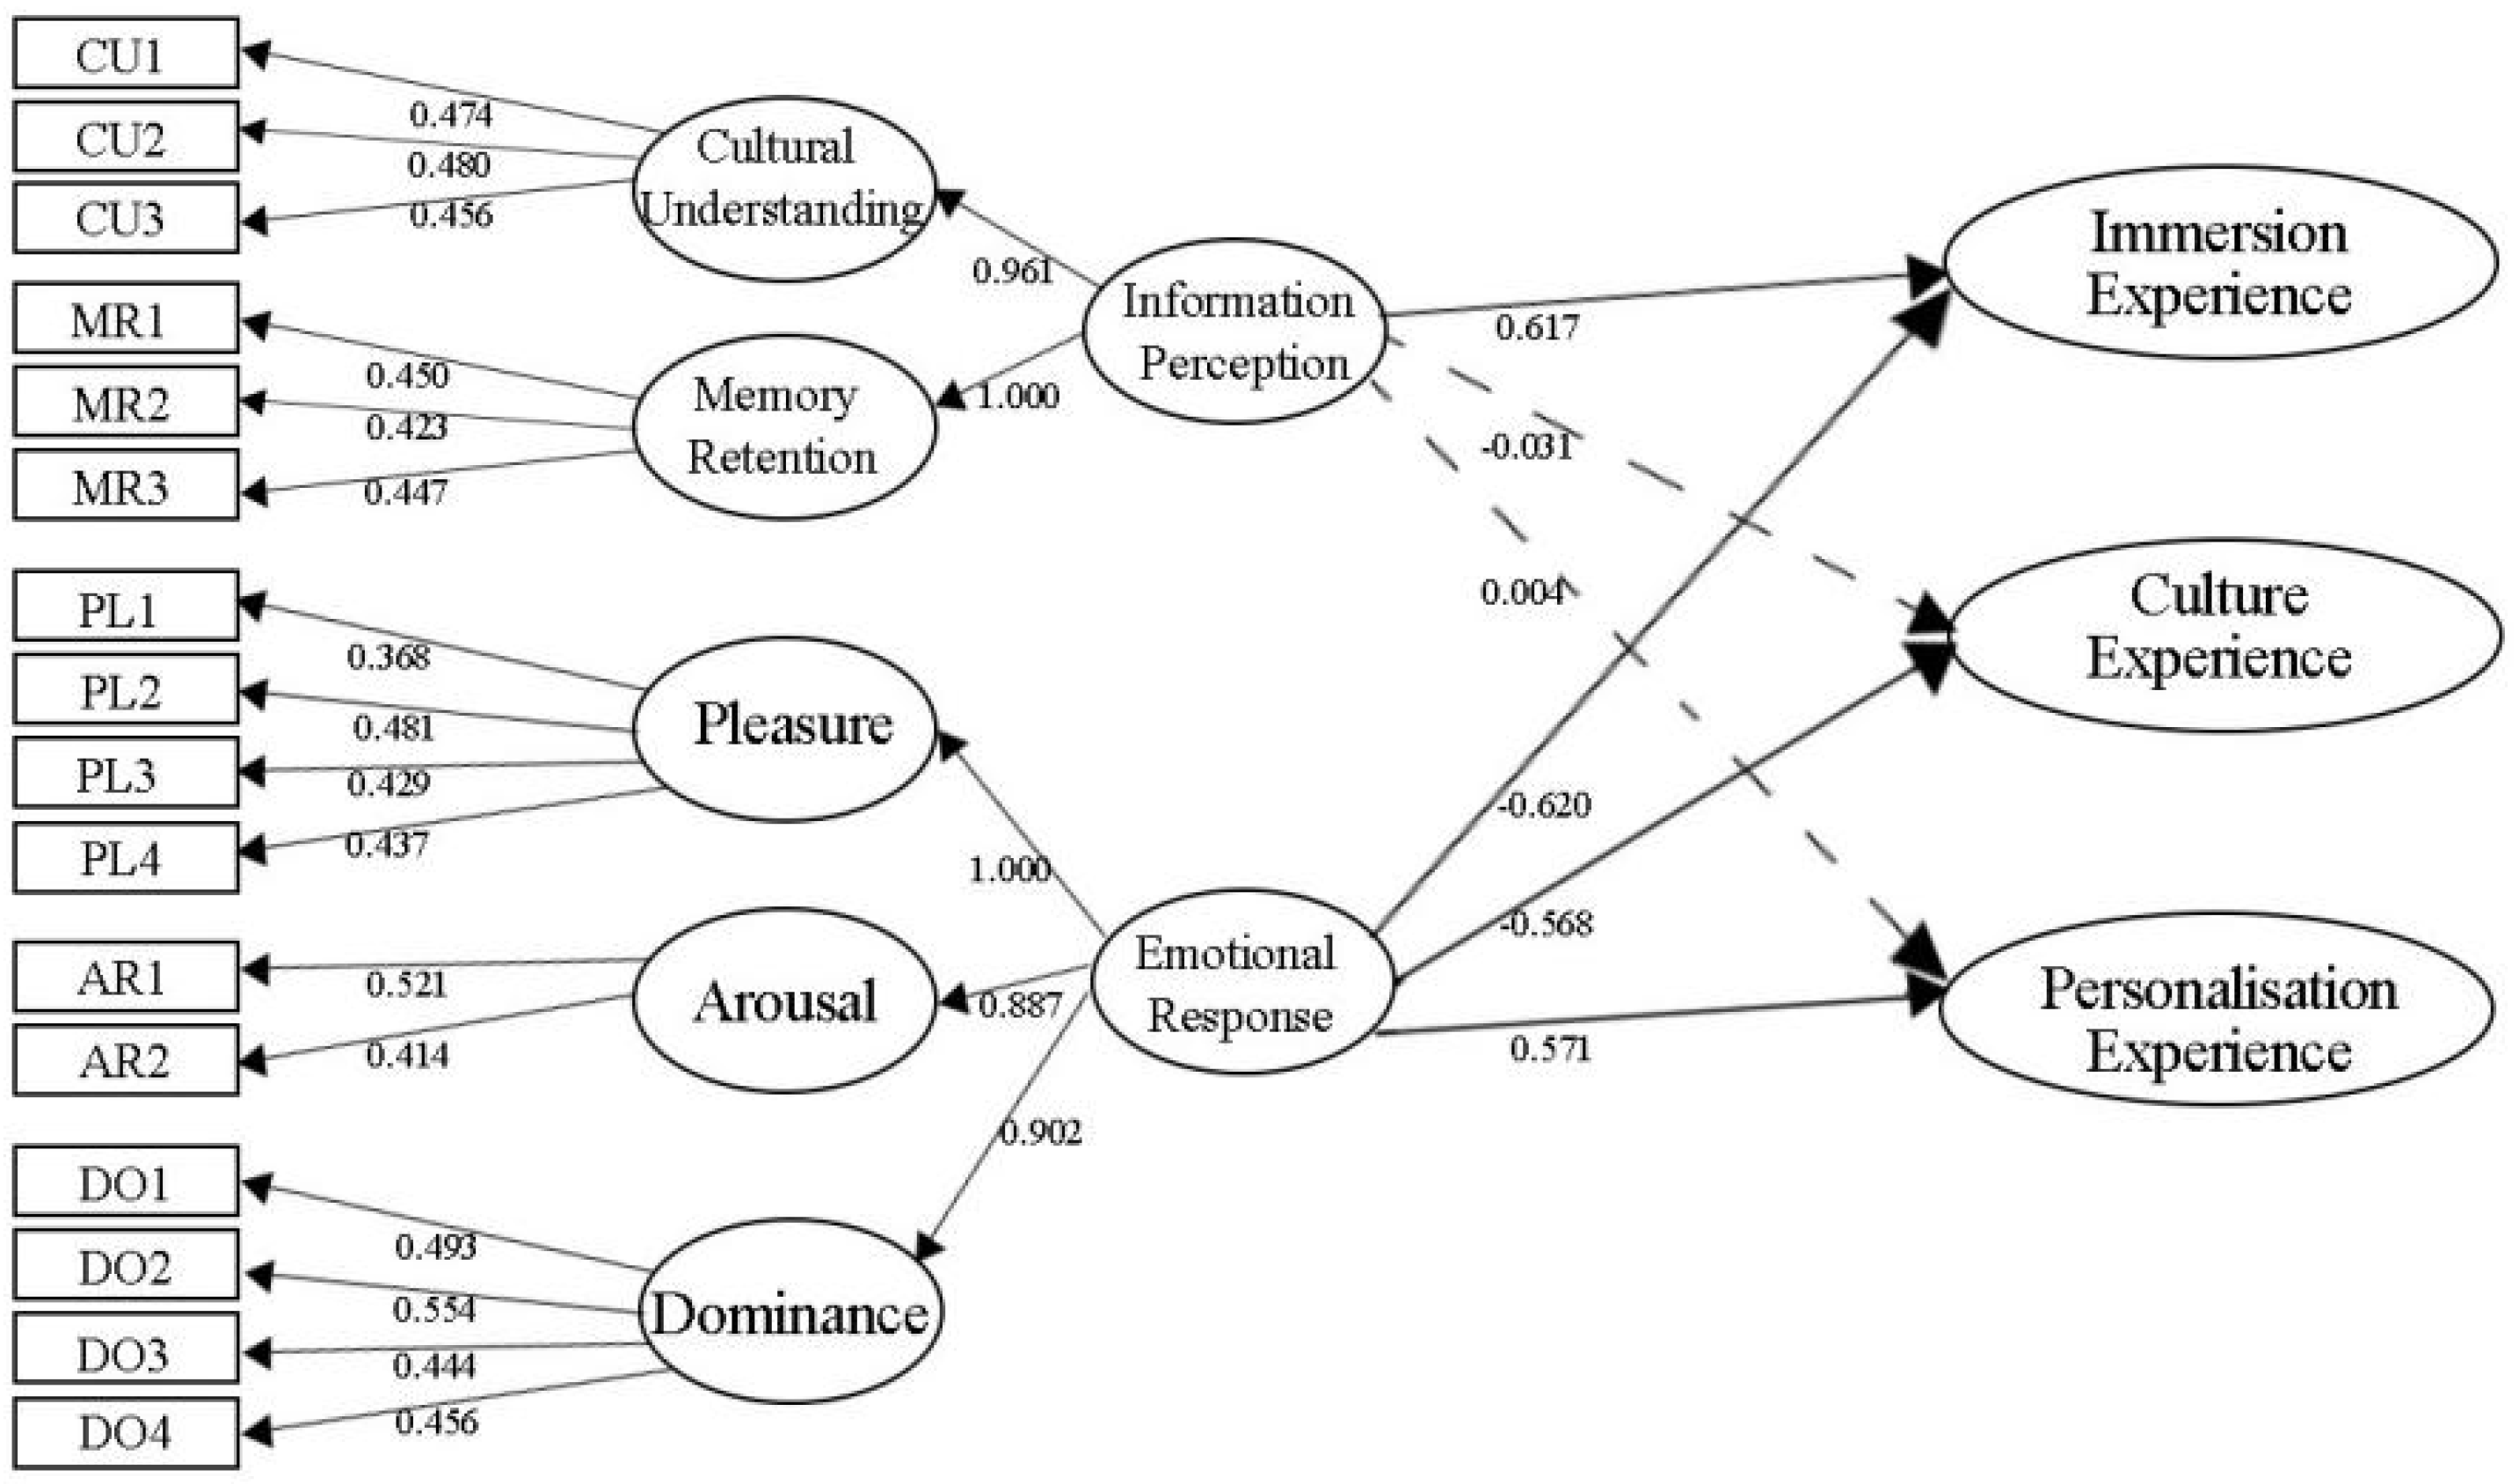
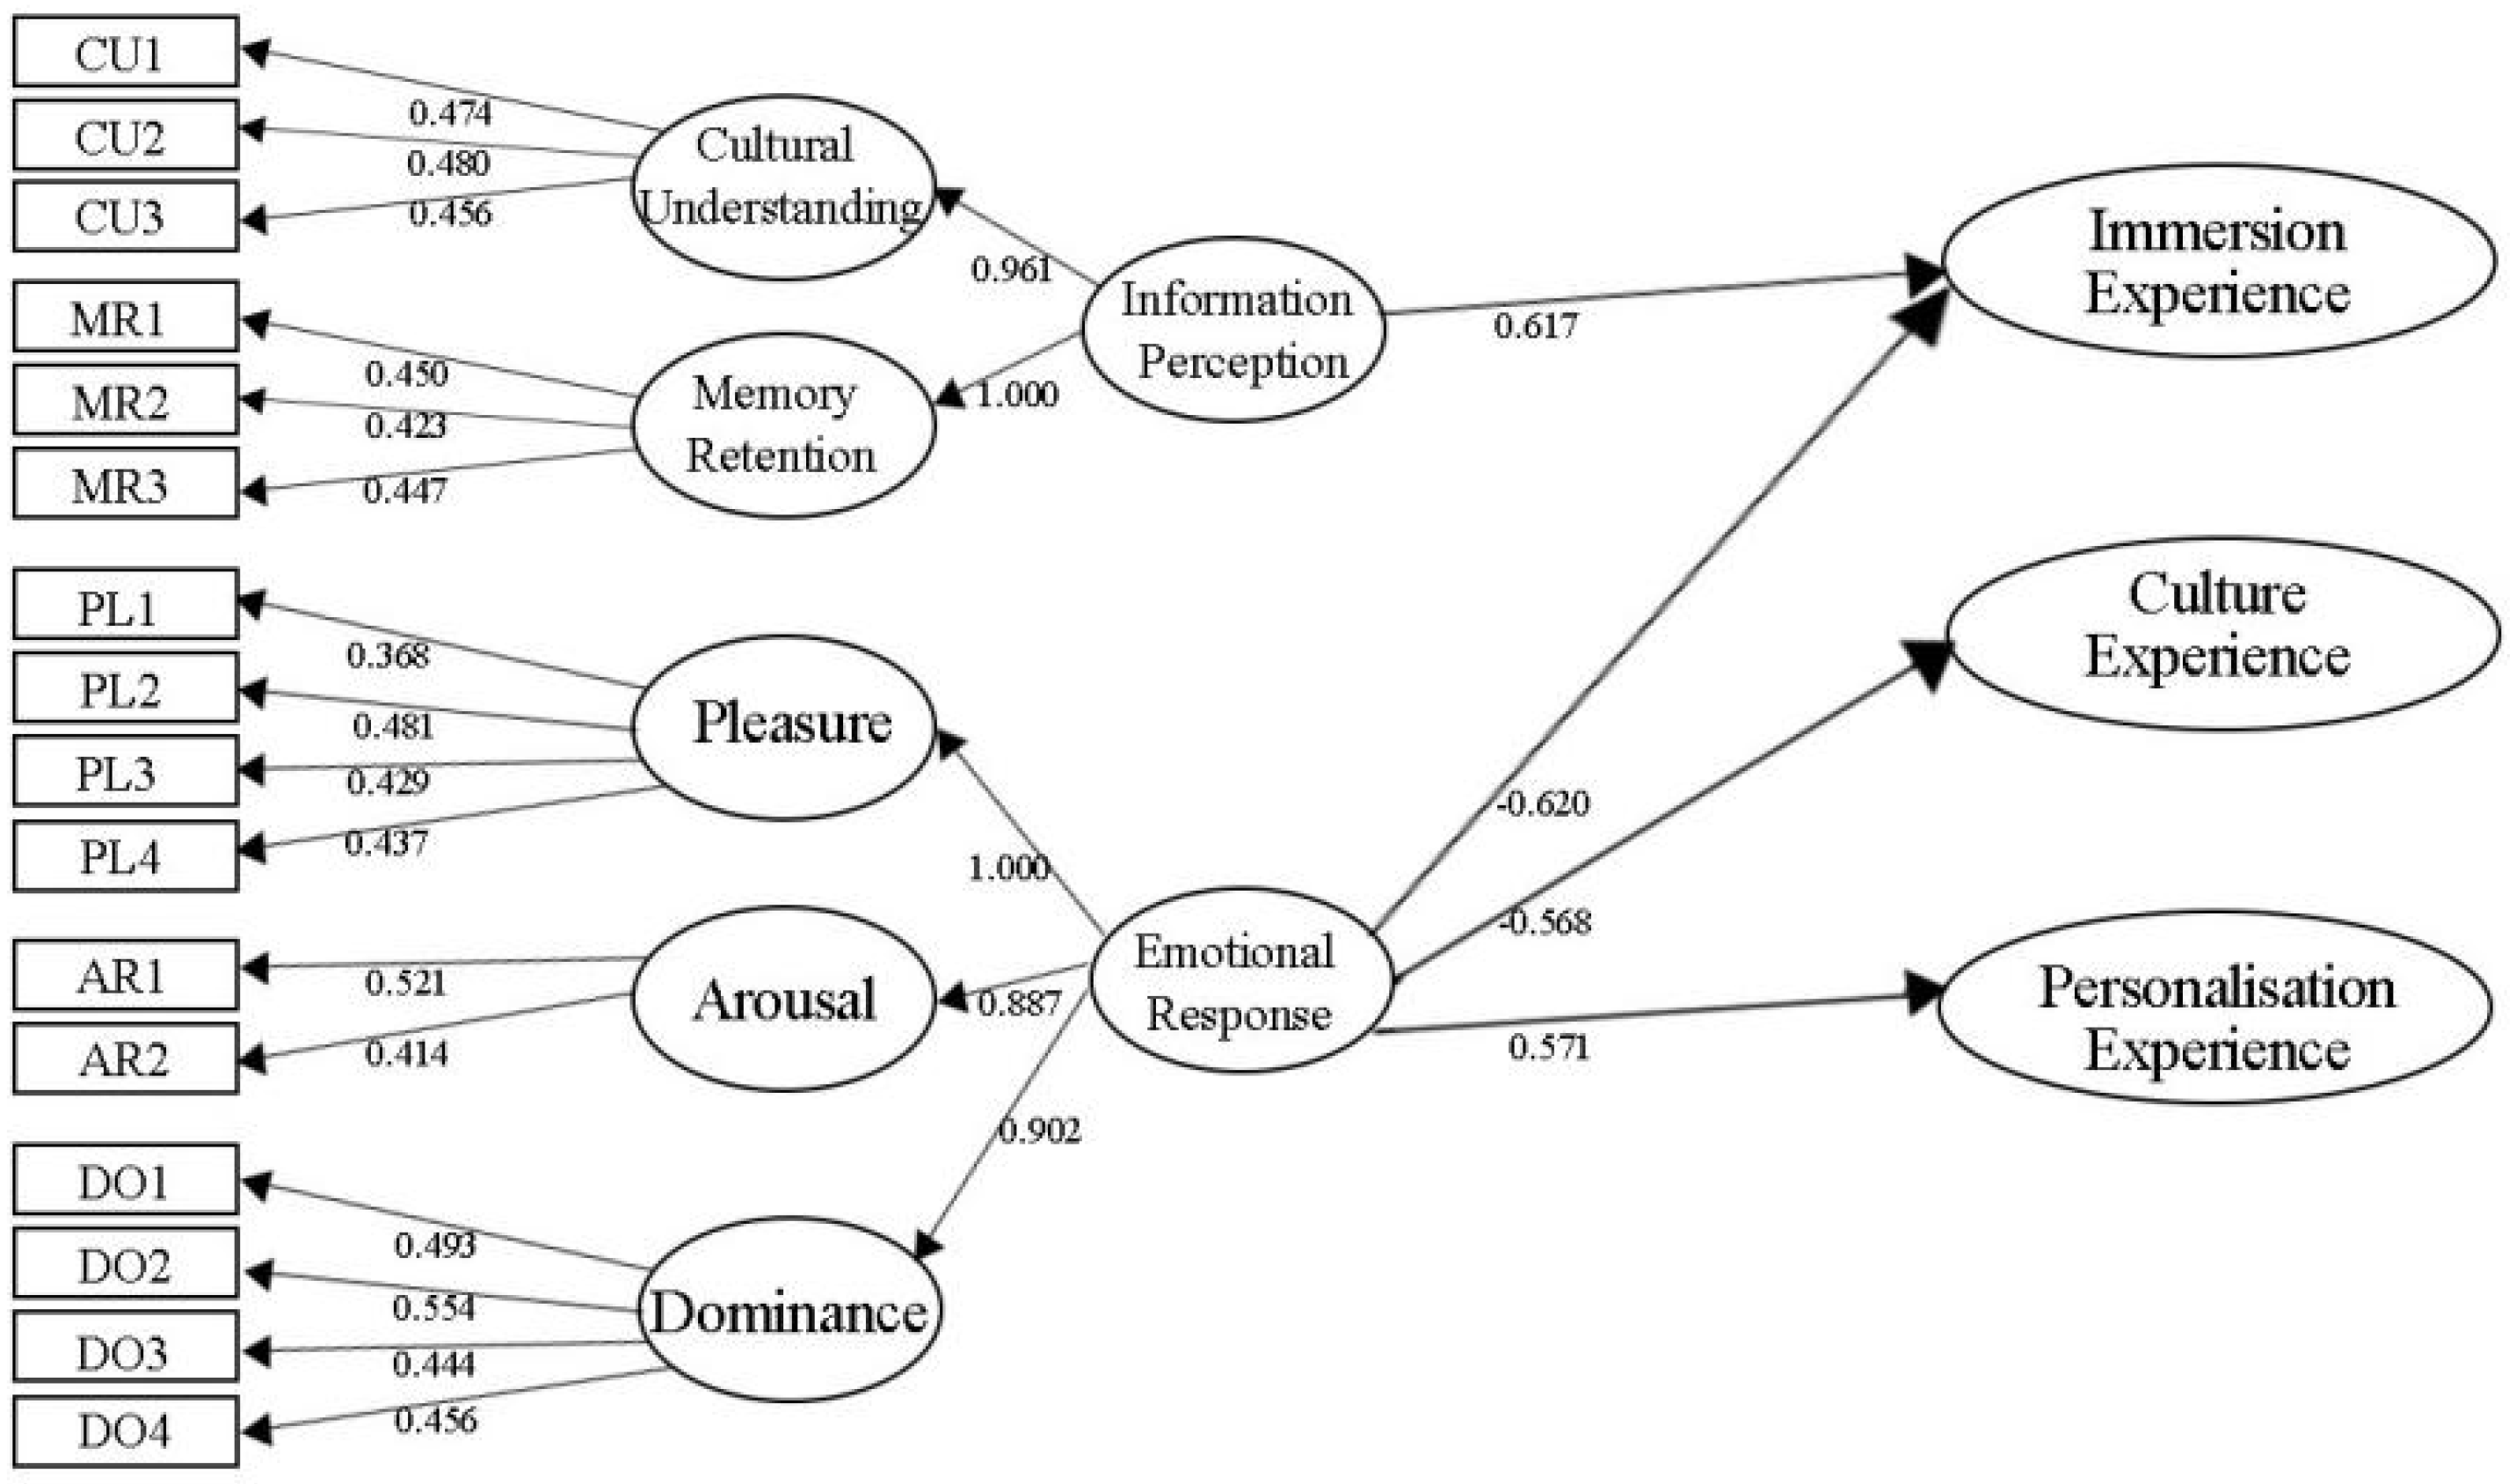
4.2.3. Structural Equation Model Results
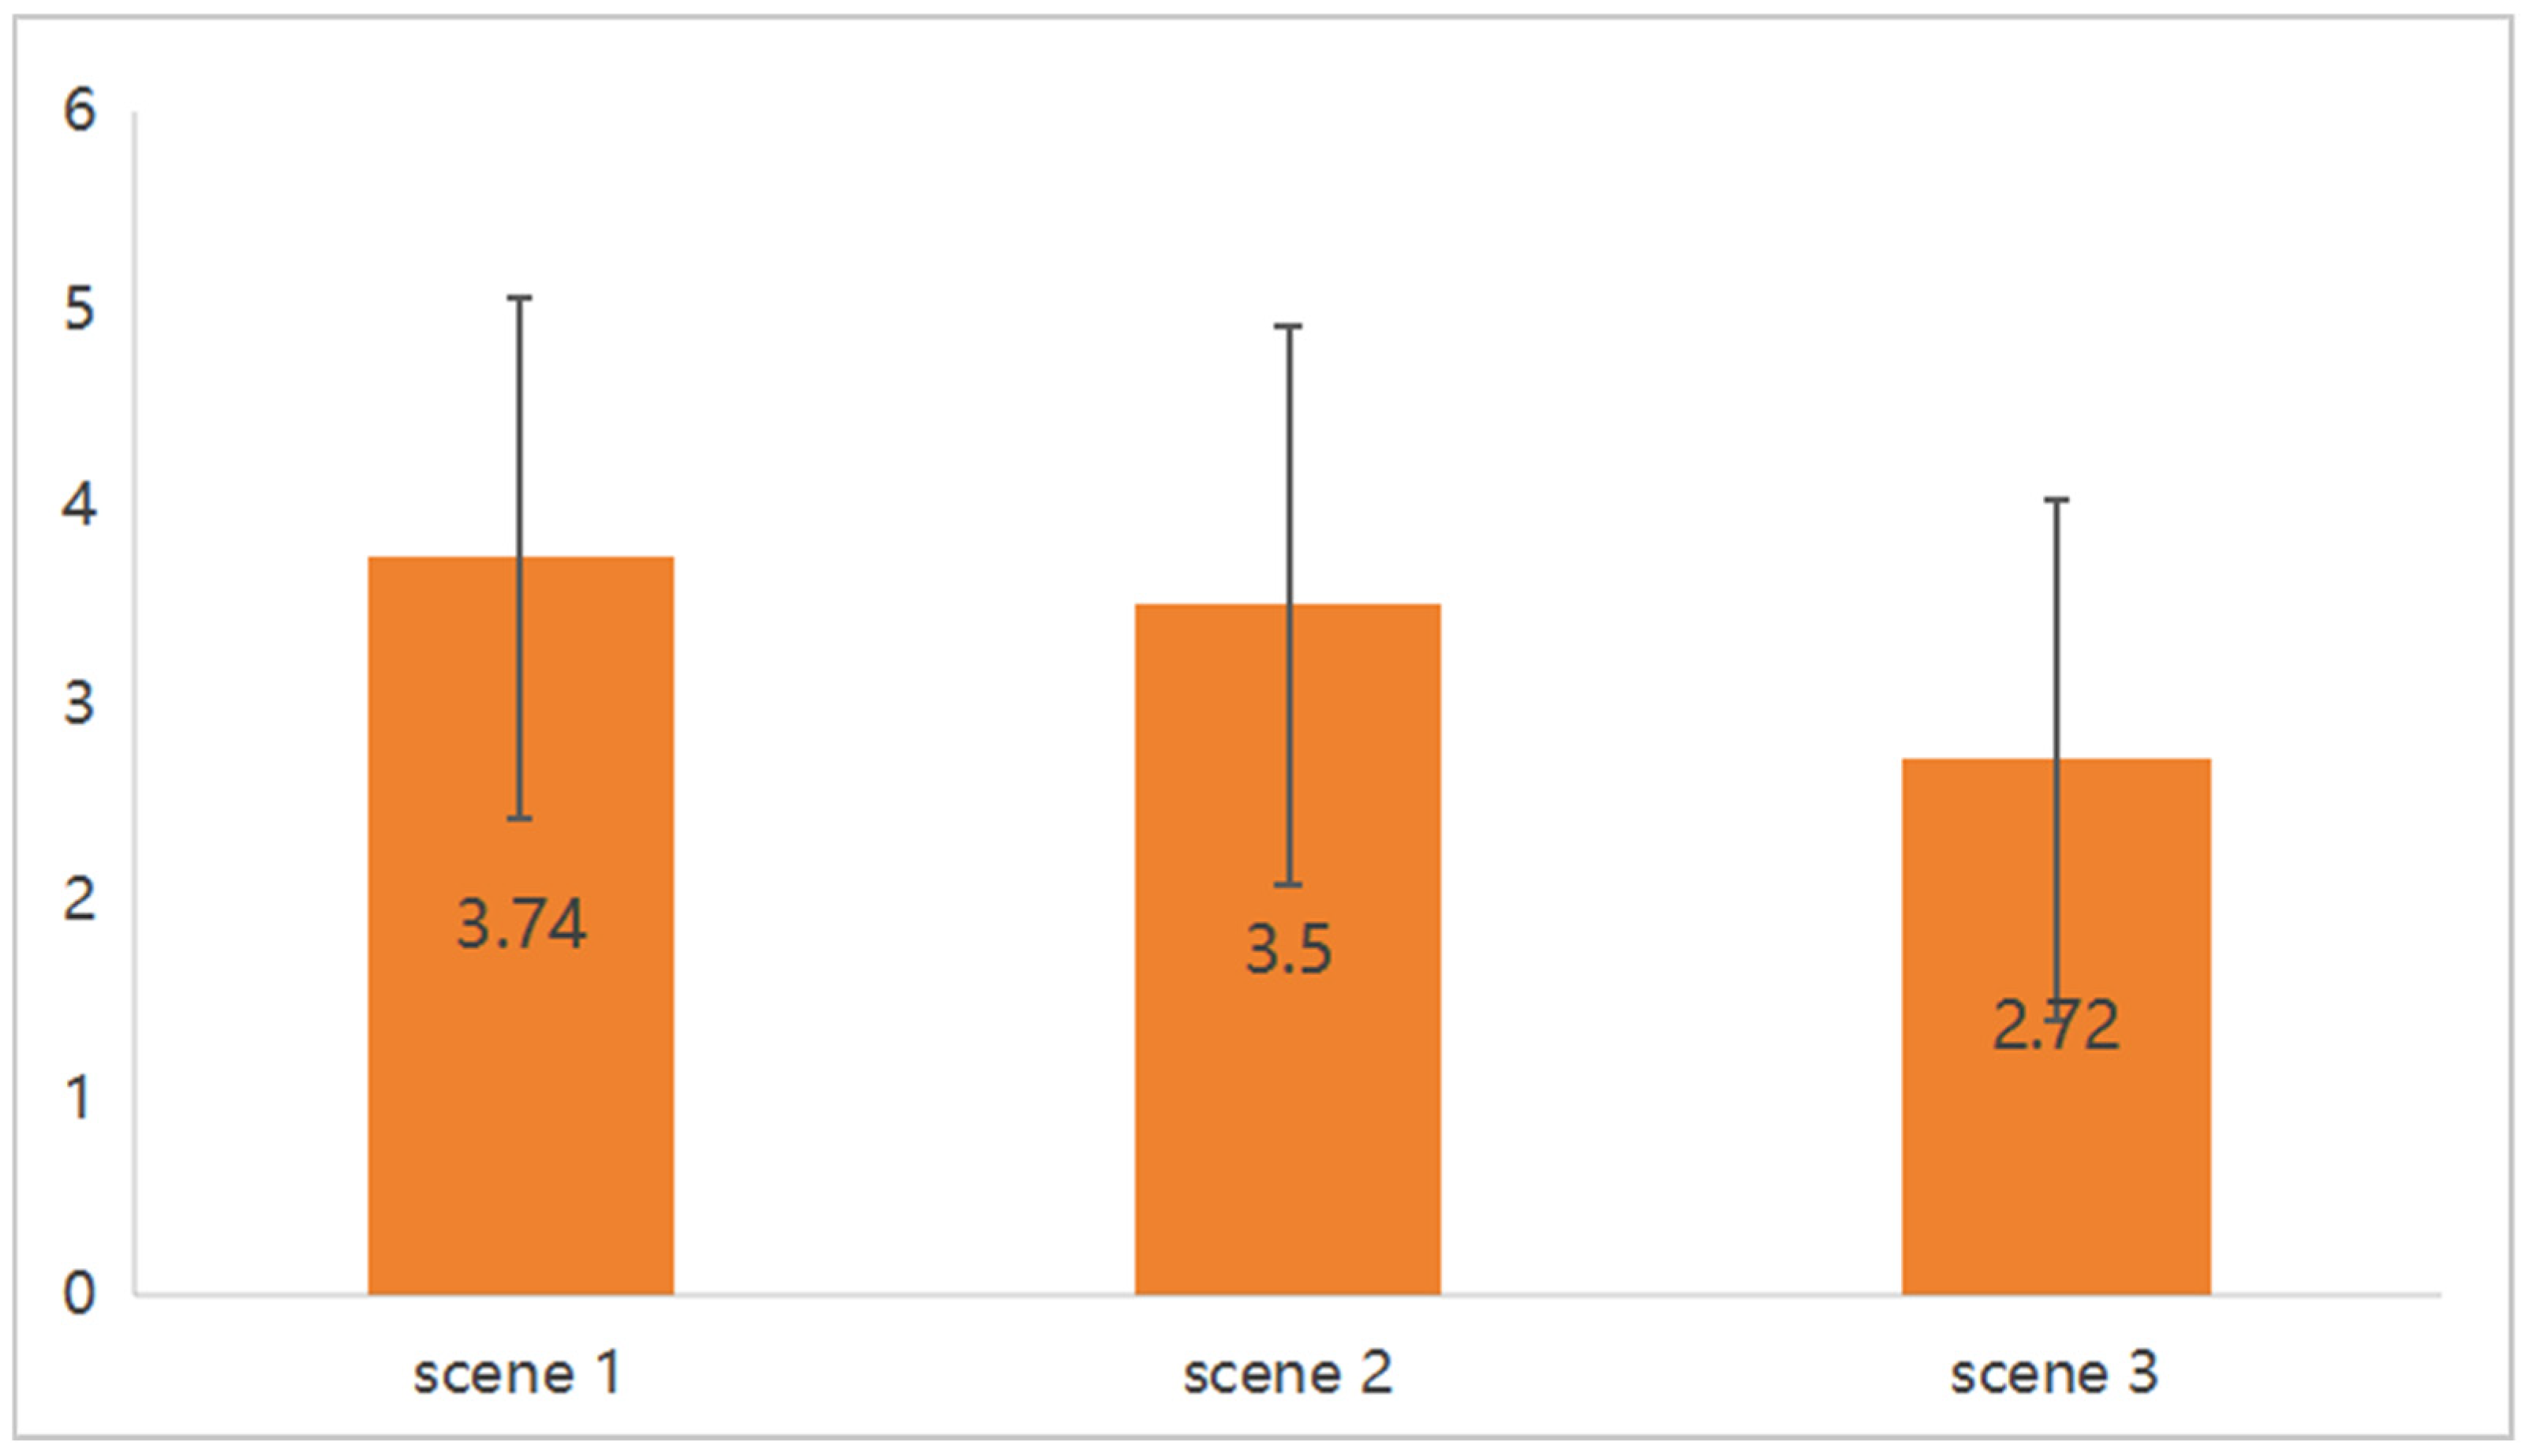
4.2.4. Multisensory Format Effects
5. Discussion
5.1. Identification and Structural Analysis of Multisensory Interaction Experience Dimensions
5.2. Exploring the Mechanism of “Immersion-Culture-Personalization” in Multi-Sensory Interactive Experiences
5.3. Comparison with Existing Research and Theoretical Contributions
- (1)
- High Consistency with Existing Literature:
- (2)
- Innovations and Differences from the Existing Literature
- (3)
- Differences from the Existing Literature and Reasons
6. Conclusions
- (1)
- Both emotional responses and information perception significantly impact the visitor experience positively. Emotional responses primarily influence personalized experiences, while information perception primarily enhances immersive and cultural experiences.
- (2)
- The synergistic effects of different sensory combinations on the experience vary. Experiences combining visual and auditory elements are the most prominent, while tactile and olfactory elements have room for improvement.
- (3)
- Different groups have different preferences for experience modes. Younger groups prioritize highly interactive and personalized experiences, while middle-aged and older groups place greater emphasis on cultural depth and authoritative information. These findings suggest that multi-sensory interactions can be designed to better accommodate the needs of different visitor groups.
7. Limitations and Implications
7.1. Limitations
- (1)
- Limitations in sample region and sensory types. This study primarily focused on digital museum visitors from specific regions, which may introduce regional cultural biases and affect the generalizability of the conclusions. Additionally, while this study involves multisensory cues, such as visual, auditory, tactile, and olfactory stimuli, exploration of gustatory stimuli is lacking due to technical limitations and constraints of the experimental environment. The interactive effects between weaker senses have not been thoroughly analyzed. Future research could expand the geographical scope of the sample and incorporate more sensory elements to enhance the model’s applicability.
- (2)
- Lack of tracking of dynamic behavior and long-term impacts. This study primarily focuses on visitors’ emotional responses and cognitive changes during short-term visits without addressing long-term behavioral changes after visits, such as cultural dissemination behaviors, cognitive retention, and social interactions. Future research could combine behavioral tracking technologies with longitudinal data collection to explore how multi-sensory experiences enhance cultural identity and promote sustainable actions in the long term.
7.2. Implications
- (1)
- Government Level: Strengthen policy support and cross-sectoral cooperation mechanisms. Governments can establish application standards for multisensory interactive technologies in the cultural dissemination sector to promote the integration of culture and technology. They should also support collaborative innovation among universities, technology companies, and cultural institutions. They should encourage technical pilot projects and application conversions in digital museum settings. Finally, they should create a favorable policy and technological environment for the high-quality development of the digital cultural industry.
- (2)
- Enterprise level: Promote the integration of the multi-sensory content industry chain. Cultural and technological enterprises should analyze audience sensory preferences and behavioral patterns, develop more immersive multi-sensory content products, and increase user engagement. They can also explore joint operations with cultural tourism sites and cultural and creative platforms to promote the integration of “virtual + physical” experiences and expand commercial scenarios for multi-sensory interaction.
- (3)
- Museum management level: Optimize audience-centric sensory experience pathways. Managers should use the “immersive, cultural, and personalized” three-dimensional experience structure to guide the layout of sensory devices in exhibition spaces. This will strengthen the synergy between visual and auditory elements and enhance exhibition engagement and memorability. They should combine audience data to make dynamic adjustments and achieve precise sensory experience design, thereby improving visitor satisfaction and the effectiveness of cultural dissemination.
Author Contributions
Funding
Institutional Review Board Statement
Informed Consent Statement
Data Availability Statement
Acknowledgments
Conflicts of Interest
References
- Bec, A.; Moyle, B.; Timms, K.; Schaffer, V.; Skavronskaya, L.; Little, C. Management of Immersive Heritage Tourism Experiences: A Conceptual Model. Tour. Manag. 2019, 72, 117–120. [Google Scholar] [CrossRef]
- Zeng, J.; Punjwani, A. Evaluating the Interactive and Transformative Role of Innovation, Education, Human Capital and Natural Resources Policies in Protecting and Sustaining Environmental Sustainability. Sustainability 2025, 17, 3130. [Google Scholar] [CrossRef]
- Howey, M.C.L. Harnessing Remote Sensing Derived Sea Level Rise Models to Assess Cultural Heritage Vulnerability: A Case Study from the Northwest Atlantic Ocean. Sustainability 2020, 12, 9429. [Google Scholar] [CrossRef]
- Li, J.; Zheng, X.; Watanabe, I.; Ochiai, Y. A Systematic Review of Digital Transformation Technologies in Museum Exhibition. Comput. Hum. Behav. 2024, 161, 108407. [Google Scholar] [CrossRef]
- Csesznek, C.; Rățulea, G.; Defta, M.; Harabagiu, F.-M.; Sorea, D. The Potential for Sustainable Local Development through Digital Communication and Digitization of Intangible Cultural Heritage Resources in Făgăraș Land, Romania. Sustainability 2024, 16, 1532. [Google Scholar] [CrossRef]
- Hoyer, W.D.; Kroschke, M.; Schmitt, B.; Kraume, K.; Shankar, V. Transforming the Customer Experience Through New Technologies. J. Interact. Mark. 2022, 51, 57–71. [Google Scholar] [CrossRef]
- Wang, S. A Bodies-On Museum: The Transformation of Museum Embodiment Through Virtual Technology. Curator Mus. J. 2022, 66, 107–128. [Google Scholar] [CrossRef]
- Sylaiou, S.; Mania, K.; Karoulis, A.; White, M. Exploring the Relationship Between Presence and Enjoyment in a Virtual Museum. Int. J. Hum.-Comput. Stud. 2010, 68, 243–253. [Google Scholar] [CrossRef]
- Vlizos, S.; Kotsopoulos, K.; Christodoulou, D. Enhancing Cultural Sustainability: Making Rescue Excavations Accessible through Educational Applications and Virtual Reality. Sustainability 2024, 16, 1439. [Google Scholar] [CrossRef]
- Li, S.; Scott, N.; Walters, G. Current and Potential Methods for Measuring Emotion in Tourism Experiences: A Review. Curr. Issues Tour. 2014, 18, 805–827. [Google Scholar] [CrossRef]
- Neuhofer, B.; Buhalis, D.; Ladkin, A. Conceptualising Technology Enhanced Destination Experiences. J. Destin. Mark. Manag. 2012, 1, 36–46. [Google Scholar] [CrossRef]
- Lee, H.; Jung, T.H.; tom Dieck, M.C.; Chung, N. Experiencing Immersive Virtual Reality in Museums. Inf. Manag. 2020, 57, 103229. [Google Scholar] [CrossRef]
- Shamim, N.; Gupta, S.; Shin, M.M. Evaluating User Engagement via Metaverse Environment Through Immersive Experience for Travel and Tourism Websites. Int. J. Contemp. Hosp. Manag. 2024, 37, 1132–1174. [Google Scholar] [CrossRef]
- Styliani, S.; Fotis, L.; Kostas, K.; Petros, P. Virtual Museums, a Survey and Some Issues for Consideration. J. Cult. Herit. 2009, 10, 520–528. [Google Scholar] [CrossRef]
- Okunaka, A. Synesthesia–Crossing the Senses with Arzt–. Available online: https://what.warehouseofart.org/en/exhibitions/synesthesia_en/ (accessed on 8 January 2025).
- Guo, K.; Fan, A.; Lehto, X.; Day, J. Immersive Digital Tourism: The Role of Multisensory Cues in Digital Museum Experiences. J. Hosp. Tour. Res. 2021, 47, 1017–1039. [Google Scholar] [CrossRef]
- Yang, Y.; Liu, S.; Song, X. The Co-Creation of Museum Experience Value from the Perspective of Visitor Motivation. Sage Open 2023, 13, 21582440231. [Google Scholar] [CrossRef]
- Poux, F.; Valembois, Q.; Mattes, C.; Kobbelt, L.; Billen, R. Initial User-Centered Design of a Virtual Reality Heritage System: Applications for Digital Tourism. Remote Sens. 2020, 12, 2583. [Google Scholar] [CrossRef]
- Antón, C.; Camarero, C.; Garrido, M.-J. Exploring the Experience Value of Museum Visitors as a Co-Creation Process. Curr. Issues Tour. 2017, 21, 1406–1425. [Google Scholar] [CrossRef]
- Pine, B.J.; Gilmore, J.H. The Experience Economy; Harvard Business Press: Boston, MA, USA, 2011. [Google Scholar]
- Trunfio, M.; Jung, T.; Campana, S. Mixed Reality Experiences in Museums: Exploring the Impact of Functional Elements of the Devices on Visitors’ Immersive Experiences and Post-Experience Behaviours. Inf. Manag. 2022, 59, 103698. [Google Scholar] [CrossRef]
- Wang, Y.; Wang, L.; Siau, K.L. Human-Centered Interaction in Virtual Worlds: A New Era of Generative Artificial Intelligence and Metaverse. Int. J. Hum.-Comput. Interact. 2024, 41, 1459–1501. [Google Scholar] [CrossRef]
- Chung, N.; Lee, H.; Kim, J.-Y.; Koo, C. The Role of Augmented Reality for Experience-Influenced Environments: The Case of Cultural Heritage Tourism in Korea. J. Travel Res. 2017, 57, 627–643. [Google Scholar] [CrossRef]
- Walls, A.R. A Cross-Sectional Examination of Hotel Consumer Experience and Relative Effects on Consumer Values. Int. J. Hosp. Manag. 2013, 32, 179–192. [Google Scholar] [CrossRef]
- Florido-Benítez, L.; del Alcázar Martínez, B. How Artificial Intelligence (AI) Is Powering New Tourism Marketing and the Future Agenda for Smart Tourist Destinations. Electronics 2024, 13, 4151. [Google Scholar] [CrossRef]
- The Metropolitan Museum of Art. The Metropolitan Museum of Art and Verizon Launch Interactive Virtual Art Experience. Available online: https://www.metmuseum.org/press-releases/the-met-unframed-2021-news (accessed on 8 January 2025).
- teamLab. Story of the Forest. Available online: https://www.teamlab.art/w/story-of-the-forest/ (accessed on 8 January 2025).
- Ng, B. teamLab. ArtAsiaPac. 2017, 105, 82–93. Available online: https://search.informit.org/doi/10.3316/informit.041339321257408 (accessed on 8 January 2025).
- Atelier des Lumières. Available online: https://www.atelier-lumieres.com/en (accessed on 8 January 2025).
- Des Lumières. Available online: https://www.deslumieres.co.kr/en/theatre (accessed on 8 January 2025).
- Kim, H.; Lee, I.K. Studying the Effects of Congruence of Auditory and Visual Stimuli on Virtual Reality Experiences. IEEE Trans. Vis. Comput. Graph. 2022, 28, 2080–2090. [Google Scholar] [CrossRef]
- Spence, C.; Puccinelli, N.M.; Grewal, D.; Roggeveen, A.L. Store Atmospherics: A Multisensory Perspective. Psychol. Mark. 2014, 31, 472–488. [Google Scholar] [CrossRef]
- Juslin, P.N.; Västfjäll, D. Emotional Responses to Music: The Need to Consider Underlying Mechanisms. Behav. Brain Sci. 2008, 31, 559–575. [Google Scholar] [CrossRef]
- Yang, T.H.; Kim, J.R.; Jin, H.; Gil, H.; Koo, J.H.; Kim, H.J. Recent Advances and Opportunities of Active Materials for Haptic Technologies in Virtual and Augmented Reality. Adv. Funct. Mater. 2021, 31, 2008831. [Google Scholar] [CrossRef]
- Wang, Y.; Li, Y.; Yuan, M.; Fei, X.; Ma, S.; Hansen, P. ScentClue: Enhancing Story Engagement in Virtual Reality Through Hedonically Varied Olfactory Hints. Int. J. Hum.-Comput. Interact. 2024, 42, 7404–7423. [Google Scholar] [CrossRef]
- Crofton, E.C.; Botinestean, C.; Fenelon, M.; Gallagher, E. Potential Applications for Virtual and Augmented Reality Technologies in Sensory Science. Innov. Food Sci. Emerg. Technol. 2019, 56, 102178. [Google Scholar] [CrossRef]
- teamLab Borderless Odaiba (Closed) Official Site: MORI Building DIGITAL ART MUSEUM. Available online: https://borderless.teamlab.art/ (accessed on 14 June 2025).
- The Panoramic Palace Museum. Available online: https://pano.dpm.org.cn/ (accessed on 14 June 2025).
- Overview Exhibitions—Deutsches Museum. Available online: https://www.deutsches-museum.de/ (accessed on 14 June 2025).
- Flavián, C.; Ibáñez-Sánchez, S.; Orús, C. The Influence of Scent on Virtual Reality Experiences: The Role of Aroma-Content Congruence. J. Bus. Res. 2021, 123, 289–301. [Google Scholar] [CrossRef]
- Merter, S. Synesthetic Approach in the Design Process for Enhanced Creativity and Multisensory Experiences. Des. J. 2017, 20 (Suppl. S1), S4519–S4528. [Google Scholar] [CrossRef]
- Gibson, J.J.; Gibson, E.J. Perceptual learning: Differentiation or enrichment? Psychol. Rev. 1955, 62, 32–41. [Google Scholar] [CrossRef] [PubMed]
- Conde, T.; Thalmann, D. An Artificial Life Environment for Autonomous Virtual Agents with Multi-Sensorial and Multi-Perceptive Features. Comput. Animat. Virtual Worlds 2004, 15, 311–318. [Google Scholar] [CrossRef]
- Eldardeer, O.; Gonzalez-Billandon, J.; Grasse, L.; Tata, M.; Rea, F. A Biological Inspired Cognitive Framework for Memory-Based Multi-Sensory Joint Attention in Human-Robot Interactive Tasks. Front. Neurorobot. 2021, 15, 648595. [Google Scholar] [CrossRef]
- Mazaheri, E.; Richard, M.-O.; Laroche, M. Online Consumer Behavior: Comparing Canadian and Chinese Website Visitors. J. Bus. Res. 2011, 64, 958–965. [Google Scholar] [CrossRef]
- Nguyen-Dinh, N.; Zhang, H. How Landscape Preferences and Emotions Shape Environmental Awareness: Perspectives from University Experiences. Sustainability 2025, 17, 3161. [Google Scholar] [CrossRef]
- Jeon, M.M.; Jeong, M. Customers’ perceived website service quality and its effects on e-loyalty. Int. J. Contemp. Hosp. Manag. 2017, 29, 438–457. [Google Scholar] [CrossRef]
- Wei, C.; Dai, S.; Xu, H.; Wang, H. Cultural Worldview and Cultural Experience in Natural Tourism Sites. J. Hosp. Tour. Manag. 2020, 43, 241–249. [Google Scholar] [CrossRef]
- Radvansky, G.A.; Doolen, A.C.; Pettijohn, K.A.; Ritchey, M. A New Look at Memory Retention and Forgetting. J. Exp. Psychol. Learn. Mem. Cogn. 2022, 48, 1698. [Google Scholar] [CrossRef]
- Cheng, L.-K.; Huang, H.-L. Virtual Tourism Atmospheres: The Effects of Pleasure, Arousal, and Dominance on the Acceptance of Virtual Tourism. J. Hosp. Tour. Manag. 2022, 53, 143–152. [Google Scholar] [CrossRef]
- Axelrod, R. Schema Theory: An Information Processing Model of Perception and Cognition. Am. Polit. Sci. Rev. 2014, 67, 1248–1266. [Google Scholar] [CrossRef]
- Li, G.; Lin, S.; Tian, Y. Immersive Museums in the Digital Age: Exploring the Impact of Virtual Reality on Visitor Satisfaction and Loyalty. J. Knowl. Econ. 2024, 16, 2. [Google Scholar] [CrossRef]
- Lorenz, M.; Brade, J.; Klimant, P.; Heyde, C.-E.; Hammer, N. Age and gender effects on presence, user experience and usability in virtual environments—First insights. PLoS ONE 2023, 18, e0283565. [Google Scholar] [CrossRef]
- Sladek, R.M.; Bond, M.J.; Phillips, P.A. Age and gender differences in preferences for rational and experiential thinking. Pers. Individ. Differ. 2010, 49, 907–911. [Google Scholar] [CrossRef]
- Fornell, C.; Larcker, D.F. Evaluating Structural Equation Models with Unobservable Variables and Measurement Error. J. Mark. Res. 1981, 18, 39–50. [Google Scholar] [CrossRef]
- Anwar, M.; Yang, J.; Frnda, J.; Choi, A.; Baghaei, N.; Ali, M. Metaverse and XR for cultural heritage education: Applications, standards, architecture, and technological insights for enhanced immersive experience. Virtual Real. 2025, 29, 51. [Google Scholar] [CrossRef]
- Psomadaki, O.; Dimoulas, C.; Kalliris, G.; Paschalidis, G. Digital storytelling and audience engagement in cultural heritage management: A collaborative model based on the Digital City of Thessaloniki. J. Cult. Herit. 2018, 36, 12–22. [Google Scholar] [CrossRef]
- Jiménez-Barreto, J.; Valle-Nogueras, J.; Fernández-Barrios, S. Sustainable strategies for the museum experience: The role of visitor emotions, satisfaction, and loyalty. Tour. Manag. 2020, 79, 104101. [Google Scholar] [CrossRef]
- Liu, Q.; Sutunyarak, C. The Impact of Immersive Technology in Museums on Visitors’ Behavioral Intention. Sustainability 2024, 16, 9714. [Google Scholar] [CrossRef]


| Location | Project Name | Technology and Experience Overview | Sensory Modalities Implemented | Reference |
|---|---|---|---|---|
| United States | Met Unframed | The Metropolitan Museum of Art, in collaboration with Verizon, uses AR technology to allow viewers to use smart devices to browse art collections at home, enhancing visual detail and realism. | Visual and auditory | [26] |
| Korea | Story of the Forest | The National Museum of Korea has collaborated with teamLab to use 3D animation and omnidirectional projection technology to immerse visitors in a virtual forest and experience the evolution of natural history. | Visual and motion-interactive | [27] |
| France | (L’Atelier des Lumières) | Culturespaces produces immersive art exhibitions in cities such as Paris and Seoul, using high-definition projections and 3D sound effects to showcase artists’ works and provide a dynamic artistic experience. | Visual and auditory | [29] |
| Japan | MORI Building Digital Art Museum (teamLab Borderless) | Interactive digital installations blending physical movement with sound, light, and touch-responsive walls. | Visual, auditory, and tactile | [37] |
| China | Palace Museum VR Experience | Virtual reconstruction of the Forbidden City using VR headsets and ambient soundscapes; includes haptic controllers. | Visual, auditory, and tactile | [38] |
| Germany | Invisible Worlds (Deutsches Museum) | A multisensory science-art exhibition combining VR, scent release, and tactile interfaces to explore microscopic environments. | Visual, auditory, tactile, and olfactory | [39] |
| Research Question | Hypothesis | Explanation |
|---|---|---|
| RQ1. How can multisensory interaction techniques enhance the audience immersion experience in digital museums? What are the key aspects of the audience experience in digital museums? | H3—Different types of multisensory combinations have a significant positive impact on the digital museum visiting experience. | Examines the effect of different sensory modality combinations (e.g., visual–auditory, visual–auditory–tactile, visual–auditory–olfactory) on visitor immersion and experience. |
| RQ2. Do the emotional response and information perception of the audience impact the immersive experience of multisensory technology in digital museums? | H1—Emotional responses have a significant positive impact on the digital museum visiting experience. | Investigates the influence of emotional dimensions (e.g., pleasure, arousal, and dominance) on audience engagement and immersion. |
| H2—Information perception has a significant positive impact on the digital museum visiting experience. | Assesses the role of cognitive aspects such as cultural understanding and memory retention in shaping immersive digital museum experiences. |
| Scenario | Sensory Modalities | Description of Immersive Setting | Sensory Input Characteristics |
|---|---|---|---|
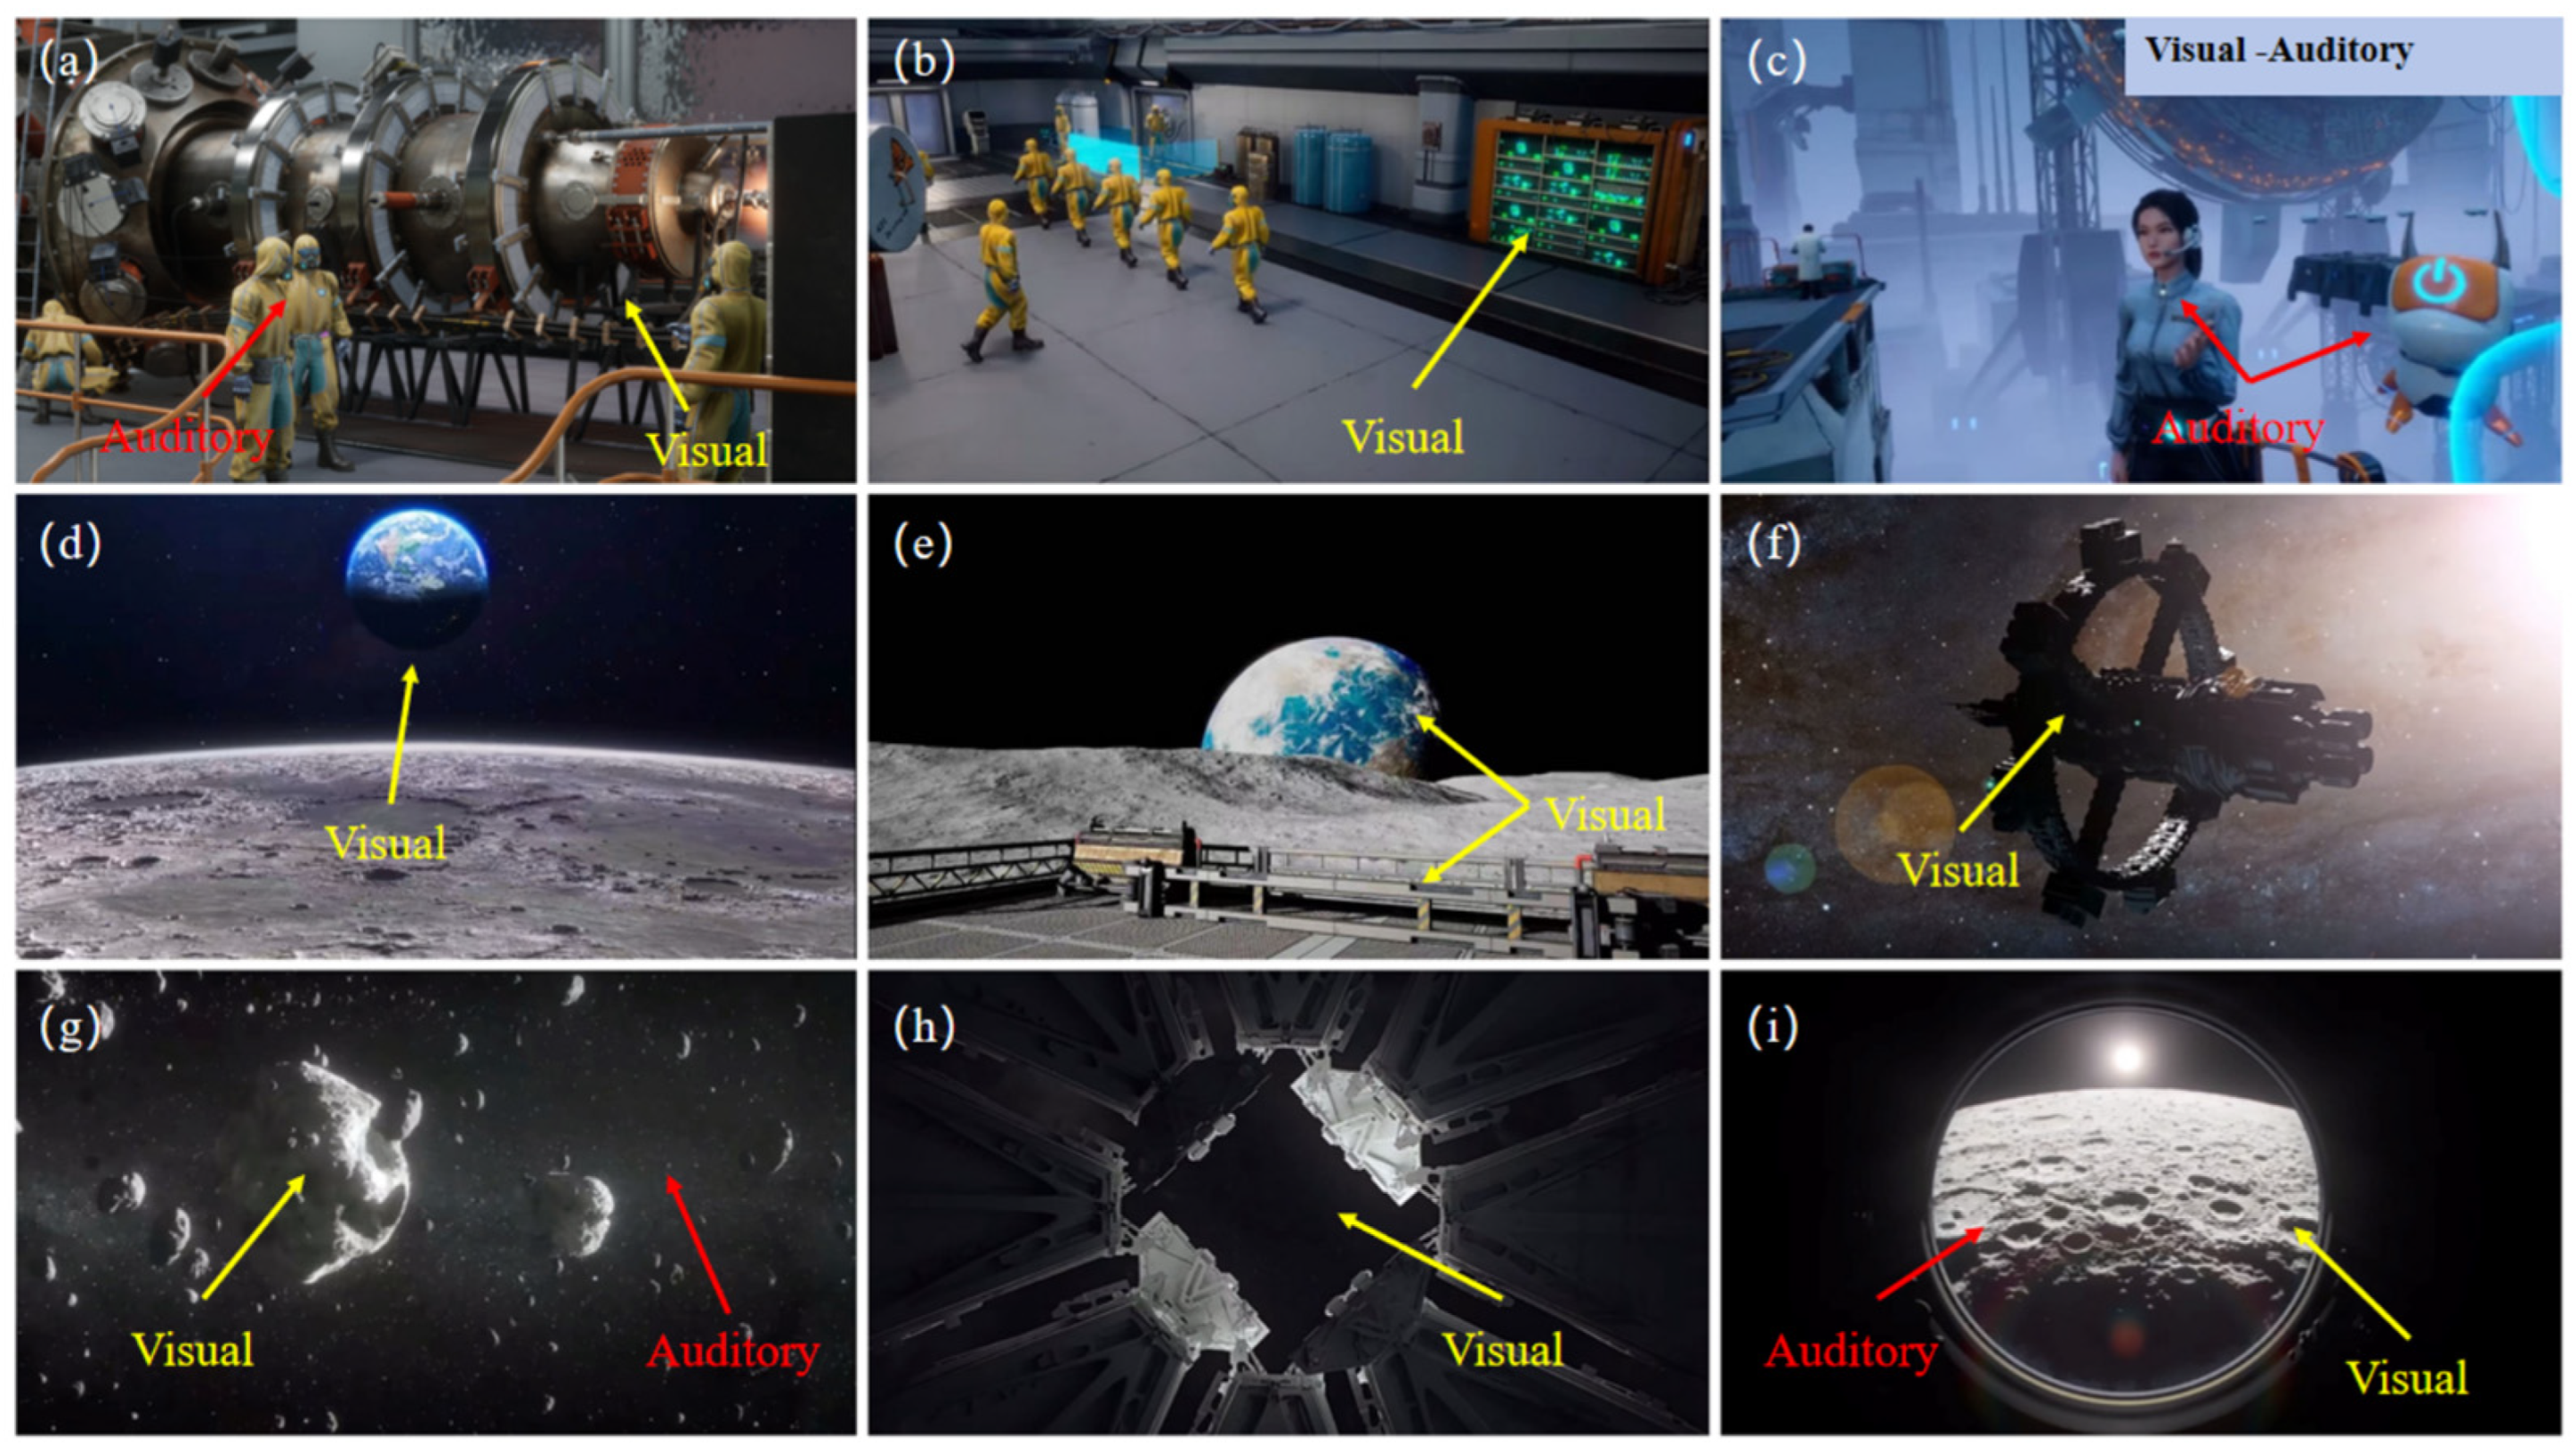
| Scenario 1 (Visual + Auditory) | Visual and auditory | Simulated scientific laboratory: participants see detailed large-scale equipment and hear mechanical sounds and team conversations. | Visual: High-resolution display of instruments and environment Auditory: Synchronized machine and dialogue sounds |
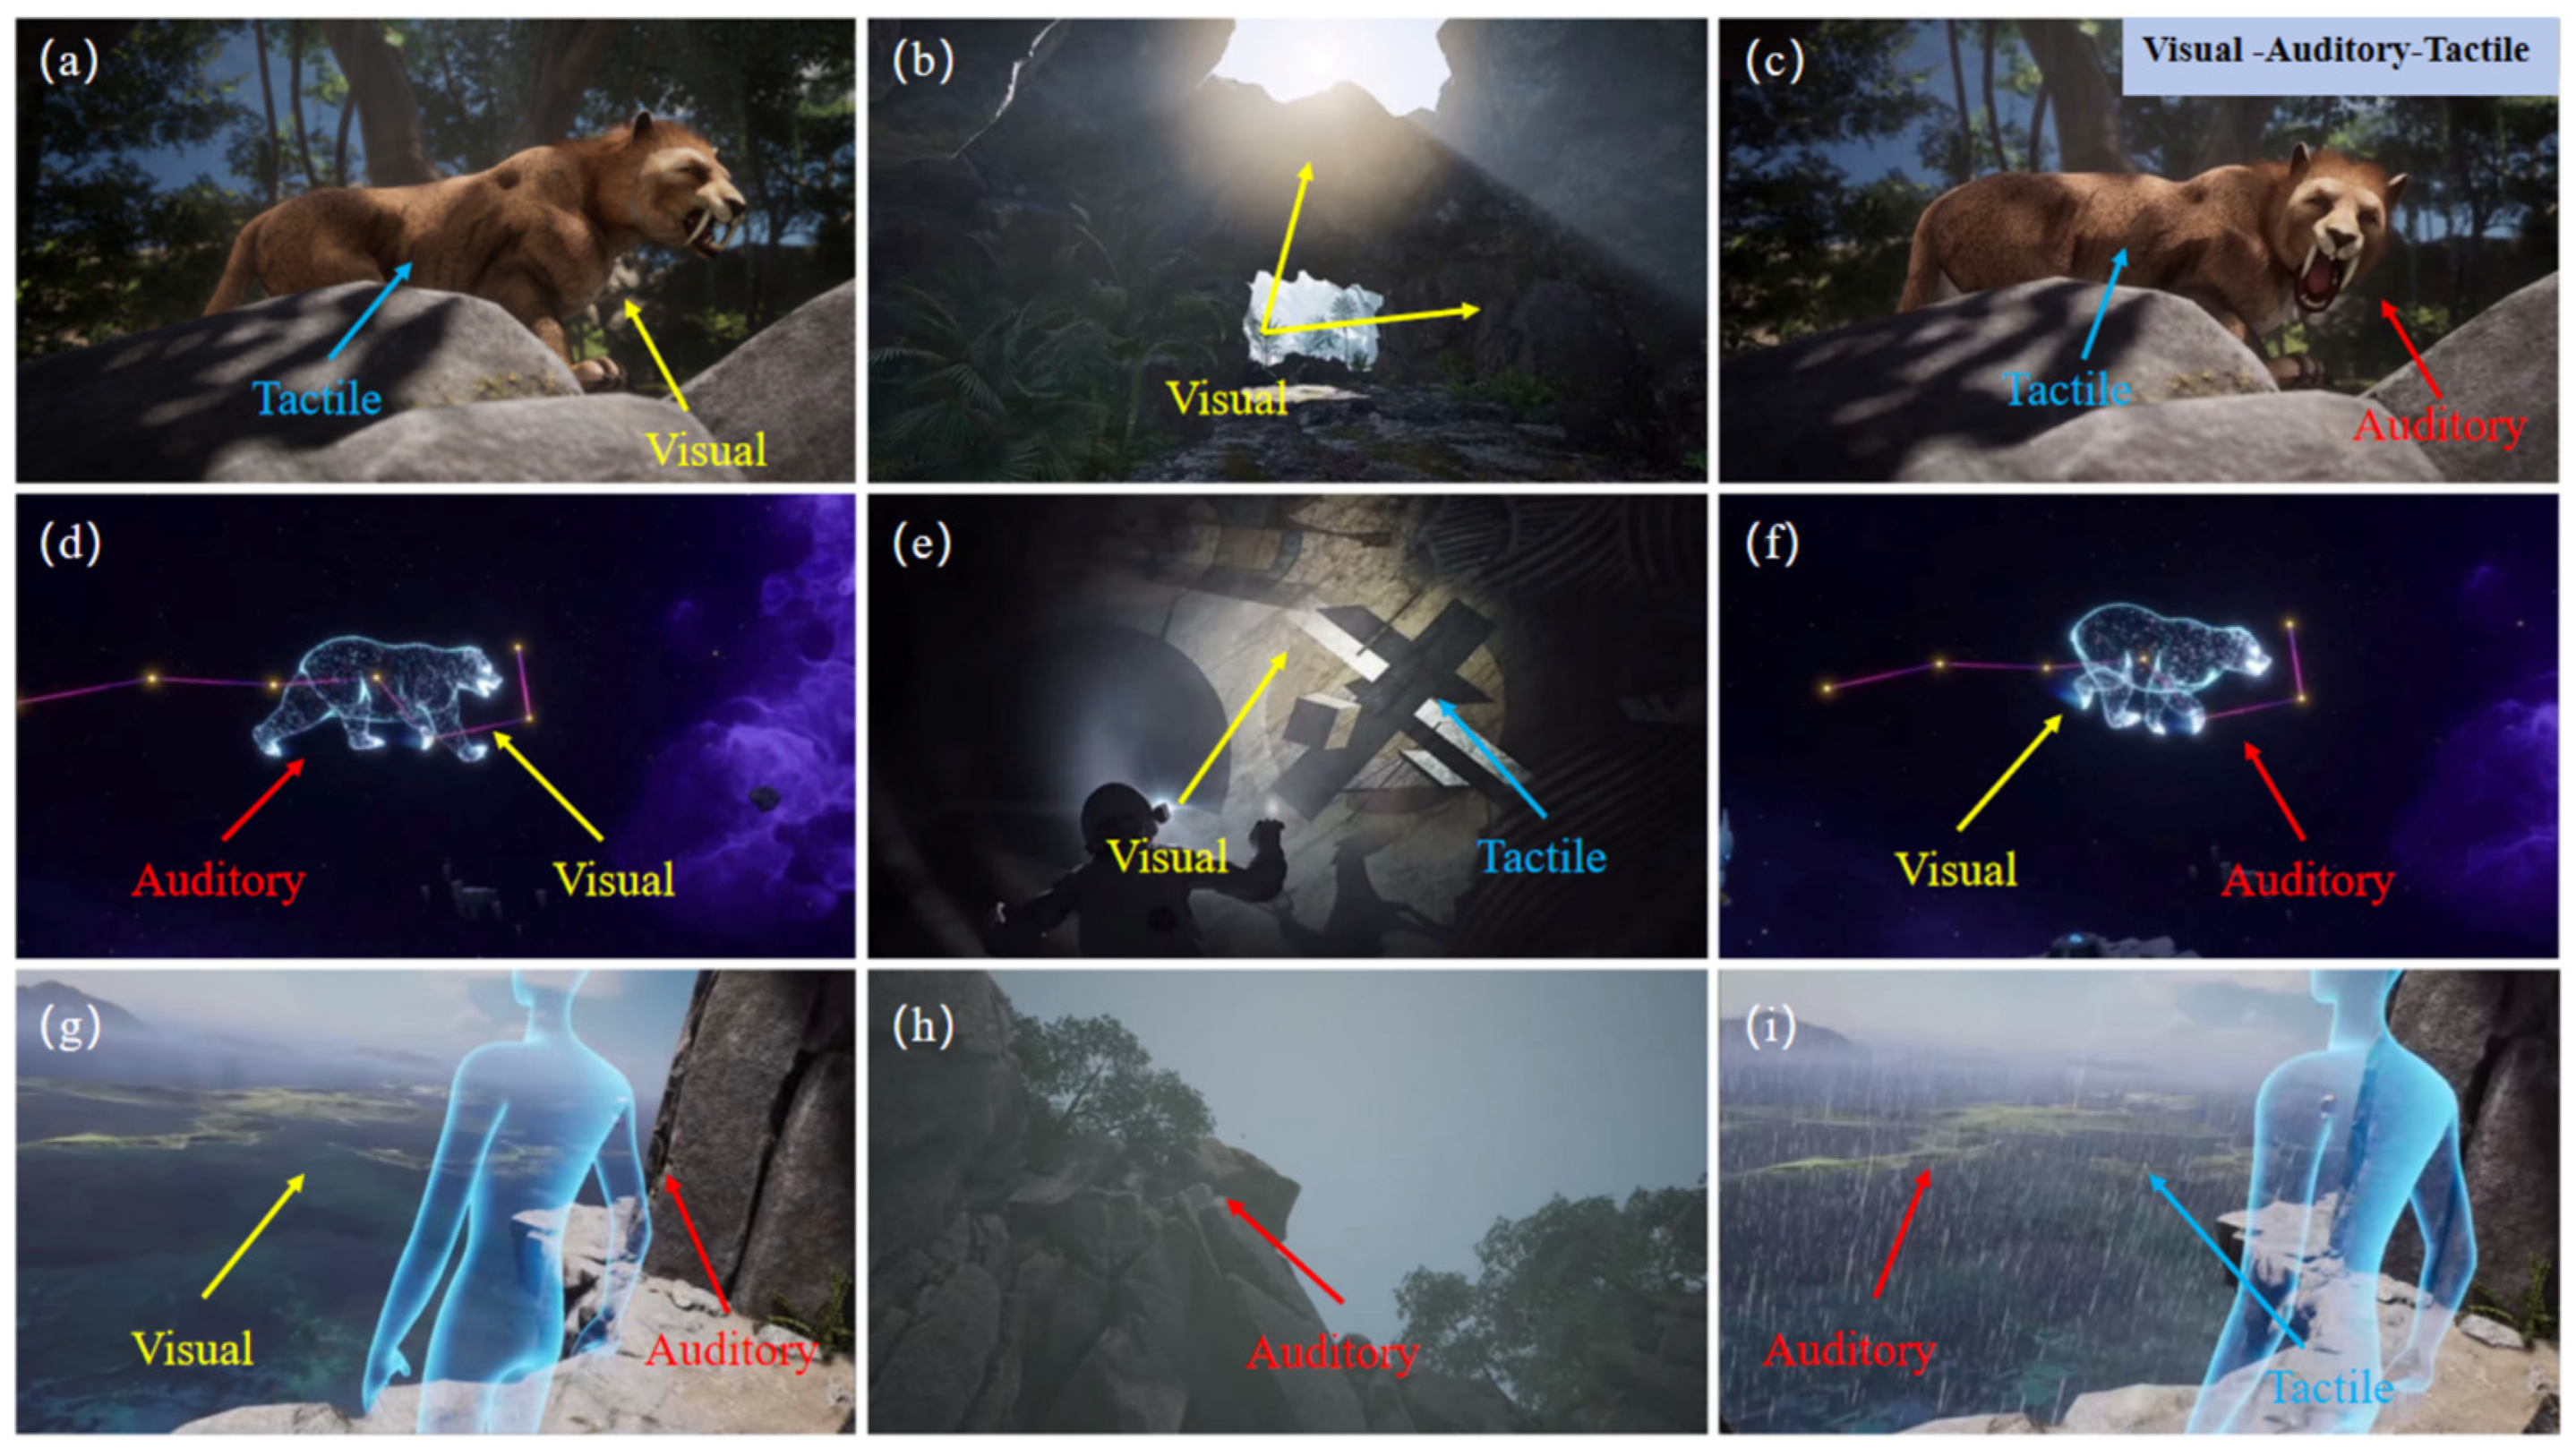
| Scenario 2 (Visual + Auditory + Tactile) | Visual, auditory, and tactile | Prehistoric animal encounter: participants see lifelike ancient beasts, hear growls, and touch the simulated texture of animal fur. | Visual: Realistic animal models Auditory: Environmental and creature sounds Tactile: Haptic feedback of fur |
| Scenario 3 (Visual + Auditory + Olfactory) | Visual, auditory, and olfactory | Ancient temple experience: participants see a restored temple scene, hear ambient temple sounds, and smell a faint sandalwood fragrance. | Visual: Cultural architectural visuals Auditory: Temple ambience Olfactory: Ambient incense scent |
| Items | CITC | Cronbach’s α Coefficient |
|---|---|---|
| 1. I gained new knowledge from my visit to the digital museum. | 0.413 | 0.869 |
| 2. This experience broadened my understanding. | 0.398 | |
| 3. It aroused my interest in exploring unfamiliar topics. | 0.447 | |
| 4. I found the digital museum visit to be highly engaging. | 0.404 | |
| 5. The exhibits in the digital museum demonstrated meticulous attention to detail. | 0.478 | |
| 6. I thoroughly enjoyed my time at the digital museum. | 0.429 | |
| 7. The digital museum visit was entertaining. | 0.466 | |
| 8. I was deeply engrossed in the digital museum experience. | 0.425 | |
| 9. The digital museum provided a delightful experience. | 0.436 | |
| 10. I felt as though I assumed a different identity during the visit. | 0.409 | |
| 11. I experienced a sense of being transported to another era or place. | 0.467 | |
| 12. I felt entirely disconnected from the real world. | 0.426 | |
| 13. The digital museum visit gave me a sense of spontaneous excitement. | 0.400 | |
| 14. I unexpectedly engaged in experiences I had never imagined before. | 0.511 | |
| 15. I encountered surprising and delightful moments while visiting. | 0.341 | |
| 16. The digital museum enabled interaction with local individuals. | 0.443 | |
| 17. Through the displays, I could immerse myself in the local culture. | 0.464 | |
| 18. I gained insight into the daily lives of local people. | 0.450 | |
| 19. The experience fostered connections that turned strangers into acquaintances. | 0.469 | |
| 20. I felt a strong sense of belonging to the location I was visiting. | 0.368 | |
| 21. I felt included in a unique travel-oriented community during the visit. | 0.476 | |
| 22. The experience felt customized to suit my preferences. | 0.483 | |
| 23. The digital museum was adapted to meet my specific interests. | 0.348 | |
| 24. The interaction made me feel personally valued as a visitor. | 0.436 |
| KMO and Bartlett’s Tests | ||
|---|---|---|
| KMO | 0.930 | |
| Bartlett’s sphericity test | Approximate chi-square test | 1310.195 |
| df | 276 | |
| p-value | 0.000 | |
| Linear Combination Coefficient Matrix | |||
|---|---|---|---|
| Component | |||
| F1 | F2 | F3 | |
| Immersion | |||
| I1. I gained new knowledge from my visit to the digital museum. | 0.200 | 0.112 | −0.373 |
| I2. This experience broadened my understanding. | 0.193 | 0.106 | 0.139 |
| I3. It aroused my interest in exploring unfamiliar topics. | 0.185 | −0.118 | −0.034 |
| I4. I found the digital museum visit to be highly engaging. | 0.212 | 0.094 | −0.047 |
| I5. The exhibits in the digital museum demonstrated meticulous attention to detail. | 0.218 | 0.228 | −0.039 |
| I6. I thoroughly enjoyed my time at the digital museum. | 0.208 | −0.169 | 0.170 |
| I7. The digital museum visit was entertaining. | 0.212 | −0.216 | −0.300 |
| I8. I was deeply engrossed in the digital museum experience. | 0.204 | −0.219 | 0.067 |
| I9. The digital museum provided a delightful experience. | 0.232 | 0.204 | −0.114 |
| I10. I felt as though I assumed a different identity during the visit. | 0.197 | 0.063 | 0.134 |
| I11. I experienced a sense of being transported to another era or place. | 0.203 | −0.269 | −0.042 |
| Culture | |||
| C1. I felt entirely disconnected from the real world. | 0.186 | −0.025 | 0.406 |
| C2. The digital museum visit gave me a sense of spontaneous excitement. | 0.185 | 0.209 | −0.197 |
| C3. I unexpectedly engaged in experiences I had never imagined before. | 0.225 | 0.147 | −0.192 |
| C4. I encountered surprising and delightful moments while visiting. | 0.178 | 0.411 | 0.258 |
| C5. The digital museum enabled interaction with local individuals. | 0.193 | 0.274 | 0.022 |
| C6. Through the displays, I could immerse myself in the local culture. | 0.222 | −0.225 | −0.193 |
| C7. I gained insight into the daily lives of local people. | 0.204 | −0.175 | 0.126 |
| C8. The experience fostered connections that turned strangers into acquaintances. | 0.225 | 0.079 | −0.000 |
| C9. I felt a strong sense of belonging to the location I was visiting. | 0.190 | 0.104 | 0.075 |
| C10. I felt included in a unique travel-oriented community during the visit. | 0.219 | 0.031 | −0.329 |
| Personalization | |||
| P1. The experience felt customized to suit my preferences. | 0.217 | −0.299 | 0.100 |
| P2. The digital museum was adapted to meet my specific interests. | 0.177 | −0.397 | 0.081 |
| P3. The interaction made me feel personally valued as a visitor. | 0.203 | 0.066 | 0.436 |
| χ2 | df | p | χ2/df | GFI | RMSEA | RMR | CFI | NFI | NNFI |
|---|---|---|---|---|---|---|---|---|---|
| 249.059 | 249 | 0.487 | 1.000 | 0.918 | 0.001 | 0.080 | 0.996 | 0.142 | 0.995 |
| TLI | AGFI | IFI | PGFI | PNFI | PCFI | SRMR | RMSEA 90% CI | ||
| 0.995 | 0.901 | 0.999 | 0.762 | 0.128 | 0.898 | 0.059 | 0.001~0.027 |
| Factors | Immersion | Culture | Personalization |
|---|---|---|---|
| Immersion | 0.220 | ||
| Culture | 0.068 | 0.323 | |
| Personalization | 0.117 | 0.165 | 0.285 |
| Variables | M | SD |
|---|---|---|
| Cultural understanding | 3.718 | 1.321 |
| CU1 | 3.708 | 1.311 |
| CU2 | 3.705 | 1.367 |
| CU3 | 3.742 | 1.287 |
| Memory retention | 3.716 | 1.262 |
| MR1 | 3.760 | 1.266 |
| MR2 | 3.674 | 1.266 |
| MR3 | 3.714 | 1.255 |
| Pleasure | 3.770 | 1.274 |
| PL1 | 3.726 | 1.313 |
| PL2 | 3.822 | 1.302 |
| PL3 | 3.766 | 1.245 |
| PL4 | 3.766 | 1.233 |
| Arousal | 3.774 | 1.285 |
| AR1 | 3.785 | 1.278 |
| AR2 | 3.763 | 1.292 |
| Dominance | 3.744 | 1.274 |
| DO1 | 3.766 | 1.252 |
| DO2 | 3.782 | 1.252 |
| DO3 | 3.748 | 1.307 |
| DO4 | 3.680 | 1.280 |
| Immersion | 4.825 | 2.455 |
| Culture | 2.792 | 1.076 |
| Personalization | 3.506 | 1.067 |
| Items | CITC | The Deleted Alpha Coefficient | Cronbach’s Alpha |
|---|---|---|---|
| Information perception | 0.600 | ||
| CU1 | 0.366 | 0.542 | |
| CU2 | 0.372 | 0.539 | |
| CU3 | 0.315 | 0.564 | |
| MR1 | 0.324 | 0.560 | |
| MR2 | 0.283 | 0.576 | |
| MR3 | 0.341 | 0.553 |
| Items | CITC | The Deleted Alpha Coefficient | Cronbach’s Alpha |
|---|---|---|---|
| Emotional response | 0.701 | ||
| PL1 | 0.258 | 0.696 | |
| PL2 | 0.393 | 0.672 | |
| PL3 | 0.329 | 0.683 | |
| PL4 | 0.346 | 0.680 | |
| AR1 | 0.427 | 0.666 | |
| AR2 | 0.319 | 0.685 | |
| DO1 | 0.391 | 0.673 | |
| DO2 | 0.421 | 0.667 | |
| DO3 | 0.340 | 0.682 | |
| DO4 | 0.372 | 0.676 |
| X | → | Y | SE | CR | p | Standardized Estimates |
|---|---|---|---|---|---|---|
| Information perception | → | Cultural understanding | - | - | - | 0.961 |
| Information perception | → | Memory retention | 0.158 | 6.040 | 0.000 | 1.000 |
| Emotional response | → | Pleasure | - | - | - | 1.000 |
| Emotional response | → | Arousal | 0.222 | 5.502 | 0.000 | 0.887 |
| Emotional response | → | Dominance | 0.212 | 5.429 | 0.000 | 0.902 |
| Cultural understanding | → | CU1 | - | - | - | 0.474 |
| Cultural understanding | → | CU2 | 0.169 | 6.242 | 0.000 | 0.480 |
| Cultural understanding | → | CU3 | 0.156 | 6.040 | 0.000 | 0.456 |
| Memory retention | → | MR1 | - | - | - | 0.450 |
| Memory retention | → | MR2 | 0.163 | 5.775 | 0.000 | 0.423 |
| Memory retention | → | MR3 | 0.165 | 5.985 | 0.000 | 0.447 |
| Pleasure | → | PL1 | - | - | - | 0.368 |
| Pleasure | → | PL2 | 0.231 | 5.603 | 0.000 | 0.481 |
| Pleasure | → | PL3 | 0.208 | 5.308 | 0.000 | 0.429 |
| Pleasure | → | PL4 | 0.208 | 5.357 | 0.000 | 0.437 |
| Arousal | → | AR1 | - | - | - | 0.521 |
| Arousal | → | AR2 | 0.142 | 5.657 | 0.000 | 0.414 |
| Dominance | → | DO1 | - | - | - | 0.493 |
| Dominance | → | DO2 | 0.163 | 6.911 | 0.000 | 0.554 |
| Dominance | → | DO3 | 0.156 | 6.004 | 0.000 | 0.444 |
| Dominance | → | DO4 | 0.155 | 6.115 | 0.000 | 0.456 |
| Information perception | → | Immersion | - | - | - | 0.617 |
| Information perception | → | Culture | - | - | - | −0.031 |
| Information perception | → | Personalization | - | - | - | 0.004 |
| Emotional response | → | Immersion | - | - | - | −0.620 |
| Emotional response | → | Culture | - | - | - | −0.568 |
| Emotional response | → | Personalization | - | - | - | 0.571 |
| χ2 | df | p | χ2/df | GFI | RMSEA | RMR | CFI | NFI | NNFI |
|---|---|---|---|---|---|---|---|---|---|
| 173.033 | 141 | 0.034 | 1.227 | 0.947 | 0.026 | 0.069 | 0.968 | 0.852 | 0.961 |
| TLI | AGFI | IFI | PGFI | PNFI | PCFI | SRMR | RMSEA 90% CI | ||
| 0.961 | 0.929 | 0.969 | 0.703 | 0.703 | 0.798 | 0.043 | 0.008~0.039 |
| Source | Difference | Sum of Squares | Freedom | Mean Square | F | p |
|---|---|---|---|---|---|---|
| Overall experience | Group | 13.061 | 2 | 6.531 | 4.324 | 0.014 |
| Intragroup | 486.336 | 322 | 1.510 | |||
| Total | 499.397 | 324 |
| (I) Item | (J) Item | (I) M | (J) M | Difference (I–J) | p | |
|---|---|---|---|---|---|---|
| Overall experience | Scenario 1 | Scenario 2 | 4.000 | 4.000 | 0.000 | 0.700 |
| Scenario 1 | Scenario 3 | 4.000 | 4.000 | 0.000 | 0.017 * | |
| Scenario 2 | Scenario 3 | 4.000 | 4.000 | 0.000 | 0.045 * |
Disclaimer/Publisher’s Note: The statements, opinions and data contained in all publications are solely those of the individual author(s) and contributor(s) and not of MDPI and/or the editor(s). MDPI and/or the editor(s) disclaim responsibility for any injury to people or property resulting from any ideas, methods, instructions or products referred to in the content. |
© 2025 by the authors. Licensee MDPI, Basel, Switzerland. This article is an open access article distributed under the terms and conditions of the Creative Commons Attribution (CC BY) license (https://creativecommons.org/licenses/by/4.0/).
Share and Cite
Zhang, W.; Du, N. Multisensory Digital Heritage Spaces as Smart Environments in Sustainable Architectural Design. Buildings 2025, 15, 2181. https://doi.org/10.3390/buildings15132181
Zhang W, Du N. Multisensory Digital Heritage Spaces as Smart Environments in Sustainable Architectural Design. Buildings. 2025; 15(13):2181. https://doi.org/10.3390/buildings15132181
Chicago/Turabian StyleZhang, Weidi, and Ningxin Du. 2025. "Multisensory Digital Heritage Spaces as Smart Environments in Sustainable Architectural Design" Buildings 15, no. 13: 2181. https://doi.org/10.3390/buildings15132181
APA StyleZhang, W., & Du, N. (2025). Multisensory Digital Heritage Spaces as Smart Environments in Sustainable Architectural Design. Buildings, 15(13), 2181. https://doi.org/10.3390/buildings15132181