_Su.png)
Comparative Study on Hyperparameter Tuning for Predicting Concrete Compressive Strength


Abstract
1. Introduction
2. Methodology
2.1. Data Preprocessing
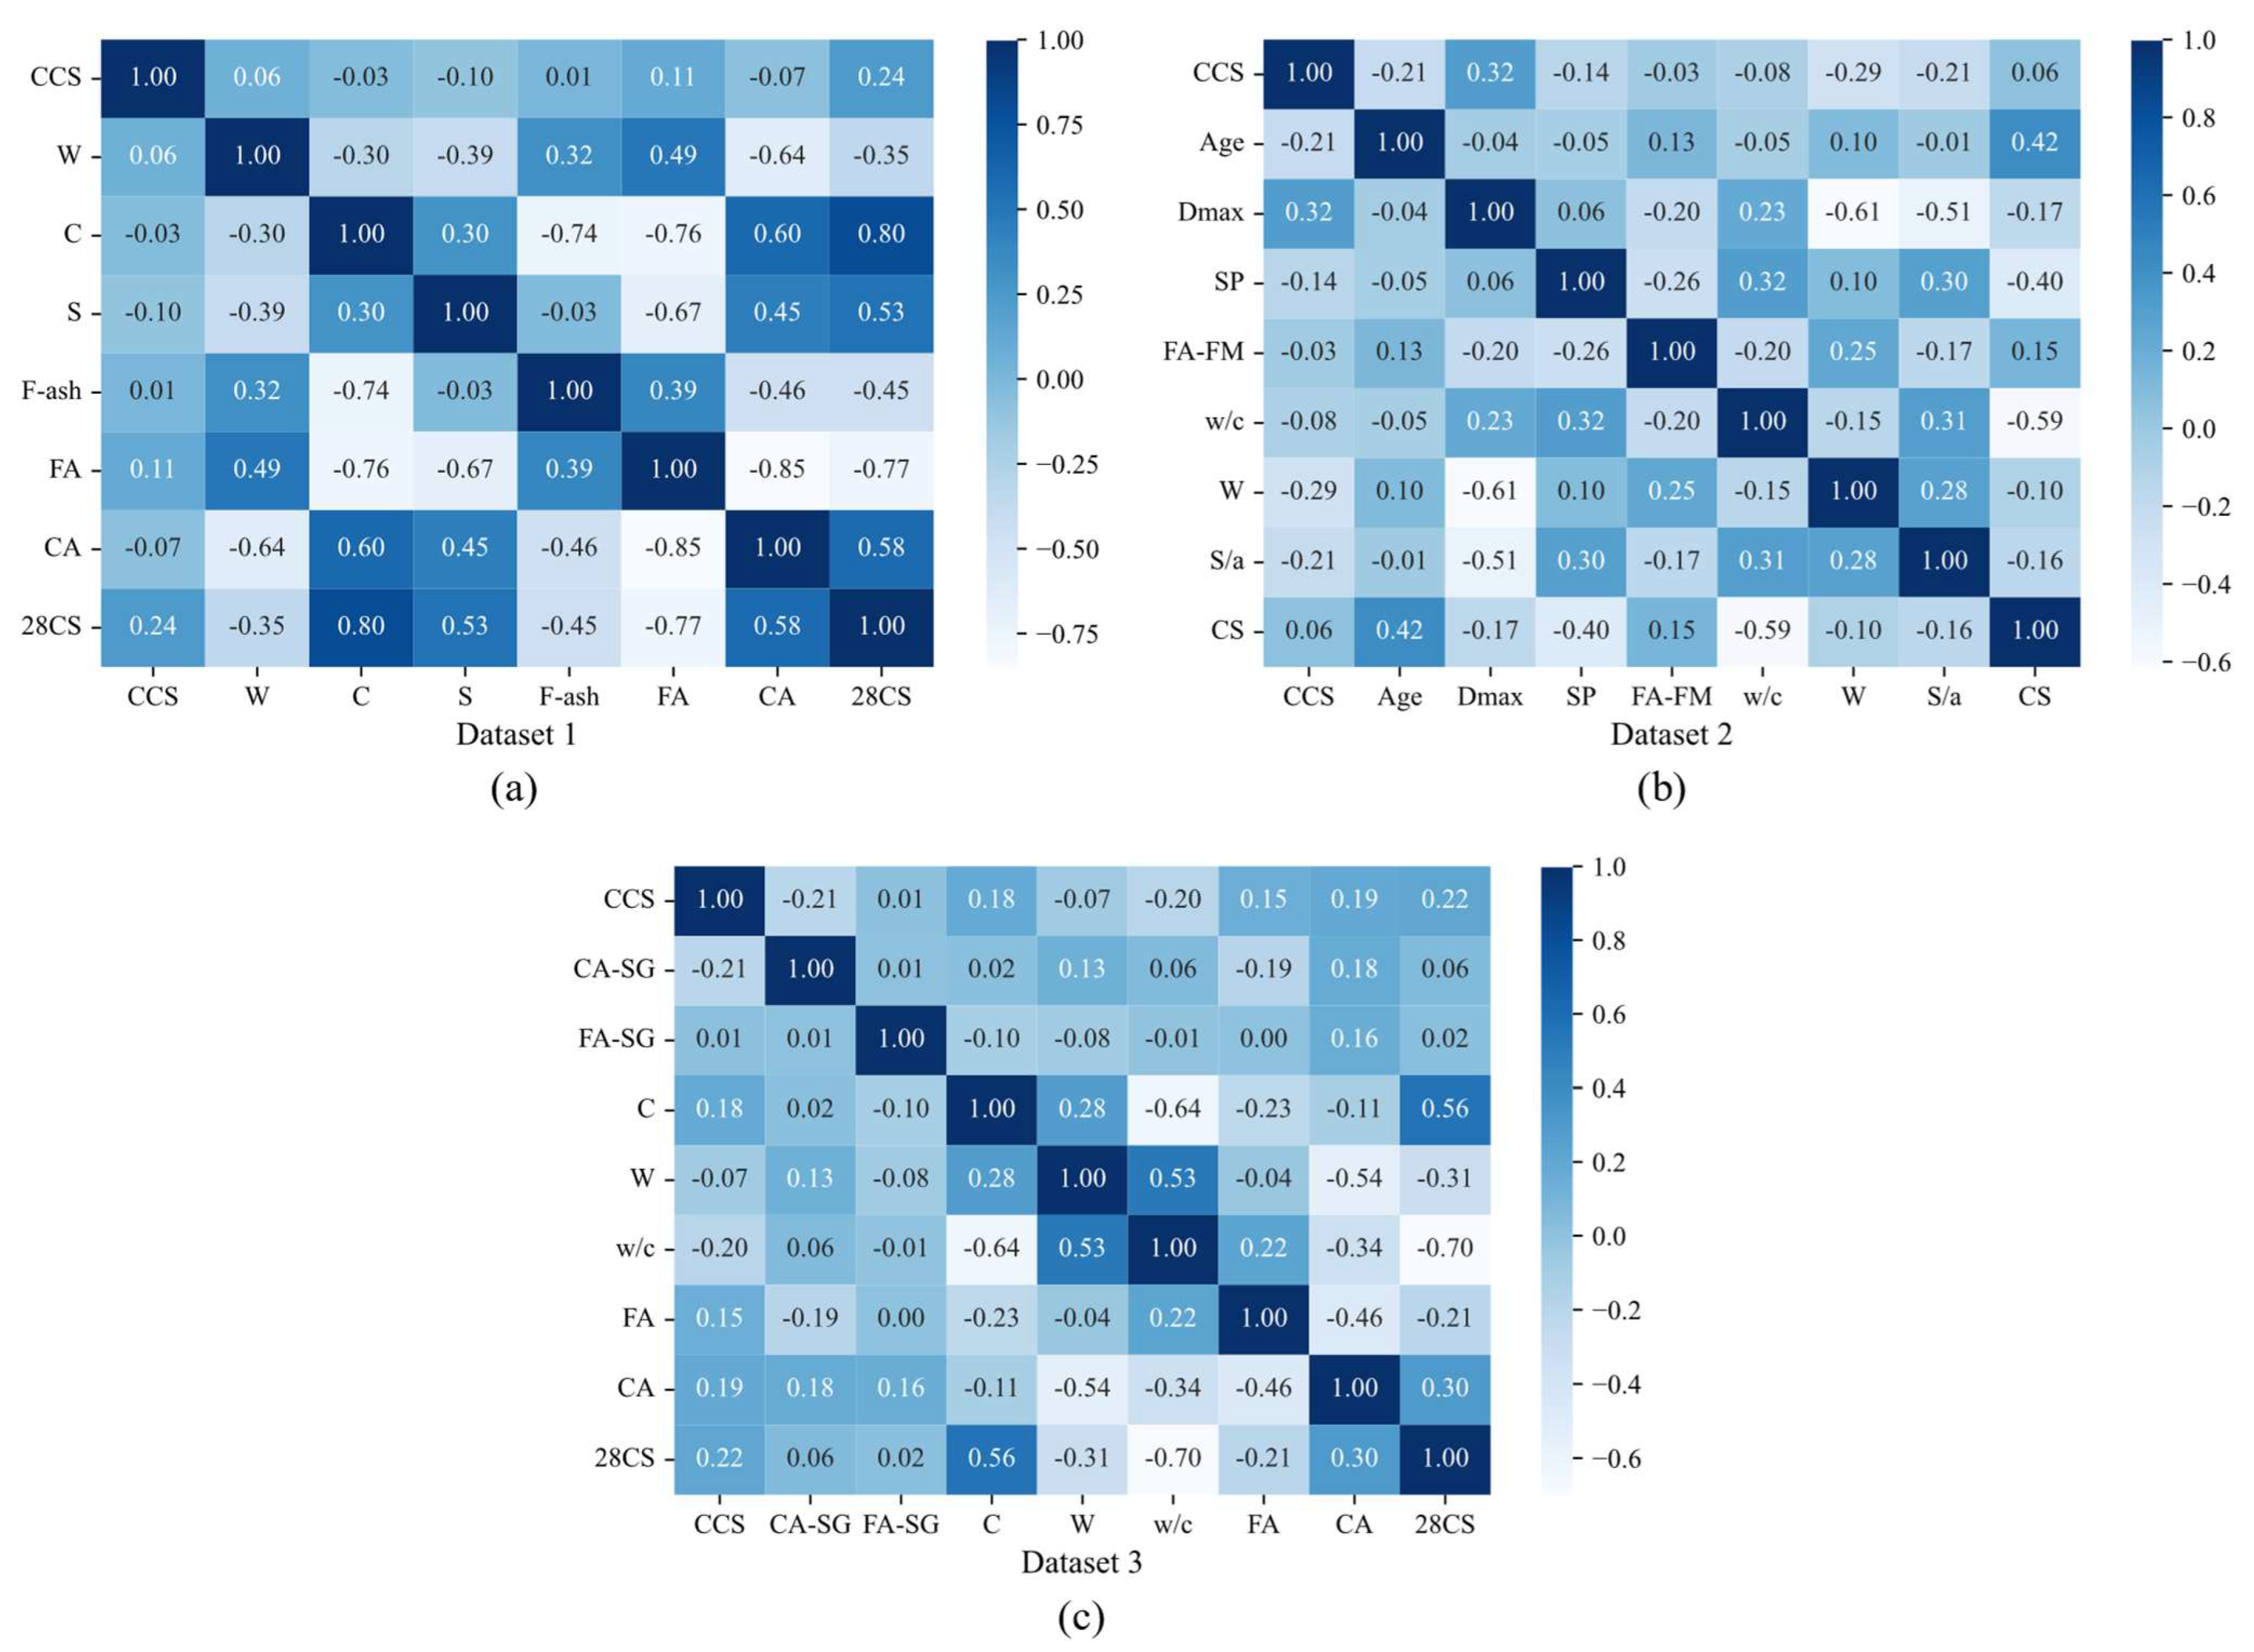
- Dataset 1 (DS1): This dataset was sourced from the study by Zheng et al. [33]. To reduce dimensionality, 8 out of the 16 original input variables were selected: cement strength (CCS), water (W), cement (C), slag (S), fly ash (F-ash), coarse aggregate (CA), fine aggregate (FA). The output variable is the 28-day compressive strength of concrete (28CS).
- Dataset 2 (DS2): This dataset was obtained from the study by Zhao et al. [34]. Variables not within the scope of this study (e.g., slump, tensile strength of cement) and data points without recorded compressive strength were excluded from the original dataset. The input variables are CCS, curing age (Age), maximum coarse aggregate size (Dmax), stone powder (SP), fine aggregate fineness modulus (FA-FM), water-cement ratio (w/c), W, and sand-aggregate ratio (S/a). The output variable is the compressive strength of concrete (CS).
- Dataset 3 (DS3): This dataset was compiled by the authors from various studies. The input variables include CCS, coarse aggregate-specific gravity (CA-SG), fine aggregate-specific gravity (FA-SG), C, W, w/c, CA, FA. The output variable is 28CS. To eliminate the size effect of the concrete specimen, compressive strengths for Ø100 × 200 mm and Ø150 × 300 mm cylindrical specimens, as well as a 100 mm cube specimen, were converted to equivalent compressive strength for a 150 mm cube specimen [35].
2.2. Model Training and Evaluation
2.3. SHapley Additive exPlanations
3. Results
3.1. Prediction Performance
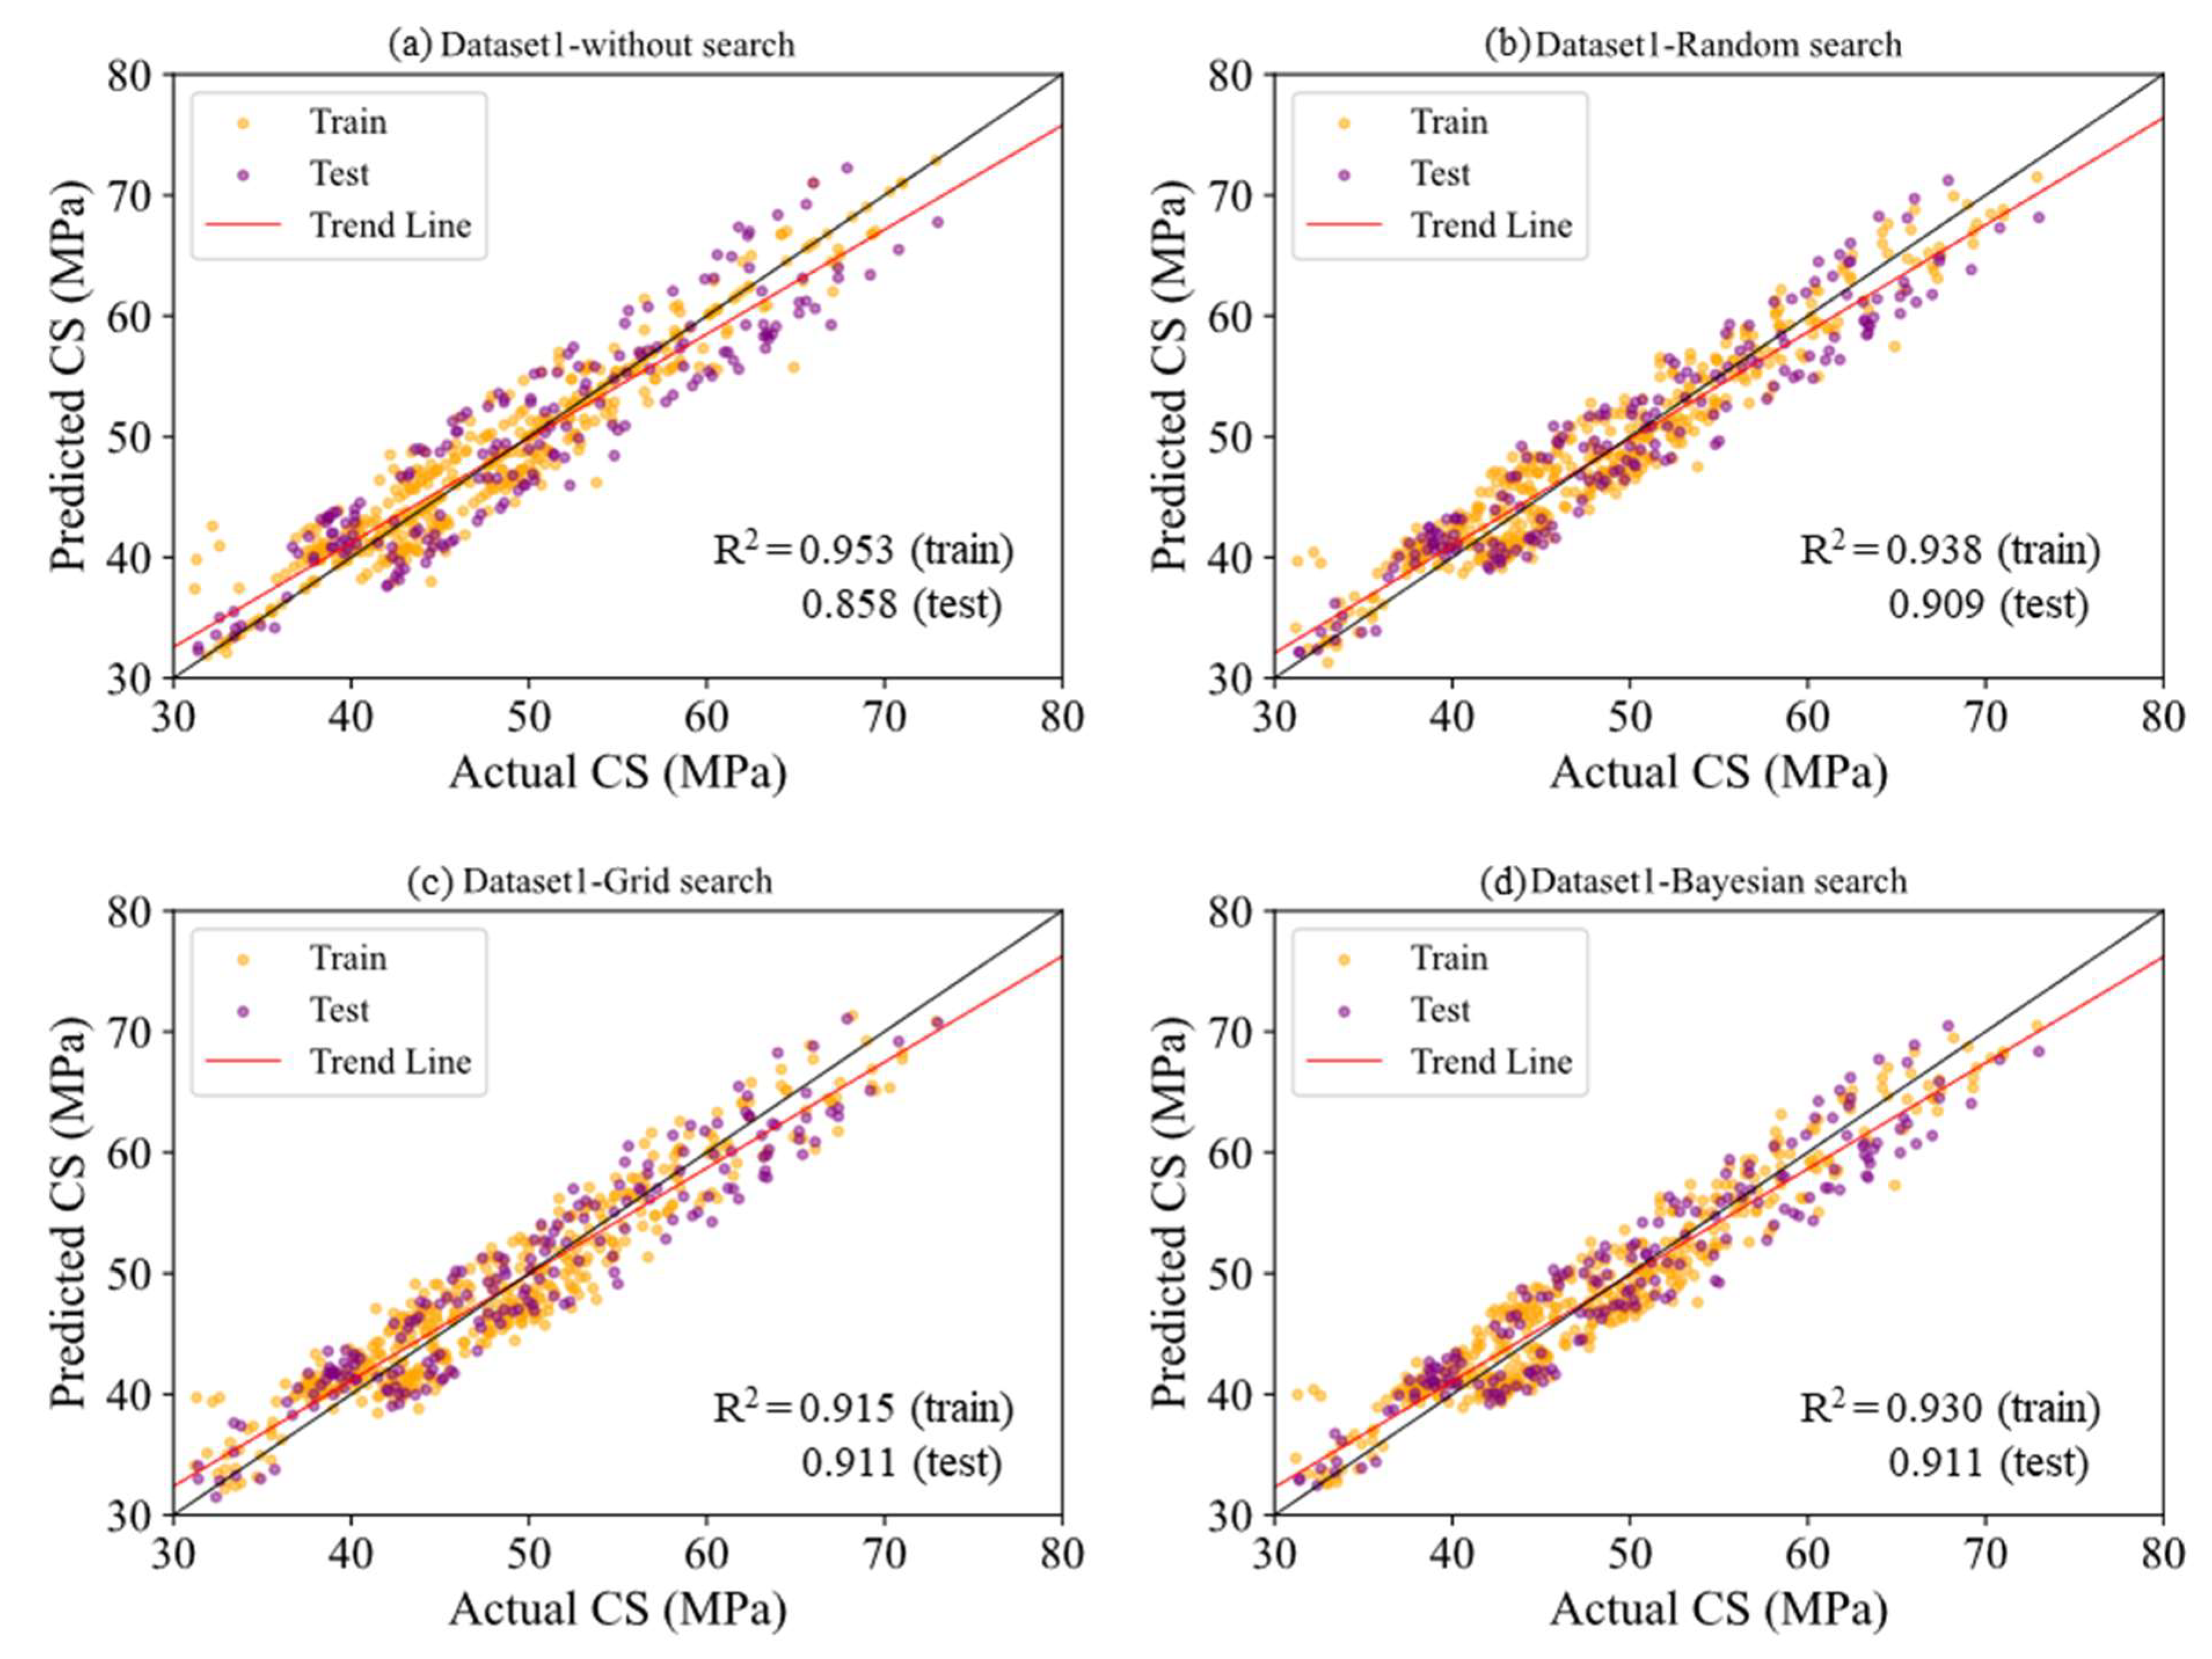
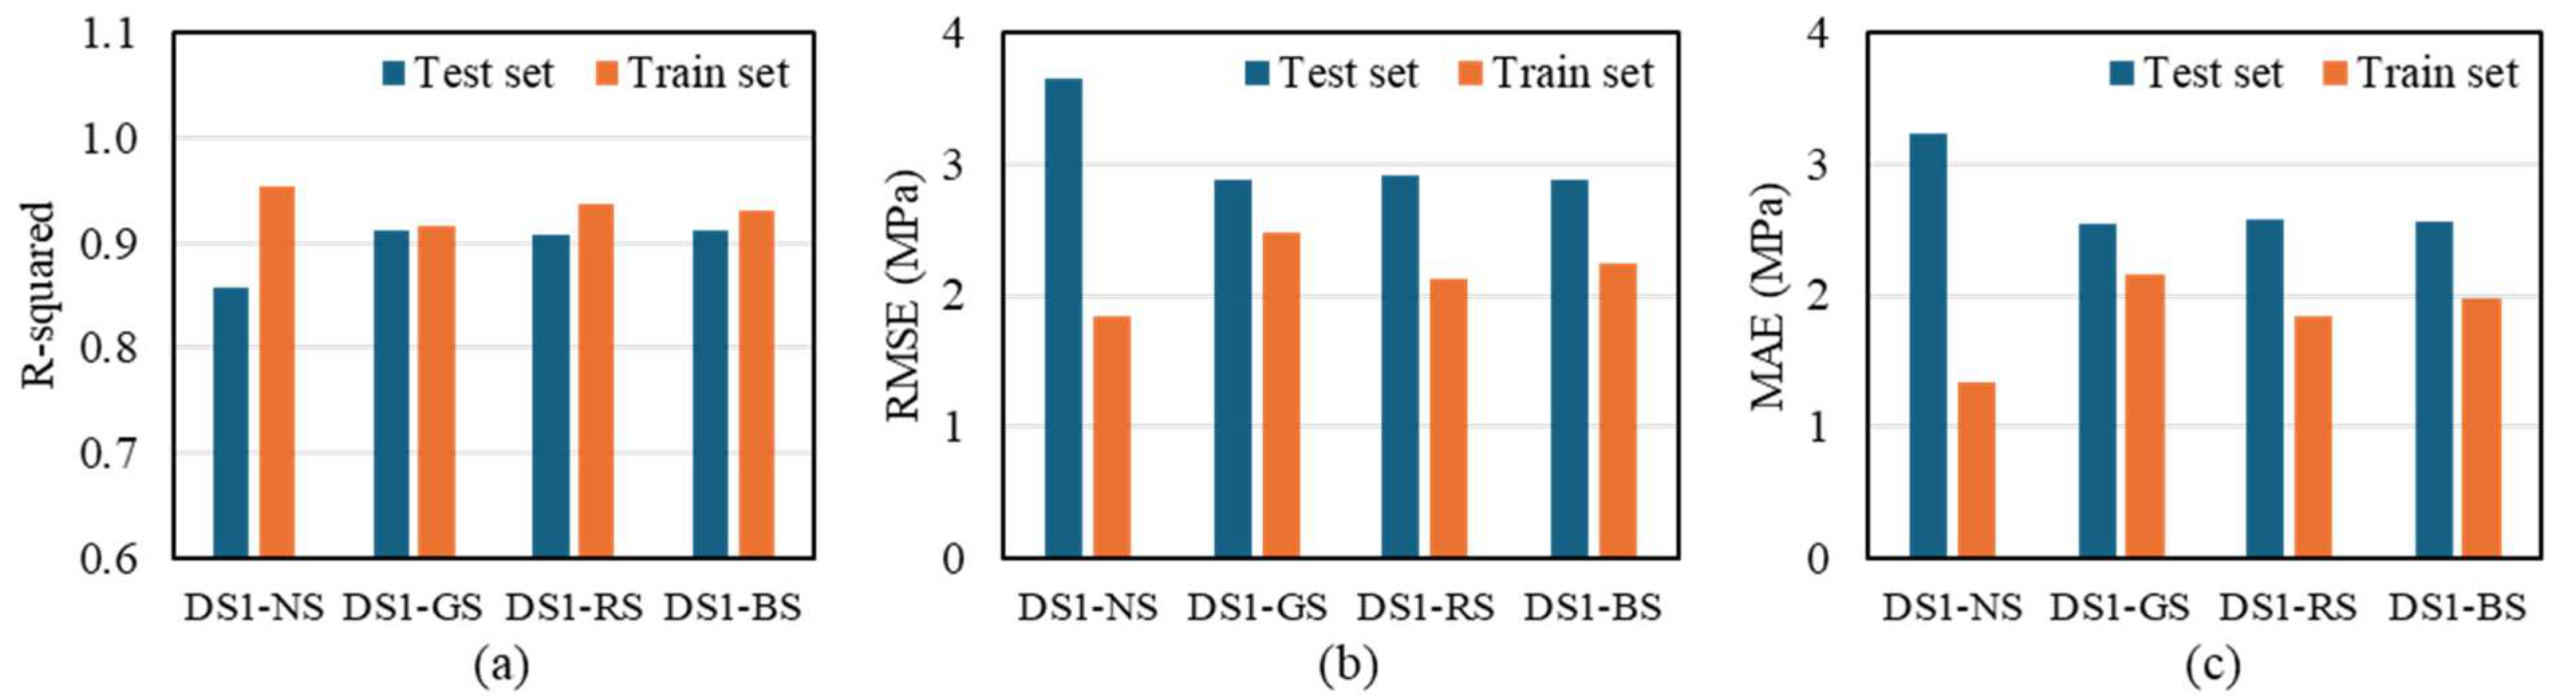
3.1.1. Dataset 1
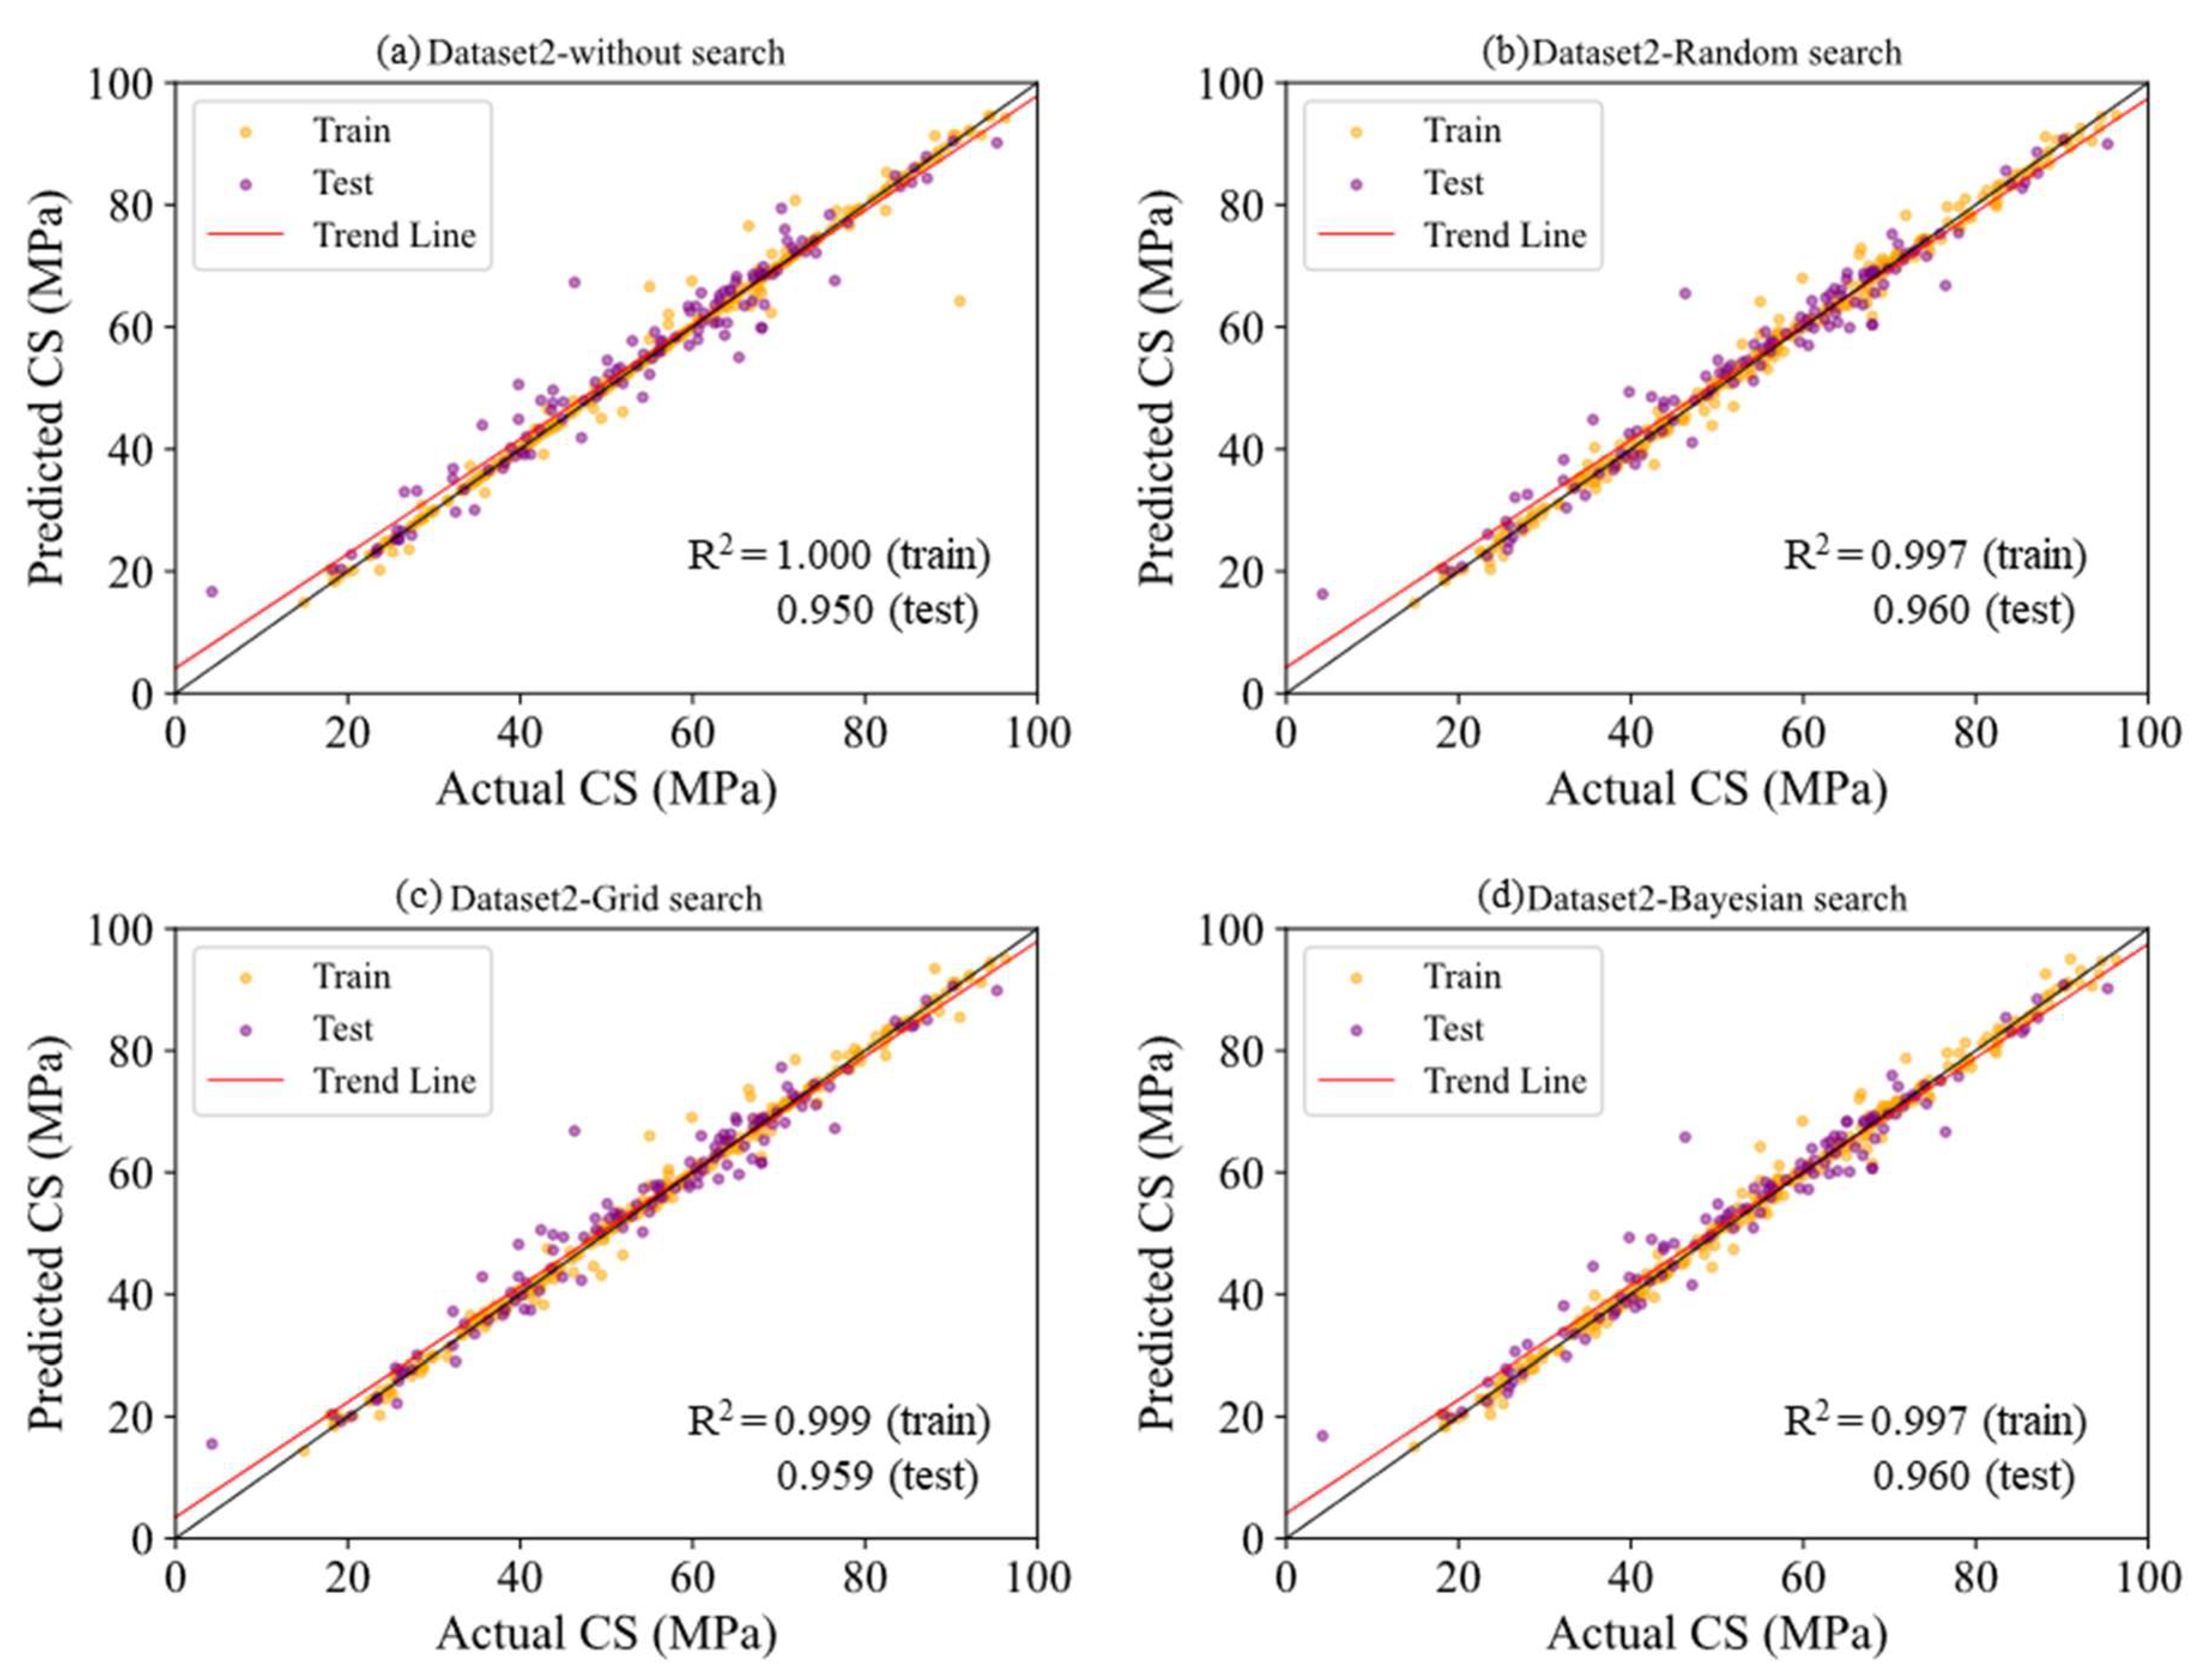
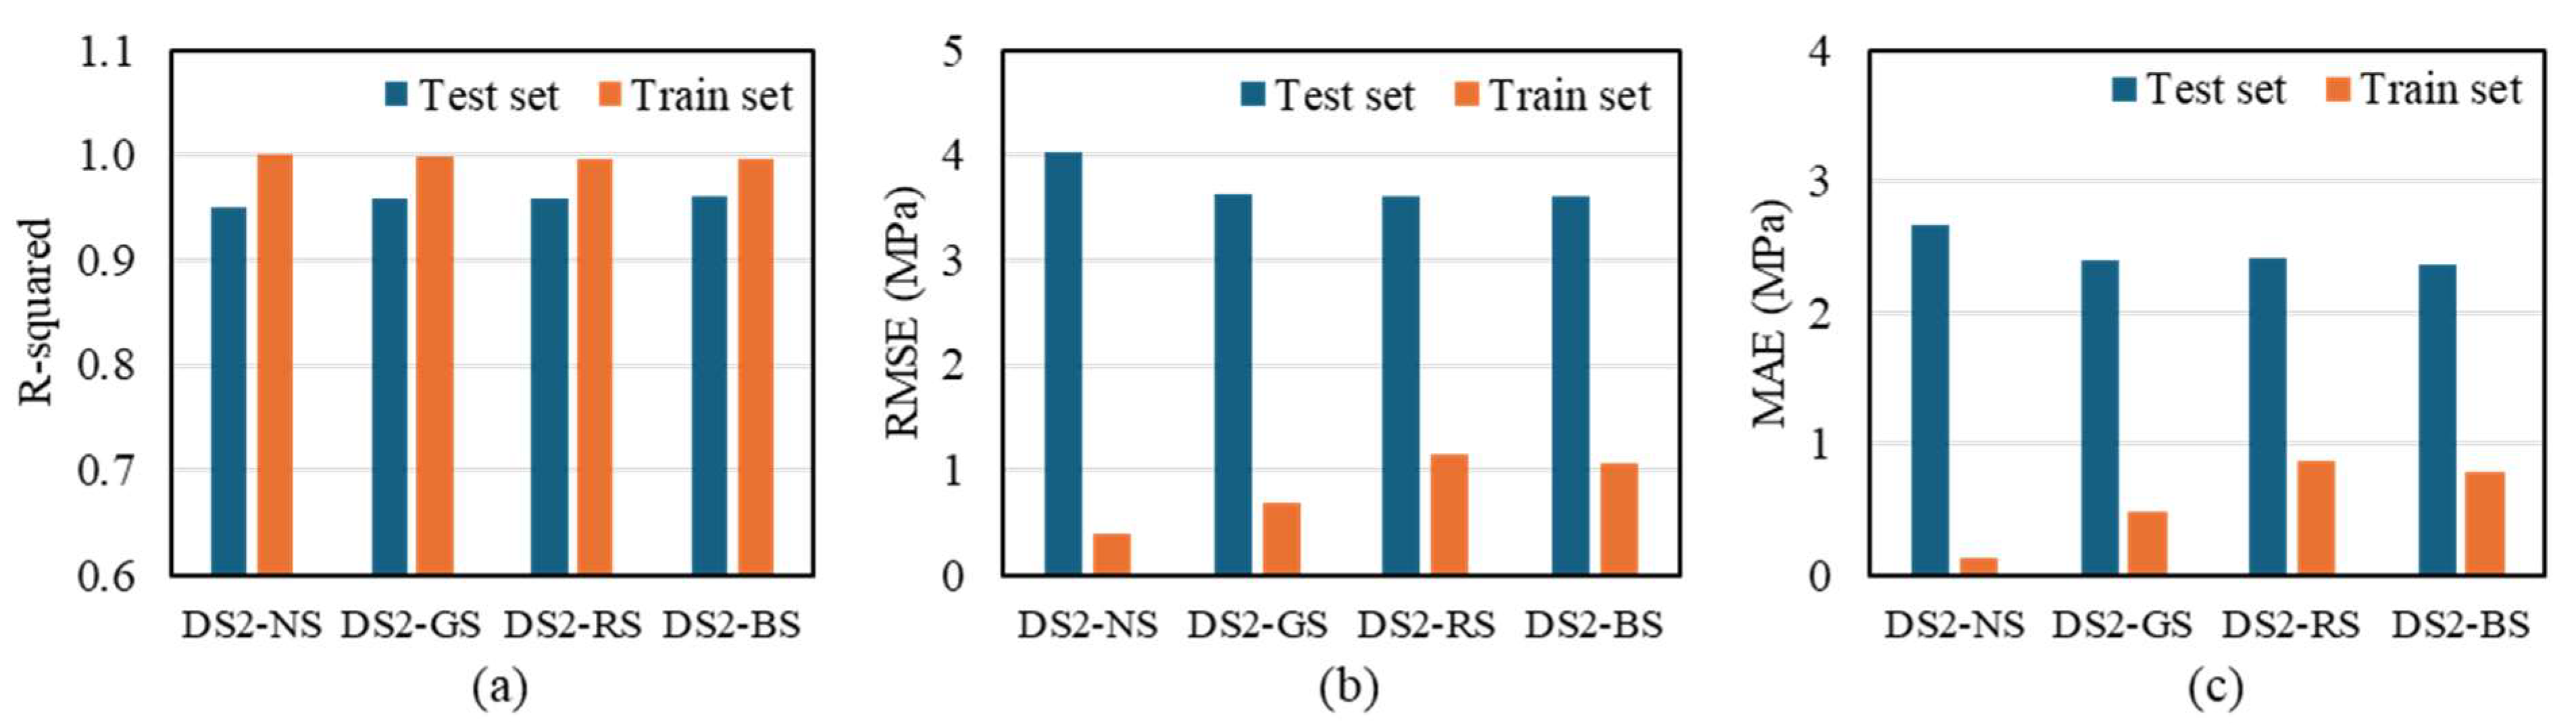
3.1.2. Dataset 2
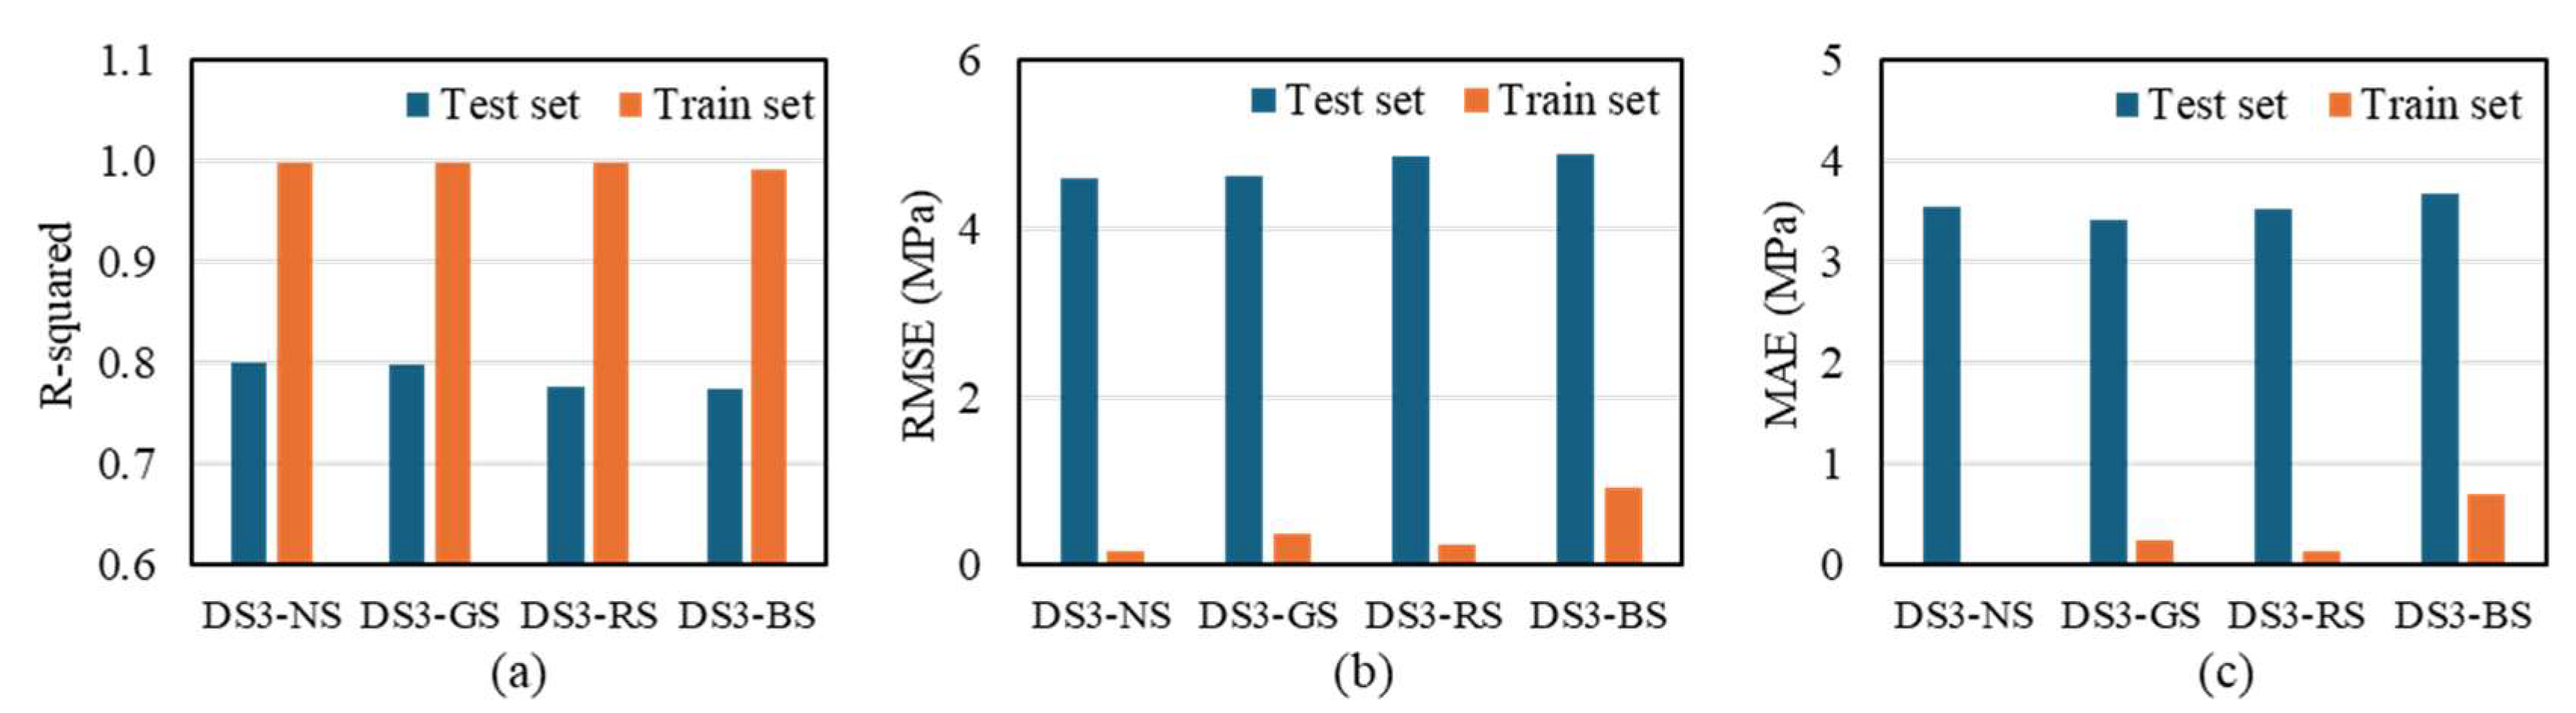
3.1.3. Dataset 3
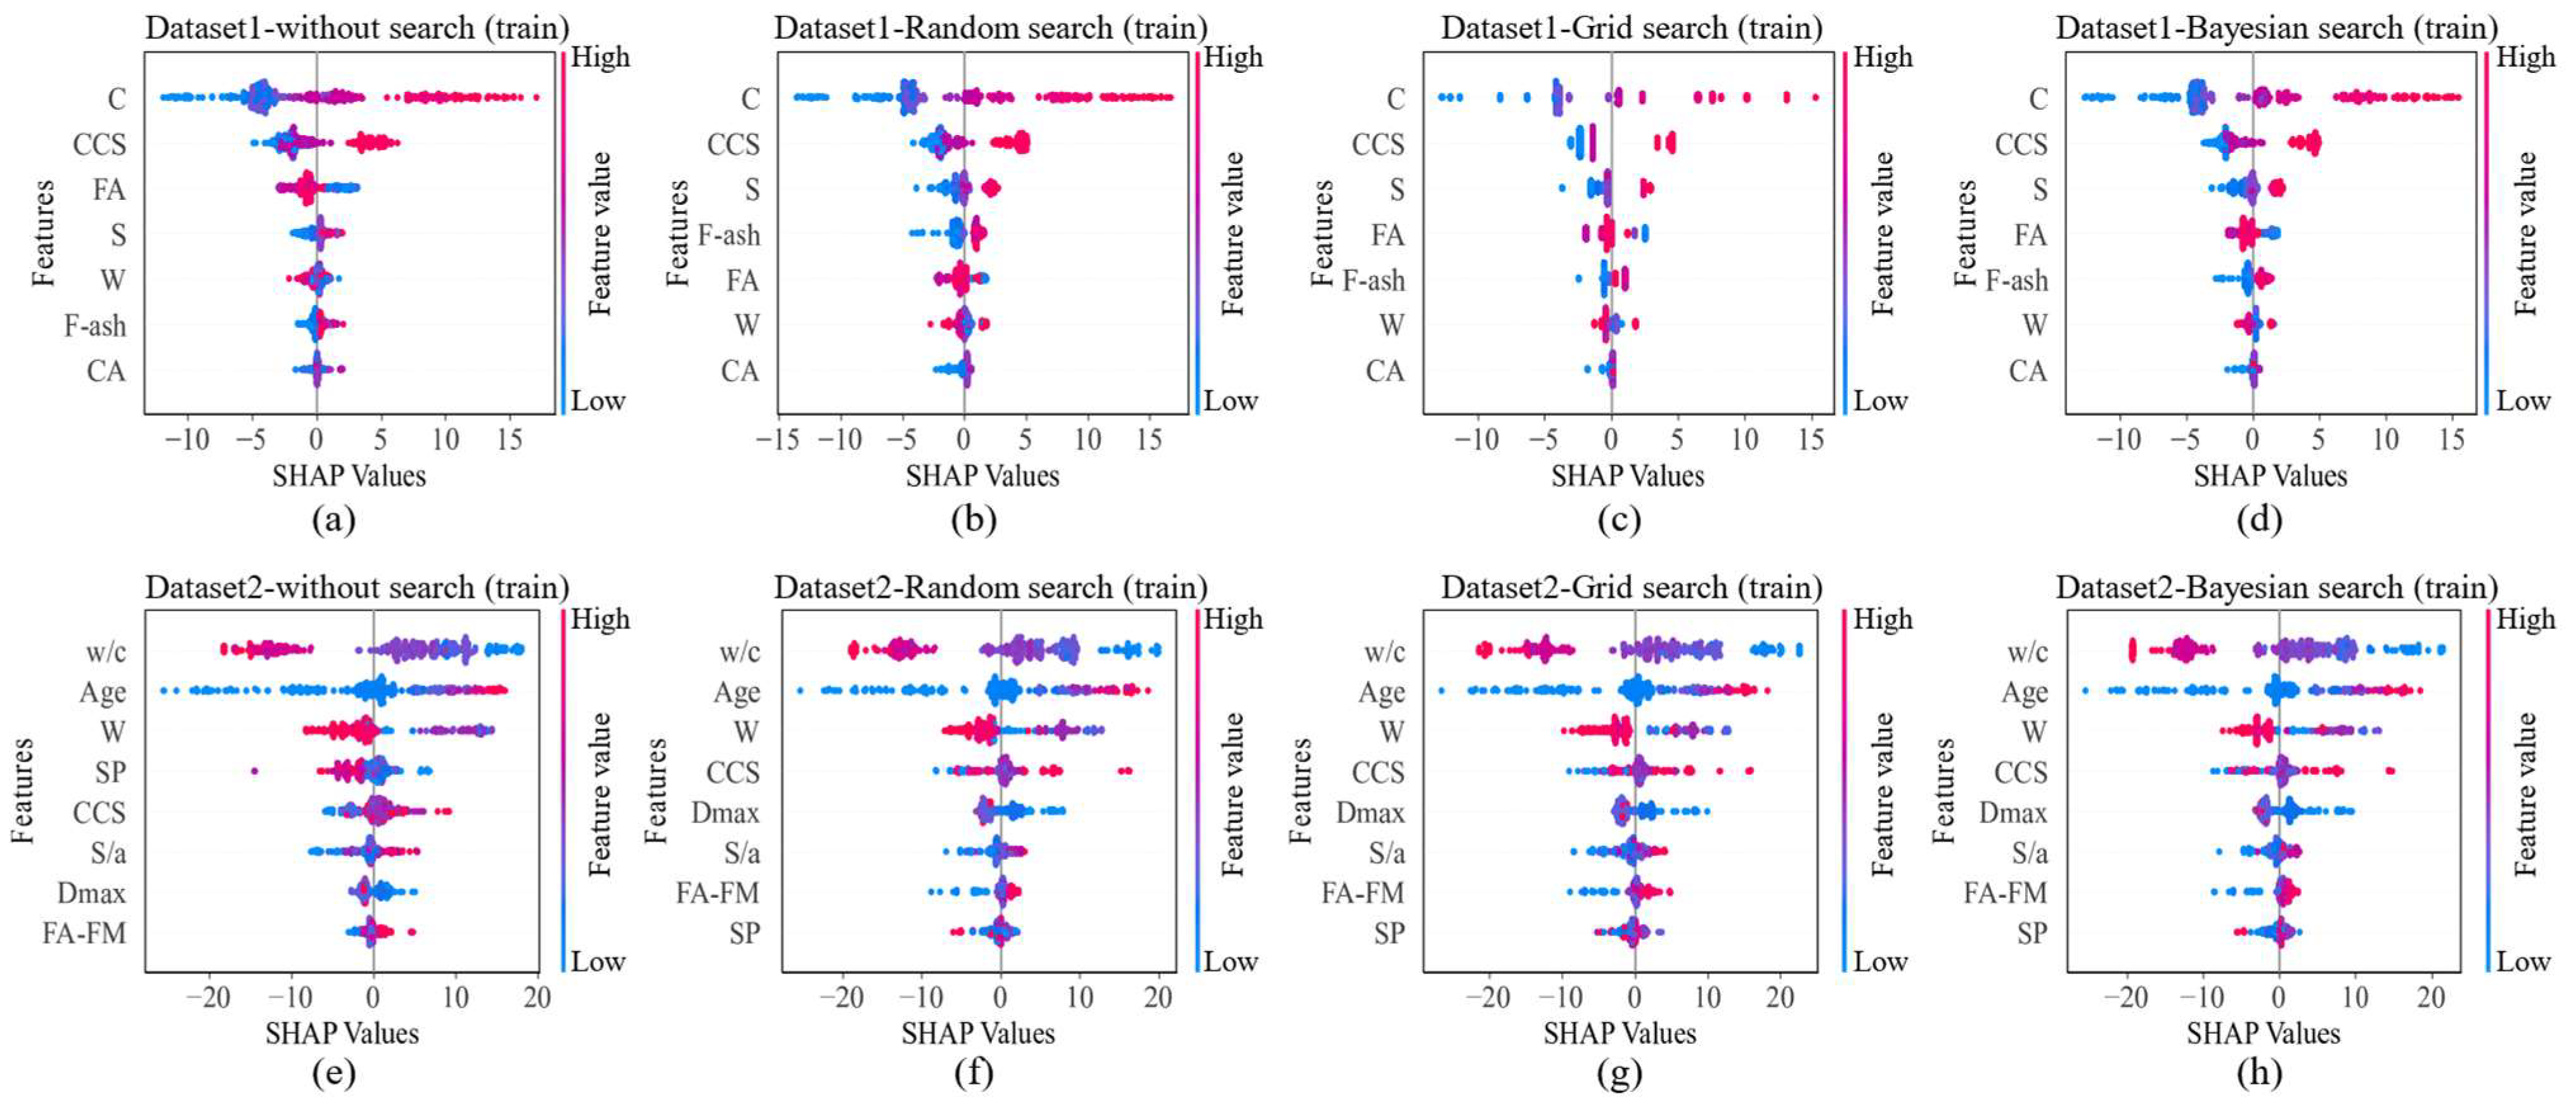
3.2. Post-Hoc Analysis
3.3. Comparison with Other Studies
4. Summary and Remarks
- In Dataset 1, the application of the search algorithm resulted in a significant improvement in the prediction accuracy of the ML model. The R2 value increased while both RMSE and MAE decreased, indicating an overall enhancement in performance. In addition, models incorporating the search algorithm demonstrated a reduced performance gap between the training and test sets, suggesting a lower risk of overfitting.
- In Dataset 2, although there was no significant change in the R2 metric, improvements in RMSE and MAE indicated a slight enhancement in the prediction performance. This suggests that the search algorithm contributed to reducing prediction errors.
- In Dataset 3, the application of the search algorithm resulted in neither significant improvements in prediction accuracy nor enhancements in overall performance. ML models based on this dataset exhibited a potential risk of overfitting and demonstrated a tendency toward lower prediction stability.
- SHAP provided valuable insights into feature importance and produced results that were generally consistent with empirical knowledge. However, it fell short in explaining the performance degradation observed in certain datasets. This limitation may stem from the SHAP approach of evaluating features independently, which does not capture complex feature interactions or multicollinearity. In addition, the potential presence of noise data and high-dimensional variables could obscure interpretability, particularly when working with small datasets. These challenges suggest that SHAP alone may not fully uncover the underlying causes of poor generalization or instability. To advance explainable AI in this context, future research should investigate the factors limiting the reliability of SHAP and explore complementary methods to improve model interpretability.
Supplementary Materials
Author Contributions
Funding
Data Availability Statement
Conflicts of Interest
References
- Nascimbene, R. Investigation of Seismic Damage to Existing Buildings by Using Remotely Observed Images. Eng. Fail. Anal. 2024, 161, 108282. [Google Scholar] [CrossRef]
- Nguyen, H.; Vu, T.; Vo, T.P.; Thai, H.T. Efficient Machine Learning Models for Prediction of Concrete Strengths. Constr. Build. Mater. 2021, 266, 120950. [Google Scholar] [CrossRef]
- Tang, F.; Wu, Y.; Zhou, Y. Hybridizing Grid Search and Support Vector Regression to Predict the Compressive Strength of Fly Ash Concrete. Adv. Civ. Eng. 2022, 2022, 3601914. [Google Scholar] [CrossRef]
- Kargari, A.; Eskandari-Naddaf, H.; Kazemi, R. Effect of Cement Strength Class on the Generalization of Abrams’ Law. Struct. Concr. 2019, 20, 493–505. [Google Scholar] [CrossRef]
- Mehdipour, I.; Khayat, K.H. Effect of Particle-Size Distribution and Specific Surface Area of Different Binder Systems on Packing Density and Flow Characteristics of Cement Paste. Cem. Concr. Compos. 2017, 78, 120–131. [Google Scholar] [CrossRef]
- Jung, H.; Kim, J.; Yang, H.; Kim, N. Evaluation of Residual Properties and Recovery of Fire-Damaged Concrete with Repeatedly Recycled Fine Aggregates. In Construction Materials and Their Properties for Fire Resistance and Insulation; Elsevier: Amsterdam, The Netherlands, 2025; pp. 165–178. [Google Scholar]
- Kim, N.; Kim, J. Effect of Maximum Aggregate Size and Powder Content on the Properties of Self-Compacting Recycled Aggregate Concrete. Period. Polytech. Civ. Eng. 2023, 67, 1038–1047. [Google Scholar] [CrossRef]
- Tam, V.W.Y.; Gao, X.F.; Tam, C.M. Microstructural Analysis of Recycled Aggregate Concrete Produced from Two-Stage Mixing Approach. Cem. Concr. Res. 2005, 35, 1195–1203. [Google Scholar] [CrossRef]
- Sičáková, A.; Kim, J. Some Aspects of the Suitability of Three-Stage Mixing for Ready-Mixed Concrete. J. Croat. Assoc. Civ. Eng. 2024, 76, 709–718. [Google Scholar] [CrossRef]
- López Gayarre, F.; López-Colina Pérez, C.; Serrano López, M.A.; Domingo Cabo, A. The Effect of Curing Conditions on the Compressive Strength of Recycled Aggregate Concrete. Constr. Build. Mater. 2014, 53, 260–266. [Google Scholar] [CrossRef]
- Sidhu, A.S.; Siddique, R. Review on Effect of Curing Methods on High Strength Concrete. Constr. Build. Mater. 2024, 438, 136858. [Google Scholar] [CrossRef]
- Ben Chaabene, W.; Flah, M.; Nehdi, M.L. Machine Learning Prediction of Mechanical Properties of Concrete: Critical Review. Constr. Build. Mater. 2020, 260, 119889. [Google Scholar] [CrossRef]
- Cai, R.; Han, T.; Liao, W.; Huang, J.; Li, D.; Kumar, A.; Ma, H. Prediction of Surface Chloride Concentration of Marine Concrete Using Ensemble Machine Learning. Cem. Concr. Res. 2020, 136, 106164. [Google Scholar] [CrossRef]
- Chou, J.S.; Tsai, C.F.; Pham, A.D.; Lu, Y.H. Machine Learning in Concrete Strength Simulations: Multi-Nation Data Analytics. Constr. Build. Mater. 2014, 73, 771–780. [Google Scholar] [CrossRef]
- Cook, R.; Lapeyre, J.; Ma, H.; Kumar, A. Prediction of Compressive Strength of Concrete: Critical Comparison of Performance of a Hybrid Machine Learning Model with Standalone Models. J. Mater. Civ. Eng. 2019, 31, 04019255. [Google Scholar] [CrossRef]
- Pham, A.-D.; Ngo, N.-T.; Nguyen, Q.-T.; Truong, N.-S. Hybrid Machine Learning for Predicting Strength of Sustainable Concrete. Soft Comput. 2020, 24, 14965–14980. [Google Scholar] [CrossRef]
- Lu, X.; Yvonnet, J.; Papadopoulos, L.; Kalogeris, I.; Papadopoulos, V. A Stochastic FE2 Data-Driven Method for Nonlinear Multiscale Modeling. Materials 2021, 14, 2875. [Google Scholar] [CrossRef]
- Sobhani, J.; Najimi, M.; Pourkhorshidi, A.R.; Parhizkar, T. Prediction of the Compressive Strength of No-Slump Concrete: A Comparative Study of Regression, Neural Network and ANFIS Models. Constr. Build. Mater. 2010, 24, 709–718. [Google Scholar] [CrossRef]
- Lee, S.-C. Prediction of Concrete Strength Using Artificial Neural Networks. Eng. Struct. 2003, 25, 849–857. [Google Scholar] [CrossRef]
- Asteris, P.G.; Skentou, A.D.; Bardhan, A.; Samui, P.; Pilakoutas, K. Predicting Concrete Compressive Strength Using Hybrid Ensembling of Surrogate Machine Learning Models. Cem. Concr. Res. 2021, 145, 106449. [Google Scholar] [CrossRef]
- Yang, J.; Zeng, B.; Ni, Z.; Fan, Y.; Hang, Z.; Wang, Y.; Feng, C.; Yang, J. Comparison of Traditional and Automated Machine Learning Approaches in Predicting the Compressive Strength of Graphene Oxide/Cement Composites. Constr. Build. Mater. 2023, 394, 132179. [Google Scholar] [CrossRef]
- Kim, J. Challenges with Hard-to-Learn Data in Developing Machine Learning Models for Predicting the Strength of Multi-Recycled Aggregate Concrete. Appl. Soft Comput. 2025, 175, 113110. [Google Scholar] [CrossRef]
- Abd, A.M.; Abd, S.M. Modelling the Strength of Lightweight Foamed Concrete Using Support Vector Machine (SVM). Case Stud. Constr. Mater. 2017, 6, 8–15. [Google Scholar] [CrossRef]
- Juncai, X.; Qingwen, R.; Zhenzhong, S. Prediction of the Strength of Concrete Radiation Shielding Based on LS-SVM. Ann. Nucl. Energy 2015, 85, 296–300. [Google Scholar] [CrossRef]
- Mirmozaffari, M.; Yazdani, M.; Boskabadi, A.; Ahady Dolatsara, H.; Kabirifar, K.; Amiri Golilarz, N. A Novel Machine Learning Approach Combined with Optimization Models for Eco-Efficiency Evaluation. Appl. Sci. 2020, 10, 5210. [Google Scholar] [CrossRef]
- Alhakeem, Z.M.; Jebur, Y.M.; Henedy, S.N.; Imran, H.; Bernardo, L.F.A.; Hussein, H.M. Prediction of Ecofriendly Concrete Compressive Strength Using Gradient Boosting Regression Tree Combined with GridSearchCV Hyperparameter-Optimization Techniques. Materials 2022, 15, 7432. [Google Scholar] [CrossRef]
- Joy, R.A. Fine Tuning the Prediction of the Compressive Strength of Concrete: A Bayesian Optimization Based Approach. In Proceedings of the 2021 International Conference on INnovations in Intelligent SysTems and Applications (INISTA), Kocaeli, Turkey, 25–27 August 2021; IEEE: Amsterdam, The Netherlands, 2021; pp. 1–6. [Google Scholar]
- Ahmed, A.; Song, W.; Zhang, Y.; Haque, M.A.; Liu, X. Hybrid BO-XGBoost and BO-RF Models for the Strength Prediction of Self-Compacting Mortars with Parametric Analysis. Materials 2023, 16, 4366. [Google Scholar] [CrossRef]
- Zhang, S.; Chen, W.; Xu, J.; Xie, T. Use of Interpretable Machine Learning Approaches for Quantificationally Understanding the Performance of Steel Fiber-Reinforced Recycled Aggregate Concrete: From the Perspective of Compressive Strength and Splitting Tensile Strength. Eng. Appl. Artif. Intell. 2024, 137, 109170. [Google Scholar] [CrossRef]
- Du, X.; Xu, H.; Zhu, F. Understanding the Effect of Hyperparameter Optimization on Machine Learning Models for Structure Design Problems. Comput. Aided Des. 2021, 135, 103013. [Google Scholar] [CrossRef]
- Li, Z.; Yoon, J.; Zhang, R.; Rajabipour, F.; Srubar III, W.V.; Dabo, I.; Radlińska, A. Machine Learning in Concrete Science: Applications, Challenges, and Best Practices. npj Comput. Mater. 2022, 8, 127. [Google Scholar] [CrossRef]
- Kim, J.; Lee, D.; Ubysz, A. Comparative Analysis of Cement Grade and Cement Strength as Input Features for Machine Learning-Based Concrete Strength Prediction. Case Stud. Constr. Mater. 2024, 21, e03557. [Google Scholar] [CrossRef]
- Zheng, W.; Shui, Z.; Xu, Z.; Gao, X.; Zhang, S. Multi-Objective Optimization of Concrete Mix Design Based on Machine Learning. J. Build. Eng. 2023, 76, 107396. [Google Scholar] [CrossRef]
- Zhao, S.; Hu, F.; Ding, X.; Zhao, M.; Li, C.; Pei, S. Dataset of Tensile Strength Development of Concrete with Manufactured Sand. Data Brief. 2017, 11, 469–472. [Google Scholar] [CrossRef]
- Yi, S.T.; Yang, E.I.; Choi, J.C. Effect of Specimen Sizes, Specimen Shapes, and Placement Directions on Compressive Strength of Concrete. Nucl. Eng. Des. 2006, 236, 115–127. [Google Scholar] [CrossRef]
- Quan Tran, V.; Quoc Dang, V.; Si Ho, L. Evaluating Compressive Strength of Concrete Made with Recycled Concrete Aggregates Using Machine Learning Approach. Constr. Build. Mater. 2022, 323, 126578. [Google Scholar] [CrossRef]
- Kamath, M.V.; Prashanth, S.; Kumar, M.; Tantri, A. Machine-Learning-Algorithm to Predict the High-Performance Concrete Compressive Strength Using Multiple Data. J. Eng. Des. Technol. 2024, 22, 532–560. [Google Scholar] [CrossRef]
- Lyngdoh, G.A.; Zaki, M.; Krishnan, N.M.A.; Das, S. Prediction of Concrete Strengths Enabled by Missing Data Imputation and Interpretable Machine Learning. Cem. Concr. Compos. 2022, 128, 104414. [Google Scholar] [CrossRef]
- Dong, Y.; Tang, J.; Xu, X.; Li, W.; Feng, X.; Lu, C.; Hu, Z.; Liu, J. A New Method to Evaluate Features Importance in Machine-Learning Based Prediction of Concrete Compressive Strength. J. Build. Eng. 2025, 102, 111874. [Google Scholar] [CrossRef]
- Nguyen-Sy, T.; Wakim, J.; To, Q.-D.; Vu, M.-N.; Nguyen, T.-D.; Nguyen, T.-T. Predicting the Compressive Strength of Concrete from Its Compositions and Age Using the Extreme Gradient Boosting Method. Constr. Build. Mater. 2020, 260, 119757. [Google Scholar] [CrossRef]
- Nguyen, N.-H.; Abellán-García, J.; Lee, S.; Garcia-Castano, E.; Vo, T.P. Efficient Estimating Compressive Strength of Ultra-High Performance Concrete Using XGBoost Model. J. Build. Eng. 2022, 52, 104302. [Google Scholar] [CrossRef]
- Duan, J.; Asteris, P.G.; Nguyen, H.; Bui, X.-N.; Moayedi, H. A Novel Artificial Intelligence Technique to Predict Compressive Strength of Recycled Aggregate Concrete Using ICA-XGBoost Model. Eng. Comput. 2021, 37, 3329–3346. [Google Scholar] [CrossRef]
- Chen, T.; Guestrin, C. XGBoost: A Scalable Tree Boosting System. In Proceedings of the 22nd ACM SIGKDD International Conference on Knowledge Discovery and Data Mining, San Francisco, CA, USA, 13–17 August 2016; Association for Computing Machinery: New York, NY, USA, 2016; pp. 785–794. [Google Scholar]
- Vasicek, D. Artificial Intelligence and Machine Learning: Practical Aspects of Overfitting and Regularization. Inf. Serv. Use 2020, 39, 281–289. [Google Scholar] [CrossRef]
- Ying, X. An Overview of Overfitting and Its Solutions. J. Phys. Conf. Ser. 2019, 1168, 022022. [Google Scholar] [CrossRef]
- Li, Q.-F.; Song, Z.-M. High-Performance Concrete Strength Prediction Based on Ensemble Learning. Constr. Build. Mater. 2022, 324, 126694. [Google Scholar] [CrossRef]
- Zhang, X.; Dai, C.; Li, W.; Chen, Y. Prediction of Compressive Strength of Recycled Aggregate Concrete Using Machine Learning and Bayesian Optimization Methods. Front. Earth Sci. 2023, 11, 1112105. [Google Scholar] [CrossRef]
- Truong, G.T.; Choi, K.-K.; Nguyen, T.-H.; Kim, C.-S. Prediction of Shear Strength of RC Deep Beams Using XGBoost Regression with Bayesian Optimization. Eur. J. Environ. Civ. Eng. 2023, 27, 4046–4066. [Google Scholar] [CrossRef]
- Lei, X.; Feng, R.; Dong, Y.; Zhai, C. Bayesian-Optimized Interpretable Surrogate Model for Seismic Demand Prediction of Urban Highway Bridges. Eng. Struct. 2024, 301, 117307. [Google Scholar] [CrossRef]


| Dataset | Sample Size | Feature | Unit | Min. | Max. | Mean. | STD. | Skew. | Kurt. | Missing |
|---|---|---|---|---|---|---|---|---|---|---|
| Dataset 1 | 610 | CCS | MPa | 42.9 | 53.2 | 47.9 | 3.8 | −0.149 | −1.52 | 0 |
| W | kg/m3 | 143.2 | 166.4 | 153.2 | 6.4 | 0.231 | −1.19 | 0 | ||
| C | kg/m3 | 135 | 335 | 231.5 | 43.9 | 0.066 | −0.99 | 0 | ||
| S | kg/m3 | 50.0 | 115.0 | 81.7 | 18.0 | 0.391 | −0.97 | 0 | ||
| F-ash | kg/m3 | 25.0 | 80.0 | 58.4 | 13.9 | 0.203 | −0.99 | 0 | ||
| FA | kg/m3 | 719.1 | 946.4 | 870.1 | 66.4 | −1.075 | −0.19 | 0 | ||
| CA | kg/m3 | 896.4 | 1004.7 | 955.2 | 30.4 | 0.508 | −0.84 | 0 | ||
| 28CS | MPa | 31.2 | 73.0 | 48.7 | 8.9 | 0.428 | −0.42 | 0 | ||
| Dataset 2 | 388 | CCS | MPa | 35.5 | 63.4 | 48.0 | 4.7 | 0.401 | 0.79 | 0 |
| Age | Day | 1 | 388 | 73 | 95 | 1.936 | 2.74 | 0 | ||
| Dmax | mm | 12 | 80 | 30.1 | 13.6 | 2.727 | 8.06 | 10 | ||
| SP | % | 0 | 20 | 8.92 | 5.45 | 0.353 | −0.75 | 31 | ||
| FA-FM | n.a | 2.2 | 3.5 | 3.03 | 0.26 | −0.746 | 0.15 | 24 | ||
| w/c | n.a | 0.30 | 1.01 | 0.47 | 0.10 | 1.027 | 2.87 | 0 | ||
| W | kg/m3 | 104 | 291 | 169.9 | 21.2 | −0.662 | 4.16 | 0 | ||
| s/a | % | 26 | 54 | 38.0 | 5.78 | 0.966 | 1.05 | 0 | ||
| CS | MPa | 4.23 | 96.3 | 55.1 | 19.0 | −0.017 | −0.71 | 0 | ||
| Dataset 3 | 371 | CCS | MPa | 32.1 | 67.5 | 49.9 | 8.620 | 0.280 | −0.639 | 0 |
| CA-SG | n.a | 2.23 | 2.89 | 2.60 | 0.127 | −0.854 | 0.201 | 28 | ||
| FA-SG | n.a | 2.24 | 2.71 | 2.59 | 0.116 | −1.169 | 0.392 | 116 | ||
| C | kg/m3 | 250 | 601 | 390.0 | 69.8 | 0.507 | 0.372 | 0 | ||
| W | kg/m3 | 108 | 320 | 181.2 | 28.8 | 0.891 | 2.758 | 0 | ||
| w/c | n.a | 0.27 | 0.80 | 0.48 | 0.093 | 0.458 | 0.132 | 0 | ||
| CA | kg/m3 | 680 | 1366 | 1098.9 | 140.6 | −0.521 | −0.140 | 0 | ||
| FA | kg/m3 | 493 | 1160 | 717.7 | 111.6 | 0.879 | 1.052 | 0 | ||
| 28CS | MPa | 10 | 83.3 | 40.5 | 10.5 | 0.415 | 0.465 | 0 |
| Algorithms | Parameter | Range | Selected | ||
|---|---|---|---|---|---|
| DS1 | DS2 | DS3 | |||
| XGB | n_estimators | [100] | n.a | n.a | n.a |
| random_state | [42] | ||||
| Grid search | n_estimator | [50, 100, 150, 200, 250, 300] | 250 | 150 | 300 |
| max_depth | [1, 3, 5, 7, 9, 11, 13, 15] | 1 | 3 | 3 | |
| learning_rate | [0.01, 0.1, 0.2, 0.3, 0.4, 0.5] | 0.3 | 0.5 | 0.2 | |
| Random search | n_estimator | Randint [50, 300] | 181 | 283 | 175 |
| max_depth | Randint [1, 15] | 2 | 3 | 3 | |
| learning_rate | Uniform [0.01, 0.49) | 0.230 | 0.119 | 0.455 | |
| Bayesian optimization | n_estimator | Integer [50, 300] | 200 | 271 | 300 |
| max_depth | Integer [1, 10] | 2 | 3 | 2 | |
| learning_rate | Real [0.01, 0.5] prior = ‘log-uniform’) | 0.106 | 0.141 | 0.264 | |
| Dataset | Search Method | Test Set | Train Set | ||||
|---|---|---|---|---|---|---|---|
| R2 | RMSE | MAE | R2 | RMSE | MAE | ||
| DS1 | NS | 0.858 | 3.647 | 3.228 | 0.953 | 1.838 | 1.345 |
| RS | 0.909 | 2.918 | 2.583 | 0.938 | 2.128 | 1.846 | |
| GS | 0.911 | 2.881 | 2.548 | 0.915 | 2.478 | 2.165 | |
| BS | 0.911 | 2.874 | 2.556 | 0.930 | 2.249 | 1.973 | |
| DS2 | NS | 0.950 | 4.022 | 2.659 | 1.000 | 0.401 | 0.136 |
| RS | 0.960 | 3.611 | 2.422 | 0.997 | 1.153 | 0.862 | |
| GS | 0.959 | 3.619 | 2.398 | 0.999 | 0.688 | 0.478 | |
| BS | 0.960 | 3.600 | 2.360 | 0.997 | 1.071 | 0.792 | |
| DS3 | NS | 0.800 | 4.613 | 3.556 | 1.000 | 0.171 | 0.030 |
| RS | 0.777 | 4.873 | 3.527 | 0.999 | 0.245 | 0.130 | |
| GS | 0.799 | 4.619 | 3.415 | 0.999 | 0.375 | 0.256 | |
| BS | 0.774 | 4.901 | 3.676 | 0.992 | 0.926 | 0.712 | |
| Reference | R2 | RMSE | ||||||
|---|---|---|---|---|---|---|---|---|
| Basic | GS | RS | BS | Basic | GS | RS | BS | |
| DS1 (this study)—XGB | 0.858 | 0.911 | 0.909 | 0.911 | 3.647 | 2.881 | 2.918 | 2.874 |
| DS1 (this study)—RF | 0.879 | 0.892 | 0.893 | 0.894 | 3.354 | 3.172 | 3.159 | 3.152 |
| DS1 (this study)—ANN | 0.794 | 0.913 | 0.914 | 0.911 | 4.384 | 2.847 | 2.831 | 2.877 |
| DS2 (this study)—XGB | 0.950 | 0.959 | 0.960 | 0.960 | 4.022 | 3.619 | 3.611 | 3.600 |
| DS2 (this study)—RF | 0.934 | 0.936 | 0.932 | 0.938 | 4.628 | 4.543 | 4.685 | 4.490 |
| DS2 (this study)—ANN | 0.872 | 0.869 | 0.943 | 0.919 | 6.420 | 6.498 | 4.297 | 5.119 |
| DS3 (this study)—XGB | 0.800 | 0.799 | 0.777 | 0.774 | 4.613 | 4.619 | 4.873 | 4.901 |
| DS3 (this study)—RF | 0.763 | 0.760 | 0.763 | 0.760 | 5.024 | 5.052 | 5.017 | 5.055 |
| DS3 (this study)—ANN | 0.588 | 0.696 | 0.688 | 0.742 | 6.620 | 5.687 | 5.765 | 5.234 |
| Zhang et al. [47] | - | 0.795 | 0.795 | 0.807 | - | - | - | - |
| Truong et al. [48] | 0.896 | 0.927 | 0.927 | 0.936 | 79.995 | 67.124 | 66.845 | 62.904 |
| Lei et al. [49] | - | 0.885 | 0.893 | 0.918 | - | - | - | - |
Disclaimer/Publisher’s Note: The statements, opinions and data contained in all publications are solely those of the individual author(s) and contributor(s) and not of MDPI and/or the editor(s). MDPI and/or the editor(s) disclaim responsibility for any injury to people or property resulting from any ideas, methods, instructions or products referred to in the content. |
© 2025 by the authors. Licensee MDPI, Basel, Switzerland. This article is an open access article distributed under the terms and conditions of the Creative Commons Attribution (CC BY) license (https://creativecommons.org/licenses/by/4.0/).
Share and Cite
Kim, J.; Lee, D. Comparative Study on Hyperparameter Tuning for Predicting Concrete Compressive Strength. Buildings 2025, 15, 2173. https://doi.org/10.3390/buildings15132173
Kim J, Lee D. Comparative Study on Hyperparameter Tuning for Predicting Concrete Compressive Strength. Buildings. 2025; 15(13):2173. https://doi.org/10.3390/buildings15132173
Chicago/Turabian StyleKim, Jeonghyun, and Donwoo Lee. 2025. "Comparative Study on Hyperparameter Tuning for Predicting Concrete Compressive Strength" Buildings 15, no. 13: 2173. https://doi.org/10.3390/buildings15132173
APA StyleKim, J., & Lee, D. (2025). Comparative Study on Hyperparameter Tuning for Predicting Concrete Compressive Strength. Buildings, 15(13), 2173. https://doi.org/10.3390/buildings15132173