Article

Monitoring and Analysis of Mechanical Response of Main Tunnel Structure During Segment-Cutting Process

1
School of Water Conservancy and Transportation, Zhengzhou University, Zhengzhou 450001, China
2
National Key Laboratory of Tunnel Boring Machine and Intelligent Operation and Maintenance, Zhengzhou University, Zhengzhou 450001, China
3
Tianjin Port Engineering Institute, Tianjin 300222, China
*
Author to whom correspondence should be addressed.
Buildings 2025, 15(13), 2175; https://doi.org/10.3390/buildings15132175
Submission received: 17 May 2025 / Revised: 11 June 2025 / Accepted: 16 June 2025 / Published: 22 June 2025
(This article belongs to the Section Building Structures)

Abstract

This study analyzes the deformation and internal force changes of the main tunnel during the cutting process of the pipe jacking method for cross passages. A combination of field monitoring and numerical simulation was used to investigate a construction case of the pipe jacking method for the cross passage of Zhengzhou Metro Line 12. The study provides an in-depth analysis of the stress characteristics of the main tunnel structure during the segment-cutting process. The research findings indicate that during the pre-support stage, the internal support system helps to disperse external water and soil pressure, thereby reducing the internal forces and deformation of the tunnel. In the segment-cutting stage, the horizontal diameter of the main tunnel near the hole location gradually increases, while the vertical diameter decreases. At the same time, the stress on the bolts also rises, with the circumferential bolt stress exceeding that of the longitudinal bolts, eventually approaching their yield strength. The upper and lower ends of the tunnel opening are cut to form cantilever ends, leading to inward converging deformation. This deformation causes the internal forces to disperse toward both sides of the opening, resulting in a noticeable increase in internal force at the 90° position of the semi-cutting ring. The research findings provide a theoretical reference for understanding the deformation patterns and internal force transfer mechanisms of the main tunnel structure during the construction process of cross passages using the pipe jacking method.

1. Introduction

As a convenient and fast mode of transportation, the subway greatly facilitates people’s travel needs and improves the quality of life. In addition, the subway also reduces traffic congestion and environmental pollution problems and contributes to the sustainable development of the city [1,2,3]. Consequently, they have rapidly developed in major cities [4]. Due to the relatively enclosed cylindrical structure of subway tunnels, which are typically long and narrow with limited access points, evacuation and rescue efforts are challenging during emergencies [5,6,7]. Therefore, cross passages between the main tunnels are crucial. Subway cross passage is an essential auxiliary facility for ensuring the safety of life and property, serving critical functions such as fire protection, safe evacuation, and drainage [8,9,10]. Many countries and regions have explicitly defined construction standards for cross passages in their subway design codes: when the continuous length of two single-line section tunnels is approximately 600 m, a cross passage with a width of no less than 2.0 m and a height of no less than 2.5 m should be constructed.
Currently, the ground freezing method is widely used in the construction of subway cross passages [11,12,13,14,15]. However, this method has several drawbacks during the construction process, including long freezing times, high energy consumption, and significant ground settlement [16,17,18]. In recent years, with the development of pipe-jacking technology, pipe-jacking machines have gradually been applied to the construction of subway connection passages [19]. This technology has gained widespread attention due to its advantages, such as fast tunneling speed, high passage quality, and minimal ground settlement [20,21,22]. There have been successful cases worldwide where the pipe-jacking method has been utilized for the rapid excavation of cross passages. For example, these include the Fourth Tube Elbe River Rescue Passage in Hamburg, Germany; the cross-passage between Tuen Mun and Hong Kong International Airport (Chek Lap Kok); the cross passages of the Emisor Oriente wastewater tunnel in Mexico; the cross-passage between Lujiazui and Dongchang Road on Shanghai’s Metro Line 2; and the cross passages on Nanjing Metro Line 1. By introducing the pipe-jacking method, these projects have significantly improved construction efficiency and quality [23].
During the construction of cross passages using the pipe-jacking method, the main tunnel at the launch end provides the thrust reaction force. The pipe-jacking machine cuts through the segments of the main tunnel and excavates the soil ahead while simultaneously using prefabricated segments for support. This process continues until the pipe-jacking machine is fully received into the receiving end sleeve. Throughout this process, the stress state of the main tunnel undergoes continuous changes [24]. Especially in the early cutting and breakthrough phase, the main tunnel changes from a cylindrical form to an open-hole configuration. This transition experiences both geostatic pressure and the thrust force exerted during construction, leading to a complex stress environment [25,26,27]. The safety of the main tunnel structure under these circumstances has attracted considerable interest [28,29,30]. Therefore, accurately identifying hazardous working conditions and structurally weak areas is essential for improving construction techniques and ensuring the safety of the main tunnel structure [31].
Due to the challenges of limited reproducibility and high costs associated with in-situ tests, researchers typically use model tests and numerical simulation methods to conduct related studies. Liu et al. [32] conducted full-scale tests on reinforced concrete and steel-concrete composite segments, analyzing deformation and internal forces during the mechanical cutting process. Zhu et al. [33] performed full-scale tests on the pipe jacking method, examining the structural performance of the main tunnel lining. Lu [34] explored the mechanical characteristics of shield tunnels under construction loads using centrifuge model tests with two resistance modes. Wang et al. [35] developed a three-dimensional numerical model for the breakthrough process of mechanically excavated cross passages in main tunnels, analyzing the mechanical response of the main tunnel during the breakthrough process. However, this study did not consider the effects of pre-support and thrust on the structure. During the pipe-jacking construction of cross passages, the main tunnel is subjected to both pre-support and thrust. The pre-support force helps to bear the external earth and water pressure, enhancing the tunnel’s resistance to deformation. The thrust provides the thrust to move the pipe-jacking machine forward, which can increase tunnel deformation. If the effects of pre-support and thrust on the tunnel structure are ignored, the model’s calculation results may not align with the actual conditions, potentially affecting structural safety. Therefore, the simulation model should fully account for these loads to ensure the safety of the engineering design and construction.
The pipe-jacking method for constructing subway cross passages was initially implemented during the construction of Ningbo Metro Line 3 in 2018. This technology has a relatively brief development history. Currently, there are relatively few case studies and field monitoring related to the use of the pipe jacking method for subway cross passages. Research on the deformation patterns of the main tunnel structure and the distribution characteristics of internal forces during the segment-cutting process is still lacking.
Based on this background, field monitoring of strain in the main tunnel was conducted during the pipe-jacking construction of the cross passage for Zhengzhou Metro Line 12. A 3D simulation model is employed to analyze the stress distribution, deformation patterns, and internal force variations within the main tunnel structure throughout the segment-cutting process. Additionally, the study explores the redistribution of tunnel forces and the force transfer mechanisms between segments, highlighting potential structural weaknesses. The goal of this work is to offer theoretical insights and guidance for the pipe-jacking construction of cross passages in similar projects.

2. Project Overview

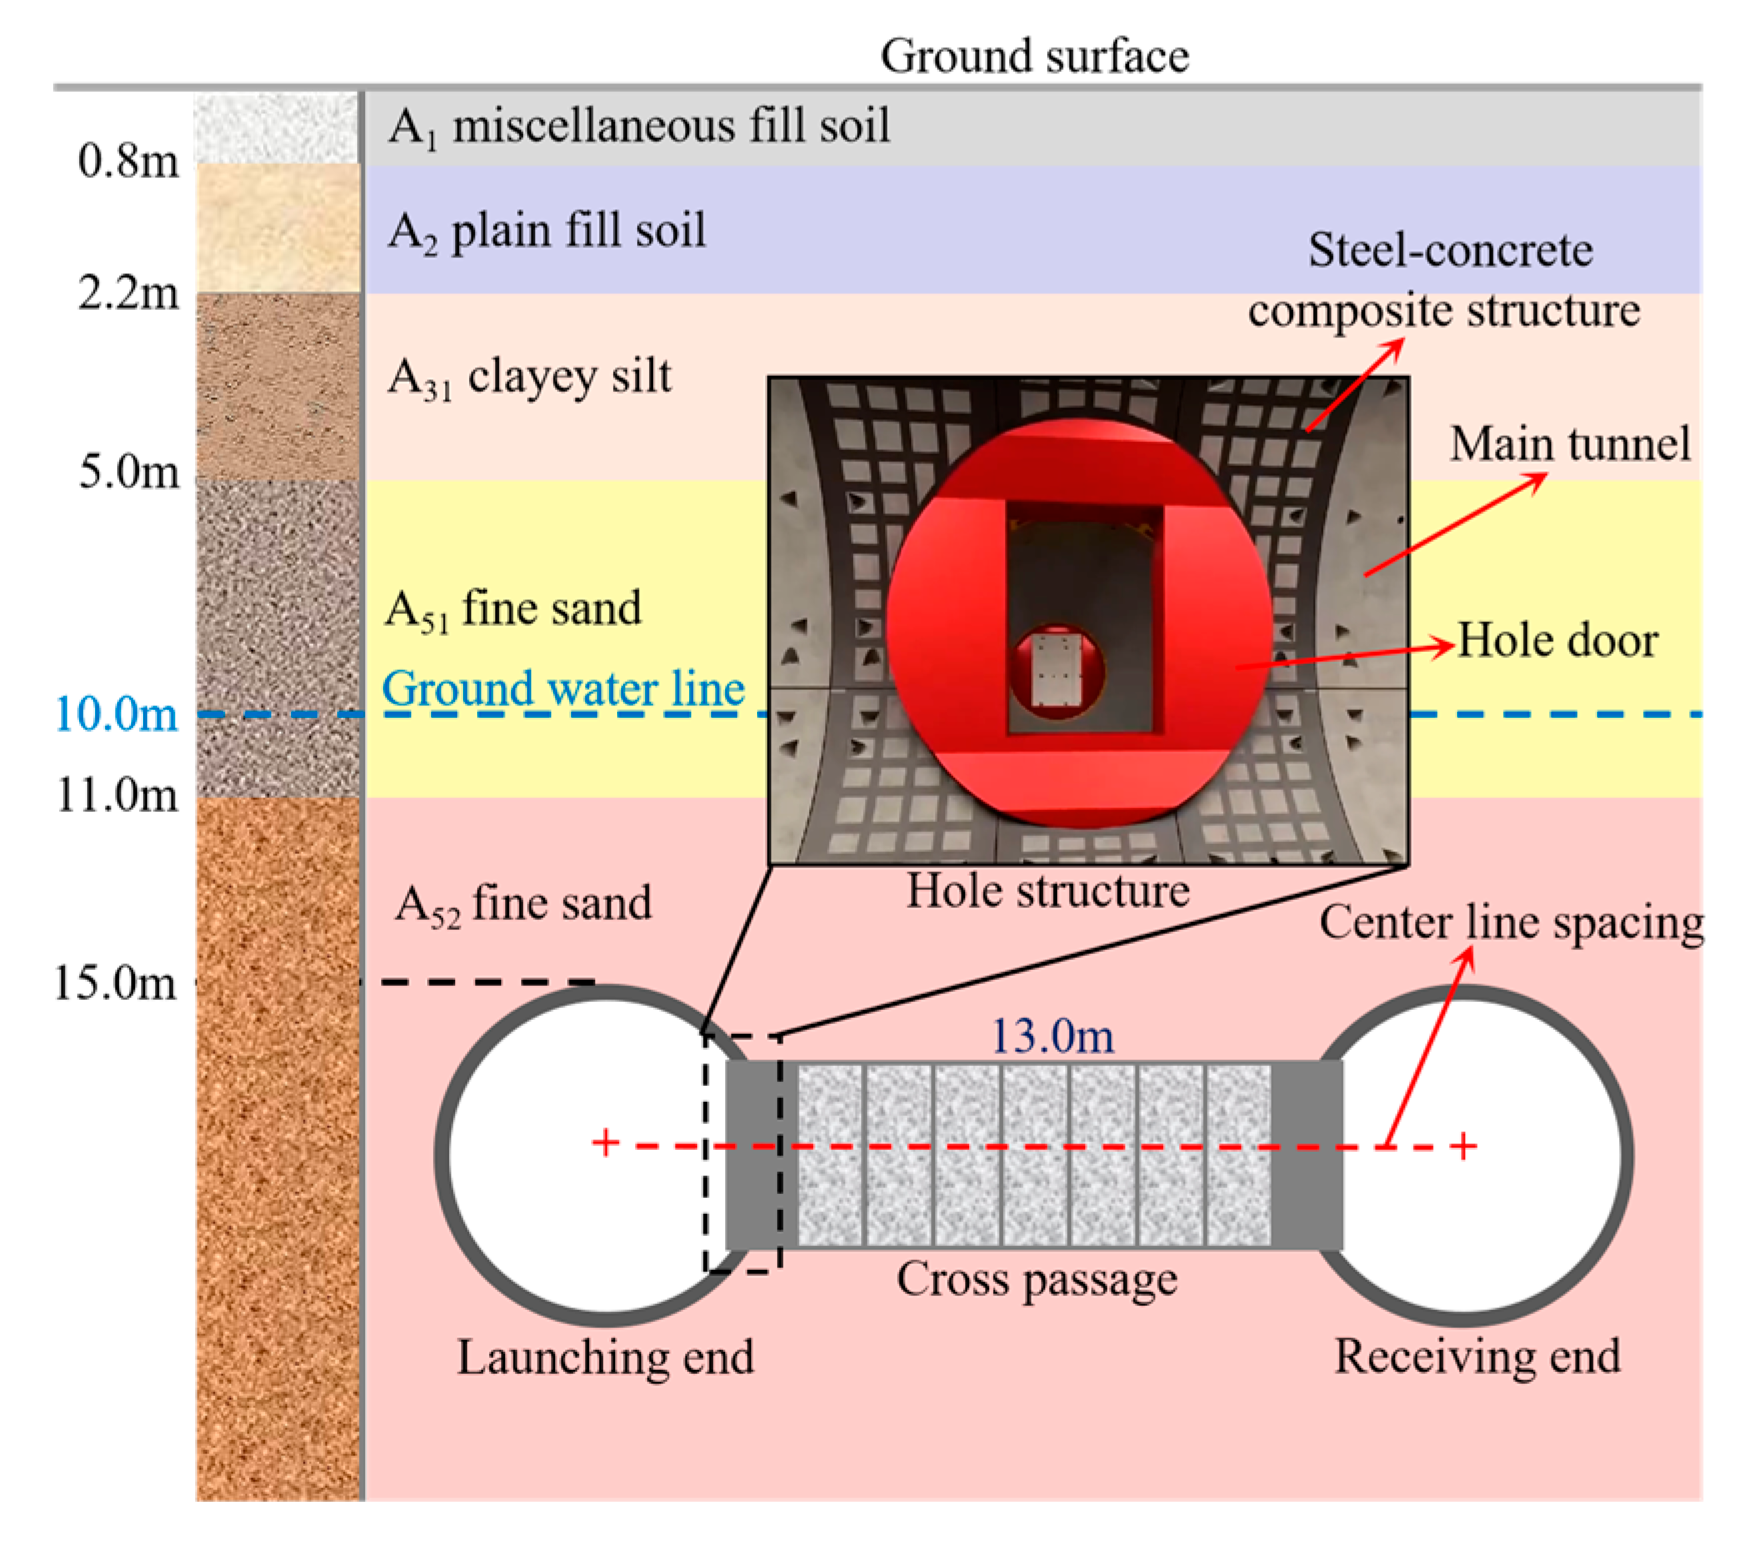
2.1. Geological Conditions

The pipe jacking construction project of the cross passage is located in the shield section of Zhengzhou Metro Line 12 in China. The left and right main tunnels are single-line single-hole circular sections. The stratigraphic stratification in the cross-passage construction area is shown in Figure 1. The red dotted line in the figure is the centerline spacing of the main tunnel, and the blue dotted line is the location of the groundwater. The arch bottom of the main tunnel to the surface is 15.0 m. The distance between the center lines of the main tunnel is 13 m. The physical and mechanical parameters of each soil layer are presented in Table 1.

2.2. Main Tunnel Structure

Figure 2 illustrates a schematic diagram of the main tunnel structure. Figure 2a shows the three-dimensional structure of the main tunnel at the hole location. In Figure 2a, the green area represents glass fiber reinforced concrete, the yellow section indicates steel-concrete composite segments and the gray part denotes C50 concrete segments. The main tunnel is assembled using longitudinal and circumferential bolts to connect the segments.
Figure 2b presents the cross-sectional dimensions of the main tunnel. The outer diameter of the tunnel is 6200 mm, with a thickness of 350 mm and a segment width of 1500 mm. In Figure 2b, K represents the crown segment (21.5°), while A and B denote adjacent segments (68°). C, D, and E are standard segments (67.5°). Different colors indicate different types of segments.

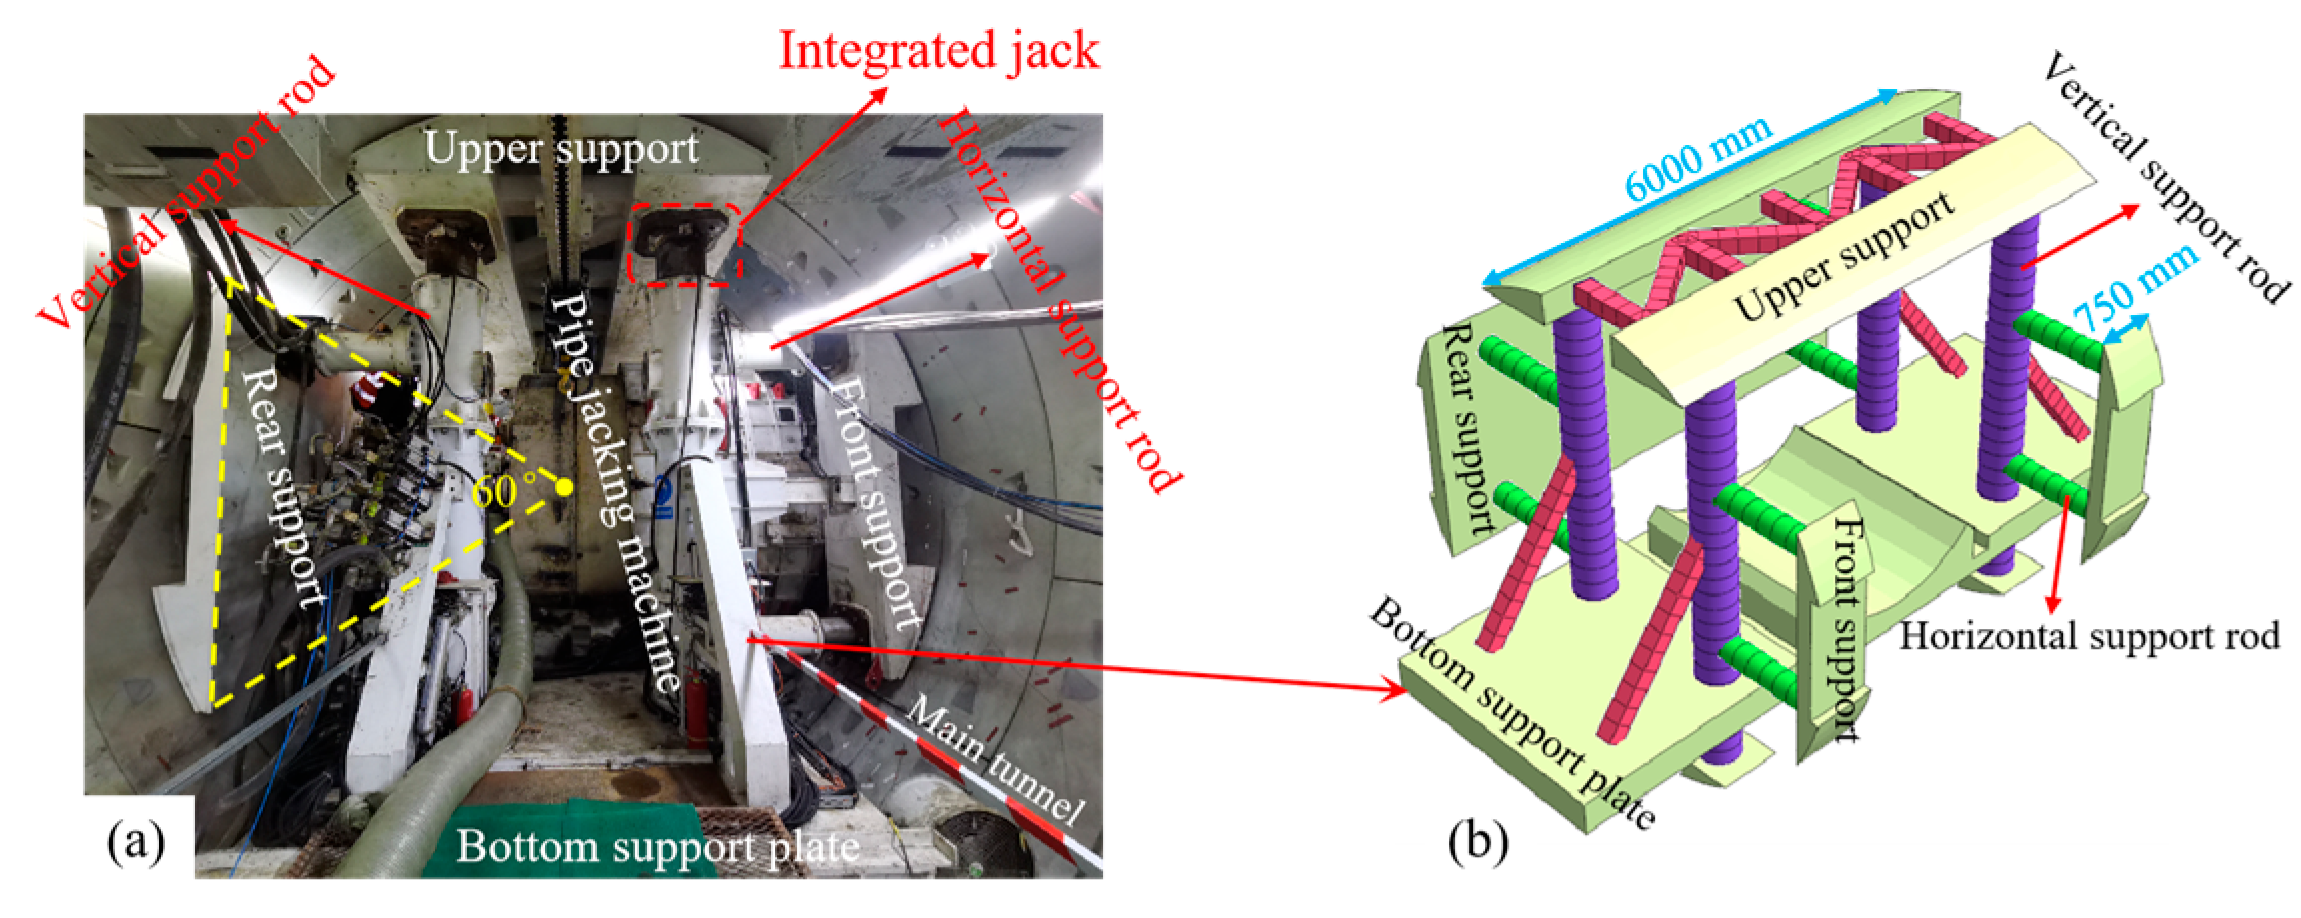
2.3. Internal Support Structure

The internal support structure system is shown in Figure 3. The internal support is an auxiliary system to ensure the safety of the main tunnel structure during the construction process. The upper support plate is in contact with the top segment, with a longitudinal length of 6000 mm, and is connected to the bottom plate through four sets of vertical support rods. The rear support plate is in contact with the back side of the main tunnel and has a longitudinal length of 6000 mm. The front support plate is in contact with the segment on the breakthrough side and has a longitudinal length of 750 mm. The front and rear support plates are connected to the vertical support rods through four sets of horizontal support rods, with the support plates curved at a 60° angle. Each support is equipped with built-in jacks that can extend and retract, providing pre-supporting force to the main tunnel structure.

3. Simulation Model

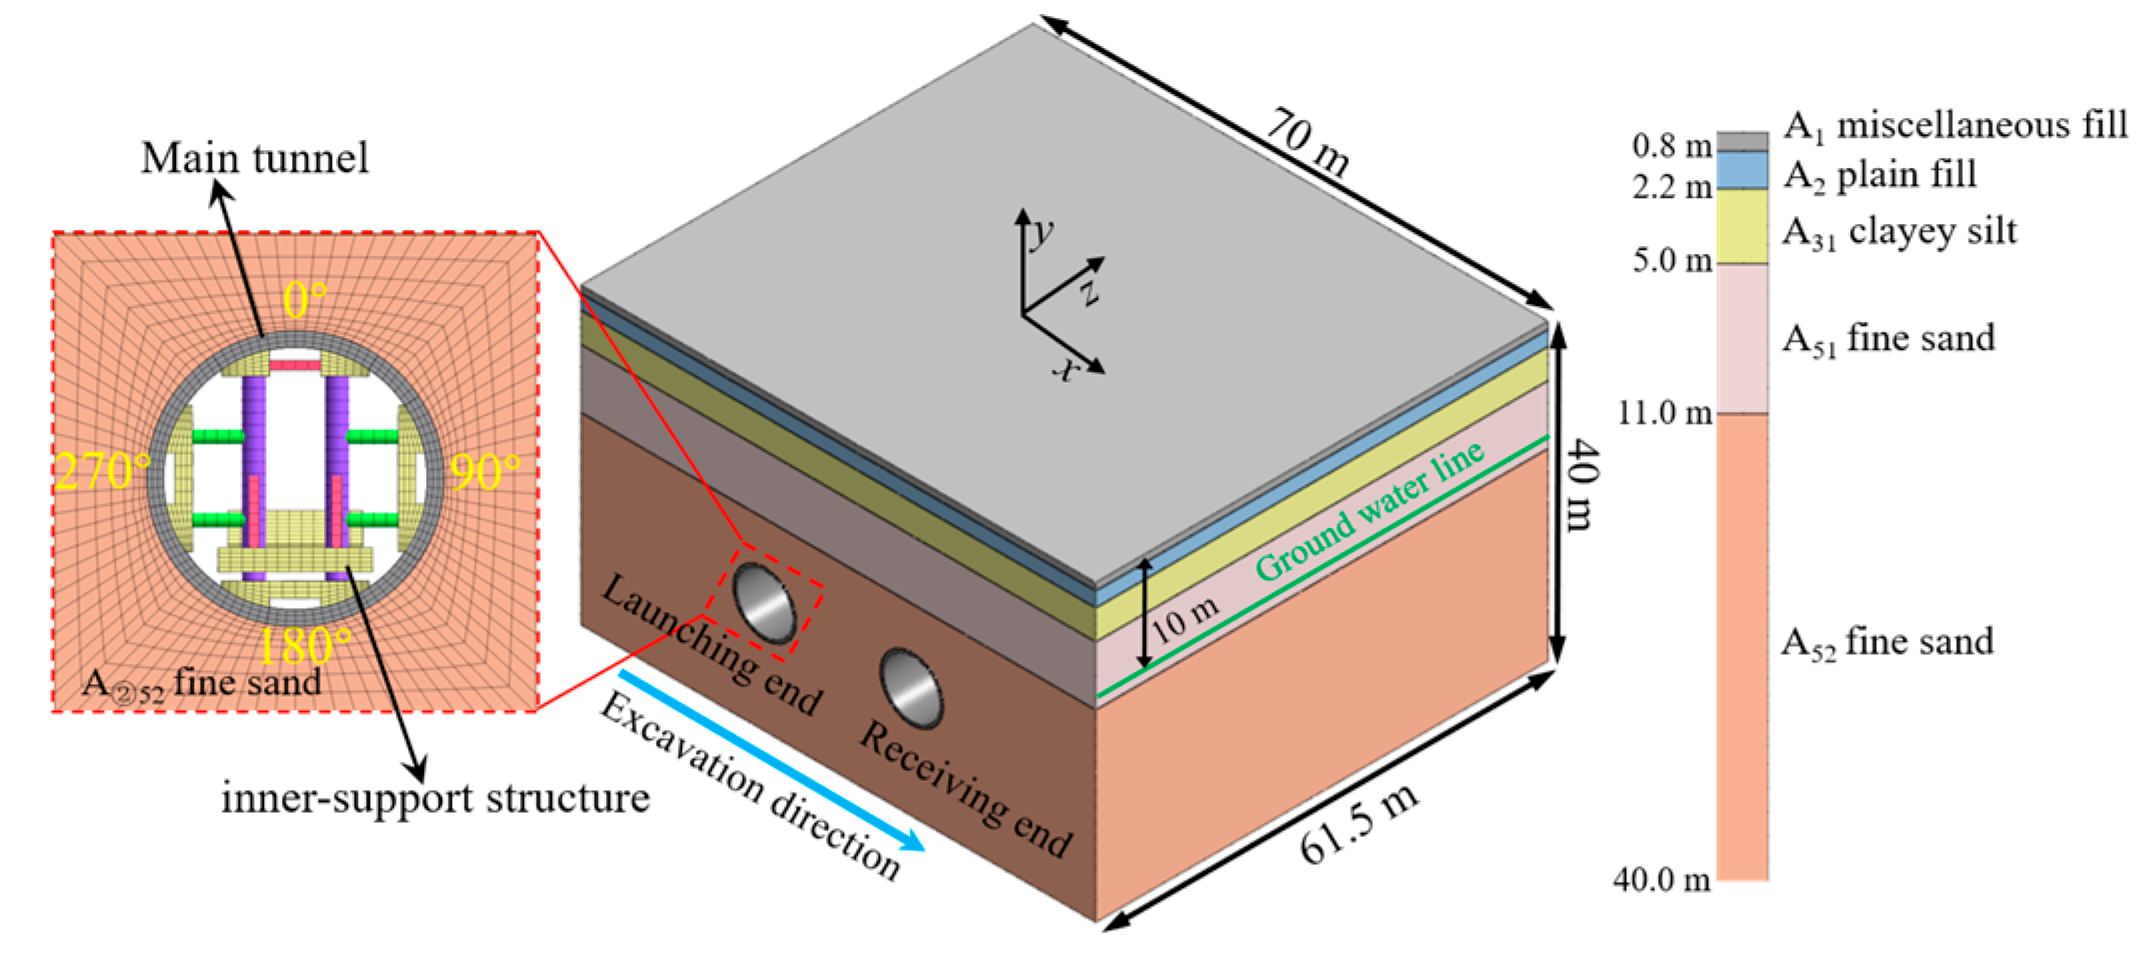
3.1. Model Establishment

The MIDAS GTS NX (2019) finite element analysis software in the geotechnical field was used to simulate and model the pipe-jacking construction project of the metro cross passage [36,37]. The established numerical model is shown in Figure 4. The surrounding and bottom of the model were subjected to constraints perpendicular to the surface, and the top was not subjected to constraints [38].

3.2. Model Parameter

In the model, the soil is represented using the Mohr–Coulomb ideal elastic–plastic constitutive model, with the corresponding physical and mechanical parameters for each soil layer provided in Table 1. For the other structural materials, the linear elastic constitutive model is employed, and the physical properties of these materials are listed in Table 2.

3.3. Calculating Procedure

The model calculation phase was divided into three main stages. The construction structure schematic for each stage is shown in Figure 5.
(1)
Initial stage: The excavation of the main tunnel is completed, and a displacement resetting operation is performed on the model.
(2)
Pre-support stage: The internal support structure and the launching sleeve are activated, and pre-support forces are applied to the main tunnel.
(3)
Cutting stage: The thrust force of 2500 kN on the cutting face and the corresponding thrust reaction force of 2500 kN on the rear support plate are activated. The contact form between the cutter head of the pipe jacking machine and the main tunnel is illustrated in Figure 6. To analyze the mechanical changes in the main tunnel during the segment-cutting process, the thickness of the segment at the hole location (H = 350 mm) is divided into four equal parts. The cutting stage is further divided into four calculation steps, corresponding to 1/4 H (87.5 mm), 2/4 H (175 mm), 3/4 H (262.5 mm), and the full thickness H (350 mm).

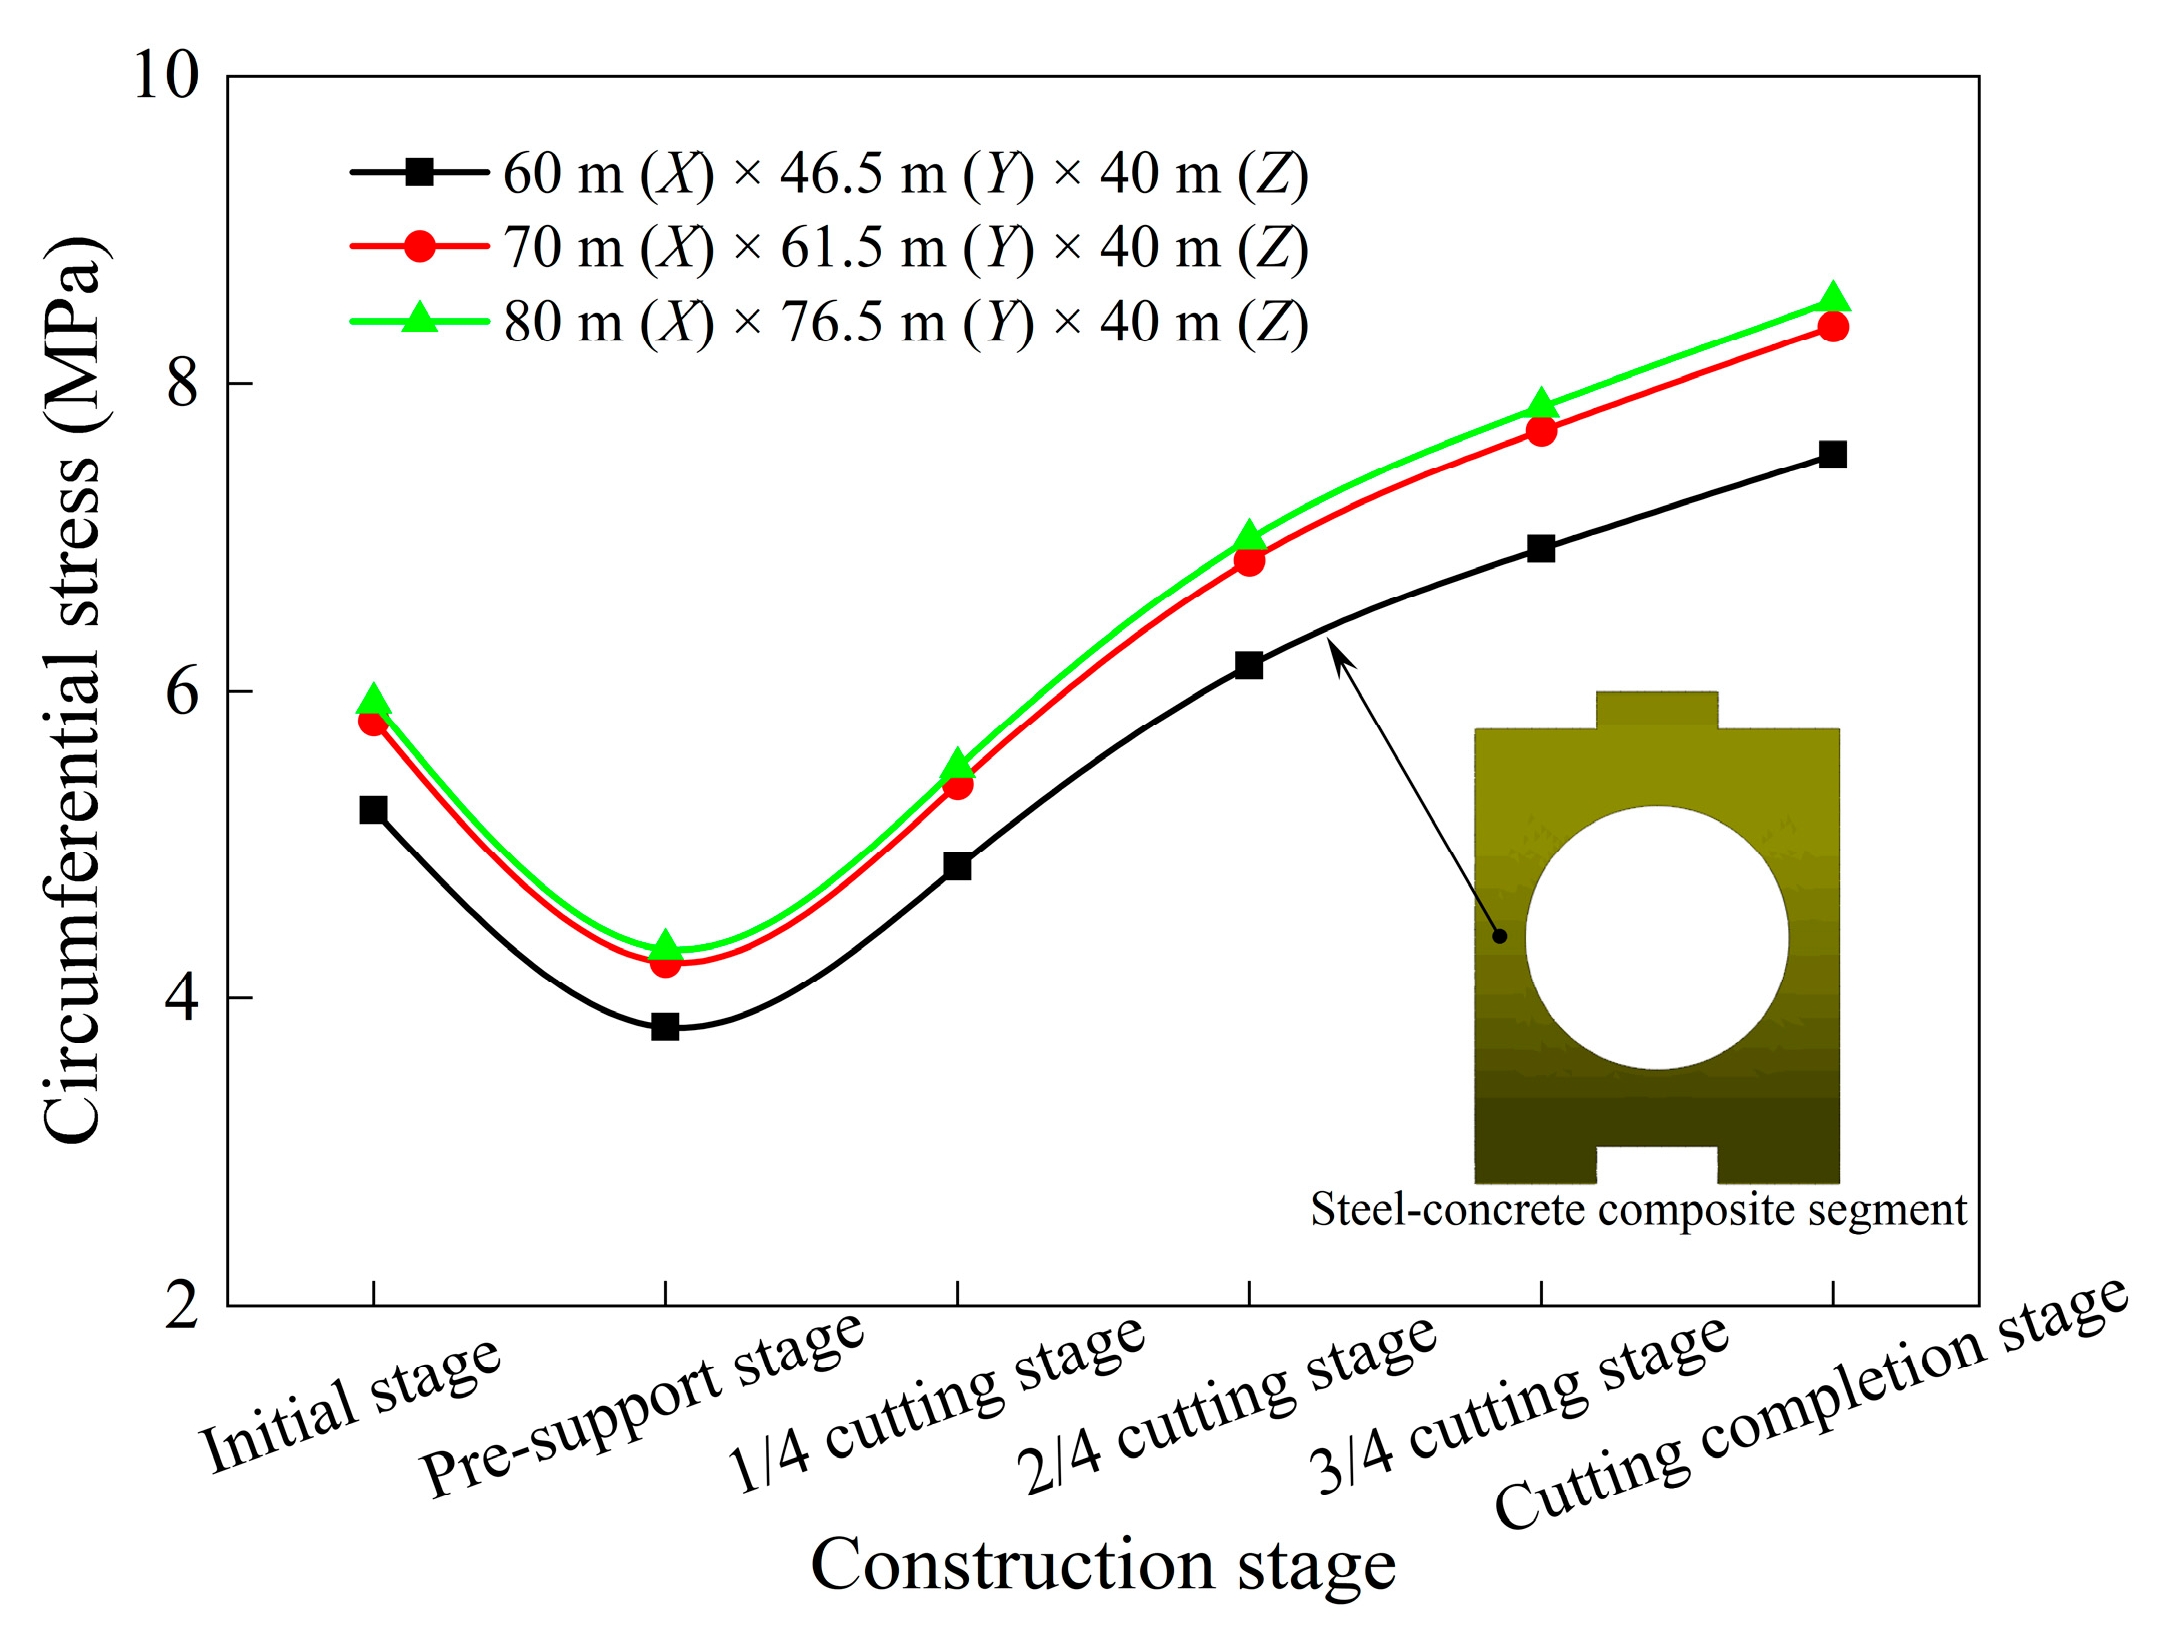
3.4. Mesh Independence Verification

Due to the impact of the boundary conditions of the finite element model on the accuracy of the results, a sensitivity analysis of the model size was conducted [39]. According to the study by Li et al. [24], the distance from the tunnel profile to the boundary should not be less than three times the tunnel diameter. Three model sizes were established: 60 m (X) × 46.5 m (Y) × 40 m (Z), 70 m (X) × 61.5 m (Y) × 40 m (Z), and 80 m (X) × 76.5 m (Y) × 40 m (Z). Since the burial depth of the cross passage is fixed at 15 m, the model size in the Z-direction remains unchanged. The model was computed using a Lenovo laptop equipped with an Intel (R) Core (TM) i5-7300HQ CPU @ 2.50 GHz. Table 3 shows the number of elements and computation time for each model size. Figure 7 presents the variation curves of circumferential stress on the left middle part of the tunnel opening for the three model sizes. When the model sizes are 70 m (X) × 61.5 m (Y) × 40 m (Z) and 80 m (X) × 76.5 m (Y) × 40 m (Z), the calculation results show minimal deviation, but the latter takes longer to compute. To balance both computational efficiency and result reliability, the model size of 70 m (X) × 61.5 m (Y) × 40 m (Z) was selected for optimal computational performance.

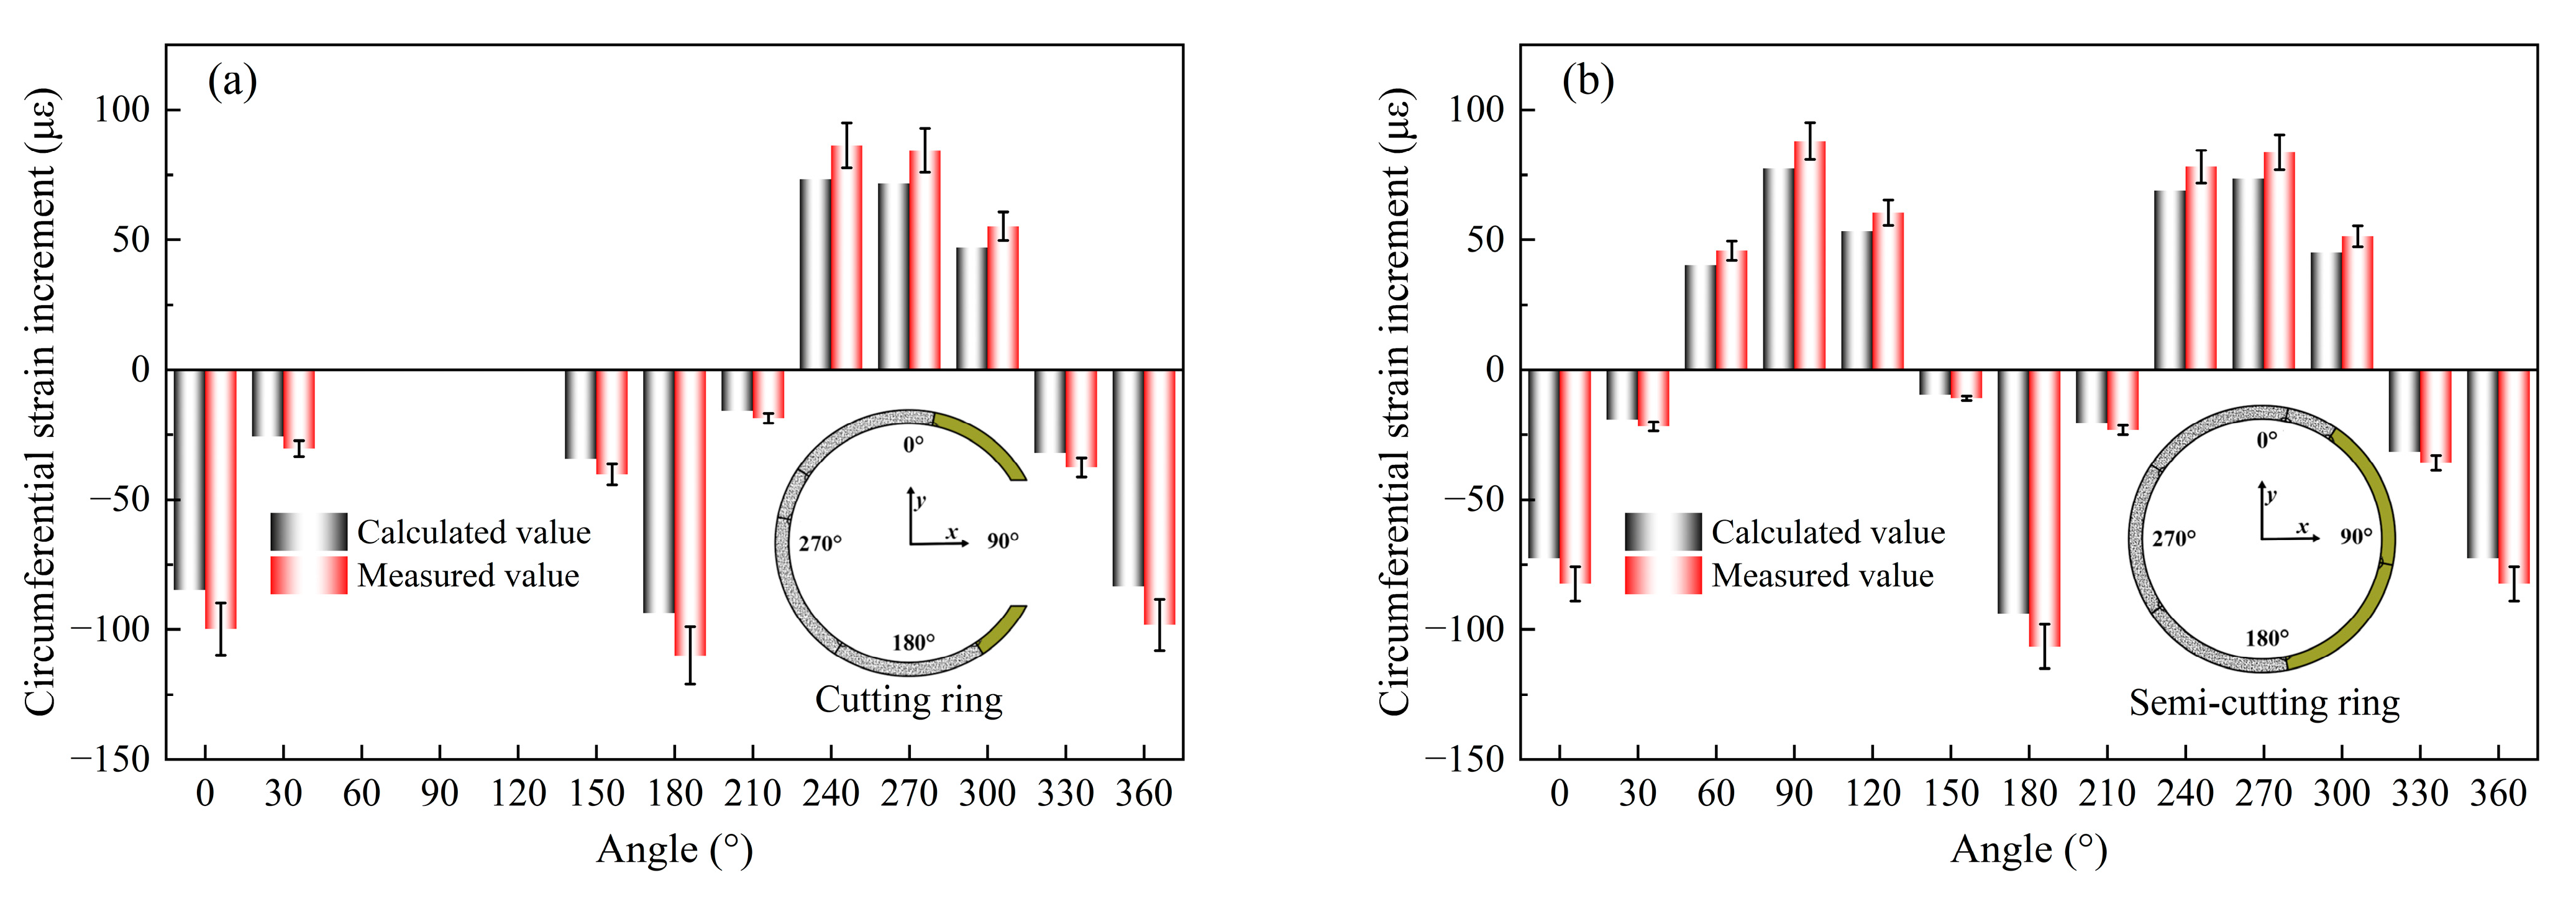
3.5. Model Validation

3.5.1. Field Monitoring

The monitoring targets included the left semi-cutting ring (L-SR), cutting ring (CR), and right semi-cutting ring (R-SR). Figure 8 shows the in-situ monitoring locations of the circumferential strain on the inner surface of the main tunnel. The ring that is fully cut at the center of the hole location is referred to as the cutting ring. The rings on the left and right sides of the opening that are half-cut are designated as the left semi-cutting ring and the right semi-cutting ring, respectively. The complete rings adjacent to the left and right semi-cutting rings are referred to as the left adjacent ring (L-AR) and the right adjacent ring (R-AR). Figure 9 presents the real-time monitoring of strain in the main tunnel. Strain data is collected using static strain measurement instruments, enabling continuous tracking and recording of the changes in circumferential strain on the inner surface of the tunnel.

3.5.2. Comparative Analysis

Since the support force in the pre-support stage can be applied repeatedly, five repeated loadings were performed on the main tunnel during this stage. Figure 10 shows a comparison between the measured and calculated circumferential strain increments for the cutting and semi-cutting rings during the pre-support stage. After five repeated loadings of the pre-support force, the average error of the measured strain values is approximately 8.2%, which is within an acceptable range, indicating that the monitoring results are accurate.
Figure 11 shows a comparison between the measured and calculated circumferential strain increments for the cutting and semi-cutting rings during the 2/4 H cutting stage. The calculated strain values for both rings closely match the measured values, and their trends are generally consistent. This indicates that the numerical model effectively reflects the actual stress state of the main tunnel structure.

4. Mechanical Response Analysis
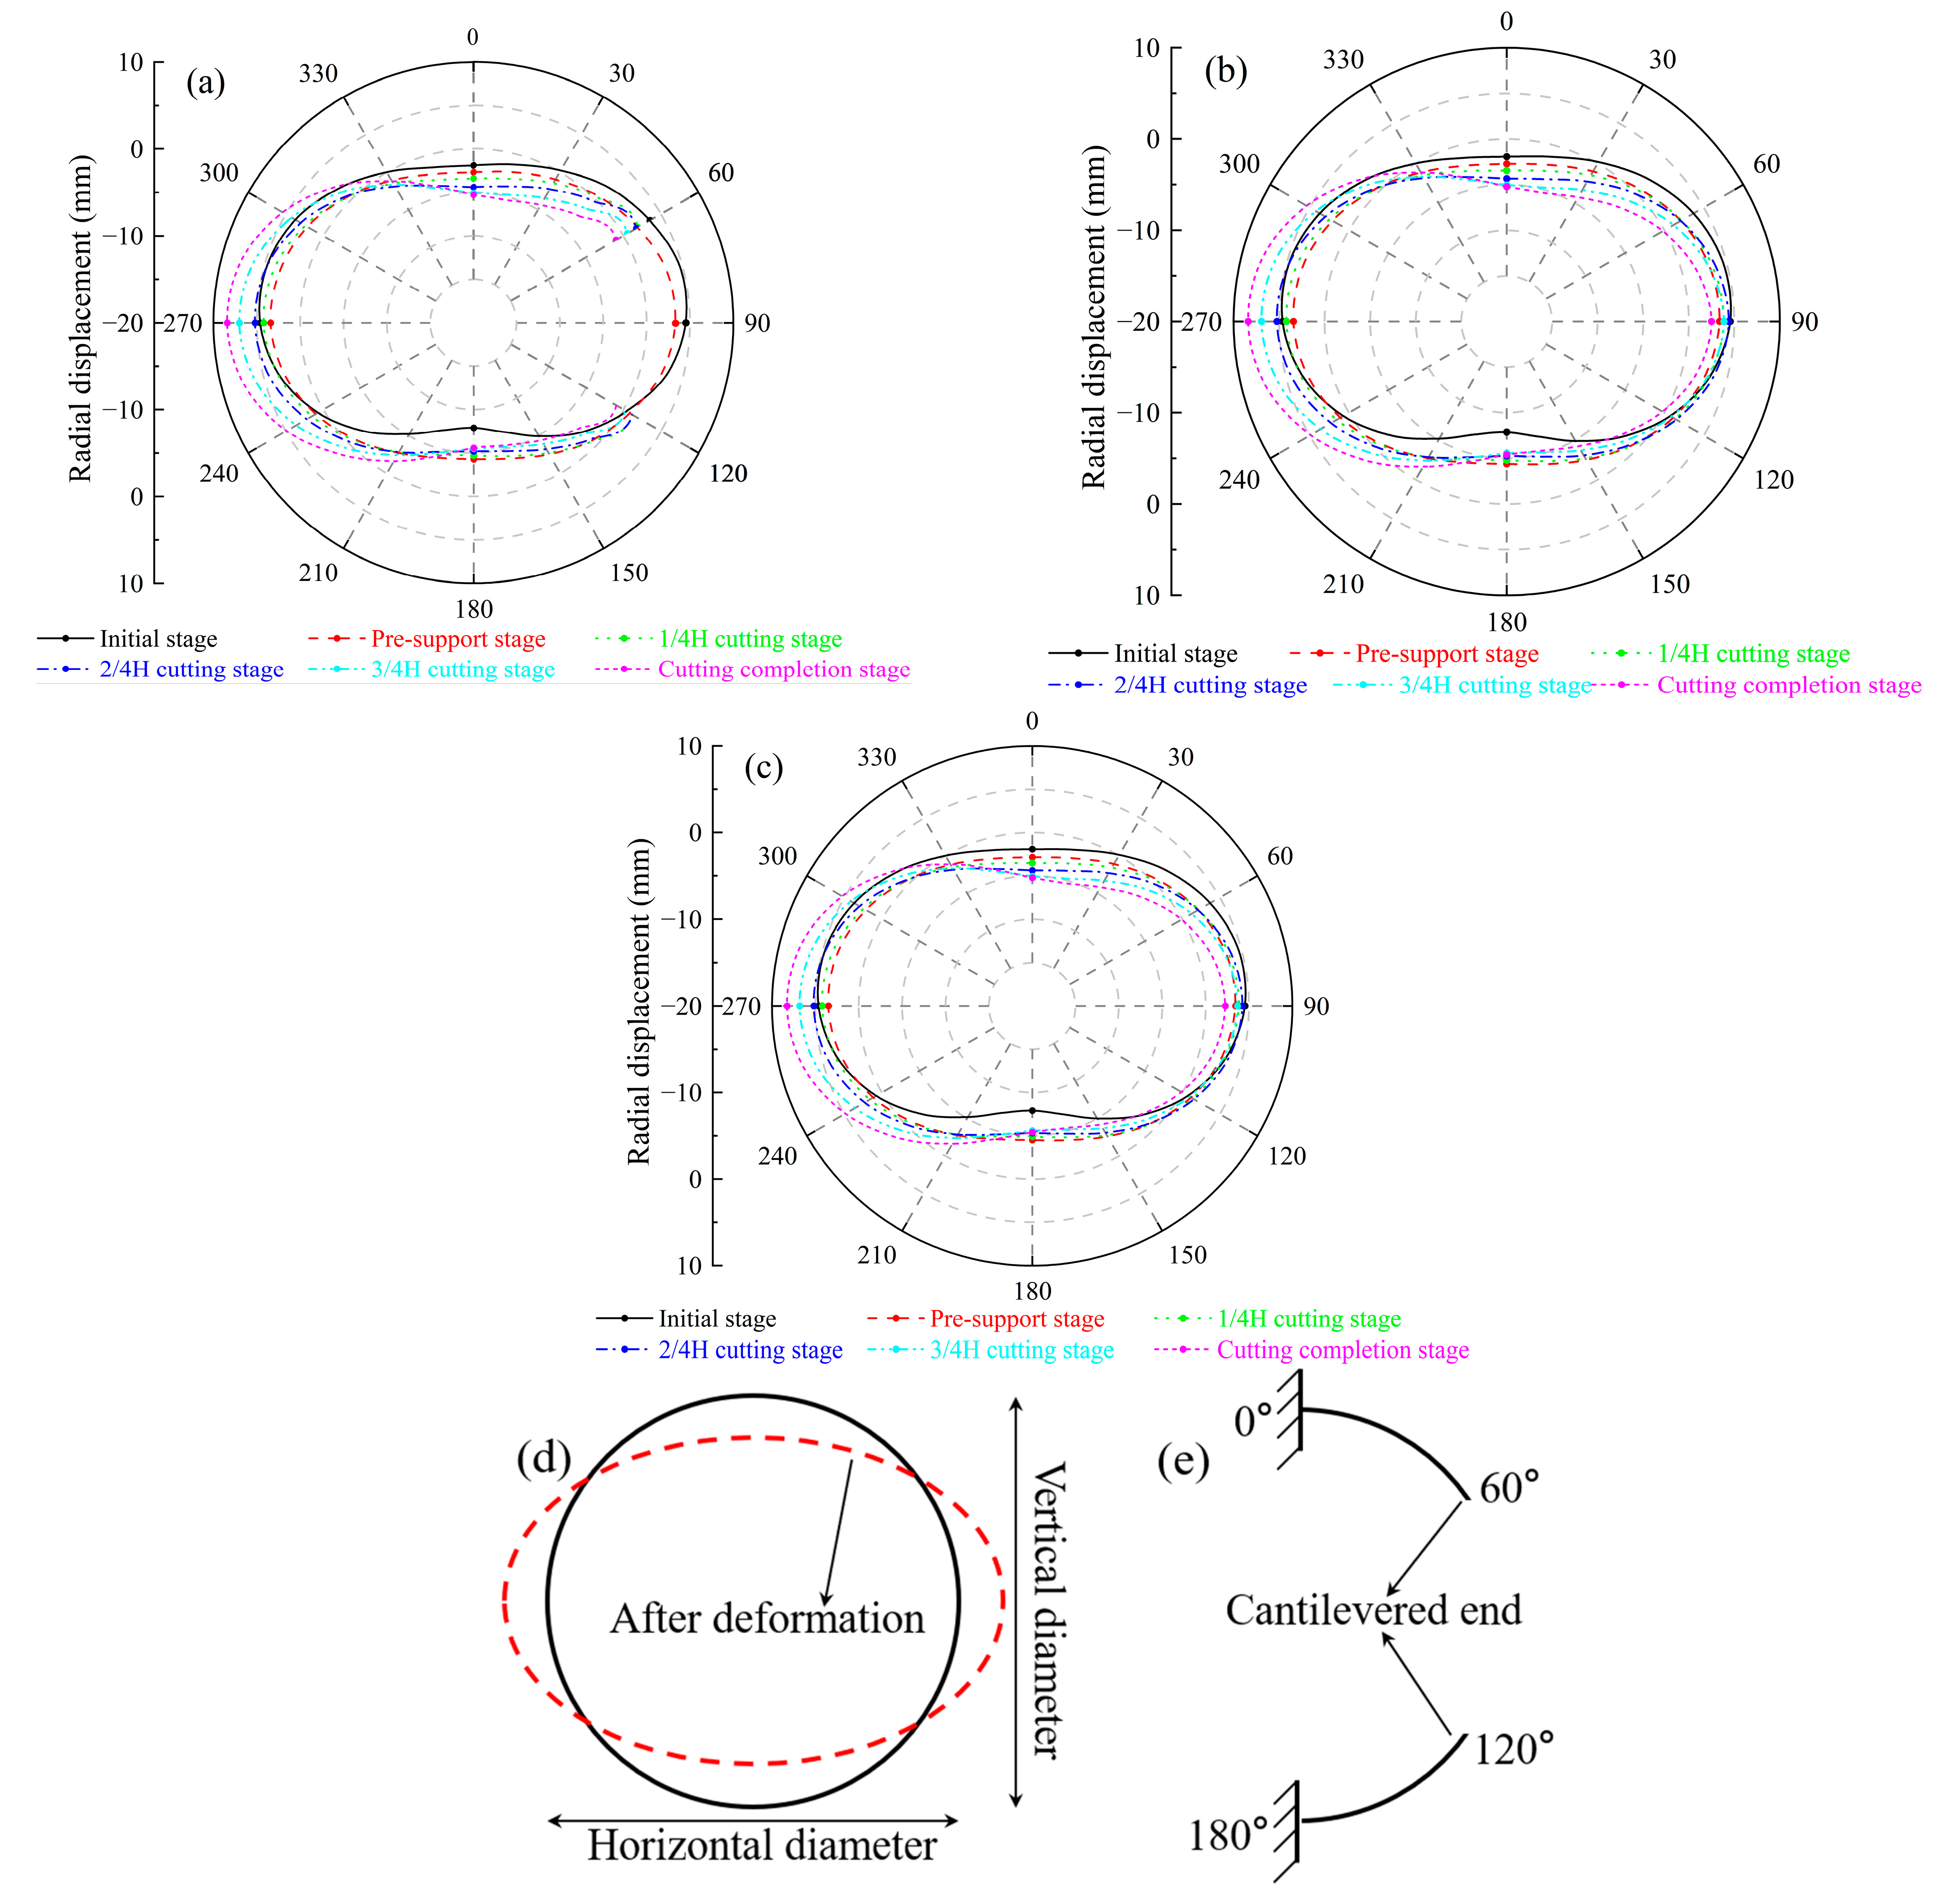
4.1. Deformation

The radial displacement of the main tunnel is shown in Figure 12. Radial displacement is defined as negative when the segments deform inward and positive when they deform outward. The radial deformation of the main tunnel at each stage is described as follows:
(1)
Initial stage: The radial displacement of the main tunnel exhibits a “horizontal ellipse” distribution under the influence of self-weight and earth and water loads. This horizontal ovalization is characterized by a decrease in the tunnel’s vertical diameter and an increase in its horizontal diameter, as illustrated in Figure 12d. The vault of each ring experiences a settlement displacement of 1.9 mm, the arch bottom rises by 7.9 mm, and the left and right arch waists deform outward by 4.6 mm and 4.5 mm, respectively.
(2)
Pre-support stage: Under the combined effects of the self-weight of the internal support and the pre-support forces, the top of the tunnel experienced settlement, while the bottom deformed outward. Convergence deformation occurred on both sides of the tunnel. This reduced the transverse elliptical deformation of the tunnel, indicating that the internal support system provided a certain level of protection to the main tunnel.
(3)
Cutting stage: As the cutting thickness increases, the inward deformation at the vault and arch bottom of each ring gradually increases, while the outward deformation at the left arch waist gradually increases. The 60° and 120° positions of the right arch waist of the cutting ring gradually converge inward, exhibiting a significant cantilever effect. (where the structure is fixed at one end and free at the other, as depicted in Figure 12e). The radial displacement of the right arch waist in the semi-cutting ring and adjacent ring first increases and then decreases. This change is attributed to the reduced contact area between the segments being cut and the surrounding segments during the 3/4 H cutting stage, which significantly decreases the outward thrust of the cutter head on the segments near the breakthrough. Under the action of the internal support system, the radial deformations at the vault, arch bottom, and left arch waist of each ring are relatively similar. Due to the continuous horizontal thrust reaction force on the rear support plate, the left arch waist segments exhibit more pronounced outward deformation. Upon completion of the cutting, the maximum outward deformation of the left arch waist segment is approximately 8.4 mm. This value is less than the specified limit of 10 mm in the “Code for Design of Urban Rail Transit Tunnels” (GB 50911–2013). Therefore, the tunnel deformation is within a safe condition.

4.2. Bolts Stress

Bolts can ensure the overall stability and safety of the tunnel structure. During the hole-breaking construction of the main tunnel, the bolts are inevitably affected. Therefore, the mechanical response of the bolts is of significant concern.

4.2.1. Circumferential Bolt Stress

Figure 13 shows the Von Mises stress change of the circumferential bolts. It can be observed that from the initial stage to the completion of the cutting stage, the Von Mises stress of the circumferential bolts in each ring first decreases and then increases, with the change curves exhibiting a “hook-shaped” pattern. In the initial stage, the maximum Von Mises stress of the circumferential bolts in each ring remains within 400 MPa. During the pre-support stage, the stress decreases by approximately 50 MPa. However, as the cutting operation continues, the stress on the circumferential bolts gradually rises. The most significant increase occurs between the pre-support stage and the 3/4 H cutting stage. In contrast, the changes are less pronounced between the 3/4 H cutting stage and the completion stage, indicating that the primary stress redistribution in the main tunnel structure at the launching end occurs during the 3/4 H cutting stage. During the whole cutting process, the maximum Von Mises stress of the circumferential bolt is 550 MPa. This is lower than the yield strength of the 8.8 grade bolt (640 MPa).

4.2.2. Longitudinal Bolt Stress

Figure 14 shows the Von Mises stress change of the longitudinal bolts. During the pre-support stage, the stress in the longitudinal bolts decreases, with a more significant reduction observed in the bolts located near the center of the support range. This indicates that the protective effect of the internal support system on the segments gradually weakens from the center toward the sides. During the cutting stage, the stress in the longitudinal bolts at the upper and lower ends of the opening significantly increases. With the increase in cutting depth, the stress also increases, reaching a peak of about 62 MPa when the cutting is completed. This value is substantially lower than the yield strength of the 8.8-grade bolts (640 MPa), indicating that the longitudinal bolts remain within safe operational limits during construction.

4.3. Internal Forces
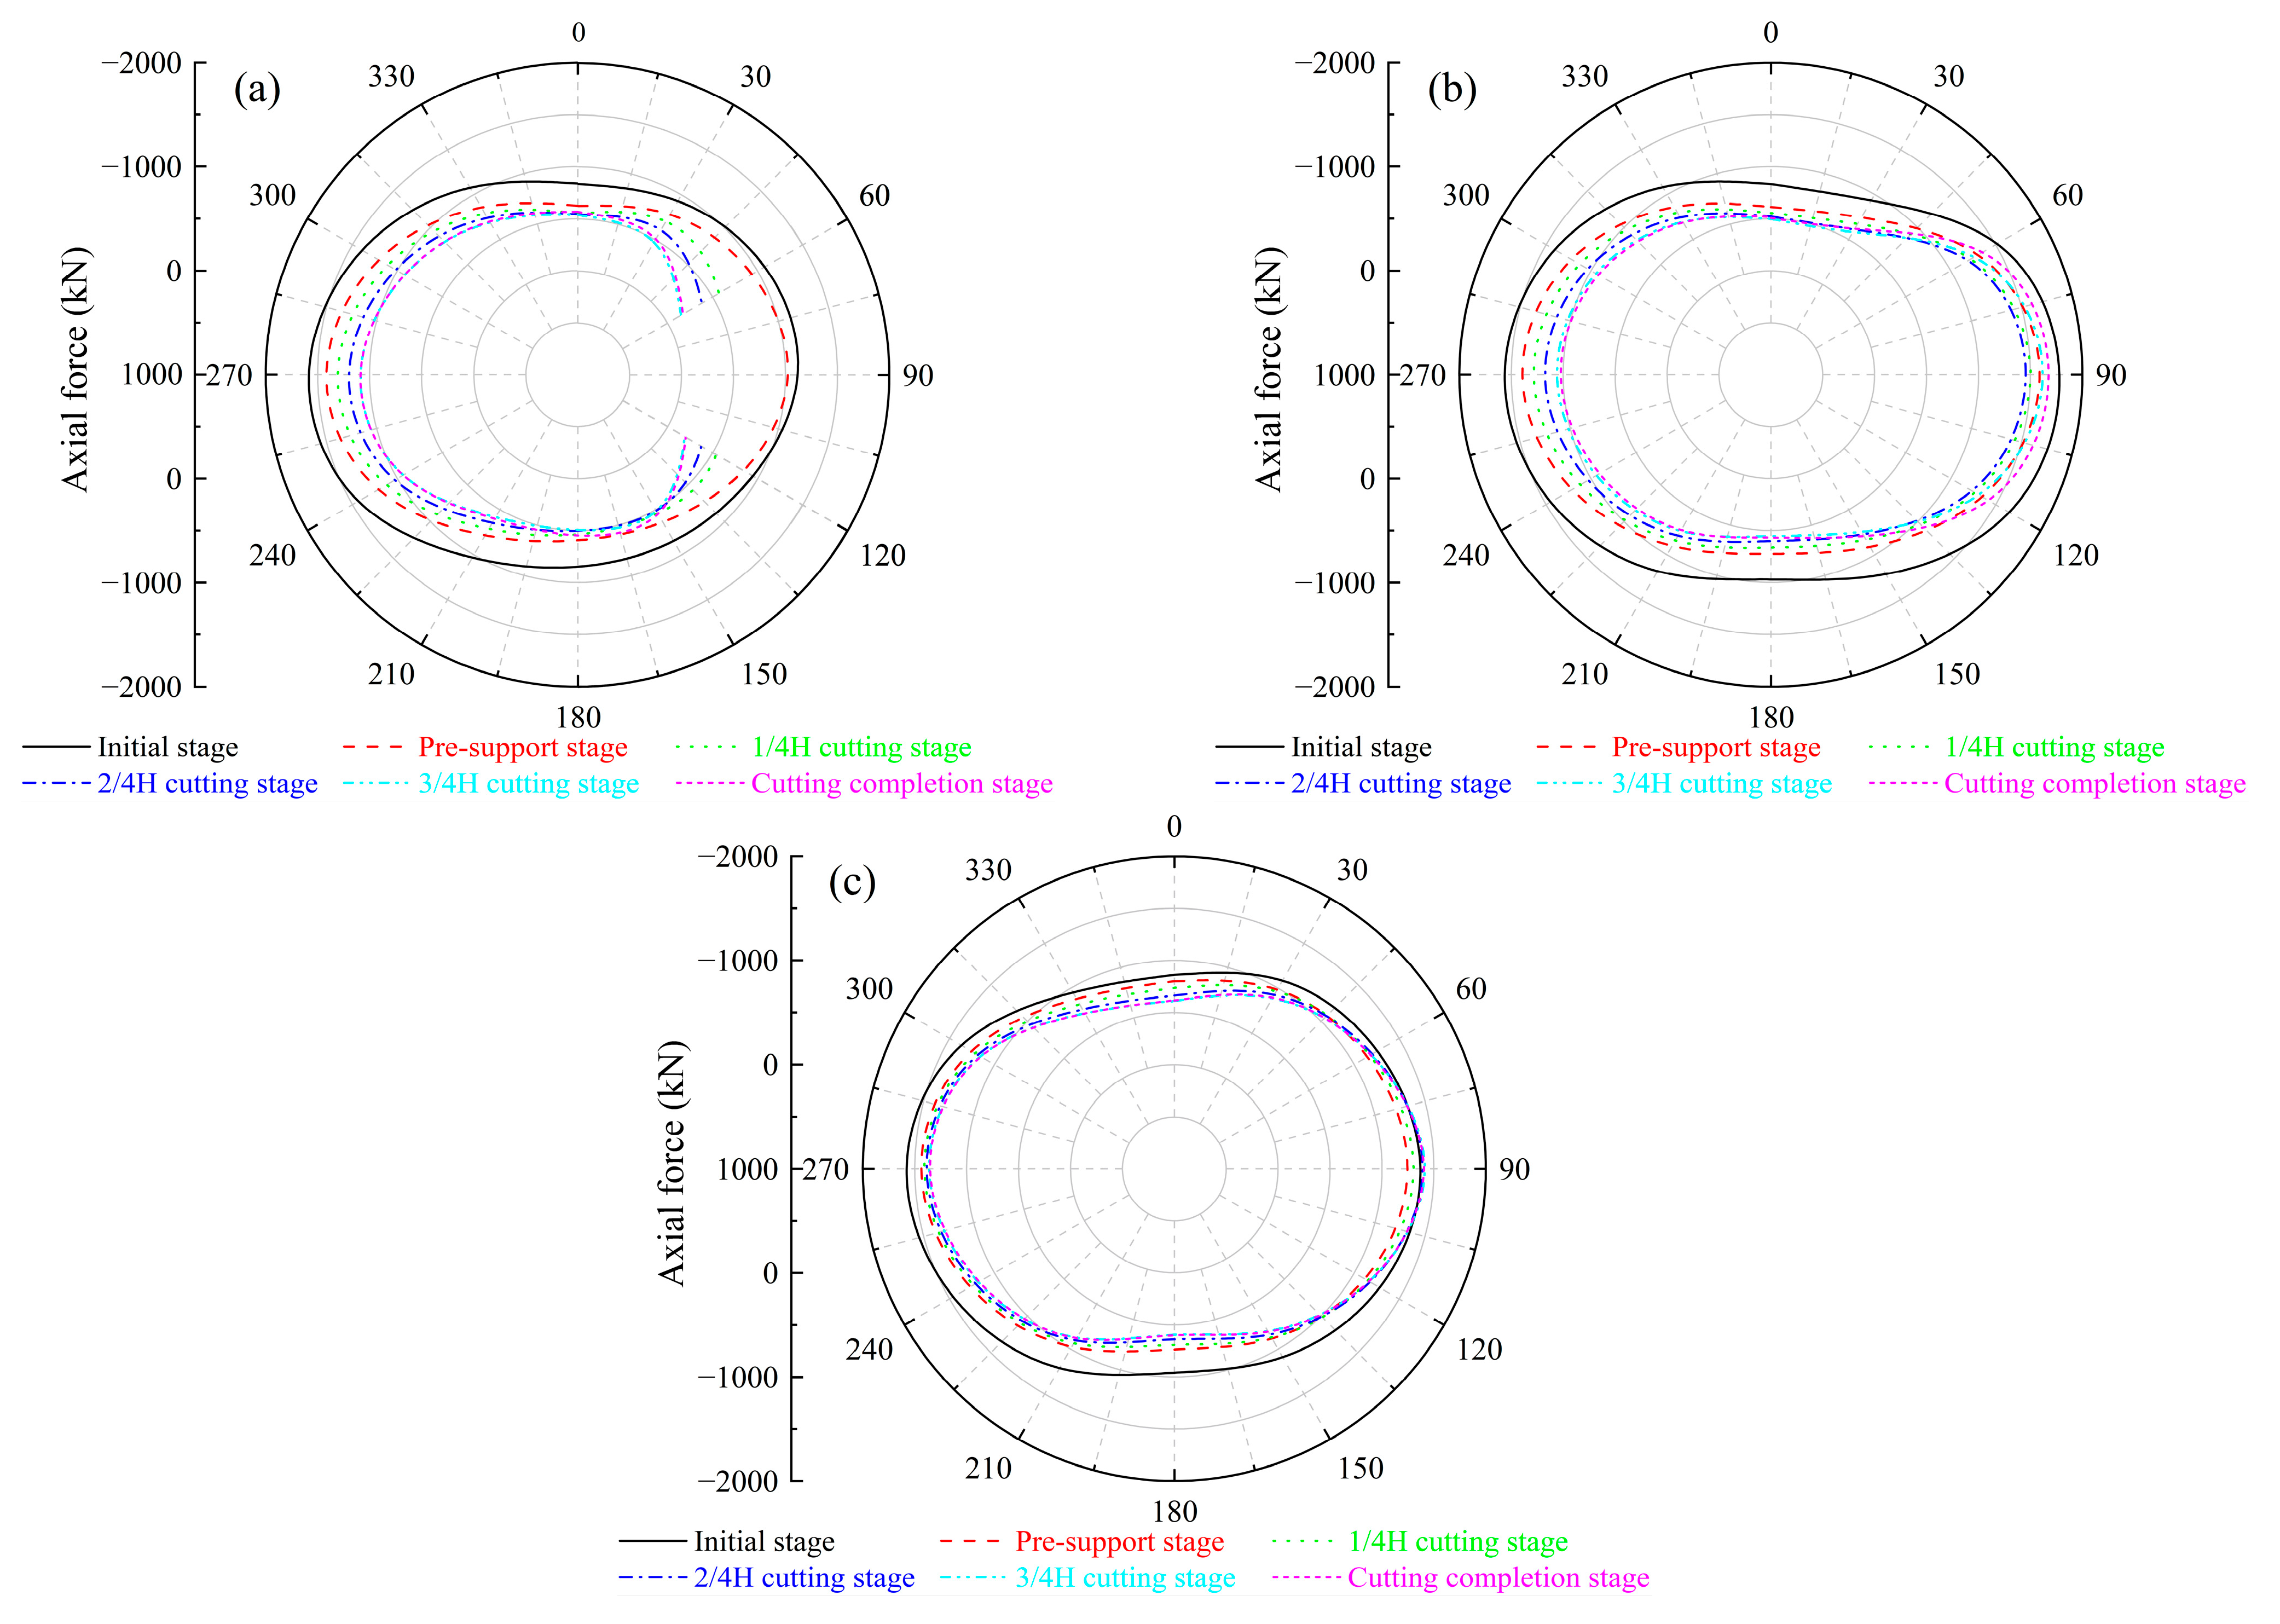
Understanding the changes in internal forces of the segments during the hole-breaking construction process helps assess the tunnel structure’s safety. Among these, the axial force and bending moment of the segments are key parameters for evaluating the tunnel’s stress state. Therefore, analyzing the distribution patterns of the axial force and bending moment is of great significance for ensuring the safety of the project.

4.3.1. Axial Force

The axial force distribution of the main tunnel in different construction stages is shown in Figure 15. Positive axial force values indicate that the segment is under tension, while negative values indicate that the segment is under compression. During the cutting process, each ring exhibits compressive axial force. From the initial stage to the pre-support stage, the axial force in all rings decreases, indicating that the internal support system effectively shares the external earth and water pressure, thereby improving the structural stress condition of the main tunnel. During the cutting stage, the axial force at the left arch waist of each ring decreases as the cutting thickness increases. This is due to the reduced integrity of the main tunnel, which weakens their resistance to deformation. Simultaneously, the thrust reaction force increases the outward deformation of the left arch waist segments, reducing the compressive force on their cross-sections. The axial force at the vault and arch bottom of each ring initially decreases and then increases. This is because the left and right arch waists are subjected to outward jacking force during the cutting process, causing tensile effects on the vault and arch bottom segments, thereby reducing their axial force. After the cutting is completed, due to the disappearance of the thrust force at the right arch waist, the tensile effect on the vault and arch bottom segments is reduced, leading to a certain degree of increase in their axial force.
As the segment in the 60° to 120° range of the cutting ring is gradually cut, the upper and lower ends of the opening progressively become cantilever structures, resulting in a reduced load transfer effect within the ring. After the cutting is completed, due to the support provided by the launching sleeve, the axial force at the upper and lower ends of the opening is 211 kN and 235 kN, respectively. At the 90° position of the semi-cutting ring, the axial force decreases by 158 kN from the pre-support stage to the 2/4 H cutting stage. From the 2/4 H cutting stage to the completion of the cutting stage, the axial force increases by 228 kN. This is likely because the 2/4 H cutting stage marks the turning point where the cutting ring alone can no longer bear the external load. As the cutting thickness further increases, the load borne by the cutting ring is gradually transferred to the adjacent rings with less damage through the inter-ring bolts and contact force, leading to an internal force redistribution. Consequently, the semi-cutting ring takes on a significant portion of the axial force lost by the cutting ring.

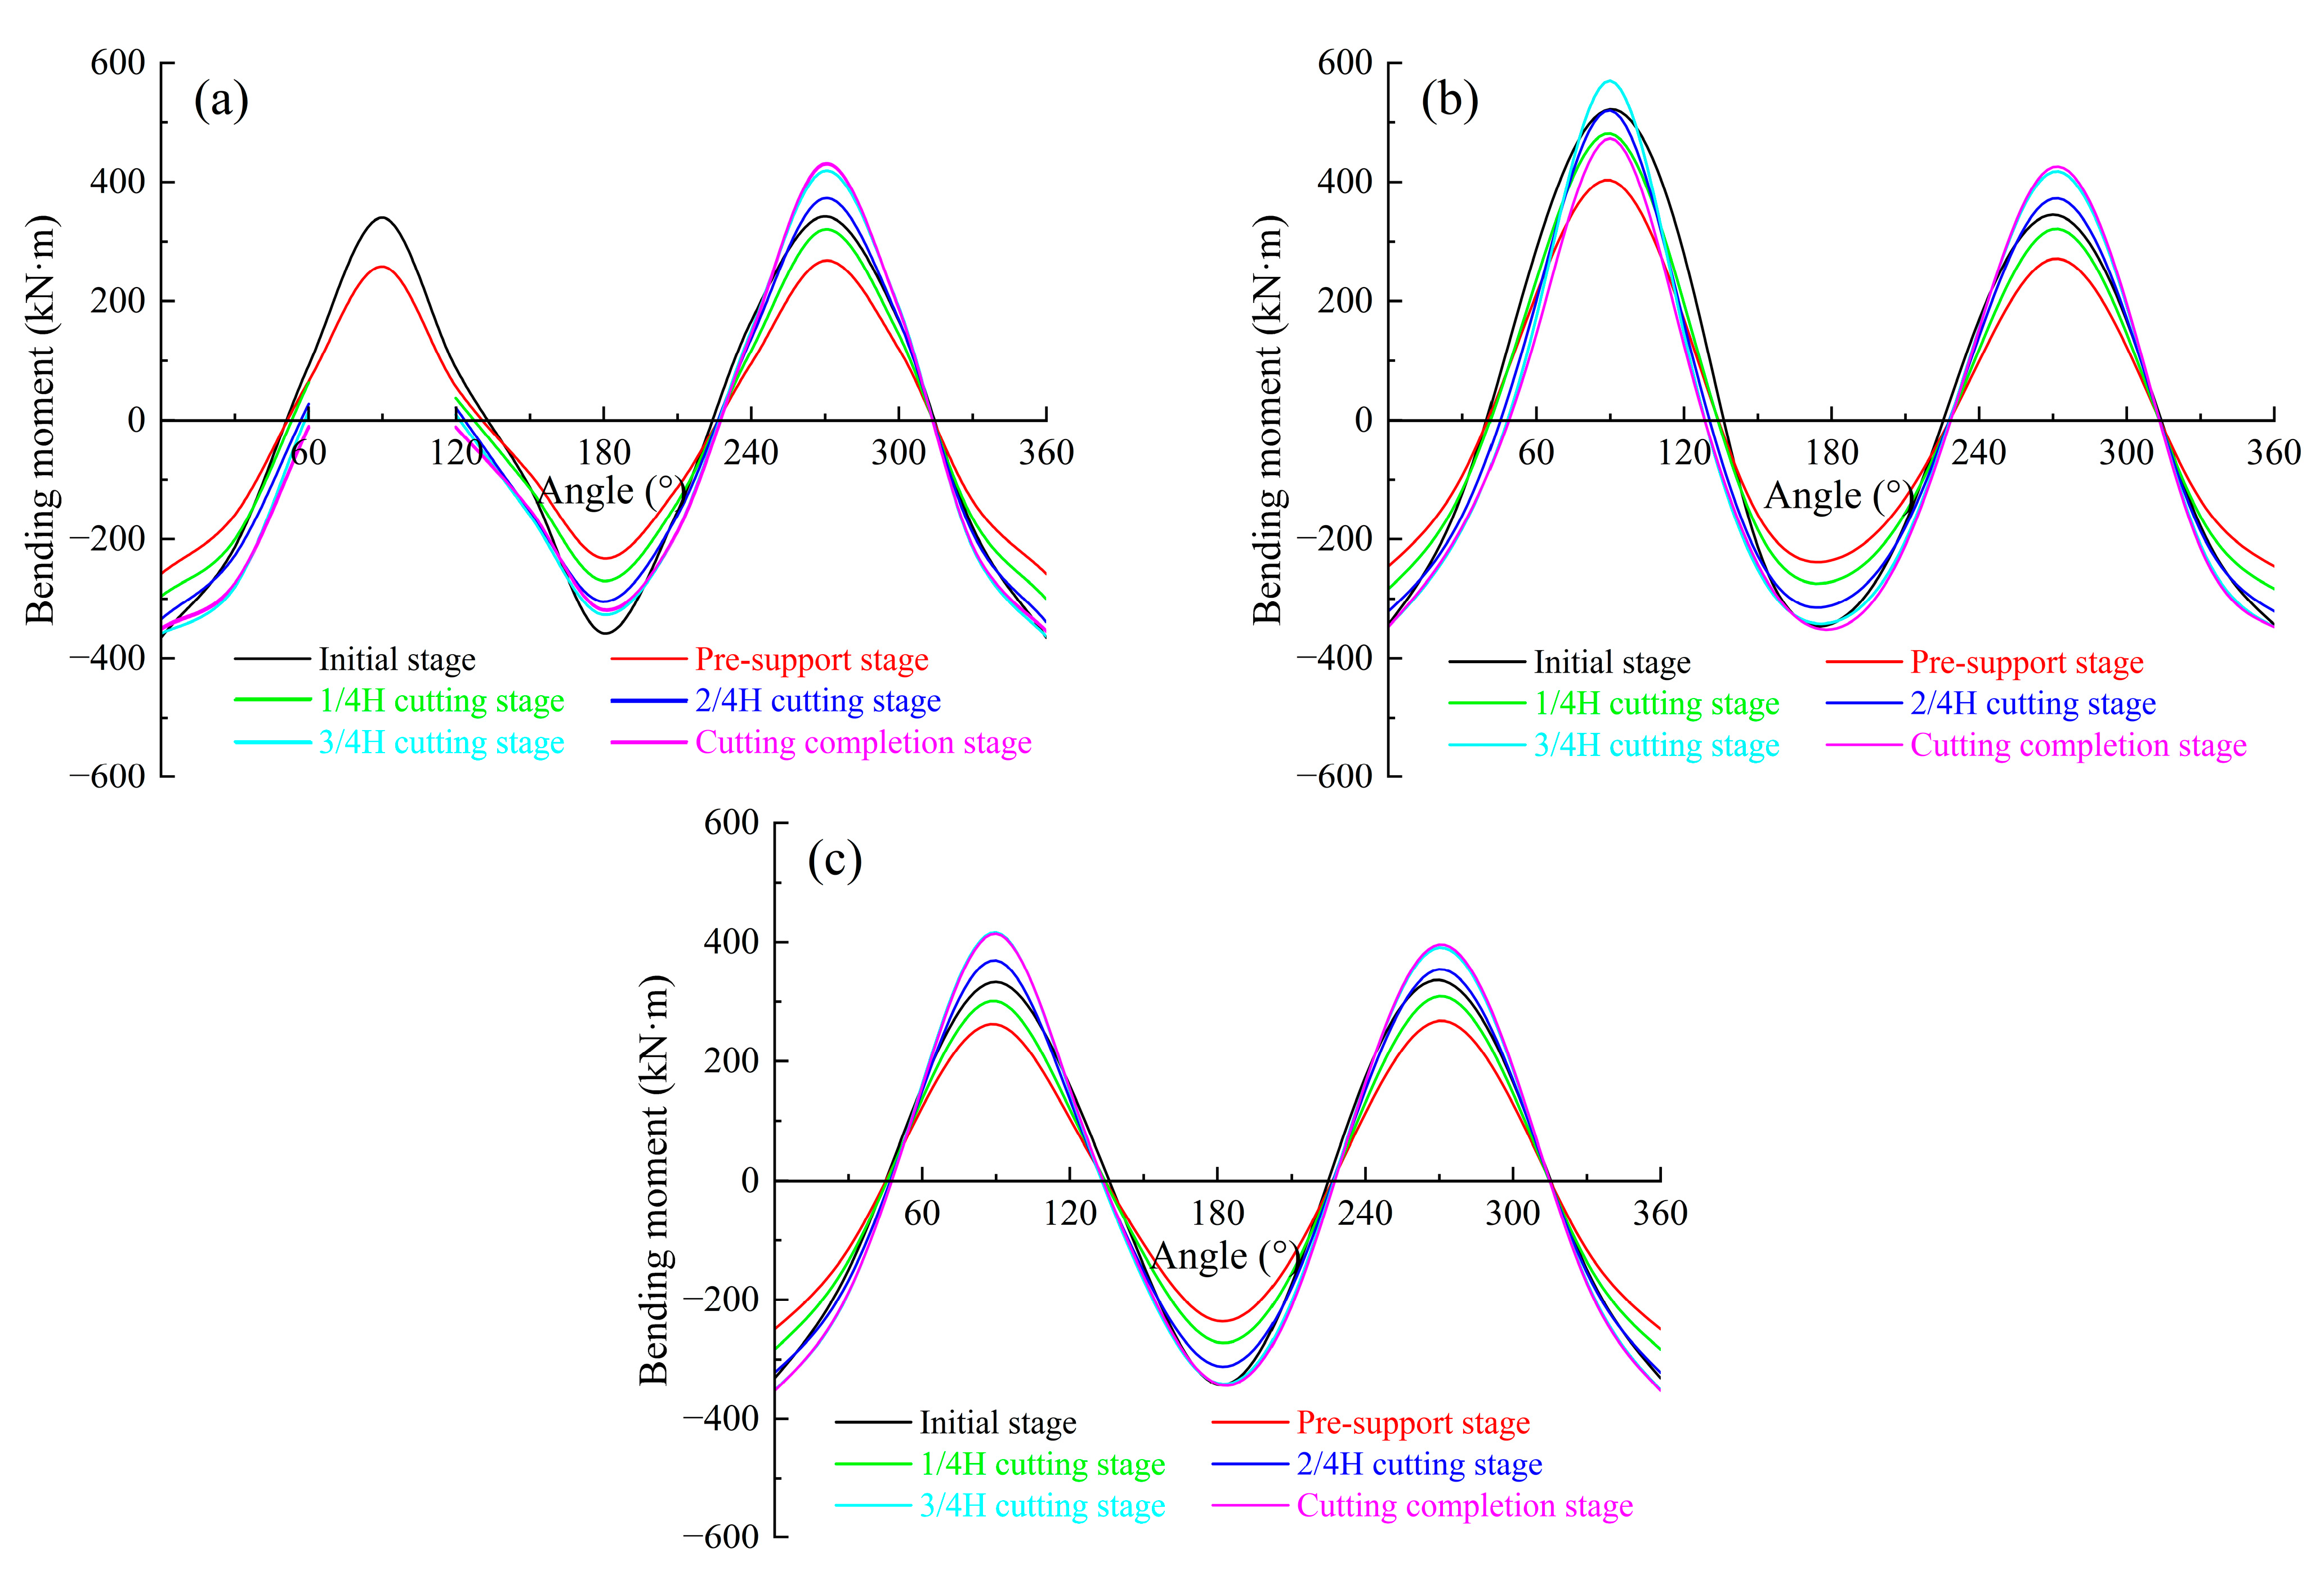
4.3.2. Bending Moment

The bending moment distribution of the main tunnel is shown in Figure 16. When the bending moment is positive, it indicates that the segment is bending outward. Conversely, when the bending moment is negative, it indicates that the segment is bending inward. From the initial stage to the pre-support stage, the bending moment of the main tunnel decreases under the influence of the pre-support force. The negative bending moment is larger at the top and bottom positions of the main tunnel, while the positive bending moment is greater at the left and right arch waist. As the thickness of the cut increases, the main tunnel’s capacity to resist deformation diminishes. Under the influence of ground load, the top and bottom of the tunnel deform inward, while the left and right arch waists bend outward, leading to a gradual increase in the tunnel’s bending moment. Due to the transfer of internal forces, the bending moment on the right side of the semi-cutting ring increases significantly.
As shown in Figure 15 and Figure 16, the axial force and bending moment of the main tunnel fluctuate within 2000 kN and 600 kN·m, respectively. Both values remain well below the maximum limits for the reinforced concrete segment, which are 3500 kN for axial force and 800 kN·m for bending moment [40].

5. Scope of Application

The pipe-jacking construction technology for cross passages is a new method developed in recent years. It offers technical advantages such as safety, efficiency, and environmental friendliness. This technology has played a positive role in promoting the development of underground space. It is suitable for the construction of cross passages in metro and highway tunnel sections. However, the technology is mainly applied to short-distance cross-passage construction. Based on current engineering experience, the passage length typically does not exceed 25 m. This is because, in pipe-jacking construction, the main tunnel bears the thrust reaction. As the thrust distance increases, the friction resistance between the cross passage and the surrounding soil gradually increases. This results in a higher required thrust reaction, which can affect the safety and stability of the main tunnel structure. Therefore, when the cross passage is relatively short, this technology can achieve good construction results.

6. Conclusions

This study employed a combination of field monitoring and numerical simulations to analyze the deformation and internal force variations of the main tunnel during the segment process. The conclusions were as follows.
(1)
Under the load of water and soil pressure, the cutting ring, semi-cutting ring, and adjacent ring all exhibit a horizontal elliptical shape. After the application of pre-support force, the degree of horizontal ellipticity of each ring is somewhat reduced. As the cutting thickness increases, the vertical diameter of the tunnel near the opening decreases while the horizontal diameter expands. Under the influence of the jacking resistance, a noticeable outward deformation occurs at the 270° position of the left arch waist of the tunnel.
(2)
As the cutting thickness gradually increases, the stress on the bolts in the main tunnel shows a consistent upward trend. Throughout this process, the stress on the circumferential bolts is significantly higher than that on the longitudinal bolts, indicating a greater concentration of stress in the circumferential bolts. Notably, the stress of the circumferential bolts near the opening rises to 550 MPa, which is approximately 86% of the yield strength of the bolts.
(3)
In the pre-supporting stage, the internal force of the main tunnel gradually decreases. After entering the cutting stage, the axial force at the upper and lower ends of the cutting ring opening is gradually reduced to about 0 kN, forming a cantilever effect. The load lost by the cutting ring is transmitted to the adjacent ring through the longitudinal bolt, resulting in a significant change in the internal force at the 90° position of the arch waist on the right side of the semi-cutting ring. This internal force redistribution mainly occurs in the 3/4 H cutting stage.

Author Contributions

Writing—original draft preparation, software, and investigation, X.L.; methodology, writing—review and editing, funding acquisition, Q.Z.; data curation and validation, X.Z. and M.J.; project administration and investigation, C.Y. All authors have read and agreed to the published version of the manuscript.

Funding

This research was funded by the Henan Provincial Science and Technology Research Project (Grant No. 242102320311) and Key Research Projects of Higher Education Institutions in Henan Province (Grant No. 25A560006).

Data Availability Statement

Data are contained within the article.

Conflicts of Interest

The authors declare no conflicts of interest.

References

  1. Cao, S.J.; Leng, J.; Qi, D.; Kumar, P.; Chen, T. Sustainable underground spaces: Design, environmental control and energy conservation. Energy Build. 2022, 257, 111779. [Google Scholar] [CrossRef]
  2. Qiao, Y.K.; Peng, F.L.; Sabri, S.; Rajabifard, A. Low carbon effects of urban underground space. Sustain. Cities Soc. 2019, 45, 451–459. [Google Scholar] [CrossRef]
  3. Cui, J.; Nelson, J.D. Underground transport: An overview. Tunn. Undergr. Space Technol. 2019, 87, 122–126. [Google Scholar] [CrossRef]
  4. Wang, L.; Chen, X.; Su, D.; Liu, S.; Liu, X.; Jiang, S.; Gao, H.; Yang, W. Mechanical performance of a prefabricated subway station structure constructed by twin closely-spaced rectangular pipe-jacking boxes. Tunn. Undergr. Space Technol. 2023, 135, 105062. [Google Scholar] [CrossRef]
  5. Wu, Y.Q.; Wang, K.; Zhang, L.Z.; Peng, S.H. Sand-layer collapse treatment: An engineering example from Qingdao Metro subway tunnel. J. Clean. Prod. 2018, 197, 19–24. [Google Scholar] [CrossRef]
  6. Zhang, S.; Cheng, X.; Yao, Y.; Zhu, K.; Li, K.; Lu, S.; Zhang, R.; Zhang, H. An experimental investigation on blockage effect of metro train on the smoke back-layering in subway tunnel fires. Appl. Therm. Eng. 2016, 99, 214–223. [Google Scholar] [CrossRef]
  7. Wang, H.; Gao, H. Study of blockage effects of metro train on critical velocity in sloping subway tunnel fires with longitudinal ventilation. Energies 2022, 15, 5762. [Google Scholar] [CrossRef]
  8. Feng, S.; Li, Y.; Hou, Y.; Li, J.; Huang, Y. Study on the critical velocity for smoke control in a subway tunnel cross-passage. Tunn. Undergr. Space Technol. 2020, 97, 103234. [Google Scholar] [CrossRef]
  9. Chen, T.B.Y.; Yuen, A.C.Y.; De Cachinho Cordeiro, I.M.; Liu, H.; Cao, R.; Ellison, A.; Yeoh, G.H. In-depth assessment of cross-passage critical velocity for smoke control in large-scale railway tunnel fires. Fire 2022, 5, 140. [Google Scholar] [CrossRef]
  10. Su, Z.; Li, Y.; Zhong, H.; Li, J.; Guo, Z.; Yang, X.; Yang, S. Advancements in smoke control strategies for metro tunnel cross-passage: A theoretical and numerical study on critical velocity and driving force. Tunn. Undergr. Space Technol. 2024, 147, 105734. [Google Scholar] [CrossRef]
  11. Liu, X.; Nowamooz, H.; Shen, Y.; Liu, Y.; Han, Y.; An, Y. Heat transfer analysis in artificial ground freezing for subway cross passage under seepage flow. Tunn. Undergr. Space Technol. 2023, 133, 104943. [Google Scholar] [CrossRef]
  12. Hou, S.; Yang, Y.; Cai, C.; Chen, Y.; Li, F.; Lei, D. Modeling heat and mass transfer during artificial ground freezing considering the influence of water seepage. Int. J. Heat Mass Transf. 2022, 194, 123053. [Google Scholar] [CrossRef]
  13. Li, Z.; Chen, J.; Sugimoto, M.; Ge, H. Numerical simulation model of artificial ground freezing for tunneling under seepage flow conditions. Tunn. Undergr. Space Technol. 2019, 92, 103035. [Google Scholar] [CrossRef]
  14. Zhou, J.; Zhao, W.; Tang, Y. Practical prediction method on frost heave of soft clay in artificial ground freezing with field experiment. Tunn. Undergr. Space Technol. 2021, 107, 103647. [Google Scholar] [CrossRef]
  15. Liu, X.; Shen, Y.; Zhang, Z.; Liu, Z.; Wang, B.; Tang, T.; Liu, C. Field measurement and numerical investigation of artificial ground freezing for the construction of a subway cross passage under groundwater flow. Transp. Geotech. 2022, 37, 100869. [Google Scholar] [CrossRef]
  16. Huang, D.W.; Chen, H.H.; Xu, C.J.; Feng, K.; Geng, D.X. Experimental study on influences of shield machine reception on existing shield tunnels during construction of connecting channels. Chin. J. Geotech. Eng. 2024, 46, 784–793. (In Chinese) [Google Scholar] [CrossRef]
  17. Li, X.; Li, P.; Liu, X.; Sun, L.; Cui, T.; He, K.; Guo, C. Surface subsidence pattern of construction of pipe jacking in water-rich sand layer cross passage measured and numerical simulation analysis. Structures 2024, 60, 105949. [Google Scholar] [CrossRef]
  18. Chen, X.; Ding, H.; Li, F.; Chen, X.; Gao, W.; Wang, H.; Wang, L.; Chen, H. Frost heave control measures for the frozen double-line tunnel undercrossing an operation station. J. China Coal Soc. 2024, 49, 172–180. (In Chinese) [Google Scholar] [CrossRef]
  19. Chen, P.; Liu, X.; Deng, Z.; Liang, N.; Du, L.; Du, H.; Deng, L.; Yang, G. Study on the pipe friction resistance in long-distance rock pipe jacking engineering. Undergr. Space 2023, 9, 173–185. [Google Scholar] [CrossRef]
  20. Wen, K.; Zeng, W.; Shimada, H.; Sasaoka, T.; Hamanaka, A. Numerical and theoretical study on the jacking force prediction of slurry pipe jacking traversing frozen ground. Tunn. Undergr. Space Technol. 2021, 115, 104076. [Google Scholar] [CrossRef]
  21. Deng, M.; Ding, F.; Liu, Y.; Huang, X.; He, Y.; Zhao, J. Surface settlement law of double-hole pipe-jacking tunnel undercrossing expressway. Sci. Rep. 2023, 13, 19286. [Google Scholar] [CrossRef]
  22. Ma, P.; Shimada, H.; Huang, S.; Moses, D.N.; Zhao, G.; Ma, B. Transition of the pipe jacking technology in Japan and investigation of its application status. Tunn. Undergr. Space Technol. 2023, 139, 105212. [Google Scholar] [CrossRef]
  23. Ding, J.; Dong, Z.; Mo, Z.; Jin, Y.; Ding, J.; Wang, N. Field experimental study on T-connected tunnel with pipe jacking method. Tunn. Constr. 2020, 40, 28–34. (In Chinese) [Google Scholar] [CrossRef]
  24. Li, Y.; Jin, X.; Lv, Z.; Dong, J.; Guo, J. Deformation and mechanical characteristics of tunnel lining in tunnel intersection between subway station tunnel and construction tunnel. Tunn. Undergr. Space Technol. 2016, 56, 22–33. [Google Scholar] [CrossRef]
  25. Yang, H.; Yu, L.; Wang, M.; Zhang, X. Analysis of mechanical response and failure characteristics of tunnels crossing active faults considering axial force and geometrical nonlinearity. Structures 2024, 64, 106583. [Google Scholar] [CrossRef]
  26. Zheng, H.; Li, P.; Ma, G.; Zhang, Q. Experimental investigation of mechanical characteristics for linings of twins tunnels with asymmetric cross-section. Tunn. Undergr. Space Technol. 2022, 119, 104209. [Google Scholar] [CrossRef]
  27. Gao, X.; Li, P.; Zhang, M.; Wang, H.; Jia, Z.; Feng, W. Effect of local openings on bearing behavior and failure mechanism of shield tunnel segments. Undergr. Space 2024, 16, 183–205. [Google Scholar] [CrossRef]
  28. Ke, W.; Shuaishuai, C.; Qianjin, Z.; Zheng, Z.; Jiahui, Z.; Yalin, Y. Mechanical mechanism analysis and influencing factors of subway cross passage construction. Lat. Am. J. Solids Struct. 2019, 16, e198. [Google Scholar] [CrossRef]
  29. Liu, J.; Shi, C.; Gong, C.; Lei, M.; Wang, Z.; Peng, Z.; Cao, C. Investigation of ultimate bearing capacity of shield tunnel based on concrete damage model. Tunn. Undergr. Space Technol. 2022, 125, 104510. [Google Scholar] [CrossRef]
  30. Zhao, S.; Wang, F.; Tan, D.; Yang, A. A deep learning informed-mesoscale cohesive numerical model for investigating the mechanical behavior of shield tunnels with crack damage. Structures 2024, 66, 106902. [Google Scholar] [CrossRef]
  31. Qian, W.; Tang, X.; Ma, X.; Wang, X. Mechanical Characteristics and Safety Evaluation of Tunnel Lining Structures in Karst Areas Under Heavy Rainfall Conditions. Buildings 2025, 15, 1756. [Google Scholar] [CrossRef]
  32. Liu, X.; Gao, Y.; Zhang, J.; Zhu, Y. Structural response of main tunnel linings during construction of connecting aisle by means of mechanized drilling. Chin. J. Geotech. Eng. 2020, 42, 951–960. (In Chinese) [Google Scholar] [CrossRef]
  33. Zhu, Y.; Gao, Y.; Dong, Z.; Liu, X. Full-scale experimental study on structural mechanism of T-connected tunnel constructed by pipe jacking method. Tunn. Constr. 2019, 39, 1392–1401. (In Chinese) [Google Scholar] [CrossRef]
  34. Lu, P.; Yuan, D.; Jin, D.; Luo, W.; Liu, M. Centrifugal model tests on the structural response of the shield tunnel when constructing cross passages by mechanical methods. Tunn. Undergr. Space Technol. 2022, 128, 104621. [Google Scholar] [CrossRef]
  35. Wang, J.; Li, F.; Chen, Z.; Li, B.; Zhu, J. Finite element analysis of T-joint of mechanical connecting channels. Adv. Mech. Eng. 2020, 12, 1–13. [Google Scholar] [CrossRef]
  36. Zhuo, Y.; Zou, D.; Chen, K.; Qu, Y.; Yi, G.; Tian, S. Improved double-phase-field algorithm based on scaled boundary finite element method for rock-like materials. Theor. Appl. Fract. Mech. 2025, 138, 104916. [Google Scholar] [CrossRef]
  37. Chen, K.; Zou, D.; Yi, G.; Nie, X.; Qu, Y. A flexible mixed-order formula for tetrahedron elements based on SBFEM. Comput. Geotech. 2024, 171, 106390. [Google Scholar] [CrossRef]
  38. Niu, X.; Xing, H.; Li, W.; Song, W.; Xie, Z. Impact of Multi-Defect Coupling Effects on the Safety of Shield Tunnels and Cross Passages. Buildings 2025, 15, 1696. [Google Scholar] [CrossRef]
  39. Wang, S.; Zhang, G.; Yu, Z.; Ya, Z. Numerical Study on Hydraulic Coupling and Surrounding Rock Deformation for Tunnel Excavation Beneath Reservoirs. Buildings 2025, 15, 1693. [Google Scholar] [CrossRef]
  40. Wu, X.; Sun, M.; Xia, Y.; Han, H.; Sun, Z. Research on evaluation method of lining safety based on ultimate bearing capacity curve of lining section. China J. Highw. Transp. 2020, 33, 160–169. (In Chinese) [Google Scholar] [CrossRef]
Figure 1. Stratigraphic distribution in the cross passage construction area.
Buildings 15 02175 g001
Figure 2. Main tunnel structure diagram: (a) the location structure of the hole, and (b) the Cross-section size diagram of the main tunnel.
Buildings 15 02175 g002
Figure 3. Structural drawing of internal support system: (a) field diagram of internal support structure, and (b) schematic diagram of internal support structure. Different colors in the figure indicate that the inner support is composed of different structural shapes.
Buildings 15 02175 g003
Figure 4. Numerical model of the main tunnel segment-cutting at the launching end. The different colors in the geological model represent different strata. The gray circular ring denotes the main tunnel, with the internal support structure located inside it.
Buildings 15 02175 g004
Figure 5. The construction structure schematic for each stage: (a) initial stage, (b) pre-support stage, and (c) cutting stage.
Buildings 15 02175 g005
Figure 6. The schematic diagram of the pipe-jacking machine cutting the main tunnel. In the figure, gray represents the main tunnel, blue represents the cutter head of the pipe jacking machine, and light blue represents the shield of the pipe jacking machine. The cutter head is in contact with the inner surface of the main tunnel.
Buildings 15 02175 g006
Figure 7. Circumferential stress variation curve of the left side of tunnel portal under different model sizes.
Buildings 15 02175 g007
Figure 8. The main tunnel strain monitoring point location map. The dotted box in (a) is the monitoring range, and the vertical dotted line is the axle wire. The dotted box in (d) is the side view of the right arch of the semi-cut ring in (c).
Buildings 15 02175 g008
Figure 9. Main tunnel strain field monitoring diagram.
Buildings 15 02175 g009
Figure 10. Comparison of calculated strain values and measured values during the pre-support stage: (a) cutting ring, (b) semi-cutting ring.
Buildings 15 02175 g010
Figure 11. Comparison of calculated strain values and measured values during the 2/4 H cutting stage: (a) cutting ring, (b) semi-cutting ring.
Buildings 15 02175 g011
Figure 12. The radial displacement of the main tunnel: (a) cutting ring, (b) semi-cutting ring, (c) adjacent ring, (d) horizontal ellipse deformation, and (e) cantilever effect.
Buildings 15 02175 g012
Figure 13. The Von Mises stress change of the circumferential bolts: (a) cutting ring (CR-1~6), (b) semi-cutting ring (SR-1~6), and (c) adjacent ring (AR-1~6).
Buildings 15 02175 g013
Figure 14. The Von Mises stress change of the longitudinal bolts: (a) longitudinal bolts between the cutting ring and semi-cutting ring, and (b) longitudinal bolts between the semi-cutting ring and adjacent ring.
Buildings 15 02175 g014
Figure 15. Axial force distribution of the main tunnel: (a) cutting ring, (b) semi-cutting ring, and (c) adjacent ring.
Buildings 15 02175 g015
Figure 16. Bending moment distribution of the main tunnel: (a) cutting ring, (b) semi-cutting ring, and (c) adjacent ring.
Buildings 15 02175 g016
Table 1. Physical and mechanical parameters of each soil layer.
Soil Layer NameThickness
h/(m)
Unit Weight
γ/(kN/m³)
Cohesion
c/(kPa)
Internal Friction Angle
φ/(°)
Compression Modulus
E0/(kPa)
Poisson’s Ratio
A1 miscellaneous fill0.818.011.216.580000.35
A2 plain fill1.418.512.818.282000.36
A31 clayey silt2.819.112.122.390000.35
A51 fine sand6.019.513015,0000.36
A52 fine sand22.519.823220,0000.36
Table 2. Physical parameters of structural materials.
Structure NameElastic Modulus
/GPa
Unit Weight
/(kN/m3)
Poisson’s Ratio
C50 concrete segment34.5250.20
steel-concrete composite segment60350.22
Glass fiber-reinforced concrete segment31.5250.20
Internal support system and bolt20678.50.25
Table 3. Model calculation information.
Model SizeNumber of ElementsComputation Time (h)
60 m (X) × 46.5 m (Y) × 40 m (Z)289,5364.8
70 m (X) × 61.5 m (Y) × 40 m (Z)398,0566.3
80 m (X) × 76.5 m (Y) × 40 m (Z)465,8248.5
Disclaimer/Publisher’s Note: The statements, opinions and data contained in all publications are solely those of the individual author(s) and contributor(s) and not of MDPI and/or the editor(s). MDPI and/or the editor(s) disclaim responsibility for any injury to people or property resulting from any ideas, methods, instructions or products referred to in the content.

