Article

Construction Concrete Price Prediction Based on a Double-Branch Physics-Informed Neural Network

1
School of Civil Engineering, Central South University, Changsha 410083, China
2
Faculty of Environment, Science and Economy, University of Exeter, Exeter EX4 4SB, UK
3
School of Civil Engineering, Zhengzhou University, Zhengzhou 450001, China
*
Author to whom correspondence should be addressed.
Buildings 2025, 15(13), 2171; https://doi.org/10.3390/buildings15132171
Submission received: 12 May 2025 / Revised: 17 June 2025 / Accepted: 20 June 2025 / Published: 22 June 2025
(This article belongs to the Section Construction Management, and Computers & Digitization)

Abstract

Traditional price prediction of construction material concrete often adopts macroeconomic indicators as independent variables. However, since there is often a closer relationship between the raw materials of construction concrete and the production of construction materials, the price prediction of construction concrete based on raw material prices can more directly ensure the prediction accuracy. Therefore, this study proposes a Double-Branch Physics-Informed Neural Network (DB-PINN) model based on both macroeconomic indicators and raw material price factors for the construction concrete price prediction. In particular, this model utilizes an Artificial Neural Network (ANN) as the baseline algorithm and incorporates physical constraints, such as a Multiple Linear Regression (MLR) model and a Vector Error Correction Model (VECM) to modify the loss function. To improve the prediction accuracy of the DB-PINN model, a feature analysis of the effect of the raw material price factors on the construction concrete price is conducted. Results showed that the proposed DB-PINN model has high accuracy in concrete price prediction. Further, to explore the specific ways in which macroeconomic indicators affect the concrete price prediction, a Marginal Effect Analysis (MEA) is conducted. Moreover, a comparative analysis using a traditional ANN model is conducted to verify the efficiency of the DB-PINN model, and a parameter sensitivity analysis is performed to reveal the impact of each raw material price factor and macroeconomic indicator on the construction concrete price. This study incorporates the introduction of raw material prices as input parameters for construction concrete price prediction, which facilitates the development of urban construction concrete price management in the pre-project phase.

1. Introduction

The rate of urbanization has been accelerating, and the amount of construction activity associated with it has also been increasing. According to a report by Statista, the urbanization rate in China rose from 26.41% in 1990 to 66.16% in 2024 [1]. By 2024, the cumulative sales revenue of commercial real estate in China was approximately 9.7 trillion yuan [2], and the corresponding construction area that Chinese developers had started by 2024 was expected to be 738.93 million square meters [3]. In this context, the prediction of building construction costs has been particularly important, as it involves significant financial outlays and affects the economic efficiency of the project [4]. It is evident to see that if reasonable predictions are not made during the building construction cost estimation stage, it can lead to a series of risks such as cost overruns [5]. Therefore, to correctly manage costs during the cost estimation phase, construction costs should be appropriately divided [6]. The main components of construction cost estimates typically include labor (20–40%), materials (30–40%), equipment (5–10%), indirect costs, costs associated with regulations and permits (5–10%), and additional supplier costs (2–5%) [7]. Although the proportion of construction costs varies depending on the type and function of a building during the construction process, construction materials usually account for the majority of total construction costs [8]. Among these materials, concrete is one of the most widely used materials in modern construction [9], and the fluctuations in building concrete prices can significantly influence overall project costs. Thus, it is essential to accurately predict and effectively manage construction concrete prices. It is worth noting that, considering that the relevant Chinese standards such as JGJ 55–2011 do not specify a fixed raw material ratio for concrete with the same compressive strength [10], the dosage regulations for sand and coarse aggregate in its calculation formula are both given in the form of ranges, indicating that it may pose uncertainty to calculate the price of concrete based on known raw material prices by accumulating them through a linear cost function under an incomplete dataset. Samuel and Snapp [11] also pointed out that relying on a single formula to estimate concrete prices may be difficult to popularize due to sequential and subjective calculations of labor costs, material costs, and quantities, while different measurement units for various materials may also increase the workload due to conversions. Moreover, the neural network method, through a data-driven approach in artificial intelligence (AI) and parametric engineering cost estimation modeling, can automatically learn the complex nonlinear mapping relationship between the historical information on price influencing factors and the final cost of construction [12] to predict the price of concrete.
In this case, this study proposes a Double-Branch Physics-Informed Neural Network (DB-PINN) model based on both macroeconomic indicators and raw material price factors for construction concrete price prediction. This model utilizes an Artificial Neural Network (ANN) as the baseline algorithm and incorporates physical constraints to modify the loss function. It is noted that the raw material price is used as the independent variable of one branch, while the independent variable of the other branch in the same model uses representative macroeconomic indicators, thus forming a comprehensive framework that considers both raw materials and the macroeconomic level (Section 3). This study takes the top four cities in Guangdong Province of China in terms of Gross Domestic Product (GDP) as the case study (Section 4). To improve the prediction accuracy of the DB-PINN model, a feature analysis of the effect of the raw material price factors on the construction concrete price is conducted. Further, a Marginal Effect Analysis (MEA) is conducted to investigate the specific ways in which macroeconomic indicators affect the prediction result of the construction concrete price. A comparative analysis using a traditional ANN model is performed to verify the efficiency of the DB-PINN model, along with a parameter sensitivity analysis of raw material prices and macroeconomic indicators. The results show that compared with a traditional ANN model, the proposed DB-PINN model has significant reliability in terms of generalization ability and prediction accuracy.

2. Literature Review

New technologies, such as AI, are currently reshaping the operation model of the construction industry, including cost management [13]. Matel et al. [14] showed that the accuracy of cost predictions for construction projects can be improved by adopting enhanced techniques such as ANNs and using statistical and predictive models to simulate the functions of the human brain. In addition, Liu et al. [15] conducted a review of data-driven construction material price prediction models in 2024 and summarized the main economic indicators used in causal model research related to construction economic issues. Peško et al. [16] compared the effectiveness of ANNs and Support Vector Machine (SVM) in predicting construction costs and project duration for road construction and landscaping work and concluded that an acceptable level of accuracy for assessing construction costs at the initial stage of the tendering process should be within ±15%. Juszczyk et al. [17] conducted research on using ANNs for estimating the construction cost of sports fields, which demonstrated that ANNs can process complex relationships between independent and dependent variables, automate training process knowledge, collect real-world examples as the basis for building and storing knowledge, and predict future data that has not yet been presented. Chandanshive et al. [18] developed an ANN-based self-learning model to provide initial construction costs estimation by consulting with professionals in the construction industry to determine the most important factors affecting construction costs. Ahmadu et al. [19] conducted an integrated model that combines a Backpropagation Neural Network (BPNN) and an autoencoder to predict the prices of construction materials in Nigeria that are susceptible to price fluctuations, such as steel and cement. The model uses 12 influencing factors such as the Producer Price Index (PPI), Consumer Price Index (CPI), and inflation rate. Bassioni et al. [20] pointed out that the price of steel and cement (the main cost components of reinforced concrete) are influenced by factors such as production process costs, raw material prices, energy prices, macroeconomic variables, and industry-related factors. Though time series analysis is a good prediction technique under stable economic and industry conditions, it cannot predict sudden macroeconomic or other unexpected events. Shiha et al. [21] implemented a model to predict the price of steel and Portland cement six months in advance, with a focus on predicting individual material prices. They also pointed out that the data used in future research should cover a period exceeding 10 years. Hosny et al. [22] implemented Autoregressive Integrated Moving Average (ARIMA) and Multiple Linear Regression (MLR) to predict the prices of steel, cement, brick, and ceramic materials in the Egyptian construction market. Mir et al. [23] proposed an ANN-based method to address the problem of high uncertainty in material prices in traditional machine learning methods. The optimal Lower Upper Bound Estimation (optimal LUBE) method was used to train the ANNs to generate prediction intervals for uncertainty quantification, with the independent variables still limited to common macroeconomic factors such as CPI, GDP, and PPI.
Although many studies have applied the ANN method to predict the construction concrete price, it is worth noting that most studies published so far have focused on using various macroeconomic factors or project-level parameters as input features. Some studies have indicated that the factors affecting the concrete price include the raw materials price, such as those of steel, cement, wood, copper, and petroleum products [24], relevant studies based on the raw materials price for the concrete price prediction are still lacking. Previous research has shown that the prices of certain materials exhibit bidirectional causality [25], meaning that the change in the price of one material can significantly affect another material, such as “concrete products” and “sand, gravel, and coarse aggregate”. This highlights an important implication in current research, that is, fluctuations in the price of a material can cause a series of ripple effects in the supply chain system, as materials are interconnected and interrelated.
On the other hand, lacking knowledge of physical laws renders data-driven ANN models inherently opaque and lacking in interpretability. Furthermore, such models typically demand extensive datasets. In contrast, Physics-Informed Neural Networks (PINNs), pioneered by Raissi et al. [26,27], offer a promising alternative. PINNs approximate underlying physical principles and effectively address complex nonlinear problems by harnessing neural networks’ self-learning capacity while embedding physical laws. This is achieved by augmenting the standard neural network loss function (which minimizes weights and biases) with constraints derived from physics. Consequently, PINNs have demonstrated significant utility across diverse disciplines, including solid mechanics [28], fluid mechanics [29], transport in porous media [30], structural engineering [31], and so on. Accordingly, the integration of physical constraints within a PINN framework shows great potential for constructing a reliable data-driven model for concrete price prediction.

3. Methodology

3.1. DB-PINN Prediction Model

To realize highly accurate construction concrete price prediction, this study proposes a DB-PINN model based on both macroeconomic indicators and raw material price factors, and this model has two features. Firstly, the DB-PINN model utilizes an ANN as the baseline algorithm and incorporates physical constraints to modify the loss function. For the establishment of the PINN, the key point is to embed the physical knowledge into the loss function of the ANN network, and since there are two types of factors affecting the price of concrete, the corresponding physical knowledge contains two types. In particular, for raw material price, compared to the nonlinear impact of macroeconomic indicators on commodity prices due to indirect effects [32,33,34], changes in raw material prices have more direct and significant impacts on fluctuations in concrete prices [25]. Although the nonlinear relationship between raw material prices and concrete prices exists [10], for the convenience of research, assuming an approximately linear relationship between raw material prices and concrete prices, the MLR model can be used to quantify the linear impact of each independent variable on the dependent variable [35]. To more clearly explore the cost transmission relationship between raw material prices and concrete prices, an MLR model is constructed, in which the dependent variable P m l r is the price of concrete and the independent variables X 1 , X 2 ,   X n are the selected raw material price factors. The corresponding function expression is as follows:
P m l r = β 0 + β 1 X 1 + β 2 X 2 + β n X n + ϵ
where n is the number of raw material price factors, β 0 is the interception, β n is the regression coefficients, and ϵ is the error term. For macroeconomic indicators, this study adopts the Vector Error Correction Model (VECM) to predict the price of construction concrete using economic indicators that capture the long-term equilibrium relationship between economic variables while revealing the short-term imbalance adjustment process [36,37]. In contrast to the traditional vector autoregressive (VAR) model, the VECM introduces an error correction term, which allows for the model to deal with non-stationary time series data with cointegrating relationships and to understand the possible long-run equilibrium relationship between these series. The functional expression of the model is shown below:
Δ Y t = α β Y t 1 + i = 1 k   Γ i Δ Y t i + ϵ t
where Y t is the endogenous variable vector at time t; Δ Y t is the first difference, which captures the short-term fluctuations or changes of endogenous variables; α is the error correction coefficient; β is the cointegration vector; Γ i is the dynamic coefficient; and ϵ t is the error term. The expression of the improved loss function of the DB-PINN model is expressed as:
L o s s TOTAL = λ 1 L M S E + λ 2 L M L R + λ 3 L V E C M
where λ 1 controls the degree of fit of the model to the actual observed data; λ 2 and λ 3 control the degree to which the model complies with physical constraints, as controlling the relative weights of different regular terms is a common strategy in regularization modeling [38]. While L M S E is the Mean Square Error (MSE) loss function, L M L R is the sum-control MLR regularization term and L V E C M is the VECM regularization term, and the corresponding functional expressions are shown as follows:
L M S E = 1 N t = 1 N   P ˆ c , t P c , t 2
L M L R = 1 N t = 1 N   P ˆ c , t P m l r , t 2
L V E C M = 1 N t = 1 N   P ˆ c , t P v e c m , t 2
where P ˆ c , t is the predicted value at moment t, P c , t is the true value, n is the sample size, and P v e c m , t is the “ideal” construction concrete price obtained by the VECM. Obviously, this PINN model regards the MLR term and the VECM term as structural constraints and embeds those into its loss function. This addition ensures that the prediction of the ANN can enforce an approximately linear relationship between raw material prices and concrete prices, while also capturing long-term equilibrium adjustments from macroeconomic indicators. It is worth emphasizing that the modelling objectives of these two types of physical laws represented by MLR and VECM regularization terms are orthogonal: MLR constrains instantaneous linear responses, while VECM constrains long-term cointegration trends. The two terms impose constraints on model parameters in the short and long-time scales, respectively, forming multidimensional regularization, thereby effectively improving the generalization ability of the model and reducing the risk of overfitting.
Secondly, the DB-PINN model proposed in this study employs double-branch architecture. The input of Branch 1 is related to the raw material prices, and Branch 2 is related to the macroeconomic indicators. This mechanism allows for the combination of the predicted basic concrete price corresponding to the material level with the modulation factor ( M t ) for the construction concrete price corresponding to the macroeconomic level, and the final concrete price prediction is obtained through a dynamic adjustment mechanism. In particular, Branch 1 of the DB-PINN model processes raw material prices with two hidden layers of 64 neurons to produce a base concrete price prediction, while Branch 2 processes macroeconomic indicators to yield a modulation factor that adjusts the base price, also with two hidden layers of 64 neurons. Both branches apply the Rectified Linear Unit (ReLU) as the activation function to avoid the gradient vanishing problem. It is worth noting that, considering the different price shares of the constituent materials of concrete, before prediction, it is necessary to characterize the raw materials prices to improve the accuracy of the predictions. Therefore, a linear regression-based feature analysis is needed to determine which raw material price factors significantly affect concrete price fluctuations, thus providing a basis for selecting model inputs and guiding subsequent parameter design.
For error evaluation indexes, this study adopts MSE, root mean square error (RMSE), mean absolute error (MAE), mean absolute percentage error (MAPE), and determination coefficient (R2) to evaluate the prediction accuracy of the DB-PINN model. MSE is the mean of the squared errors reflecting the extent to which the predicted values deviate from the actual values, RMSE takes the square root of MSE, MAE is the mean value of absolute error, MAPE is a dimensionless error metric expressed in percentage terms, and R2 is a dimensionless performance metric that measures the proportion of variance in the observed data that is explained by the model. The corresponding expressions are shown as follows:
MSE = 1 N i = 1 N   ( y i true y i pred ) 2
RMSE = MSE
MAE = 1 N i = 1 n y i true y i pred
MAPE = 100 % N i = 1 n   y i true y i pred y i true
R 2 = 1 i = 1 N   ( y i true y i pred ) 2 i = 1 N   ( y i true y - ) 2
where n is the total number of data samples, y i true is the actual value, and y i pred is the predicted value. These indicators have been used in multiple studies to evaluate model performance, while the R2 is more explanatory and should be used as a more heavily weighted evaluation indicator [39]. The research procedure based on the proposed DB-PINN model is shown in Figure 1.

3.2. Research Procedure

This section outlines the overall research design adopted in this study. It includes the data sources and preprocessing method, selection of input variables, modelling, and the validation strategies used to evaluate model performance. In this study, the features of raw material prices of construction concrete are analyzed after section of collecting and preprocessing data, determining which corresponding parameters that have a greater effect on construction concrete prices should be selected. For raw material price, due to differences in transportation distance and production methods, the cost of construction materials in different regions varies greatly [40]. This study thus limits the scope of raw material price data collection to a specific region to ensure that there is a valuable correlation between raw material prices, while the adoption of macroeconomic indicators referred to Skitmore’s [41] research, which studied the impact of the market on construction prices and found a positive correlation between construction prices and new orders. In addition, Tajani et al. [42] proposed the selling price of construction, the total transaction volume of construction, and the total number of buildings as key variables affecting construction costs. Based on previous the research literature [15,21,23], eight representative macroeconomic indicators are adopted in this study, and the corresponding contents and interpretations of those indicators are shown in Appendix A. Further, a case study is conducted to validate the accuracy and efficiency of the DB-PINN model based on the actual data collected in the top 4 cities in Guangdong Province of China in terms of GDP, and an MEA of the DB-PINN model is implemented to assess the impact of macroeconomic indicators on the prediction result of the construction concrete price. Finally, to verify the efficiency of the DB-PINN model proposed in this study, a comparative analysis using the traditional ANN model is conducted, and a parameter sensitivity analysis is performed to reveal the impact of the raw material price factor and the macroeconomic indicator on the construction concrete price. The applied research methods are described as below:
  • Data collection
This study takes the top 4 cities in Guangdong Province of China in terms of GDP as examples to investigate the price prediction of construction concrete. Considering the recommendation of Shiha et al. [21] that the period of collected data for predicting construction material prices should exceed ten years, this study collects monthly data on all independent variables from 2012 to 2024. Specifically, the construction material price data includes the information prices of finished C30 concrete with 20 mm coarse aggregate (hereinafter referred to as concrete) and its components: 42.5-grade cement (hereinafter referred to as cement), medium-graded sand (hereinafter referred to as sand), 20 mm coarse aggregate, water, concrete admixture, and transportation cost. The price of concrete and its raw materials is sourced from the information price released by the Guangdong government agency. It should be noted that, considering the accessibility of data, the relevance of the price components of construction materials, and the context of the widely implemented bill of quantities pricing model in China [43], the concrete prices analyzed in this study refer to common mass concrete rather than reinforced concrete, which requires consideration of various actual construction process costs. For the macroeconomic indicators, in addition to the data of loan interest rate that comes from the China Economic Information Center (CEIC) database, all data is released by the National Bureau of Statistics of China (NSBC).
The data of monthly cement production, cumulative real estate construction area, and cumulative real estate investment released by the NBSC are missing in January and February each year. The reason is that the data for January and February is combined and released due to the public holiday in the Spring Festival [44]. Therefore, it is necessary to process this part of the missing data. The processing of missing values is a key step in data preprocessing and can directly affect the accuracy of the analysis results [45]. In this study, the processing of missing values is achieved through time-based interpolation (TBI), which is a method that infers missing values based on time intervals and adjacent data points. In this study, only three monthly datasets of macroeconomic indicators have missing data for January and February, and the proportion of data requiring interpolation accounted for only 3.57% of the total dataset. Under these circumstances, TBI is a proven method to be implemented [46]. The missing values can be calculated using the linear interpolation formula. For missing time points, the expression of the interpolation value v is expressed as
v = v 1 + ( v 2 v 1 ) × t t 1 t 2 t 1
where t 1 and t 2 are the two closest non-missing time points, respectively; v 1 and v 2 are the corresponding values, respectively.
  • Data preprocessing
To improve the predictive performance of the DB-PINN model, standardization is used to ensure that all features are compared in the same dimension in this study. For various data features, their units and dimensions may be different. Direct analysis may produce errors or lead to the impact of certain features being ignored [47]. Therefore, this study converts the data to a mean of 0 and a standard deviation of 1 through standardization. Z-score normalization is a technique commonly used to standardize data that involves placing the geometric center of data points at the origin of the coordinates, while making the variance of the projections of these points on each axis equal to 1 [48]. The expression is given as
z = (x − μ)/σ
where x is the raw data value, μ is the sample mean, and σ is the sample standard deviation. This standardization method means that the dimensions of different characteristics no longer bias the analysis results. When the value ranges of two characteristics are different, they are compared based on the standard deviation instead of the absolute value through Z-score standardization.
  • Feature Analysis
With the purpose of comparing the weights of the raw material price factors that lead to the fluctuation in concrete prices to explore what kind of raw material prices should be included in the prediction of construction concrete prices, this study takes the data of Foshan City as an example and conducts a linear regression analysis on the relationship between the concrete price and corresponding raw material prices.
  • Marginal Effect Analysis
To further explore the specific mechanisms by which macroeconomic indicators affect concrete prices, after introducing physical constraints into the DB-PINN model, partial dependence plots (PDPs) are adopted to conduct the MEA analysis of each input macroeconomic indicator in the DB-PINN model on concrete price prediction. The PDP is a useful tool for interpreting complex machine learning models because it can illustrate the marginal effect of one or two features on the prediction result [49].
  • Comparison Analysis
To verify the efficiency of the DB-PINN model proposed in this study, a comparative analysis is conducted using a traditional ANN model. The traditional ANN model includes an input layer with 8 macroeconomic indicators (as shown in Appendix A), while the number of its hidden layers, the number of neurons in each hidden layer, and the selection of activation functions are the same as those of the DB-PINN model.
  • Parameter Sensitivity Analysis
A parameter sensitivity analysis is conducted to reveal the impact of the raw material price factors and the macroeconomic indicators on the construction concrete price in this study. In addition, the Pearson correlation analysis is conducted to further analyze the impact of each raw material price factor and macroeconomic indicator on the concrete price.

4. Results and Discussion

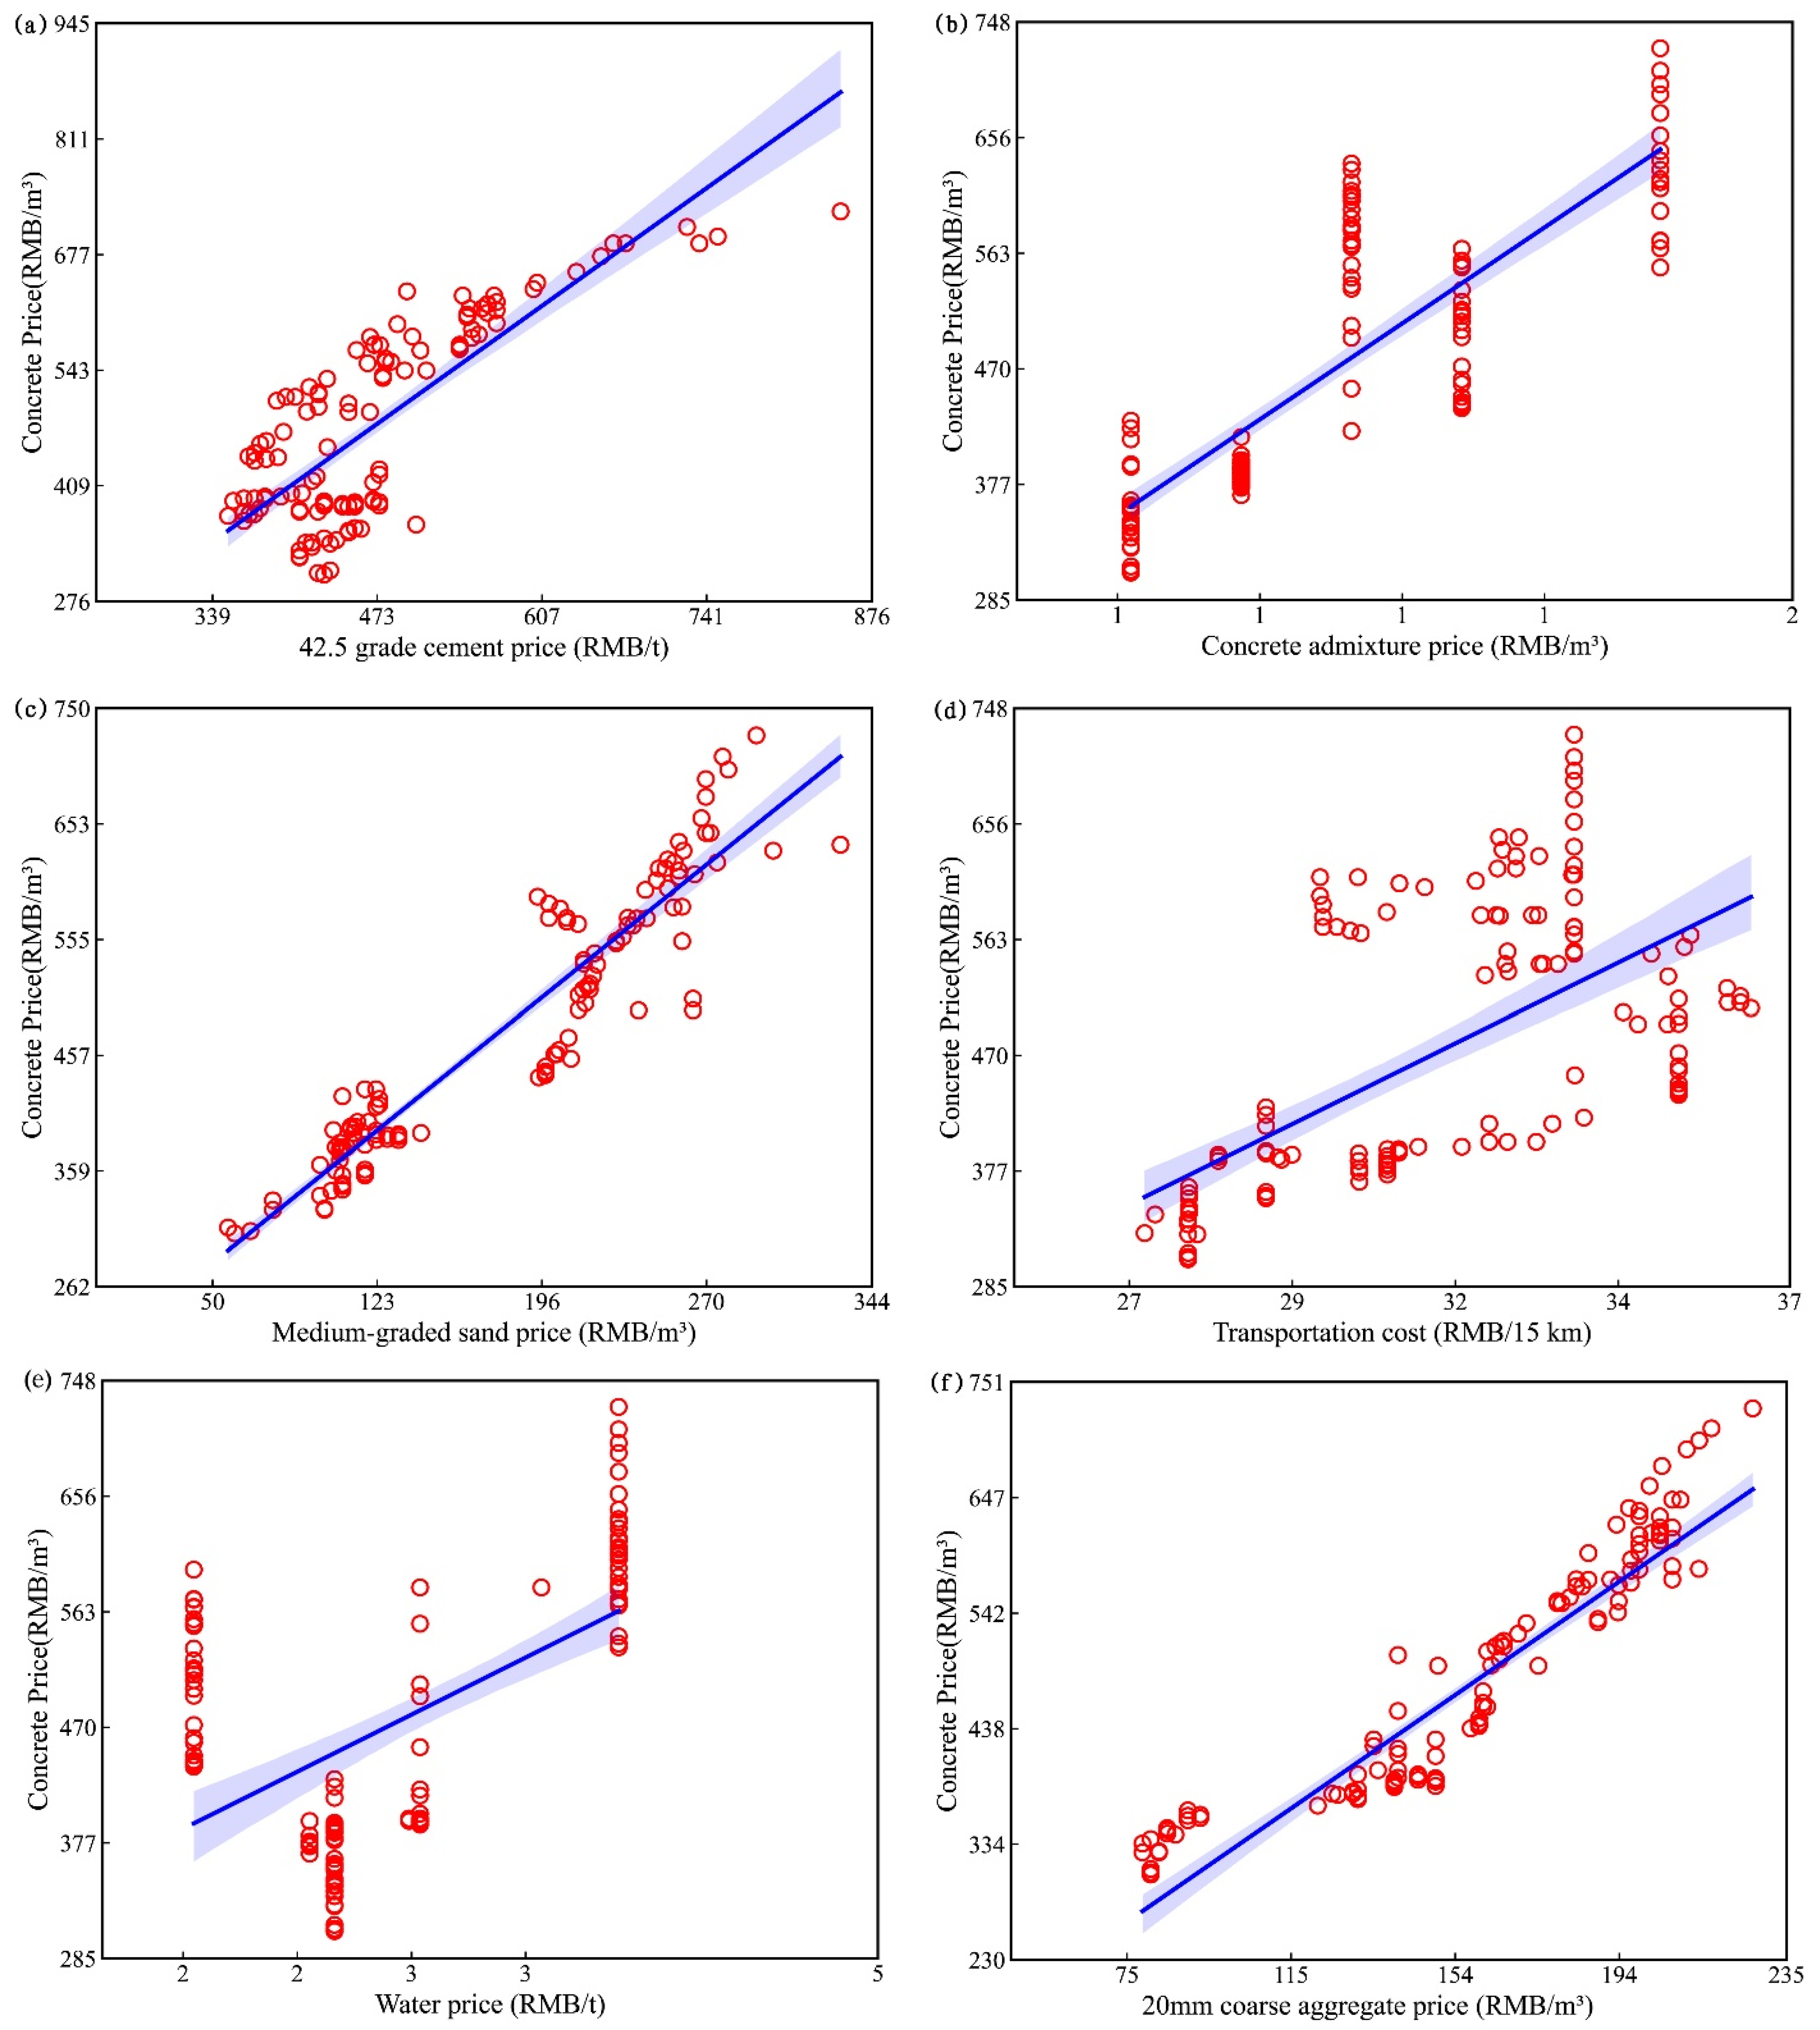
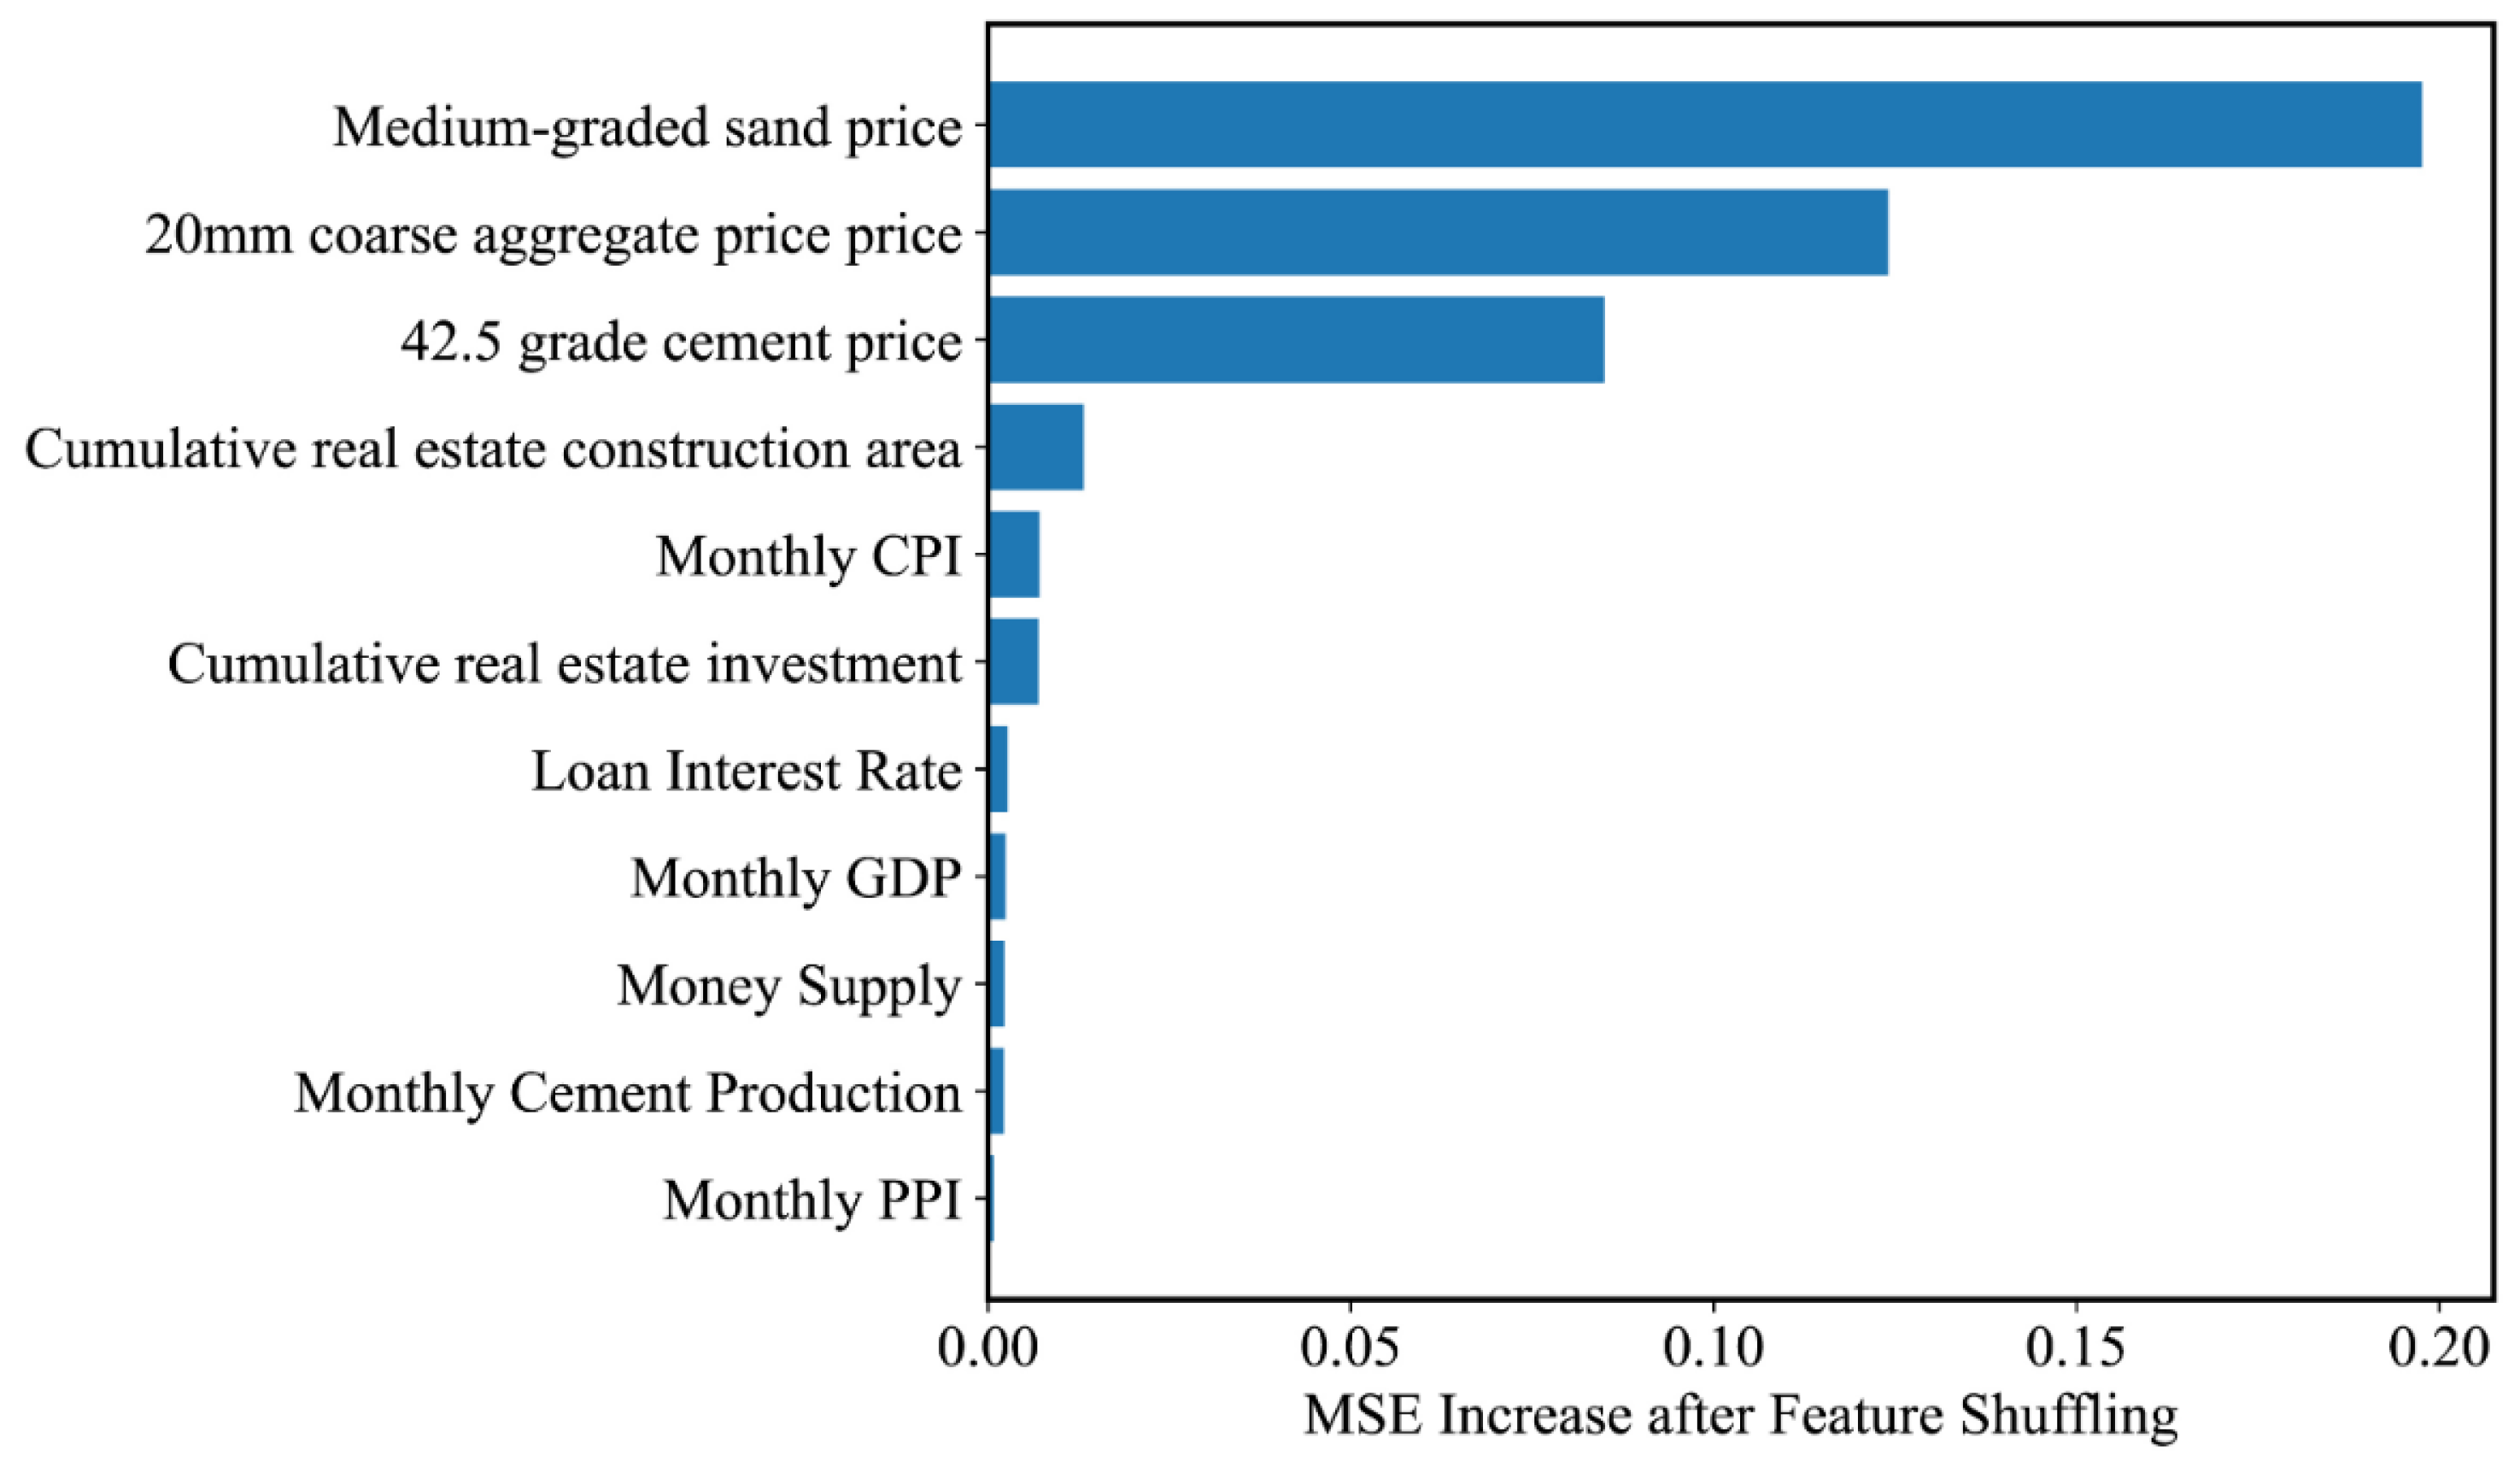
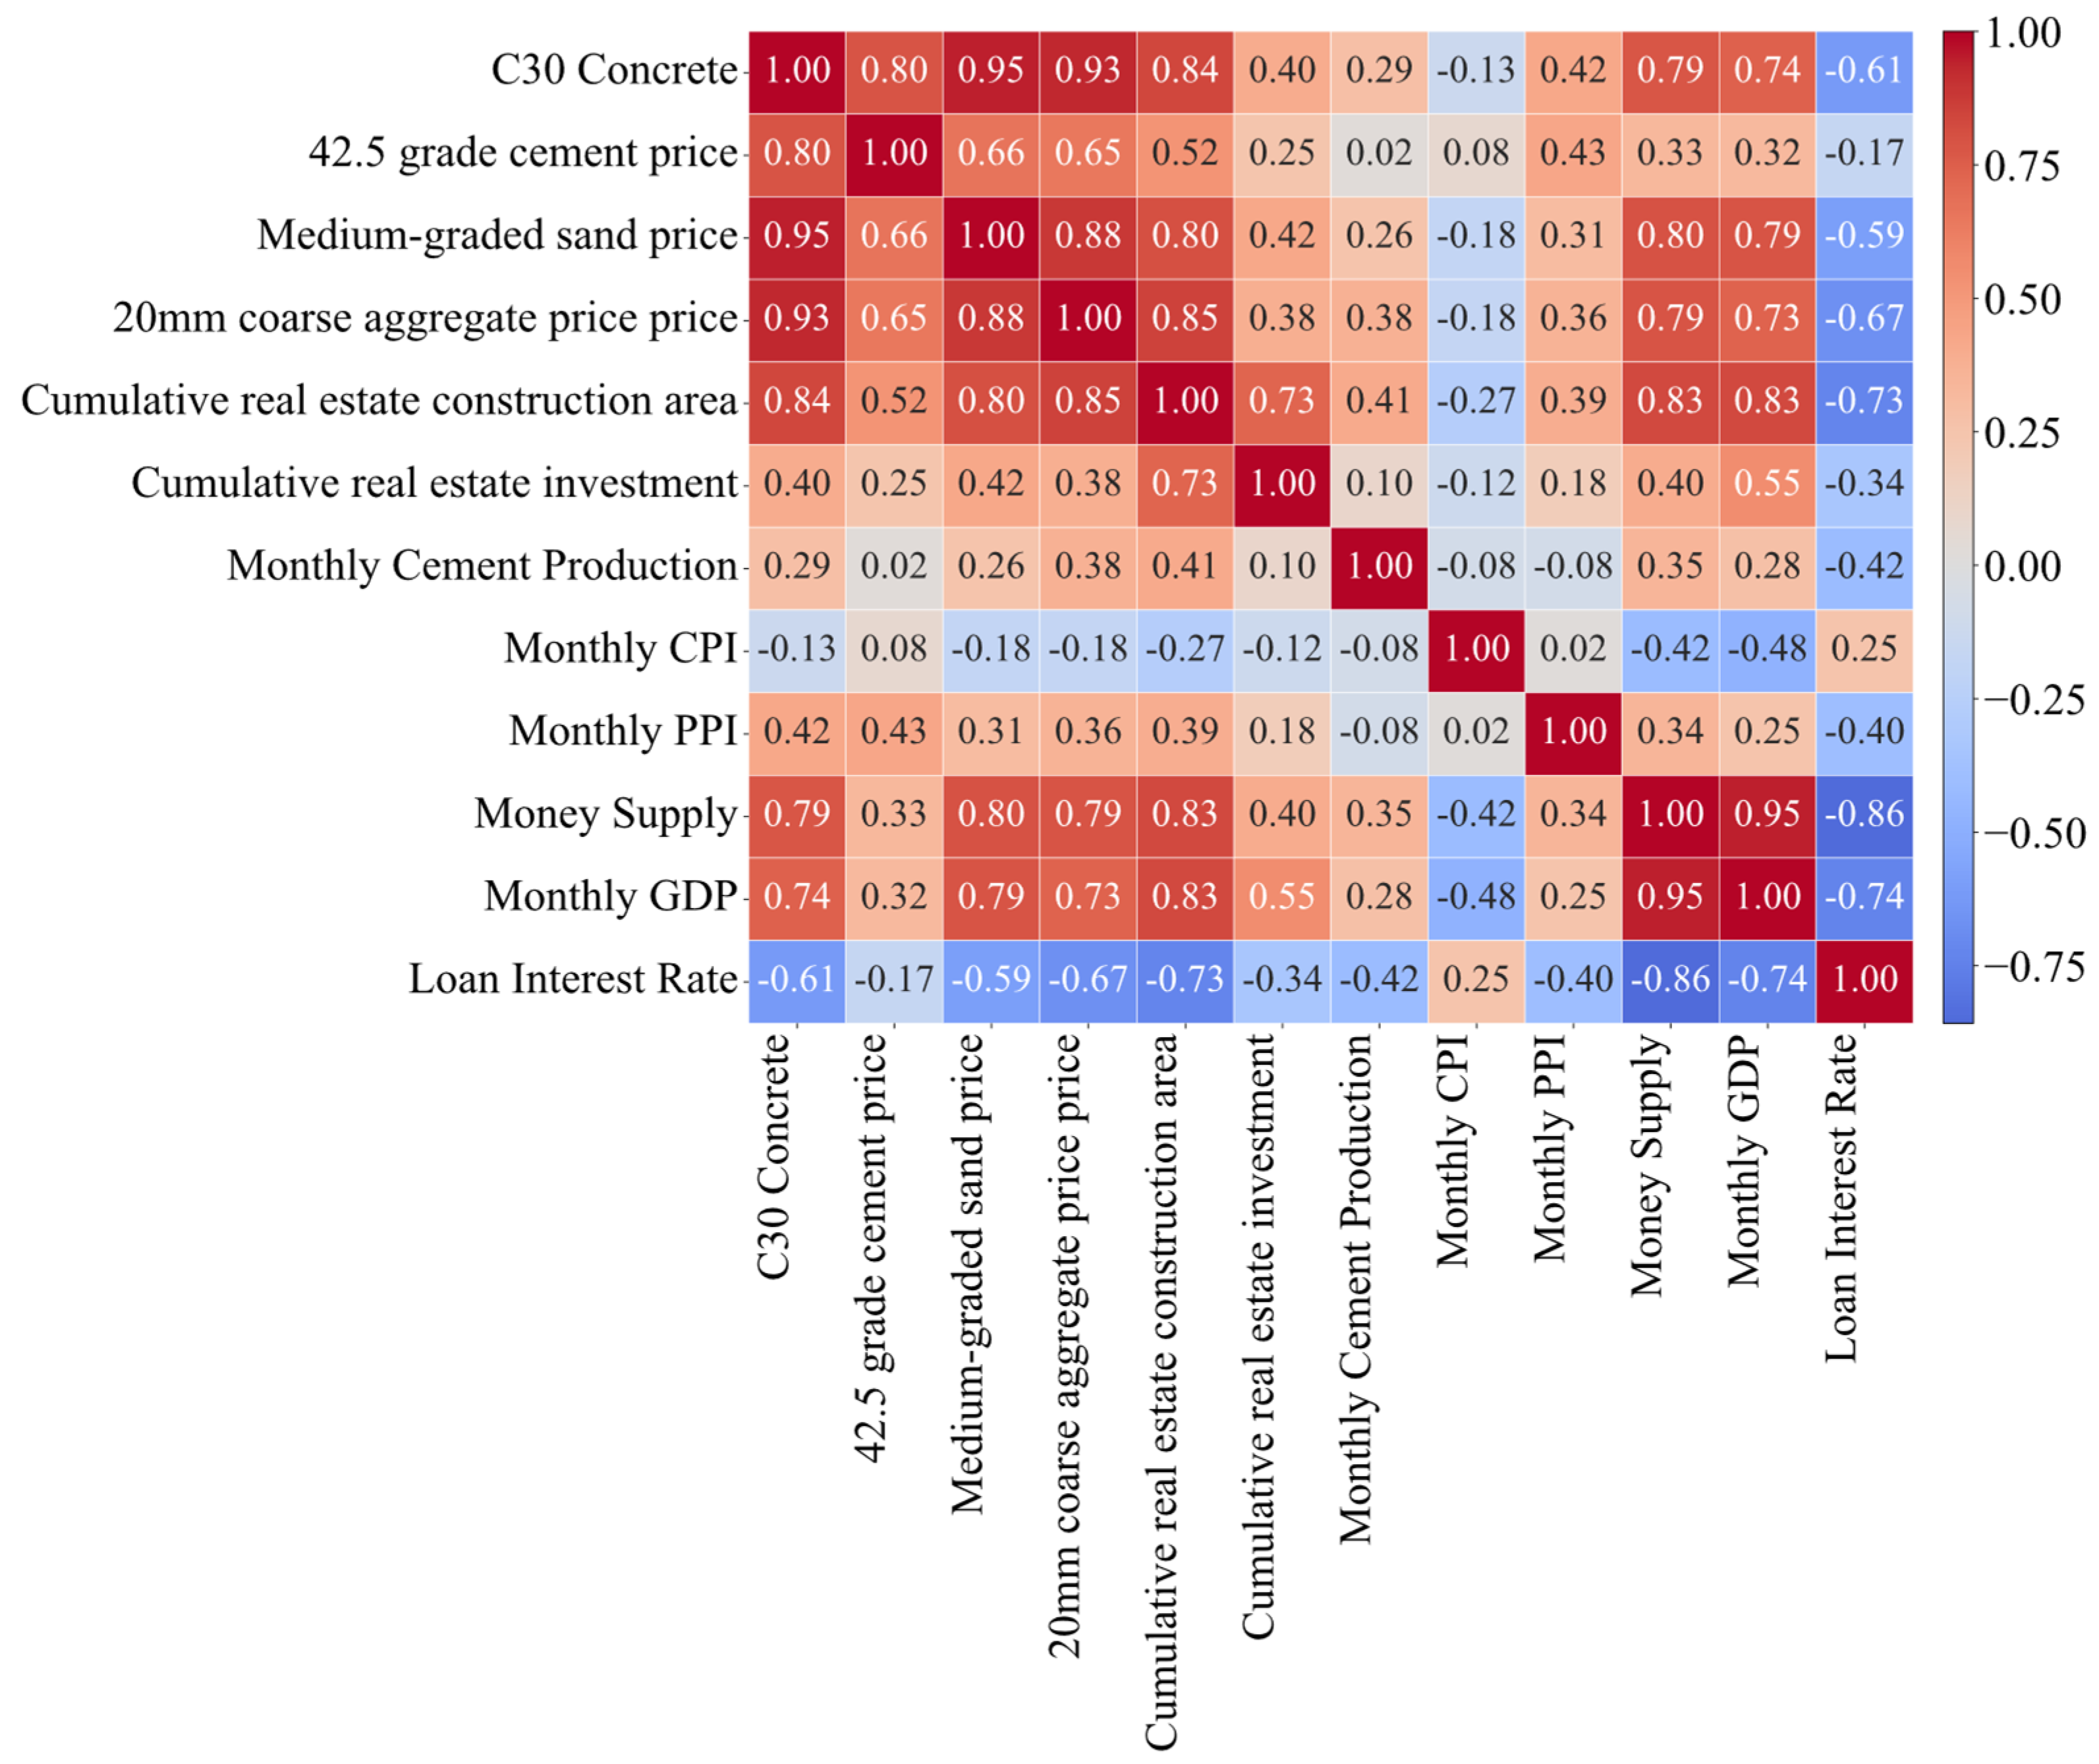
4.1. Result of Feature Analysis

The relationship between raw material prices and concrete prices is demonstrated in Figure 2. The slope of the regression line for cement was 1.02, the intercept was −0.40, and the confidence interval was [0.89, 1.14], indicating that an increase in cement prices directly drives an increase in concrete prices. The positive correlation between the price of sand and the price of concrete was also more significant, the slope of the regression line was 1.53, the intercept was 205.54, and the confidence interval was [1.29, 1.61], which indicated that the increase in the price of sand can significantly push up the price of concrete. The positive correlation between 20 mm coarse aggregate prices and concrete prices was even more pronounced, with a regression line slope of 2.58, an intercept of 497.73, and a confidence interval of [2.56, 2.74], indicating that an increase in the price of 20 mm coarse aggregate can significantly increase concrete prices. The water prices, concrete admixture prices, and transportation cost did not demonstrate a linear relationship with concrete prices compared to cement, sand, and 20 mm coarse aggregate. In particular, the actual price of water remained nearly constant throughout the dataset, and this lack of variation made capturing meaningful statistical correlations using linear regression challenging. Similarly, concrete admixture prices fluctuated relatively little, suggesting that their cost structure may have remained relatively stable over time. For transportation cost, although it showed some degree of fluctuation over time, its impact on concrete prices did not necessarily reflect valuable fluctuations. This is because the information price of transportation cost published by the government department is a cost within a fixed transport range, and the actual transport distances may change depending on factors such as project location and producer selection. The additional complexity introduced by these changes makes it difficult to establish a direct linear relationship between transportation cost and the price of concrete. Therefore, in the subsequent DB-PINN prediction model, only the more influential features (cement, sand, and 20 mm coarse aggregate) are retained as input variables. It is important to note that although there is an approximately linear relationship between the prices of these three dominant raw materials and concrete prices, the univariate marginal trends explored in this section are only used for the selection of input variables and not for the joint relationship under the multivariate, which is an important factor in concrete price prediction in this study. Furthermore, the ability of an ANN to adapt to linear models usually depends on the parameter settings in the specific training process [50]. Therefore, it is still theoretically feasible to use ANN models to make predictions based on selected features in this study.

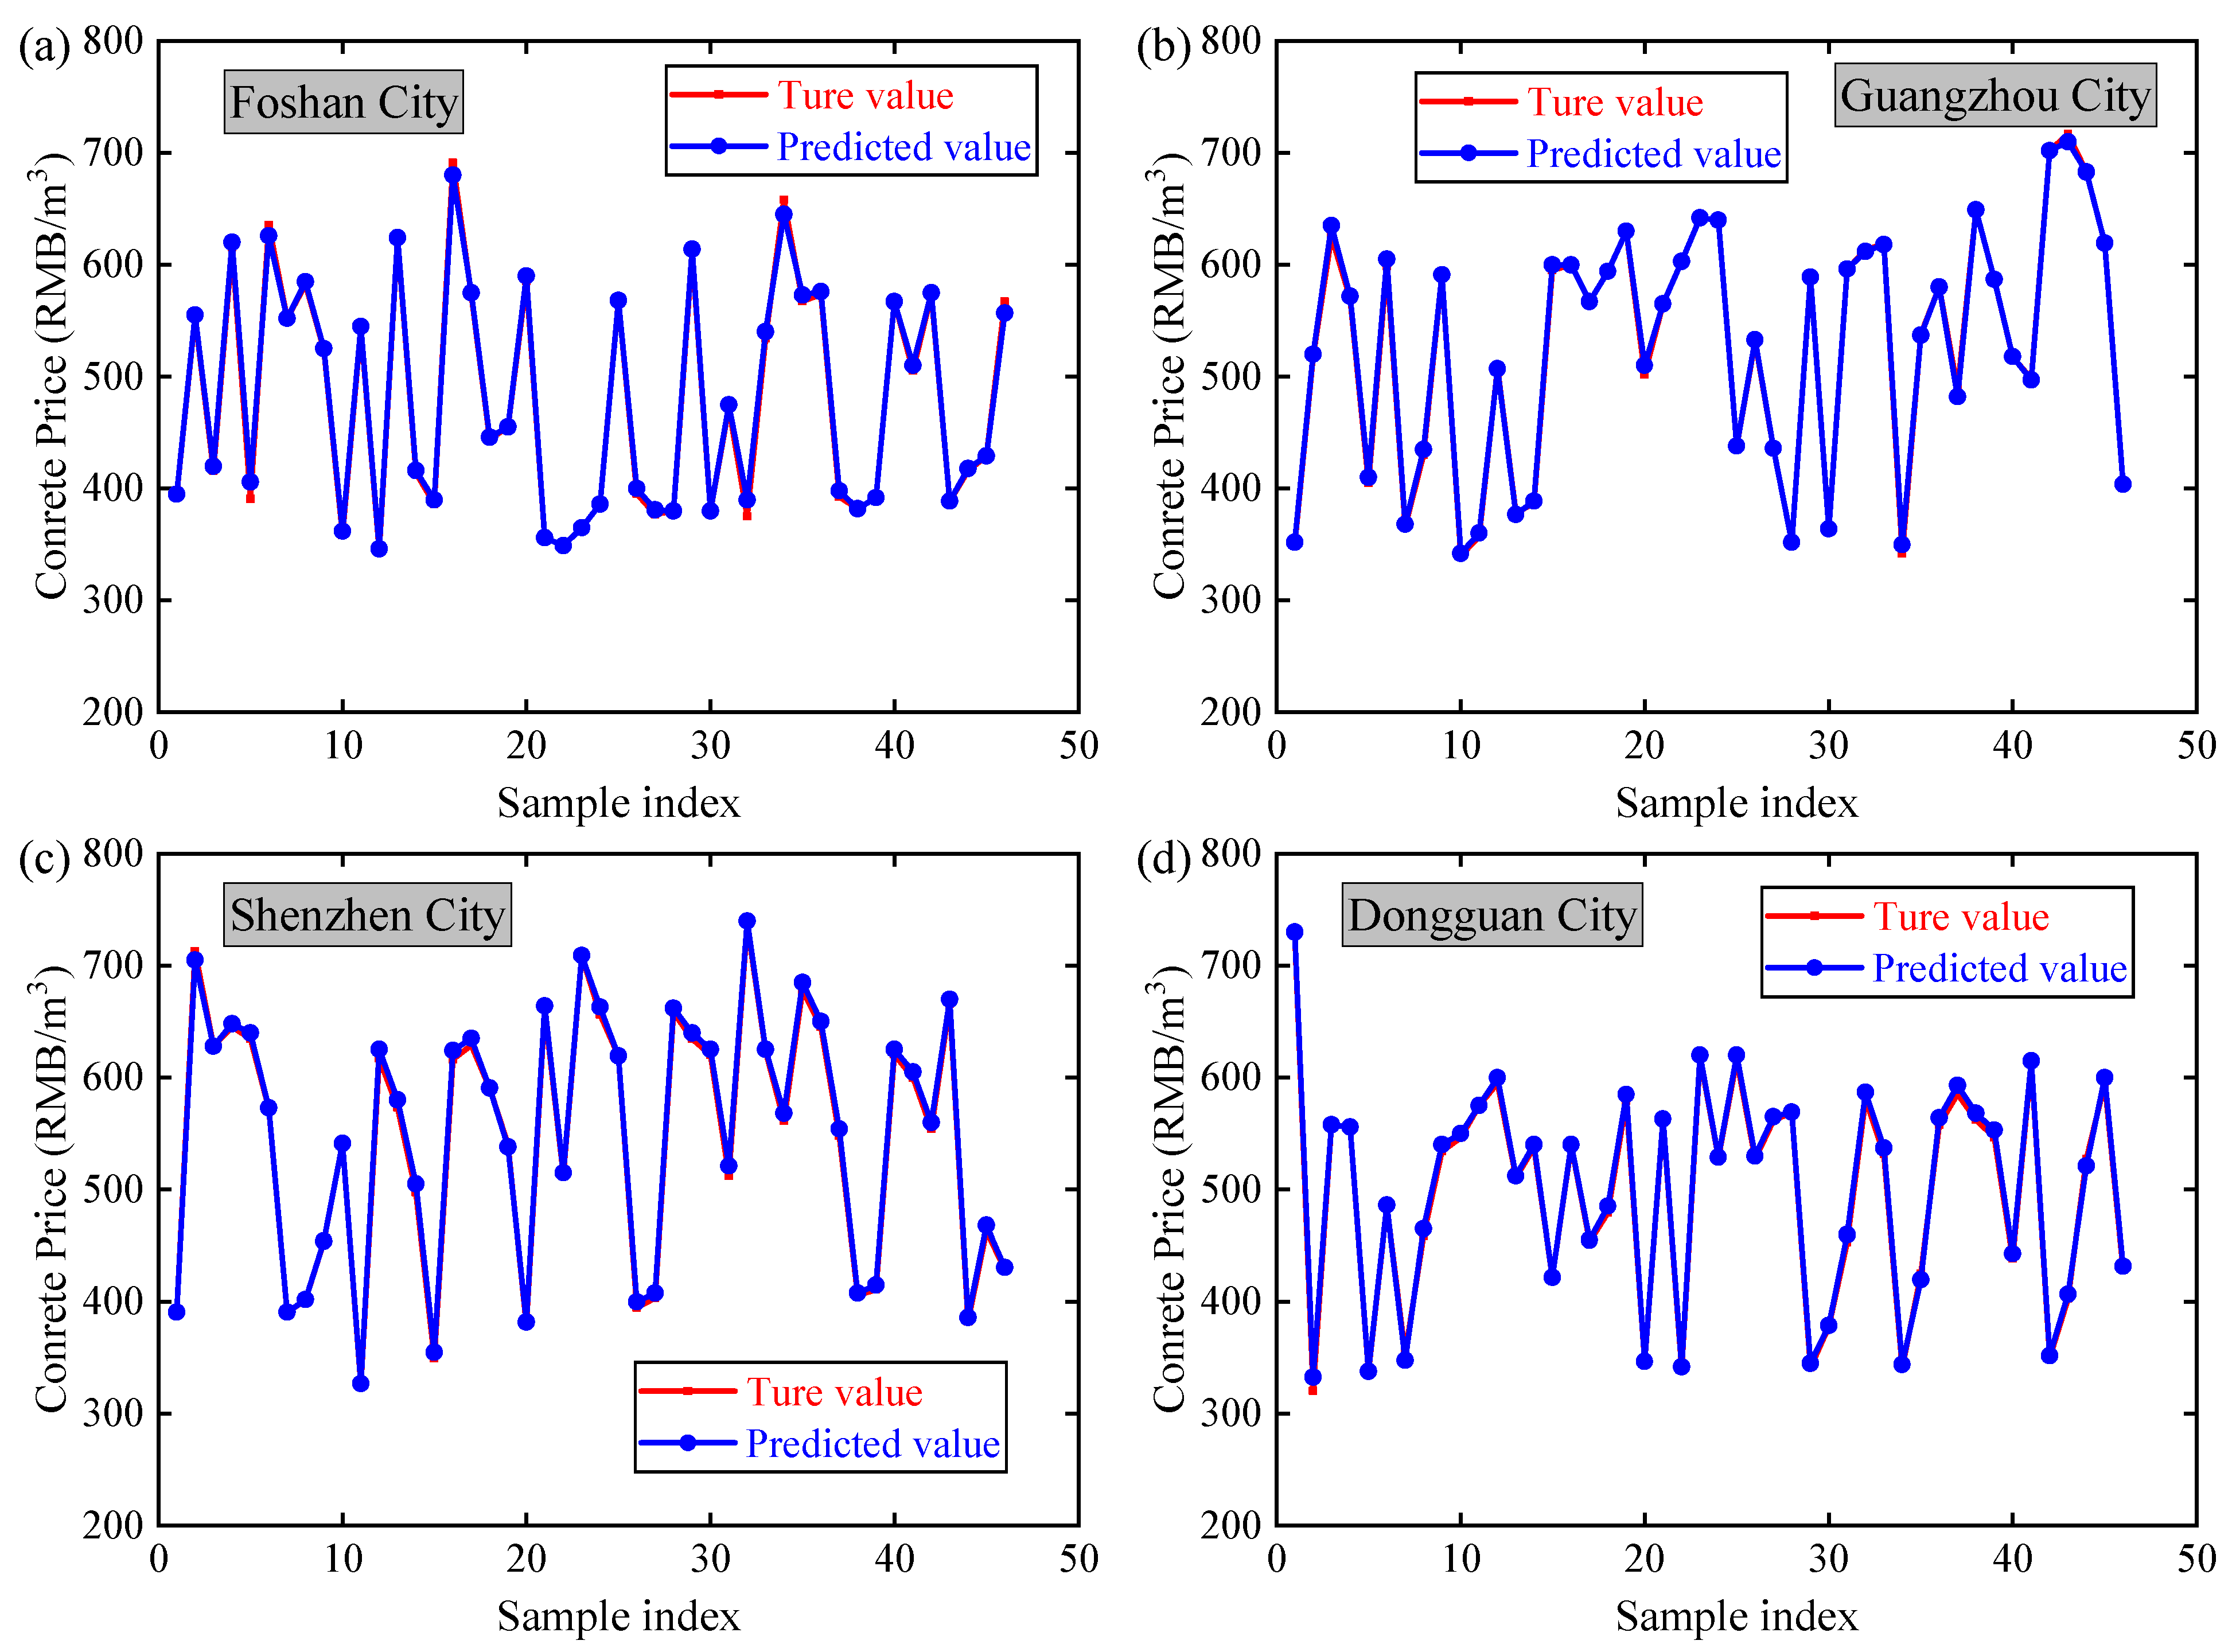
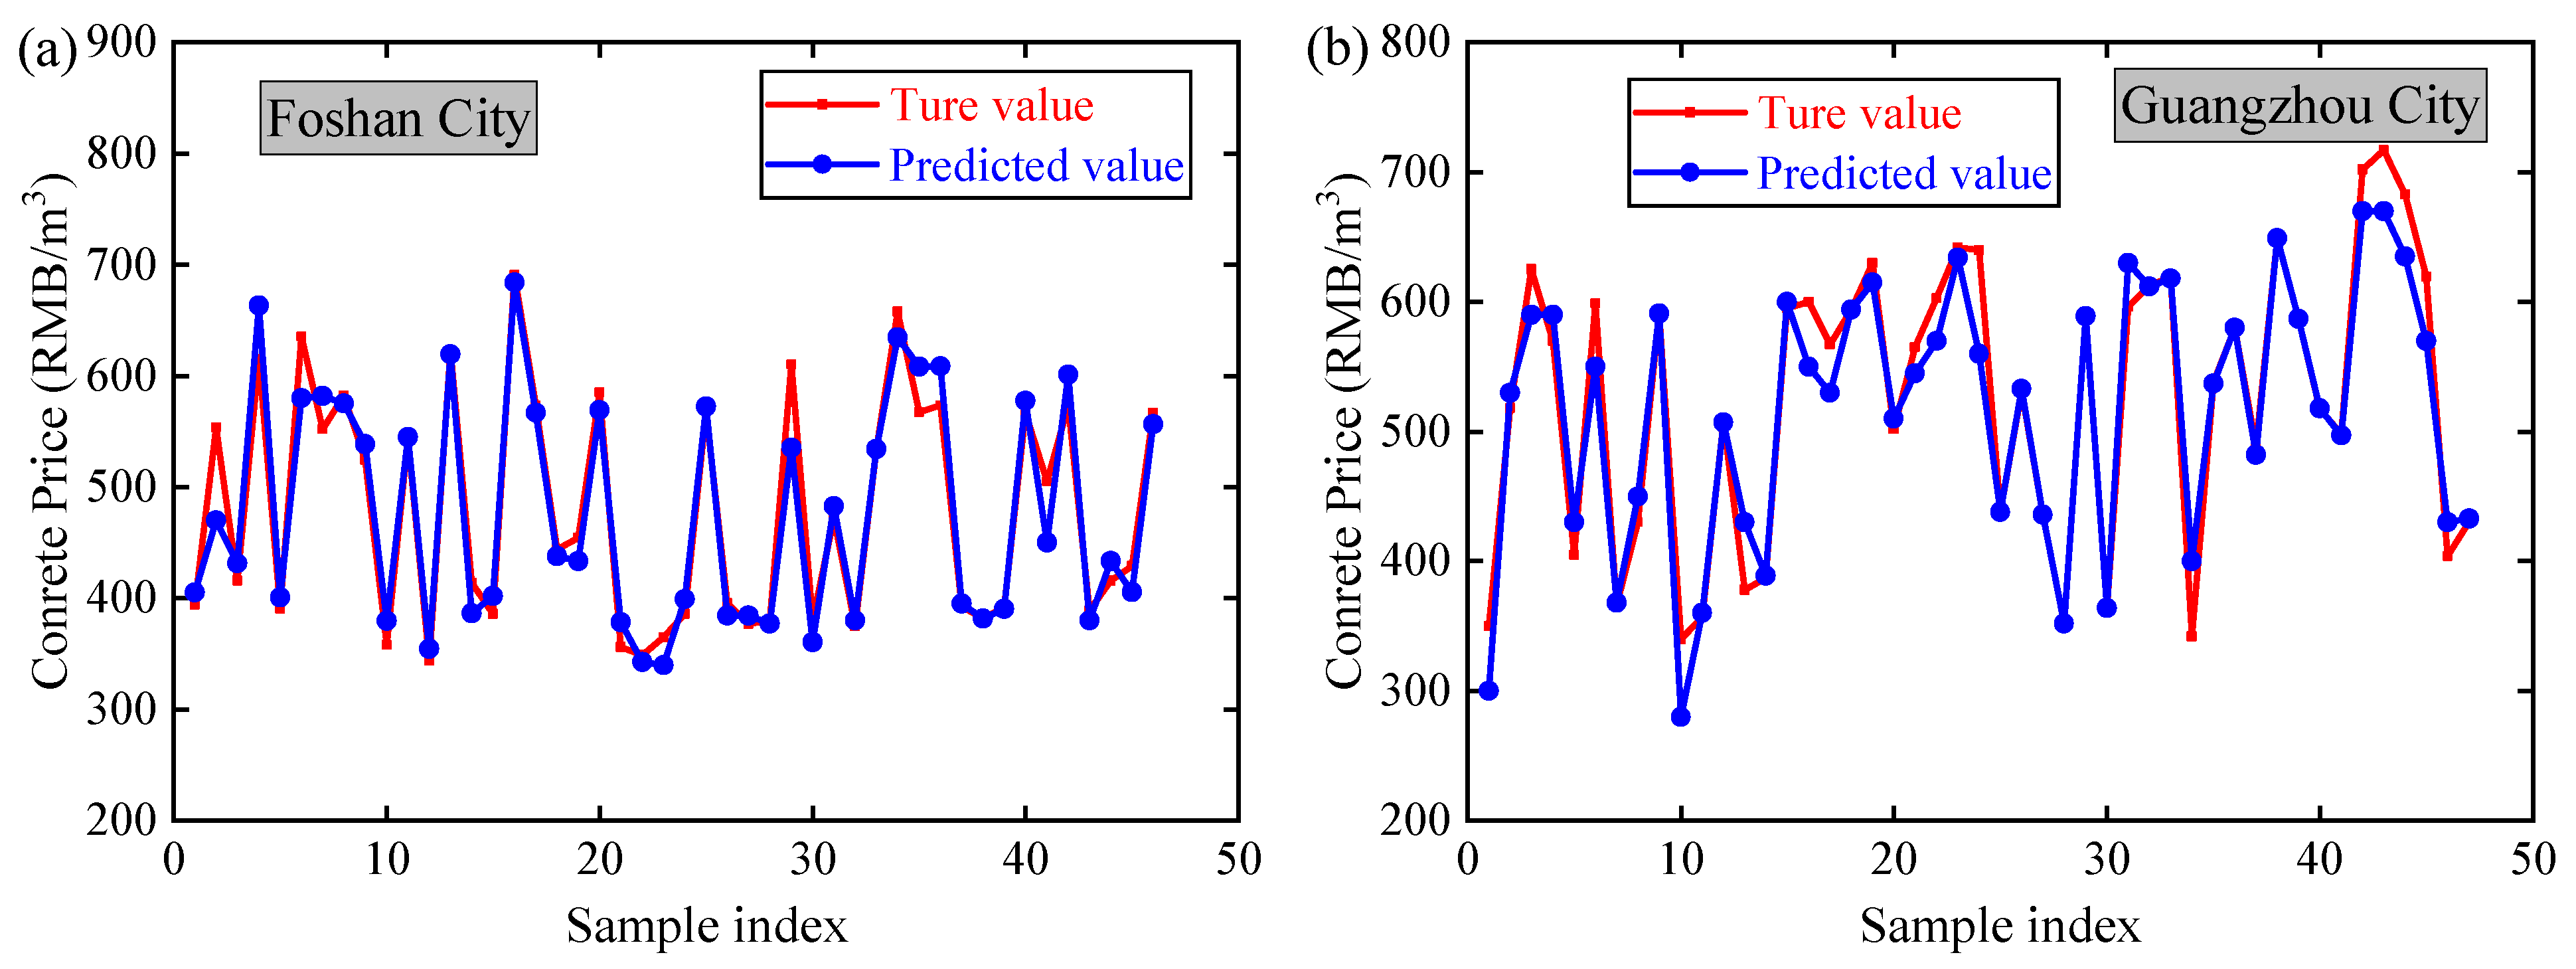
4.2. Prediction Results

In this study, the DB-PINN model was trained on 70% of the dataset, using the remaining 30% for testing, while training and testing losses were monitored at each epoch to evaluate learning performance and generalization. As shown in Figure 3, the training and testing loss curves of the DB-PINN model exhibited a rapid decline in the initial stage, indicating that the model quickly captures the underlying patterns of the data. As training continues, the two loss curves flattened out and converged. The test loss approached the training loss without diverging, and there was no significant difference between the two curves. This result indicated that the model had not overfitted and that its generalization extended far beyond the training data, maintaining the same performance on unseen data from different cities. Figure 4 compares the construction concrete prices predicted by the DB-PINN model with the actual prices in cities of Foshan, Guangzhou, Shenzhen, and Dongguan. The predicted price trends were closely aligned with the actual trends in these four cities. Although there were minor deviations at certain points, the overall direction and amplitude of the fluctuations in the predicted prices were consistent with the actual price trends. Notably, during periods of significant price fluctuation, the prediction model successfully captured the sharp increases and decreases in concrete prices, indicating that the DB-PINN model can effectively simulate changes in the concrete raw material market and macroeconomic conditions, accurately predicting trends in concrete price changes and specific price peaks.
To quantify the predictive performance of the DB-PINN model, Table 1 and Figure 5 provide information on the error metrics for each city. The MSE values of the model on the test sets of the four cities of Foshan, Guangzhou, Shenzhen, and Dongguan were [10.35, 11.57], with corresponding RMSE values of [2.42, 2.62]. Compared with the actual amplitude of concrete price fluctuations, these values were small. The MAE was also low [1.22–1.37), confirming that the average difference between the predicted and actual prices was approximately 1.3 RMB/m3. Compared to the actual unit price of concrete (approximately 300–700 RMB/m3 from 2012 to 2024), this difference was almost negligible. In addition, the average MAPE for each city was below 0.6%, indicating that the predictive accuracy of the model in the early stages of construction tendering can provide valuable reference that meets standards [15]. In addition, the R2 value was [0.997, 0.999], which was consistently high in all cities, meaning that almost 100% of the variance in the actual specific price data can be explained by the model’s predictions. In summary, by leveraging the information prices of raw materials and outputting the reasonable prices, the results indicate that the proposed DB-PINN model has high reliability in actual concrete price prediction. It is worth noting that this study takes the four cities in Guangdong Province of China as examples to investigate the price prediction of construction concrete, and it is necessary to conduct relevant research on the price prediction of construction concrete in cities in other countries in the future. It is also worthwhile to investigate the adoption of a smaller number of macroeconomic indicators as inputs to the model for the price prediction of construction concrete.

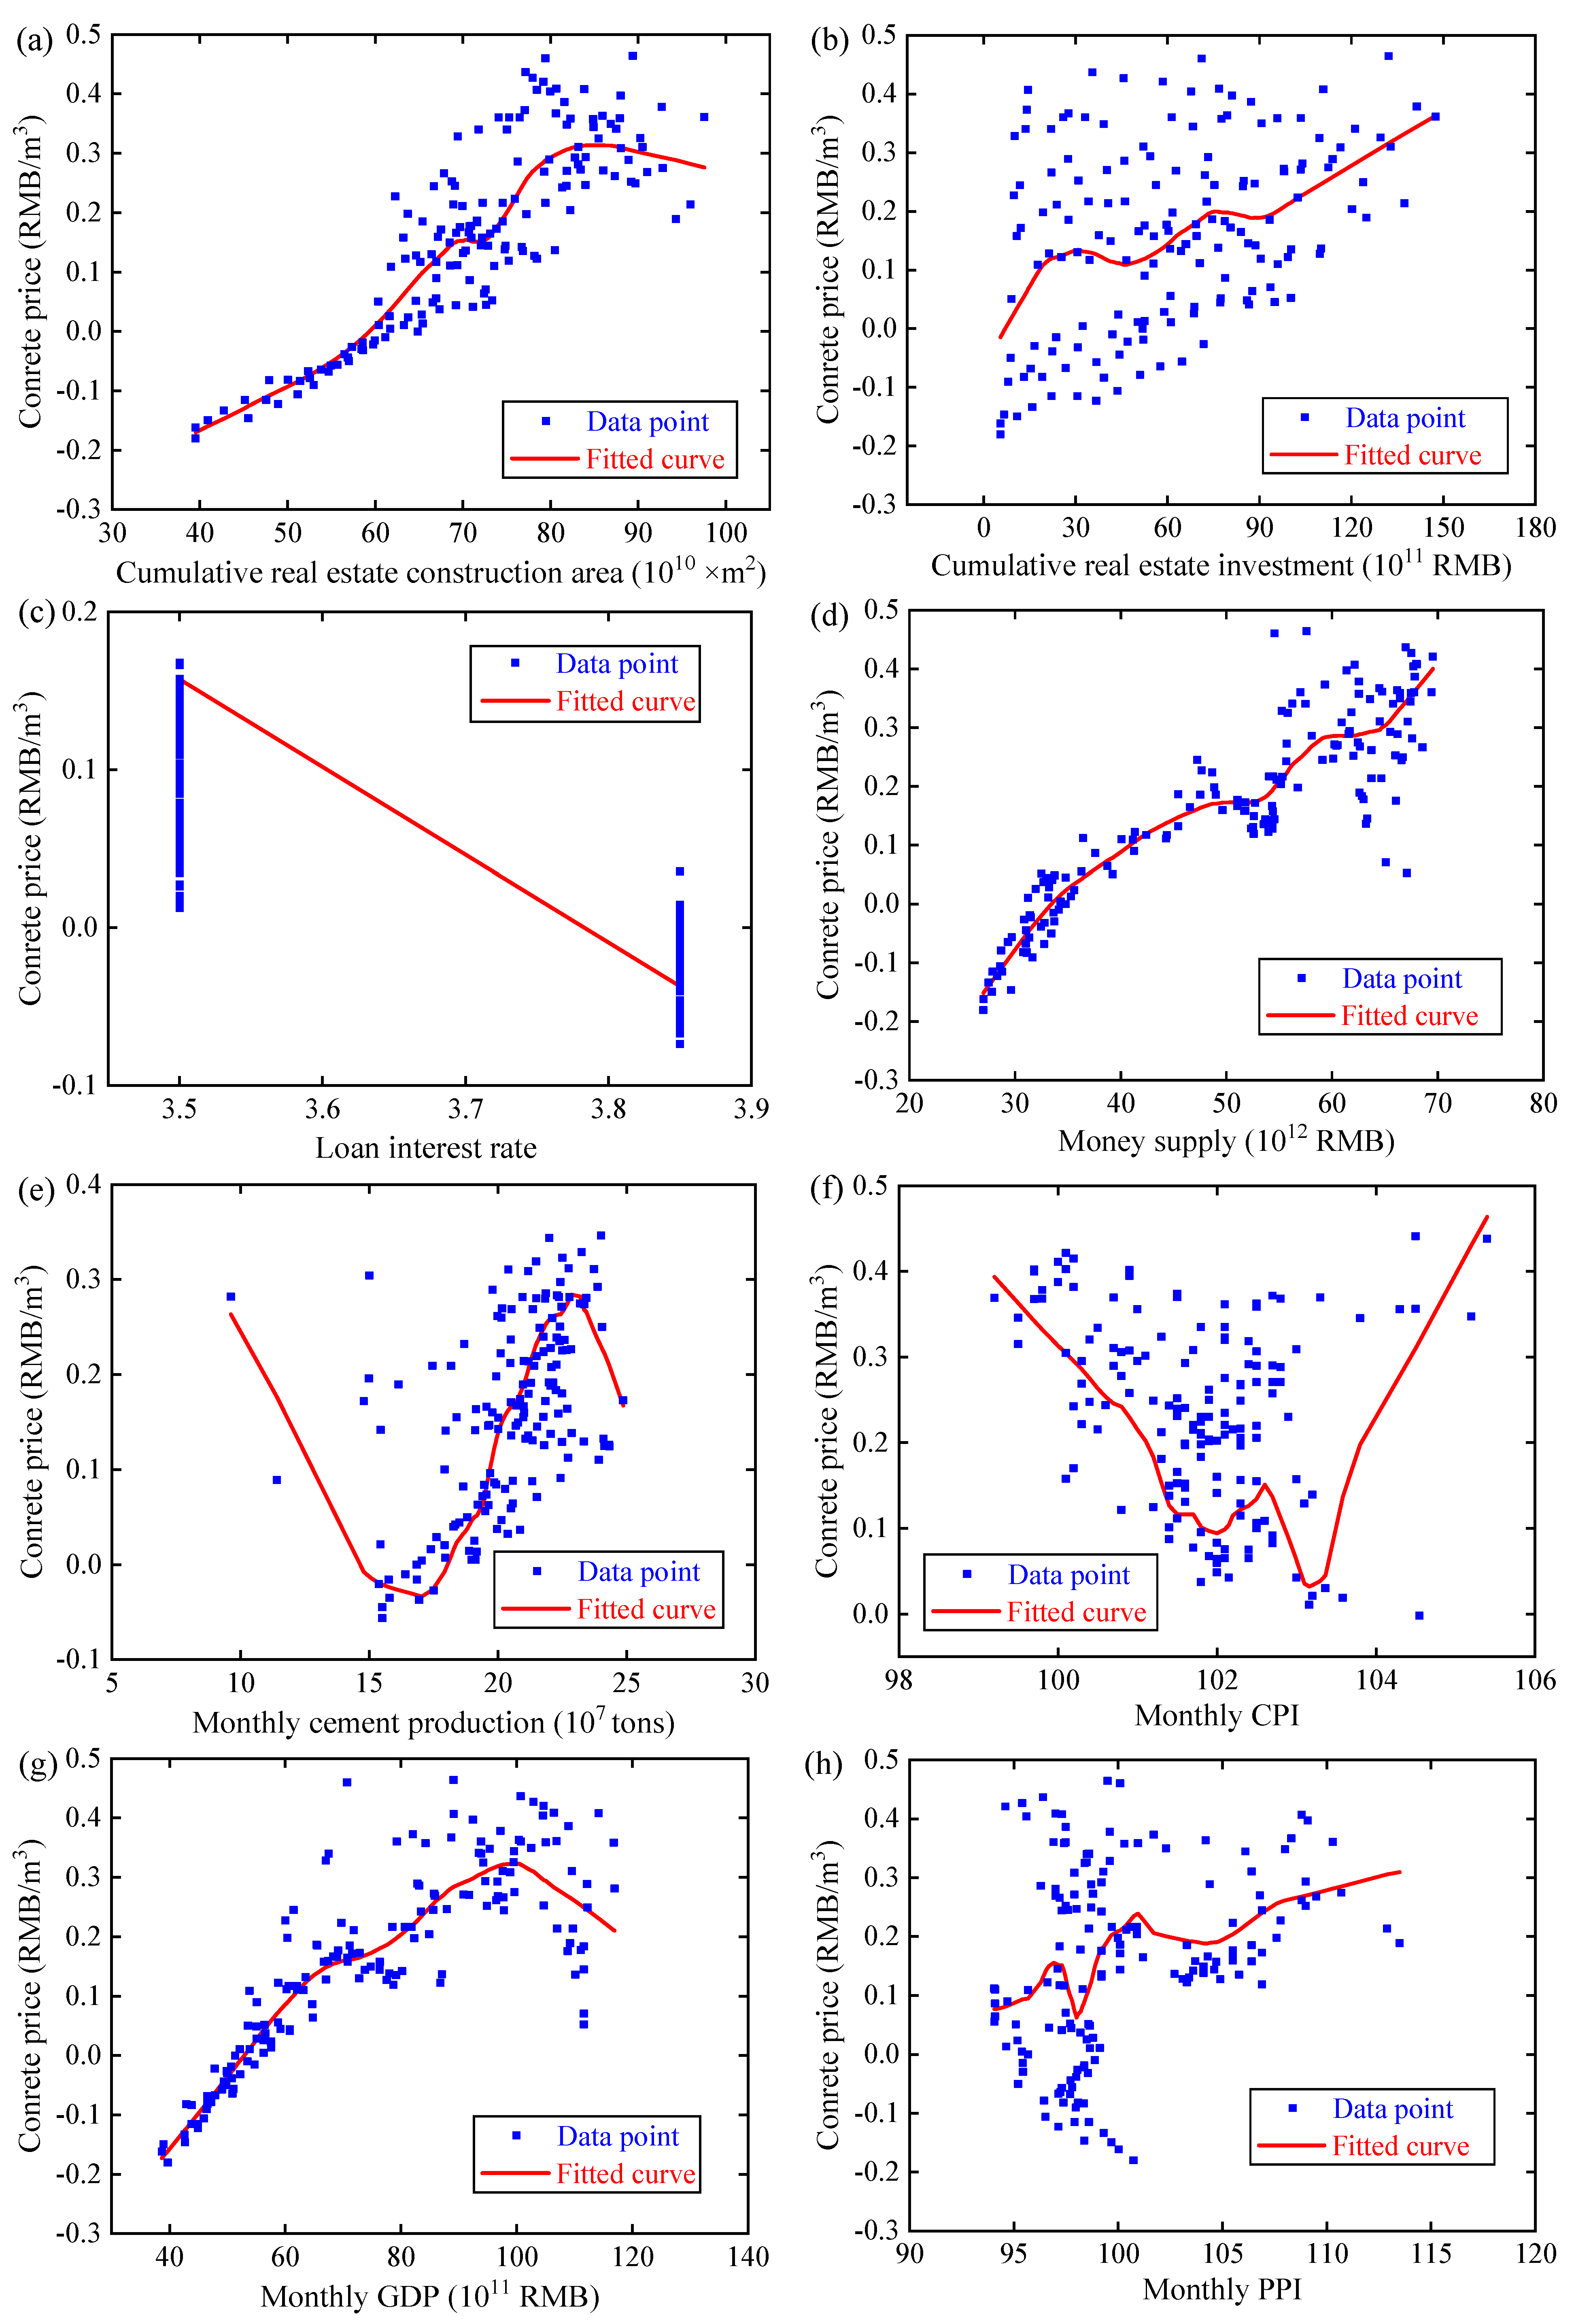
4.3. Result of Marginal Effect Analysis

Figure 6 reveals the relationship between the macroeconomic indicators used in the DB-PINN model and the price of concrete. The cumulative real estate construction area and monthly GDP were significantly and positively correlated with the price of concrete, and the relationship was approximately linear, indicating that there may be a relatively direct and direct link between them. With the cumulative construction area and monthly GDP increasing, the price of concrete showed an overall upward trend, although the rate of increase decreased slightly at higher levels, indicating diminishing marginal returns. Similarly, the money supply also showed a clear linear positive correlation, indicating that the increase in money supply can indirectly stimulate concrete price increases through construction market activity. In contrast, cumulative real estate investment and monthly cement production showed more complex relations. The marginal effect between cumulative real estate investment and concrete price showed a weak upward trend with considerable fluctuation, reflecting the fact that the indirect effects transmitted by the market may not be stable. Monthly cement production and monthly CPI showed an irregular and volatile relationship, indicating that production and overall inflation may not have a sustained or direct impact on concrete prices due to the influence of inventory. The loan interest rate based on the CEIC database of benchmark lending rate remained essentially unchanged throughout the entire analysis period, causing the marginal effect line to remain almost horizontal, indicating that there may be a difference between the loan interest rate and the market lending rate borne by construction companies.

4.4. Result of Comparison Analysis

As shown in Figure 7, the prediction accuracy of the traditional ANN model was lower, especially in areas with large price fluctuations. Compared with the DB-PINN model, the model failed to accurately predict actual price changes. Table 2 shows the comparison of prediction performance between the DB-PINN model and the traditional ANN model on the test set, using Foshan City as an example. The DB-PINN model achieved significantly lower errors, with an MSE of 10.56, RMSE of 2.62, MAE of 1.37, and MAPE of 0.57%. It also demonstrated a much higher R2 value (0.998) compared to the traditional ANN model, which recorded an MSE of 1115.21, RMSE of 33.39, MAE of 21.82, MAPE of 2.34%, and R2 of 0.892. This result also confirms the necessity of incorporating the raw material price factor into the construction concrete price prediction.

4.5. Result of Parameter Sensitivity Analysis

Figure 8 shows the ranking of the feature importance of each input variable. The results confirm that sand, 20 mm coarse aggregate, and cement are the most important factors in the fluctuation of concrete prices, as their MSE values increased by 0.1976, 0.1240, and 0.0849, respectively, after feature shuffling. This shows that these materials are the core components of concrete production, and changes in their prices directly determine changes in costs. In addition, the effects of cumulative real estate construction area (0.0132), monthly CPI (0.0070), cumulative real estate investment (0.0069), loan interest rate (0.0027), monthly GDP (0.0024), money supply (0.0022), monthly cement production (0.0021), and monthly PPI (0.0008) were significantly smaller than that of the raw material price, which also confirmed the necessity of incorporating the raw material price factor into the price prediction of construction materials.
As shown in Figure 9, there was a strong correlation between concrete prices and key raw materials, with correlation coefficients of 0.95 for sand, 0.93 for 20 mm coarse aggregate, and 0.80 for cement, confirming their dominant influence. Among the macroeconomic indicators with relatively higher correlation with concrete price, the cumulative real estate construction area had a correlation coefficient of 0.84, followed by the money supply (0.79), monthly GDP (0.74), and cumulative real estate investment (0.73). Through comparison, it is evident that the correlation of raw material price factors with construction concrete prices remains higher than that of macroeconomic indicators. It is worth noting that previous study has pointed out the necessity of applying multicollinearity analysis based on the results of correlation analysis in the interpretation of AI models [51]. Since if there is multicollinearity between the variables used to make statistical inferences, the model performance can be compromised. In this regard, Veaux et al. [52] demonstrates that the ANN is less sensitive to the multicollinearity between input variables due to its over-parameterized nature. Moreover, our study focuses mainly on prediction accuracy and model generalization performance rather than on the statistical interpretation of individual input coefficients. In this case, performing multicollinearity analysis contributes little to the assessment of the stability of parameter estimates in this study.

5. Concluding Remarks

In this study, a novel DB-PINN model was proposed for high-precision prediction of construction concrete price based on the raw material price and macroeconomic indicators. This model utilizes an ANN as the baseline algorithm and incorporates physical constraints to modify the loss function and enhance interpretability. To improve the prediction accuracy of the DB-PINN model, a feature analysis of the effect of the raw material price factors on the construction concrete price was conducted. The results showed that cement, sand, and coarse aggregate prices had a strong effect on concrete costs, and these three factors were selected as inputs for the branch of the raw material price factors. This study took the top four cities (e.g., Guangzhou City, Foshan City, Shenzhen City, and Dongguan City) in Guangdong Province of China in terms of GDP as the case study. Experimental results showed that the predicted construction concrete prices for these four cities were basically consistent with the actual values, verifying the validity and generalizability of the DB-PINN model under various dynamic market. To investigate the specific ways in which macroeconomic indicators affect the prediction result of the construction concrete price, an MEA was conducted. Results showed that the cumulative real estate construction area and monthly GDP were significantly and positively correlated with the construction concrete price, and monthly cement production and monthly CPI showed an irregular and volatile relationship. To verify the efficiency of the DB-PINN model, a comparative analysis using a traditional ANN model was conducted. Moreover, a parameter sensitivity analysis was conducted to reveal the impact of the raw material price factor and the macroeconomic indicator on the construction concrete price. The results of the adopted model performance evaluation regarding the rationality of the model support the significance of the DB-PINN model. Noticeably, the DB-PINN model reduces input variables while maintaining significant prediction accuracy, facilitating data collection for future research and providing a reference for developers or contractors to formulate reasonable cost strategies, which is also helpful for the preliminary price management for urban construction concrete projects.
In future studies, policies, unexpected events and various compositions of building materials with the same function in various markets can be considered as additional considerations to further improve the accuracy of model predictions. In addition, more advanced machine learning methods (e.g., LSTM, XGBoost, ensemble models) can be considered for construction material price prediction research.

Author Contributions

Conceptualization, K.S.; methodology, K.S., R.H., Z.L. and P.G.; software, K.S.; validation, R.H.; formal analysis, R.H.; investigation, K.S.; resources, R.H., Z.L. and P.G.; data curation, K.S.; writing—original draft preparation, K.S.; writing—review and editing, R.H.; visualization, K.S. and R.H.; supervision, R.H.; project administration, R.H.; funding acquisition, R.H. All authors have read and agreed to the published version of the manuscript.

Funding

Support for this project provided by the China Scholarship Council program (202406370138) and the School of Civil Engineering of Central South University is gratefully acknowledged.

Data Availability Statement

The data presented in this study are available on request from the corresponding author.

Conflicts of Interest

The authors declare no conflict of interest.

Appendix A. Description of Macroeconomic Indicators

Table A1. Description of macroeconomic indicators.
Macroeconomic IndicatorsImpact on Prices of Construction Materials
CPIThe CPI measures the general level of inflation for consumer goods and services. In an inflationary environment, manufacturers may raise material prices to maintain profits [15,21,23].
PPIPPI tracks price changes from the perspective of product manufacturers. When PPI rises, it indicates that manufacturers are charging higher fees for raw materials and processed materials [15,21].
Money supplyThe money supply (usually measured by M2) represents the liquidity available in the economy. Expansionary monetary policy tends to lead to lower interest rates and more available credit, stimulating investment in RE and construction [16].
GDPGDP represents the total amount and growth of the economy. Higher GDP growth usually indicates more construction spending and higher demand for construction materials [15,21,23].
Industrial production volumeThe volume of industrial production such as cement, steel, and aggregates is an important factor in determining the price of construction materials. This relationship follows the basic supply and demand principle [16].
Loan interest rateMany construction projects are usually financed through loans; lower interest rates reduce borrowing costs for developers and homebuyers. When the supply side is under pressure from additional demand, it may lead to rising material prices [15,21].
Number of new construction projectsThe number of new construction projects can reflect changes in the demand for construction materials. New construction projects often require a large quantity of construction materials, so construction material manufacturers will adjust their product prices based on changes in supply and demand [21,23,41,42].
Market size of the construction industryThe market size of the construction industry refers to the overall scale of construction business in an economy. A larger construction industry scale means a higher baseline demand for construction materials, which causes inflationary pressure in the material market and in turn pushes up the prices of construction materials [41,42].

References

  1. Statista. Urbanization Rate in China 1980–2024. Available online: https://www.statista.com/statistics/270162/urbanization-in-china/ (accessed on 19 February 2025).
  2. Statista. China: Real Estate Sales Revenue Monthly 2024. Available online: https://www.statista.com/statistics/1459232/monthly-sales-revenue-of-real-estate-in-china/ (accessed on 19 February 2025).
  3. Statista. China: Real Estate Construction Started Monthly 2024. Available online: https://www.statista.com/statistics/1459210/monthly-construction-of-real-estate-in-china/ (accessed on 19 February 2025).
  4. Holm, L.; Schaufelberger, J.E. Construction Cost Estimating; Routledge: London, UK, 2021; ISBN 978-1-003-02349-4. [Google Scholar]
  5. Ekung, S.; Lashinde, A.; Adu, E. Critical Risks to Construction Cost Estimation. J. Eng. Proj. Prod. Manag. 2021, 11, 19–29. [Google Scholar]
  6. Potts, K.; Ankrah, N. Construction Cost Management: Learning from Case Studies; Routledge: London, UK, 2014; ISBN 978-0-203-75294-4. [Google Scholar]
  7. Trackunit. Construction Project Cost Breakdown: Estimate the Total Cost. Available online: https://trackunit.com/articles/construction-project-breakdown/ (accessed on 12 March 2025).
  8. Tigranyan, H. Detailed Construction Project Cost Breakdown [Examples Included]. Available online: https://buildern.com/resources/blog/construction-project-cost-breakdown/ (accessed on 20 April 2025).
  9. Zhang, J.; Peng, L.; Wen, S.; Huang, S. A review on concrete structural properties and damage evolution monitoring techniques. Sensors 2024, 24, 620. [Google Scholar] [CrossRef] [PubMed]
  10. JGJ 55-2011; Specification for Mix Proportion Design of Ordinary Concrete. MOHURD: Beijing, China, 2011.
  11. Samuel, E.; Snapp, S. Cost model for unit rate pricing of concrete in construction projects. Int. J. Constr. Eng. Manag. 2015, 4, 149–158. [Google Scholar]
  12. Elmousalami, H.H. Artificial intelligence and parametric construction cost estimate modeling: State-of-the-art review. J. Constr. Eng. Manag. 2020, 146, 03119008. [Google Scholar] [CrossRef]
  13. Igwe, U.S.; Mohamed, S.F.; Azwarie, M.B.M.D. Recent Technologies in Construction; A Novel Search for Total Cost Management of Construction Projects. In IOP Conference Series: Materials Science and Engineering; IOP Publishing: Bristol, UK, 2020; Volume 884, p. 012041. [Google Scholar]
  14. Matel, E.; Vahdatikhaki, F.; Hosseinyalamdary, S.; Evers, T.; Voordijk, H. An artificial neural network approach for cost estimation of engineering services. Int. J. Constr. Manag. 2022, 22, 1274–1287. [Google Scholar] [CrossRef]
  15. Liu, Q.; He, P.; Peng, S.; Wang, T.; Ma, J. A Survey of Data-Driven Construction Materials Price Forecasting. Buildings 2024, 14, 3156. [Google Scholar] [CrossRef]
  16. Peško, I.; Mučenski, V.; Šešlija, M.; Radović, N.; Vujkov, A.; Bibić, D.; Krklješ, M. Estimation of Costs and Durations of Construction of Urban Roads Using ANN and SVM. Complexity 2017, 2017, 1–13. [Google Scholar] [CrossRef]
  17. Juszczyk, M.; Leśniak, A.; Zima, K. ANN based approach for estimation of construction costs of sports fields. Complexity 2018, 2018, 1–11. [Google Scholar] [CrossRef]
  18. Chandanshive, V.; Kambekar, A.R. Estimation of building construction cost using artificial neural networks. J. Soft Comput. Civ. Eng. 2019, 3, 91–107. [Google Scholar]
  19. Ahmadu, H.; Ibrahim, Y.; Abdulrahman, R.; Jibril, U.; Yamusa, M. Developing Machine Learning Prediction Models for Construction Material Prices in Nigeria. ATBU J. Environ. Technol. 2023, 16, 22–42. [Google Scholar]
  20. Bassioni, H.A.; Elmasry, M.I.; Ragheb, A.M.; Youssef, A.A. Time series analysis for the prediction of RC material components prices in Egypt. In Proceedings of the 28th Annual ARCOM Conference, Edinburgh, UK, 3–5 September 2012; pp. 381–390. [Google Scholar]
  21. Shiha, A.; Dorra, E.M.; Nassar, K. Neural networks model for prediction of construction material prices in Egypt using macroeconomic indicators. J. Constr. Eng. Manag. 2020, 146, 04020010. [Google Scholar] [CrossRef]
  22. Hosny, S.; Elsaid, E.; Hosny, H. Prediction of construction material prices using ARIMA and multiple regression models. Asian J. Civ. Eng. 2023, 24, 1697–1710. [Google Scholar] [CrossRef]
  23. Mir, M.; Kabir, H.D.; Nasirzadeh, F.; Khosravi, A. Neural network-based interval forecasting of construction material prices. J. Build. Eng. 2021, 39, 102288. [Google Scholar] [CrossRef]
  24. Rešetar, Z.; Rešetar, N.P.; Lukić, F. The impact of the increase in raw material prices on costs in the construction sector in the city of Osijek. In Proceedings of the International Scientific Conference on Economy, Management and Information Technologies, Blace, Serbia, 21–23 September 2023; Volume 1, pp. 257–268. [Google Scholar]
  25. Abdul Nabi, M.; Chammout, B.; El-adaway, I.H.; Assaad, R.H.; Assaf, G. Investigating price fluctuation transmission among construction materials. In Proceedings of the Construction Research Congress, Des Moines, Iowa, 20–23 March 2024; pp. 339–349. [Google Scholar]
  26. Raissi, M.; Perdikaris, P.; Karniadakis, G.E. Physics Informed Deep Learning (Part I): Data-Driven Solutions of Nonlinear Partial Differential Equations. arXiv 2017, arXiv:1711.10561. [Google Scholar]
  27. Raissi, M.; Perdikaris, P.; Karniadakis, G.E. Numerical Gaussian processes for time-dependent and nonlinear partial differential equations. SIAM J. Sci. Comput. 2018, 40, A172–A198. [Google Scholar] [CrossRef]
  28. Guo, M.; Haghighat, E. Energy-based error bound of physics-informed neural network solutions in elasticity. J. Eng. Mech. 2022, 148, 04022038. [Google Scholar] [CrossRef]
  29. Reyes, B.; Howard, A.A.; Perdikaris, P.; Tartakovsky, A.M. Learning unknown physics of non-Newtonian fluids. Phys. Rev. Fluids 2021, 6, 073301. [Google Scholar] [CrossRef]
  30. Aliakbari, M.; Mahmoudi, M.; Vadasz, P.; Arzani, A. Predicting high-fidelity multiphysics data from low-fidelity fluid flow and transport solvers using physics-informed neural networks. Int. J. Heat Fluid Flow 2022, 96, 109002. [Google Scholar] [CrossRef]
  31. Ahmed, B.; Howard, A.A.; Perdikaris, P.; Tartakovsky, A.M. Physics-informed deep operator networks with stiffness-based loss functions for structural response prediction. Eng. Appl. Artif. Intell. 2025, 144, 110097. [Google Scholar] [CrossRef]
  32. Aliyu, S.U. Oil price shocks and the macroeconomy of Nigeria: A non-linear approach. J. Int. Bus. Entrepren. Dev. 2011, 5, 179–198. [Google Scholar] [CrossRef]
  33. Fernandez, V. Linear and non-linear causality between price indices and commodity prices. Resour. Policy 2014, 41, 40–51. [Google Scholar] [CrossRef]
  34. Gupta, M.; Varshney, S. Non-linear Effect of Real Exchange Rate Variability with Macroeconomic Variable on Non-Petroleum Commodities of India–US Trade. Foreign Tr. Rev. 2023, 58, 289–328. [Google Scholar] [CrossRef]
  35. Draper, N.R.; Smith, H. Applied Regression Analysis; John Wiley & Sons: Hoboken, NJ, USA, 1998; ISBN 978-1-107-07599-3. [Google Scholar]
  36. Engle, R.F.; Granger, C.W. Co-integration and error correction: Representation, estimation, and testing. Econom. J. Econom. Soc. 1987, 55, 251–276. [Google Scholar] [CrossRef]
  37. Hauzenberger, N.; Pfarrhofer, M.; Rossini, L. Sparse time-varying parameter VECMs with an application to modeling electricity prices. Int. J. Forecast. 2025, 41, 361–376. [Google Scholar] [CrossRef]
  38. Perez-Rosero, D.A.; Álvarez-Meza, A.M.; Castellanos-Dominguez, C.G. A regularized physics-informed neural network to support data-driven nonlinear constrained optimization. Computers 2024, 13, 176. [Google Scholar] [CrossRef]
  39. Chicco, D.; Warrens, M.J.; Jurman, G. The coefficient of determination R-squared is more informative than SMAPE, MAE, MAPE, MSE and RMSE in regression analysis evaluation. PeerJ Comput. Sci. 2021, 7, e623. [Google Scholar] [CrossRef] [PubMed]
  40. Shakantu, W.; Tookey, J.E.; Bowen, P.A. The hidden cost of transportation of construction materials: An overview. J. Eng. Des. Technol. 2003, 1, 103–118. [Google Scholar] [CrossRef]
  41. Skitmore, M. Construction Prices: The Market Effect; University of Salford Environmental Resources Unit: Salford, UK, 1987; ISBN 0-901025-10-0. [Google Scholar]
  42. Tajani, F.; Morano, P.; Saez-Perez, M.P.; Di Liddo, F.; Locurcio, M. Multivariate dynamic analysis and forecasting models of future property bubbles: Empirical applications to the housing markets of Spanish metropolitan cities. Sustainability 2019, 11, 3575. [Google Scholar] [CrossRef]
  43. Han, L.; Liu, C.; Ren, Z.; Zhang, X.; Yang, H. Research on project cost management under the mode of bill of quantities valuation. Int. J. Front. Eng. Technol. 2022, 4, 63–69. [Google Scholar] [CrossRef]
  44. NSBC. Consultation Disclosure—National Bureau of Statistics. Available online: https://www.stats.gov.cn/hd/lyzx/zxgk/202405/t20240524_1954065.html (accessed on 5 April 2025).
  45. Imtiaz, S.A.; Shah, S.L. Treatment of missing values in process data analysis. Can. J. Chem. Eng. 2008, 86, 838–858. [Google Scholar] [CrossRef]
  46. Lepot, M.; Aubin, J.-B.; Clemens, F. Interpolation in time series: An introductive overview of existing methods, their performance criteria and uncertainty assessment. Water 2017, 9, 796. [Google Scholar] [CrossRef]
  47. Santos, N.P. The expansion of data science: Dataset standardization. Standards 2023, 3, 400–410. [Google Scholar] [CrossRef]
  48. Cheadle, C.; Vawter, M.P.; Freed, W.J.; Becker, K.G. Analysis of microarray data using Z score transformation. J. Mol. Diagn. 2003, 5, 73–81. [Google Scholar] [CrossRef]
  49. Molnar, C. Interpretable Machine Learning: A Guide for Making Black Box Models Explainable; Independently Published; 2020. ISBN 978-0-244-76852-2.
  50. Data MasterClub. Applying Artificial Neural Networks (ANNs) for Linear Regression: Yay or Nay? Available online: https://datamastersclub.com/applying-artificial-neural-networks-anns-for-linear-regression-yay-or-nay/ (accessed on 7 June 2025).
  51. Raja, M.N.A.; Abdoun, T.; El-Sekelly, W. Smart prediction of liquefaction-induced lateral spreading. J. Rock Mech. Geotech. Eng. 2024, 16, 2310–2325. [Google Scholar] [CrossRef]
  52. De Veaux, R.D.; Ungar, L.H. Multicollinearity: A tale of two nonparametric regressions. In Selecting Models from Data; Cheeseman, P., Oldford, R.W., Eds.; Lecture Notes in Statistics; Springer: New York, NY, USA, 1994; Volume 89, pp. 393–402. [Google Scholar]
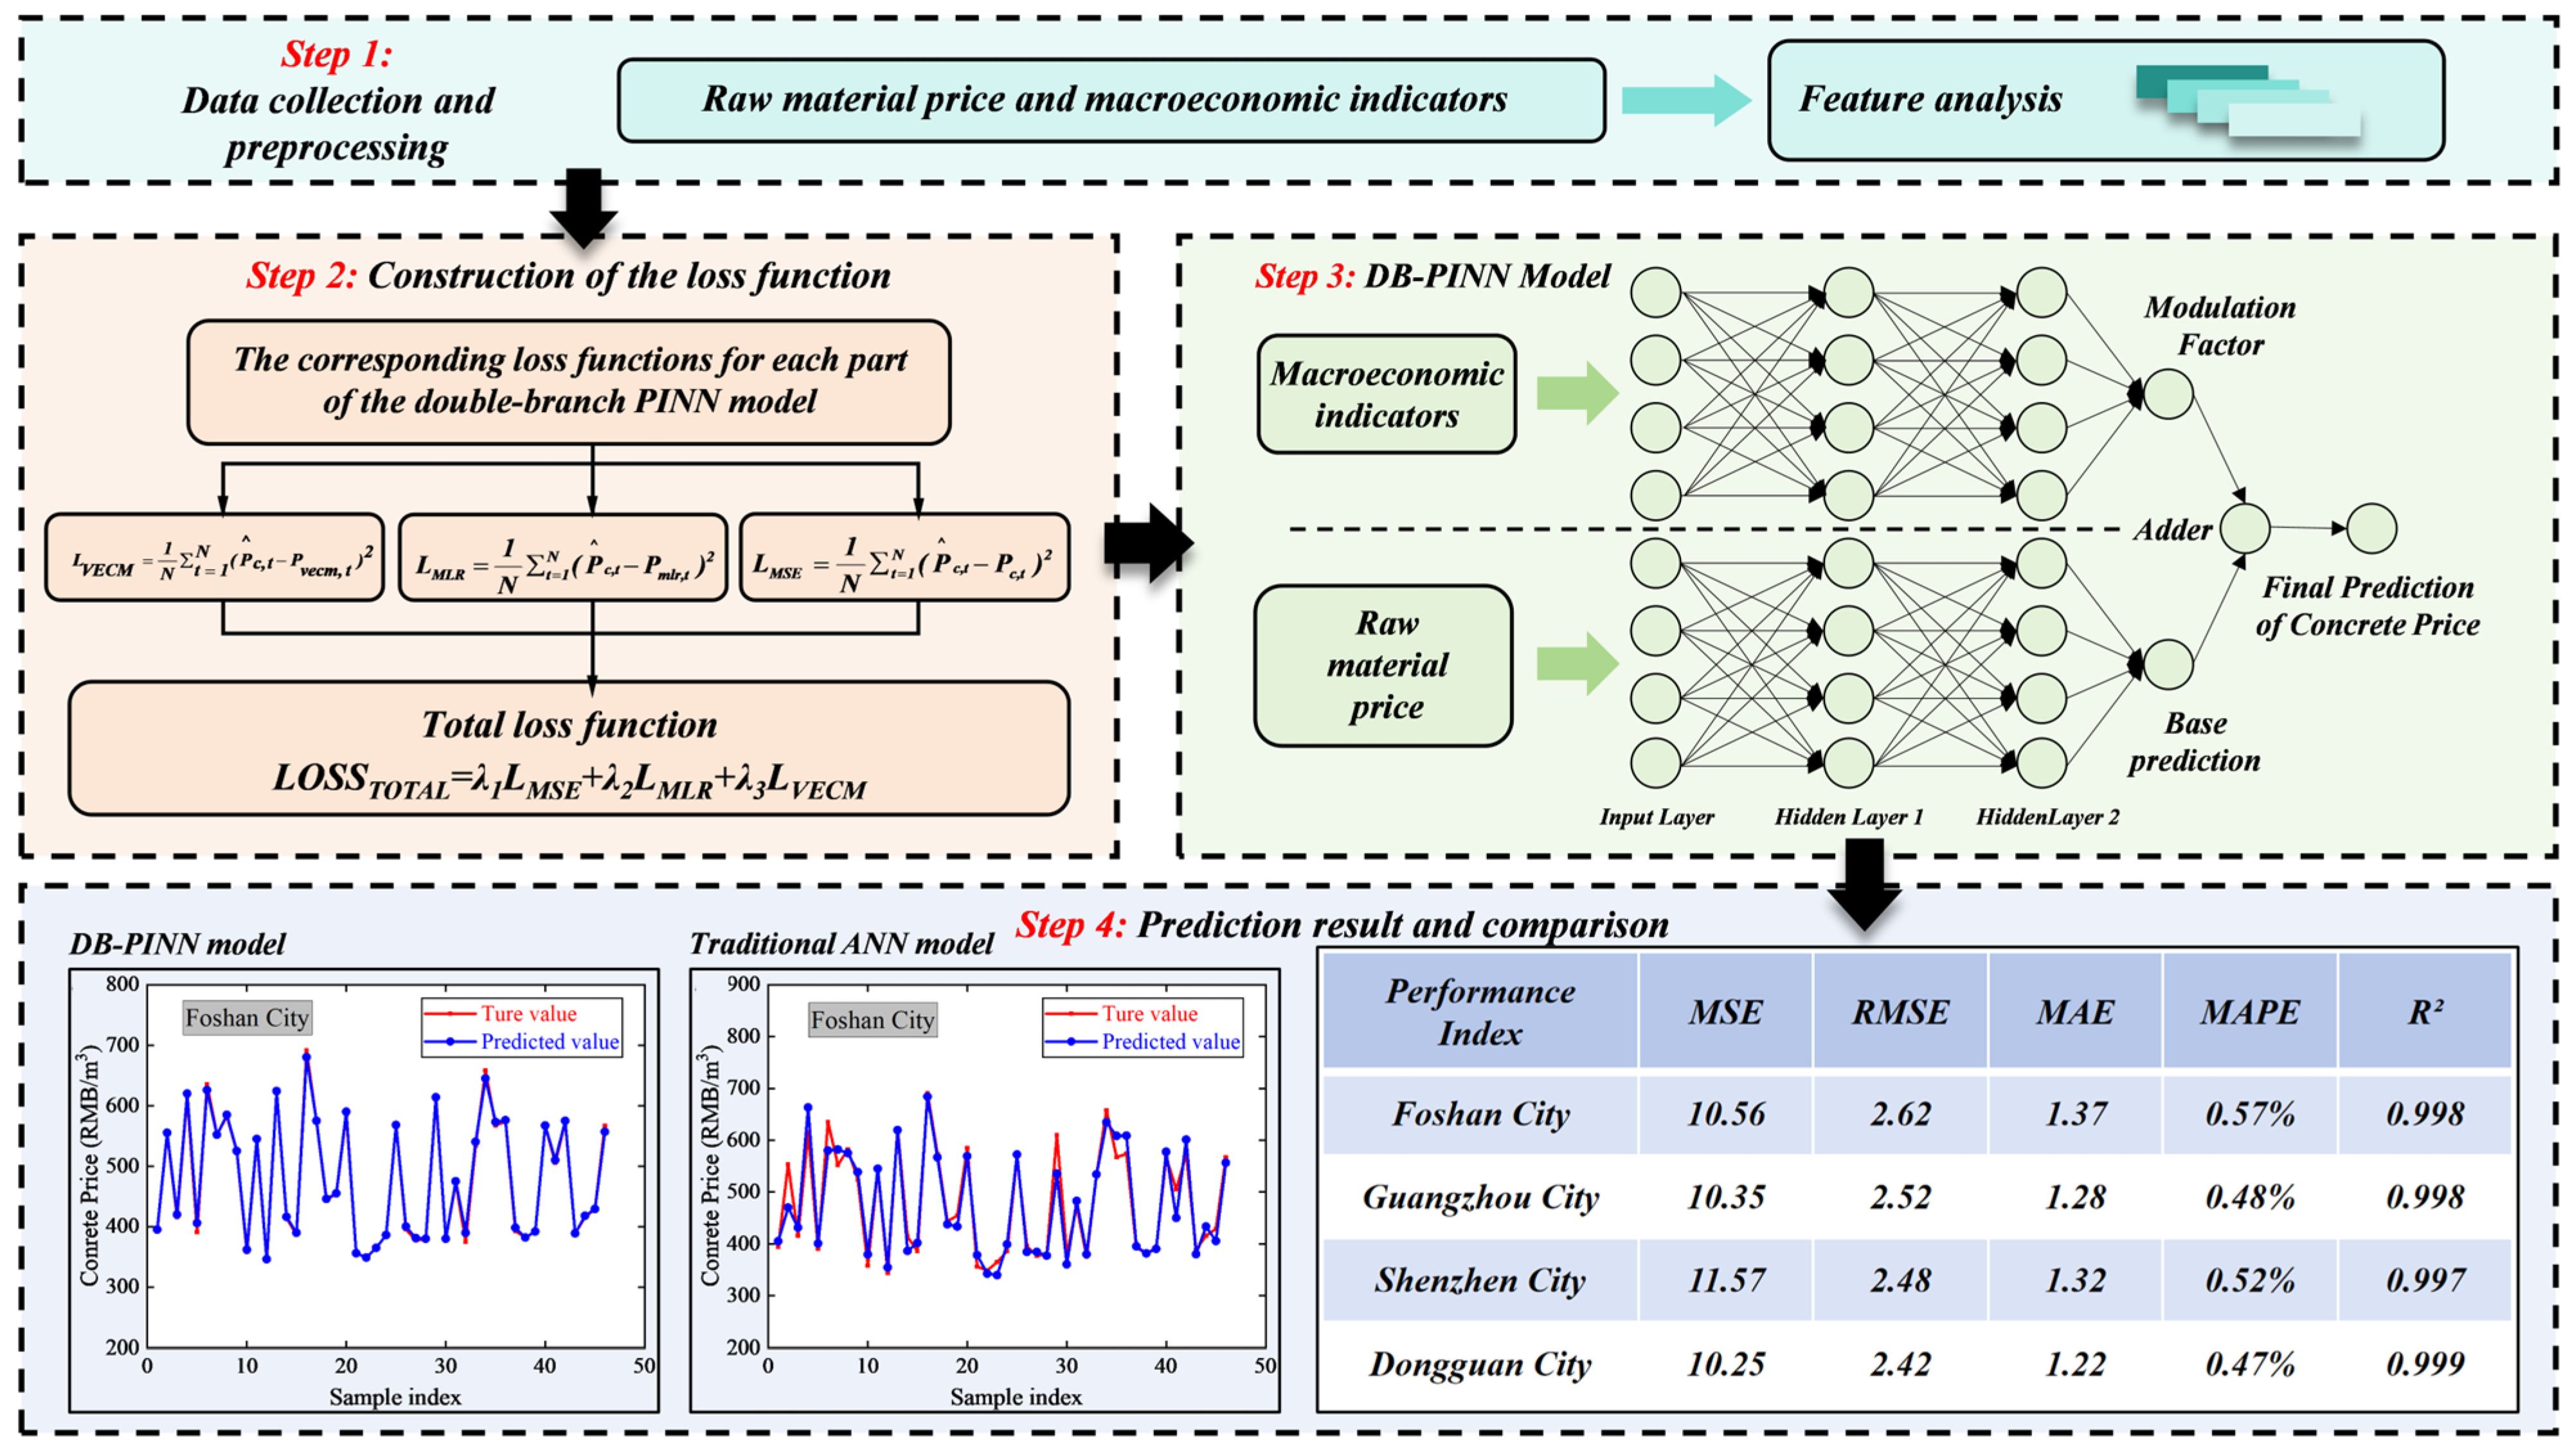
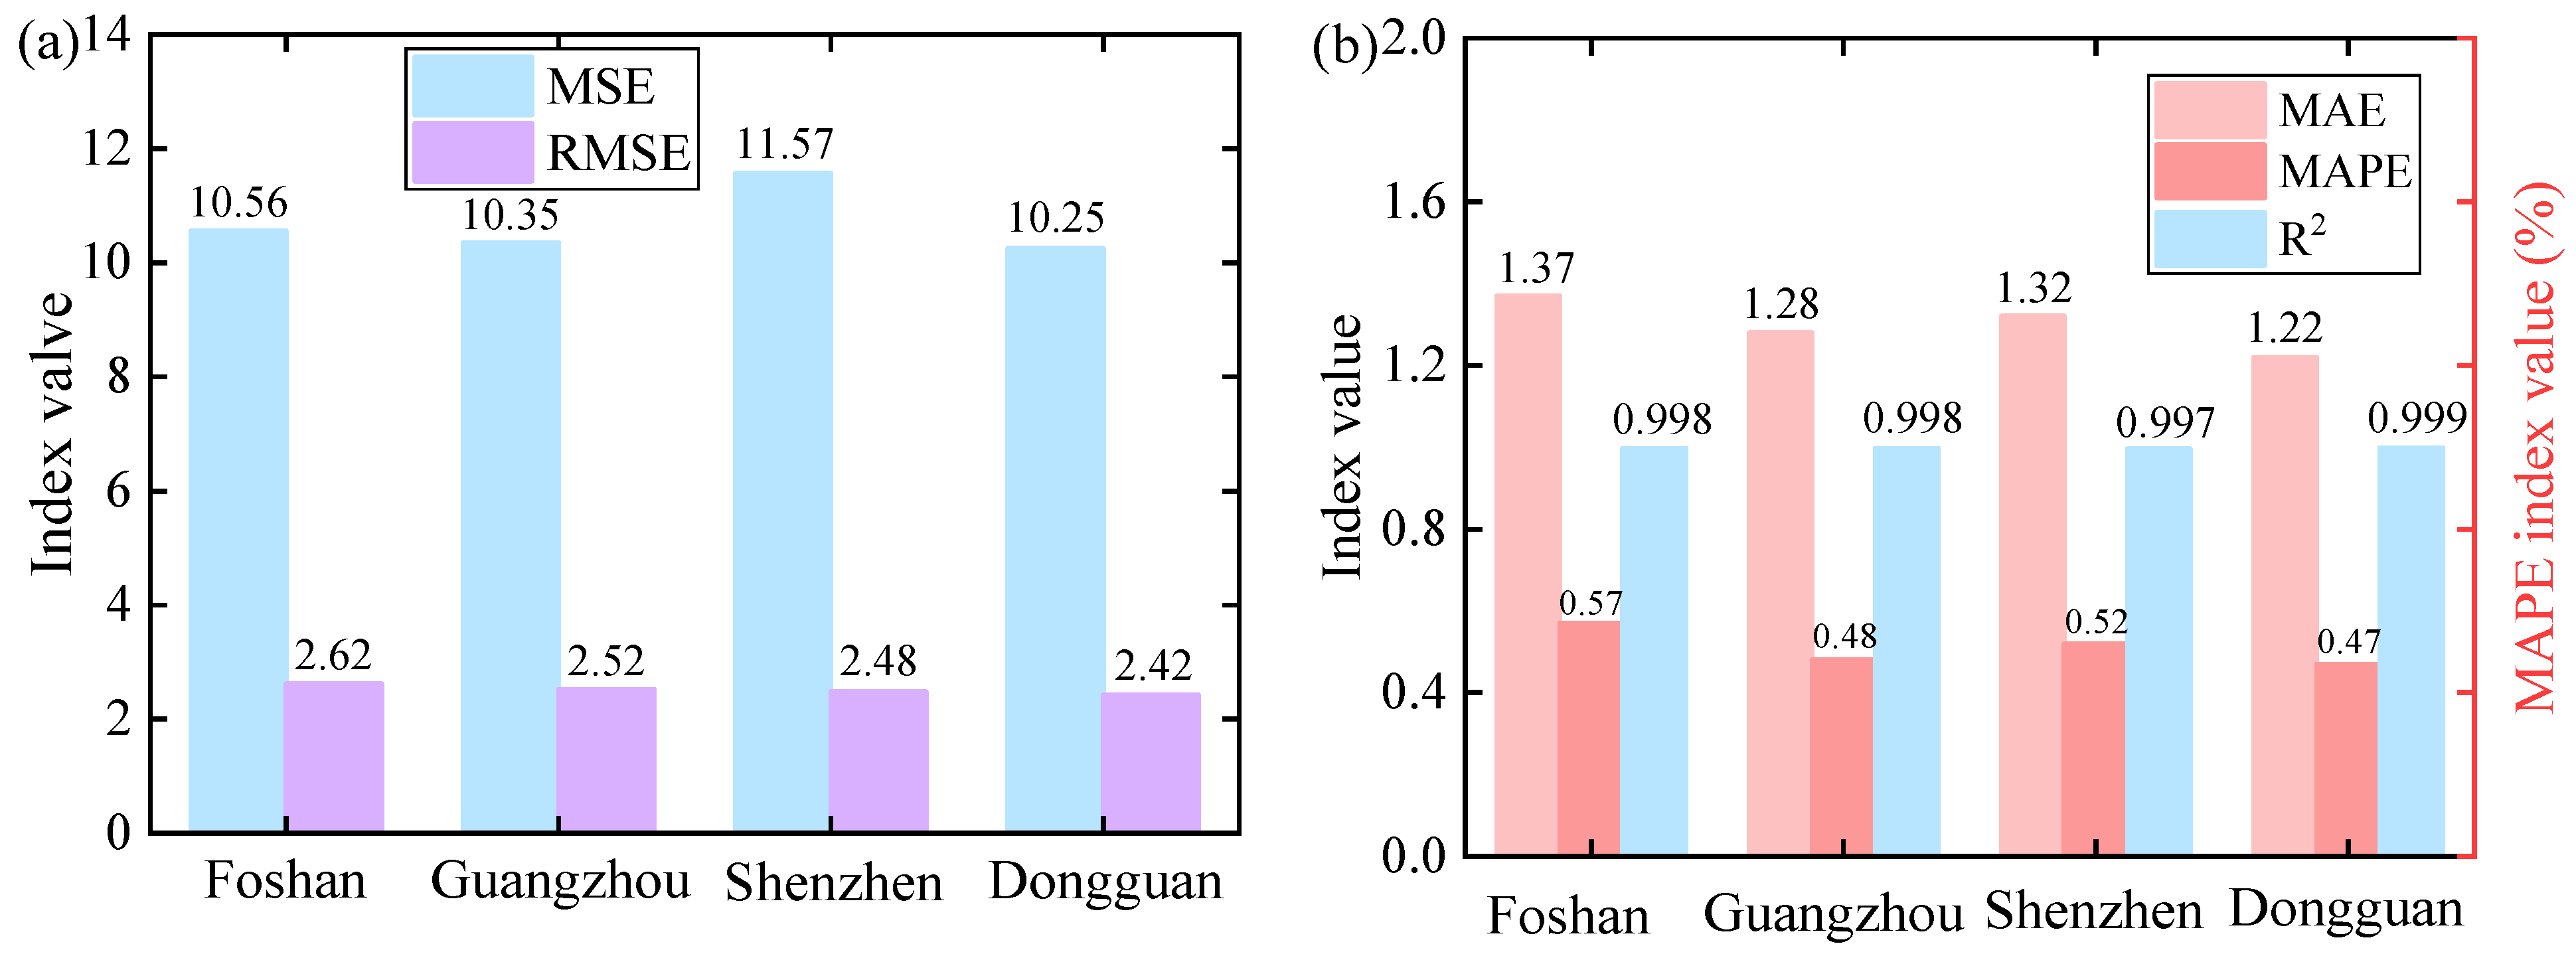
Figure 1. Proposed prediction procedure based on the DB-PINN model.
Buildings 15 02171 g001
Figure 2. Linear regression analysis results: (a) 42.5-grade cement; (b) concrete admixture; (c) medium-graded sand; (d) transportation cost; (e) water; (f) 20 mm coarse aggregate.
Buildings 15 02171 g002
Figure 3. Training and test loss curves of the DB-PINN model.
Buildings 15 02171 g003
Figure 4. Comparison of predicted and actual values for DB-PINN model of (a) Foshan City; (b) Guangzhou City; (c) Shenzhen City; (d) Dongguan City.
Buildings 15 02171 g004
Figure 5. DB-PINN model prediction indexes: (a) MSE and RMSE; (b) MAE, MAPE, and R2.
Buildings 15 02171 g005
Figure 6. MEA results: (a) cumulative real estate construction area; (b) cumulative real estate investment; (c) loan interest rate; (d) money supply; (e) monthly cement production; (f) monthly CPI; (g) monthly GDP; (h) monthly PPI.
Buildings 15 02171 g006
Figure 7. Comparison of predicted and actual values for the traditional ANN model. (a) Foshan City; (b) Guangzhou City.
Buildings 15 02171 g007
Figure 8. Feature importance analysis value ranking.
Buildings 15 02171 g008
Figure 9. Result of Pearson correlation analysis.
Buildings 15 02171 g009
Table 1. Performance indexes of the DB-PINN prediction model.
Performance IndexFoshan CityGuangzhou CityShenzhen CityDongguan City
MSE10.5610.3511.5710.25
RMSE2.622.522.482.42
MAE1.371.281.321.22
MAPE0.57%0.48%0.52%0.47%
R20.9980.9980.9970.999
Table 2. Comparison of the prediction performance of the DB-PINN model and the traditional ANN model.
Performance IndexDB-PINN ModelTraditional ANN Model
MSE10.561115.21
RMSE2.6233.39
MAE1.3721.82
MAPE0.57%2.34%
R20.9980.892
Disclaimer/Publisher’s Note: The statements, opinions and data contained in all publications are solely those of the individual author(s) and contributor(s) and not of MDPI and/or the editor(s). MDPI and/or the editor(s) disclaim responsibility for any injury to people or property resulting from any ideas, methods, instructions or products referred to in the content.

