Article

Study on the Effects of Wind Direction on the Characteristics of Vortex-Induced Vibration for a Square Cylinder

1
School of Management, Shijiazhuang Tiedao University, 17 North Second Ring East Road, Shijiazhuang 050043, China
2
School of Civil Engineering, Shijiazhuang Tiedao University, 17 North Second Ring East Road, Shijiazhuang 050043, China
3
Shijiazhuang Institute of Railway Technology, 18 Sishuichang Road, Shijiazhuang 050041, China
4
Intelligent Control Technology Innovation Center for Bridge and Tunnel Engineering Construction of Hebei Province, 18 Sishuichang Road, Shijiazhuang 050041, China
*
Author to whom correspondence should be addressed.
Buildings 2025, 15(12), 2129; https://doi.org/10.3390/buildings15122129
Submission received: 23 May 2025 / Revised: 11 June 2025 / Accepted: 17 June 2025 / Published: 19 June 2025
(This article belongs to the Special Issue Recent Advances in Technology and Properties of Composite Materials)

Abstract

Due to its complex mechanism of action, the wind-resistant design of square cross-section structures against vortex-induced vibration (VIV) still presents significant challenges. The angle of the wind direction is an important factor affecting the VIV characteristics of square cylinders. A series of stationary model pressure tests were performed and an elastic supporting model was used in the present study. The effects of the wind direction angle on parameters corresponding to fluid–structure interaction were analyzed with reference to the Strouhal number, range of “lock-in”, amplitude, and aerodynamic forces. The Strouhal number of the square cylinder was greatest at a 16° wind direction angle. When the wind direction angle was 10°, the wind speed range of vortex-induced vibration (VIV) of the square cylinder was the greatest, and the corresponding value was the smallest when the wind direction angle ranged from 20° to 45°. Within the vibration interval, the extreme value of the amplitude was smallest when the wind direction angle was 10°, and the extreme value of the amplitude was greatest when the wind direction angle was 30°. The vibration state had a minimal influence on the mean lift coefficient and a relatively large influence on the mean drag coefficient.

1. Introduction

A square cross-section is one of the commonly employed section shapes in the engineering of slender cylinders. Under wind loads, civil engineering structures are prone to damage [1,2], with some structures being susceptible to wind-induced vibrations [3,4,5,6]. Significant fluctuations in lift and drag coefficients occur when the vortex shedding frequency coincides with the natural vibration frequency of the structure, and the dominant frequency is associated with the Strouhal number [7]. The occurrence of vortex-induced vibration (VIV) largely depends on the relationship between the vortex shedding frequency and the natural vibration frequency of the structure. VIV typically arises within a wind speed range wherein the vortex shedding frequency approaches the structure’s natural frequency [8].
In aerodynamic–elastic experiments on cylinders, some researchers have adopted forced vibration test techniques, primarily because free vibration tests do not enable full control over the motion states [9]. Compared with traditional resonance in forced vibrations, the self-excited nature of VIV represents a complex fluid–structure interaction involving multiple parameters such as the natural frequency [8,10], Strouhal number, mass ratio [11,12,13,14], and damping ratio [15,16]. The findings presented in [17] demonstrate that the vibration response of a square cylinder exhibits strong nonlinear characteristics. At low wind speeds within the lock range of the frequency, vibration of the square cylinder significantly affects the lift coefficient in the crosswind direction. When the wind speed moves away from the lock range of the frequency, the influence of vibration of a square cylinder on the lift coefficient diminishes, and the lift coefficient tends to stabilize. In a spectrogram, two separate peak values appear, corresponding to the model’s motion and vortex shedding. The authors of [18] found that the attack angle significantly alters the lift and drag coefficients and their fluctuating characteristics in two square cylinders. When arranged diagonally at a small attack angle, due to enhanced wake turbulence, in this arrangement of square cylinders, the fluctuating lift coefficient of the square cylinder at the wake region is significantly higher than that of a single square cylinder, suggesting that strong fluid–structure interaction may induce vibrations.
The crosswind direction response power spectrum of chamfered models is generally lower than that of square models, indicating that chamfering can effectively suppress high-frequency vibrations caused by vortex shedding. The chamfered model stabilizes the wake region by promoting flow reattachment, thereby reducing fluctuating pressure caused by flow separation and consequently lowering the fluctuation amplitudes of lift and drag [19]. The authors of [20] found that antisymmetric vortex shedding leads to periodic large fluctuations in lift; in comparison, symmetric vortex modes reduce lift fluctuations and suppress resonance risks. The findings presented in [21] demonstrate that, based on pressure distribution on the model’s top surface, strong negative pressure (suction) in the conical vortex core region is the primary contributor to crosswind lift. The low-frequency peak in pressure spectral density (corresponding to the vortex shedding frequency) and its high-frequency components (corresponding to the vortex shedding frequency) can indirectly reflect the frequency characteristics of lift fluctuations.
At present, researchers investigating the VIV of cylinders primarily focus on the circular section, with a multitude of research results being obtained. Due to the complexity of the VIV fluid–structure interaction of a square cylinder, research on its VIV characteristics is relatively scarce. In terms of the influence of the wind direction, researchers mainly focus on the influence on the Strouhal number of a stationary square cylinder. However, there are relatively few studies on the effects of wind direction on the “lock-in” range and amplitude of the VIV of a square cylinder [22]. In the study presented in this paper, the results of a pressure test on a rigid segment model and a simultaneous pressure and vibration test on the rigid segment model of elastic suspension are presented. By using these methods, the effects of the wind direction on the square cylinder’s Strouhal number at rest and the effect of the lock-in range, amplitude, and aerodynamics of a square cylinder’s VIV are systematically investigated.

2. Test Overview

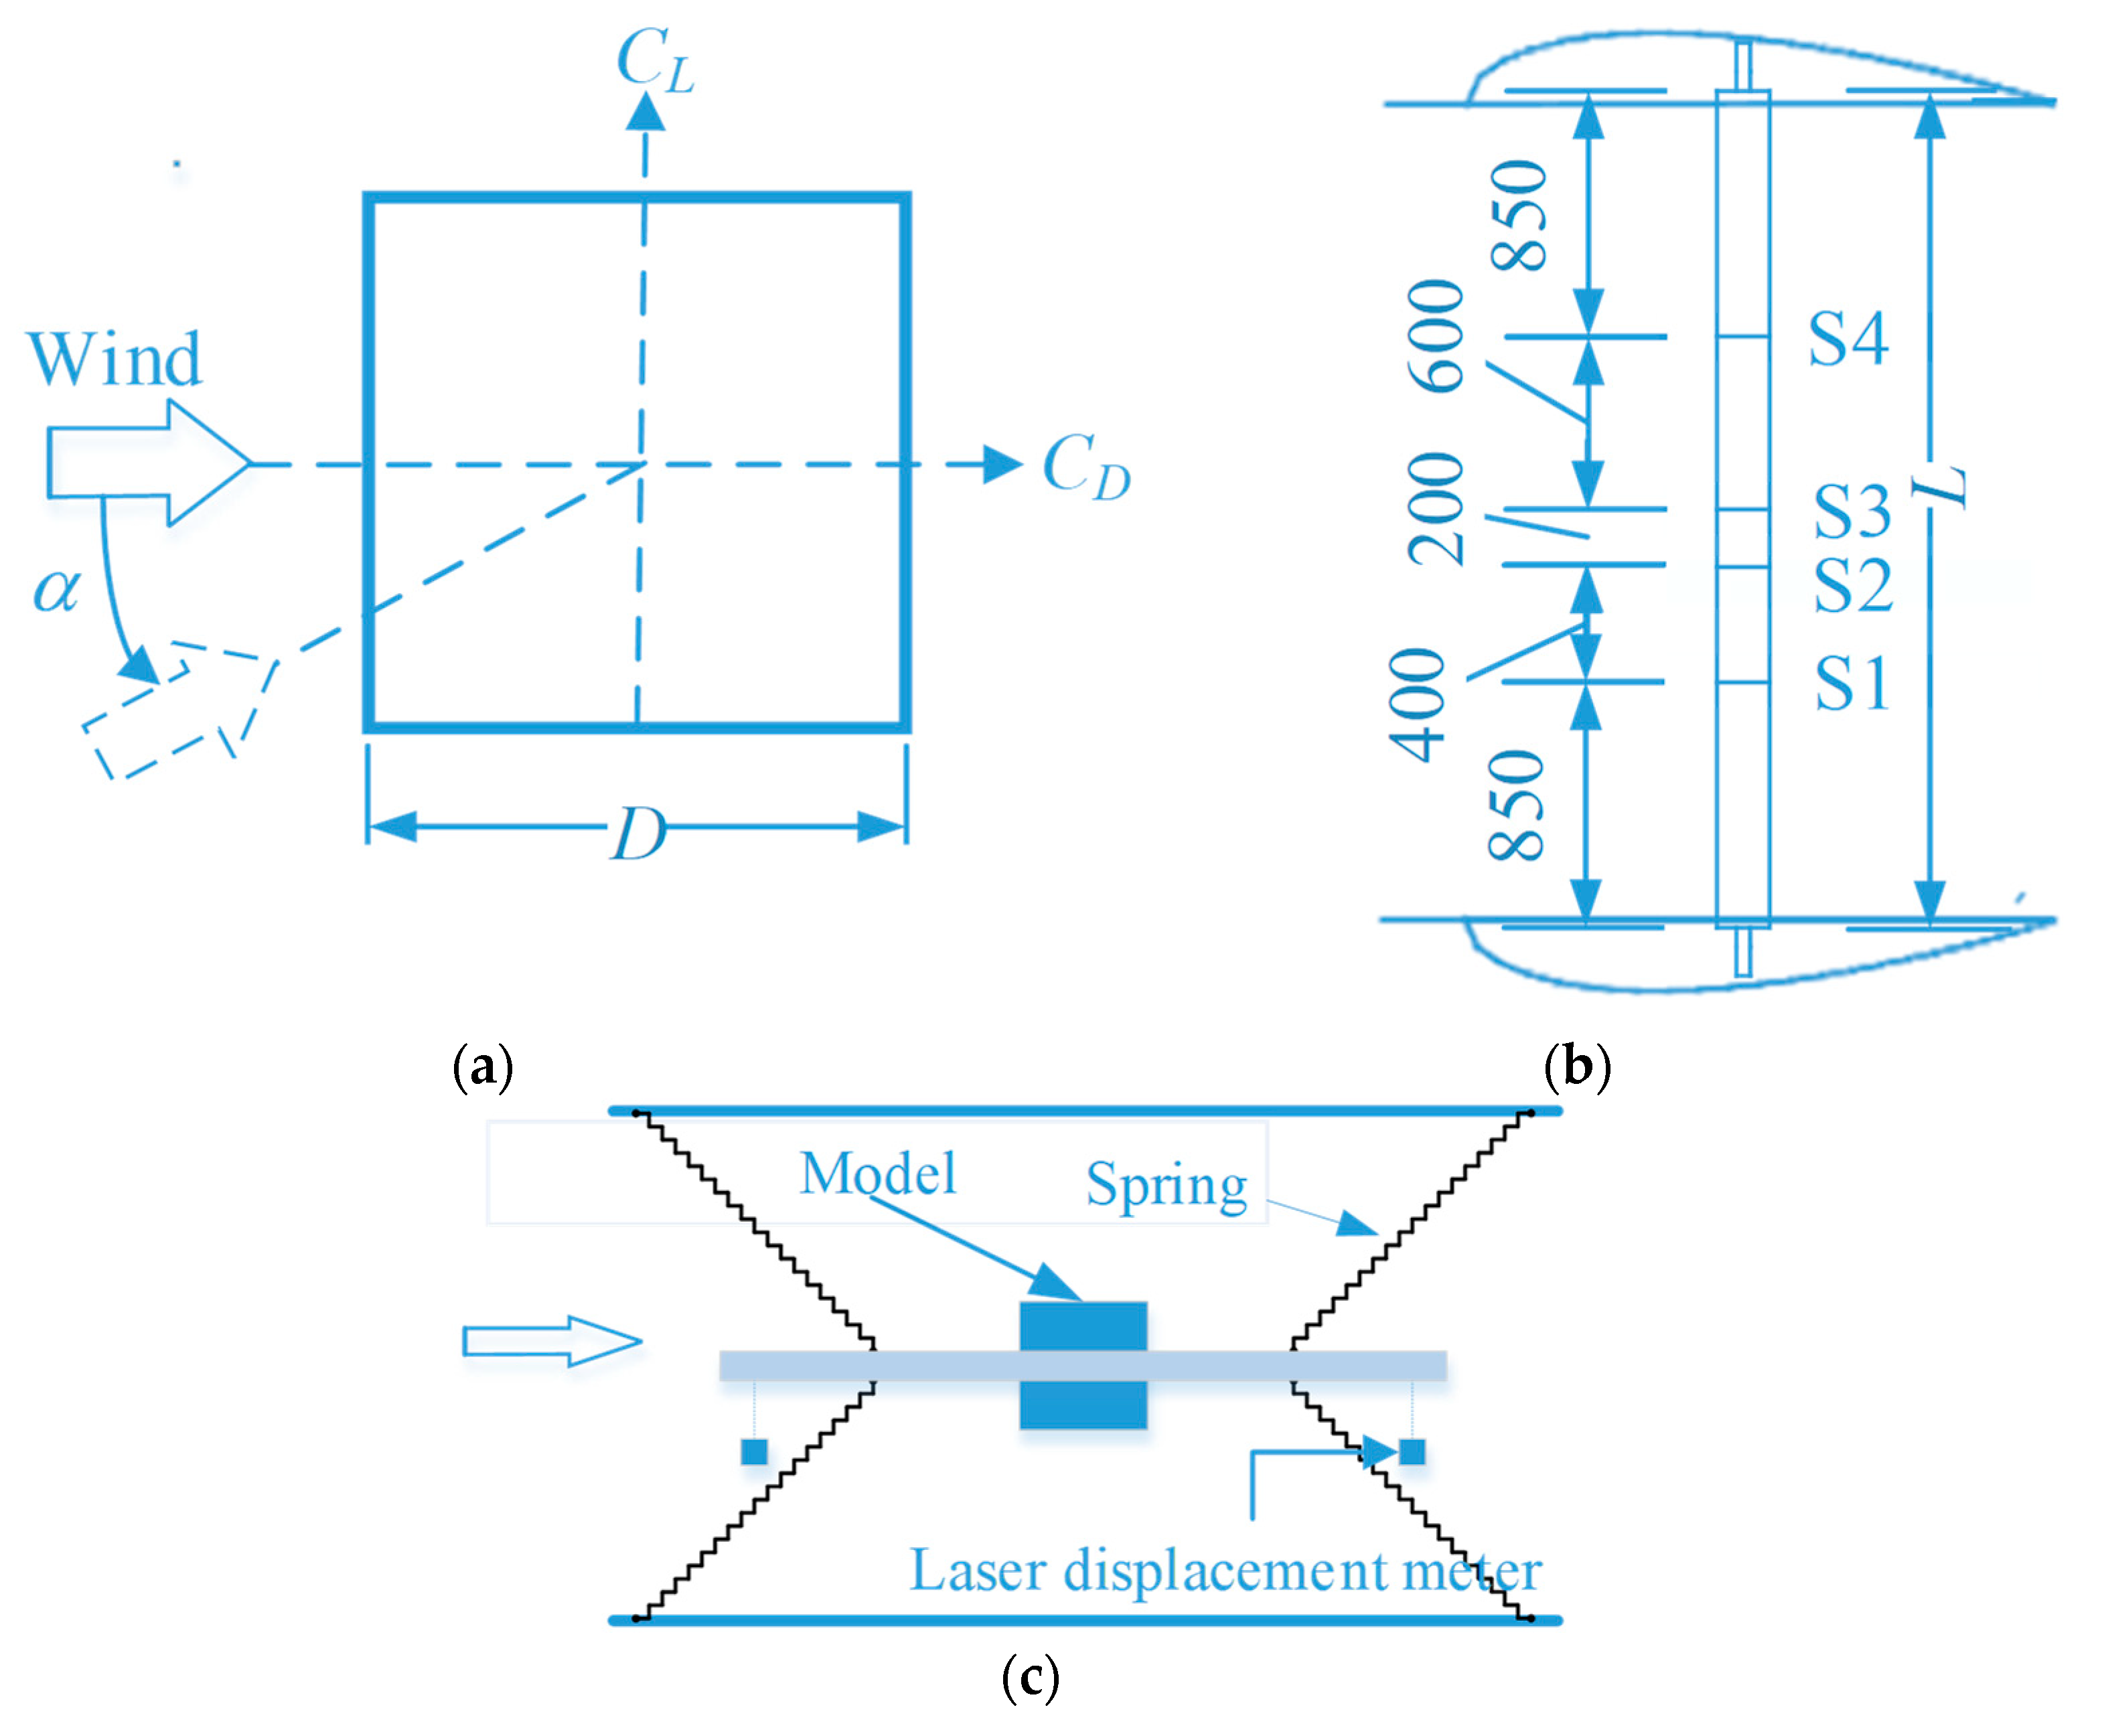
2.1. Test Equipment and Model

The test described herein was conducted in the low-speed test section of the STDU-1 wind tunnel of Shijiazhuang Tiedao University, with a width of 4.4 m, a height of 3.0 m, and a length of 24.0 m, and it was possible to continuously adjust the wind speed from 3 to 30 m/s. The test flow field had a uniform flow, the incoming turbulence was less than 0.4%, and the wind speed non-uniformity was less than 0.4% (the test value was 23 m/s).
The section length of the test model was D = 180 mm and L = 2900 mm, and the blockage percentage of the test was 3.9%. The model was composed of acrylonitrile–butadiene–styrene (ABS), with a steel pipe 50 mm in diameter added to the center to improve its stiffness. End plates (2.5 m × 2.5 m) were installed at the end of the model to reduce the influence of free flow at the end. Fifty pressure measuring holes were arranged in sections S1, S2, S3, and S4 along the model. A deflector with a fairing was installed at both ends of the model to eliminate the end effect, as shown in Figure 1. The pressure test was conducted using an ESP-64Hd Pressure Scanning Valve Tester, which was placed inside the model, and the pressure-measuring tube length was 0.8 m. The sampling frequency of the pressure test equipment was 331.7 Hz. To eliminate the influence of the pressure-measuring pipe on the test data, a relevant method proposed in the literature [23] was adopted for correction. The model was fixed on the test support during the static test. During the elastic test, the model was suspended by four springs above and below to form a mass–spring–damping system. During the test, the vibration displacement of the model was measured using the laser displacement meter installed at both ends of the model. The sampling frequency of the displacement test equipment was 1000 Hz. In China, the frequency of the alternating current (AC) was 50 Hz. We eliminated the effect of AC power on the test results by filtering out the components above 50 Hz. Synchronous trigger technology was used for test data acquisition, and data acquisition instructions were sent to the electronic pressure scanning valve system and the laser displacement meter system simultaneously, with it being possible to collect the model vibration displacement and wind pressure changes concurrently. The wind speed test equipment was a 4-hole Cobra Probe, and the sampling frequency was 625 Hz.

2.2. Operating Conditions of the Test

The test wind direction α ranged from 0° to approximately 45°, as shown in Figure 1a. Since the square cylinder was more prone to transverse wind gallops when α = 0°~20°, in order to better understand the static aerodynamic characteristics of the square cylinder in the range of the wind direction, the wind direction was separated by 2° between 0° and approximately 20° and by 5° between 20° and approximately 45° during the static test. During the elastic test, five typical wind directions of 0°, 10°, 20°, 30°, and 45° were selected to perform the segment model VIV elastic test. The range of wind speeds in the test was roughly from 2.0 m/s to 10.0 m/s, with a wind speed interval of about 0.1 m/s. The test photos are shown in Figure 1d.

2.3. Parameter Definition

The wind pressure coefficient is defined as follows:
C p ( i ) = P ( i ) P 0 0.5 ρ U r 2
where i is the measuring point index; Cp(i) is the wind pressure coefficient at the i measuring point, with the average wind pressure coefficient denoted by Cp; P(i) is the wind pressure at the measuring point i; P0 is the static pressure; ρ is the air density; and Ur is the reference wind speed, taken here as the incoming wind speed V.
The average lift and drag coefficients (CL and CD) were obtained using the following equations:
C L = C p ( i ) sin ( θ i ) D i D C D = C p ( i ) cos ( θ i ) D i D
where θ i is the angle between the normal value of the surface of the measuring point i and the incoming flow direction and Di is the calculated length corresponding to the measuring point i.
In the following analysis, C′p, C′D, and C′L represent the root mean square (RMS) values of the wind pressure coefficient, drag coefficient, and lift coefficient, respectively.
The critical wind speed for the VIV of the square cylinder was estimated using the following equation:
V c r = f n D / S t
where fn is the natural frequency of the cylinder and St is the Strouhal number, which is defined as follows:
S t = f s D / V
In the formula, fs is the vortex shedding frequency of the fluid.
The cylinder damping ratio (ξ) can be calculated using the following equation:
ln v n v n + m = 2 m π ζ 1 ζ 2
where Vn is the maximum amplitude at cycle n; vn+m is the maximum amplitude at cycle n + m; and m is the number of calculation cycles.
The maximum dimensionless amplitude of the square cylinder is as follows:
η = A / D = m e a n ( A i ) / D
where Ai is the amplitude of the cylinder vibration in cycle i, defined as the distance of the square cylinder from the maximum displacement to the equilibrium position during that cycle, and A is the average value of Ai over the entire sampling period for a given wind speed.

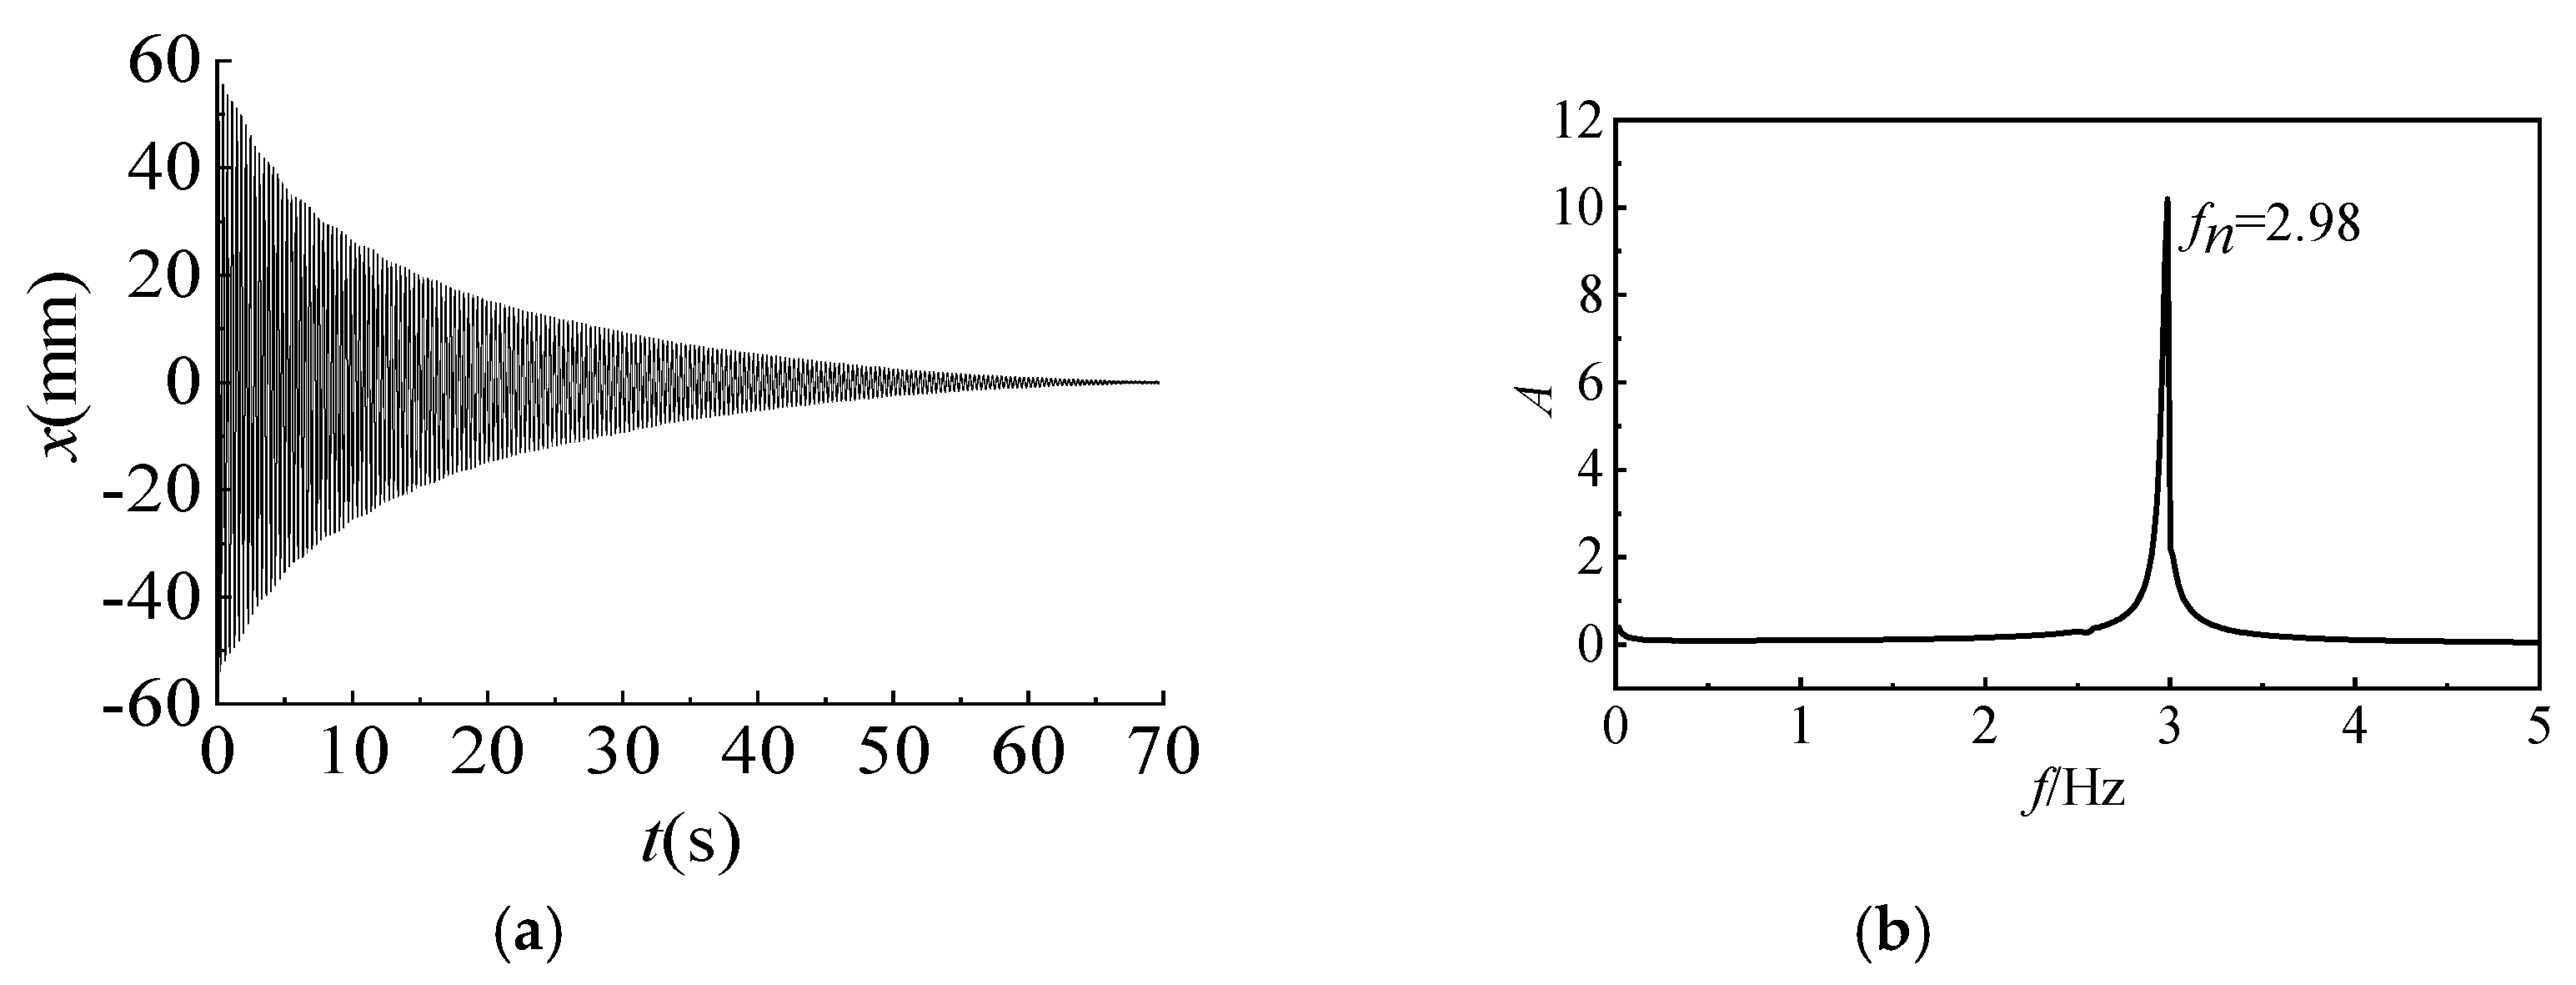
2.4. Dynamic Characteristics of the System

First, the dynamic characteristics of the test model were identified. Under no-wind conditions, a significant initial vertical displacement was applied to the model, and the displacement response time history during its free decay motion was recorded. By performing the FFT, the power spectral density curve of the lateral vibration amplitude of the cylinder was obtained, as shown in Figure 2b. From the results presented in Figure 2b, the natural frequency of the cylinder was determined to be fn = 2.98 Hz. Using Equation (5) to analyze the displacement decay time history shown in Figure 2a, the damping ratio of the structure was calculated to be ξ = 0.613%.

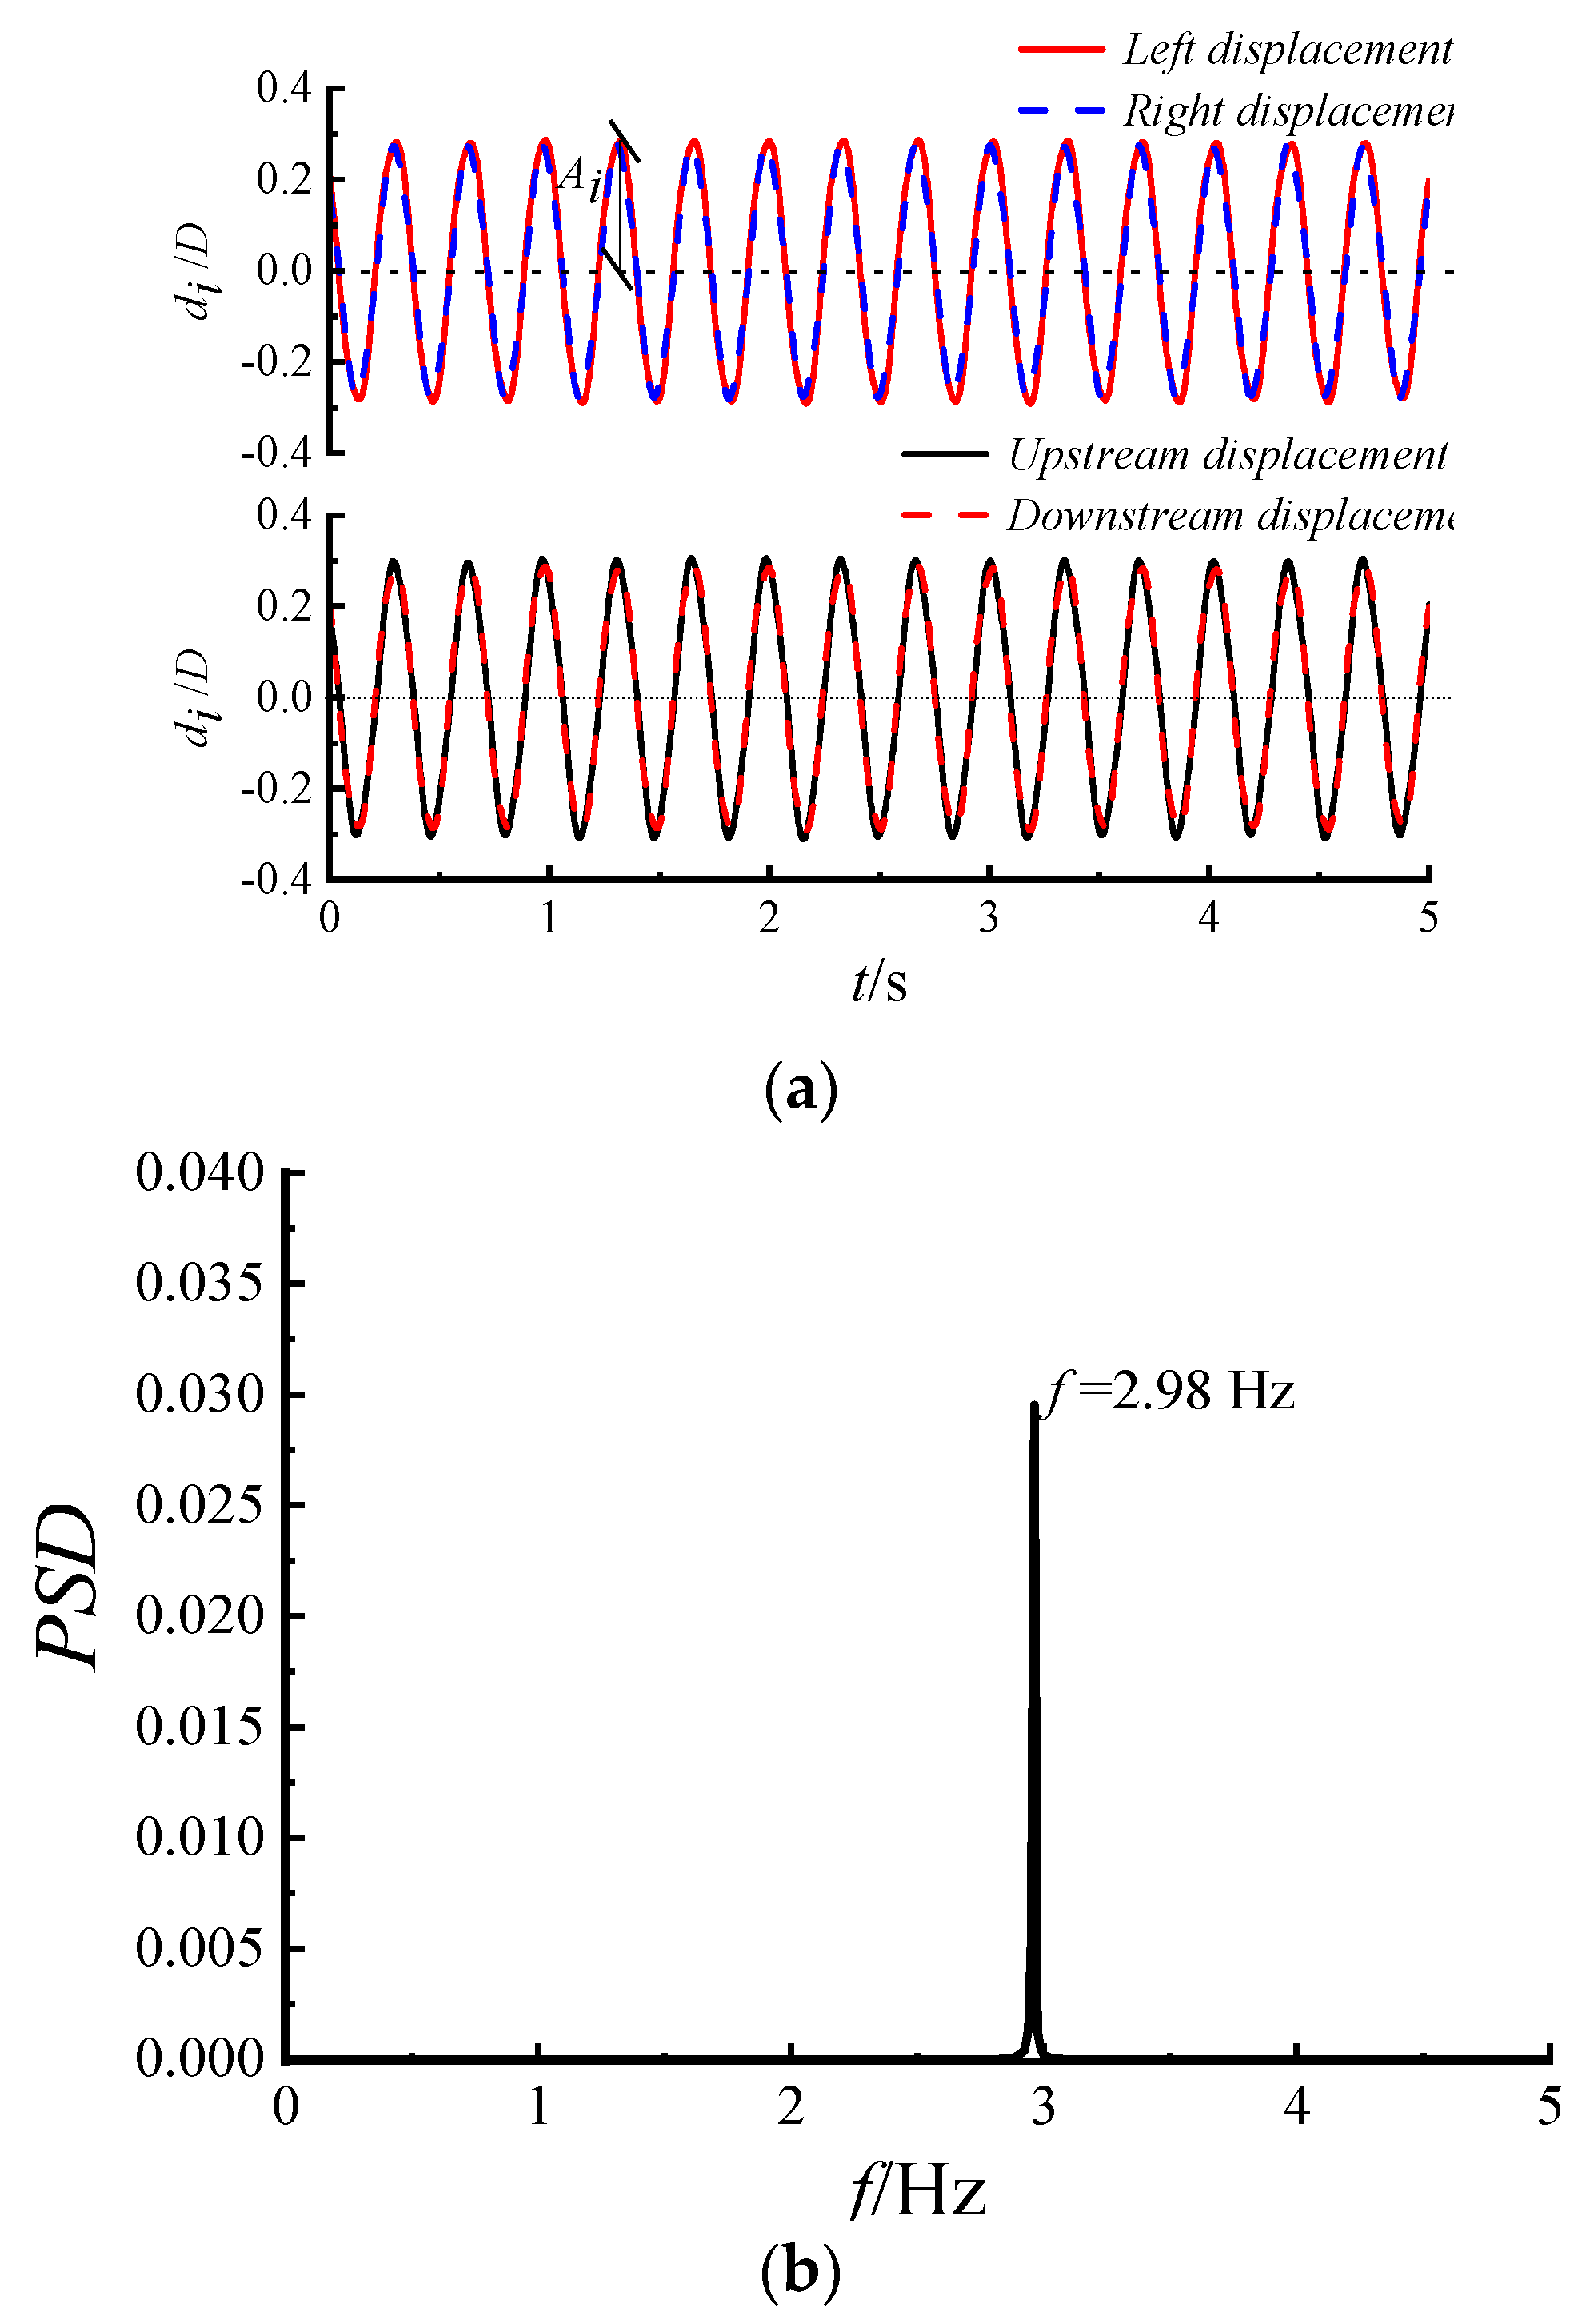
3. Occurrence of Vortex-Induced Vibrations

In Figure 3, the results show the displacement time history of the model undergoing large-amplitude vibrations at a wind direction angle of 0°. The vibration behavior of the model under other conditions was similar to that shown in Figure 3a. It can be observed that the displacement time histories collected by the laser displacement sensors upstream, downstream, and at both ends of the model showed no phase difference. This finding indicates that during the VIV process, the model’s vibration was uniform, without uneven swaying or torsional motion. The observed vibration was a large-amplitude, cross-wind vibration. Figure 3b shows the characteristic distribution of the vibration displacement spectrum of the structure, which is characterized by a single superior frequency and the same frequency as the natural frequency. This finding could indicate that this vibration was a single-degree-of-freedom vibration.

4. Test Conclusions

4.1. Influence of Wind Direction on Strouhal Number

The Strouhal number is a crucial parameter in studying the characteristics of VIV. Figure 4 compares the Strouhal numbers of the stationary square cylinder at different wind direction angles obtained from static tests in this study with the results presented in other studies [24,25]. In Figure 4, the variation curve of the critical wind speed (Vcr) for VIV with wind direction angles is also illustrated.
As shown in Figure 4, the variation pattern of the Strouhal number with the wind direction angles in this study aligns well with the results from the numerical simulations and tests. Numerically, it is closer to the test results reported in [24,25]. According to Equation (3), Vcr is inversely proportional to the Strouhal number; when the Strouhal number reaches its maximum, Vcr is at its minimum.
It can be seen from Figure 4 that when α ≈ 16°, the Strouhal number reached its maximum, and Vcr reached its minimum. The relationship between the variation curve of Vcr with the wind direction angle and the variation curve of the Strouhal number with the wind direction angle aligns well with theoretical expectations.

4.2. Influence of Wind Direction on Lock-In Range and Amplitude

Figure 5 shows the variation curves of the dimensionless amplitude (η) and vortex shedding frequency (fs) with the wind speed ratio for the square cylinder model under VIV at different wind directions. The amplitude showed a tendency to increase and then decrease with the increase in wind speed, which means that the square cylinder vibrated only in a specific wind speed interval, which is consistent with the characteristics of vortex- induced vibration. To facilitate comparative analysis, Figure 6 and Figure 7 present the variation curves of the dimensionless amplitude (η) and the VIV lock-in range (LR) with the wind direction, respectively. Here, LR is defined as the ratio of the termination wind speed ratio (V2/Vcr) to the initiation wind speed ratio (V1/Vcr) of VIV, as shown in Figure 5. Based on Figure 5, Figure 6 and Figure 7, the following observations can be made.
The variation pattern of the VIV amplitude of the square cylinder with the wind speed ratio was generally consistent across different wind direction angles, showing an initial increase followed by a decrease. The peak amplitude occurred at a wind direction angle of 10°, with a value of ηmax = 0.132. The peak amplitude at a 30° wind angle was the largest with ηmax = 0.305. For the other wind direction angles, the peak amplitude ranged from 0.225 to 0.305. During VIV, the magnitude of the inertial force experienced by the cylinder was related to the vibration amplitude; the larger the amplitude, the greater the inertial force. Thus, it can be inferred that the crosswind inertial force on the square cylinder during VIV was the smallest at a wind direction angle of 10°and the largest at 30°.
By comparing the wind speed ratio V/Vcr during VIV with 1.0, the relationship between the actual onset wind speed of VIV and the critical wind speed (the theoretical wind speed at which VIV occurs) for the square cylinder could be determined. At wind directions of 0° and 10°, the wind speed ratio V/Vcr ≈ 1.0, indicating that the actual onset wind speed of VIV matched the theoretical value. However, in other wind directions, the wind speed ratio V/Vcr < 1.0, suggesting that the actual onset wind speed of VIV was lower than the theoretical value. This finding demonstrates that the square cylinder entered the VIV lock-in range earlier under these wind directions.
The wind direction angle significantly influenced the lock-in range of VIV for the square cylinder. For α = 0°, the lock-in range was relatively large (LR ≈ 1.55). When α = 10°, the lock-in range was the largest at approximately LR ≈ 1.77. For other wind directions, the lock-in range of VIV was comparatively small, ranging from 1.1 to 1.2.

4.3. Effect of Wind Direction on Coupled Aerodynamic Forces

In this study, we investigated the relationship between the VIV amplitude and aerodynamic force coefficients of a square cylinder under different wind direction angles with the wind speed ratio, as shown in Figure 8. In Figure 8, the shaded area represents the range of the aerodynamic force coefficient’s mean value with or without the corresponding root mean square (RMS) value.
When α = 0° (Figure 8a,b), the mean drag coefficient inside the lock-in range of VIV was slightly higher than that outside the lock-in range; however, the difference was not significant. The RMS of the drag coefficient remained relatively stable throughout the entire process. The mean lift coefficient also showed almost no variation, with an average value close to zero. The RMS value of the lift coefficient was approximately 0.4 when the cylinder did not vibrate. However, during VIV, the RMS value of the lift coefficient increased significantly, reaching a maximum of 1.3. The RMS value of the lift coefficient inside the lock-in range was greater than that outside. When α = 10° (Figure 8c,d), excluding the nonzero mean lift coefficient, the results were similar to those observed at a wind direction angle of 0°.
When α = 20° (Figure 8e,f), the mean drag coefficient gradually increased with the rise in vibration amplitude during VIV. Conversely, it decreased as the amplitude decreased. The mean drag coefficient inside the lock-in range of VIV was higher than that outside the range. The mean lift coefficient gradually decreased with the increase in vibration amplitude; however, the variation was minor, remaining stable around −0.4 within the lock-in range. When α = 30° and 45° (Figure 8g,j), the variation between the amplitude and aerodynamic force coefficients during VIV was similar to that observed at a wind direction angle of 20°. However, at 30°, the mean lift coefficient first increased and then decreased within the lock-in range. In comparison, at 45°, the mean lift coefficient remained close to zero. The significant increase in the RMS value of the lift and drag coefficients during VIV, specifically the notably higher values inside the lock-in range compared with those outside, was mainly due to the substantial disturbance of the surrounding flow field caused by the cylinder’s vibration. This disturbance affected the state and intensity of vortex shedding, enlarging the range of the negative pressure region in the wake of the square cylinder. As a result, there was a strong coupling effect between the VIV amplitude of the square cylinder and the aerodynamic forces.
The variation curves of the mean drag and lift coefficients with the wind direction angle for the square cylinder at the peak amplitude within the VIV lock-in range and under non-vibrating conditions are shown in Figure 9 and Figure 10, respectively. In Figure 11, the variation curves of the RMS value of the square of the aerodynamic coefficients with the wind direction angle are illustrated. In Figure 11, CD and C′D represent the mean and RMS values of the drag coefficients under non-vibrating conditions, respectively. In comparison, CL and C′L are the mean and root mean square (RMS) of the lift coefficients, respectively. CDmax, C′Dmax, CLmax, and C′Lmax represent the mean and RMS of the drag coefficient and the mean and RMS of the lift coefficient corresponding to the peak amplitude within the VIV lock-in range, respectively. From the results presented in Figure 9, Figure 10 and Figure 11, the following conclusions can be drawn.
The wind direction angle had a significant impact on the variation in the mean drag coefficient during the VIV process (Figure 9). At α = 0°and 10°, the mean drag coefficient of the square cylinder showed almost no change regardless of whether it vibrated or not. However, for other wind direction angles, the mean drag coefficient increased significantly.
The wind direction angle had a relatively minor effect on the variation in the mean lift coefficient during the VIV process (Figure 10). When α = 0° and 45°, the mean lift coefficient showed almost no change during the occurrence of VIV. For other wind direction angles, the mean lift coefficient changed slightly; it decreases slightly at α = 20°, and in comparison, it increased slightly at α = 10° and 30°. However, the overall variation remained minimal.
The wind direction angle had a significant effect on the variation in the RMS of the aerodynamic coefficients during the VIV process (Figure 11). When α = 0° and 10°, the RMS of the drag coefficient remained unchanged during vibration. In comparison, the RMS of the lift coefficient increased slightly. For other wind direction angles, the structure’s vibration had a considerable impact on the RMS value of both the drag and lift coefficients. Notably, at α = 20° and 30°, the vibration had the greatest effect on the RMS of the drag coefficient and lift coefficient. By analyzing the variation curve of the peak amplitude with the wind direction angle, shown in Figure 6, it can be observed that this curve closely matches the variation in C′Lmax with the wind direction angle. This finding indicates that the peak amplitude of the structure during VIV is related to the RMS value of the lift coefficient.

4.4. Influence of Wind Direction on Wind Pressure Distribution

Figure 12 illustrates the wind pressure distribution on the model’s surface at a typical wind speed ratio. The numerical values marked in Figure 12 represent the mean wind pressure coefficients at the center of the corresponding edges (indicated by the dots). The shaded areas represent the mean wind pressure coefficient with or without the root mean square (RMS) value of the wind pressure coefficient. The width of the shaded area indicates the magnitude of wind pressure coefficient fluctuations. Based on the results presented in Figure 12, the following observations can be made.
When α = 0° (Figure 12a), the flow separated at the edges of the windward surface, forming negative pressure regions on the top, bottom, and leeward surfaces. The cylinder vibration reduced the pressure on the windward surface, leading to a decrease in its mean wind pressure coefficient. The variation in vortex shedding induced by the cylinder vibration significantly affected the wind pressure on the top and bottom surfaces; however, it had a smaller impact on the leeward surface. This finding indicates that the wind pressure on the top and bottom surfaces makes the greatest contribution to cylinder vibration.
When α = 10° (Figure 12b), cylinder vibration had a more significant effect on the wind pressure of the bottom surface. In comparison, its impact on the other three surfaces was relatively smaller. This finding suggests that variations in wind pressure on the bottom surface make the greatest contribution to cylinder vibration. When α = 20°, 30°, and 45° (Figure 12c,e), cylinder vibration had a greater influence on the wind pressure of the leeward and top surfaces, inducing significant changes in both the mean and RMS of the wind pressure coefficients. In contrast, its impact on the other two surfaces was relatively smaller. This finding indicates that wind pressure variations on the leeward and top surfaces play a major role in cylinder vibration.
By combining this analysis with the non-dimensional amplitude variation curves with the wind speed ratio for the different wind direction angles shown in Figure 5, a relationship between cylinder vibration and the wind pressure distribution can be established. Cylinder vibration alters the state of vortex shedding after flow separation, leading to changes in the surface wind pressure. Our results indicate that as the vibration amplitude increased, the corresponding fluctuating wind pressure coefficient also increased. When the wind direction angle changed, the flow separation points and vortex shedding patterns also shifted, causing variations in the effects of vortex shedding on the wind pressure of different surfaces.

5. Conclusions

In the present study, the wind tunnel test method was employed to study the influence of the wind direction on the aerodynamic force and vibratory characteristics of a square cylinder. Through analysis, the main conclusions are as follows:
  • The Strouhal number of the square cylinder first increased and then decreased with the increase in wind direction, reaching its maximum at approximately 16°.
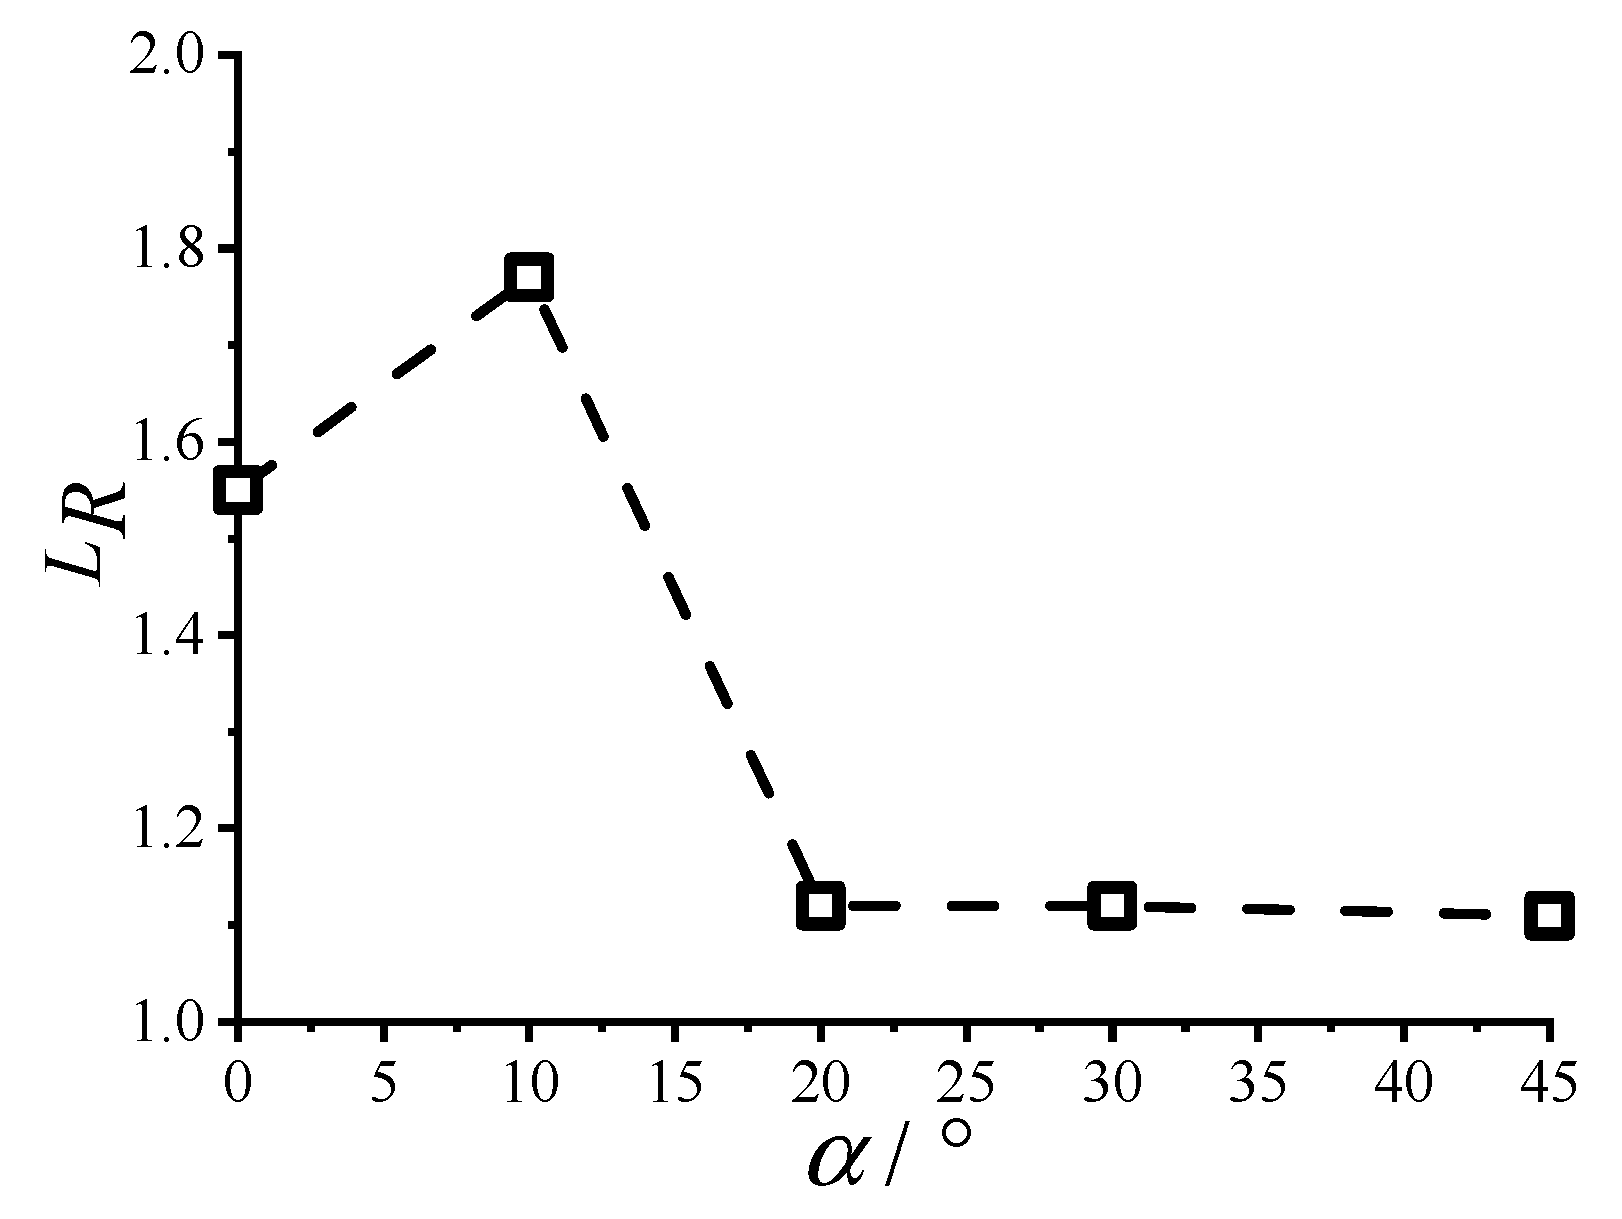
  • The wind direction had a significant impact on the lock-in range and maximum amplitude of VIV in the square cylinder. At a wind direction of 10°, the lock-in range was the largest. In comparison, the amplitude was the smallest. At 0°, both the lock-in range and maximum amplitude were relatively large.
  • The amplitude of the square cylinder was smallest at the 10° wind direction angle and greatest at the 30° wind direction angle.
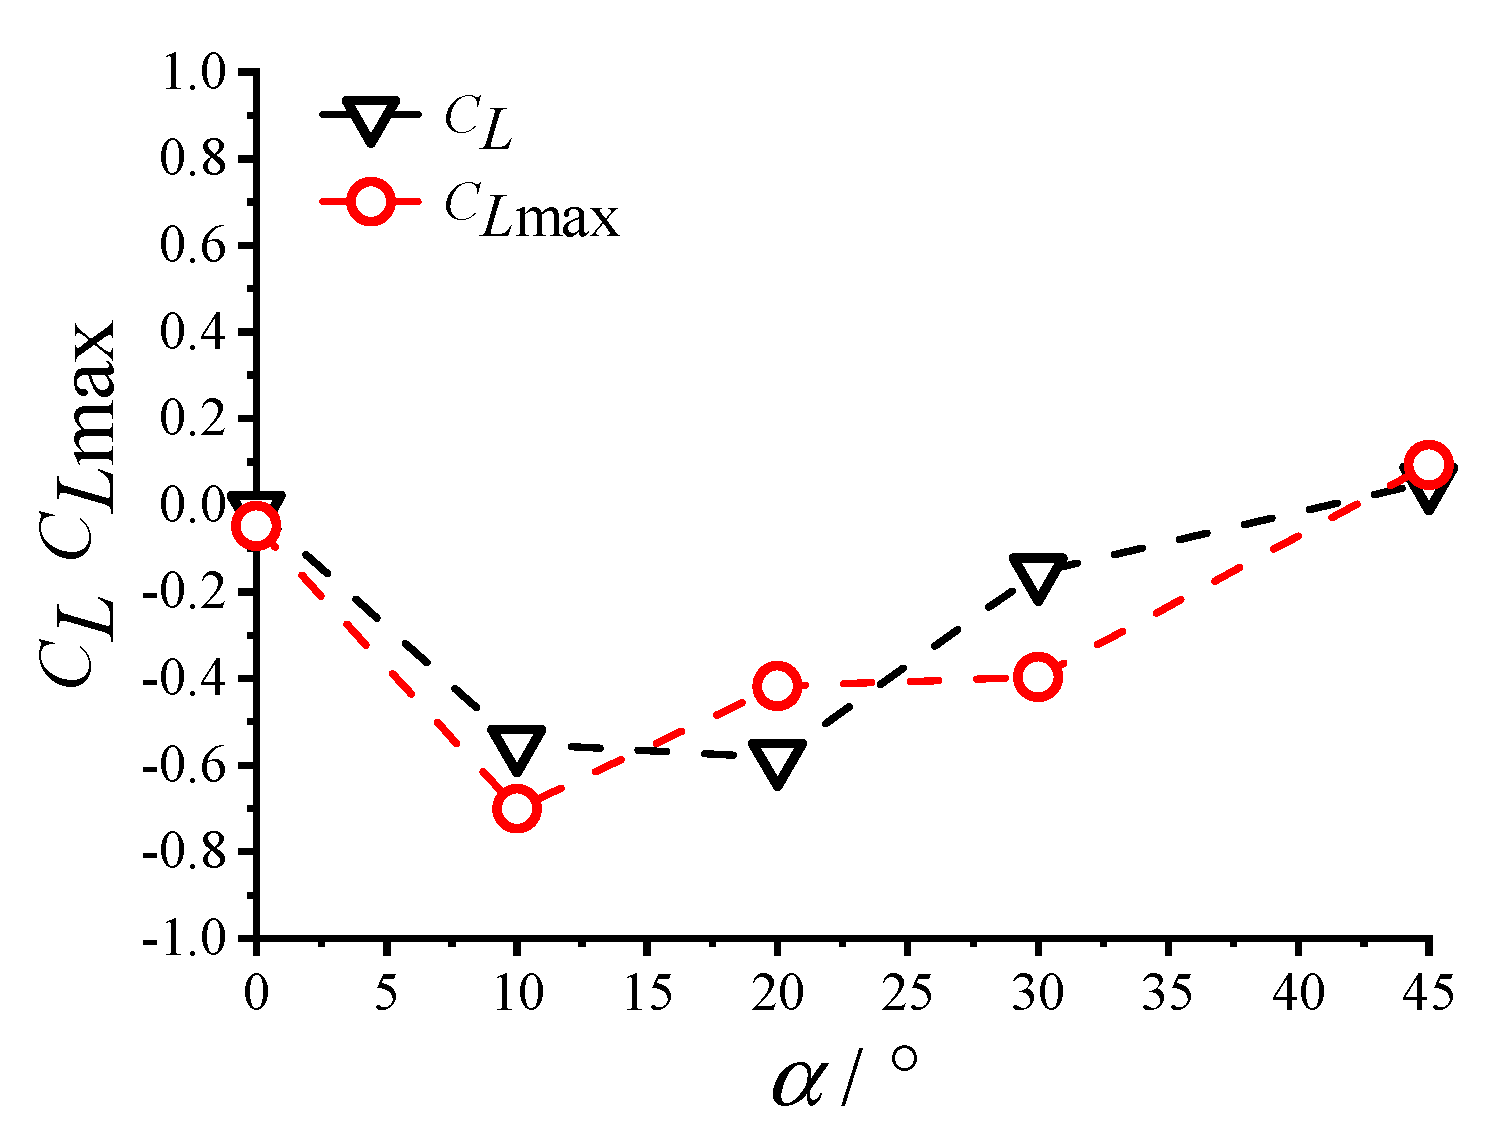
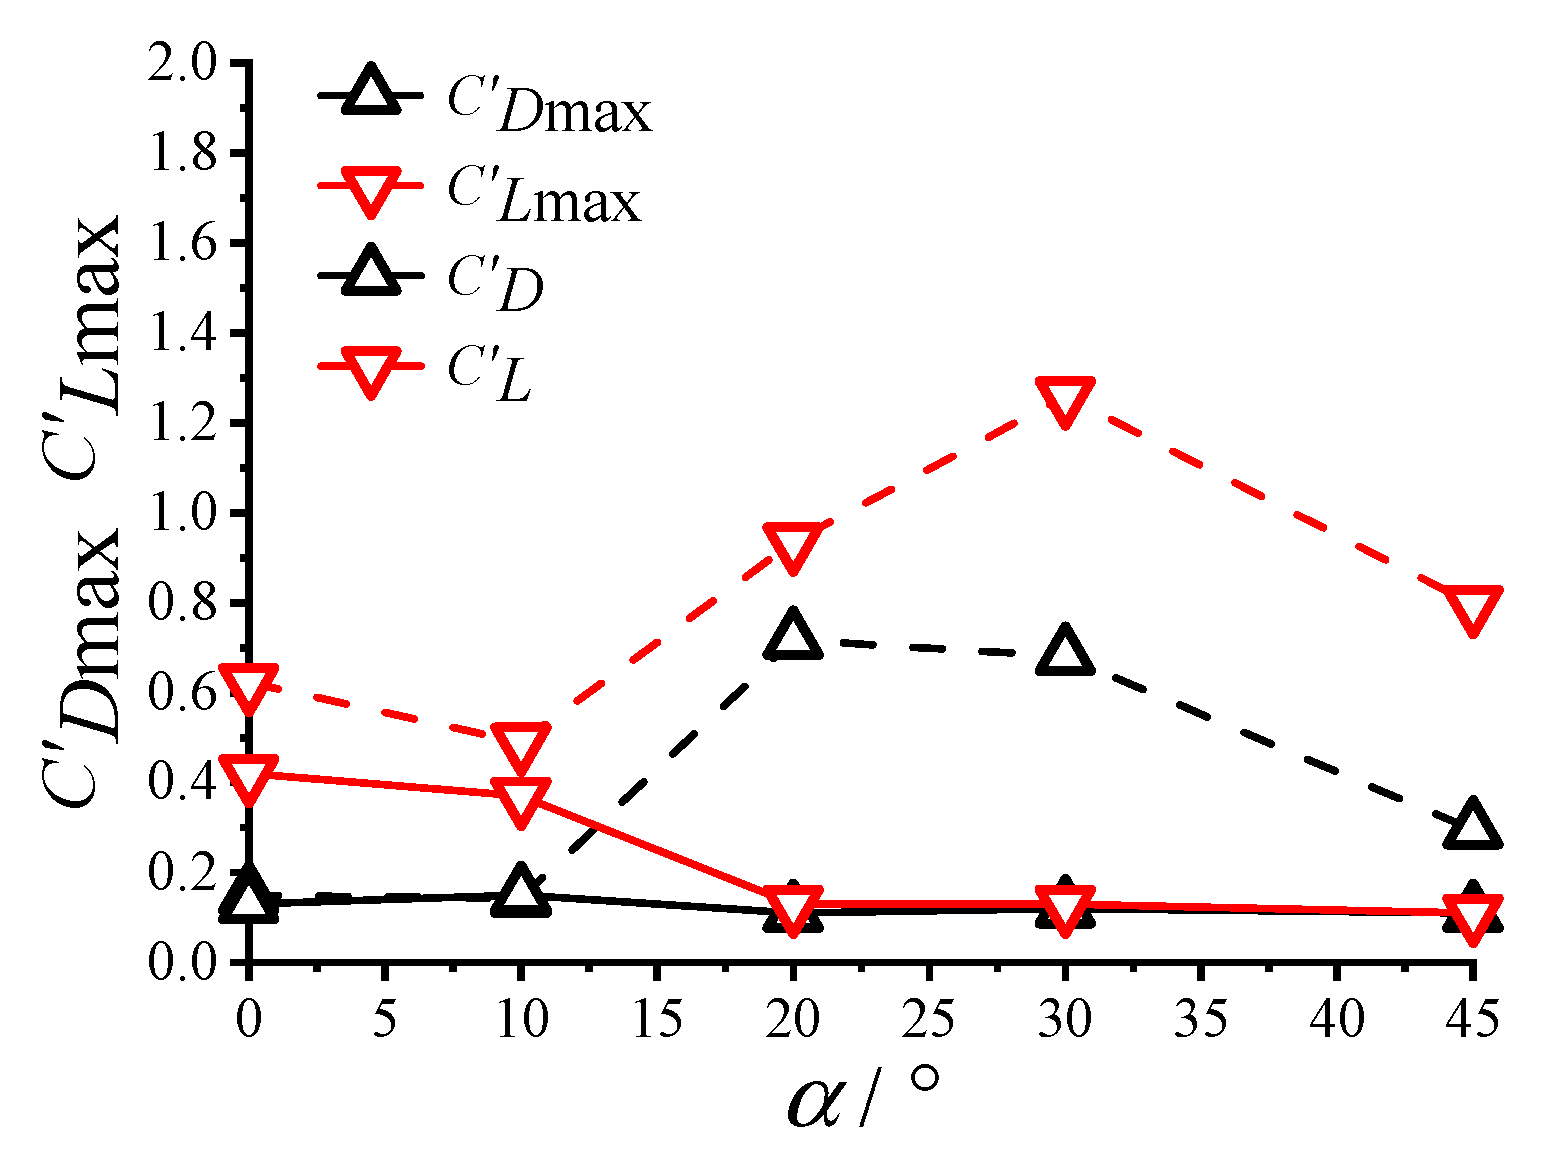
  • Compared with a stationary square cylinder, the wind direction had a smaller impact on the mean lift coefficient of the vibrating square cylinder but a greater impact on the mean drag coefficient, with the most significant effects occurring at wind directions of 20° and 30°.
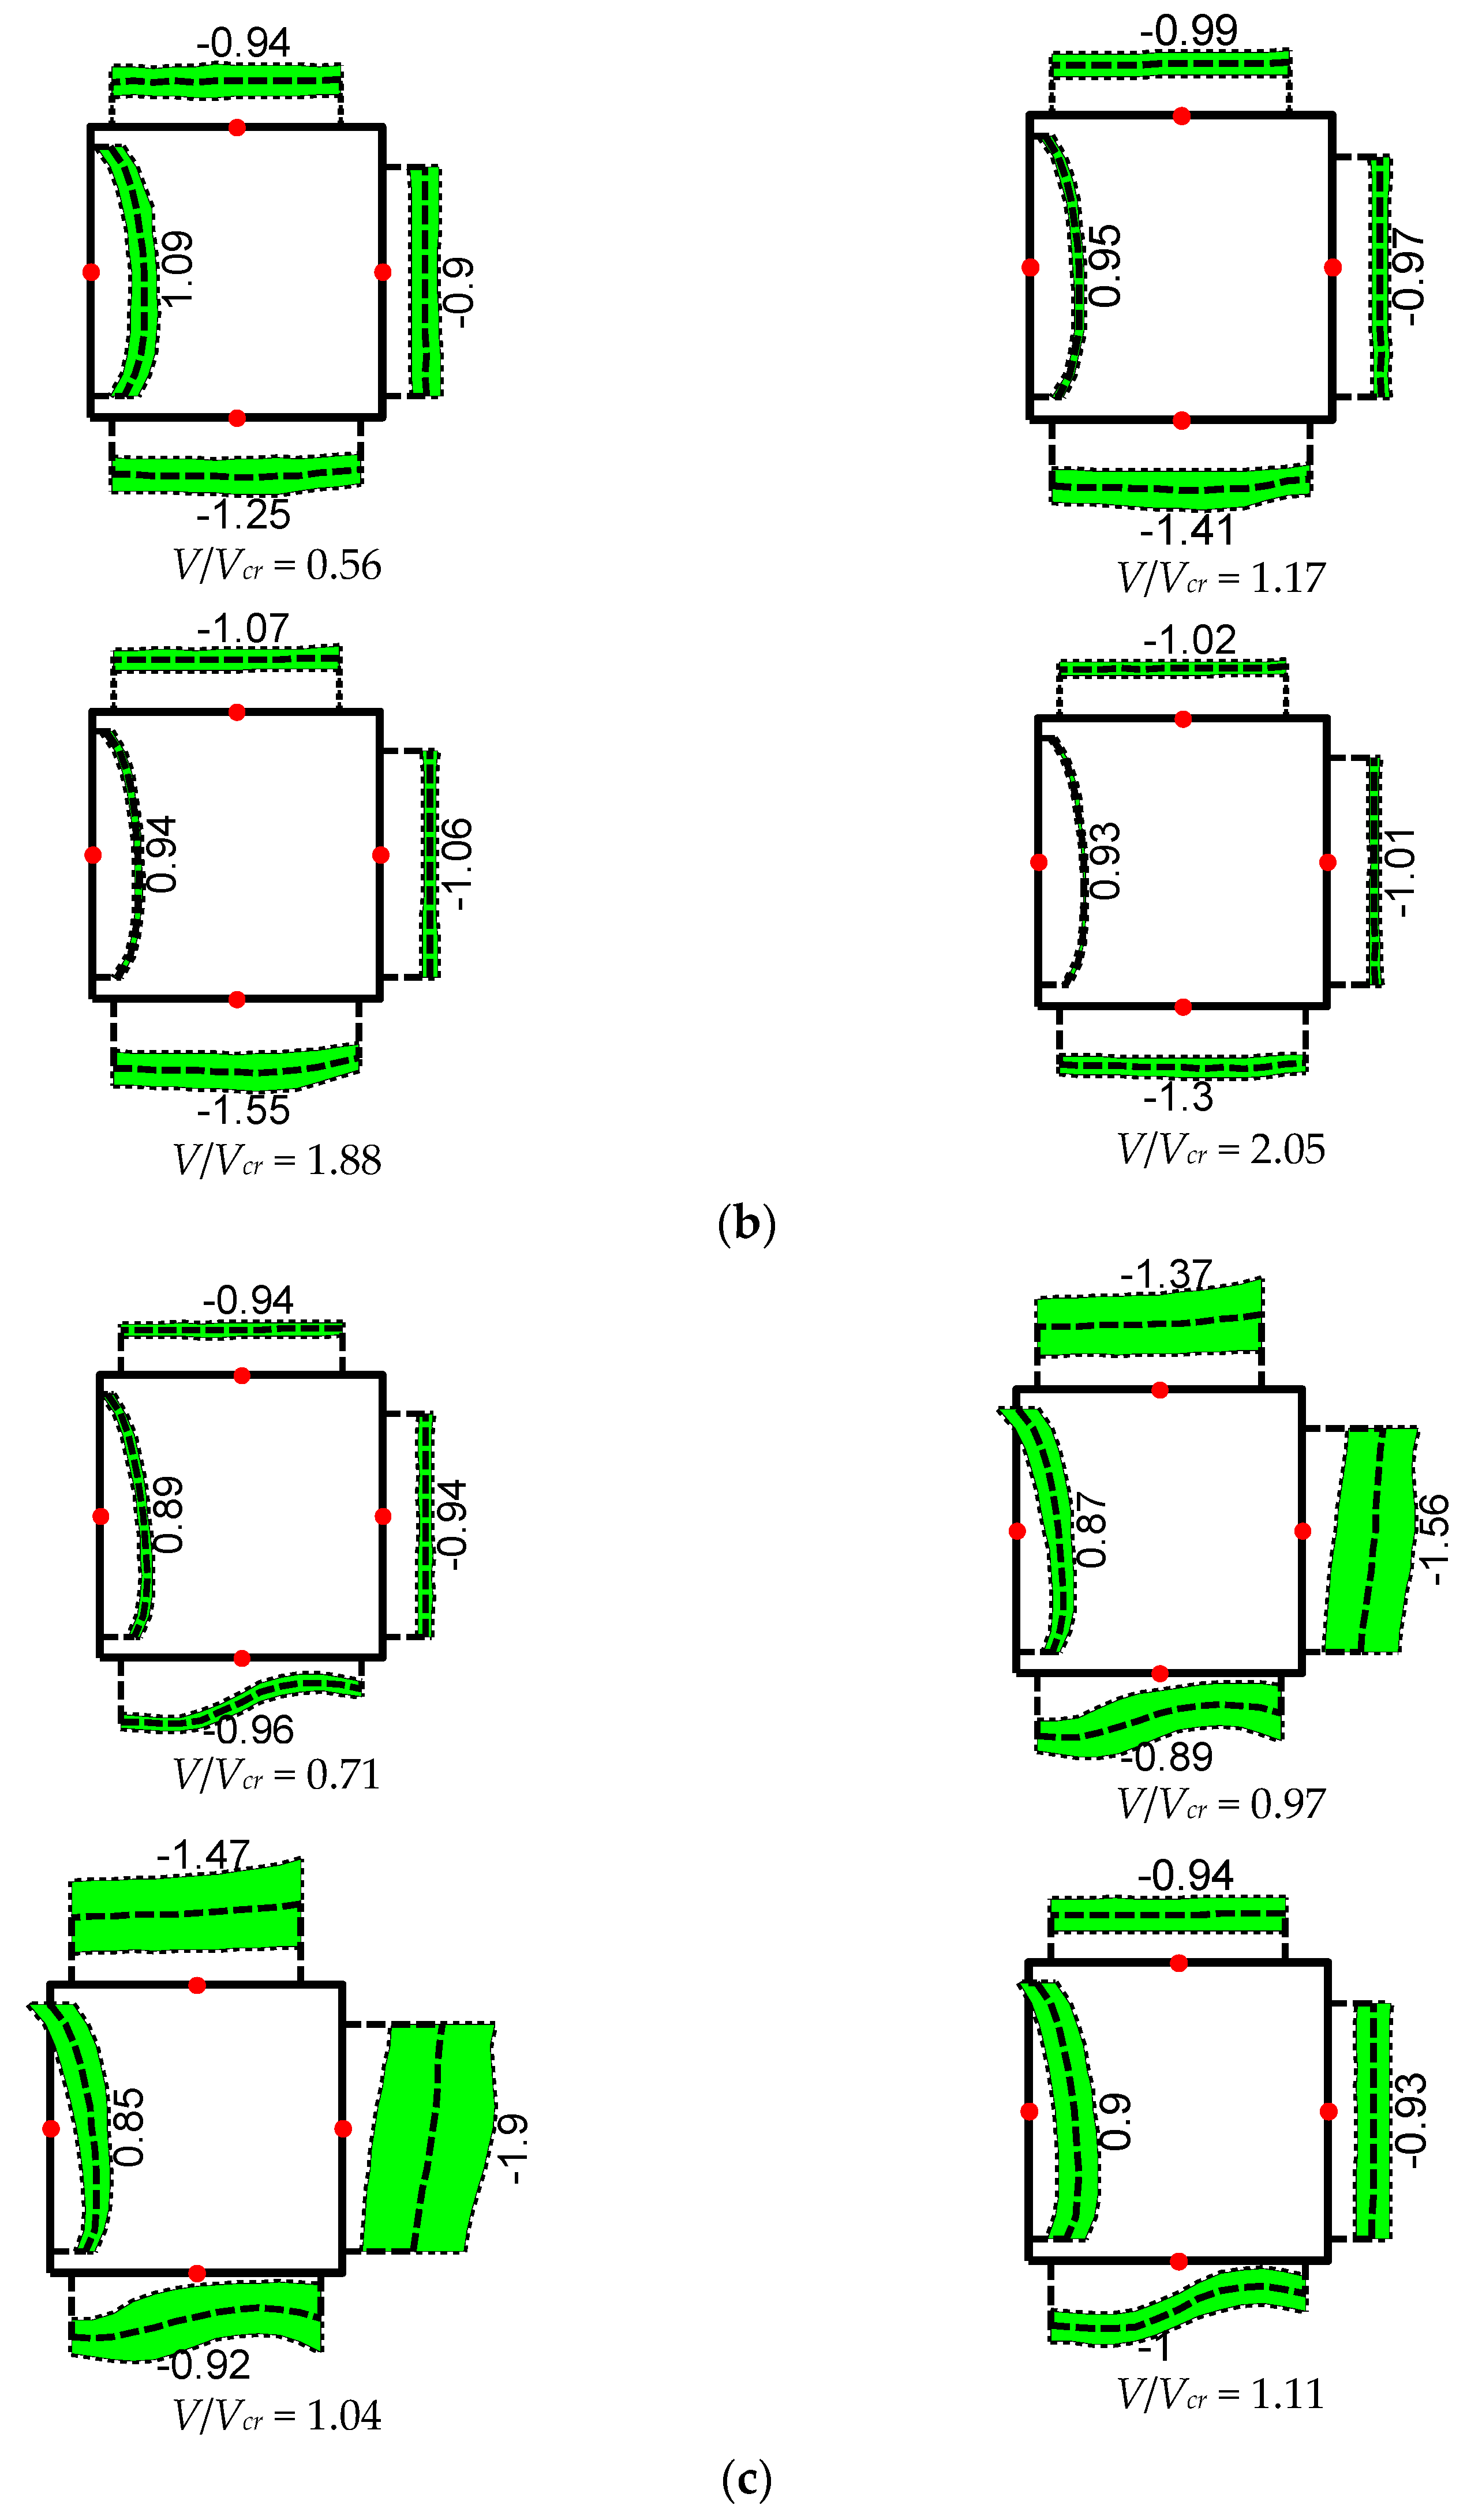
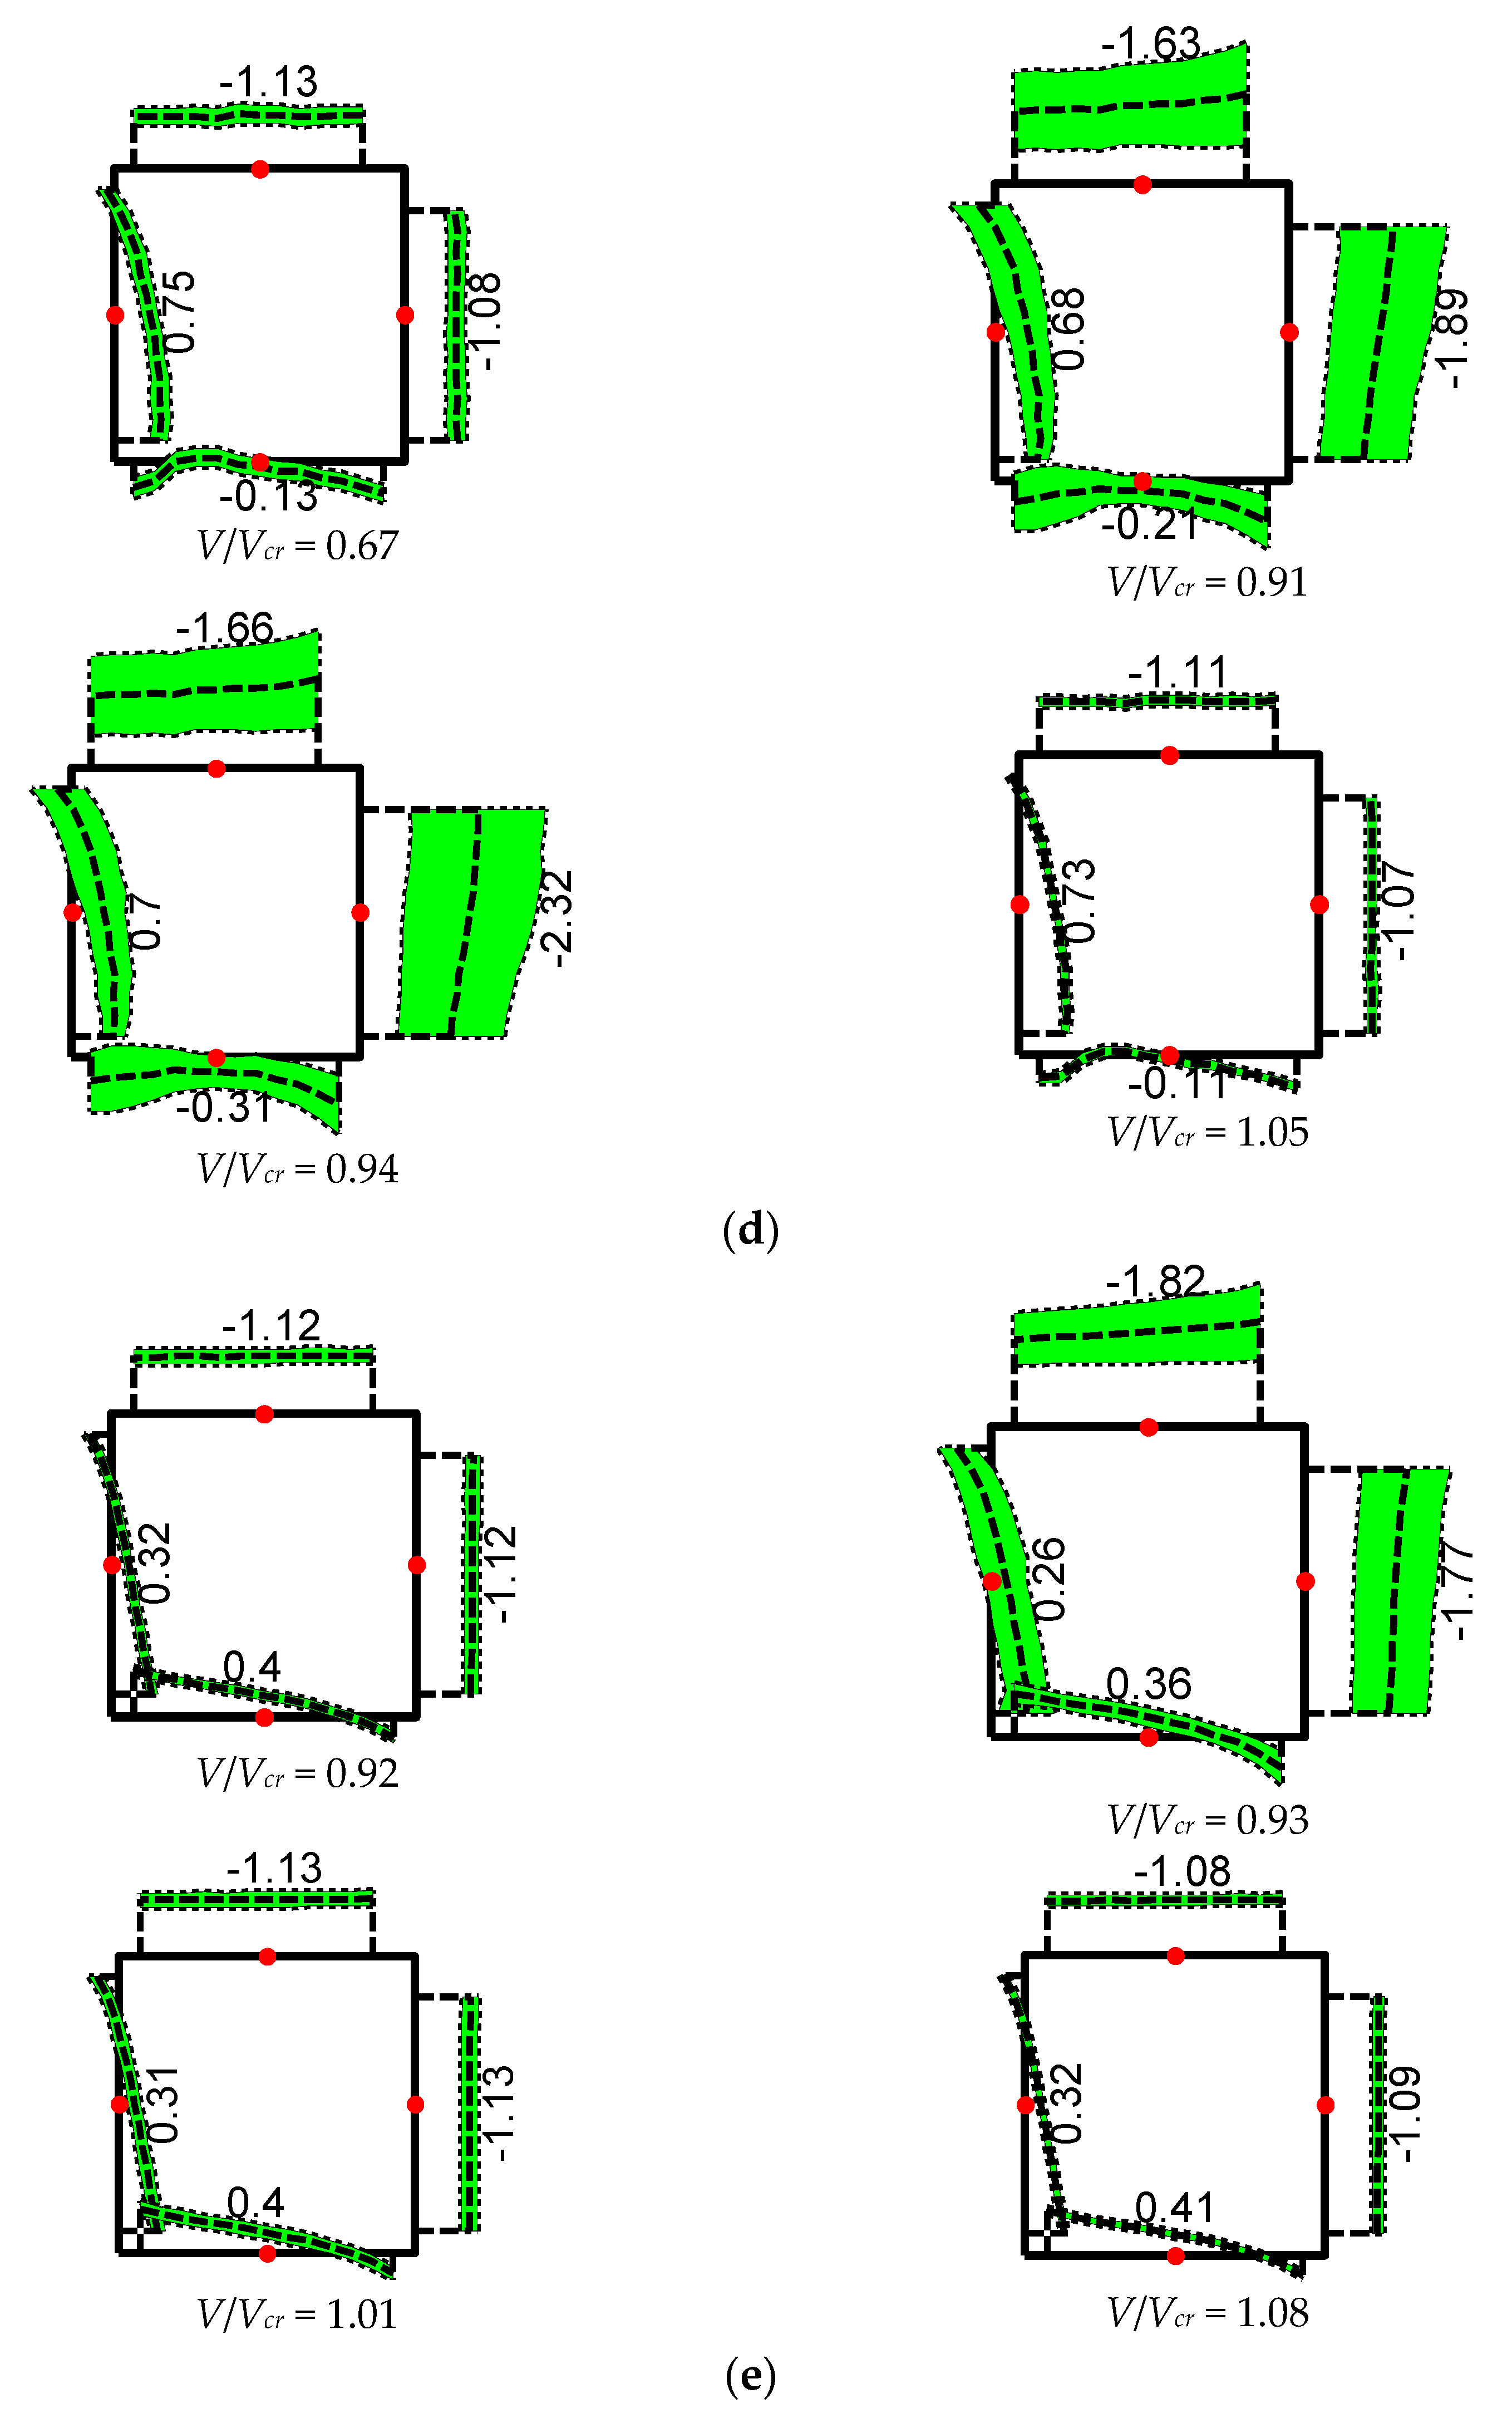
  • When the wind direction changed, the impact of cylinder vibration on the surface wind pressure varied significantly. Measures can be taken to adapt the surfaces, on which wind pressure changes greatly during vibration, to reduce these fluctuations, thereby achieving the goal of suppressing cylinder vibration.

Author Contributions

Conceptualization, Y.G.; data curation, J.X. and F.W.; formal analysis, X.Z. and Y.G.; funding acquisition, X.Z.; investigation, W.M.; writing—original draft, X.Z. and Q.Z. All authors have read and agreed to the published version of the manuscript.

Funding

The authors gratefully acknowledge the support of the Science and Technology Project of Hebei Education Department (No. QN2025424).

Data Availability Statement

Data will be supplied upon request.

Acknowledgments

We are very grateful to Zhenkai Zhang from Shijiazhuang Tiedao University for his instructive comments and great encouragement.

Conflicts of Interest

The authors declare no conflicts of interest.

References

  1. Nguyen, C.H.; Nguyen, D.T.; Owen, J.S.; Hargreaves, D.M. Wind tunnel measurements of the aerodynamic characteristics of a 3:2 rectangular cylinder including non-Gaussian and non-stationary features. J. Wind Eng. Ind. Aerodyn. 2022, 220, 104826. [Google Scholar] [CrossRef]
  2. Yang, X.; Su, Y.; Li, M.; Jiang, Z.; Du, S. Effect of turbulent integral scale on non-Gaussian characteristics of surface wind pressure on square cylinder. Phys. Fluids 2024, 36, 055150. [Google Scholar] [CrossRef]
  3. Feng, Z.; Lin, Y. Flutter Derivatives Identification and Uncertainty Quantification for Bridge Decks Based on the Artificial Bee Colony Algorithm and Bootstrap Technique. Appl. Sci. 2021, 11, 11376. [Google Scholar] [CrossRef]
  4. Wang, C.; Hua, X.; Feng, Z.; Xiao, H.; Chen, Z.; Zhang, J. Experimental investigation on vortex-induced vibrations of a triple-box girder with web modification. J. Wind Eng. Ind. Aerodyn. 2021, 218, 104783. [Google Scholar] [CrossRef]
  5. Ma, K.; Zhang, C.; Dang, X.; Zhang, G. Study on VIV Behavior of Two 5:1 Rectangular Cylinders in Tandem Based on Correlation Analysis. Buildings 2023, 14, 85. [Google Scholar] [CrossRef]
  6. Feng, Z.; Jing, H.; Wu, Q.; Li, Y.; Hua, X. Performance Evaluation of Inerter-Based Dampers for Bridge Flutter Control: A Comparative Study. Int. J. Struct. Stab. Dyn. 2023, 24, 2450058. [Google Scholar] [CrossRef]
  7. Carlson, D.W.; Currier, T.M.; Modarres-Sadeghi, Y. Flow-induced vibrations of a square prism free to oscillate in the cross-flow and inline directions. J. Fluid Mech. 2021, 919, A2. [Google Scholar] [CrossRef]
  8. Zhao, M. Effects of natural frequency ratio on vortex-induced vibration of a circular cylinder in steady flow. Phys. Fluids 2020, 32, 073604. [Google Scholar] [CrossRef]
  9. Lin, S.; Wang, Q.; Nikitas, N.; Liao, H. Effects of oscillation amplitude on motion-induced forces for 5:1 rectangular cylinders. J. Wind Eng. Ind. Aerodyn. 2019, 186, 68–83. [Google Scholar] [CrossRef]
  10. Govardhan, R.; Williamson, C.H.K. Modes of vortex formation and frequency response of a freely vibrating cylinder. J. Fluid Mech. 2000, 420, 85–130. [Google Scholar] [CrossRef]
  11. Govardhan, R.; Williamson, C.H.K. Critical mass in vortex-induced vibration of a cylinder. Eur. J. Mech.-B/Fluids 2004, 23, 17–27. [Google Scholar] [CrossRef]
  12. Modir, A.; Kahrom, M.; Farshidianfar, A. Mass ratio effect on vortex induced vibration of a flexibly mounted circular cylinder, an experimental study. Int. J. Mar. Energy 2016, 16, 1–11. [Google Scholar] [CrossRef]
  13. Sen, S.; Mittal, S. Effect of mass ratio on free vibrations of a square cylinder at low Reynolds numbers. J. Fluids Struct. 2015, 54, 661–678. [Google Scholar] [CrossRef]
  14. Sourav, K.; Kumar, D.; Sen, S. Vortex-induced vibrations of an elliptic cylinder of low mass ratio: Identification of new response branches. Phys. Fluids 2020, 32, 023605. [Google Scholar] [CrossRef]
  15. Chang, C.C.; Gu, M. Suppression of vortex-excited vibration of tall buildings using tuned liquid dampers. J. Wind Eng. Ind. Aerodyn. 1999, 83, 225–237. [Google Scholar] [CrossRef]
  16. Dorogi, D.; Baranyi, L. Identification of upper branch for vortex-induced vibration of a circular cylinder at Re=300. J. Fluids Struct. 2020, 98, 103135. [Google Scholar] [CrossRef]
  17. Chen, Z.; Huang, H.; Xu, Y.; Tse, K.T.; Kim, B.; Wang, Y. Unsteady aerodynamics on a tapered prism under forced excitation. Eng. Struct. 2021, 240, 112387. [Google Scholar] [CrossRef]
  18. Du, X.; Chen, R.; Dong, H.; Ma, W.; Xu, H.; Zhao, Y. Aerodynamic characteristics of two closely spaced square cylinders in different arrangements. J. Wind Eng. Ind. Aerodyn. 2021, 208, 104462. [Google Scholar] [CrossRef]
  19. Gaur, N.; Raj, R. Aerodynamic mitigation by corner modification on square model under wind loads employing CFD and wind tunnel. Ain Shams Eng. J. 2022, 13, 101521. [Google Scholar] [CrossRef]
  20. Yu, H.; Chen, W.-L.; Huang, Y.; Meng, H.; Gao, D. Dynamic wake of a square cylinder controlled with steady jet positioned at the rear stagnation point. Ocean Eng. 2021, 233, 109157. [Google Scholar] [CrossRef]
  21. Kozmar, H. Surface pressure on a cubic building exerted by conical vortices. J. Fluids Struct. 2020, 92, 102801. [Google Scholar] [CrossRef]
  22. Cui, Z.; Zhao, M.; Teng, B.; Cheng, L. Two-dimensional numerical study of vortex-induced vibration and galloping of square and rectangular cylinders in steady flow. Ocean Eng. 2015, 106, 189–206. [Google Scholar] [CrossRef]
  23. Irwin, H.P.A.H.; Cooper, K.R.; Girard, R. Correction of distortion effects caused by tubing systems in measurements of fluctuating pressures. J. Wind Eng. Ind. Aerodyn. 1979, 5, 93–107. [Google Scholar] [CrossRef]
  24. Alonso, G.; Valero, E.; Meseguer, J. An analysis on the dependence on cross section geometry of galloping stability of two-dimensional bodies having either biconvex or rhomboidal cross sections. Eur. J. Mech.-B/Fluids 2009, 28, 328–334. [Google Scholar] [CrossRef]
  25. Lee, B.E. The effect of turbulence on the surface pressure field of a square prism. J. Fluid Mech. 2006, 69, 263–282. [Google Scholar] [CrossRef]
Figure 1. Sketch of the testing model and definitions of parameters. (a) Model section and parameter definition. (b) Model installation diagram. (c) Model suspension system diagram. (d) Experimental photos.
Buildings 15 02129 g001aBuildings 15 02129 g001b
Figure 2. The free vibration characteristics of the testing model system. (a) Displacement decay time. (b) Displacement attenuation amplitude spectrum.
Buildings 15 02129 g002
Figure 3. Displacement time history and power spectrum of the displacement of a typical vibration. (a) Displacement time history under a typical wind speed at a 0° wind direction. (b) Displacement power spectral density at a typical wind speed at a 0° wind direction.
Buildings 15 02129 g003
Figure 4. The curve of the Strouhal number of the wind direction.
Buildings 15 02129 g004
Figure 5. Variation in η and fs with the wind direction angle. (a) The variation in the wind speed ratio of η and fs at α = 0°. (b) The variation in the wind speed ratio of η and fs at α = 10°. (c) The variation in the wind speed ratio of η and fs at α = 20°. (d) The variation in the wind speed ratio of η and fs at α = 30°. (e) The variation in the wind speed ratio of η and fs at α = 45°. (The blue dashed line indicates the reduced wind speed range in which the vibration occurs).
Buildings 15 02129 g005
Figure 6. Variation in normalized amplitude with the angle of attack.
Buildings 15 02129 g006
Figure 7. Variation in “lock-in” with the wind direction angle.
Buildings 15 02129 g007
Figure 8. Variation in aerodynamic force coefficients with the velocity ratio of VIV. (a) The relationship between the amplitude and drag coefficient at α = 0°. (b) The relationship between the amplitude and lift coefficient at α = 0°. (c) The relationship between the amplitude and drag coefficient at α = 10°. (d) The relationship between the amplitude and lift coefficient at α = 10°. (e) The relationship between the amplitude and drag coefficient at α = 20°. (f) The relationship between the amplitude and lift coefficient at α = 20°. (g) The relationship between the amplitude and drag coefficient at α = 30°. (h) The relationship between the amplitude and lift coefficient at α = 30°. (i) The relationship between the amplitude and drag coefficient at α = 45°. (j) The relationship between the amplitude and lift coefficient at α = 45°.
Buildings 15 02129 g008aBuildings 15 02129 g008b
Figure 9. Variation in drag coefficients with the wind direction angle.
Buildings 15 02129 g009
Figure 10. Variation in lift coefficients with the wind direction angle.
Buildings 15 02129 g010
Figure 11. Variation in fluctuating aerodynamic coefficients at the maximum amplitude with the wind direction angle.
Buildings 15 02129 g011
Figure 12. Wind pressure distribution at different angles of attack. (a) Wind pressure distribution at α = 0°. (b) Wind pressure distribution at α = 10°. (c) Wind pressure distribution at α = 20°. (d) Wind pressure distribution at α = 30°. (e) Wind pressure distribution at α = 45°.
Buildings 15 02129 g012aBuildings 15 02129 g012bBuildings 15 02129 g012c
Disclaimer/Publisher’s Note: The statements, opinions and data contained in all publications are solely those of the individual author(s) and contributor(s) and not of MDPI and/or the editor(s). MDPI and/or the editor(s) disclaim responsibility for any injury to people or property resulting from any ideas, methods, instructions or products referred to in the content.

