
Fire Test on Insulated Steel Beams with Fire-Protection Coating and Fiber Cement Board


Abstract
1. Introduction
1.1. Research on the Fire-Resistance of Beams
1.2. Calculation Method from GB 51249-2017
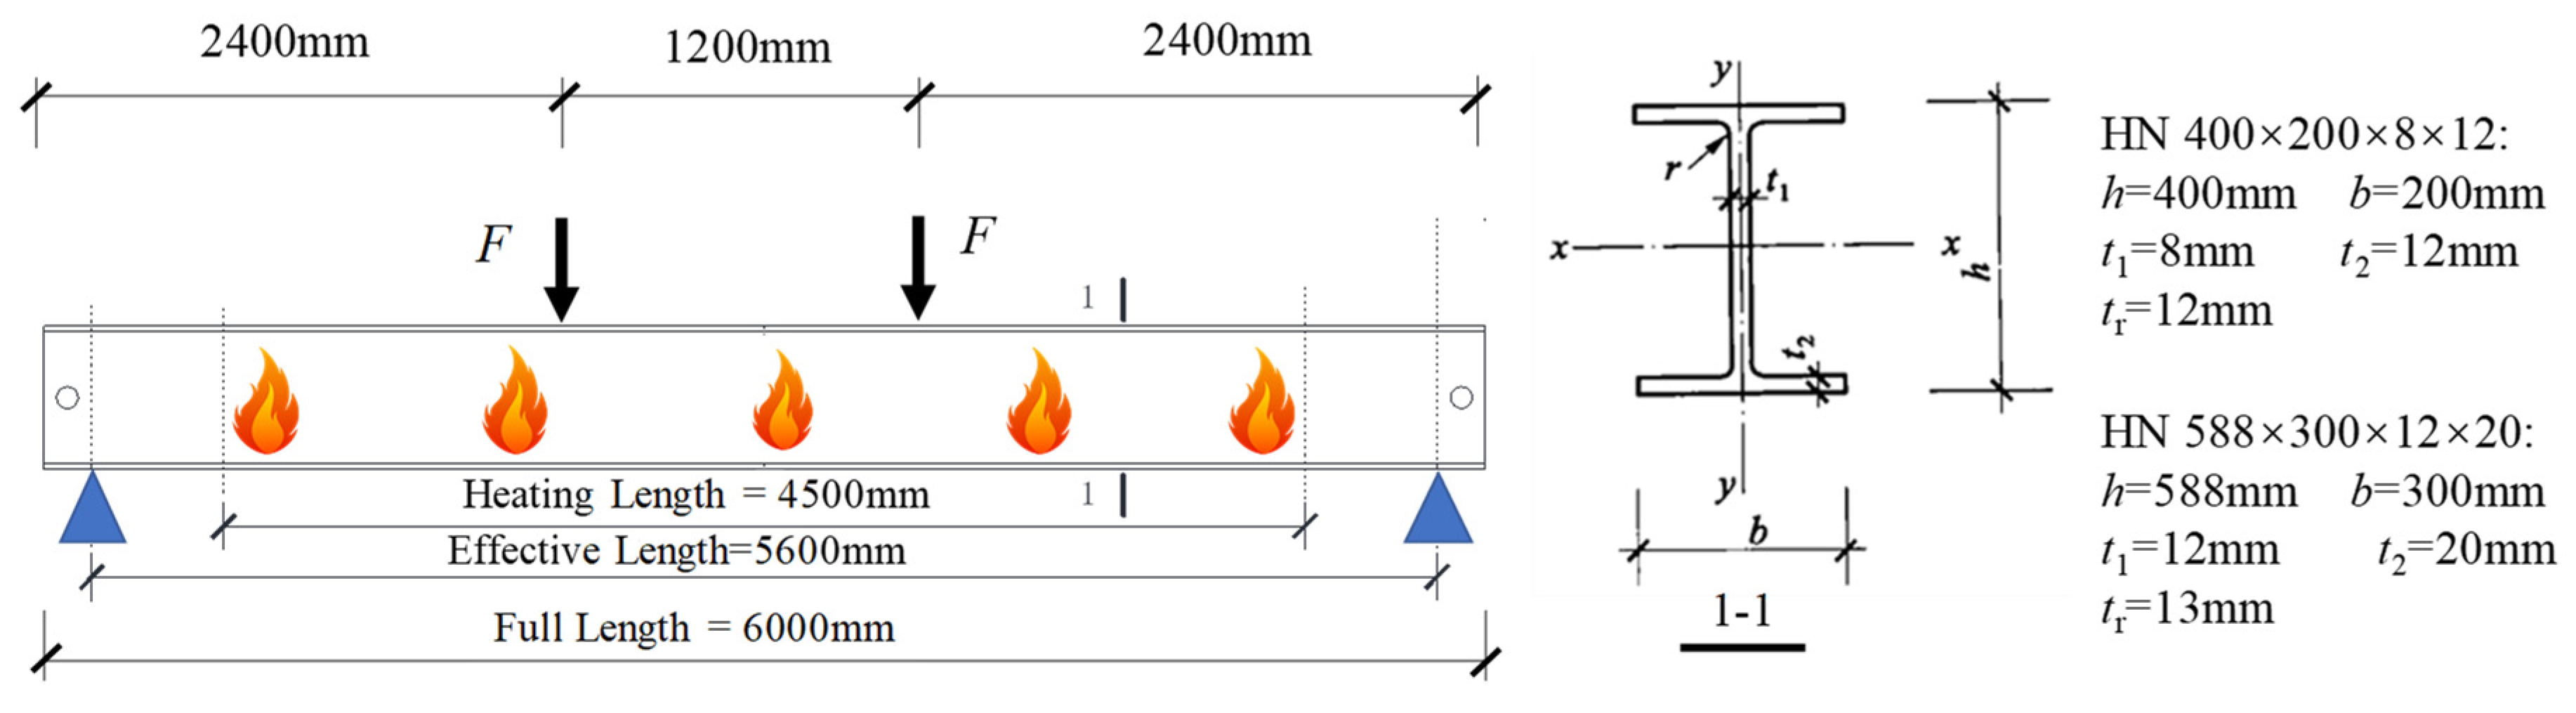
2. The Specimens
- (1)
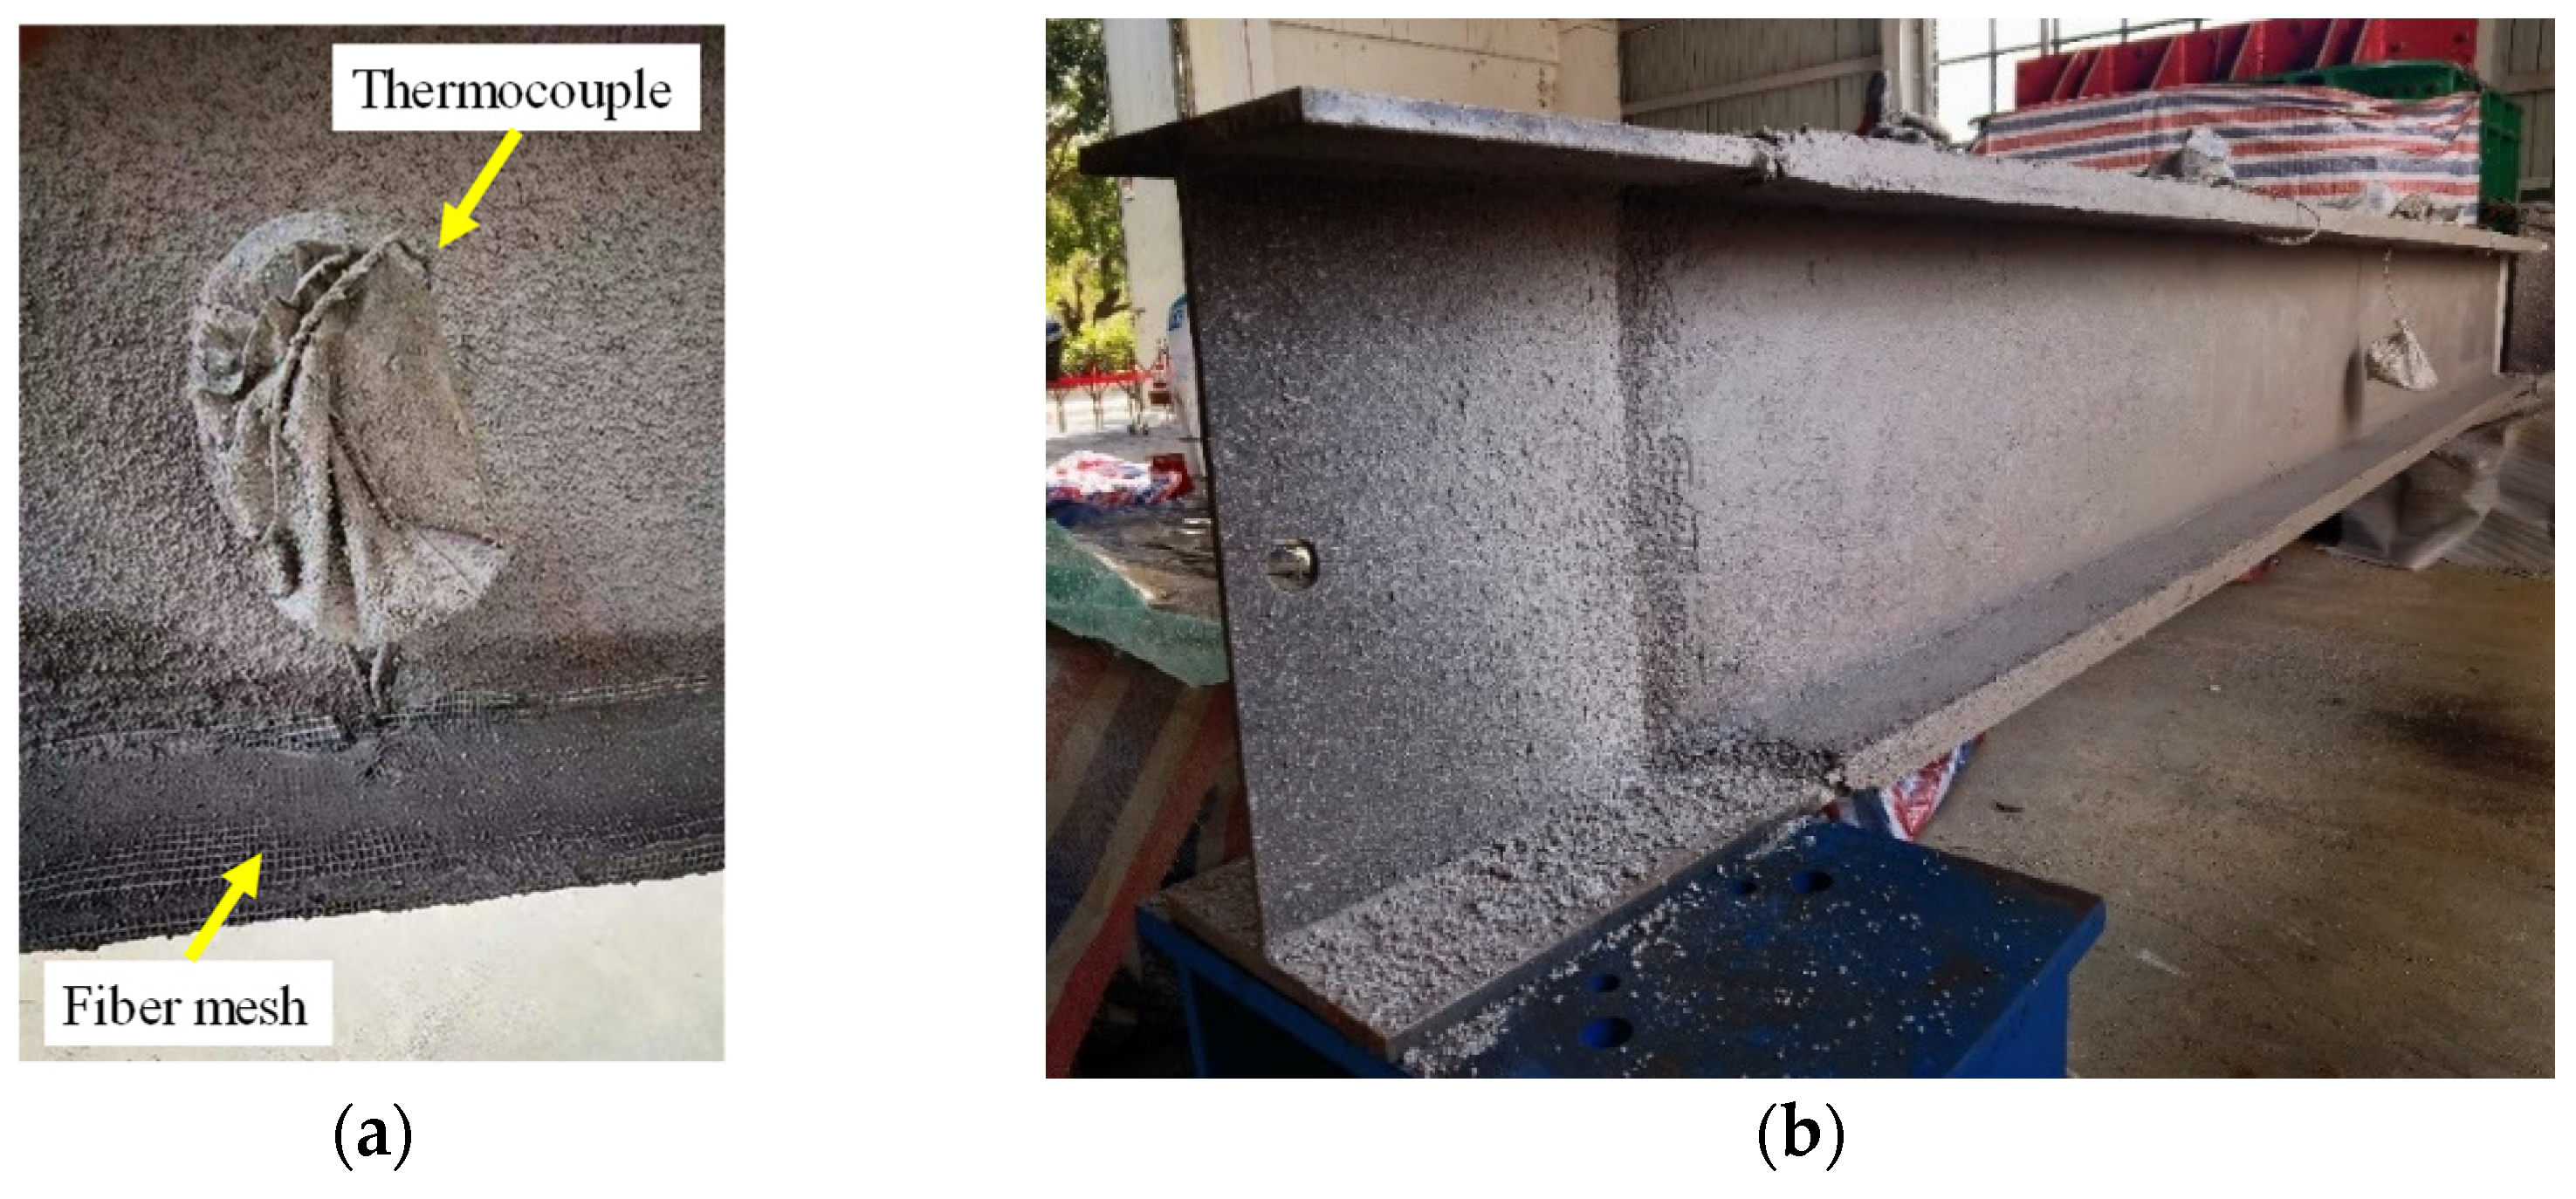
- Implementation of the fire-retardant coating
- (2)
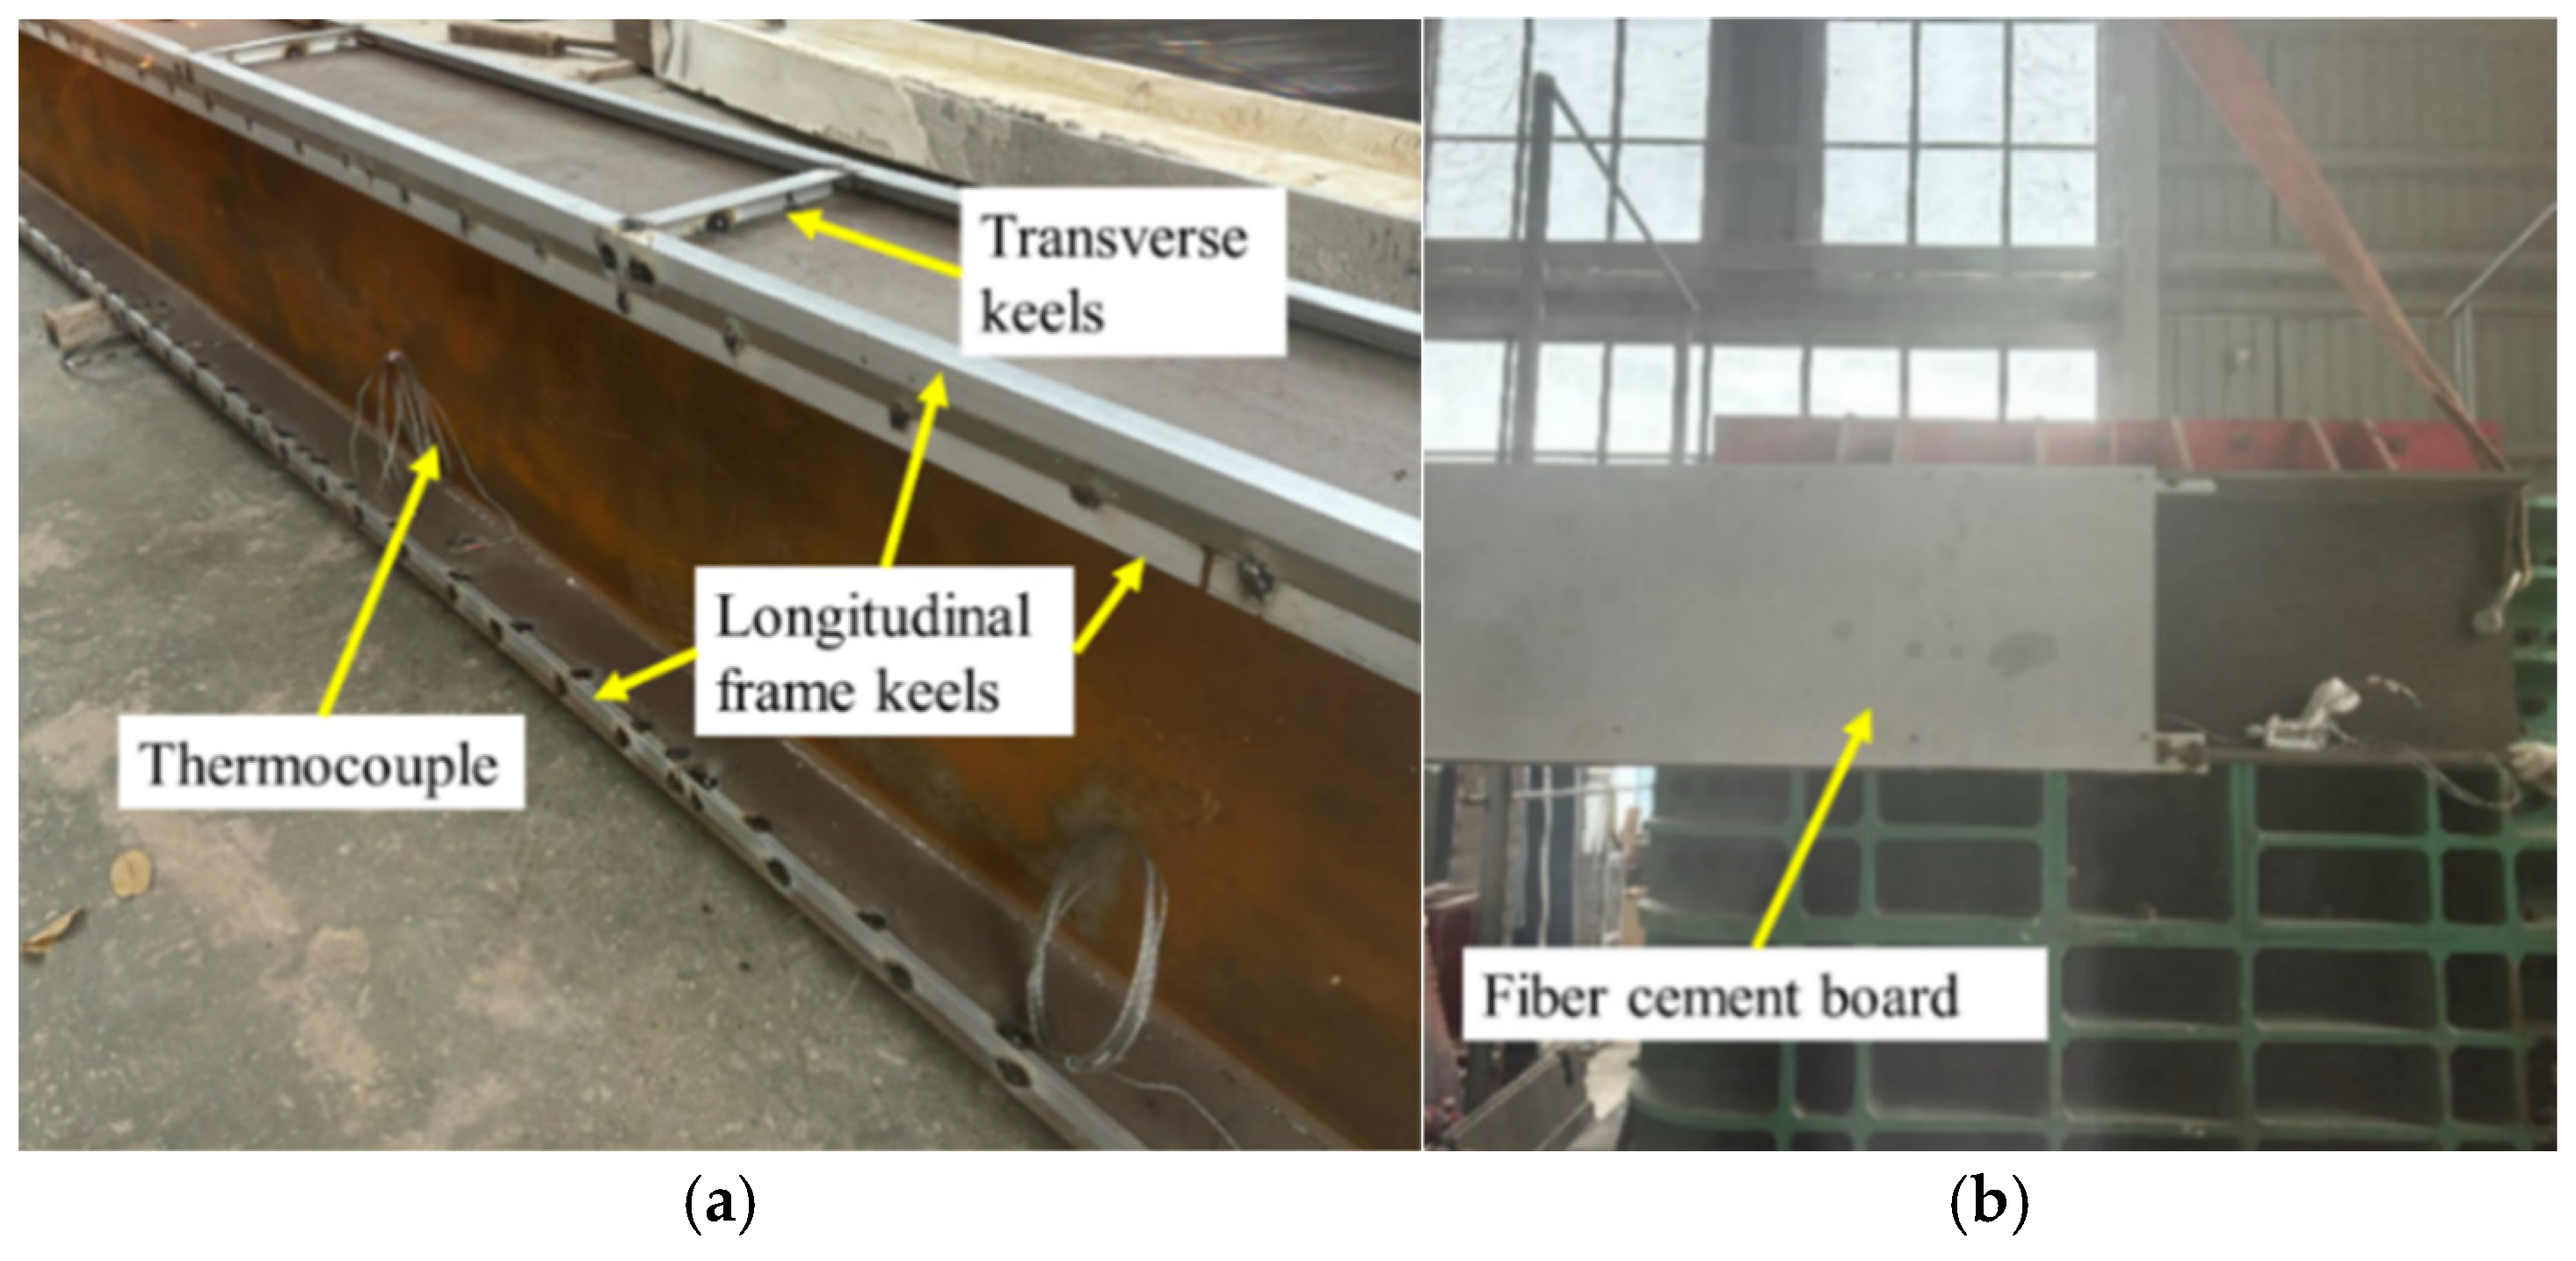
- Implementation of the cement fiber fireproof board
- (3)
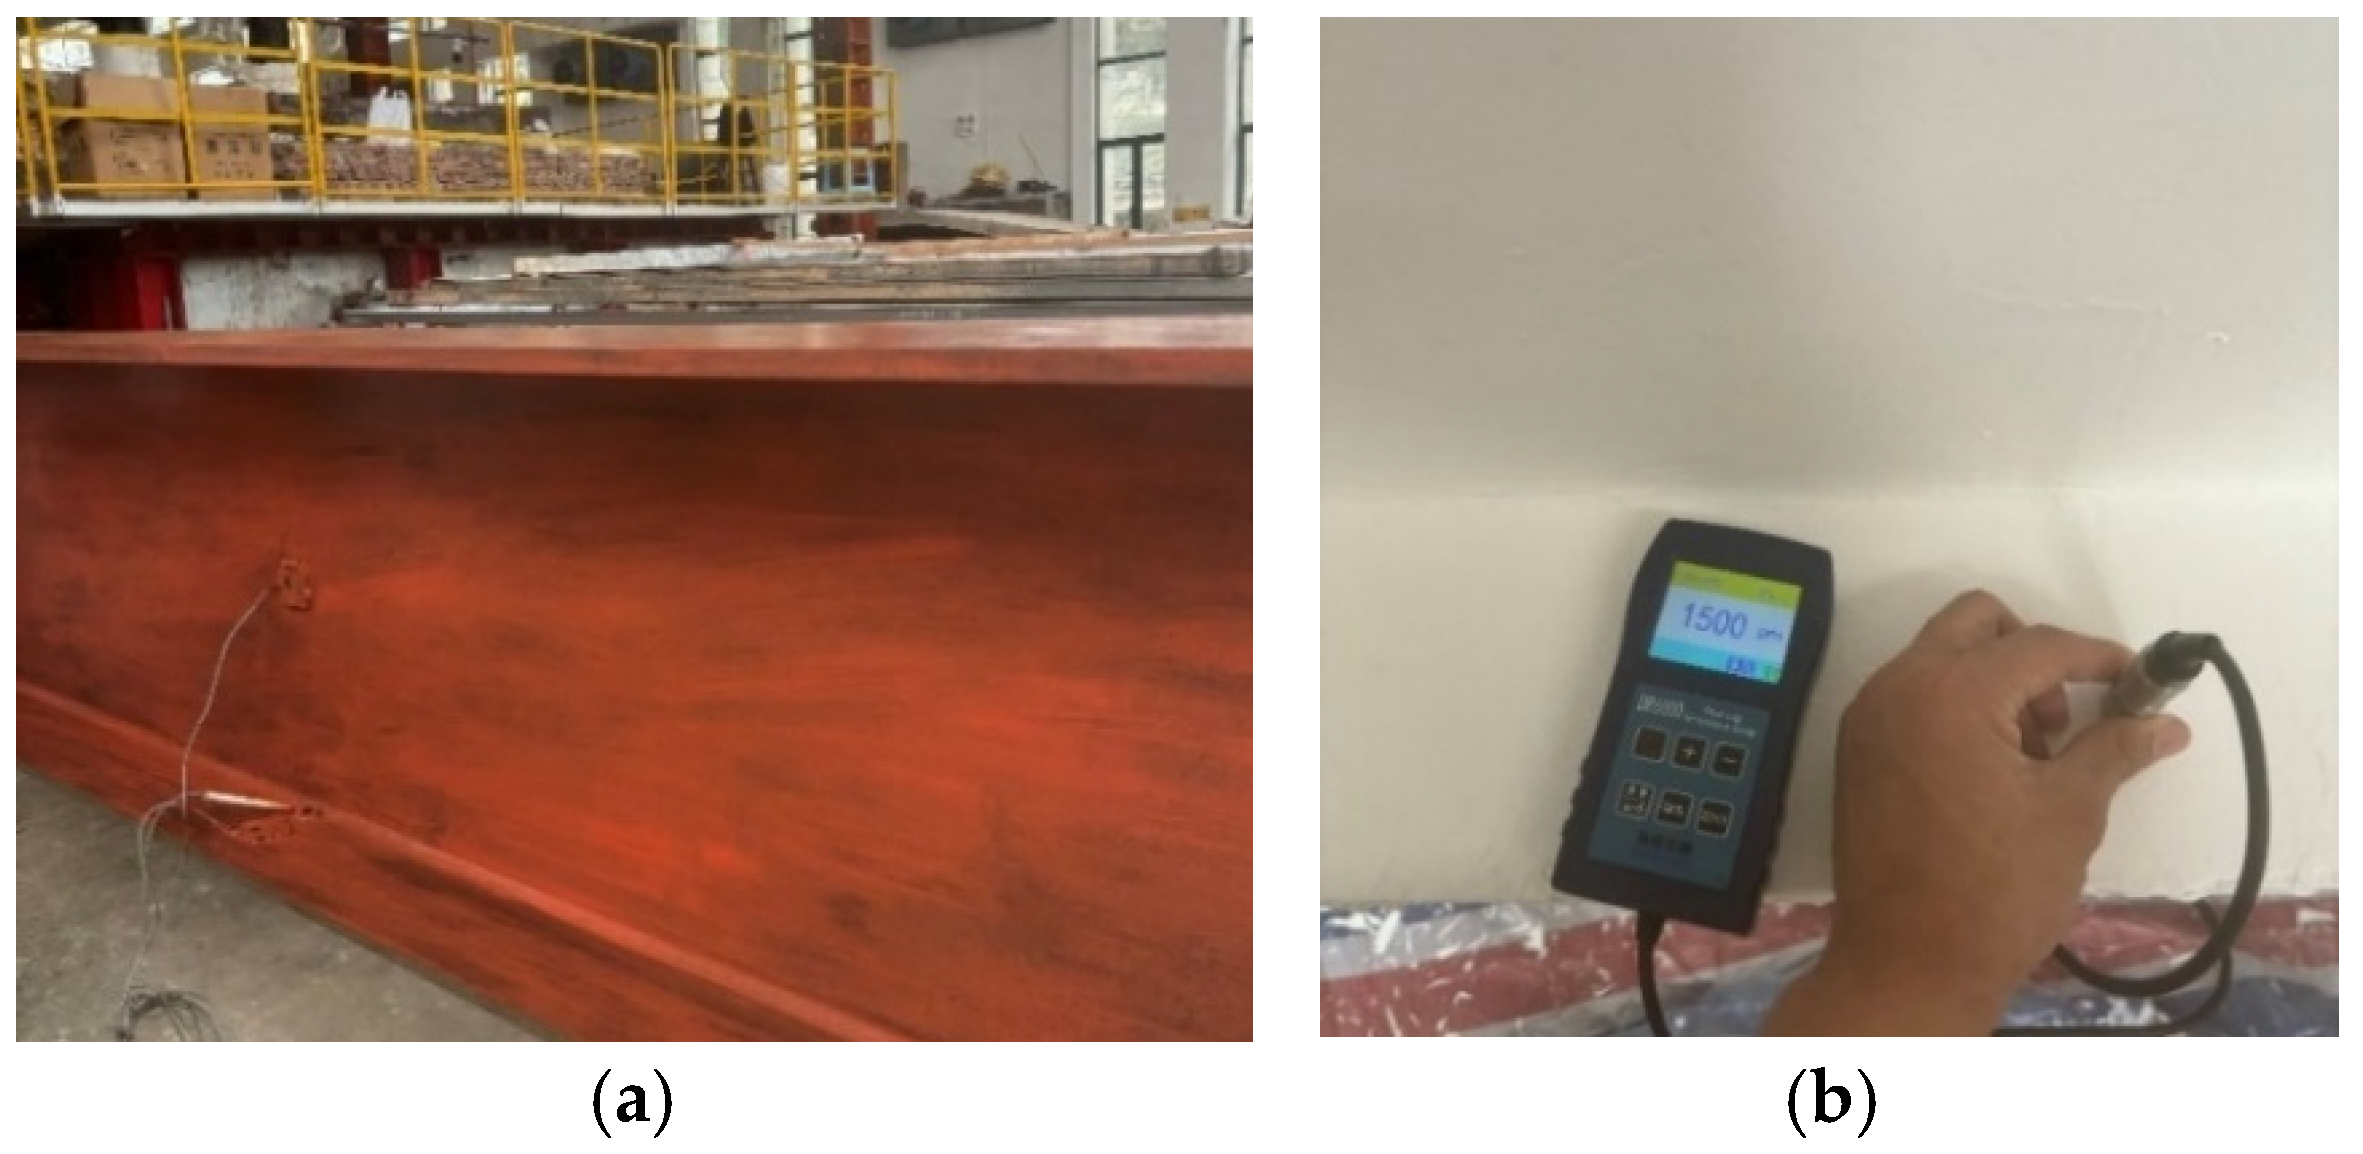
- Implementation of the intumescent coating
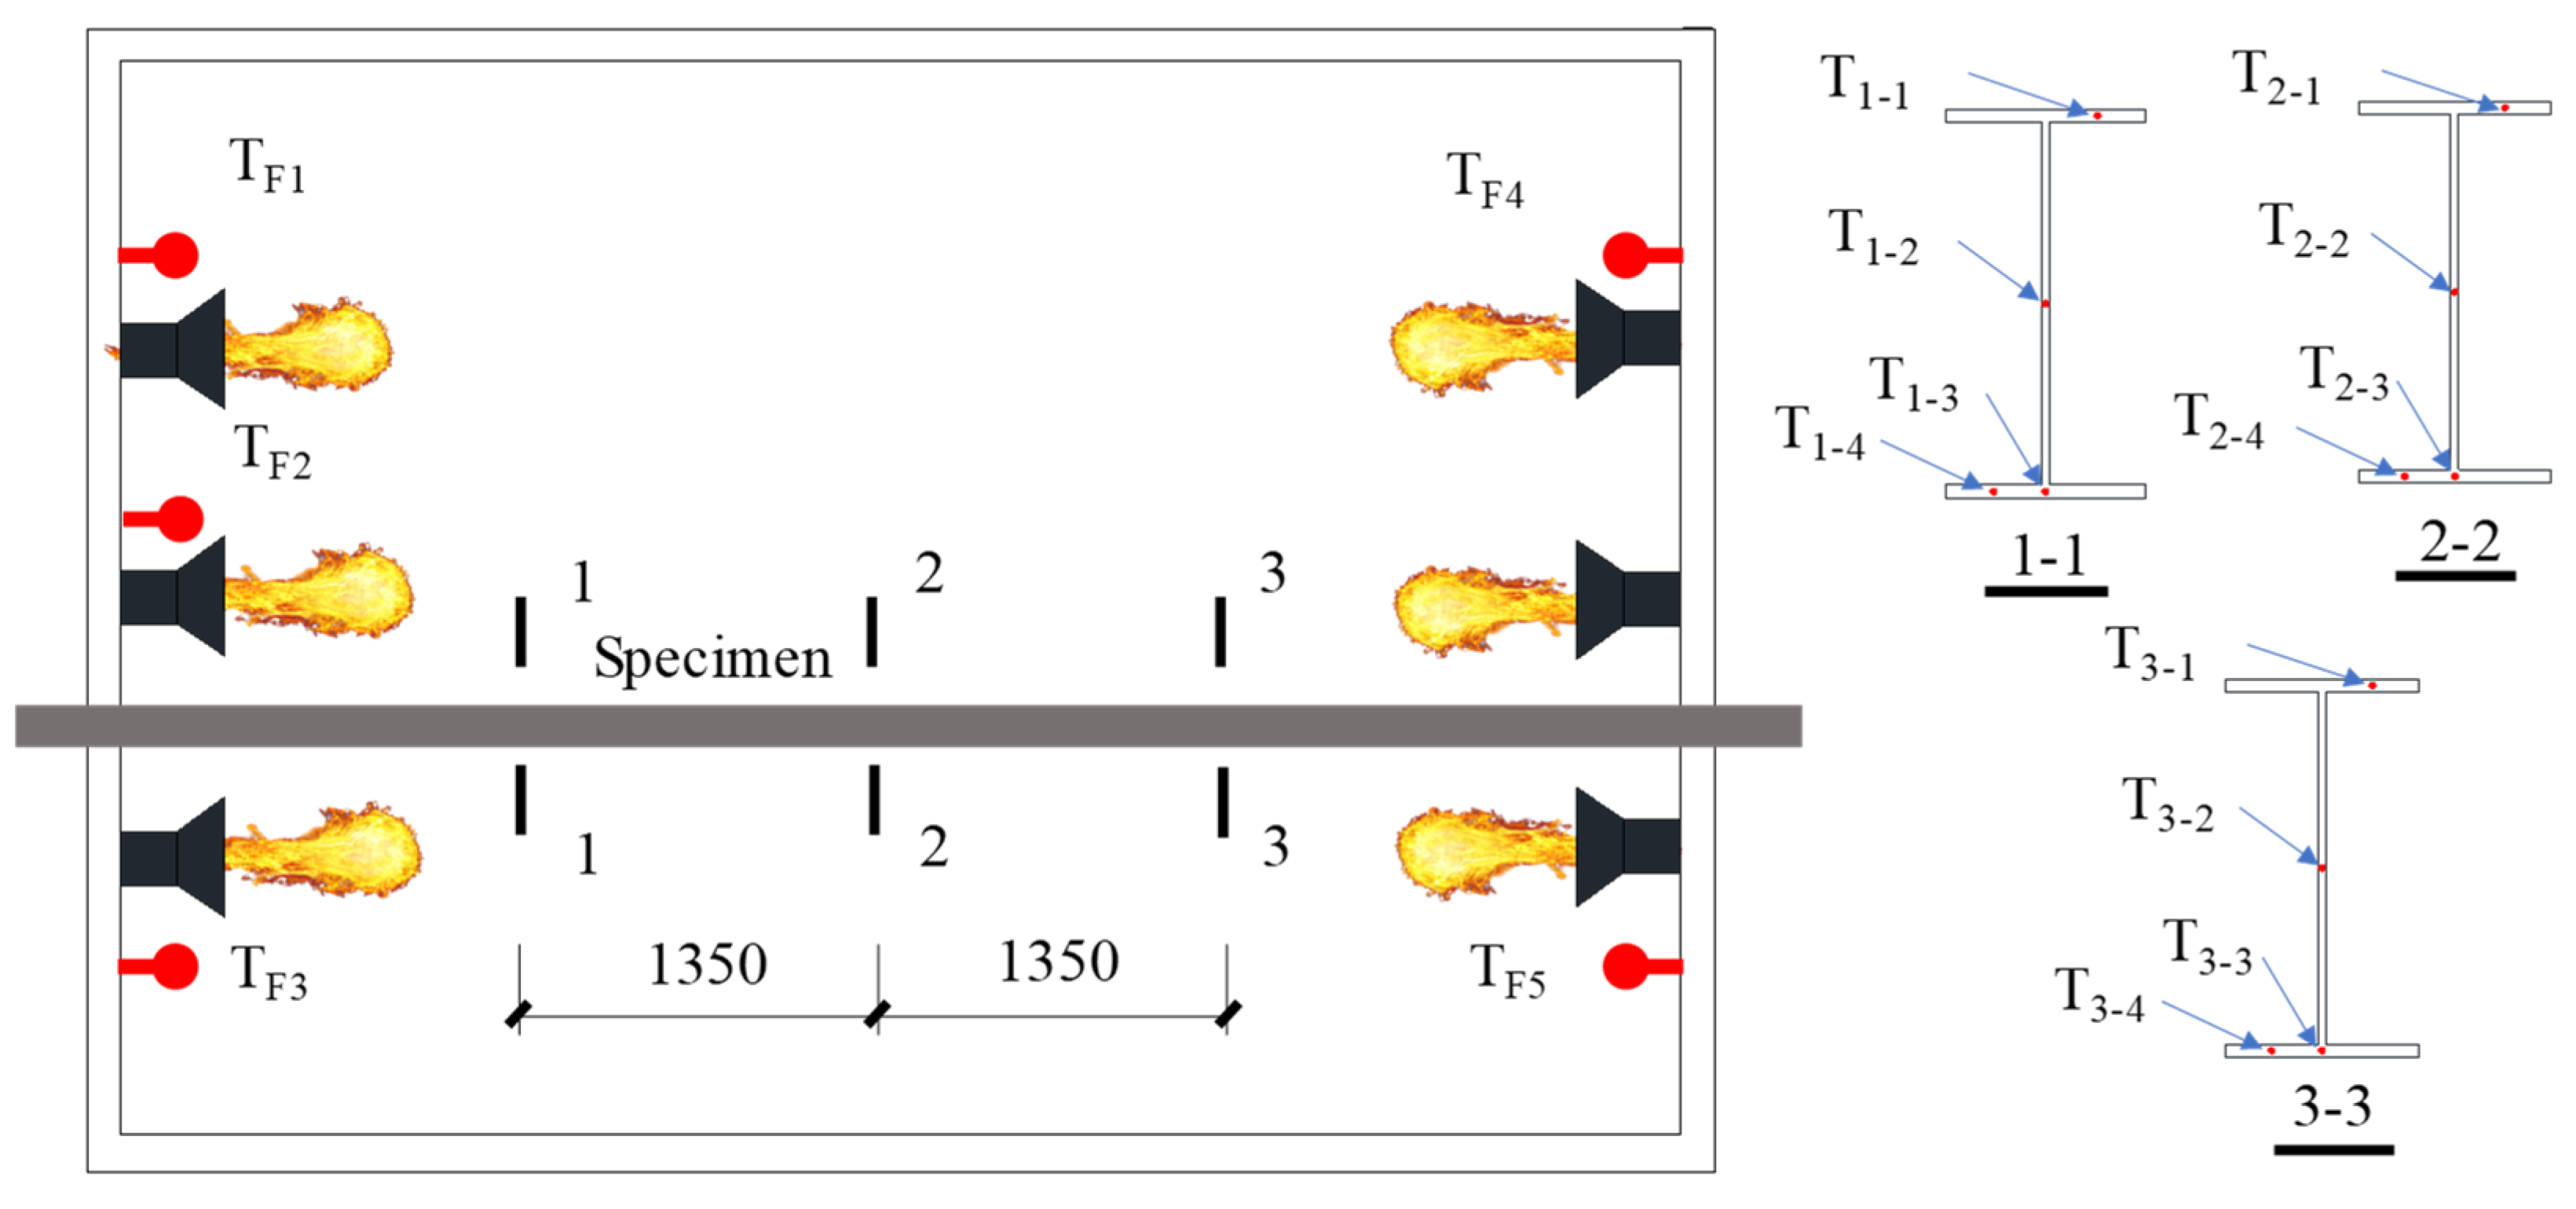
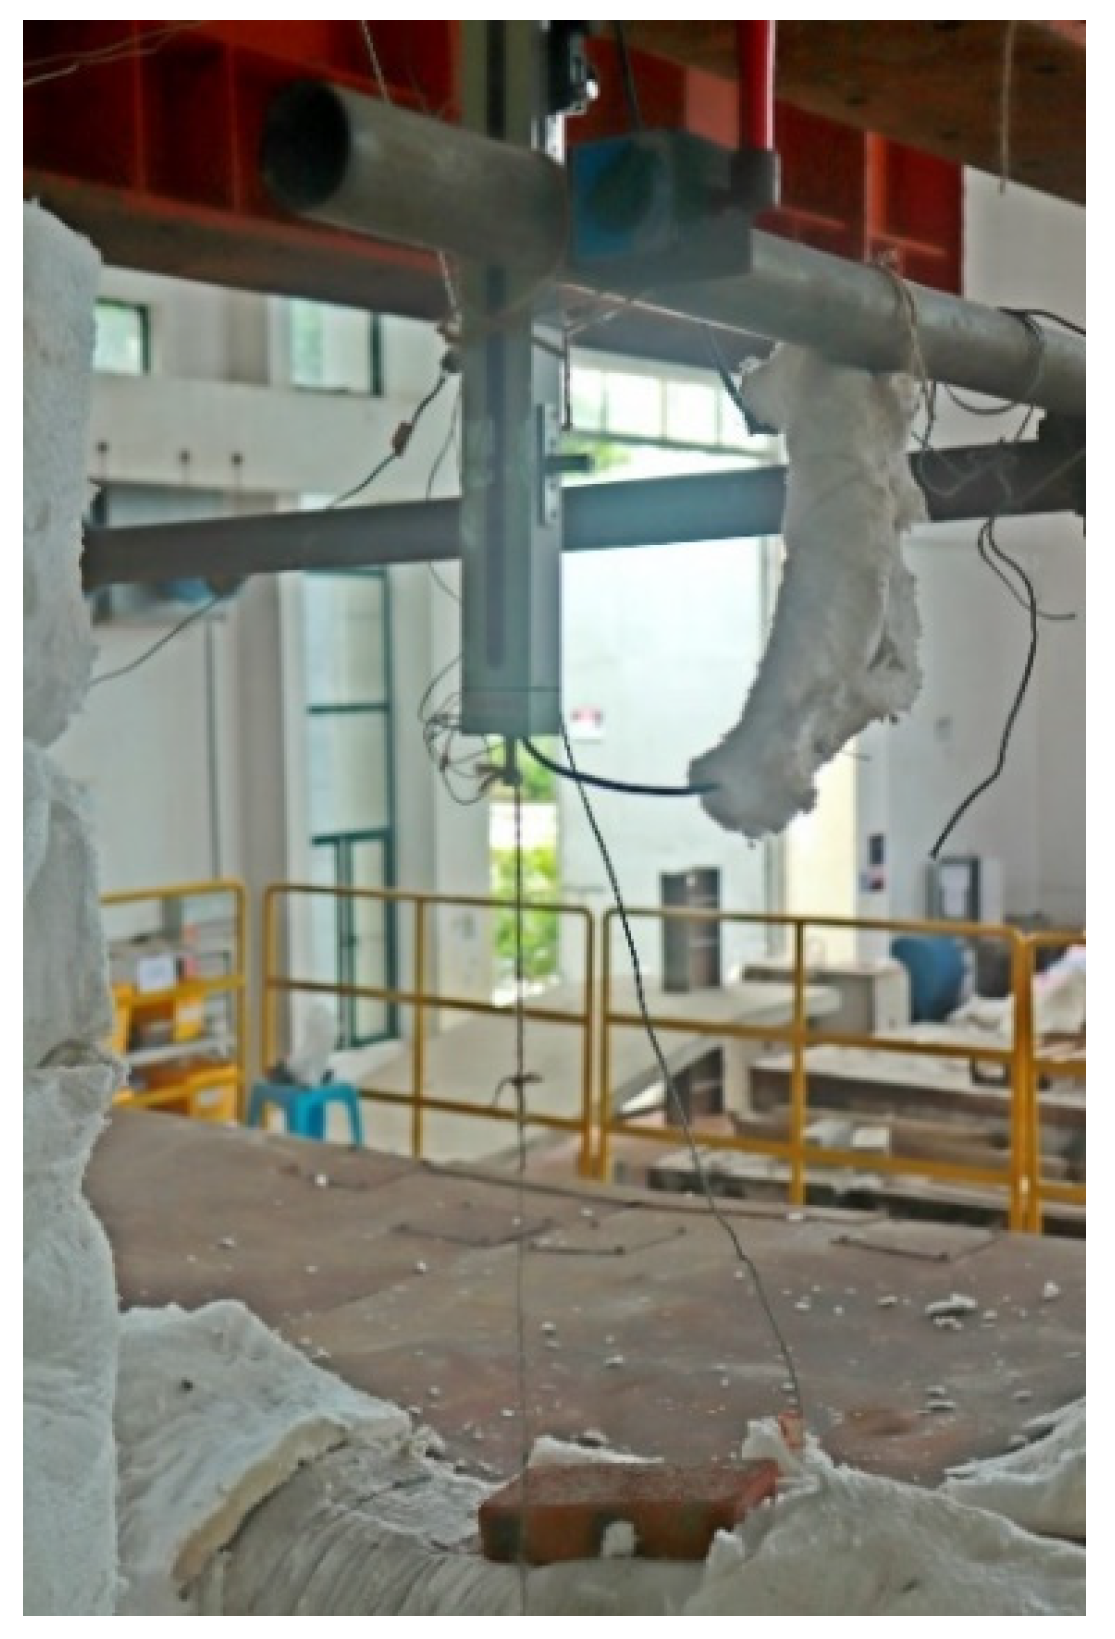
3. Test Set-Up
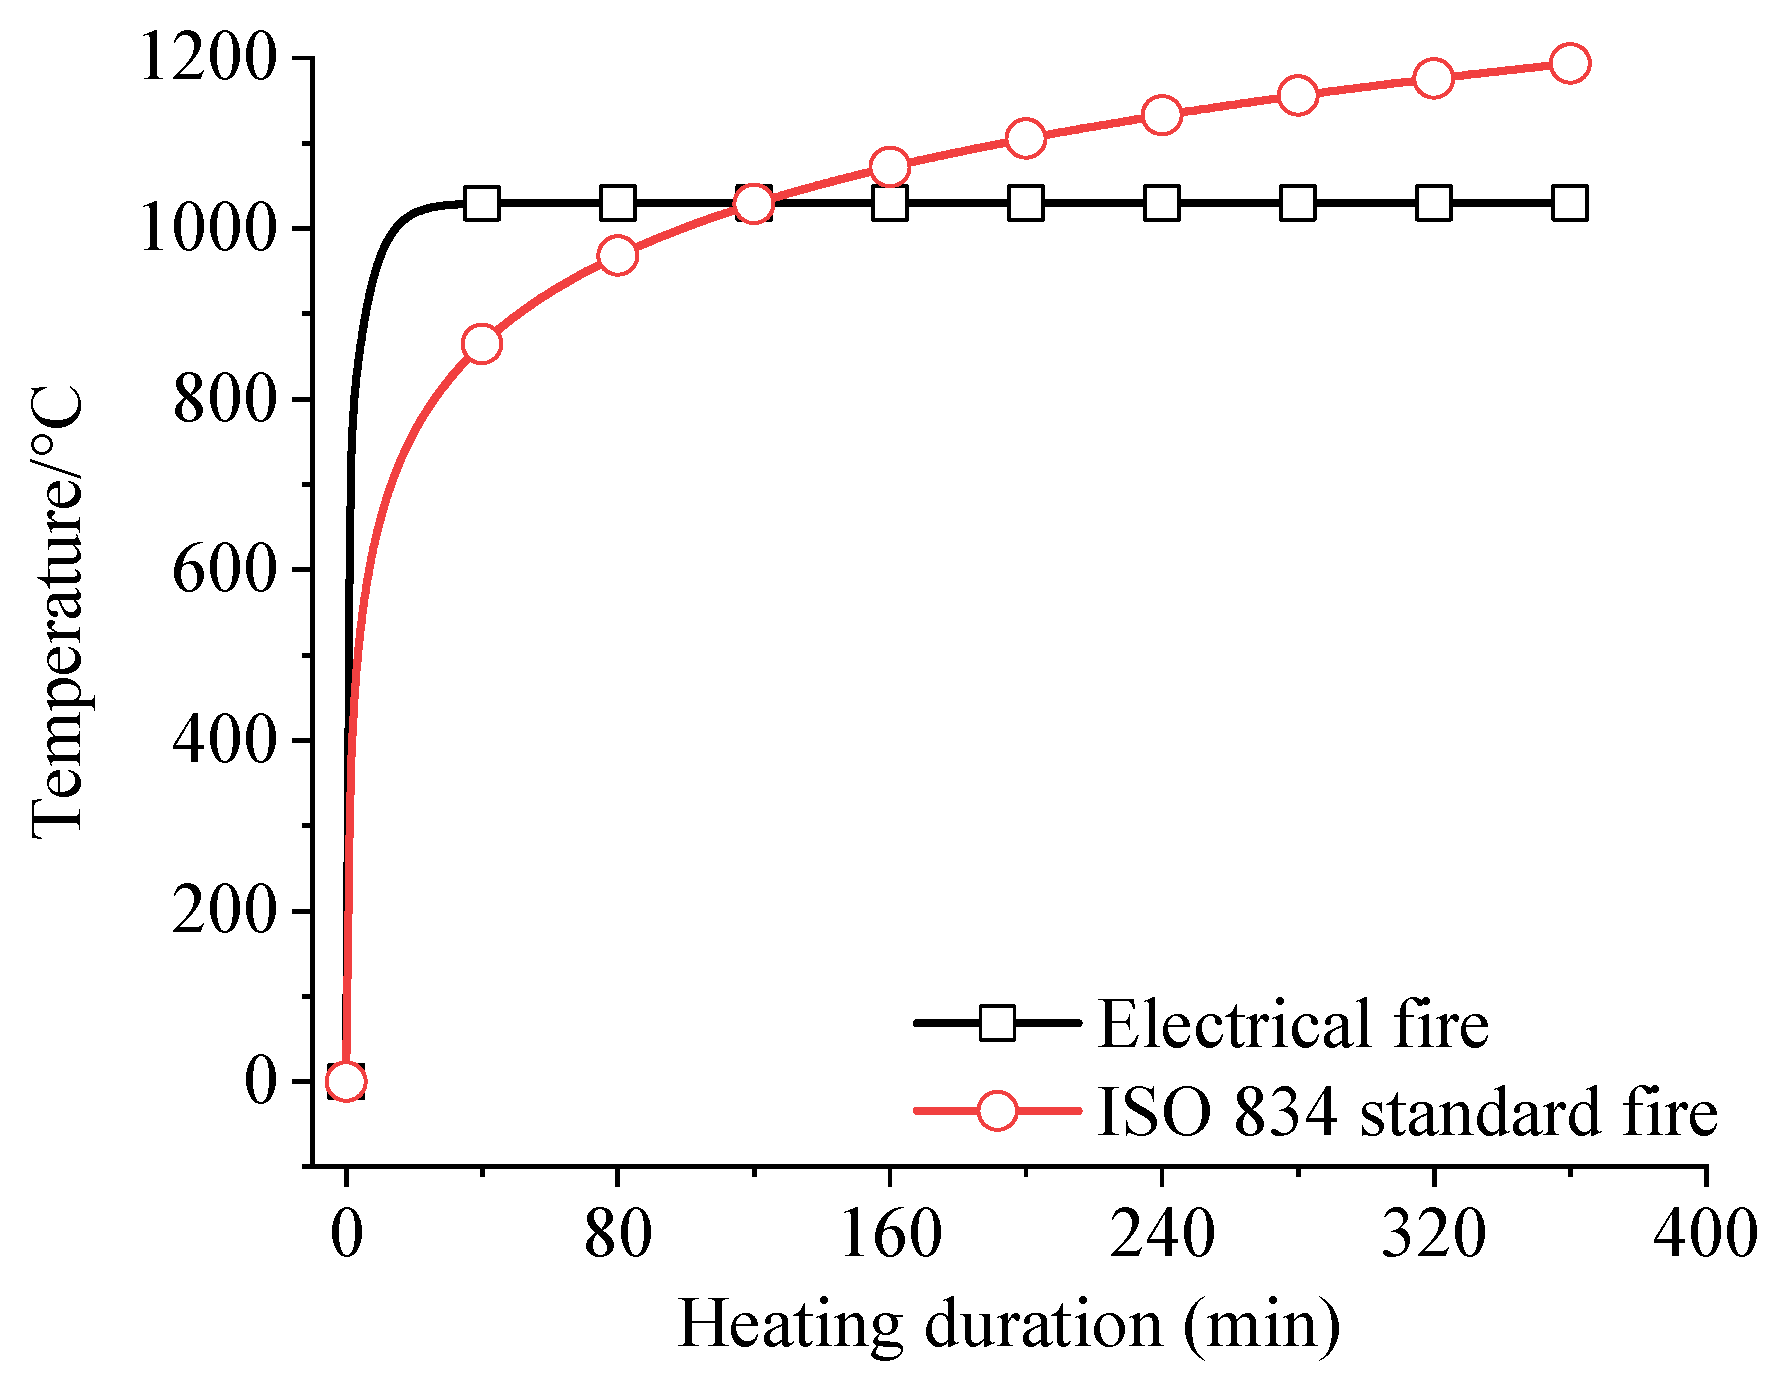
4. Test Program
5. Test Results
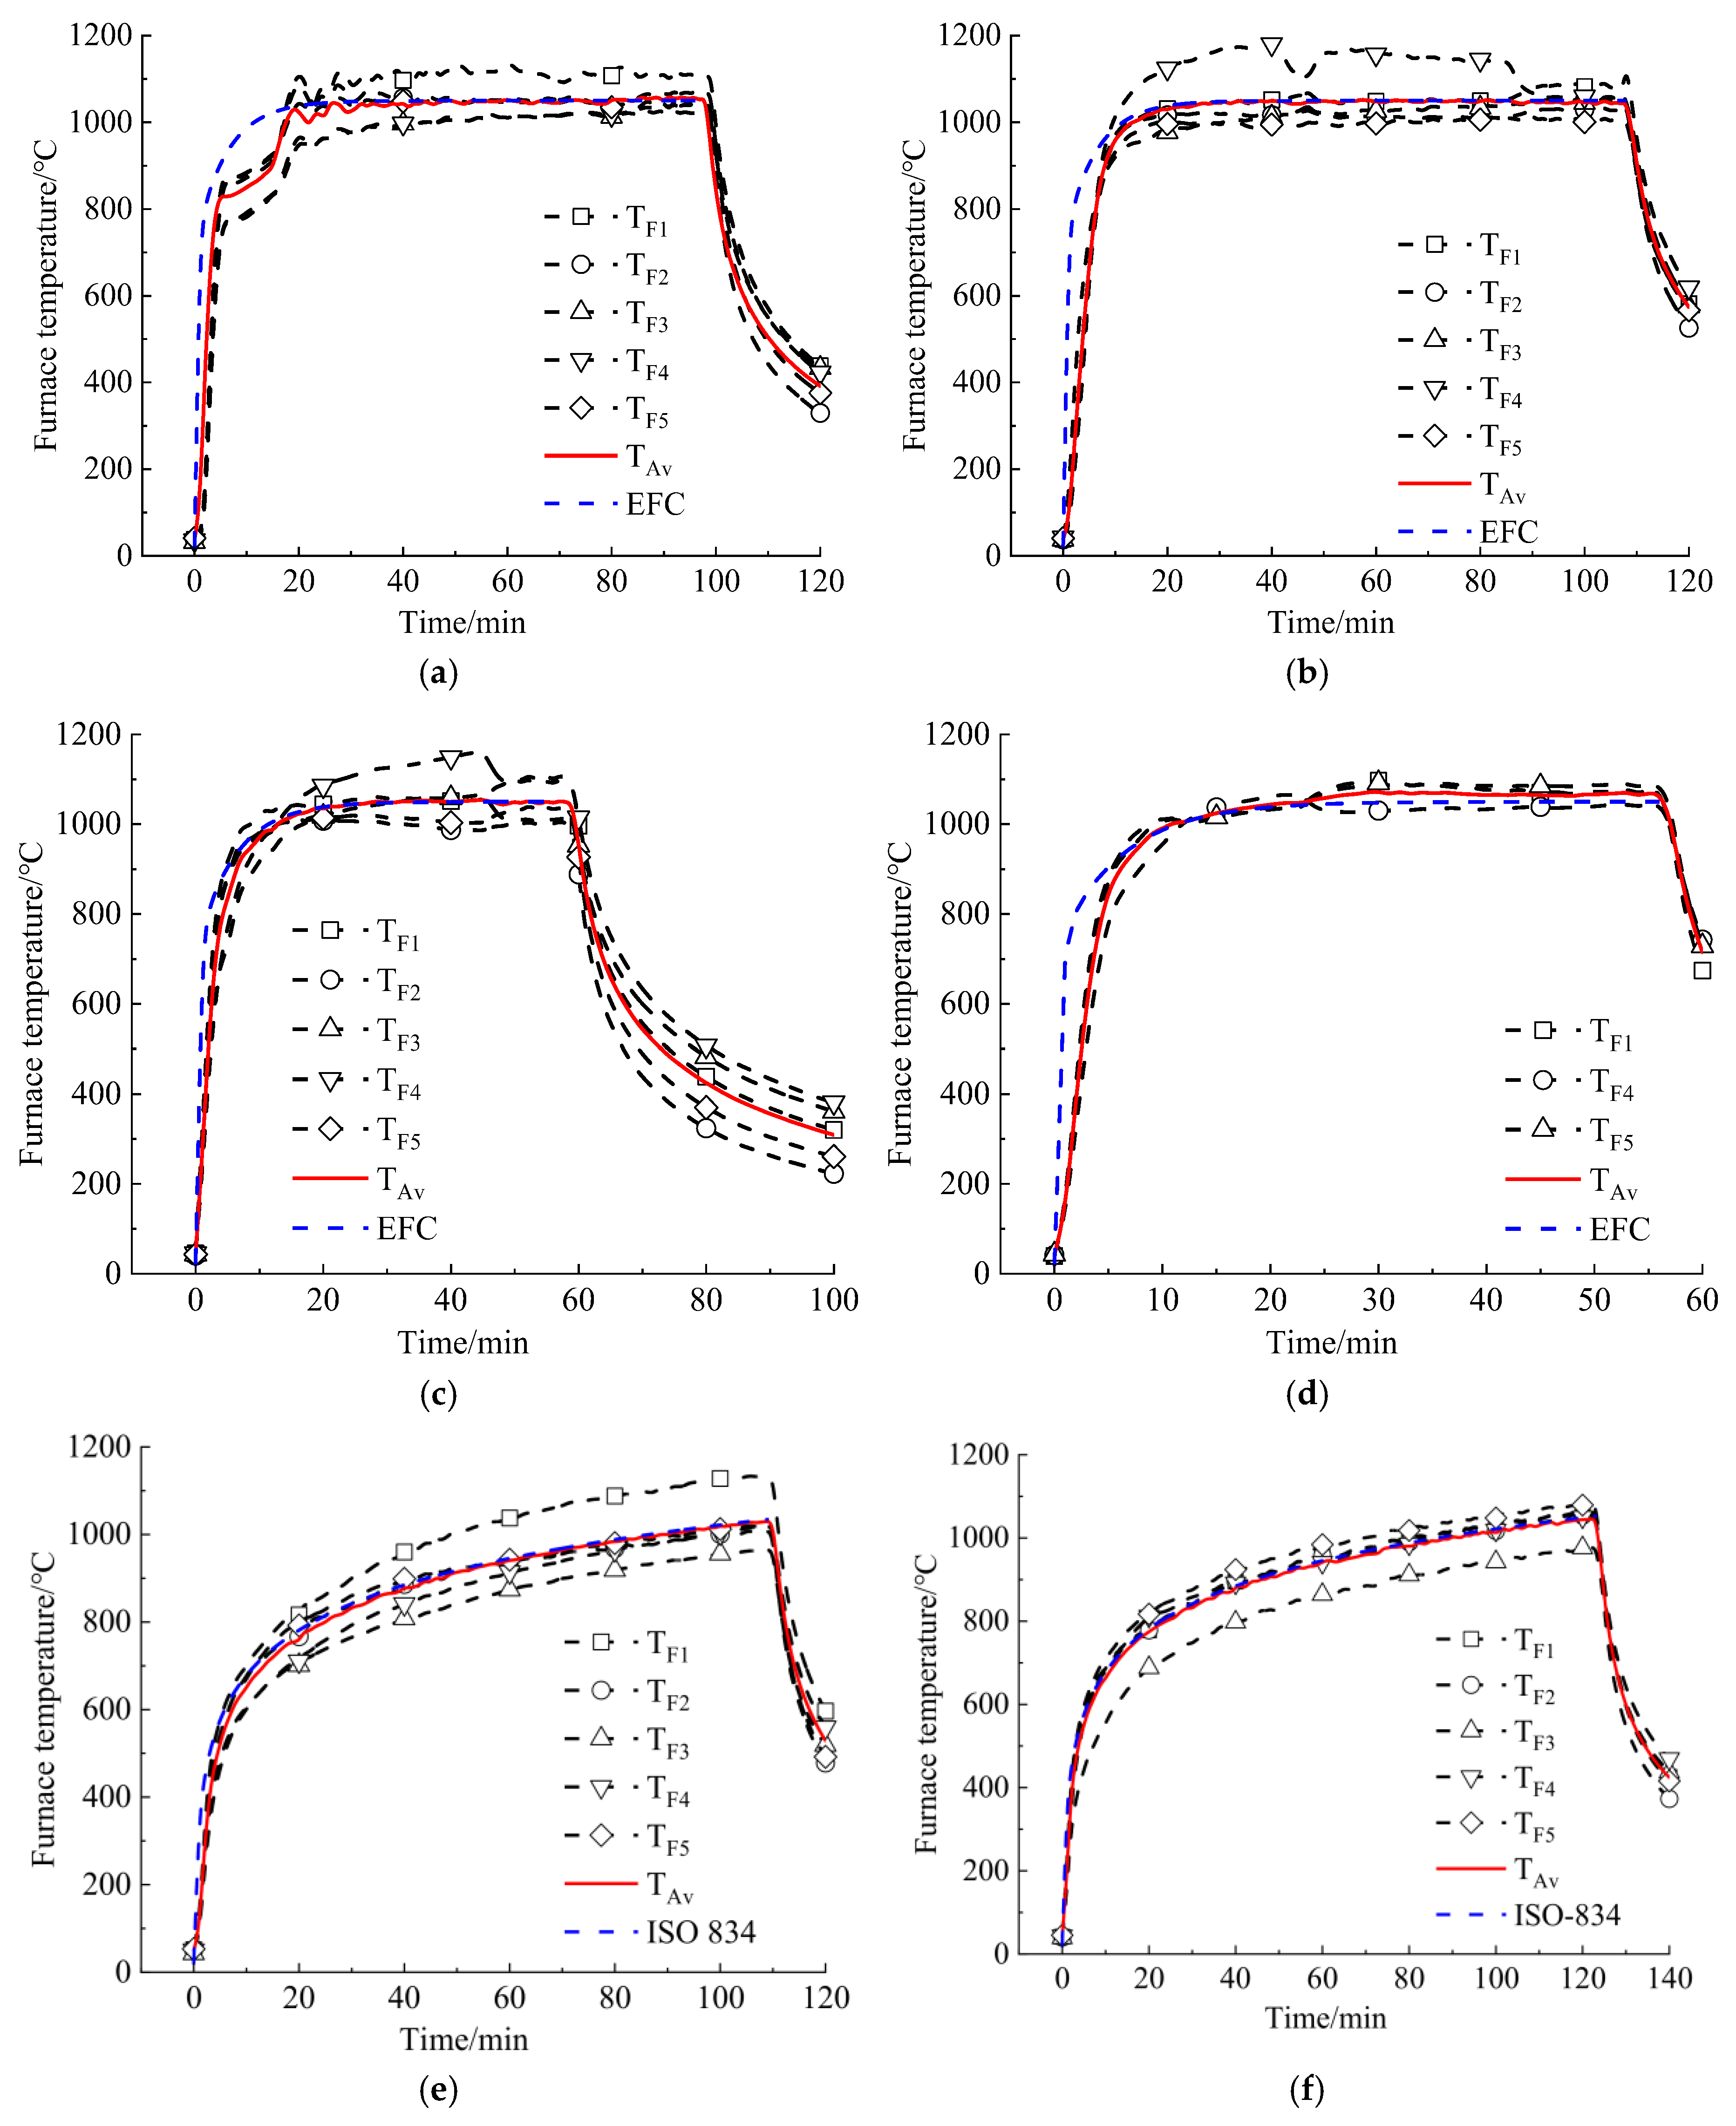
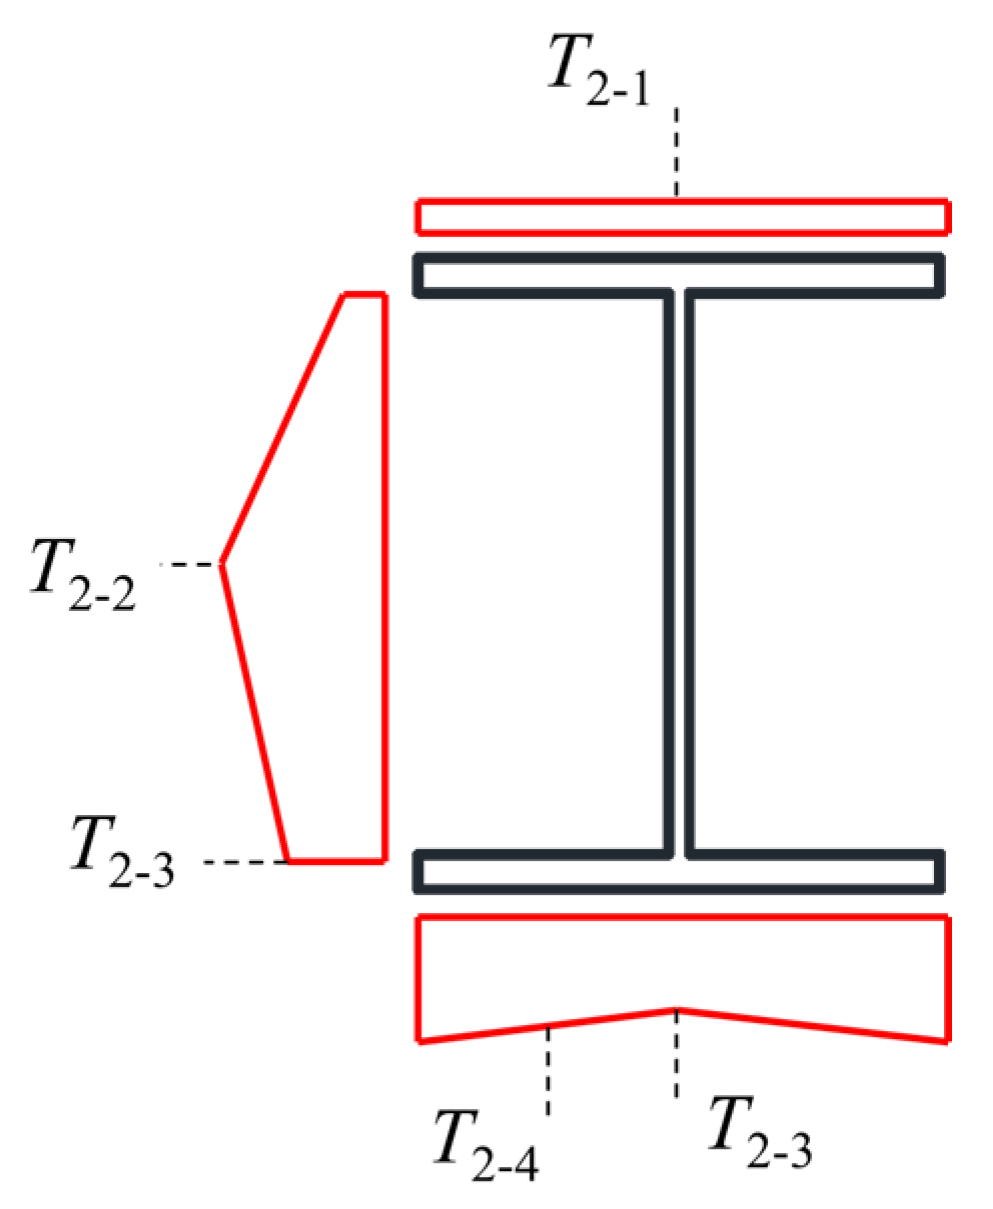
5.1. Temperature Results
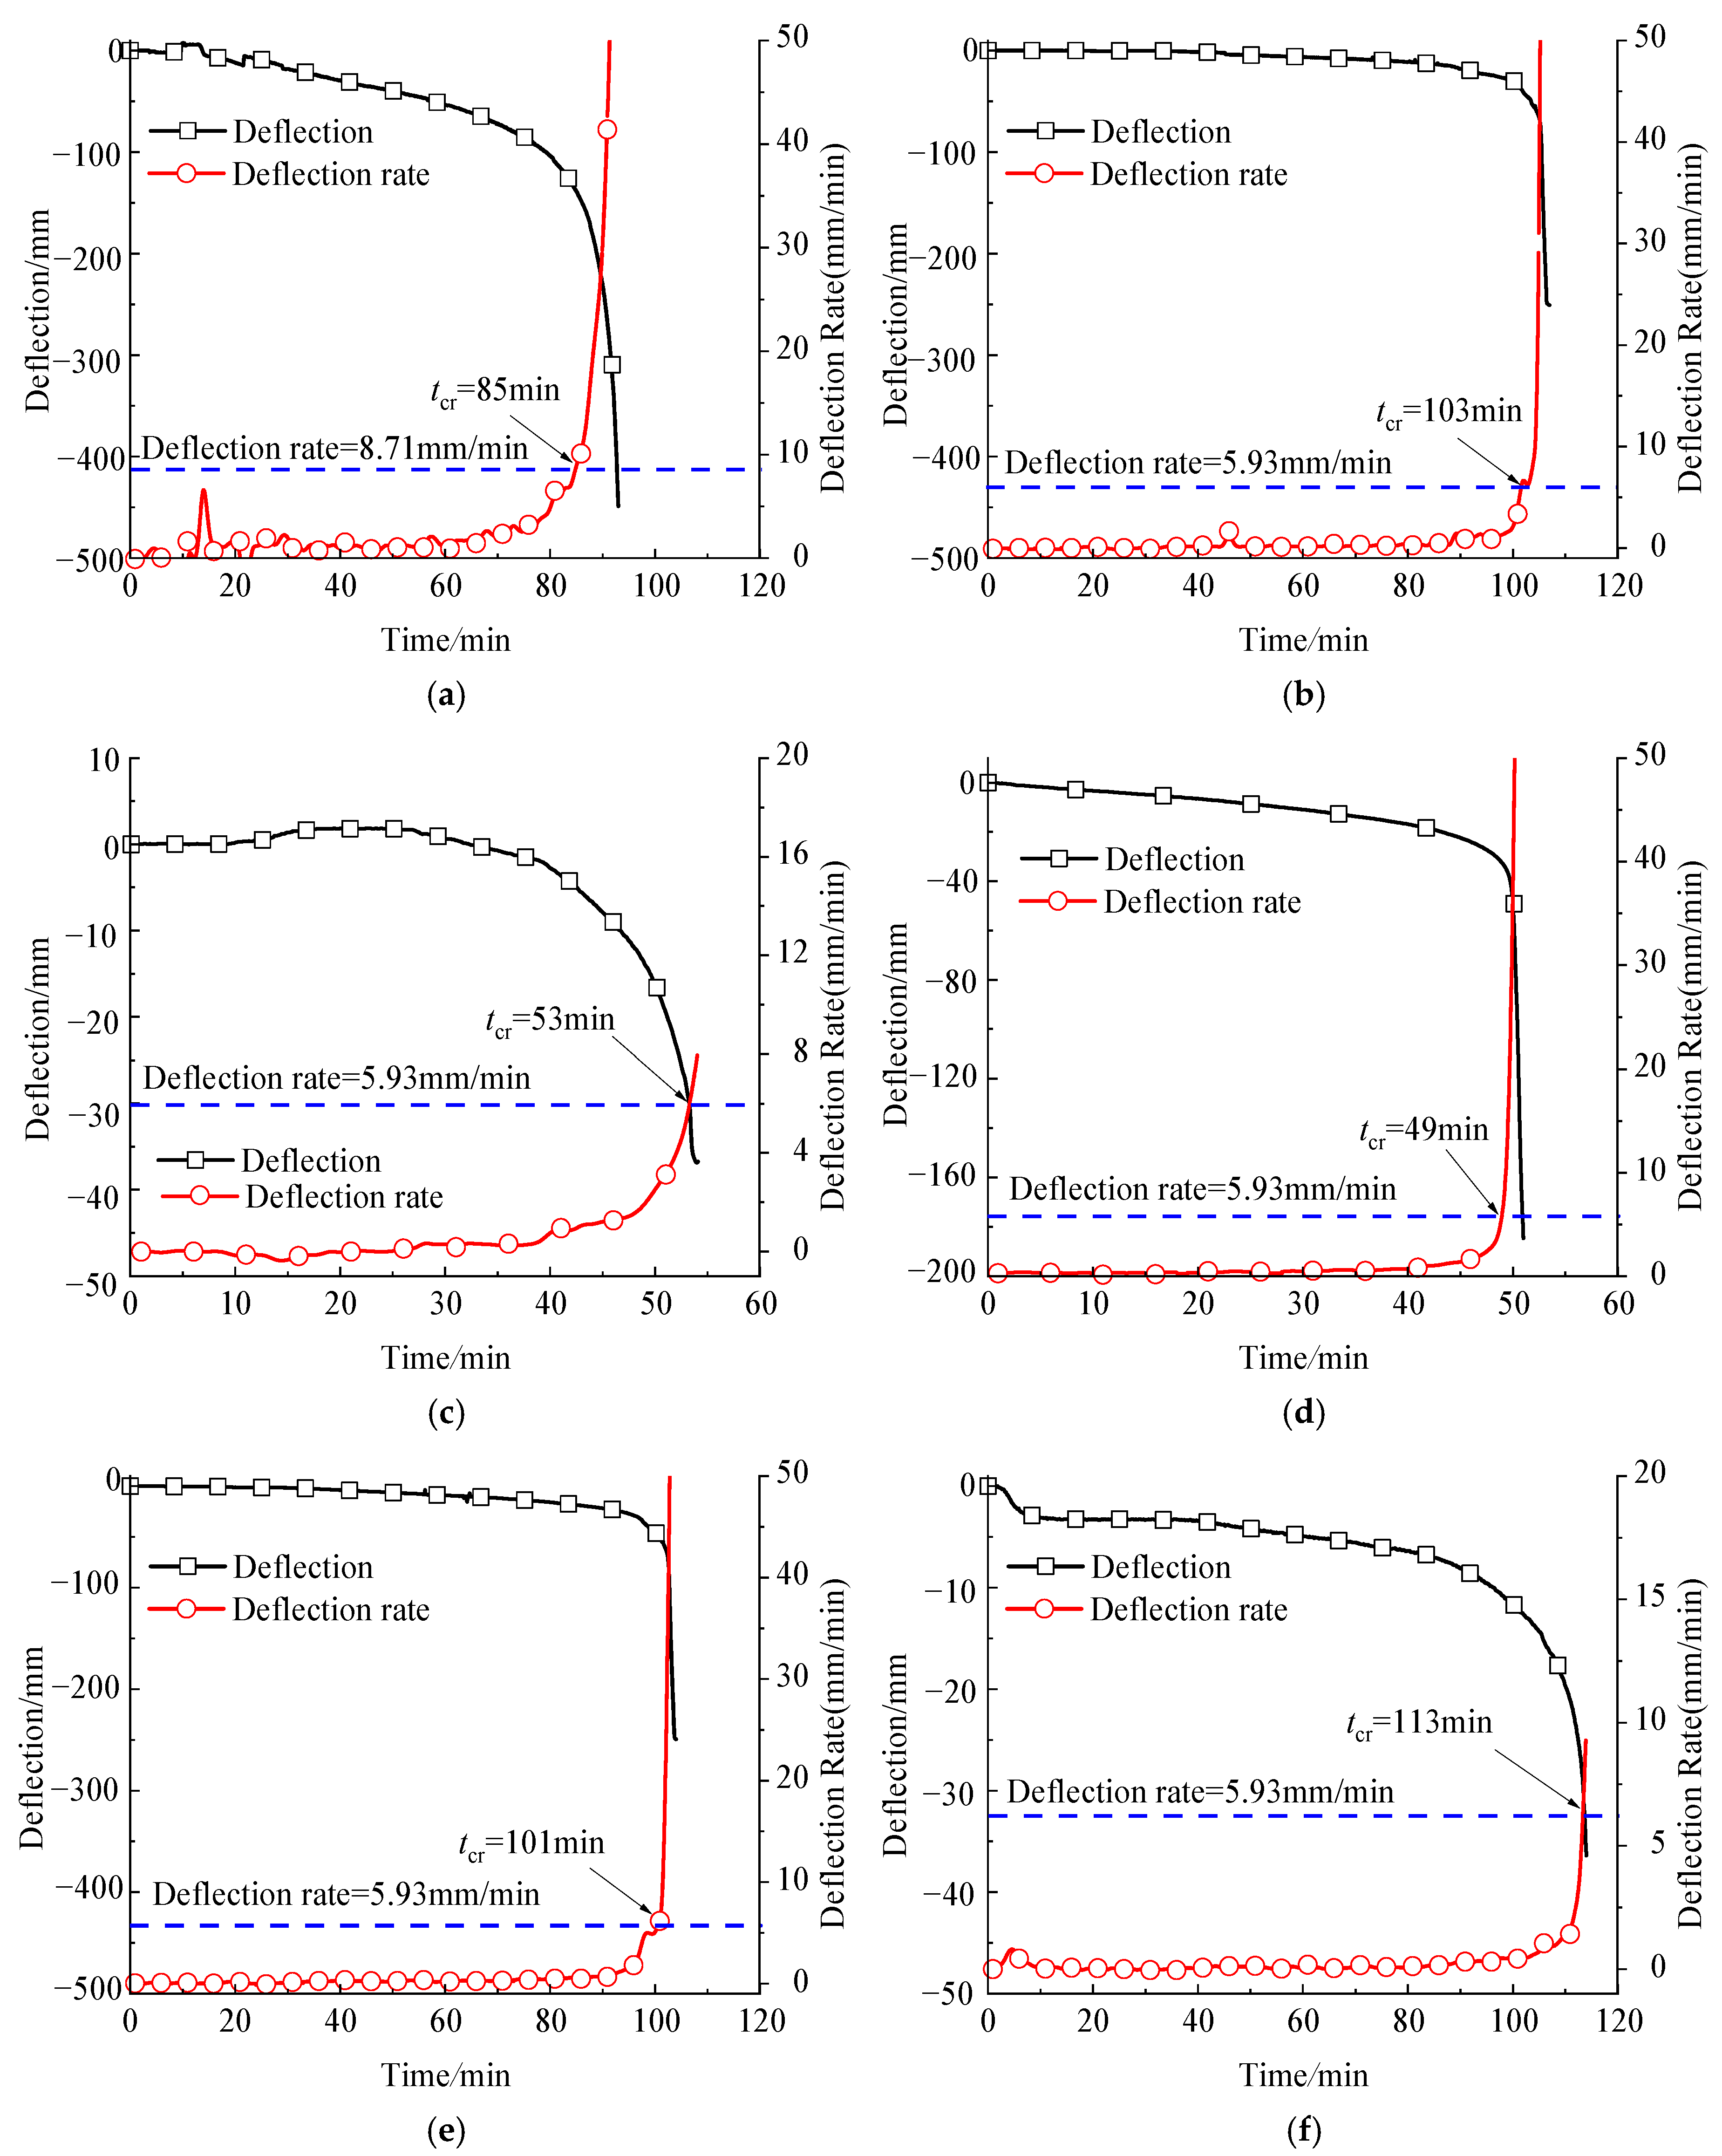
5.2. Displacement Results
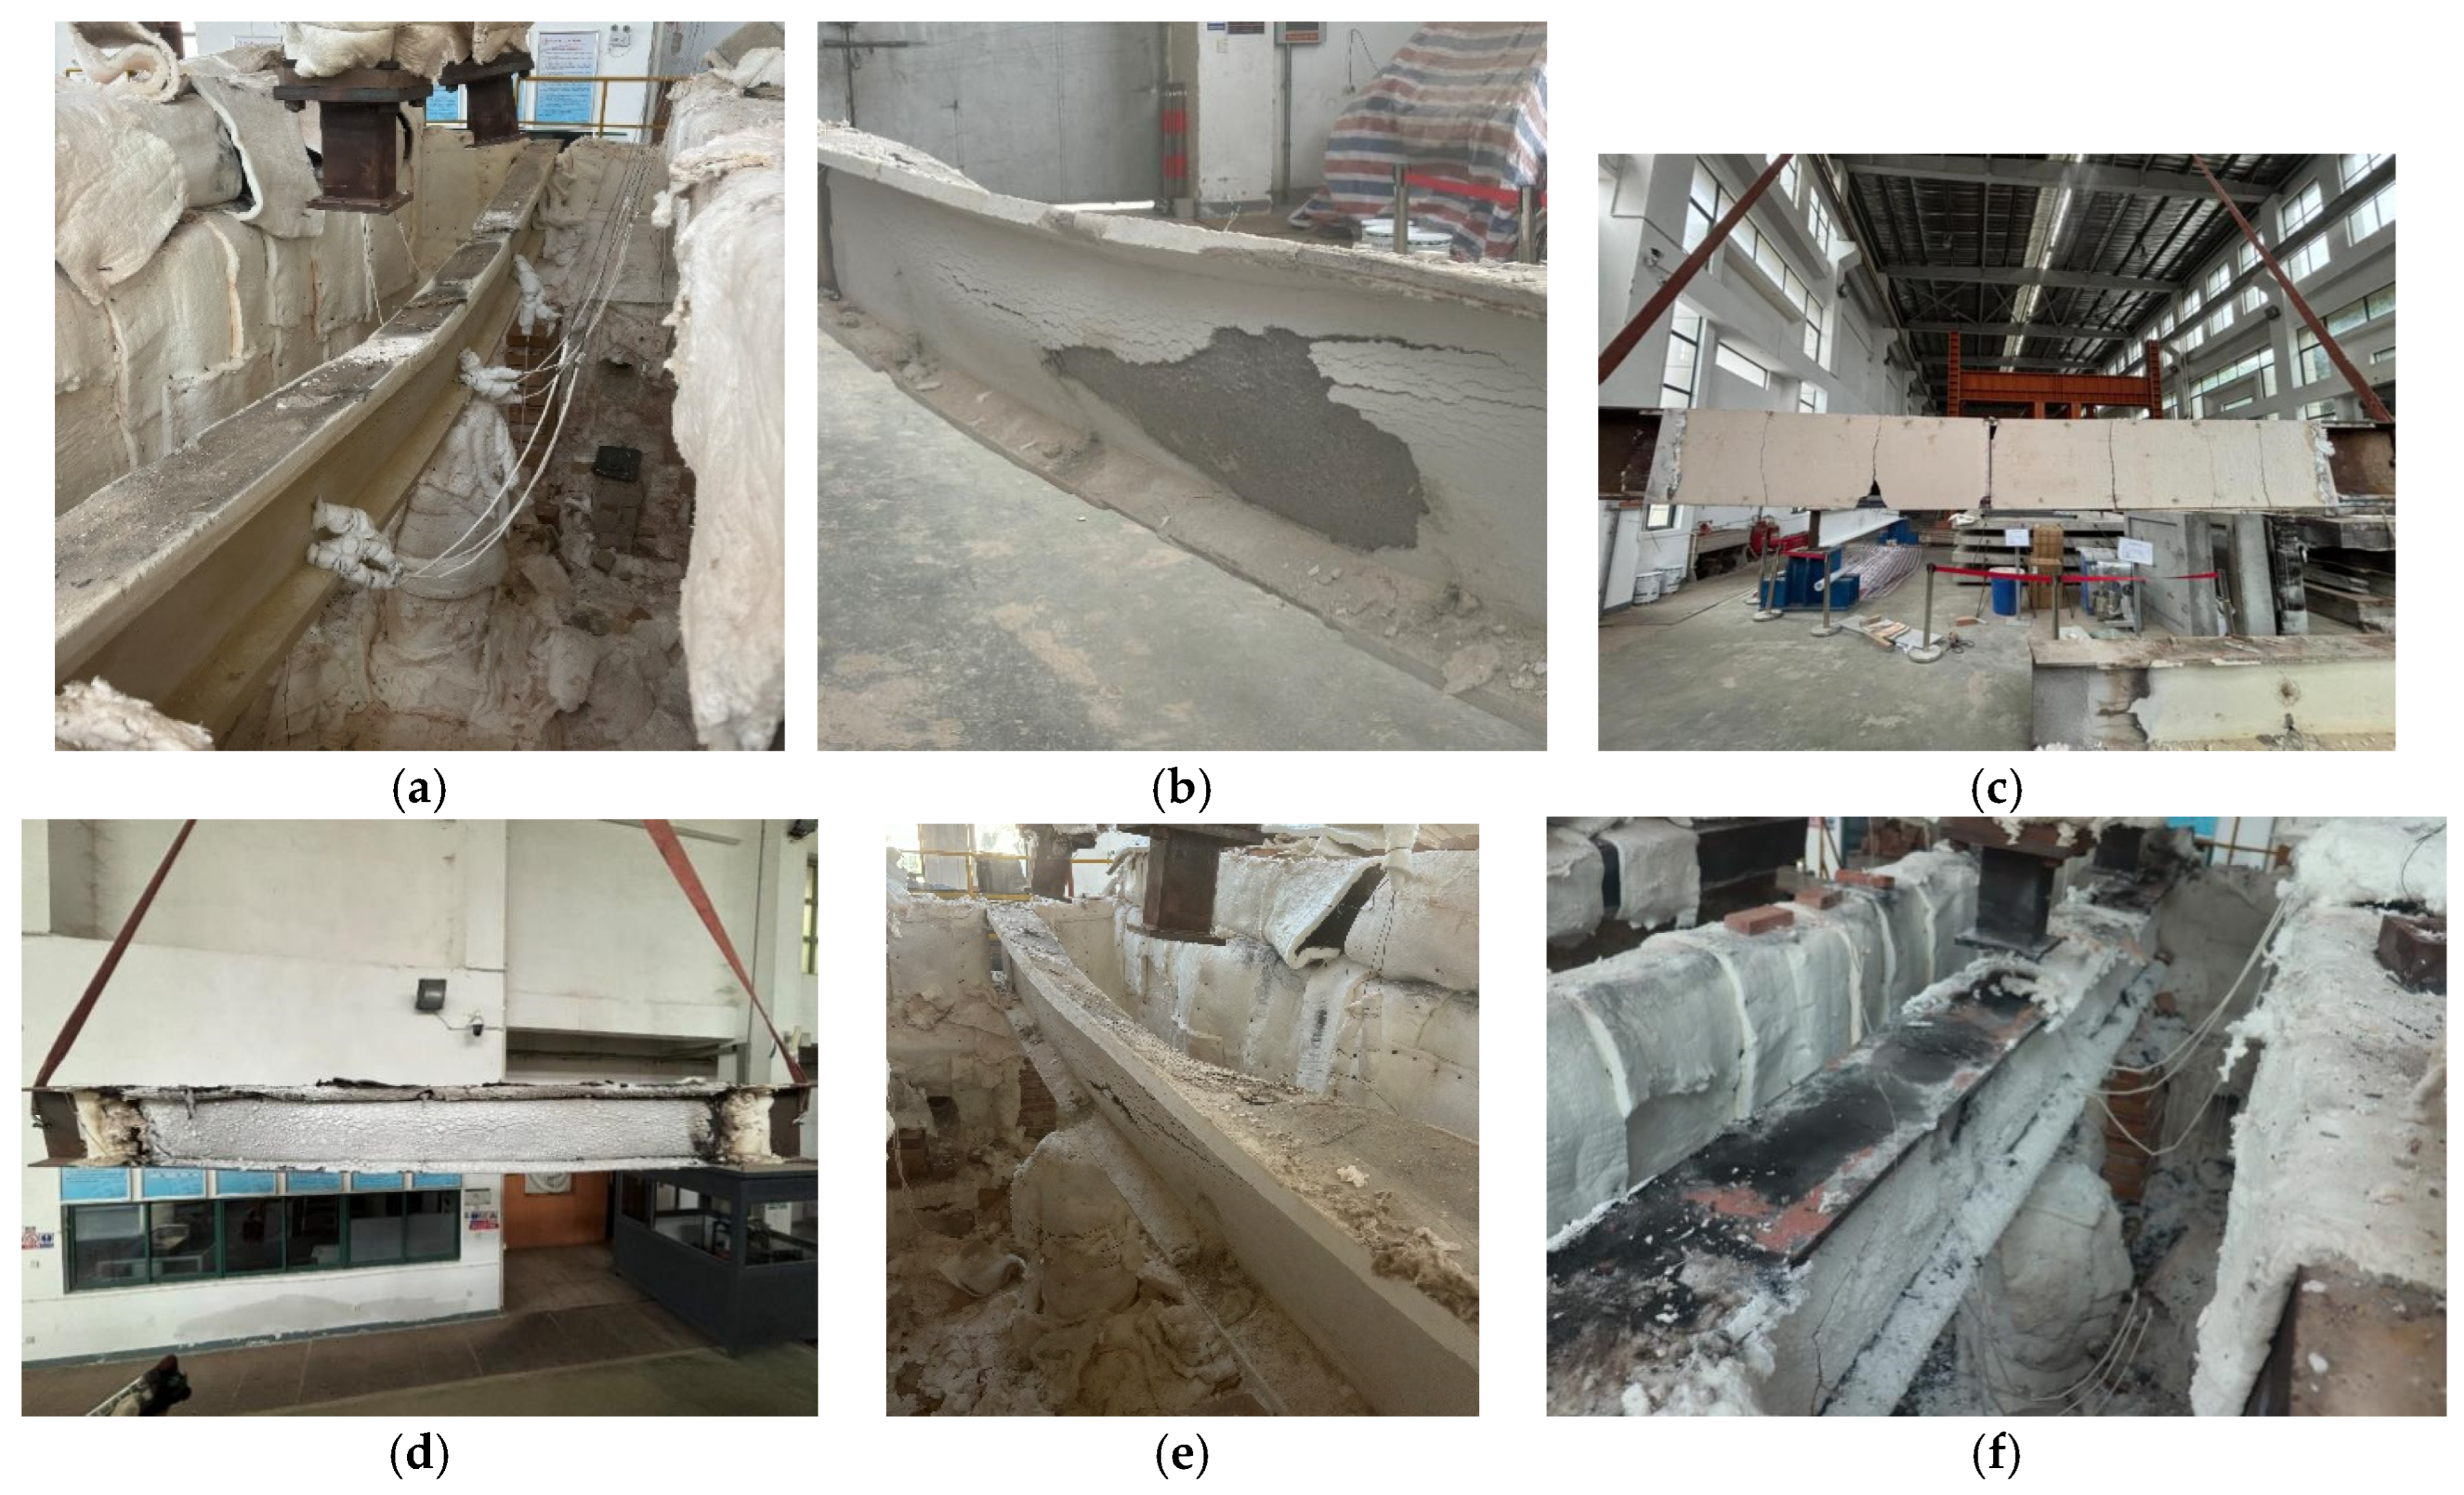
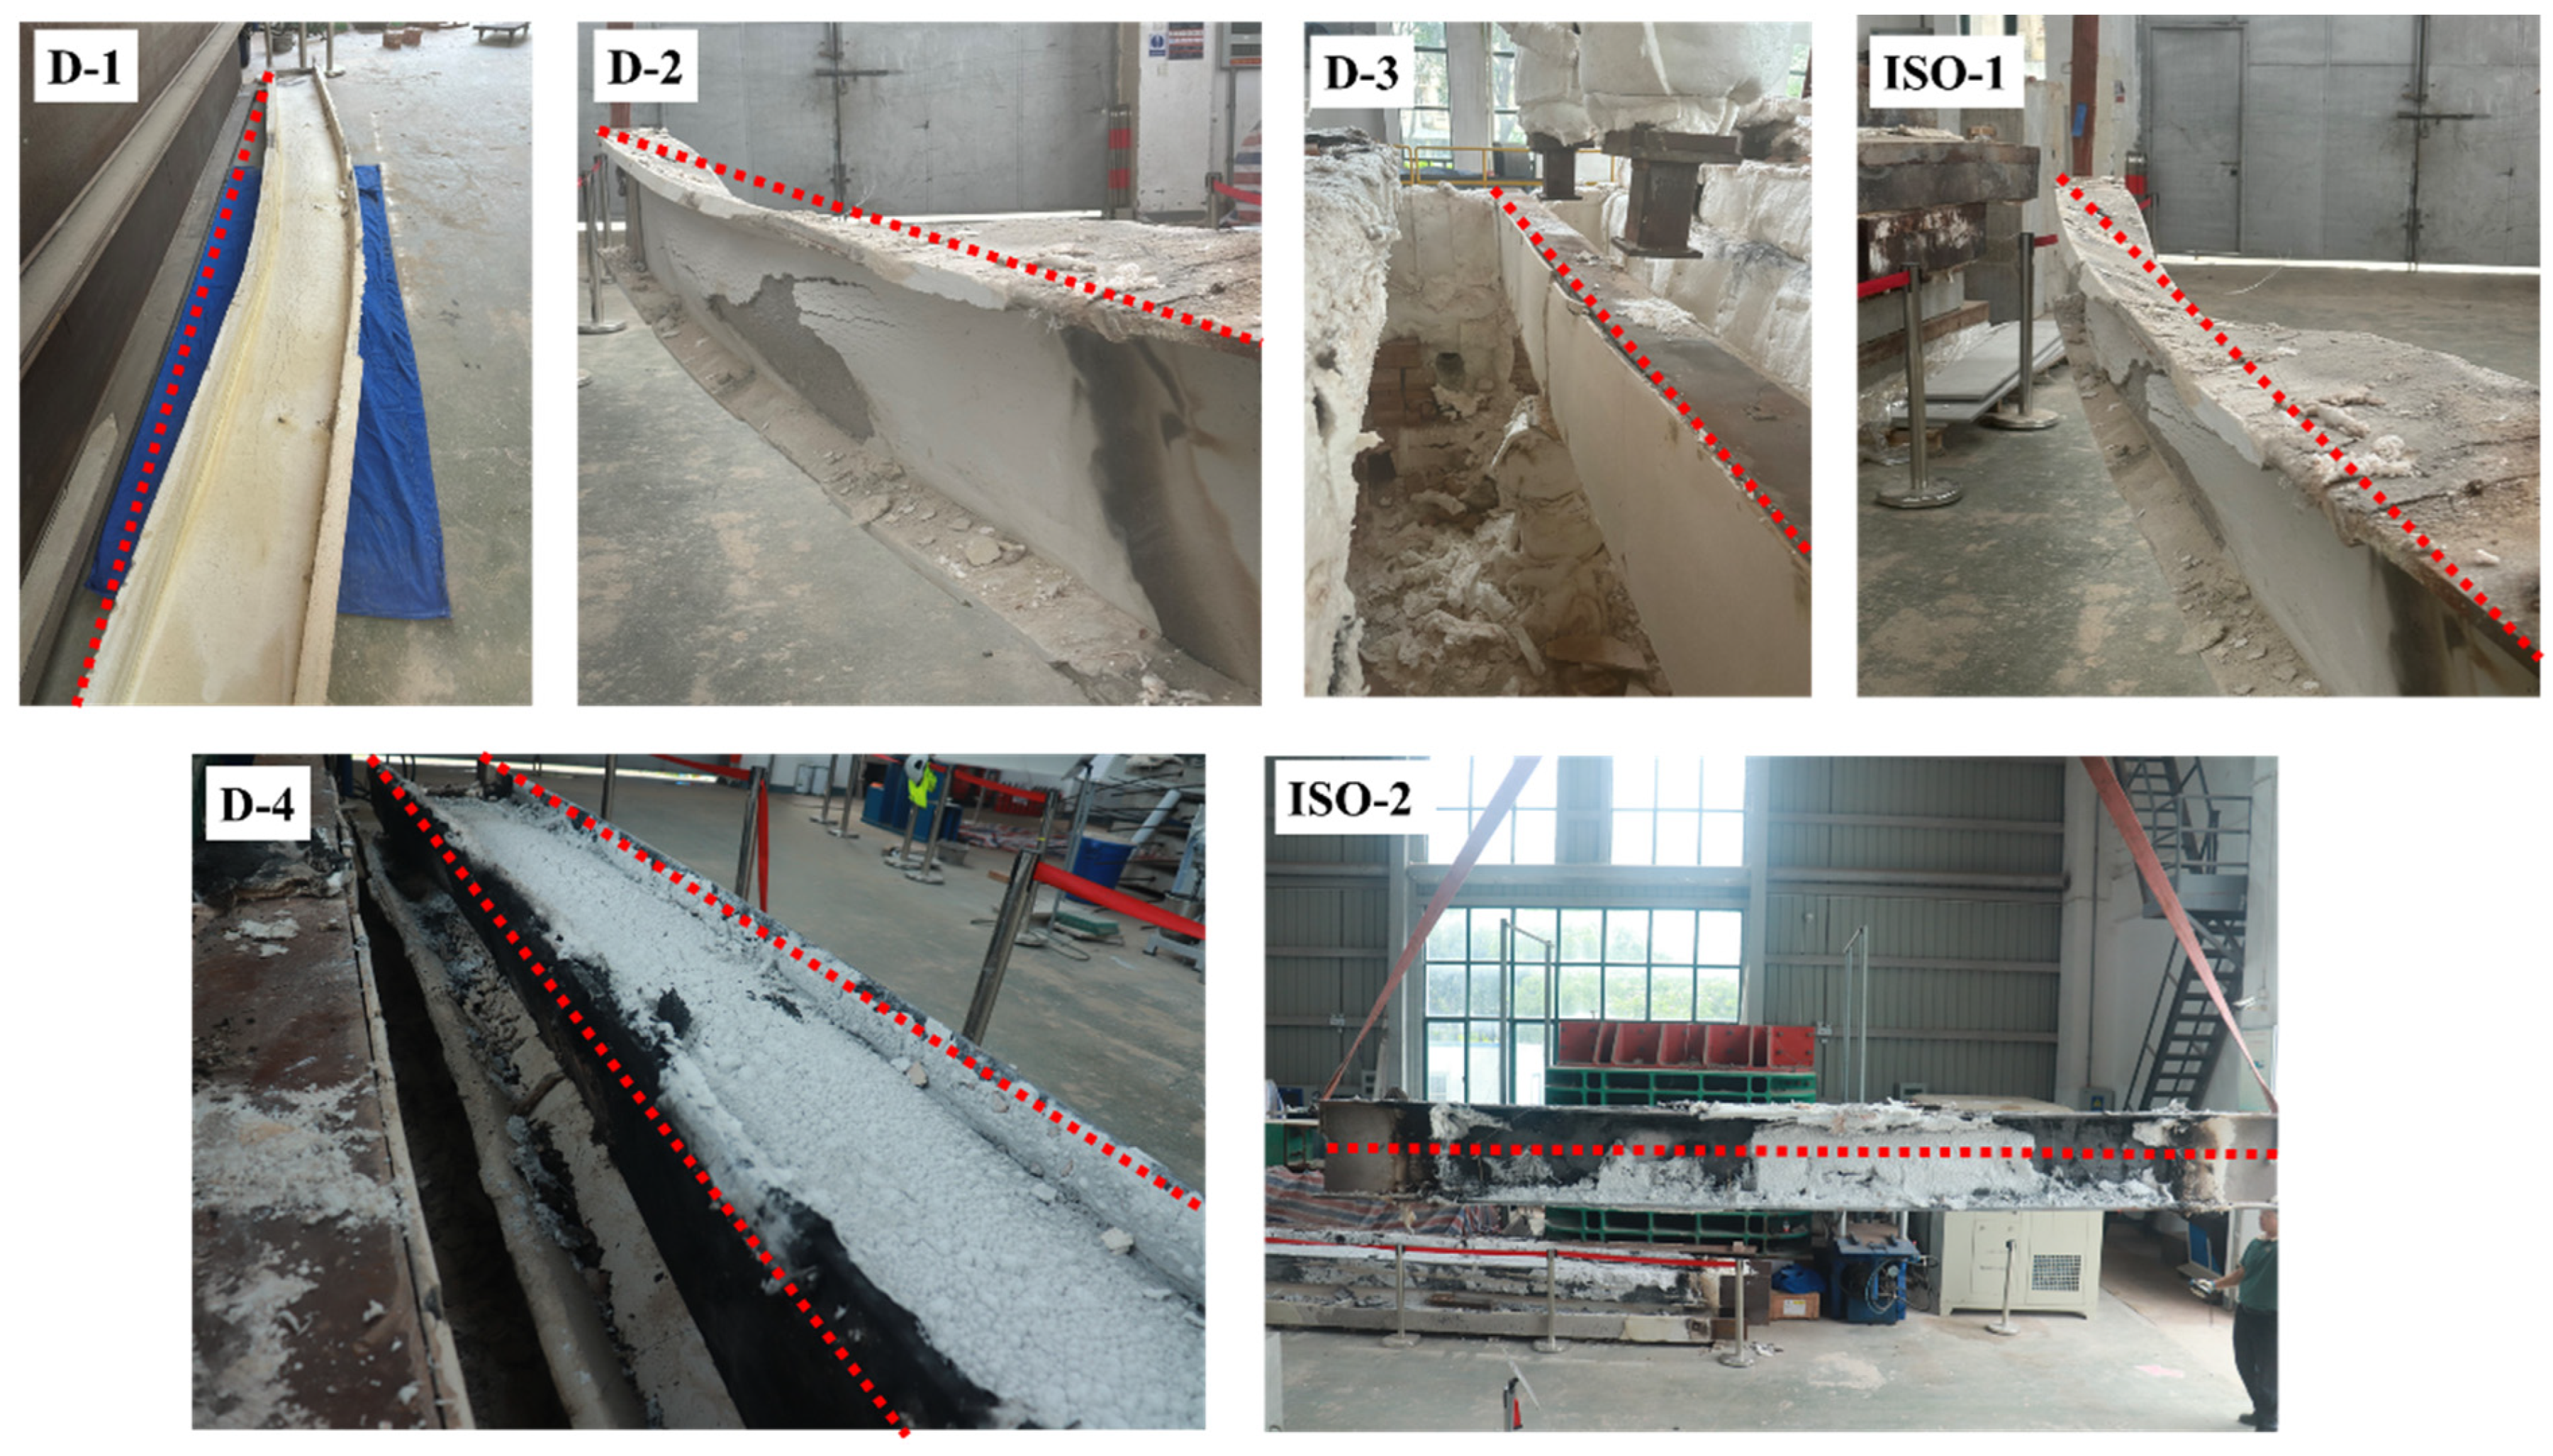
5.3. Test Phenomenon
5.4. Discussion of the Test Results
- (1)
- Determination of the fire resistance and critical temperature
- (2)
- Influence of fire-protection method on critical temperature
- (3)
- Influence of creep deformation on critical temperature
- (4)
- Influence of heating curves on critical temperature
- (5)
- Influence of fire protection on fire resistance
- (6)
- Influence of shape factors (Fi/V) on fire resistance
6. Evaluation of BS EN 1993-1-2
6.1. Critical Temperature of BS EN 1993-1-2
6.2. Fire Resistance of BS EN 1993-1-2
7. Evaluation of ANSI/AISC 360-22
7.1. Critical Temperature of ANSI/AISC 360-22
7.2. Fire Resistance of ANSI/AISC 360-22
8. Conclusions
- (1)
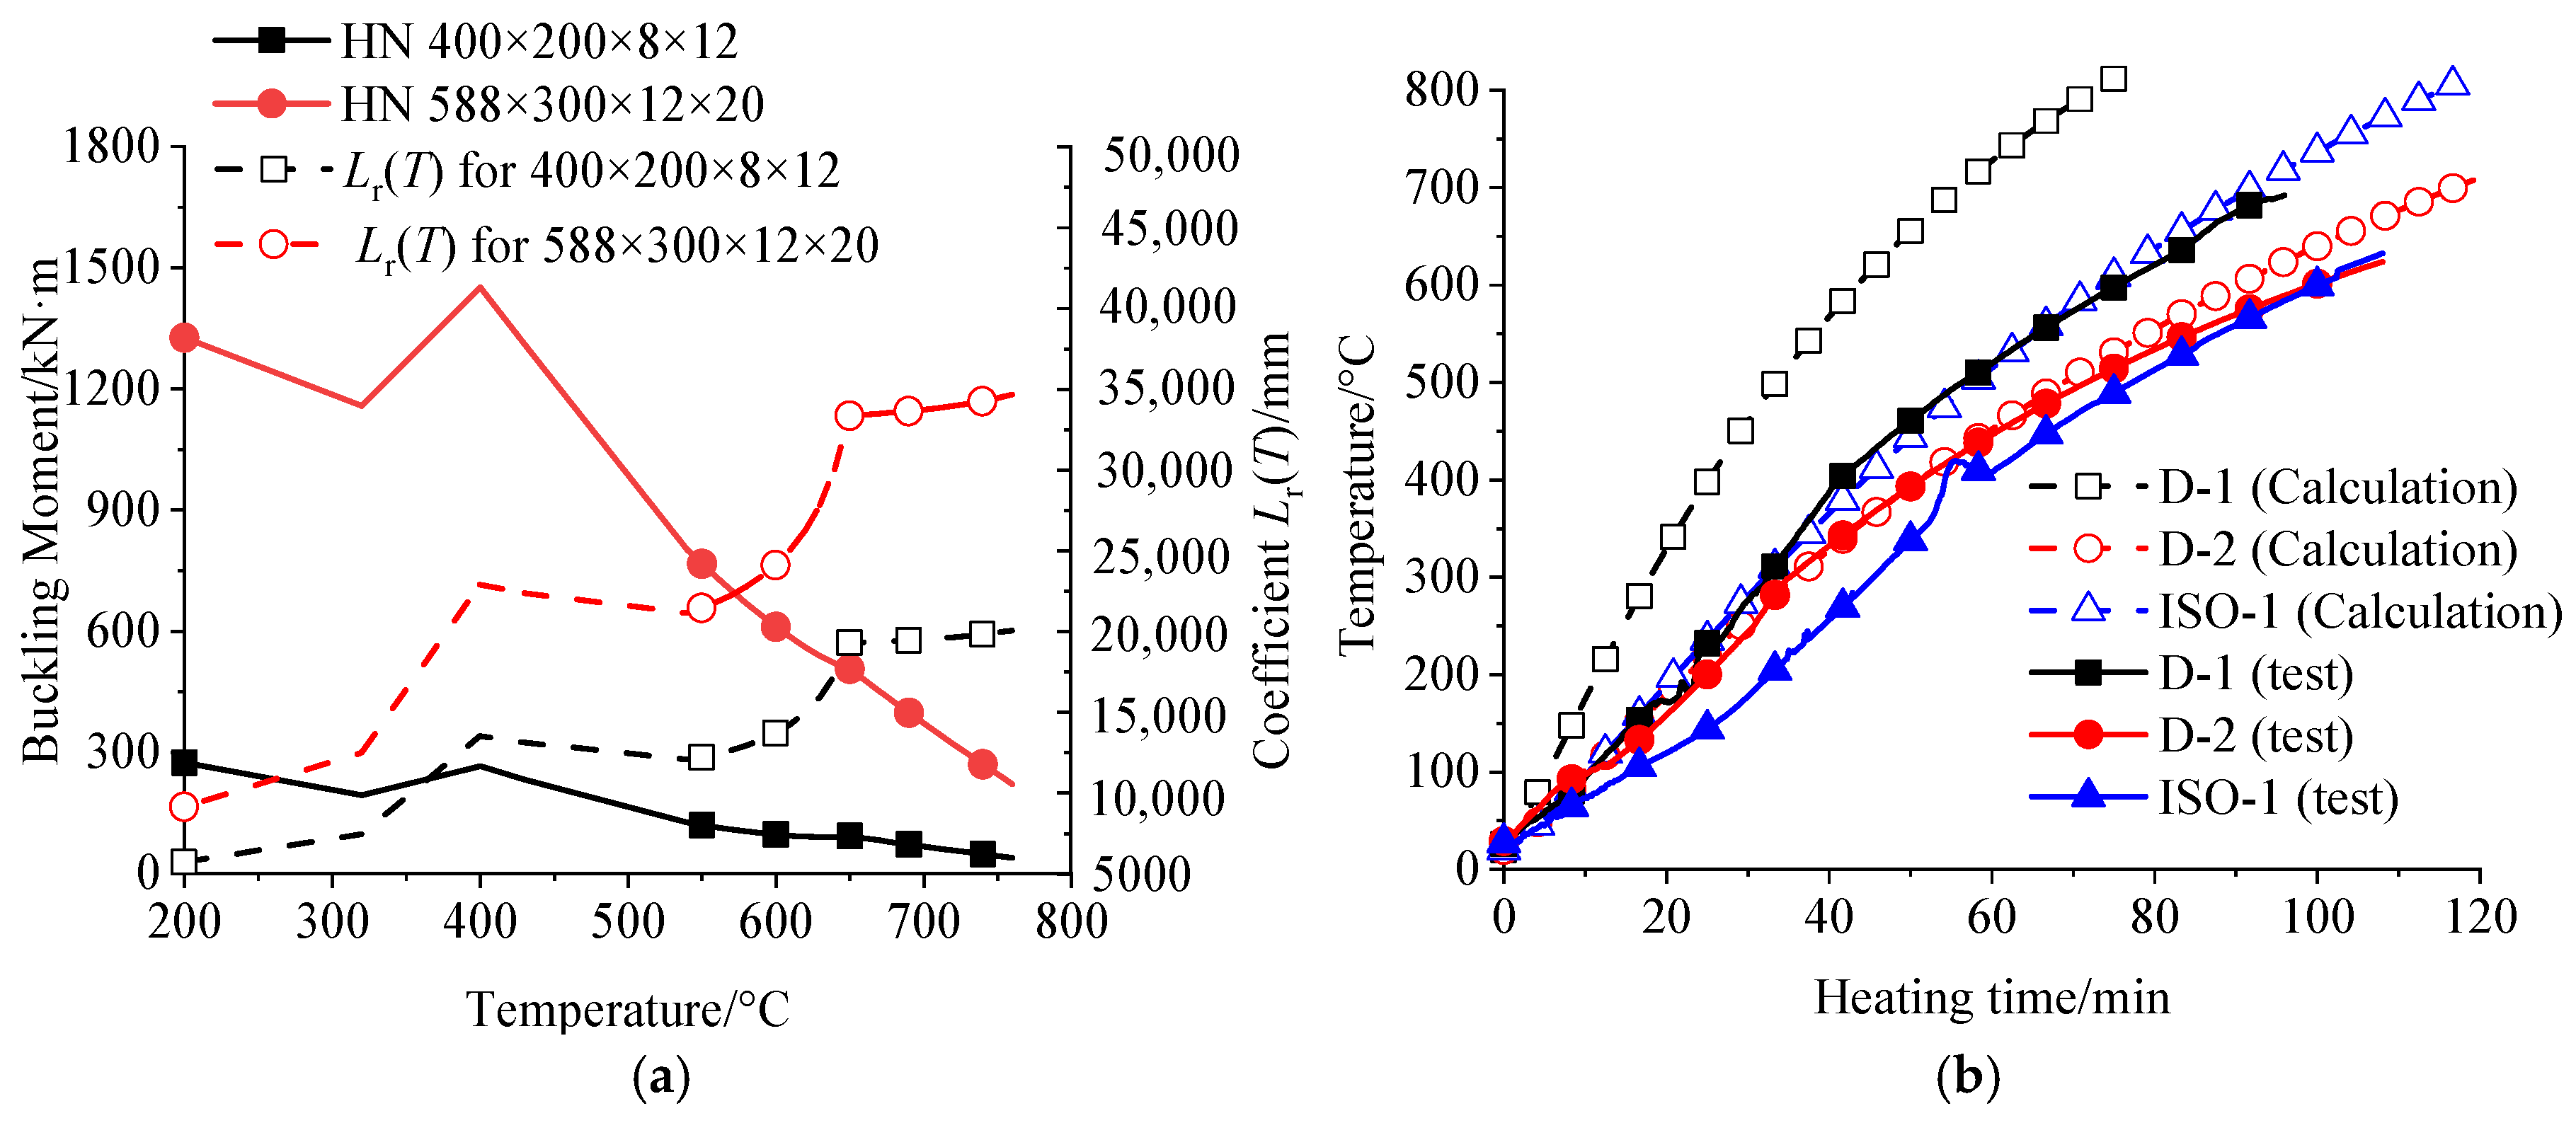
- Test results indicated that the steel beams subjected to three-sided fire exhibited a non-uniform temperature distribution. The difference between the lowest temperature on the upper flange and the highest temperature at the midpoint of the web reached 300 °C when the average cross-sectional temperature was 600 °C. This non-uniform temperature distribution presents a challenge in engineering applications, as it complicates the prediction of the mechanical behavior and fire resistance of the beams.
- (2)
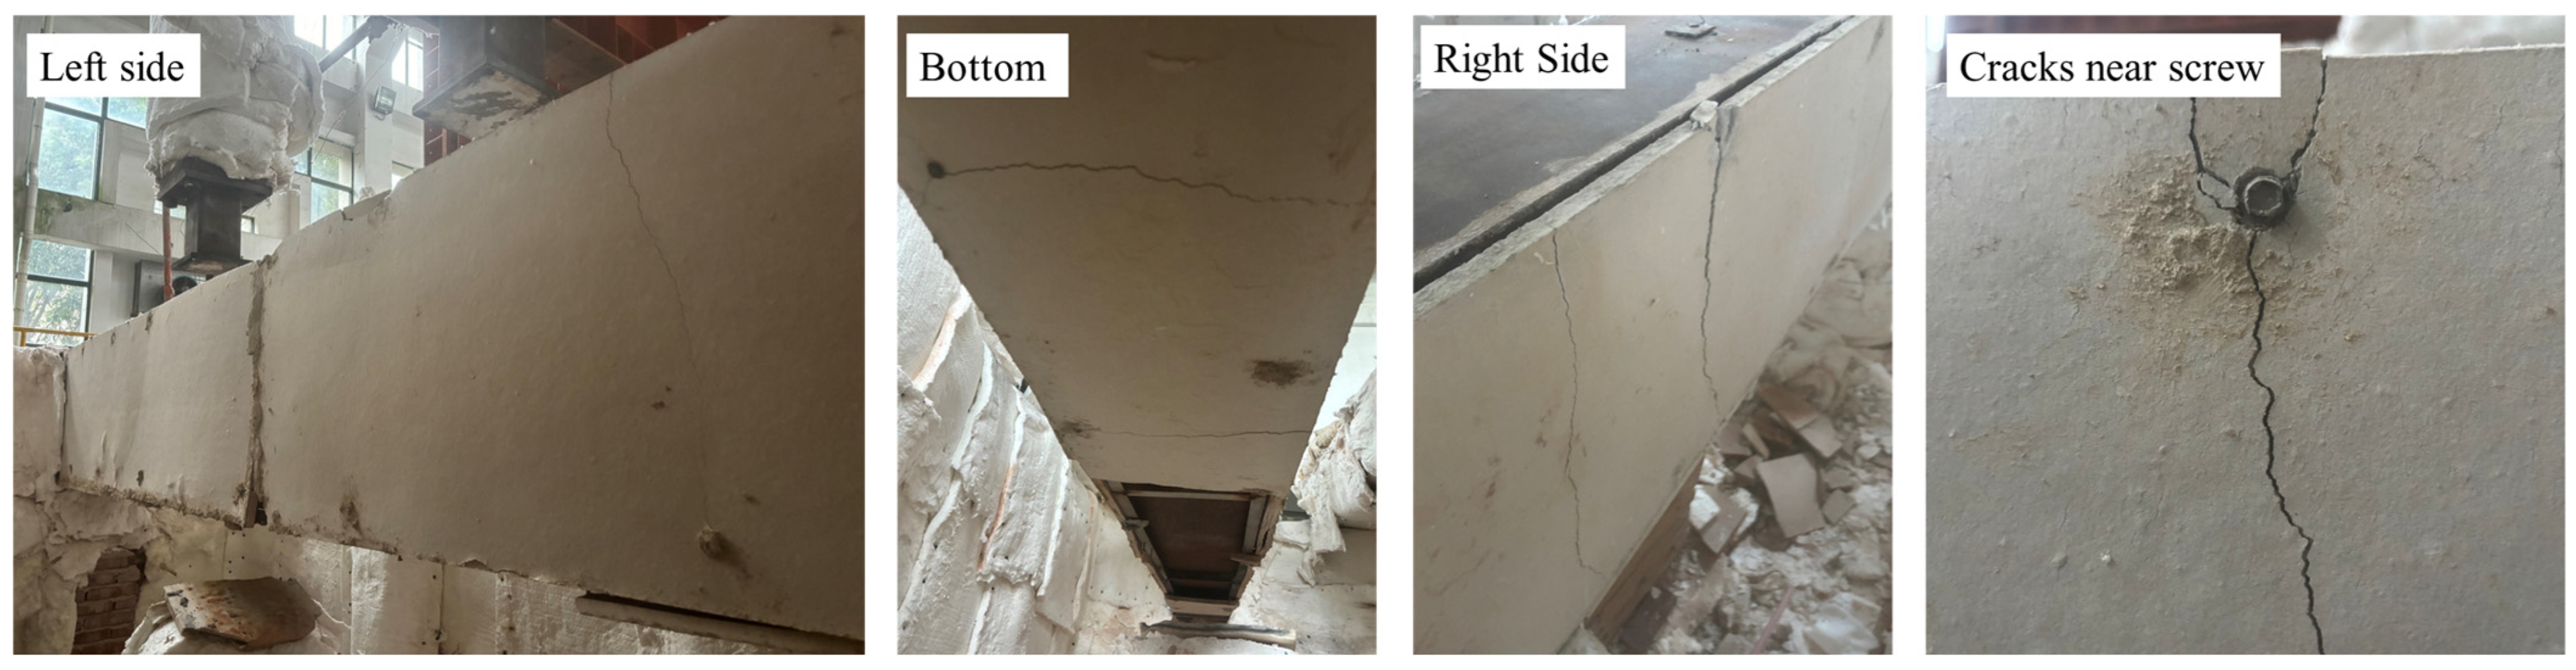
- It was found that the critical temperature (Tcr) and fire resistance (tcr) of the specimens with fire-retardant or intumescent coatings were lower than the values predicted by GB 51249-2017. The discrepancies in GB 51249-2017 for Tcr and tcr range from 0% to 8.4% and from 6% to 41%, respectively, indicating unsafe design methodology. Furthermore, fiber cement board should be used with caution in the fire protection of beams, as it can become brittle at elevated temperatures and is prone to breakage and detachment when the beams begin to bend.
- (3)
- Fire-retardant coatings and intumescent coatings exhibit superior protective properties compared to fiber cement boards, with only a minor difference in critical temperature between the two types of coatings.
- (4)
- Creep deformation can significantly reduce the critical temperature of steel beams. Research indicates that beams subjected to shorter heating durations exhibit a critical temperature that is 8.6% higher than that of specimens exposed to longer heating durations. Furthermore, heating curves have a limited impact on the critical temperature, provided that the beams are protected from fire and their heating durations are comparable. In contrast, if these conditions are not met, creep deformation will affect the critical temperature.
- (5)
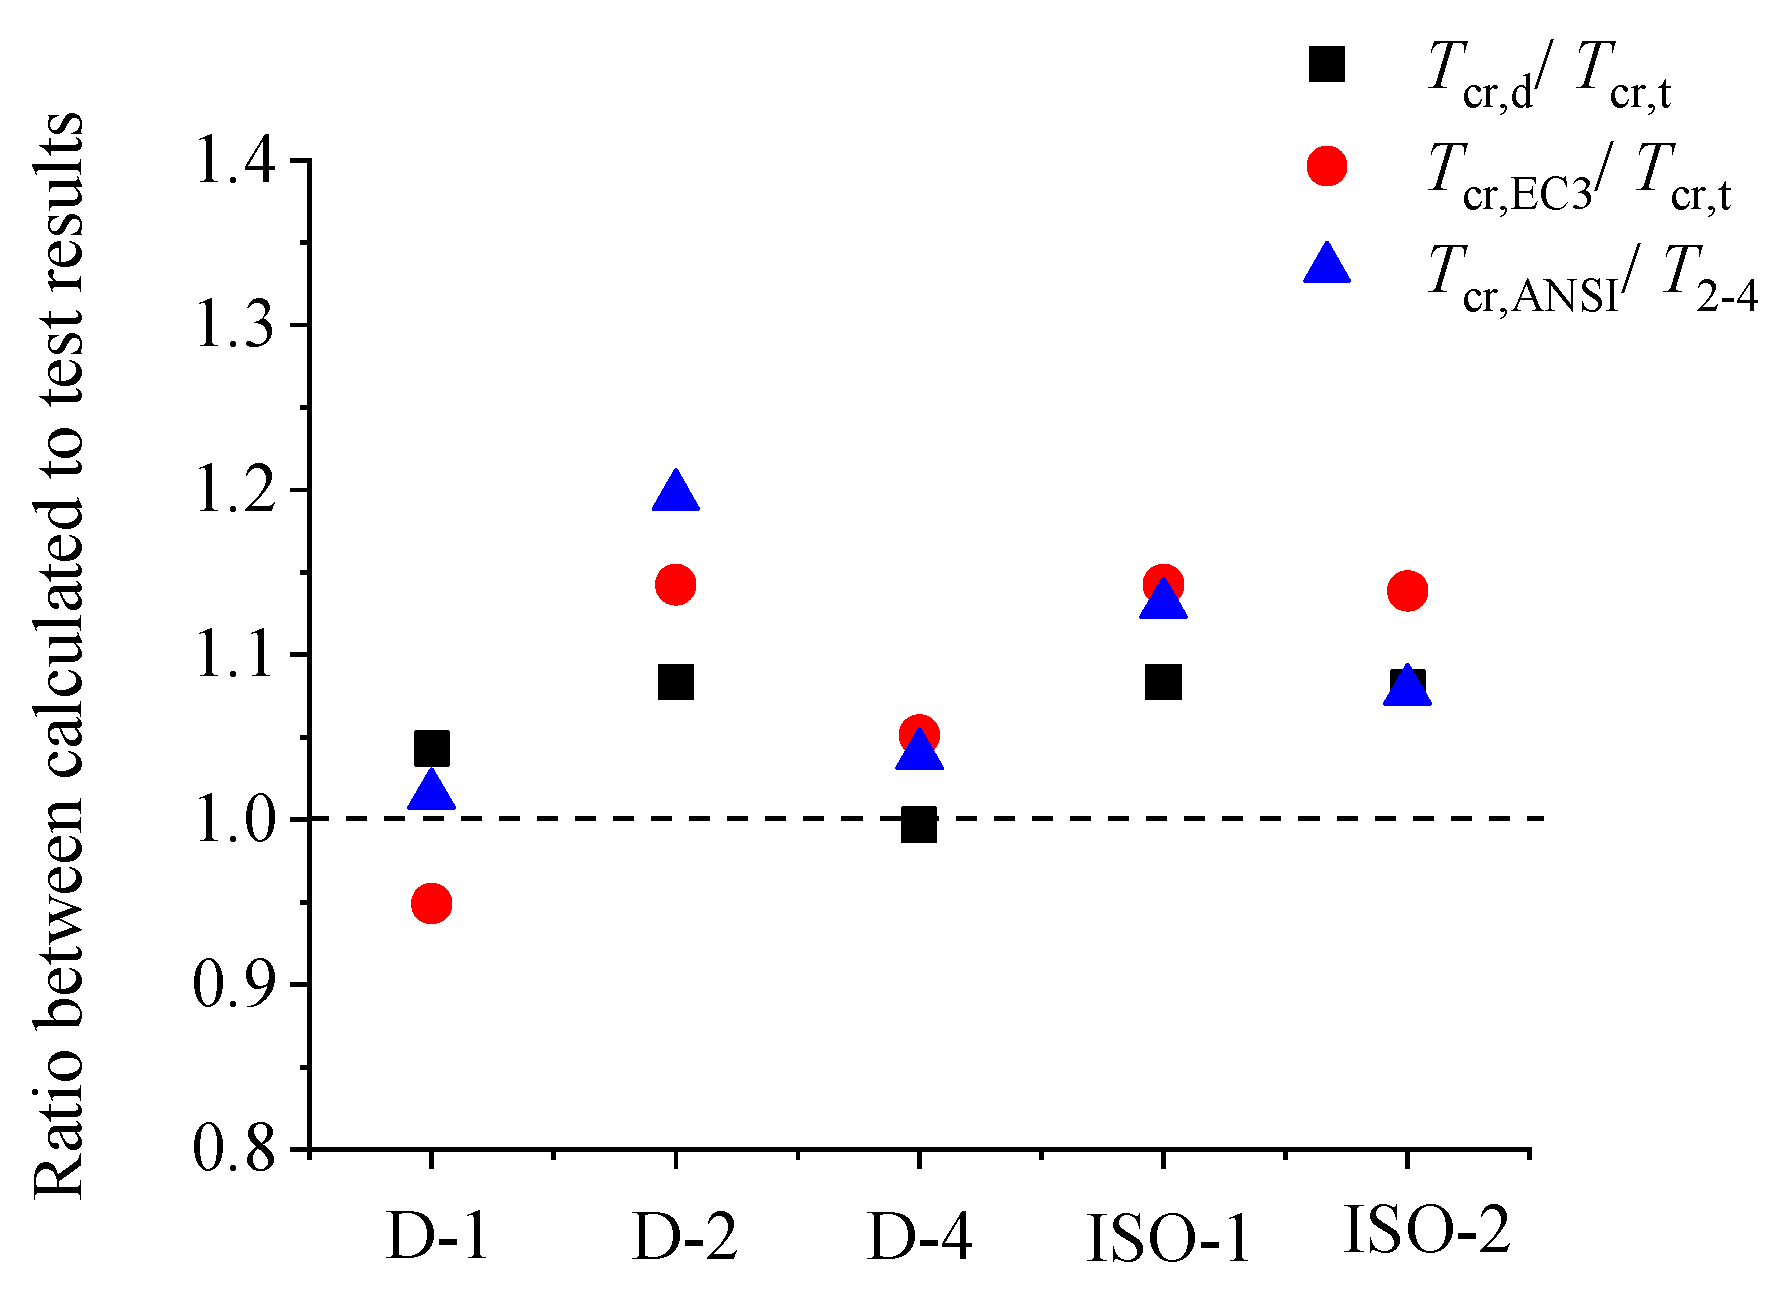
- The accuracy of the design methods outlined in BS EN 1993-1-2 and ANSI/AISC 360-22 was evaluated based on the test results. It was found that both specifications provided accurate predictions on the critical temperatures for D-1 and D-4, which have shorter heating durations, but unconservative predictions for other specimens with longer heating durations. This phenomenon was attributed to the ignorance of creep deformation in both specifications, emphasizing the importance of considering creep deformation in the fire safety design of steel beams.
Author Contributions
Funding
Data Availability Statement
Conflicts of Interest
References
- Thongchom, C.; Bui, L.V.H.; Poonpan, N.; Phudtisarigorn, N.; Nguyen, P.T.; Keawsawasvong, S.; Mousa, S. Experimental and Numerical Investigation of Steel- and GFRP-Reinforced Concrete Beams Subject to Fire Exposure. Buildings 2023, 13, 609. [Google Scholar] [CrossRef]
- Jiang, Y.; Hu, X.; Zheng, H.; Shuai, H. Flexural Behavior of Partially Encased Composite Beams with a Large Tensile Reinforcement Ratio. Buildings 2024, 14, 1606. [Google Scholar] [CrossRef]
- Zhang, Z.; Lyu, J.; Shi, G.; Li, W.; Wang, C. Study on the Fire Resistance of Castellated Composite Beams with Semi-Rigid Restraints. Buildings 2025, 15, 1016. [Google Scholar] [CrossRef]
- Rzeszut, K.; Goscinski, B. Load-Bearing Capacity of Klein’s Ceiling Under Fire Conditions. Buildings 2025, 15, 323. [Google Scholar] [CrossRef]
- Memarzadeh, A.; Shahmansouri, A.A.; Nematzadeh, M.; Gholampour, A. A review on fire resistance of steel-concrete composite slim-floor beams. Steel Compos. Struct. 2021, 40, 13–32. [Google Scholar]
- Burgess, I.W.; Rimawi, J.E.; Plank, R.J. Studies of the Behaviour of Steel Beams in Fire. J. Constr. Steel Res. 1991, 19, 285–312. [Google Scholar] [CrossRef]
- Liu, T.C.H.; Fahad, M.K.; Davies, J.M. Experimental investigation of behaviour of axially restrained steel beams in fire. J. Constr. Steel Res. 2002, 58, 1211–1230. [Google Scholar] [CrossRef]
- Yin, Y.Z.; Wang, Y.C. A numerical study of large deflection behaviour of restrained steel beams at elevated temperatures. J. Constr. Steel Res. 2004, 60, 1029–1047. [Google Scholar] [CrossRef]
- Li, G.; Guo, S. Experiment on restrained steel beams subjected to heating and cooling. J. Constr. Steel Res. 2008, 64, 268–274. [Google Scholar] [CrossRef]
- Tan, K.; Huang, Z. Structural Responses of Axially Restrained Steel Beams with Semirigid Moment Connection in Fire. J. Struct. Eng. 2005, 131, 541–551. [Google Scholar] [CrossRef]
- Huang, Z.; Tan, K. Structural response of restrained steel columns at elevated temperatures. Part 2: FE simulation with focus on experimental secondary effects. Eng. Struct. 2007, 29, 2036–2047. [Google Scholar] [CrossRef]
- Dwaikat, M.; Kodur, V. Engineering Approach for Predicting Fire Response of Restrained Steel Beams. J. Eng. Mech. 2011, 137, 447–461. [Google Scholar] [CrossRef]
- Kodur, V.K.R.; Dwaikat, M.M.S. Effect of high temperature creep on the fire response of restrained steel beams. Mater. Struct. 2010, 43, 1327–1341. [Google Scholar] [CrossRef]
- Al-azzani, H.; Yang, J.; Sharhan, A.; Wang, W. A Practical Approach for Fire Resistance Design of Restrained High-Strength Q690 Steel Beam Considering Creep Effect. Fire Technol. 2021, 57, 1683–1706. [Google Scholar] [CrossRef]
- Shakil, S.; Lu, W.; Puttonen, J. Behaviour of vertically loaded steel beams under a travelling fire. Structures 2022, 44, 1–17. [Google Scholar] [CrossRef]
- Nguyen, T.Q.; Nguyen, X.T.; Nguyen, T.N.M.; Park, J.S. Buckling strength of steel I-beams subjected to simultaneous transverse loads and negative end moments under elevated temperature. Structures 2024, 67, 106934. [Google Scholar] [CrossRef]
- Laím, L.; Rodrigues, J.P.C. Experimental and numerical study on the fire response of cold-formed steel beams with elastically restrained thermal elongation. J. Struct. Fire Eng. 2016, 7, 388–402. [Google Scholar] [CrossRef]
- Couto, C.; Vila Real, P.; Lopes, N. Local-global buckling interaction in steel I-beams—A European design proposal for the case of fire. Thin-Walled Struct. 2025, 206, 112664. [Google Scholar] [CrossRef]
- Xie, B.; Dai, W.; Zhang, S.; Guo, C.; Tan, Y.; Wang, M.; Xu, Z.; Liu, Q. Experimental and numerical investigation on fire resistance of stainless steel core plate beams. Thin-Walled Struct. 2023, 190, 110948. [Google Scholar] [CrossRef]
- Kucukler, M. Stainless steel I-section beams at elevated temperatures: Lateral–torsional buckling behaviour and design. Thin-Walled Struct. 2025, 208, 112720. [Google Scholar] [CrossRef]
- Pournaghshband, A.; Afshan, S.; Theofanous, M. Elevated temperature performance of restrained stainless steel beams. Structures 2019, 22, 278–290. [Google Scholar] [CrossRef]
- Shaheen, M.A.; Afshan, S.; Foster, A.S. Performance of axially restrained carbon and stainless steel perforated beams at elevated temperatures. Adv. Struct. Eng. 2021, 24, 3564–3579. [Google Scholar] [CrossRef]
- GB 51249-2017; Code for Fire Safety of Steel Structures in Buildings. China Planning Press: Beijing, China, 2017. (In Chinese)
- GB 50017-2017; Standard for Design of Steel Structures. China Architecture & Building Press: Beijing, China, 2017. (In Chinese)
- ISO-834; Fire-Resistance Tests-Elements of Building Construction. International Organization for Standardization: Geneva, Switzerland, 1975.
- GB/T 26784-2011; Fire Resistance Test for Elements of Building Construction-Alternative and Additional Procedures. Standards Press of China: Beijing, China, 2011. (In Chinese)
- GB9978.1-2008; Fire-Resistance Tests-Elements of Building Construction-Part 1: General Requirements. Standards Press of China: Beijing, China, 2008. (In Chinese)
- BS EN 1993-1-2:2024; Eurocode 3-Design of Steel Structures. Part 1-2: Structural Fire Design. British Standards Institution: London, UK, 2024.
- ANSI/AISC 360-22; Specification for Structural Steel Buildings. American Institute of Steel Construction: Washington, DC, USA, 2022.


| Labels | Yield Strength /MPa | Average Yield Strength/MPa | Ultimate Strength /MPa | Average Ultimate Strength/MPa |
|---|---|---|---|---|
| C-8-1 | 401.6 | 401.7 | 549.4 | 549.6 |
| C-8-2 | 402.5 | 549.6 | ||
| C-8-3 | 401.0 | 549.7 | ||
| C-12-1 | 403.0 | 406.0 | 542.6 | 539.6 |
| C-12-2 | 410.3 | 538.2 | ||
| C-12-3 | 404.8 | 538.1 | ||
| C-20-1 | 405.9 | 404.5 | 564.6 | 563.8 |
| C-20-2 | 398.2 | 563.9 | ||
| C-20-3 | 409.3 | 562.8 |
| Labels | Dimensions /mm | Heating Curves | Fire Protections | Thickness /mm | Applied Load /kN | Tcr /°C | tcr /min |
|---|---|---|---|---|---|---|---|
| D-1 | HN 400 × 200 × 8 × 12 | EFC | FRC | 20 | 36 | 676 | 120 |
| D-2 | HN 588 × 300 × 12 × 20 | EFC | FRC | 15 | 120 | 661 | 120 |
| D-3 | HN 588 × 300 × 12 × 20 | EFC | FCB | 20 | 120 | 661 | 120 |
| D-4 | HN 588 × 300 × 12 × 20 | EFC | IC | 1.5 | 120 | 661 | 60 |
| ISO-1 | HN 588 × 300 × 12 × 20 | ISO-834 | FRC | 12 | 120 | 661 | 120 |
| ISO-2 | HN 588 × 300 × 12 × 20 | ISO-834 | IC | 2.5 | 120 | 661 | 120 |
| Lables | Tcr,d (°C) | T2-1 (°C) | T2-2 (°C) | T2-3 (°C) | T2-4 (°C) | Tcr,t (°C) | tcr,d (min) | tcr,t (min) | (Tcr,d − Tcr,t)/Tcr,t | (tcr,d − tcr,t)/tcr,t |
|---|---|---|---|---|---|---|---|---|---|---|
| D-1 | 676 | 556 | 776 | 660 | 665 | 648 | 120 | 85 | 4.3% | 41% |
| D-2 | 661 | 570 | 692 | 636 | 621 | 610 | 120 | 103 | 8.3% | 17% |
| D-3 | 661 | 385 | 575 | 425 | 586 | 487 | 120 | 53 | 35.7% | 126% |
| D-4 | 661 | 542 | 824 | 693 | 715 | 663 | 60 | 49 | −0.3% | 22% |
| ISO-1 | 661 | 524 | 704 | 636 | 657 | 610 | 120 | 101 | 8.4% | 19% |
| ISO-2 | 661 | 468 | 782 | 642 | 689 | 612 | 120 | 113 | 8.0% | 6% |
| Lables | Tcr,t (°C) | Tcr,EC3 (°C) | tcr,t (°C) | tcr,EC3 (°C) | (Tcr,EC3 − Tcr,t)/Tcr,t | (tcr,EC3 − tcr,t)/tcr,t |
|---|---|---|---|---|---|---|
| D-1 | 648 | 615 | 85 | 81 | −5% | −5% |
| D-2 | 610 | 697 | 103 | 101 | 14% | −2% |
| D-3 | 487 | - | 53 | - | ||
| D-4 | 663 | 697 | - | - | 5% | |
| ISO-1 | 610 | 697 | 101 | 100 | 14% | −1% |
| ISO-2 | 612 | 697 | - | - | 14% |
| Lables | Tcr,t (°C) | T2-4 (°C) | Tcr,ANSI (°C) | (Tcr, ANSI − T2-4)/T2-4 | (Tcr, ANSI − Tcr,t)/Tcr,t |
|---|---|---|---|---|---|
| D-1 | 648 | 665 | 675 | 1.5% | 4% |
| D-2 | 610 | 621 | 743 | 19.6% | 22% |
| D-3 | 487 | 586 | - | ||
| D-4 | 663 | 715 | 743 | 3.9% | 12% |
| ISO-1 | 610 | 657 | 743 | 13.1% | 22% |
| ISO-2 | 612 | 689 | 743 | 7.8% | 21% |
Disclaimer/Publisher’s Note: The statements, opinions and data contained in all publications are solely those of the individual author(s) and contributor(s) and not of MDPI and/or the editor(s). MDPI and/or the editor(s) disclaim responsibility for any injury to people or property resulting from any ideas, methods, instructions or products referred to in the content. |
© 2025 by the authors. Licensee MDPI, Basel, Switzerland. This article is an open access article distributed under the terms and conditions of the Creative Commons Attribution (CC BY) license (https://creativecommons.org/licenses/by/4.0/).
Share and Cite
Wang, W.; Zhu, T.; Gao, X.; Yang, J.; Chen, X.; Wang, W. Fire Test on Insulated Steel Beams with Fire-Protection Coating and Fiber Cement Board. Buildings 2025, 15, 2121. https://doi.org/10.3390/buildings15122121
Wang W, Zhu T, Gao X, Yang J, Chen X, Wang W. Fire Test on Insulated Steel Beams with Fire-Protection Coating and Fiber Cement Board. Buildings. 2025; 15(12):2121. https://doi.org/10.3390/buildings15122121
Chicago/Turabian StyleWang, Weihua, Tao Zhu, Xian Gao, Jingjie Yang, Xilong Chen, and Weiyong Wang. 2025. "Fire Test on Insulated Steel Beams with Fire-Protection Coating and Fiber Cement Board" Buildings 15, no. 12: 2121. https://doi.org/10.3390/buildings15122121
APA StyleWang, W., Zhu, T., Gao, X., Yang, J., Chen, X., & Wang, W. (2025). Fire Test on Insulated Steel Beams with Fire-Protection Coating and Fiber Cement Board. Buildings, 15(12), 2121. https://doi.org/10.3390/buildings15122121